Heavy Oil Latin America Congress HOLA Markets and ... n Dr... · PDF file213 CPE-1 META...
19
Heavy Oil Latin America Congress HOLA Markets and Investment Commercial potential of heavy oil reserves in Colombia Armando Zamora Director General Bogotá, August 2011
Transcript of Heavy Oil Latin America Congress HOLA Markets and ... n Dr... · PDF file213 CPE-1 META...

Heavy Oil Latin America CongressHOLA
Markets and Investment
Commercial potential of heavy oil reserves in Colombia
Armando ZamoraDirector General
Bogotá, August 2011
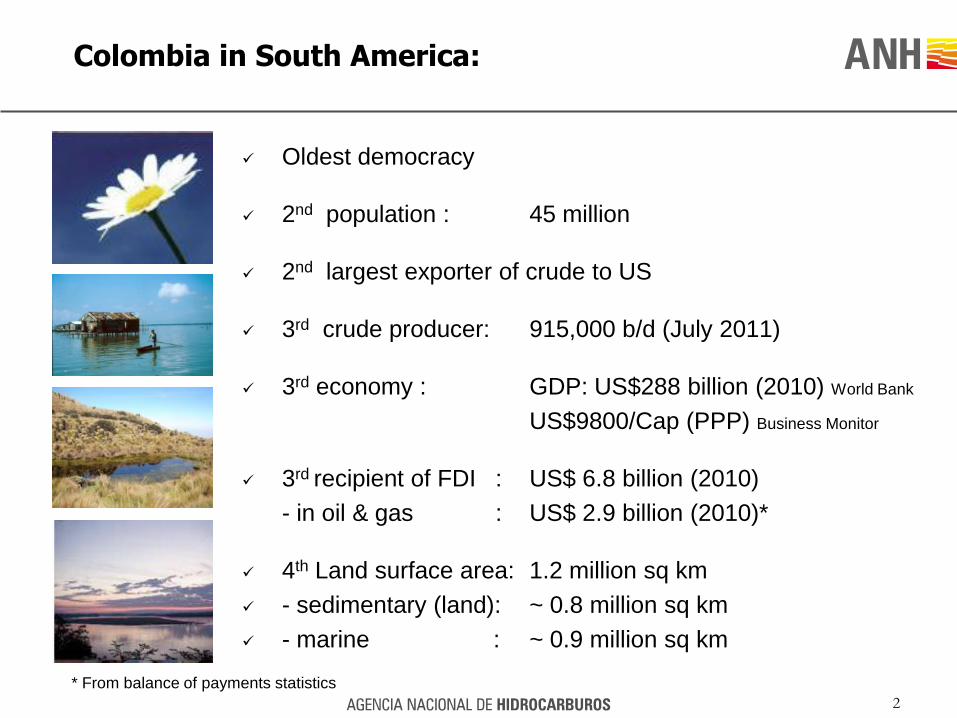
Colombia in South America:
Oldest democracy
2nd population : 45 million
2nd largest exporter of crude to US
3rd crude producer: 915,000 b/d (July 2011)
3rd economy : GDP: US$288 billion (2010) World Bank
US$9800/Cap (PPP) Business Monitor
3rd recipient of FDI : US$ 6.8 billion (2010)
- in oil & gas : US$ 2.9 billion (2010)*
4th Land surface area: 1.2 million sq km
- sedimentary (land): ~ 0.8 million sq km
- marine : ~ 0.9 million sq km
2
* From balance of payments statistics
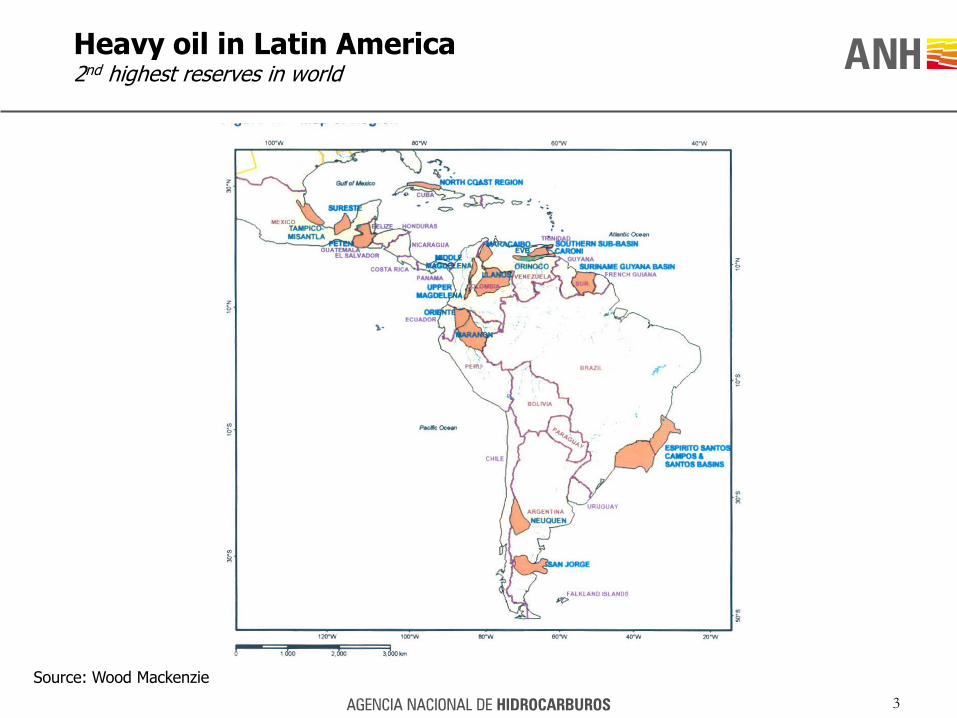
Heavy oil in Latin America2nd highest reserves in world
3
Source: Wood Mackenzie
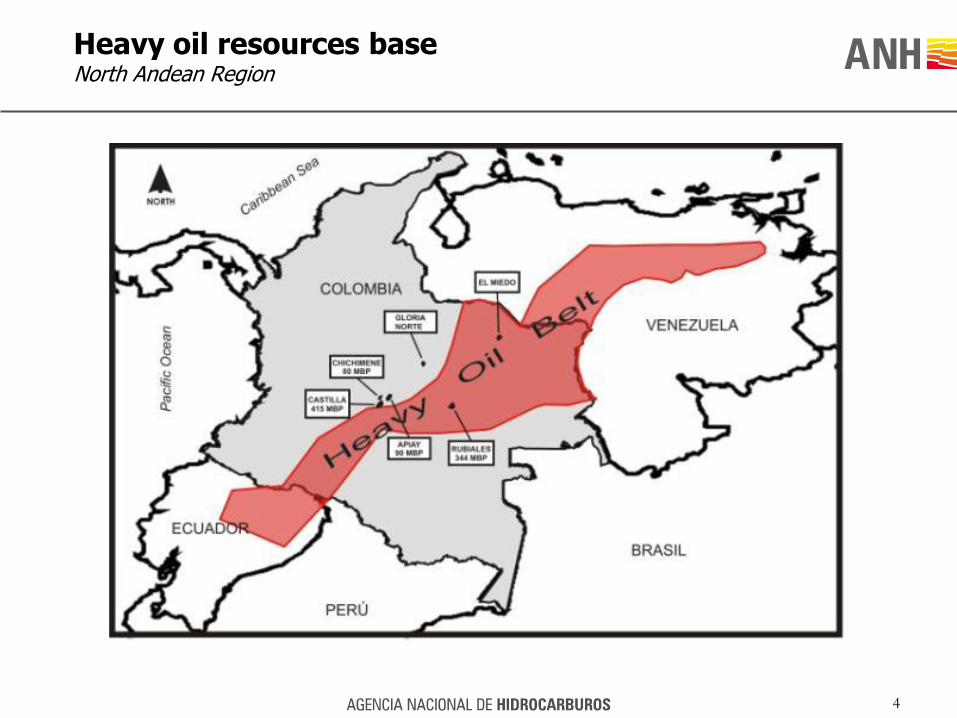
Heavy oil resources baseNorth Andean Region
4

Regional background
5
ESCUDO DE
GUAYANA
BOGOTA
LAGO DE MARACAIBO
BARINAS APURE
87,000 Km2
2,000 MM BBLS
55,000 km2
34,800 MM BBLS
220,000 Km2
4,000 MM BBLS
Sources: Plan de Negocio 2004-2009 PDVSA.- Colombianet, Ecopetrol
RESERVES
50,000 Km2
21,600 MM BBLS
10,000 MM BBLS pesados
FAJA DEL ORINOCO
LLANOS ORIENTALES

Wells and shows in Llanos basin
6
Source: * PROYECTO DE CRUDOS PESADOS 2006. LANDMARK, HALLIBURTON. - ACIPET.
RIO CASANARE
RIO ARAUCA
N
Villavicencio
Yopal
Arauca
Oil show
Oil and Gas show
Gas show
Well
Llanos Basin
ANH Special Area
River
The map ilustrates the 41 exploratory wells drilled in the exploratory area of
the ANH with hydrocarbon shows.
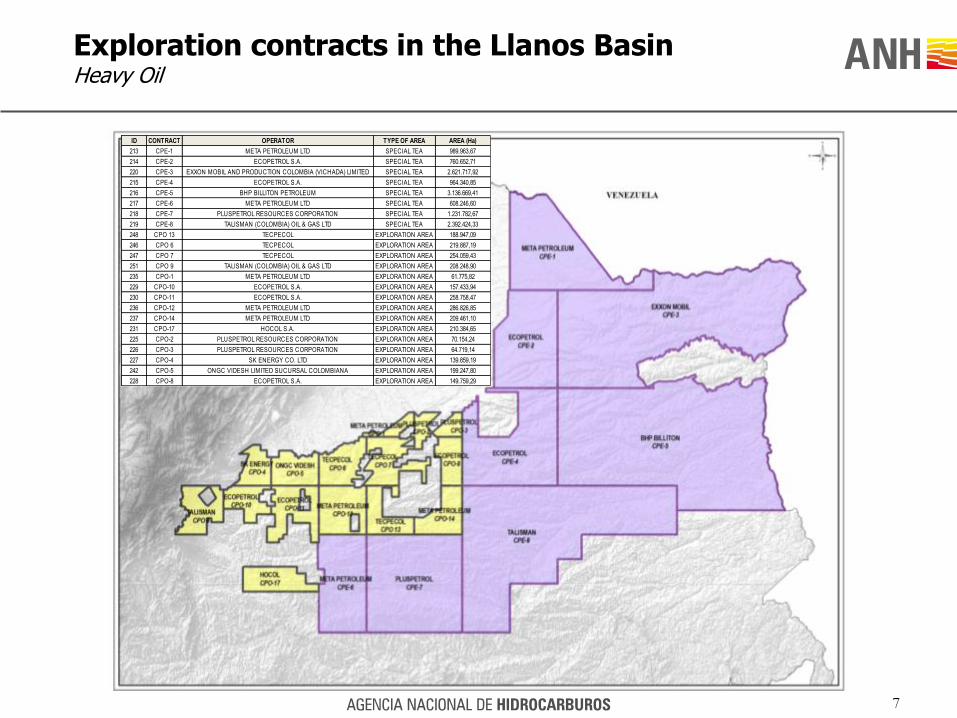
ID CONTRACT OPERATOR TYPE OF AREA AREA (Ha)
213 CPE-1 META PETROLEUM LTD SPECIAL TEA 989.963,67
214 CPE-2 ECOPETROL S.A. SPECIAL TEA 760.652,71
220 CPE-3 EXXON MOBIL AND PRODUCTION COLOMBIA (VICHADA) LIMITED SPECIAL TEA 2.621.717,92
215 CPE-4 ECOPETROL S.A. SPECIAL TEA 964.340,85
216 CPE-5 BHP BILLITON PETROLEUM SPECIAL TEA 3.136.669,41
217 CPE-6 META PETROLEUM LTD SPECIAL TEA 608.246,60
218 CPE-7 PLUSPETROL RESOURCES CORPORATION SPECIAL TEA 1.231.782,67
219 CPE-8 TALISMAN (COLOMBIA) OIL & GAS LTD SPECIAL TEA 2.392.424,33
248 CPO 13 TECPECOL EXPLORATION AREA 188.947,09
246 CPO 6 TECPECOL EXPLORATION AREA 219.887,19
247 CPO 7 TECPECOL EXPLORATION AREA 254.059,43
251 CPO 9 TALISMAN (COLOMBIA) OIL & GAS LTD EXPLORATION AREA 208.248,90
235 CPO-1 META PETROLEUM LTD EXPLORATION AREA 61.775,82
229 CPO-10 ECOPETROL S.A. EXPLORATION AREA 157.433,94
230 CPO-11 ECOPETROL S.A. EXPLORATION AREA 258.758,47
236 CPO-12 META PETROLEUM LTD EXPLORATION AREA 286.826,85
237 CPO-14 META PETROLEUM LTD EXPLORATION AREA 209.461,10
231 CPO-17 HOCOL S.A. EXPLORATION AREA 210.384,65
225 CPO-2 PLUSPETROL RESOURCES CORPORATION EXPLORATION AREA 70.154,24
226 CPO-3 PLUSPETROL RESOURCES CORPORATION EXPLORATION AREA 64.719,14
227 CPO-4 SK ENERGY CO. LTD EXPLORATION AREA 139.859,19
242 CPO-5 ONGC VIDESH LIMITED SUCURSAL COLOMBIANA EXPLORATION AREA 199.247,80
228 CPO-8 ECOPETROL S.A. EXPLORATION AREA 149.759,29
Exploration contracts in the Llanos BasinHeavy Oil
7

E&P Discoveries
Light Oil
Medium Oil
Heavy Oil
8

Risked STOIIP
The P50 STOIIP with an average geological risk of 15%Is around 124.000 MMBBLS
9

Yet-to-find recoverable oil reservesColombia
10
Sources: National University (Colombia), Halliburton (heavy oil)
0
20
40
60
80
100
120
140
High Medium Low
Bn bls
Heavy Oil

-
500.000
1.000.000
1.500.000
2.000.000
2002 2004 2006 2008 2010 2012 2014 2016 2018 2020 2022 2024
bopd
Heavy Oil Other
Heavy oil share of expected future productionBase case scenario (P50)
11
Projection
Source: ANH analysis
50%54%
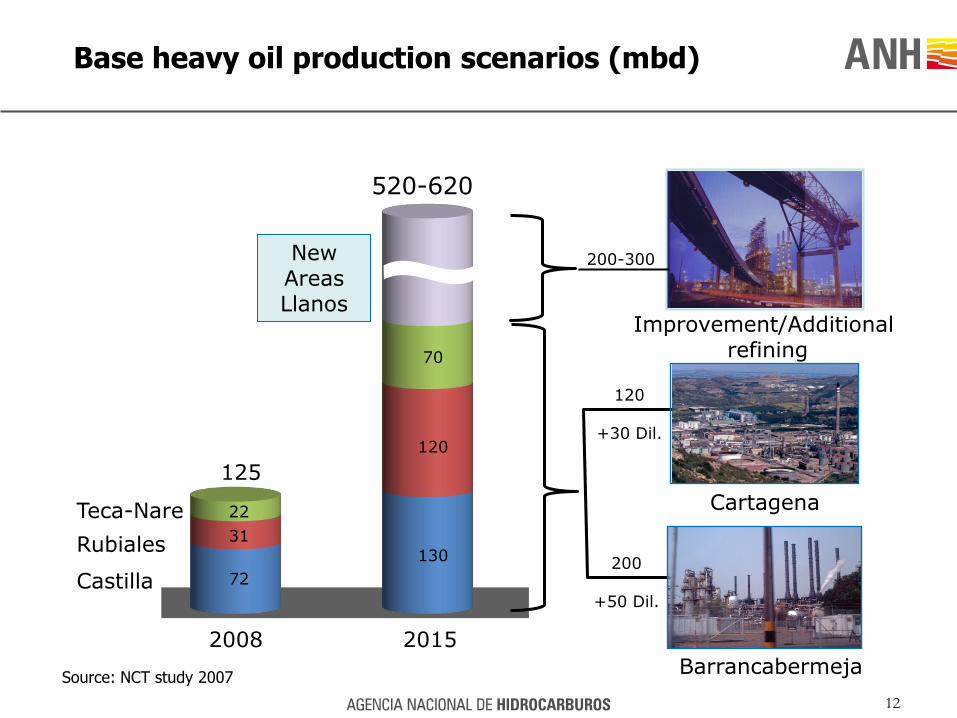
Base heavy oil production scenarios (mbd)
12
72
2008 2015
31
22
130
120
70
125
Castilla
Rubiales
Teca-Nare
New Areas Llanos
Barrancabermeja
Cartagena
120
+30 Dil.
200
+50 Dil.
Improvement/Additionalrefining
200-300
520-620
Source: NCT study 2007
13
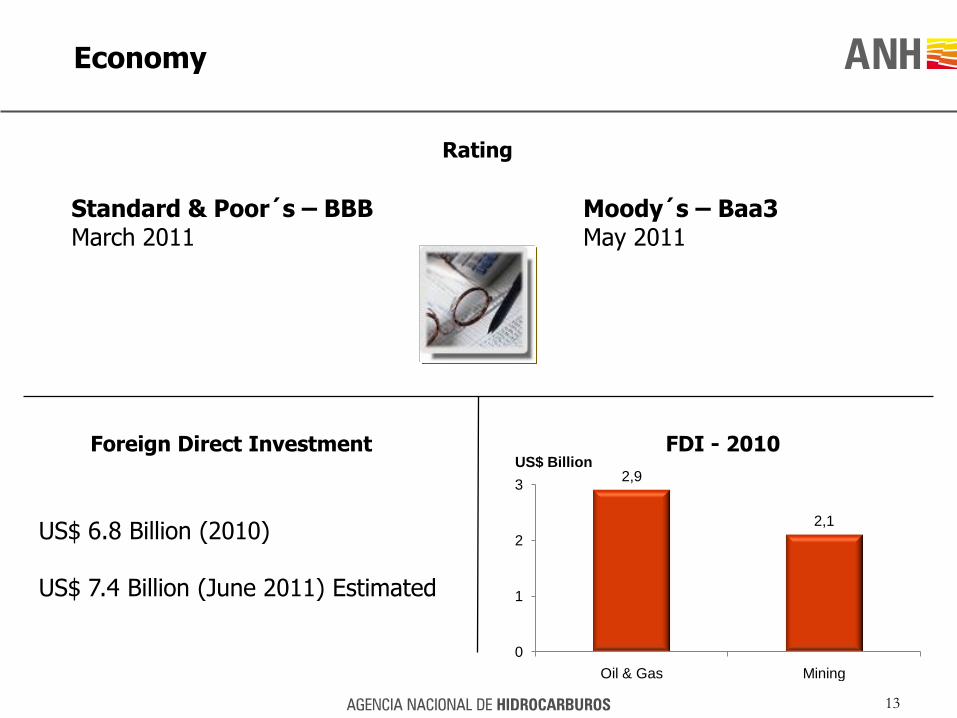
Economy
Rating
Standard & Poor´s – BBBMarch 2011
US$ 6.8 Billion (2010)
US$ 7.4 Billion (June 2011) Estimated
Foreign Direct Investment FDI - 2010
2,9
2,1
0
1
2
3
Oil & Gas Mining
US$ Billion
Moody´s – Baa3May 2011
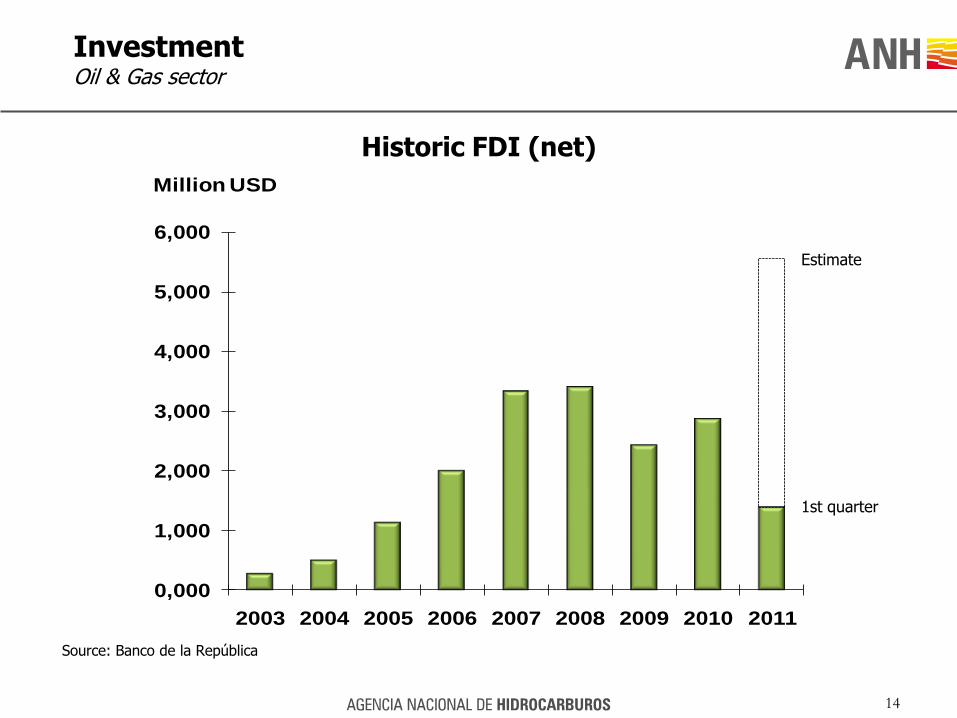
Source: Banco de la República
InvestmentOil & Gas sector
Historic FDI (net)
14
1st quarter
0,000
1,000
2,000
3,000
4,000
5,000
6,000
2003 2004 2005 2006 2007 2008 2009 2010 2011
Million USD
Estimate
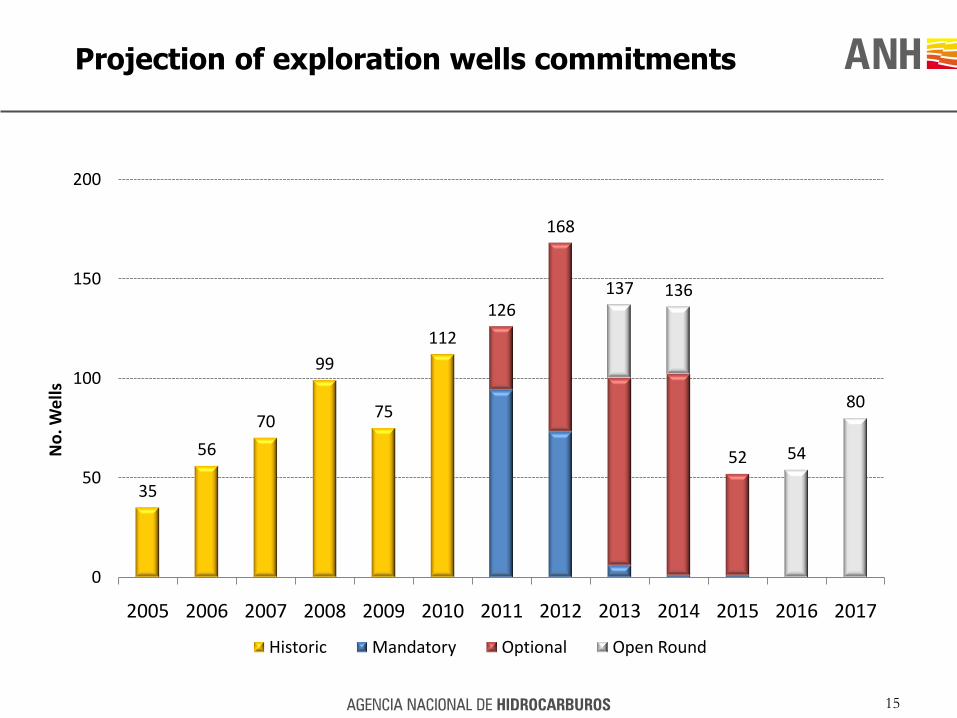
Projection of exploration wells commitments
15
35
56
70
99
75
112
126
168
137 136
52 54
80
0
50
100
150
200
2005 2006 2007 2008 2009 2010 2011 2012 2013 2014 2015 2016 2017
No
. We
lls
Historic Mandatory Optional Open Round
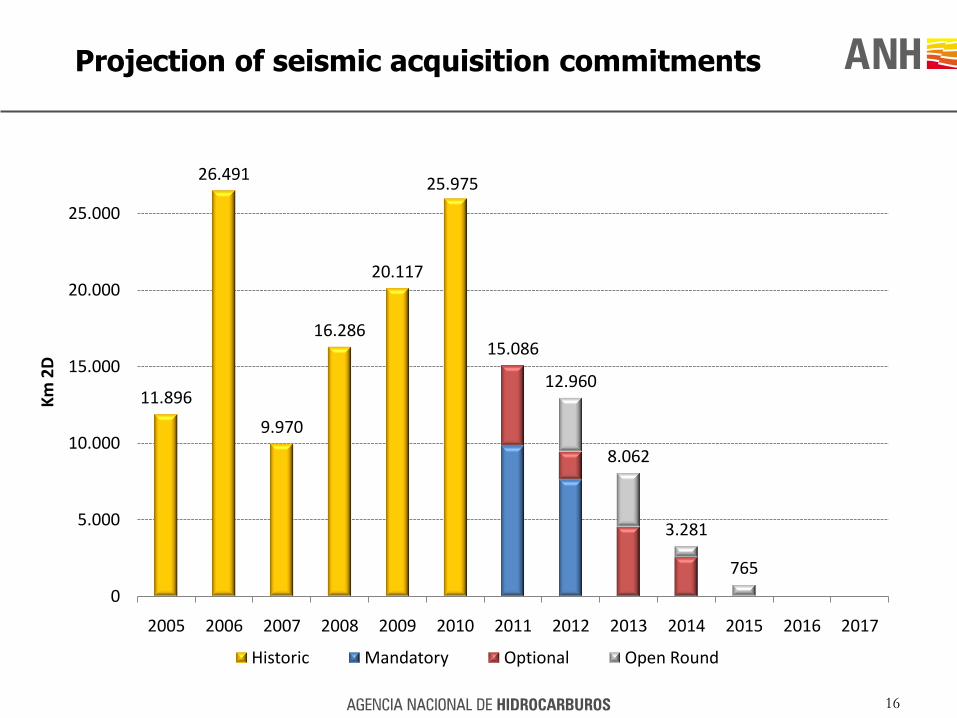
Projection of seismic acquisition commitments
16
11.896
26.491
9.970
16.286
20.117
25.975
15.086
12.960
8.062
3.281
765
0
5.000
10.000
15.000
20.000
25.000
2005 2006 2007 2008 2009 2010 2011 2012 2013 2014 2015 2016 2017
Km
2D
Historic Mandatory Optional Open Round
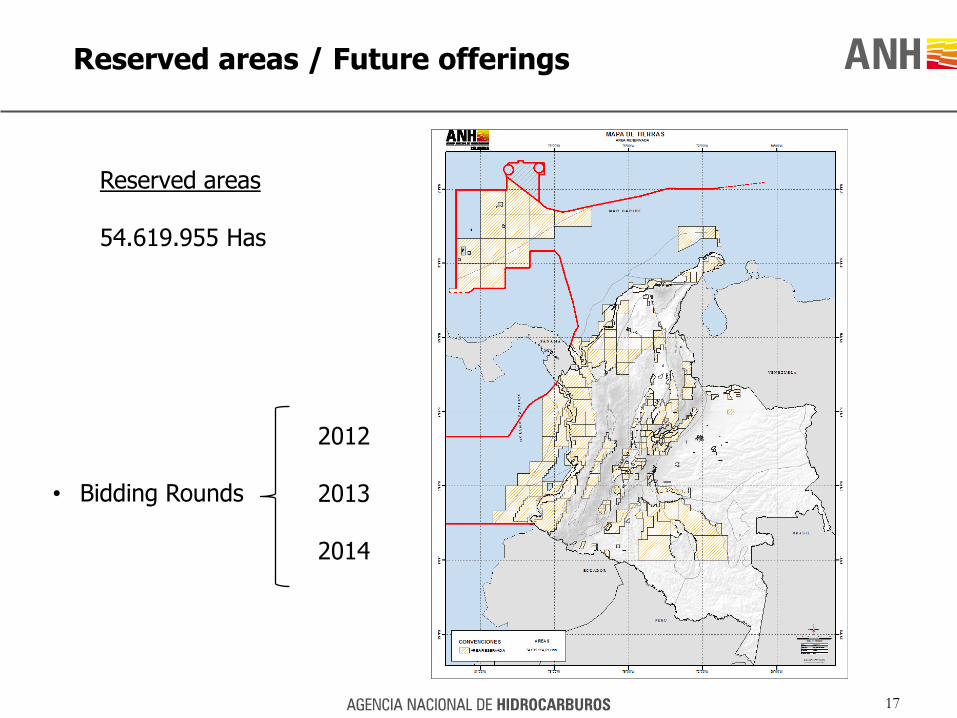
Reserved areas / Future offerings
17
Reserved areas
54.619.955 Has
• Bidding Rounds
2012
2013
2014
Challenges
• Community relations
• Environmental permits
• Transport infrastructure
• Security
• Industry image
• Technology / services / Man power
18
Thank you!
www.anh.gov.co
19