Heavy Metal Pollution of Natural Waters in Abakaliki ... · 2.1 Location . The study area is...
5
International Journal of Science and Research (IJSR) ISSN (Online): 2319-7064 Index Copernicus Value (2013): 6.14 | Impact Factor (2013): 4.438 Volume 4 Issue 6, June 2015 www.ijsr.net Licensed Under Creative Commons Attribution CC BY Heavy Metal Pollution of Natural Waters in Abakaliki, Ebonyi State, Nigeria D. C. Ozoko Department of Geology and Mining, Enugu State University of Science and Technology, P.M.B. 01660, Enugu, NIGERIA. Abstract: Abakaliki is one of the fast growing cities of South Eastern Nigeria. It depends mainly on surface water and limited groundwater supplies from a highly jointed and weathered shale-regolith aquifer. Since the aquifer is lithologically similar to a Nigerian rock formation that has been established as having groundwater - laden with heavy metals, the waters from the shale-regolith aquifer was tested for its heavy metal status. A few hand- dug wells and streams were also tested since they are hydraulically connected to the same aquifer. A total of 20 water samples were tested for their concentration levels with respect to iron (Fe); lead (Pb); copper(Cu); zinc (Zn); cadmium (Cd) and arsenic (As). Concentration levels for copper (Cu) and zinc (Zn) were below maximum contaminant levels (MCL) but iron(Fe) ranges from 0.2mg/l to 9.2mg/l. Its average value (5.44mg/l) exceeds the MCL by 18 times. The range for lead (Pb) is from BDL (below detection limits) to 13.8mg/l which exceeds the prescribed limits by 300 times. Cadmium (Cd) ranges from BDL to 0.67mg/l while arsenic levels vary from 0.1mg/l to 2.9mg/l. Their average values exceed prescribed limits by 50 and 159 times respectively. Mobilization of these heavy metals into natural water seem to be enhanced by iron oxyhydroxide reduction and nitrate reduction in processes that are microbially-driven. Health risks of the continued exposure of the Abakaliki population to these heavy metals is potentially serious. Keyword: Abakaliki; Shale-regolith aquifer; Heavy Metals; Maximum Contaminant Levels 1. Introduction Water is perhaps one of the most essential elements on earth today but its usefulness diminishes greatly when it is polluted. Pollution occurs when toxic or undesirable substances are introduced into surface water bodies or groundwater. The introduction of harmful substances into water may be by naturally occurring processes without human input – (i.e.geogenic) or as a result of human activities like mining, industrial processes, waste disposal etc. (i.e. anthropogenic). Regulatory bodies like World Health Organisation (WHO) or United States Environment Protection Agency (U.S.E.P.A) usually set maximum contaminant levels (MCL) for various elements. Whenever any element or substance has a concentration value exceeding the MCL set for it by these regulatory bodies, such a water is said to be polluted. In establishing MCL’s these regulatory bodies took into consideration, the impacts of the presence or excess levels of such substances on the human body. One group of pollutants known to be toxic to human health is the heavy metal group. Heavy metals are defined as those metals with atomic number equal to or greater than 20 but this usually does not include alkali and alkali earth metals like Ca, Mg, Na and K. Metals are introduced into aquifers and surface water bodies through rock weathering and erosion or by human activities. The global concern about the presence of heavy metals or their elevated concentration levels in water is because of their high level of toxicity. Several heavy metals are known to be toxic to human, animal and plant life and therefore need to be detected in and removed from water before it affects whole populations of people. A major characteristic of heavy metals is that they usually have very low concentrations in natural water. In fact they typically have < 0. 1 mg/l in most cases and for this reason, most chemical analyses of water tend to focus on major elements which are considered to be major because they constitute the greater percentage of dissolved solids in water, but it has been found that even at very low concentrations, heavy metals can be extremely dangerous to human health. Some years ago, the widespread pollution of natural waters in Bangladesh by geognic arsenic drew global attention. The Bangladeshi case in the late eighties and nineties was well documented 1, 2, 3 . Later on, it was discovered that arsenic poisoning of natural water systems was not limited to Bangladesh and West Bengal of India alone. At least 19 countries in the world had the same problem 4 . The outcry that arose due to the arsenic problem helped to fuel a lot of research into the factors leaching arsenic into natural systems. It was discovered that the arsenic pollution of natural water in Assam State in India was connected with high levels of iron in the water 5, 6 . The occurrence of arsenic and iron in groundwater was linked to the aquifer sedimentology. High levels of arsenic and iron were found in fine grained, sands and silts that had plenty of organic matter and in the United States, it was also discovered that arsenic commonly occurredin calcareous metasediments 7 . A comparison between the sedimentology of arsenic occurrence in Bangladesh and United States led to the need to check for the presence of arsenic and other heavy metals in Nigerian rocks with similar lithologic characteristics. It was discovered that the Awgu Formation which comprises mostly of carbonaceous shales andcalcareoussandstones had elevated concentration levels of arsenic, lead and cadmium 8 . The focus of this paper therefore is to check the heavy metal status of natural waters in Abakaliki in Ebonyi State because the underlying rocks also are lithological similar to the Awgu Formation, though they differ in age. 2. The Study Area Paper ID: SUB155071 482
Transcript of Heavy Metal Pollution of Natural Waters in Abakaliki ... · 2.1 Location . The study area is...

International Journal of Science and Research (IJSR) ISSN (Online): 2319-7064
Index Copernicus Value (2013): 6.14 | Impact Factor (2013): 4.438
Volume 4 Issue 6, June 2015
www.ijsr.net Licensed Under Creative Commons Attribution CC BY
Heavy Metal Pollution of Natural Waters in
Abakaliki, Ebonyi State, Nigeria
D. C. Ozoko
Department of Geology and Mining, Enugu State University of Science and Technology, P.M.B. 01660, Enugu, NIGERIA.
Abstract: Abakaliki is one of the fast growing cities of South Eastern Nigeria. It depends mainly on surface water and limited
groundwater supplies from a highly jointed and weathered shale-regolith aquifer. Since the aquifer is lithologically similar to a Nigerian
rock formation that has been established as having groundwater - laden with heavy metals, the waters from the shale-regolith aquifer
was tested for its heavy metal status. A few hand- dug wells and streams were also tested since they are hydraulically connected to the
same aquifer. A total of 20 water samples were tested for their concentration levels with respect to iron (Fe); lead (Pb); copper(Cu); zinc
(Zn); cadmium (Cd) and arsenic (As). Concentration levels for copper (Cu) and zinc (Zn) were below maximum contaminant levels
(MCL) but iron(Fe) ranges from 0.2mg/l to 9.2mg/l. Its average value (5.44mg/l) exceeds the MCL by 18 times. The range for lead (Pb)
is from BDL (below detection limits) to 13.8mg/l which exceeds the prescribed limits by 300 times. Cadmium (Cd) ranges from BDL to
0.67mg/l while arsenic levels vary from 0.1mg/l to 2.9mg/l. Their average values exceed prescribed limits by 50 and 159 times
respectively. Mobilization of these heavy metals into natural water seem to be enhanced by iron oxyhydroxide reduction and nitrate
reduction in processes that are microbially-driven. Health risks of the continued exposure of the Abakaliki population to these heavy
metals is potentially serious.
Keyword: Abakaliki; Shale-regolith aquifer; Heavy Metals; Maximum Contaminant Levels
1. Introduction
Water is perhaps one of the most essential elements on earth
today but its usefulness diminishes greatly when it is
polluted. Pollution occurs when toxic or undesirable
substances are introduced into surface water bodies or
groundwater. The introduction of harmful substances into
water may be by naturally occurring processes without
human input – (i.e.geogenic) or as a result of human
activities like mining, industrial processes, waste disposal
etc. (i.e. anthropogenic). Regulatory bodies like World
Health Organisation (WHO) or United States Environment
Protection Agency (U.S.E.P.A) usually set maximum
contaminant levels (MCL) for various elements. Whenever
any element or substance has a concentration value
exceeding the MCL set for it by these regulatory bodies,
such a water is said to be polluted. In establishing MCL’s
these regulatory bodies took into consideration, the impacts
of the presence or excess levels of such substances on the
human body.
One group of pollutants known to be toxic to human health
is the heavy metal group. Heavy metals are defined as those
metals with atomic number equal to or greater than 20 but
this usually does not include alkali and alkali earth metals
like Ca, Mg, Na and K. Metals are introduced into aquifers
and surface water bodies through rock weathering and
erosion or by human activities. The global concern about the
presence of heavy metals or their elevated concentration
levels in water is because of their high level of toxicity.
Several heavy metals are known to be toxic to human,
animal and plant life and therefore need to be detected in
and removed from water before it affects whole populations
of people.
A major characteristic of heavy metals is that they usually
have very low concentrations in natural water. In fact they
typically have < 0. 1 mg/l in most cases and for this reason,
most chemical analyses of water tend to focus on major
elements which are considered to be major because they
constitute the greater percentage of dissolved solids in water,
but it has been found that even at very low concentrations,
heavy metals can be extremely dangerous to human health.
Some years ago, the widespread pollution of natural waters
in Bangladesh by geognic arsenic drew global attention. The
Bangladeshi case in the late eighties and nineties was well
documented 1, 2, 3
. Later on, it was discovered that arsenic
poisoning of natural water systems was not limited to
Bangladesh and West Bengal of India alone. At least 19
countries in the world had the same problem 4. The outcry
that arose due to the arsenic problem helped to fuel a lot of
research into the factors leaching arsenic into natural
systems. It was discovered that the arsenic pollution of
natural water in Assam State in India was connected with
high levels of iron in the water5, 6
. The occurrence of arsenic
and iron in groundwater was linked to the aquifer
sedimentology. High levels of arsenic and iron were found
in fine grained, sands and silts that had plenty of organic
matter and in the United States, it was also discovered that
arsenic commonly occurredin calcareous metasediments7.
A comparison between the sedimentology of arsenic
occurrence in Bangladesh and United States led to the need
to check for the presence of arsenic and other heavy metals
in Nigerian rocks with similar lithologic characteristics. It
was discovered that the Awgu Formation which comprises
mostly of carbonaceous shales andcalcareoussandstones had
elevated concentration levels of arsenic, lead and cadmium8.
The focus of this paper therefore is to check the heavy metal
status of natural waters in Abakaliki in Ebonyi State because
the underlying rocks also are lithological similar to the
Awgu Formation, though they differ in age.
2. The Study Area
Paper ID: SUB155071 482

International Journal of Science and Research (IJSR) ISSN (Online): 2319-7064
Index Copernicus Value (2013): 6.14 | Impact Factor (2013): 4.438
Volume 4 Issue 6, June 2015
www.ijsr.net Licensed Under Creative Commons Attribution CC BY
2.1 Location
The study area is located within latitudes 6016’ N and 6
0 21’
N and longitudes 8005’E and 8
0 10’ E covering an area of
about 83square Kilometres. It is a rapidly growing city
because of its status as a state capital. The area lacks good
aquifers because it is underlain by shales instead of sands or
gravels9.The shales however provide limited quantities of
water due to its fractured and jointed nature. The flat – lying
topography, high runoff and heavy rains at Abakaliki have
created many ponds and ephemeral streams. Only the
Ebonyi -River is perennial. Unfortunately some of these
surface water bodies and the shale – regolith aquifers do not
always survive the long, dry spells of the dry season. They
tend to dry up during the dry season but get recharged
during the rainy season periods. Water quality in Abakaliki
is a big issue because the waters harbour pathogens that
cause river blindness and elephantiasis.
2.2 Geohydrological Setting
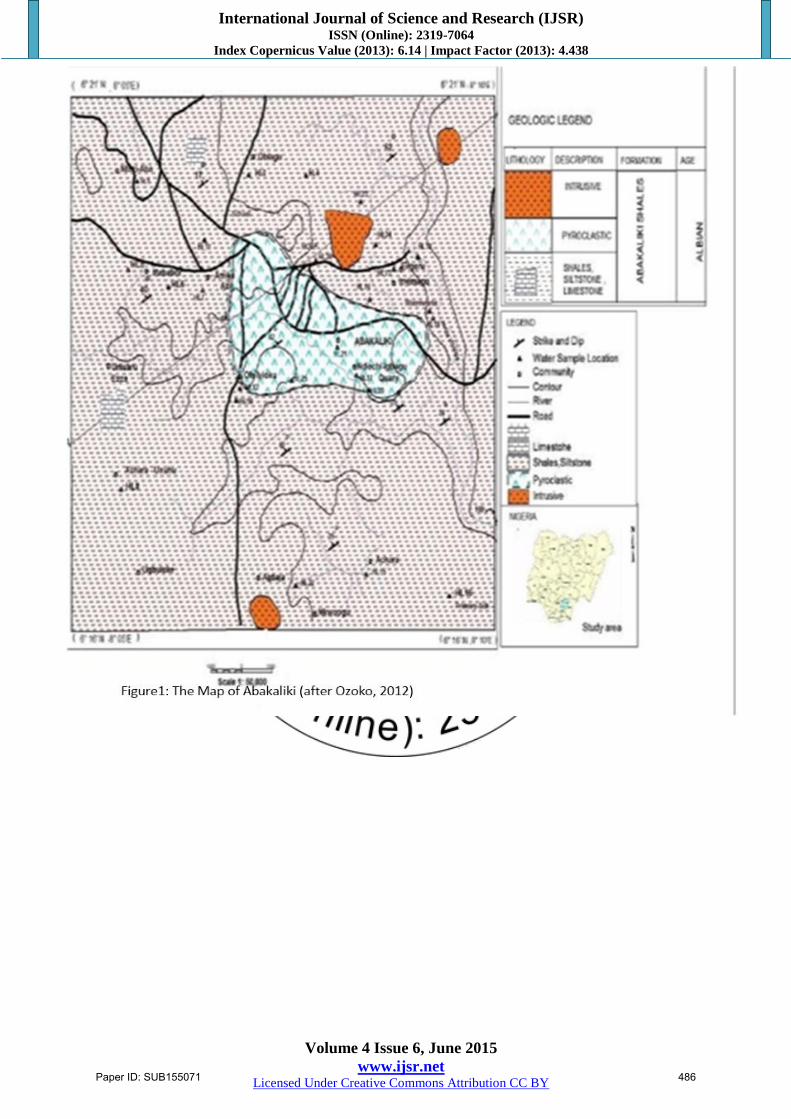
The study area (figure1) is underlain by Asu River Group of
sediments which are albian in age. The main formation in
the area is Abakaliki Formation (albian) which comprises
dark grey to black shales. The shales outcrop in parts of the
city like the Water Works area and Onuebonyi. The dips of
the rocks range from 550 to 57
0 in the SE direction. North of
the town a few outcrops of sandstone lenses may be found.
The sandstones are fine grained, greyish to yellowish in
colour with dark brown iron stains. Ancient volcanic activity
led to the pyroclastics exposed at the Juju hill which is the
highest point (topographically) in the area. At the Juju hill
area, there are exposures of baked shales. The shales of
Abakaliki Formation are folded, lead/zinc mineralized shales
with sandstone lenses and limestone bed. The limestone bed
is up to 30m in thickness while the thickness of the
formation is more than 500m10
. The sandstones of the
Abakaliki Formation are fine grained and have calcareous
cement. It has a highly fractured and weathered zone. Depth
to the static water table range from 6.5m to 25m in some
locations. Average values of K (hydraulic conductivities)
estimated from joint/fracture density characteristics of the
area is 6.06 x 10⁻³
cm/s.
3. Materials and Methods
Field work for the heavy metals involved collecting water
samples from 20 locations. The samples were collected with
500ml acid-rinsed polypropylene containers and acidified to
pH less than 2 in order to stabilise them for laboratory
analysis. The samples were then analysed with Atomic
Absorption Spectrophotometer at the PRODA laboratories
of Federal Ministry of Science and Technology, Enugu.
4. Results and Discussion
Results of selected physico-chemical tests on the natural
waters are given in Table 1. The pH values range from 6.5 to
8.4 which indicates mildly acidic conditions to alkaline.
Most of the waters had pH values slightly greater than
7.0(neutral). The pH values also indicate the possibility of a
well- buffered system. Values of total dissolved solids
(TDS) range from 827.8mg/l to 1206.4mg/l which shows
significant solute concentrations. Values in excess of
1000mg/l of TDS are considered to be brackish water.
Fifteen of the samples (75%) had nitrate concentrations
which when compared with dissolved oxygen levels appear
to be anomalous, particularly in the presence of iron but this
likely indicates redox processes in virtually all the samples.
It has been suggested that groundwater - based redox
processes are common in marine sediments11
. The Abakaliki
Formation (albian) was deposited in a marine environment.
Results from heavy metal chemical analysis are given by
table 2. Five heavy metals and one metalloid were tested for
and they include iron (Fe), lead (Pb), copper (Cu), zinc(Zn),
cadmium (Cd) and arsenic (As). Though it is customary to
give the units in µg/L (or parts per billion), the units of table
2 are in milligrams per litre.Iron (Fe) ranges from 0.2mg/l at
Ugbuloke to 9.2mg/l at Obiagu Central. The permitted limit
for iron in groundwater is 0.3mg/l but the results show that
apart from the Ugbuloke all the samples have very elevated
concentrations of iron. The average value of iron for all the
samples is 5.44mg/l (see table 3) which exceeds the MCL (ie
maximum contaminant level) by 18 times. The leaching of
iron into water is microbial driven in the presence of humic
and fulvic acids.The Abakaliki Formation is also known to
have carbonaceous shales and iron oxides which could be
leaching into the water. The range for lead (Pb) is from BDL
(below detection limits) to 13.8mg/l. The MCL for lead is
0.015mg/l and the average value for the study area is
4.5mg/l which exceeds the MCL by 300 times. Sulphides
like pyrites and galena occur in the study area. It is clear that
the excess lead in the water is of geogenic origin. It has been
suggested that lead in water usually tends to have strong
correlation with iron because lead (Pb) adsorbs on to iron
oxhydroxides which exist as particulate matter and also
because non-soluble particles of lead may be present as Pb –
carbonates14
.
Values of Copper (Cu) and Zinc are not significant
geochemically but arsenic (As) ranges from 0.1mg/l to
209mg/l. The average value (1.59mg/l) exceeds the MCL by
159 times. There are numerous studies on the mechanism of
arsenic mobilisation into groundwater. It has already been
established that pyrite and arsenopyrite occur in association
with lead/zinc mineralization. Arsenite in the form of
trivalent arsenite (As3+
) is leached into water through the
reduction of iron oxyhydroxides through microbial
breakdown of organic matter. For some of the hand-dug
wells and surface waters, it has been demonstrated that
nitrate reduction may promote the leaching of pentavalent
arsenate (As5+
) and (Fe3+
) into the water15
.
Values for cadmium range from BDL to 0.67mg/l in the
area. The average value 0.25mg/l exceeds the MCL
(0.05mg/l) by 50 times. The occurrence of cadmium is
closely associated with zinc availability. The lead/zinc
mineralisation in the study area will therefore facilitate the
release of cadmium into the waters.From the foregoing, it
can now be established that the natural waters of Abakaliki
have elevated concentrations with respect to iron, lead,
arsenic and cadmium. The maximum contaminant levels for
these heavy metals have all been exceeded.
5. Health Implications
Paper ID: SUB155071 483

International Journal of Science and Research (IJSR) ISSN (Online): 2319-7064
Index Copernicus Value (2013): 6.14 | Impact Factor (2013): 4.438
Volume 4 Issue 6, June 2015
www.ijsr.net Licensed Under Creative Commons Attribution CC BY
The health implication for excess iron in water is fortunately
not grave. The real problem with iron enrichment is that it
stains laundry, bath tubs, sinks and even human teeth. It can
clog well screen of boreholes. Excess lead is however
potentially dangerous. Lead has been implicated is diseases
like anaemia, liver damage, kidneydisease, reduced IQ,
behavioural and learning problems in children and
irreversible edema16
.
Arsenic is toxic to human health. It has also been implicated
in cancers of the bladder, lungs skin, liver and in prostate
problems. Non – life threatening effects of excess arsenic in
water include stomach pains, nausea, diarrhoea and partial
paralysis.16
The maximum contaminant level MCL for cadmium is
0.015mg/l but the average value is 0.25mg/l which is50
times more than the MCL. Cadmium (Cd) directly affects
the human body in a negative way, particularly the arteries
of the body. It is also known to cause stomach irritation,
vomiting and diarrhoea and death. Exposure to cadmium
over an extended period of time can cause kidney damage16
.
6. Conclusion
The natural waters of Abakaliki are polluted with respect to
heavy metals like iron, lead, arsenic and cadmium. The
mechanisms by which they are leached into groundwater
and surface water bodies in Abakaliki are not yet fully
understood. More detailed geochemical investigations need
to be carried out to determine these mechanisms so that
mitigation measures can be established for dealing with the
heavy metal pollution of the waters. It will also be necessary
to examine in greater detail the actual health status of the
population in order to establish the extent of the problem.
References
[1] Saha, A. K., and Chakrabarti, C., Geological and
geochemical background of the As bearing groundwater
occurrences of West Bengal. In: Proc. Int. Conf. on
Arsenic in Groundwater; Causes, Effect and Remedy,
Calcutta (1995).
[2] Dhar, R. K, Biswas, B. K., Samanta, G., Mandal, B. K.,
Chaksaborti, D., Roy, S., Jafar A., Islam, A., Ara, G.,
Kabir, S., Khan, A. W., Ahmed, S. K., Hadi, S. A.,
Groundwater As Calamity in Bangladesh. Currrent
Science, 73, 48-59(1997).
[3] Nickson, R. T., McArthur, J.M., Burgess, W. G.,
Ahmed, K. M., Ravenscroft, P., Rahman, M., Arsenic
Poisoning of Bangladesh groundwater. Nature 395,
338,(1998).
[4] Sever, M., Arsenic Leaching into Water from Soil.
Geotimes (September): 24-28(2011).
[5] Griffin, R.A and Shimp, N. F., Attenuation of Pollutants
in Municipal landfill leachate by clay minerals. EPA-
600/2-78-157(1978).
[6] Chetia, M., Chatterjee, S., Banerjee, M. J., Nath, D.,
Singh, R. B., Srivastava, H. P., Sarma, P., Groundwater
Arsenic Contamination in Brahmaputra river basin: A
water quality assessment in Golaghat (Assam),
India.Environ Monit Assess. 173, p. 1393-1398 (2011).
[7] Ayotte, J. D., Nielson, M. G., and Robinson, G. R.,
Relation of Arsenic concentrations in groundwater to
bedrock lithology in eastern New England. Geol. Soc. of
Amer. Ann. Meeting Abstracts with Program.A-
50(1998).
[8] Ozoko, D. C., Elevated Concentration Levels of Heavy
Metals in Natural Waters of Awgu-NdeaborShales
Aquifer, South Eastern Nigeria. J. of Envi. and Earth
Sci.vol. 4, No. 18, 94-104. (2014).
[9] Ozoko, D. C., Hydrogeochemical and Microbial
Characteristics of AbakalikiShales, Ebonyi State,
Nigeria. J. of Environ. Hydro,vol. 20, paper 5, 1-9
(2012)
[10] Nwajide, C.S., Geology of Nigeria‘s Sedimentary
Basins. CSS Bookshops, Lagos. (2013).
[11] Smedley, P. L., and Edmunds, W. M., Redox Patterns
and Trace Elements Behaviour in East Midlands
Triassic Sandstone Aquifer, U. K. Ground water,
vol.40, No1, 44-58(2002).
[12] World Health Organisation, Guidelines for drinking
Water quality.(2006).
[13] United States Environment Protection Agency,
Drinking Water Contaminants. (2010).
[14] Katz, B. G., Berndt, M. P., Bullen, T. D., and Hansard,
P., Factors Controlling Elevated Lead Concentrations in
water Samples from Aquifer Systems in Florida U. S.
Geological Survey Water Resources Investigation
Report. 99-4020. 26p (1999).
[15] Peter, S.C., Arsenic in groundwaters in the Northern
Appalachian Mountain Belt: a review of patterns and
processes. J. of Contam. Hydro., vol.99 (1), 8-21,
(2008).
[16] Agency for Toxic Substances and Disease Registry,
Toxicological Profile for Lead, update. Atlanta; U. S.
Department of Health and Human Services (2007).
Table 1: Selected physico – chemical parameters from the sampled sites. S/N Location Sample No pH Temp0C TDS mg/l NO3 mg/l Dissolved Oxygen
Mg/l
1 Ntezi Abu L2 7.4 26 985.7 1.2 1072.0
2 Prison Hospital L4 7.1 25 911.5 0.2 996.4
3 Obiagu West L6 7.5 27 1102.0 2.4 600.0
4 Obiagu Central L8 7.4 28 1004.7 2.8 673.8
5 Igbagu L9 7.8 24 827.8 BDL 1102.0
6 Abakaliki Borehole L10 7.3 28 902.3 3.7 1048.0
7 Water Works L11 7.1 29 846.0 BDL 1247.6
8 Ofeiyi Oku L12 7.3 24 956.7 BDL 1126.2
9 Primary School well L13 6.9 23 975.6 0.7 997.7
10 Rice farm well L14 7.2 25 1159.8 5.7 709.8
11 R. Iyiokwu L18 7.7 21 1108.5 3.5 750.2
Paper ID: SUB155071 484

International Journal of Science and Research (IJSR) ISSN (Online): 2319-7064
Index Copernicus Value (2013): 6.14 | Impact Factor (2013): 4.438
Volume 4 Issue 6, June 2015
www.ijsr.net Licensed Under Creative Commons Attribution CC BY
12 Quarry (Hw) L19 7.6 22 1334 BDL 720.3
13 Juju hill (well) L20 7.6 26 1294 4.4 620.0
14 Ebonyi River L21 7.8 27 1209 3.9 576.8
15 Limestone Quarry L22 8.5 22 1001.6 BDL 794.0
16 AkaeruIyimagu L24 7.9 25 904.6 0.3 1014.7
17 Military Cantonment L25 6.5 22 960.1 2.7 605.0
18 Ugbuloke L26 6.7 24 1001.2 2.5 1148.2
19 Achi Stream L28 7.5 26 1206.4 3.9 680.4
20 Abia Stream L30 7.7 24 1108.7 3.5 794.00
Table 2: Heavy metal concentration in the waters of the study areas (in mg/l) S/N Location Sample No Iron Lead (pd) Copper (Cu) Zinc (Zn) Arsenic (As) Cadmium (Cd)
1 Ntezi Abu (BH) L2 6.9 7.5 BDL BDL 1.0 BDL
2 Prison Hospital (BH) L4 7.9 BDL 0.3 0.35 0.1 BDL
3 Obiagu West (BH) L6 7.8 0.5 0.5 0.44 2.3 BDL
4 Obiagu Central (BH) L8 9.2 10.1 0.3 0.1 4.1 BDL
5 Igbagu , (BH) L9 1.8 3.2 0.4 0.11 2.4 BDL
6 Abakaliki (BH) L10 6.9 0.1 0.6 0.74 1.5 BDL
7 Water Work Area (BH) L11 3.3 BDL 0.1 0.41 0.7 BDL
8 Ofeiyi Oku L12 4.4 3.7 0.4 0.09 1.1 BDL
9 Primary School (BH) L13 2.9 2.3 0.2 0.09 1.2 BDL
10 Rice farm (HW) L14 7.8 8.3 BDL 0.70 BDL 0.48
11 R. Iyiokwu L18 2.3 14.7 0.1 0.64 1.3 BDL
12 Quarry (Hw) L19 7.6 BDL BDL 1.12 2.6 0.24
13 Juju hill (well) L20 4.4 9.6 0.1 0.33 2.9 0.52
14 Ebonyi River I L21 3.7 13.8 BDL 0.27 BDL BDL
15 Limestone Quarry (HW) L22 4.11 0.8 0.4 0.78 0.7 0.27
16 AkaeruIyimagu (HW) L24 5.3 0.2 0.2 BDL 1.7 0.07
17 Military Cantonment Abakaliki< BH L25 9.0 0.6 0.1 0.81 2.7 BDL
18 Ugbuloke (HW) L26 0.2 0.3 0.3 0.11 0.2 0.11
19 Achi Stream L28 4.7 0.5 0.3 BDL 1.7 0.67
20 Abia Stream L30 3.7 0.3 BDL 0.43 0.5
0.01
Table 3: Comparison of Heavy Metal concentrations in AbakalikiwithW.H.O.(2006)12
& USEPA 2010 13
standards Heavy Metals WHO Standards 2006 U.S.E.P.A. (2010) Average value Exceeds MCL by
Health Based guideline Maximum Contamination level
Iron(Fe) No guide line 0.3mg/l 5.44mg/l 18
times Lead(Pb) 0.01mg/l 0.015mg/l 4.5mg/l 300
times Cooper(Cu) 2mg/l 1.3mg/l 0.29mg/l 0.22 times
Zinc (Zn) - - 0.44mg/l -
Arsenic (As) 0.01mg/l 0.01mg/l 1.59mg/l 159 times
Cadmium(Cd) 0.003mg/l 0.005mg/l 0.25mg/l 50 times
Paper ID: SUB155071 485
International Journal of Science and Research (IJSR) ISSN (Online): 2319-7064
Index Copernicus Value (2013): 6.14 | Impact Factor (2013): 4.438
Volume 4 Issue 6, June 2015
www.ijsr.net Licensed Under Creative Commons Attribution CC BY
Paper ID: SUB155071 486