Heavy-Duty Flexible Bases: Year 3 Progress Report
140
Technical Report Documentation Page 1. Report No. FHWA/TX-05/0-4358-3 2. Government Accession No. 3. Recipient's Catalog No. 5. Report Date May 2005 Resubmitted: July 2006 Published: December 2006 4. Title and Subtitle HEAVY-DUTY FLEXIBLE BASES: YEAR 3 PROGRESS REPORT 6. Performing Organization Code 7. Author(s) Anuroopa Kancherla and Tom Scullion 8. Performing Organization Report No. Report 0-4358-3 10. Work Unit No. (TRAIS) 9. Performing Organization Name and Address Texas Transportation Institute The Texas A&M University System College Station, Texas 77843-3135 11. Contract or Grant No. Project 0-4358 13. Type of Report and Period Covered Technical Report: September 2002−August 2004 12. Sponsoring Agency Name and Address Texas Department of Transportation Research and Technology Implementation Office P. O. Box 5080 Austin, Texas 78763-5080 14. Sponsoring Agency Code 15. Supplementary Notes Project performed in cooperation with the Texas Department of Transportation and the Federal Highway Administration. Project Title: Materials, Specifications and Construction Techniques for High Performance Flexible Bases URL:http://tti.tamu.edu/documents/0-4358-3.pdf 16. Abstract In Year 3 the laboratory test protocols for measuring the resilient modulus and permanent deformation properties of granular bases were further developed. A repeatability study was conducted, and studies were also made on the influence of sample size. A comparison was made with samples molded to the recommended dimensions (6 inches by 12 inches high) to the standard Texas Department of Transportation (TxDOT) size, 6 by 8 inch. Using a high-quality base material from Spicewood Springs, it was found statistically that the resilient modulus values were not affected by using a smaller sample size. Experimental test sections were also constructed with three premium bases that meet the proposed Item 245 specification. Preliminary laboratory test results are presented on these bases together with details of the test section construction. The Tube Suction Test continues to be a good test to identify good base materials; it clearly distinguished between the Item 245 and Item 247 materials. No clear distinction could be made with other tests such as resilient modulus. Numerous problems were encountered with running the low-fines bases through the traditional strength testing. We found problems with both the compaction and testing. A new vibratory compaction system was built, and it will be evaluated in Year 4 of this project. 17. Key Words Aggregate Base Materials, Cement Stabilization, Durability, Moisture Susceptibility, Pre-cracking, Shrinkage Cracking, Tube Suction Test 18. Distribution Statement No restrictions. This document is available to the public through NTIS: National Technical Information Service Springfield, Virginia 22161 http://www.ntis.gov 19. Security Classif.(of this report) Unclassified 20. Security Classif.(of this page) Unclassified 21. No. of Pages 140 22. Price Form DOT F 1700.7 (8-72) Reproduction of completed page authorized
Transcript of Heavy-Duty Flexible Bases: Year 3 Progress Report

Technical Report Documentation Page 1. Report No. FHWA/TX-05/0-4358-3
2. Government Accession No.
3. Recipient's Catalog No. 5. Report Date May 2005 Resubmitted: July 2006 Published: December 2006
4. Title and Subtitle HEAVY-DUTY FLEXIBLE BASES: YEAR 3 PROGRESS REPORT
6. Performing Organization Code
7. Author(s) Anuroopa Kancherla and Tom Scullion
8. Performing Organization Report No. Report 0-4358-3 10. Work Unit No. (TRAIS)
9. Performing Organization Name and Address Texas Transportation Institute The Texas A&M University System College Station, Texas 77843-3135
11. Contract or Grant No. Project 0-4358 13. Type of Report and Period Covered Technical Report: September 2002−August 2004
12. Sponsoring Agency Name and Address Texas Department of Transportation Research and Technology Implementation Office P. O. Box 5080 Austin, Texas 78763-5080
14. Sponsoring Agency Code
15. Supplementary Notes Project performed in cooperation with the Texas Department of Transportation and the Federal Highway Administration. Project Title: Materials, Specifications and Construction Techniques for High Performance Flexible Bases URL:http://tti.tamu.edu/documents/0-4358-3.pdf 16. Abstract In Year 3 the laboratory test protocols for measuring the resilient modulus and permanent deformation properties of granular bases were further developed. A repeatability study was conducted, and studies were also made on the influence of sample size. A comparison was made with samples molded to the recommended dimensions (6 inches by 12 inches high) to the standard Texas Department of Transportation (TxDOT) size, 6 by 8 inch. Using a high-quality base material from Spicewood Springs, it was found statistically that the resilient modulus values were not affected by using a smaller sample size. Experimental test sections were also constructed with three premium bases that meet the proposed Item 245 specification. Preliminary laboratory test results are presented on these bases together with details of the test section construction. The Tube Suction Test continues to be a good test to identify good base materials; it clearly distinguished between the Item 245 and Item 247 materials. No clear distinction could be made with other tests such as resilient modulus. Numerous problems were encountered with running the low-fines bases through the traditional strength testing. We found problems with both the compaction and testing. A new vibratory compaction system was built, and it will be evaluated in Year 4 of this project. 17. Key Words Aggregate Base Materials, Cement Stabilization, Durability, Moisture Susceptibility, Pre-cracking, Shrinkage Cracking, Tube Suction Test
18. Distribution Statement No restrictions. This document is available to the public through NTIS: National Technical Information Service Springfield, Virginia 22161 http://www.ntis.gov
19. Security Classif.(of this report) Unclassified
20. Security Classif.(of this page) Unclassified
21. No. of Pages 140
22. Price
Form DOT F 1700.7 (8-72) Reproduction of completed page authorized


HEAVY-DUTY FLEXIBLE BASES: YEAR 3 PROGRESS REPORT
by
Anuroopa Kancherla Graduate Research Assistant
Texas Transportation Institute
and
Tom Scullion, P.E. Research Engineer
Texas Transportation Institute
Report 0-4358-3 Project 0-4358
Project Title: Materials, Specifications and Construction Techniques for High Performance Flexible Bases
Performed in cooperation with the Texas Department of Transportation
and the Federal Highway Administration
May 2005 Resubmitted: July 2006
Published: December 2006
TEXAS TRANSPORTATION INSTITUTE The Texas A&M University System
College Station, TX 77843-3135

v
DISCLAIMER
The contents of this report reflect the views of the authors, who are responsible for the
opinions, findings, and conclusions presented herein. The contents do not necessarily reflect the
official views or policies of the Texas Department of Transportation (TxDOT), or the Federal
Highway Administration (FHWA). This report does not constitute a standard, specification, or
regulation, nor is it intended for construction, bidding, or permit purposes. Trade names were
used solely for information and not for product endorsement. The engineer in charge of the
project was Tom Scullion, P.E. #62683.

vi
ACKNOWLEDGMENTS
The authors wish to acknowledge Ms. Caroline Herrera, P.E., of the Construction
Division for arranging this project and serving as project director. Her support and flexibility are
appreciated. Mr. Mike Arellano from the project steering committee provided continuing
support and direction to this study. Mr. Lee Gustavus of Texas Transportation Institute (TTI)
was instrumental in obtaining the aggregate samples and facilitating laboratory testing.
Dr. Jacob Uzan of Technion is recognized for assistance in establishing the resilient modulus test
program. Dr. Fujie Zhou provided software to interpret the results of the resilient modulus test.

vii
TABLE OF CONTENTS Page
List of Figures ................................................................................................................................ ix
List of Tables ...................................................................................................................................x
Chapter 1 Introduction.................................................................................................................1
Research Objectives.............................................................................................................2
Chapter 2 Modified Resilient Modulus and Permanent Deformation Test Procedure................3
Experimental Design............................................................................................................4
Preliminary Testing..............................................................................................................4
Chapter 3 Performance Test Sequence........................................................................................7
Proposed Performance Test .................................................................................................7
Test Apparatus .....................................................................................................................8
Test Specimen Preparation ................................................................................................10
Test Sequence ....................................................................................................................12
Conditioning .................................................................................................................12
Permanent Deformation Test ........................................................................................13
Resilient Modulus Test .................................................................................................13
Calculations........................................................................................................................18
Within Lab Repeatability Measurements...........................................................................21
Influence of Specimen Size ...............................................................................................22
Chapter 4 Test Results...............................................................................................................23
Performance Test Results ..................................................................................................23
Permanent Deformation Properties...............................................................................23
Resilient Modulus Test Results .........................................................................................24
Statistical Analysis of Test Results....................................................................................27
Sample Size Calculations..............................................................................................29
Influence of Specimen Size on Test Results......................................................................30

viii
Chapter 5 Evaluation of Granular Base Materials ......................................................................35
Tube Suction Test............................................................................................................37
Texas Triaxial Test ..........................................................................................................38
Permanent Deformation and Resilient Modulus Test .....................................................38
Chapter 6 Summary ................................................................................................................47
REFERENCES ..............................................................................................................................49
APPENDIX A: Test Protocols......................................................................................................51
APPENDIX B: Sample Preparation..............................................................................................77
APPENDIX C: Permanent Deformation Results for Spicewood Springs ....................................83
APPENDIX D: Resilient Modulus Results for Spicewood Springs.............................................99
APPENDIX E: Preliminary Test Results for Granite Mountain and
Sawyer Pit Materials......................................................................................................109
APPENDIX F: Tube Suction Test Results .................................................................................113
APPENDIX G: Resilient Modulus and Permanent Deformation Test Results ..........................125
ix
LIST OF FIGURES Figure Page
1 Moisture-Density Relationship for Spicewood Material...................................................5
2 Stress Sequence Compared for Granular Materials...........................................................8
3 Test Setup for Resilient Modulus ......................................................................................9
4 Specimen Prepared for Testing .........................................................................................9
5 Molding and Compacting Equipment .............................................................................10
6 Extrusion of Specimen from the Compaction Mold........................................................11
7 Test Specimen Prepared for Testing................................................................................12
8 Representation of Load and Position of LVDTs on Specimen .......................................13
9 Flowchart of the Test Procedure for Permanent Deformation
and Resilient Modulus.....................................................................................................17
10 Sample Plot of Permanent Strain versus Number of Load Cycles ..................................20
11 Sample Regression Plot of Measured versus Predicted Values ......................................21
12 Specimen after Testing ....................................................................................................22
13 Plot of εp/εr with Number of Load Cycles .......................................................................25
14 Resilient Modulus Values at 5 psi Confining Pressure and 15 psi
Deviatoric Stress..............................................................................................................27
15 Plot of Number of Samples versus Percent Error of Resilient
Modulus Value ................................................................................................................29
16 Plot of Number of Samples versus Percent Error of Permanent
Deformation Values ........................................................................................................30
17 Resilient Modulus Values for 6 in. by 8 in. Specimens ..................................................31
18 Test Sections Built at Texas A&M University Riverside Campus .................................35
19 Test Section Built with Granite Mountain as Base Material ...........................................36
20 Test Section Built with Springdale Material ...................................................................36
21 Test Section Built Sawyer Pit Material ...........................................................................37
22 Tube Suction Test Results for Granite Mountain............................................................42
23 Tube Suction Test Results for Springdale .......................................................................43
24 Tube Suction Test Results for Sawyer Pit .......................................................................44
25 TTI’s New Base Vibratory Compactor............................................................................46

x
LIST OF TABLES Table Page
1 Preliminary Test Results....................................................................................................5
2 Suggested Data Collection for Permanent Deformation Test .........................................14
3 Permanent Deformation and Resilient Modulus Test Sequence
for Granular Base ............................................................................................................15
4 Permanent Deformation Test Results for Specimen size 6 in. by 12 in ..........................23
5 Resilient Modulus Test Results for Specimen Size 6 in. by 12 in. at 5 psi
Confining Pressure and 15 psi Deviatoric Stress ............................................................26
6 Average and Standard Deviations of Test Results ..........................................................28
7 Repeatability Limits for Resilient Modulus and Permanent Strain.................................28
8 Permanent Deformation Test Results for 6 in. by 8 in. Specimens.................................30
9 Resilient Modulus Test Results for 6 in. by 8 in. Specimens..........................................31
10 Calculation of Pooled Standard Deviation for Resilient Modulus Values ......................32
11 Calculation of Pooled Standard Deviation for Permanent Deformation
Values at 5000 Load Cycles ............................................................................................32
12 Results of Engineering Properties of Granite Mountain, Springdale,
and Sawyer Pit Samples ..................................................................................................39
13 Summary of TST Results ................................................................................................40
14 Resistance to Moisture Ingress as Measured in TST.......................................................41
15 Results of Resilient Modulus and Permanent Deformation Test ....................................45
1
CHAPTER 1
INTRODUCTION
New specifications proposed by Texas Department of Transportation (TxDOT) for base
materials aim to improve the quality of base materials used for pavement construction.
Numerous research efforts have been devoted to characterizing the behavior of granular
materials, which is one of the main concerns of pavement engineers (1). The major structural
function of a granular base layer is to contribute to the distribution of stresses applied to the
pavement surface by traffic loading. These stresses must be reduced to levels that do not
overstress the underlying base, subbase, and subgrade. Overstressing unbound granular material
can produce unacceptable levels of resilient pavement deflections under moving wheel loads or
can cause accumulation of excessive amounts of permanent deformation, ultimately affecting the
pavement performance (2). Thus, researchers need better understanding of the behavior of base
materials obtained by applying laboratory tests where insitu stress conditions and traffic loads
are adequately simulated.
This report summarizes the project conducted as part of the research for upgrading the
quality of base materials. Researchers evaluated material properties using different testing
procedures. The resilient modulus and permanent deformation test procedure was modified based
on recommendations in the National Cooperative Highway Research Program (NCHRP) 1-28A
report. A repeatability analysis was carried out on the proposed test procedure. Further,
laboratory evaluation was conducted on three base materials for different performance
parameters such as moisture susceptibility, strength, resistance to permanent deformation, and
resilient modulus. These materials are used in the test sections built at the Texas Transportation
Institute (TTI) at College Station, Texas. The test sections were built as part of the final phase of
this project, wherein field tests would be conducted to estimate their performance. Also, the
performance of these test sections will be monitored over a period of time.
The documentation of this project is mainly divided into two parts. The first part focuses
on the development of the resilient modulus and permanent deformation test procedure and the
repeatability analysis of this test procedure. The second part focuses on the evaluation of various
base materials and their performance. The description of the test procedures conducted is
provided, followed by a discussion on the test results and analysis.
2
RESEARCH OBJECTIVES
It is critical to conduct a rigorous evaluation of the properties of base materials to
facilitate TxDOT’s efforts to improve the quality of base materials used in pavement
construction. The following were the objectives of this project:
1. Evaluation of a modified test procedure to estimate the minimum number of samples
necessary to test for a reliable level of accuracy for the resilient modulus and permanent
deformation test:
• Evaluate the variability of the test results determined from the test.
• Estimate the number of test specimens required for a given tolerance level of the
test results.
• Evaluate the influence of sample size on test results. If possible TxDOT would
prefer to use standard samples 6 inches in diameter by 8 inches tall, as opposed
to the recommended 6- by 12-inch samples.
2. Laboratory evaluation of base materials used in Texas using the standard test
procedures of the Texas manual of testing procedures (6). All strength tests were
conducted at both optimum and moisture conditioned states.
• Evaluate the moisture susceptibility of base materials.
• Evaluate the compressive strength of material.
• Evaluate the stiffness of the material under repeated loading.
• Evaluate the resistance to permanent deformation under repeated loading.
3
CHAPTER 2
MODIFIED RESILIENT MODULUS AND PERMANENT DEFORMATION
TEST PROCEDURE
There has been a significant amount of research in the determination of resilient
properties of base materials (1). Several agencies have specified different test methods for
resilient modulus testing, and some agencies have modified the current American Association of
State Highway and Transportation Officials (AASHTO) test protocol to their need and
convenience. Hence, there is a need to develop a unified test method that would also represent
field conditions. NCHRP project 1-28A “Harmonized Test Methods for Laboratory
Determination of Resilient Modulus for Flexible Pavement Design” was initiated to combine the
best features of the resilient modulus testing procedures in current usage (3).
The literature suggests that the Strategic Highway Research Program (SHRP)-46 protocol
is one of the methods that closely represents the field stress state conditions (4, 5); however,
AASHTO deleted this SHRP-46 protocol for resilient modulus testing from the standard
specification due to lack of use. The standard test protocol for the resilient modulus test,
AASHTO T307, measures only the resilient modulus. The present study made use of an
expanded test protocol including resilient modulus as well as permanent deformation testing.
Henceforth, this test will be referred to as the performance test.
The present project made use of an expanded test protocol which included measurement
of nonlinear resilient modulus parameters (k1, k2, k3) and permanent deformation parameters
(α, µ). The resilient modulus test result is a required input in the level I analysis or most
sophisticated analysis of the newly proposed 2002 design guide to be released soon. Also, both
resilient modulus and permanent deformation test results provide material property input to the
VESYS5 computer model used to predict pavement performance.
This section consists of a description of the research methodology adopted for the
repeatability analysis of the performance test procedure including the experimental setup and test
matrix. The tests conducted are briefly described with a sample test result. Further, the salient
features of this test procedure are discussed. A description of this procedure is provided in the
following subsections including the test apparatus and the test specimen preparation.

4
EXPERIMENTAL DESIGN
Researchers conducted a within-laboratory study to evaluate the modified test procedure.
For any test method it is necessary that the inherent variability in the test procedure be
minimized. Specimens of Spicewood Springs crushed limestone base material were compacted
to two different sizes: (1) 6 in. (152 mm) diameter by 12 in. (305 mm) height and (2) 6 in.
(152 mm) diameter by 8 in. (203 mm) height to be used in the proposed performance test. The
present study evaluated the variability between independent test results obtained within a single
laboratory in the shortest practical period of time by a single operator with a specific test
apparatus using test specimens (or test units) taken at random from a single quantity of
homogeneous material obtained or prepared for the study. Further, the influence of reducing the
specimen height from 12 in. (305 mm) to 8 in. (203 mm) was investigated.
It was necessary to conduct a preliminary assessment of the mechanical properties of the
materials such as the gradation, dry density, and moisture content, which influence the
compaction and specimen preparation characteristics for the proposed test procedure.
PRELIMINARY TESTING
Preliminary testing of the material was conducted and the mechanical properties were
determined according to the Texas manual of testing procedures (6). After completion of the
preliminary tests, the gradation and optimum moisture content results were used in the
preparation and compaction of test specimens. The preliminary tests that were conducted are:
• particle size analysis,
• determination of liquid limit,
• determination of plastic limit,
• determination of plasticity index, and
• determination of moisture-density relationship.
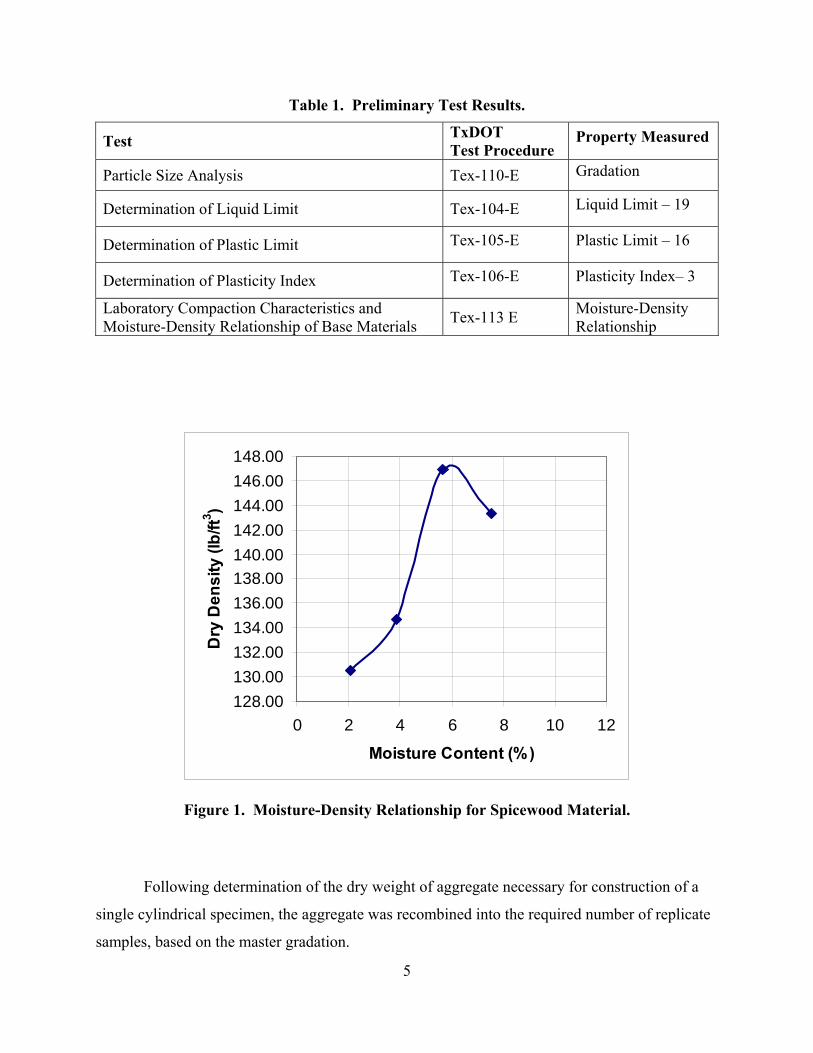
The results of these tests are provided in Table 1.
The optimum moisture content determined using standard test procedure (7) was found to
be 5.6 percent with a corresponding maximum dry density of 146.8 lb/ft3 (2352.6 kg/m3). This
result is graphically shown in Figure 1.
5
Table 1. Preliminary Test Results.
Test TxDOT Test Procedure
Property Measured
Particle Size Analysis Tex-110-E Gradation
Determination of Liquid Limit Tex-104-E Liquid Limit – 19
Determination of Plastic Limit Tex-105-E Plastic Limit – 16
Determination of Plasticity Index Tex-106-E Plasticity Index– 3
Laboratory Compaction Characteristics and Moisture-Density Relationship of Base Materials Tex-113 E Moisture-Density
Relationship
128.00130.00132.00134.00136.00138.00140.00142.00144.00146.00148.00
0 2 4 6 8 10 12
Moisture Content (%)
Dry
Den
sity
(lb/
ft3 )
Figure 1. Moisture-Density Relationship for Spicewood Material.
Following determination of the dry weight of aggregate necessary for construction of a
single cylindrical specimen, the aggregate was recombined into the required number of replicate
samples, based on the master gradation.

7
CHAPTER 3
PERFORMANCE TEST SEQUENCE
After completion of the preliminary testing of the material, the proposed performance test
was conducted. The proposed performance test sequence is described in detail in this section
including the test apparatus, test specimen preparation, and the test sequence.
PROPOSED PERFORMANCE TEST
Previous research studies focused on the determination of resilient modulus; relatively
little research has been conducted on determination of permanent deformation properties of
granular materials. NCHRP 1-37A “Development of the 2002 Guide for the Design of New and
Rehabilitated Pavement Structures” also requires the resilient modulus value as an input for
level I design. It further recommends AASHTO T307 specification for the determination of
resilient modulus value, which does not include determination of permanent deformation
properties. The proposed performance test procedure integrates determination of permanent
deformation properties along with determination of resilient modulus values of unbound granular
materials.
The test sequence is adapted from the standard test methods given by the VESYS user
manual, NCHRP 1-28A report, and AASHTO T307 and TP46 (4, 8, 9, 10). The data acquisition
system is completely automated. The stress sequence follows the recommendations of the
NCHRP 1-28A project, which is a more rational approach than the stress sequences followed by
current standards (4, 9) that maintain a constant stress ratio (ratio of maximum axial stress to
confining pressure, σ1/σ3) by increasing both the principal stresses simultaneously. Since the
selected sequence starts with the minimum stress ratio, the possibility of failing the sample early
in the test is minimized. The method is illustrated in Figure 2, which indicates the sequence of
the confining pressure and the deviatoric stress applied. Both the confining pressure and the
deviatoric stress are varied such that increasing stress levels are applied on the specimen while
keeping the stress ratio constant. This method prevents premature failure of the specimen, as the
specimen is not subjected to high stress ratios in the earlier sequences. Also, this enables testing
the specimen beyond the line of failure and studying the behavior of material as the stress levels
increase beyond the line of failure.

8
Figure 2. Stress Sequence Compared for Granular Materials.
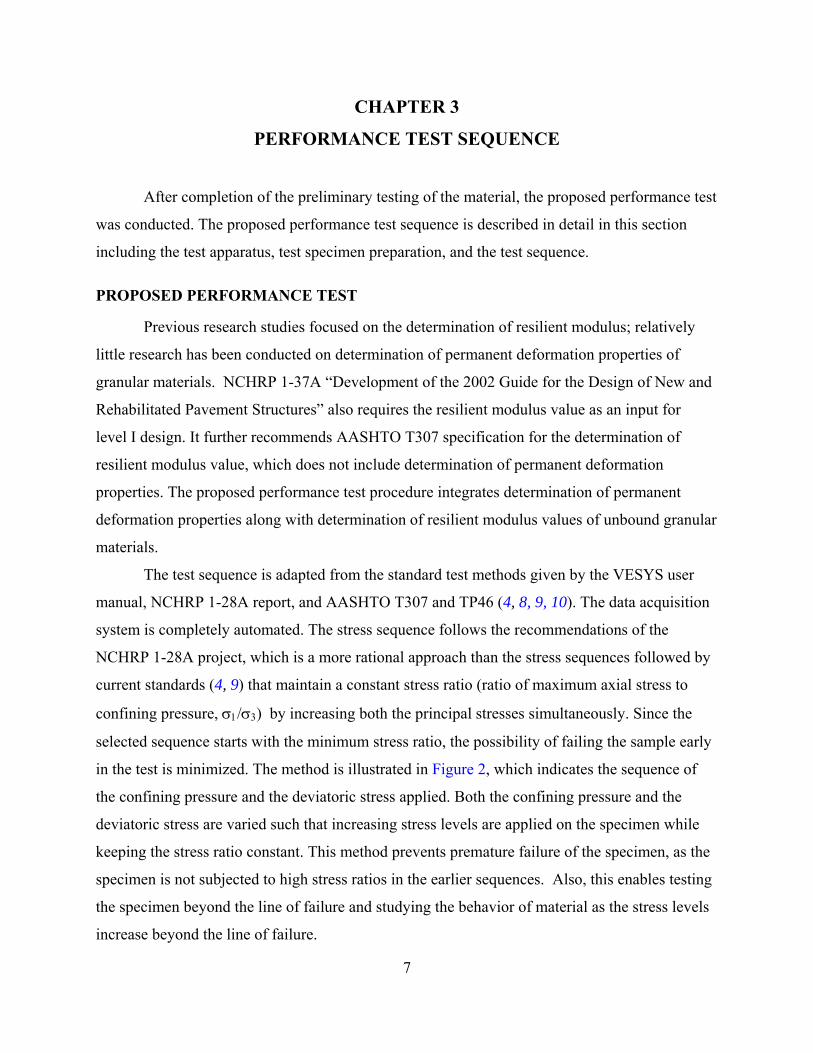
TEST APPARATUS
The test apparatus consists of a triaxial chamber, loading device, response measuring
equipment, and data acquisition system. The triaxial pressure chamber contains the test specimen
and the confining fluid during the test as shown in Figure 3. Air is used in the triaxial chamber as
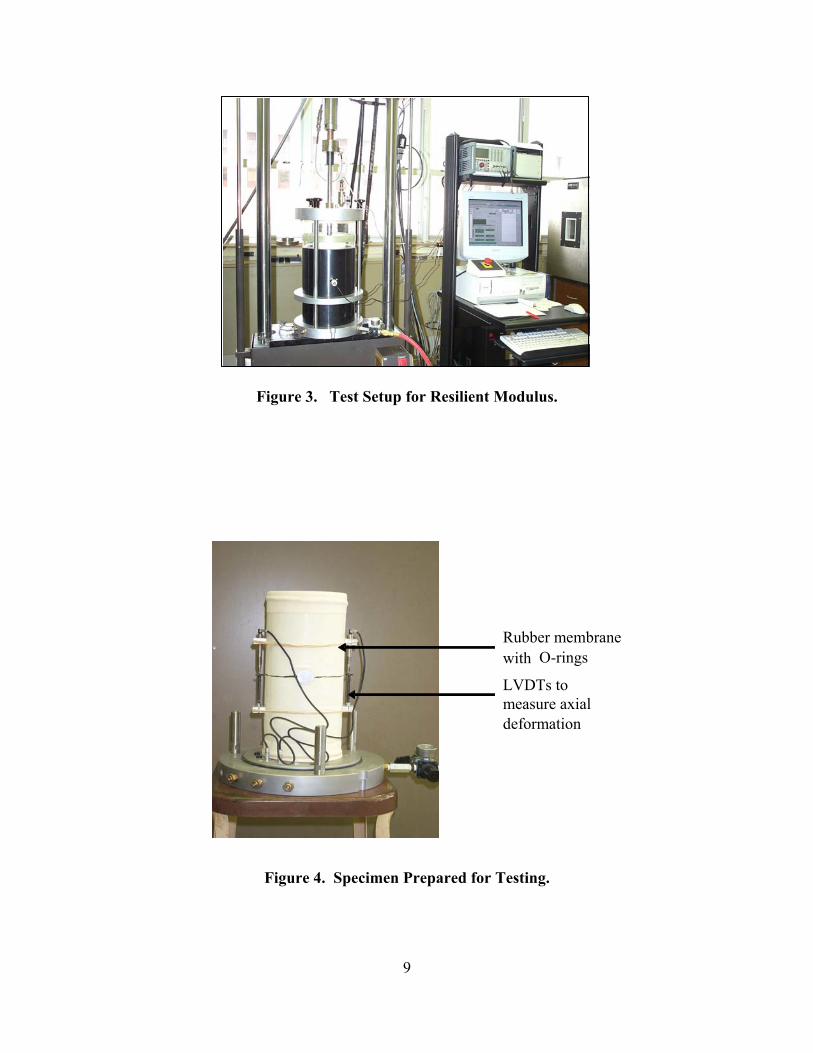
the confining fluid for all testing. The axial deformation is measured internally, directly on the
specimen using Linear Variable Differential Transducers (LVDT) as shown in Figure 4.
The loading device consists of a top-loading, closed-loop electro-hydraulic testing
machine capable of applying repeated cycles of a haversine-shaped load pulse (0.1 sec loading
and 0.9 sec unloading). The data acquisition system is completely automated. The test apparatus
complies with the specifications of AASHTO T307 (9).
σ3
σd
Line of Failure
Stress Level
9
Figure 3. Test Setup for Resilient Modulus.
Figure 4. Specimen Prepared for Testing.
Rubber membrane with O-rings
LVDTs to measure axial deformation

10
TEST SPECIMEN PREPARATION
Preparation of the specimens included:
• dry mechanical sieving into various size fractions,
• determining the optimum moisture content,
• maximum dry density,
• recombining the aggregate into replicate samples,
• and compaction.
The standard method of sample preparation was followed as given in AASHTO (9). The
optimum moisture content and maximum dry density results are used for the compaction of the
specimen for the performance test. The required amount of material is mixed with the optimum
amount of water and compacted to the specified dimensions. In this study, the specimen
dimensions used are 6 in. (152 mm) diameter by 12 in. (305 mm) height and 6 in. (152 mm)
diameter by 8 in. (203 mm) height. The compaction and molding equipment are shown in
Figure 5.
Figure 5. Molding and Compacting Equipment.
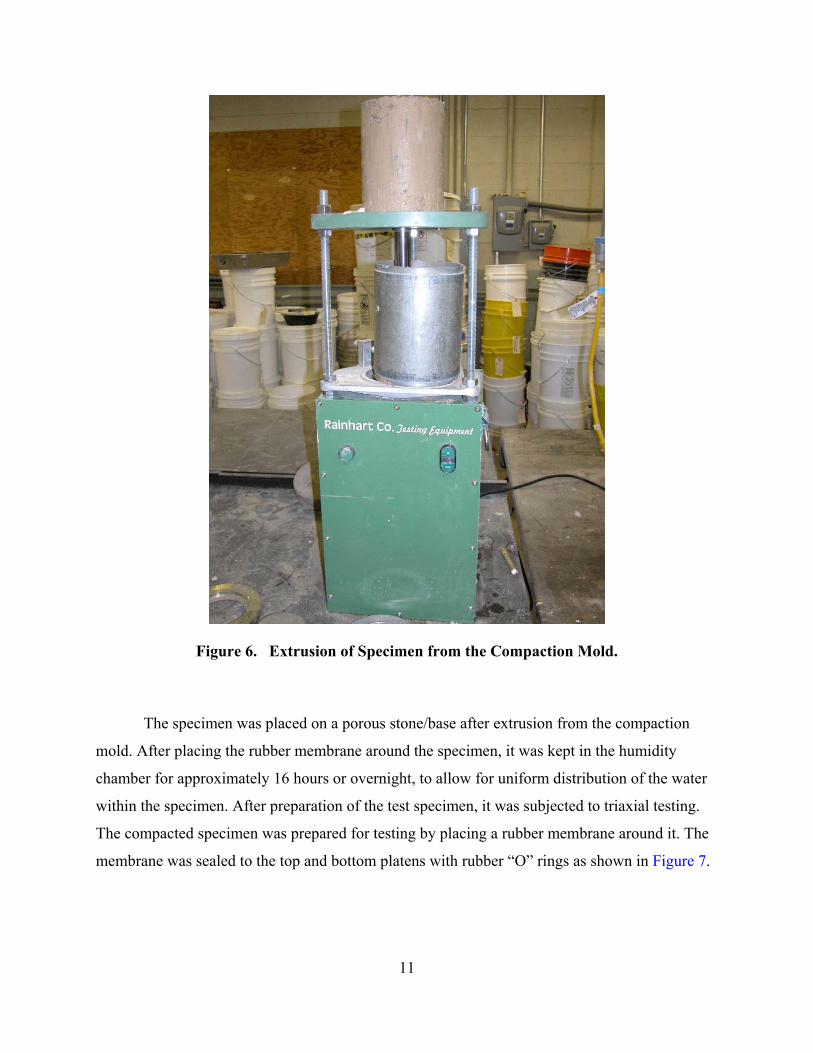
After compaction of the specimen, it was extruded from the compaction mold as shown
in Figure 6.
11
Figure 6. Extrusion of Specimen from the Compaction Mold.
The specimen was placed on a porous stone/base after extrusion from the compaction
mold. After placing the rubber membrane around the specimen, it was kept in the humidity
chamber for approximately 16 hours or overnight, to allow for uniform distribution of the water
within the specimen. After preparation of the test specimen, it was subjected to triaxial testing.
The compacted specimen was prepared for testing by placing a rubber membrane around it. The
membrane was sealed to the top and bottom platens with rubber “O” rings as shown in Figure 7.

12
Figure 7. Test Specimen Prepared for Testing.
TEST SEQUENCE
After the preparation of the test specimen, the following testing sequence was used. The
stress sequence follows the recommendations by NCHRP 1-28A for base/subbase materials,
which maintains a constant stress ratio by increasing both the principal stresses simultaneously.
The test sequence consisted of three stages:
• preliminary conditioning,
• permanent deformation test, and
• resilient modulus test.
Conditioning
The specimen was preconditioned before testing by applying 100 repetitions of a load
equivalent to a maximum axial stress of 6 psi (41.4 kPa) and a corresponding cyclic stress of
3 psi (20.7 kPa) using a haversine-shaped 0.1 second load pulse followed by a 0.9 second rest
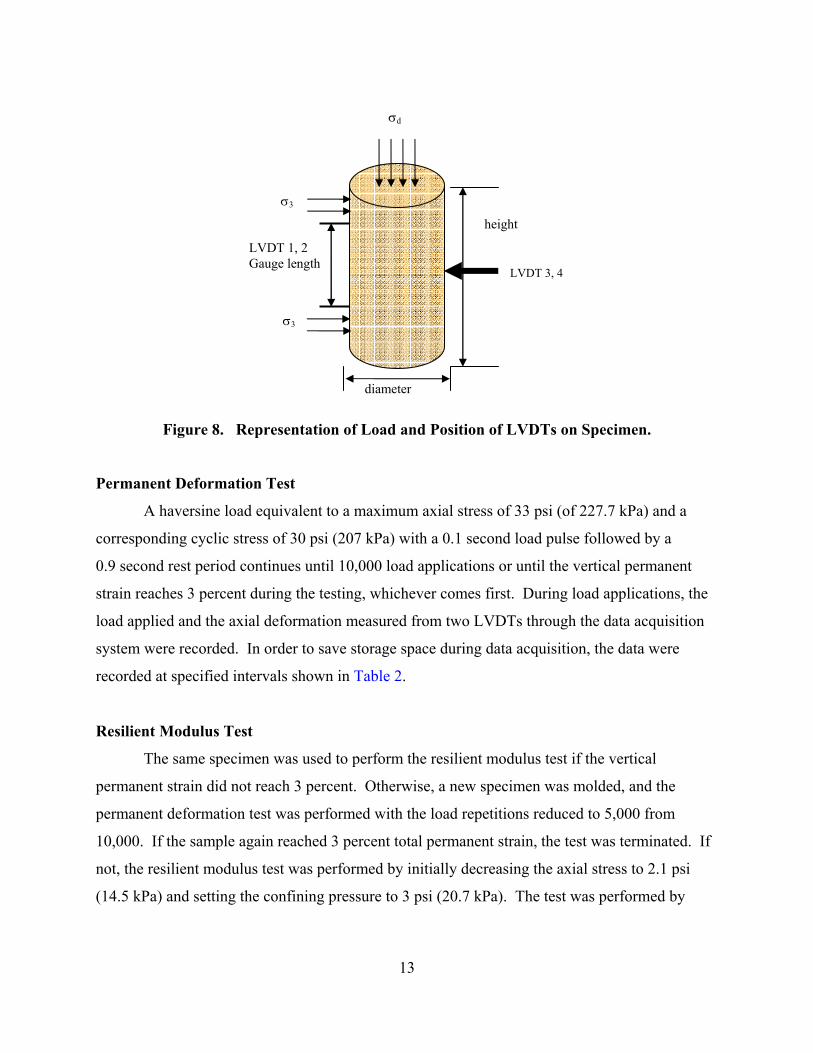
period. A confining pressure of 15 psi (103.4 kPa) was applied to the test specimen. A schematic
representation of the load and the placement of LVDT are shown in Figure 8. σd is the axial
deviatoric stress, and σ3 is the confining pressure. LVDTs 1 and 2 measure the axial
displacement, and LVDTs 3 and 4 measure the radial displacement.
13
Figure 8. Representation of Load and Position of LVDTs on Specimen.
Permanent Deformation Test
A haversine load equivalent to a maximum axial stress of 33 psi (of 227.7 kPa) and a
corresponding cyclic stress of 30 psi (207 kPa) with a 0.1 second load pulse followed by a
0.9 second rest period continues until 10,000 load applications or until the vertical permanent
strain reaches 3 percent during the testing, whichever comes first. During load applications, the
load applied and the axial deformation measured from two LVDTs through the data acquisition
system were recorded. In order to save storage space during data acquisition, the data were
recorded at specified intervals shown in Table 2.
Resilient Modulus Test
The same specimen was used to perform the resilient modulus test if the vertical
permanent strain did not reach 3 percent. Otherwise, a new specimen was molded, and the
permanent deformation test was performed with the load repetitions reduced to 5,000 from
10,000. If the sample again reached 3 percent total permanent strain, the test was terminated. If
not, the resilient modulus test was performed by initially decreasing the axial stress to 2.1 psi
(14.5 kPa) and setting the confining pressure to 3 psi (20.7 kPa). The test was performed by
σd
LVDT 3, 4
LVDT 1, 2 Gauge length
σ3
σ3
diameter
height

14
following the sequence of loading at regular intervals shown in Table 3, which was
recommended in NCHRP project 1-28A (4).
The test was stopped and the result reported when the total permanent strain of the
sample exceeded 3 percent. After completion of the test, the confining pressure was reduced to
zero and the specimen was removed from the triaxial chamber. The moisture content of the
specimen was determined at the end of the test using AASHTO T265-93 (7). The testing
sequence is shown schematically in Figure 9.
Table 2. Suggested Data Collection for Permanent Deformation Test.
Data Collection during Cycles
1-15 450 1300 4000
20 500 1400 4500
30 550 1500 5000
40 600 1600 5500
60 650 1700 6000
80 700 1800 6500
100 750 1900 7000
130 800 2000 7500
160 850 2200 8000
200 900 2400 8500
250 950 2600 9000
300 1000 2800 9500
350 1100 3000 10000
400 1200 3500
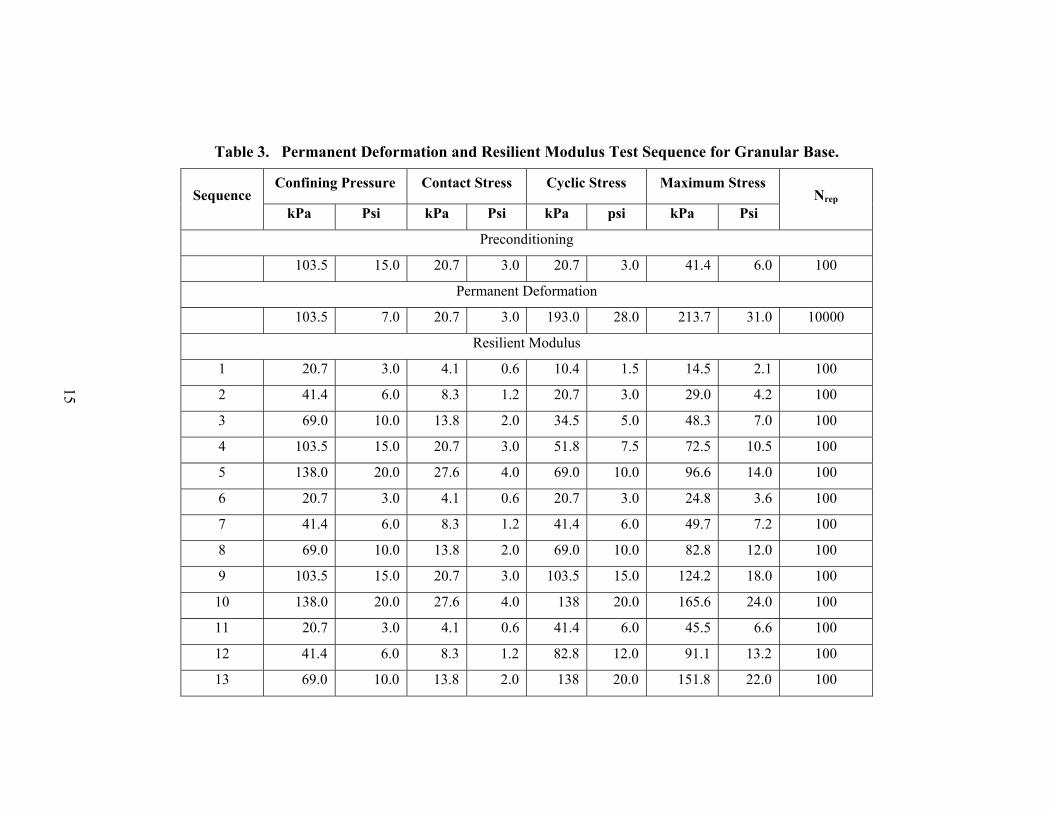
Table 3. Permanent Deformation and Resilient Modulus Test Sequence for Granular Base.
Confining Pressure Contact Stress Cyclic Stress Maximum Stress Sequence
kPa Psi kPa Psi kPa psi kPa Psi Nrep
Preconditioning
103.5 15.0 20.7 3.0 20.7 3.0 41.4 6.0 100
Permanent Deformation
103.5 7.0 20.7 3.0 193.0 28.0 213.7 31.0 10000
Resilient Modulus
1 20.7 3.0 4.1 0.6 10.4 1.5 14.5 2.1 100
2 41.4 6.0 8.3 1.2 20.7 3.0 29.0 4.2 100
3 69.0 10.0 13.8 2.0 34.5 5.0 48.3 7.0 100
4 103.5 15.0 20.7 3.0 51.8 7.5 72.5 10.5 100
5 138.0 20.0 27.6 4.0 69.0 10.0 96.6 14.0 100
6 20.7 3.0 4.1 0.6 20.7 3.0 24.8 3.6 100
7 41.4 6.0 8.3 1.2 41.4 6.0 49.7 7.2 100
8 69.0 10.0 13.8 2.0 69.0 10.0 82.8 12.0 100
9 103.5 15.0 20.7 3.0 103.5 15.0 124.2 18.0 100
10 138.0 20.0 27.6 4.0 138 20.0 165.6 24.0 100
11 20.7 3.0 4.1 0.6 41.4 6.0 45.5 6.6 100
12 41.4 6.0 8.3 1.2 82.8 12.0 91.1 13.2 100
13 69.0 10.0 13.8 2.0 138 20.0 151.8 22.0 100
15

Table 3. Permanent Deformation and Resilient Modulus Test Sequence for Granular Base (Continued).
Confining Pressure Contact Stress Cyclic Stress Maximum Stress Sequence
kPa psi kPa psi kPa psi kPa Psi Nrep
Resilient Modulus
14 103.5 15.0 20.7 3.0 207 30.0 227.7 33.0 100
15 138.0 20.0 27.6 4.0 276 40.0 303.6 44.0 100
16 20.7 3.0 4.1 0.6 62.1 9.0 66.2 9.6 100
17 41.4 6.0 8.3 1.2 124.4 18.0 132.5 19.2 100
18 69.0 10.0 13.8 2.0 207 30.0 220.8 32.0 100
19 103.5 15.0 20.7 3.0 310.5 45.0 331.2 48.0 100
20 138.0 20.0 27.6 4.0 414.0 60.0 441.6 64.0 100
21 20.7 3.0 4.1 0.6 103.5 15.0 107.6 15.6 100
22 41.4 6.0 8.3 1.2 207 30.0 215.3 31.2 100
23 69.0 10.0 13.8 2.0 345.0 50.0 358.8 52.0 100
24 103.5 15.0 20.7 3.0 517.5 75.0 538.2 78.0 100
25 138.0 20.0 27.6 4.0 690.0 100.0 717.6 104.0 100
26 20.7 3.0 4.1 0.6 144.9 21.0 149.0 21.6 100
27 41.4 6.0 8.3 1.2 289.8 42.0 298.1 43.2 100
28 69.0 10.0 13.8 2.0 483.0 70.0 496.8 72.0 100
29 103.5 15.0 20.7 3.0 724.5 105.0 745.2 108.0 100
30 138.0 20.0 27.6 4.0 966.0 140.0 993.6 144.0 100
16

17
Figure 9. Flowchart of the Test Procedure for Permanent Deformation and Resilient Modulus.
Preparation of Test Specimen
Preconditioning: 100 load repetitions
Permanent Deformation Test: Load repetitions until 10,000 cycles or Vertical permanent strain reaches 3%
Resilient Modulus Test: Loading sequence continued until
vertical permanent strain exceeds 3%
A new specimen is molded and permanent
deformation test conducted for 5,000
repetitions
3% total vertical permanent strain
reached
End the test
No
Yes
10,000 load repetitions
5% vertical permanent strain reached

18
CALCULATIONS
The following results are computed from the test:
Permanent deformation properties
• Average axial deformation is determined for each specimen by averaging the readings from
the two axial LVDTs. The total axial strain is determined by dividing by the gauge length
(L). Cumulative axial permanent strain and resilient strain at the 500th load repetition are
calculated.
• A graph is plotted between the cumulative axial permanent strain and the number of loading
cycles in log space (shown in Figure 10). The permanent deformation parameters, intercept
(a) and slope (b), are determined from the linear portion of the permanent strain curve (log-
log scale), which is also demonstrated in Figure 10.
• Rutting parameters α and µ are determined using the following equations as shown
below:
b1−=α
r
baε×
=µ
Resilient Modulus parameter
• The resilient modulus values are computed from each of the last five cycles of each load
sequence, which are then averaged.
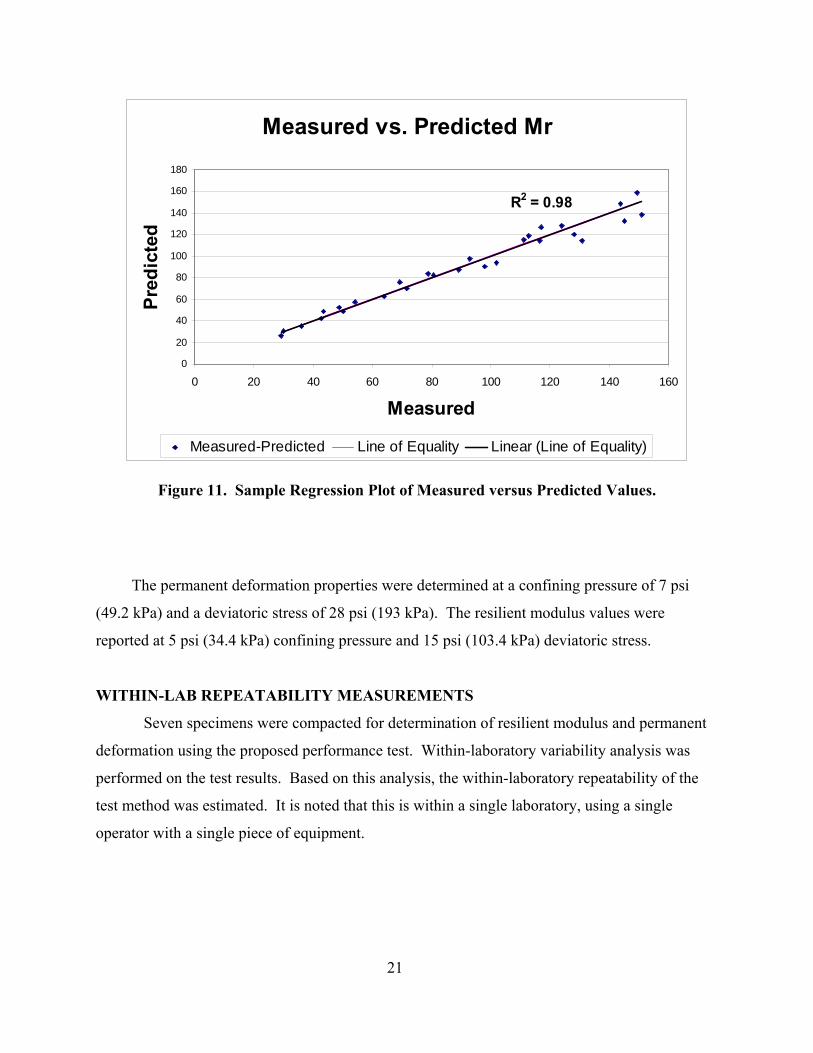
• The data obtained from the applied procedure are fit to the following resilient modulus
model using nonlinear regression techniques as shown in Figure 11.
The resilient modulus is calculated by the following equation, which is adapted from NCHRP 1-
37A project (21):
32 k
a
octk
aa1r 1
PPPkM ⎟⎟
⎠
⎞⎜⎜⎝
⎛+
τ⎟⎟⎠
⎞⎜⎜⎝
⎛ θ=
19
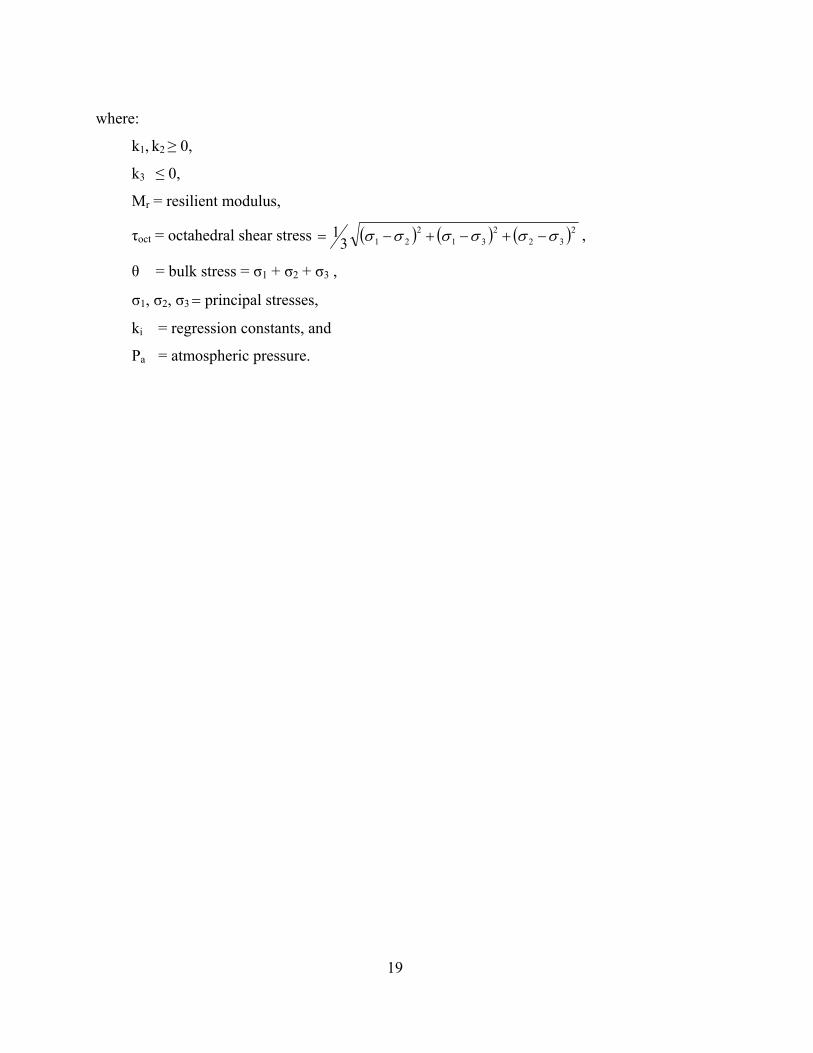
where:
k1, k2 ≥ 0,
k3 ≤ 0,
Mr = resilient modulus,
τoct = octahedral shear stress ( ) ( ) ( )232
231
2213
1 σσσσσσ −+−+−= ,
θ = bulk stress = σ1 + σ2 + σ3 ,
σ1, σ2, σ3 = principal stresses,
ki = regression constants, and
Pa = atmospheric pressure.
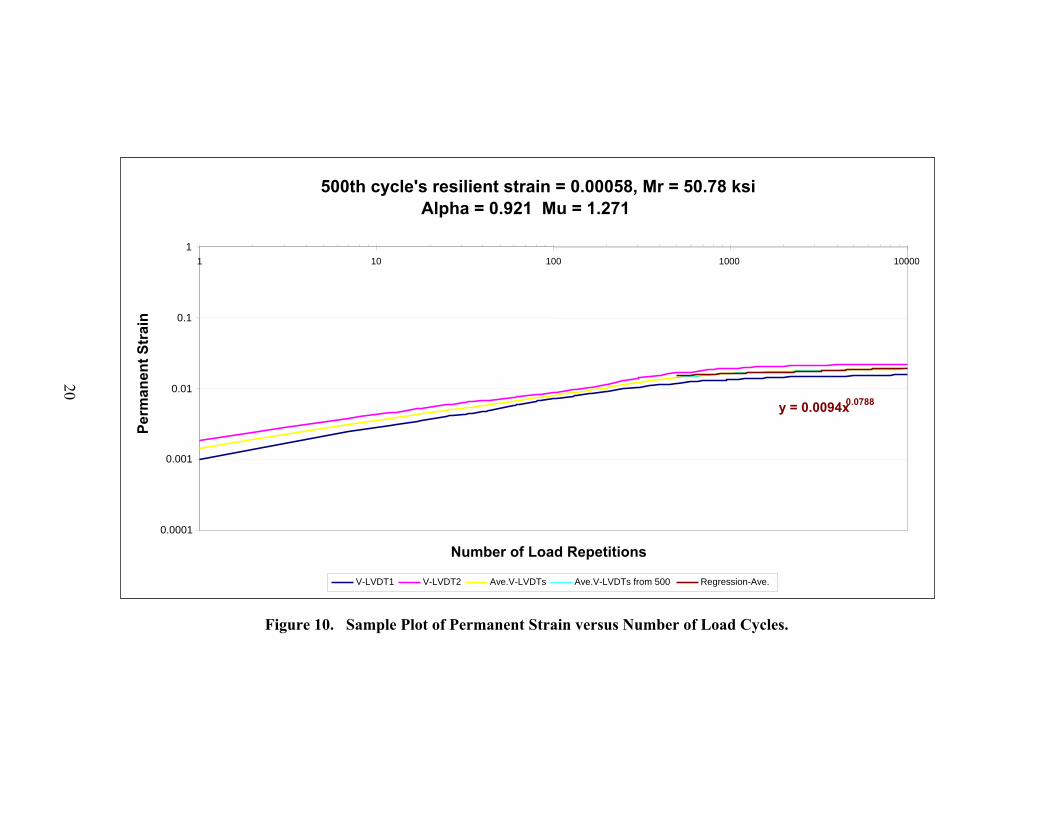
Figure 10. Sample Plot of Permanent Strain versus Number of Load Cycles.
500th cycle's resilient strain = 0.00058, Mr = 50.78 ksi Alpha = 0.921 Mu = 1.271
y = 0.0094x0.0788
0.0001
0.001
0.01
0.1
1 1 10 100 1000 10000
Number of Load Repetitions
Perm
anen
t Str
ain
V-LVDT1 V-LVDT2 Ave.V-LVDTs Ave.V-LVDTs from 500 Regression-Ave.
20
21
Measured vs. Predicted Mr
R2 = 0.98
0
20
40
60
80
100
120
140
160
180
0 20 40 60 80 100 120 140 160
Measured
Pred
icte
d
Measured-Predicted Line of Equality Linear (Line of Equality)
Figure 11. Sample Regression Plot of Measured versus Predicted Values.
The permanent deformation properties were determined at a confining pressure of 7 psi
(49.2 kPa) and a deviatoric stress of 28 psi (193 kPa). The resilient modulus values were
reported at 5 psi (34.4 kPa) confining pressure and 15 psi (103.4 kPa) deviatoric stress.
WITHIN-LAB REPEATABILITY MEASUREMENTS
Seven specimens were compacted for determination of resilient modulus and permanent
deformation using the proposed performance test. Within-laboratory variability analysis was
performed on the test results. Based on this analysis, the within-laboratory repeatability of the
test method was estimated. It is noted that this is within a single laboratory, using a single
operator with a single piece of equipment.

22
INFLUENCE OF SPECIMEN SIZE
The influence of preparing samples with a specimen height of 8 in. (203 mm) instead of
the 12 in. (305 mm) height in the proposed performance test was investigated. For the 6 in.
(152 mm) by 12 in. (305 mm) (diameter by height) specimens, the gauge length for measuring
the axial strains is 6 in. (152 mm). The length to diameter ratio and the length to gauge length
ratio used were in accordance with standard practices (9, 10). However, for the use of an 8 in.
(203 mm) height specimen, the gauge length should also be changed. A gauge length ratio of 0.5
or lower is recommended by researchers (11). Hence, for the 8 in. (203 mm) high specimen, a
gauge length of 4 in. (102 mm) was used. This enables placement of the LVDTs and
measurement of the axial deformations at a distance considerably far from the end platens.
Measuring axial deformation closer to the end platens will result in overestimation of the
modulus value of the material. Conversely, measuring axial deformation closer to the center of
the specimen will lead to accurate estimation of the stiffness parameters (11). Hence, the
configuration of an 8 in. specimen with a gauge length of 4 in. (102 mm) is reasonable for the
determination of modulus values. Figure 12 shows the specimen with height 8 in. (203 mm) after
testing.
Figure 12. Specimen after Testing.

23
CHAPTER 4 TEST RESULTS
This chapter presents the permanent deformation and resilient modulus results. An
analysis on the influence of stress ratios on the test results was conducted. The within-laboratory
variability of the test results was evaluated. Also, the number of test specimens required for
desired reliability of this test method was estimated. Further, the within-laboratory precision of
the test method was established. Subsequently, the influence of specimen size on test results was
investigated.
PERFORMANCE TEST RESULTS
In this section, the permanent deformation properties are presented followed by the
resilient modulus parameters for a 6 in. (152 mm) diameter by 12 in. (305 mm) height (6 in. by
12 in.) specimen.
Permanent Deformation Properties
The individual plots for all the specimens tested are presented in Appendix C. Table 4
provides a summary of the test results of the permanent deformation parameters. Thompson
stated that for reasonable stress states, the “b” term in equation for soils and granular materials is
generally within the range of 0.12 to 0.2. The lower values are for soils. He also indicated that
the “a” term was quite variable and is dependent on material type, repeated stress state, and
factors influencing material shear strength (12).
Table 4. Permanent Deformation Test Results for Specimen Size 6 in. by 12 in.
µ α1 0.000546 54.18 1.478 0.8602 0.000485 59.73 0.799 0.9253 0.000580 50.78 1.271 0.9214 0.000619 48.71 1.280 0.9125 0.000641 45.51 1.470 0.9116 0.000687 43.33 0.844 0.9337 0.000589 50.07 1.544 0.926
Specimen Mr (ksi)
Rutting parametersε r at 500th
load cycle

24
From Table 4, the µ values range from 0.79 to 1.5 and α values range from 0.86 to 0.93.
Also, the resilient strain at the 500th repetition is used to compute the resilient modulus values at
7 psi (48 kPa) confining pressure and 28 psi (193 kPa) deviatoric stress.
Bonaquist and Witzack (13) indicated that the typical values of α and µ range between
0.85 to 0.95 and 0.1 to 0.4, respectively. The higher the value of α, the lower the slope of the
curve and the lower the rate of accumulated strain. The values of µ are high compared to the
values reported by Bonaquist and Witzack (13). This is due to the high stress level at which the
testing was conducted. These properties depend on the ratio of maximum axial stress to the
confining pressure (σ1/σ3), termed the stress ratio. The higher the stress ratio, the higher the
accumulation of permanent strain.
Figure 13 shows the relationship between the ratio of permanent strain to resilient strain
(εp/εr) and the number of load cycles for all specimens. The results indicate a linear relationship.
Thus, as the number of load cycles increased, the ratio εp/εr increased.
RESILIENT MODULUS TEST RESULTS
The regression parameters k1, k2, and k3 computed by this model for each of the
specimens are presented in Table 5. These parameters are used to calculate the resilient modulus
value at a specific confining pressure and deviatoric stress. Here, the resilient modulus value at
5 psi (34.5 kPa) confining pressure and 15 psi (103.4 kPa) deviatoric stress are computed for
comparison. The individual regression plots for each of the seven specimens are provided in
Appendix B.

εp/εr Vs No of load cycles
1
10
100
1 10 100 1000 10000
N
εp/ εr
specimen 1specimen 2Specimen 3Specimen 4Specimen 5Specimen 6Specimen 7
Figure 13. Plot of εp/εr with Number of Load Cycles.
25
26
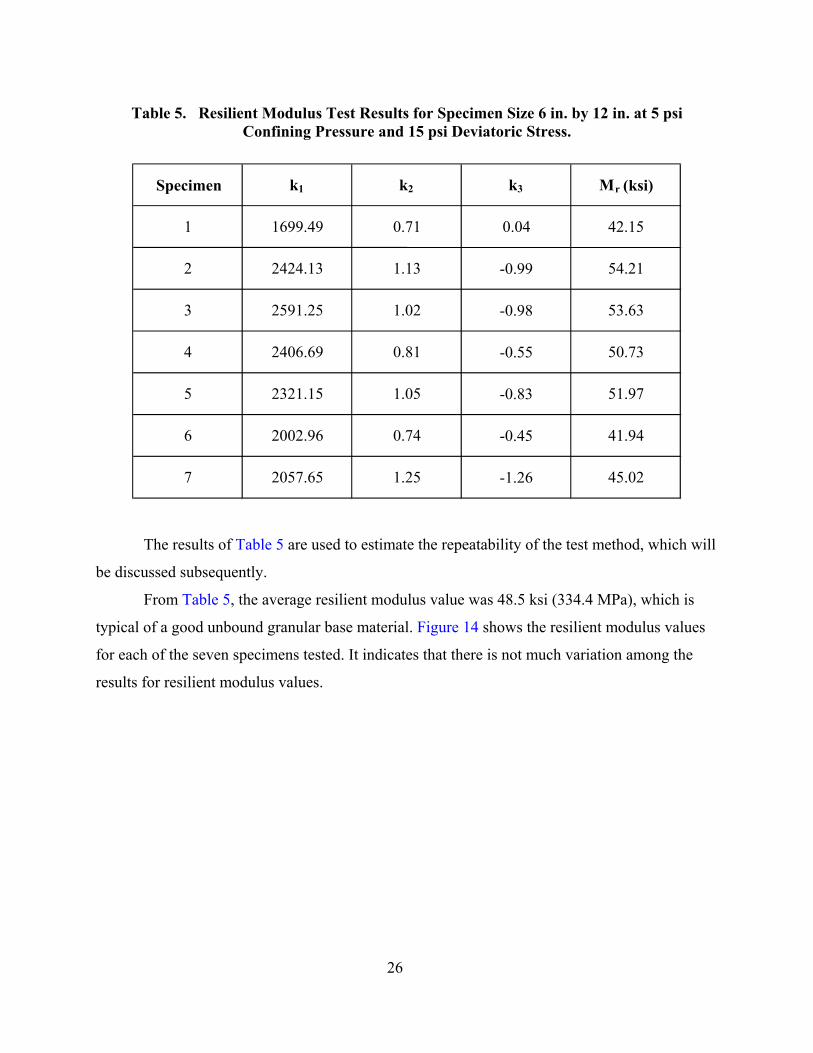
Table 5. Resilient Modulus Test Results for Specimen Size 6 in. by 12 in. at 5 psi Confining Pressure and 15 psi Deviatoric Stress.
The results of Table 5 are used to estimate the repeatability of the test method, which will
be discussed subsequently.
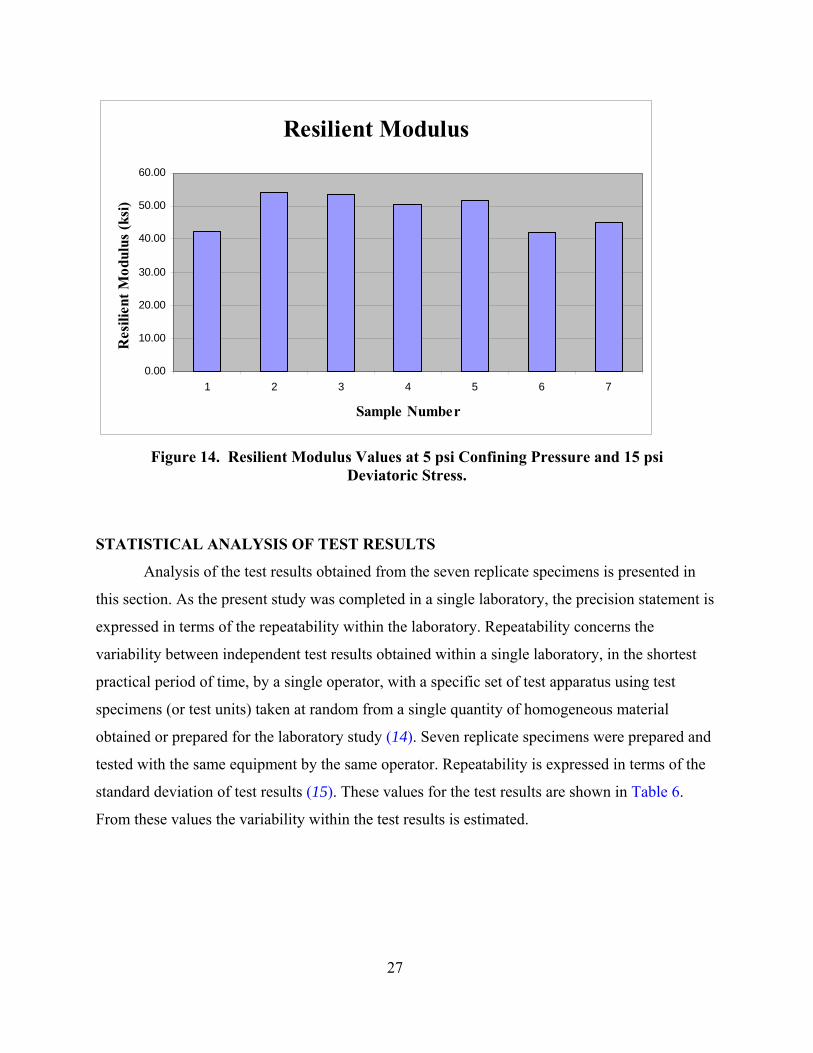
From Table 5, the average resilient modulus value was 48.5 ksi (334.4 MPa), which is
typical of a good unbound granular base material. Figure 14 shows the resilient modulus values
for each of the seven specimens tested. It indicates that there is not much variation among the
results for resilient modulus values.
Specimen k1 k2 k3 M r (ksi)
1 1699.49 0.71 0.04 42.15
2 2424.13 1.13 -0.99 54.21
3 2591.25 1.02 -0.98 53.63
4 2406.69 0.81 -0.55 50.73
5 2321.15 1.05 -0.83 51.97
6 2002.96 0.74 -0.45 41.94
7 2057.65 1.25 -1.26 45.02
27
Resilient Modulus
0.00
10.00
20.00
30.00
40.00
50.00
60.00
1 2 3 4 5 6 7
Sample Number
Res
ilien
t Mod
ulus
(ksi
)
Figure 14. Resilient Modulus Values at 5 psi Confining Pressure and 15 psi Deviatoric Stress.
STATISTICAL ANALYSIS OF TEST RESULTS
Analysis of the test results obtained from the seven replicate specimens is presented in
this section. As the present study was completed in a single laboratory, the precision statement is
expressed in terms of the repeatability within the laboratory. Repeatability concerns the
variability between independent test results obtained within a single laboratory, in the shortest
practical period of time, by a single operator, with a specific set of test apparatus using test
specimens (or test units) taken at random from a single quantity of homogeneous material
obtained or prepared for the laboratory study (14). Seven replicate specimens were prepared and
tested with the same equipment by the same operator. Repeatability is expressed in terms of the
standard deviation of test results (15). These values for the test results are shown in Table 6.
From these values the variability within the test results is estimated.

28
Table 6. Average and Standard Deviations of Test Results.
1 42.15 0.01873
2 54.21 0.01800
3 53.63 0.01830
4 50.73 0.01910
5 51.97 0.02200
6 41.94 0.01790
7 45.02 0.02300
Average 48.52 0.01958
Std Dev 5.34 0.00206
coeff of var 11.02 10.52349
Specimen Resilient Modulus (ksi)
Permanent Strain at 5000 cycles
From standard practice American Society for Testing and Materials (ASTM) E 691, the
repeatability limit for the result is 2.8 times the standard deviation for a confidence level of 95
percent in test results. Thus, the repeatability limits for the results for resilient modulus and
permanent deformation are as shown below in Table 7.
Table 7. Repeatability Limits for Resilient Modulus and Permanent Strain.
Test property Average Standard deviation (std dev)
95% repeatability limit= 2.8* std dev
Resilient Modulus 48.52 ksi 5.345 15 ksi
Permanent Strain 0.01958 0.00206 0.0057

29
Sample Size Calculations
Statistical methods estimated the number of specimens required for a desired tolerance
level in the test results. The number of observations included in the sample is a compromise
between the desired accuracy of the sample statistic as an estimate of the population parameter
and the required time and cost to achieve this degree of accuracy.
The sample size is determined by the following equation (16):
( )2
222/
Ez
nσα=
where
n = sample size,
Zα/2 = Z value used for a desired confidence level,
σ = standard deviation, and
E = half of the width of the confidence interval.
At a confidence level of 95 percent, the Z value is 1.96 from a statistical table of standard
normal curve areas (16). The standard deviation values are obtained from Table 7. The sample
size calculations are made for different tolerable errors from the mean of the resilient modulus
values and the permanent deformation. Graphs plotted between the sample size and the percent
errors of the results are presented in Figure 15 and Figure 16.
Figure 15. Plot of Number of Samples versus Percent Error of Resilient Modulus Value.
No. of Samples vs % Error (RM)
0.00
1.00
2.00
3.00
4.00
5.00
6.00
7.00
8.00
5% 6% 7% 8% 9% 10% 11% 12% 13% 14% 15% 16% 17%
Error
Num
ber o
f Sam
ples
30
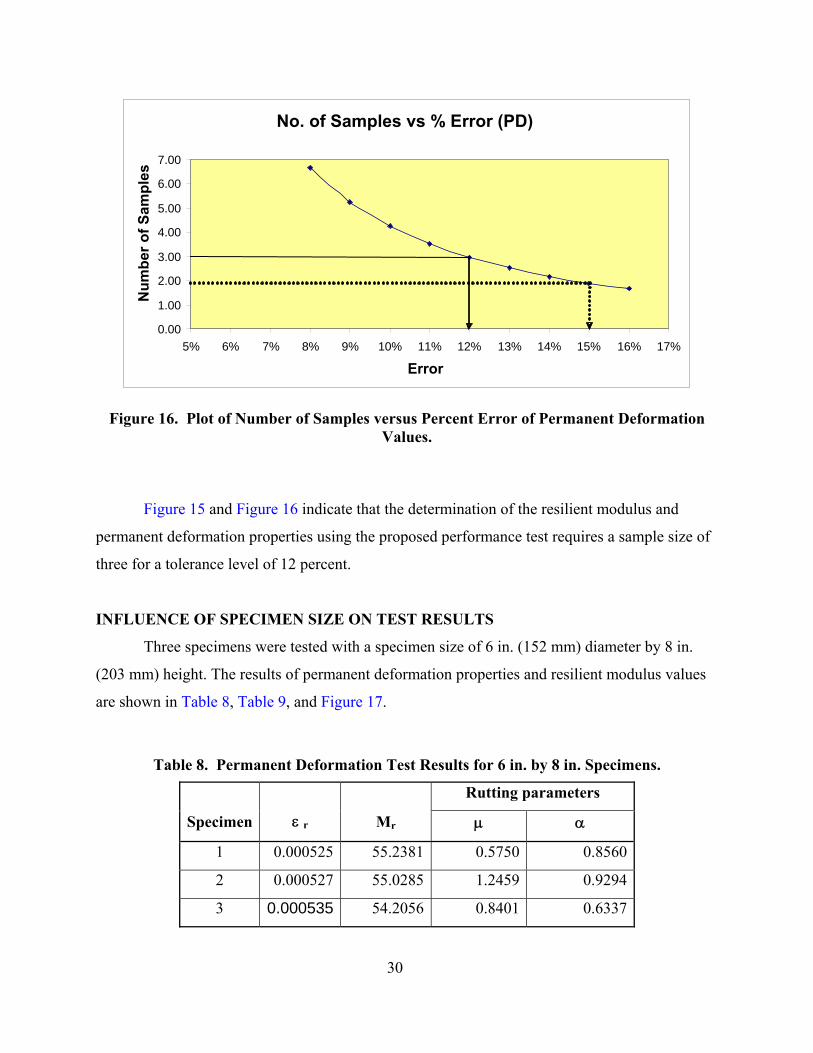
Figure 16. Plot of Number of Samples versus Percent Error of Permanent Deformation Values.
Figure 15 and Figure 16 indicate that the determination of the resilient modulus and
permanent deformation properties using the proposed performance test requires a sample size of
three for a tolerance level of 12 percent.
INFLUENCE OF SPECIMEN SIZE ON TEST RESULTS
Three specimens were tested with a specimen size of 6 in. (152 mm) diameter by 8 in.
(203 mm) height. The results of permanent deformation properties and resilient modulus values
are shown in Table 8, Table 9, and Figure 17.
Table 8. Permanent Deformation Test Results for 6 in. by 8 in. Specimens.
Rutting parameters
Specimen ε r Mr µ α
1 0.000525 55.2381 0.5750 0.8560
2 0.000527 55.0285 1.2459 0.9294
3 0.000535 54.2056 0.8401 0.6337
No. of Samples vs % Error (PD)
0.00
1.00
2.00
3.00
4.00
5.00
6.00
7.00
5% 6% 7% 8% 9% 10% 11% 12% 13% 14% 15% 16% 17%
Error
Num
ber o
f Sam
ples
31
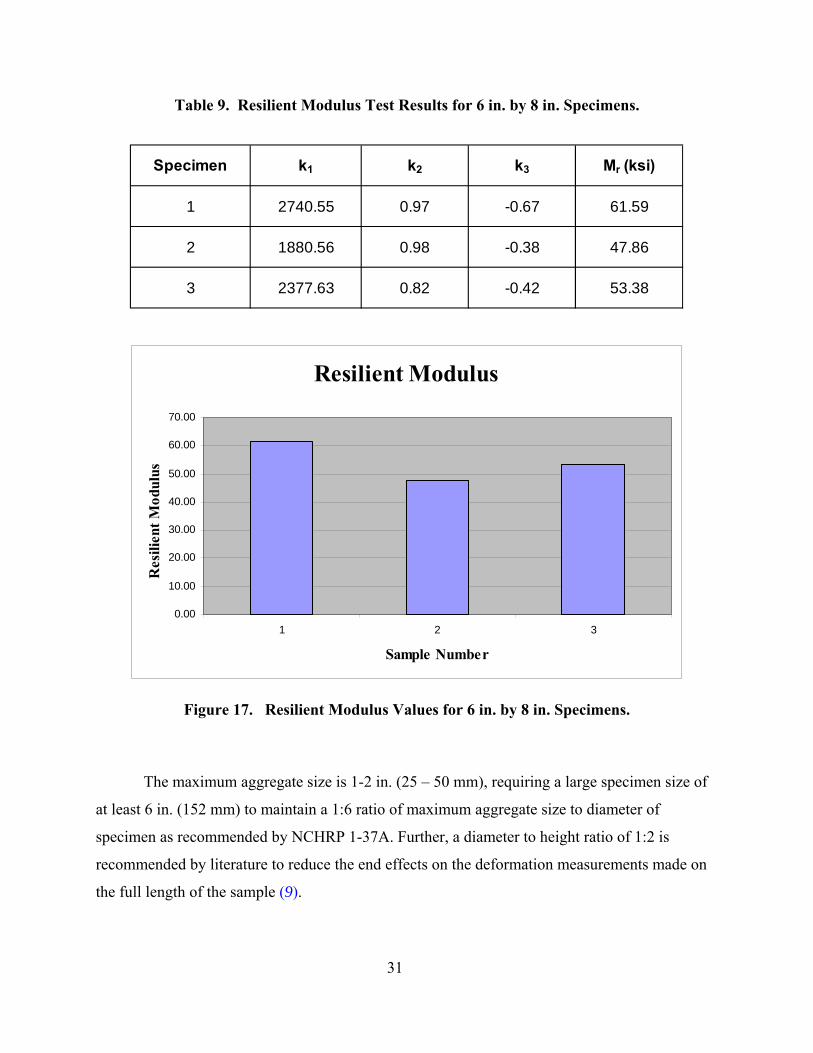
Table 9. Resilient Modulus Test Results for 6 in. by 8 in. Specimens.
Specimen k1 k2 k3 Mr (ksi)
1 2740.55 0.97 -0.67 61.59
2 1880.56 0.98 -0.38 47.86
3 2377.63 0.82 -0.42 53.38
Resilient Modulus
0.00
10.00
20.00
30.00
40.00
50.00
60.00
70.00
1 2 3
Sample Number
Res
ilien
t Mod
ulus
Figure 17. Resilient Modulus Values for 6 in. by 8 in. Specimens.
The maximum aggregate size is 1-2 in. (25 – 50 mm), requiring a large specimen size of
at least 6 in. (152 mm) to maintain a 1:6 ratio of maximum aggregate size to diameter of
specimen as recommended by NCHRP 1-37A. Further, a diameter to height ratio of 1:2 is
recommended by literature to reduce the end effects on the deformation measurements made on
the full length of the sample (9).

32
Statistical analysis of the test results determined the influence of specimen size on the
measured resilient modulus. The student’s t-test was used to statistically evaluate the impact of
different specimen sizes.
Sample sizes and standard deviations for the two populations for the calculation of the
pooled standard deviation based on resilient modulus and permanent deformation values are
shown in Table 10 and Table 11. Using the average and standard deviation values of the samples
from Table 8, the t-statistic is calculated.
Table 10. Calculation of Pooled Standard Deviation for Resilient Modulus Values.
Table 11. Calculation of Pooled Standard Deviation for Permanent Deformation
Values at 5000 Load Cycles.
n 1 7 n2 3y 1 48.52 y2 54.28s1 5.345 s2 6.9s1
2 28.56903 s22 47.61
S p
df t`
population one,height 12 in.
population two,height 8 in.
8
5.773150678
1.445836679
n 1 7 n2 3y 1 0.000592 y2 0.0048s1 0.000066 s2 8.27E-05s 1
2 4.356E-09 s22 6.84E-09
SP
df t`
0.008377052
0.727937626
8
population one, height 12 in.
population two, height 8 in.
33
For α = 5 percent and df = 8, the tα/2 determined from table of critical values for the
student’s t-distribution is 2.3.
Since 2/αtt ≤ , for both the permanent deformation and resilient modulus values the null
hypothesis cannot be rejected. Thus, there is no difference in the test results when the specimen
size is reduced to 8 in. (203 mm) from 12 in. (305 mm) for the resilient modulus value.


35
CHAPTER 5
EVALUATION OF GRANULAR BASE MATERIALS
Three samples of premium base coarse aggregates; Granite Mountain (granite),
Springdale Arkansas (limestone), and Sawyer Pit Oklahoma (sandstone) were tested in the
laboratory to evaluate their engineering properties. These materials were also incorporated into
test sections built at the Riverside campus of Texas A&M University. Figures 18-21 show the
test sections built using the various base materials.
Figure 18. Test Sections Built at Texas A&M University Riverside Campus.
36
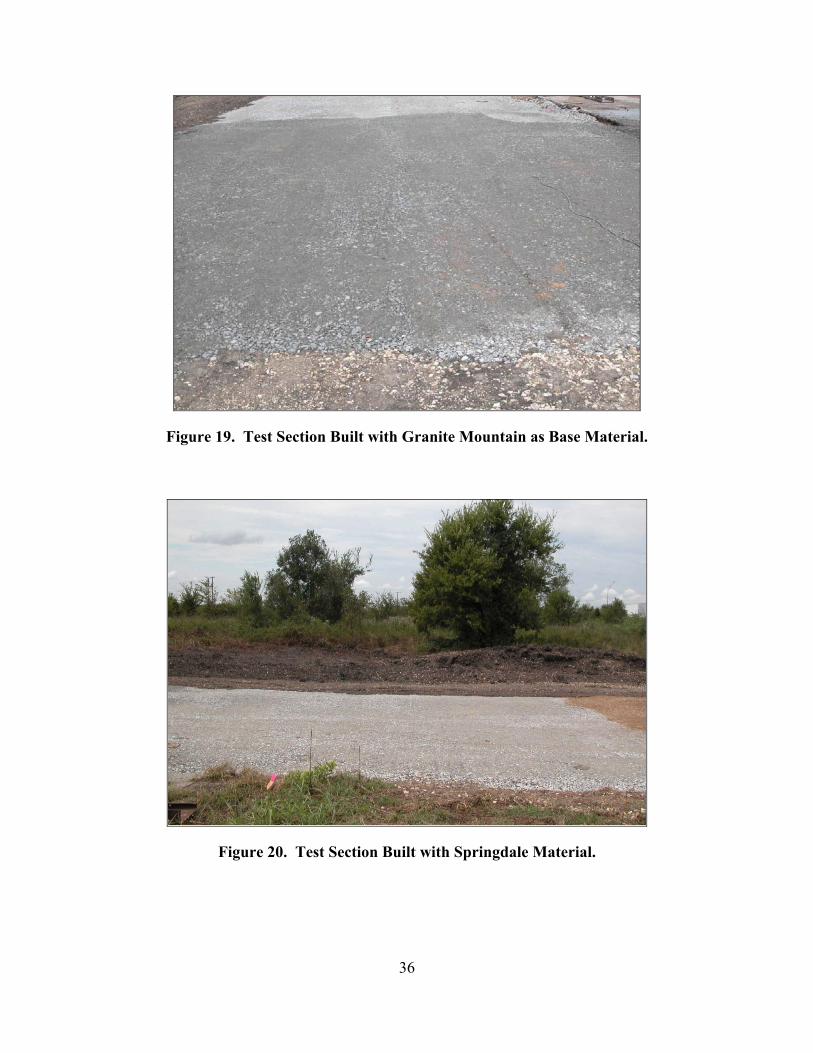
Figure 19. Test Section Built with Granite Mountain as Base Material.
Figure 20. Test Section Built with Springdale Material.
37
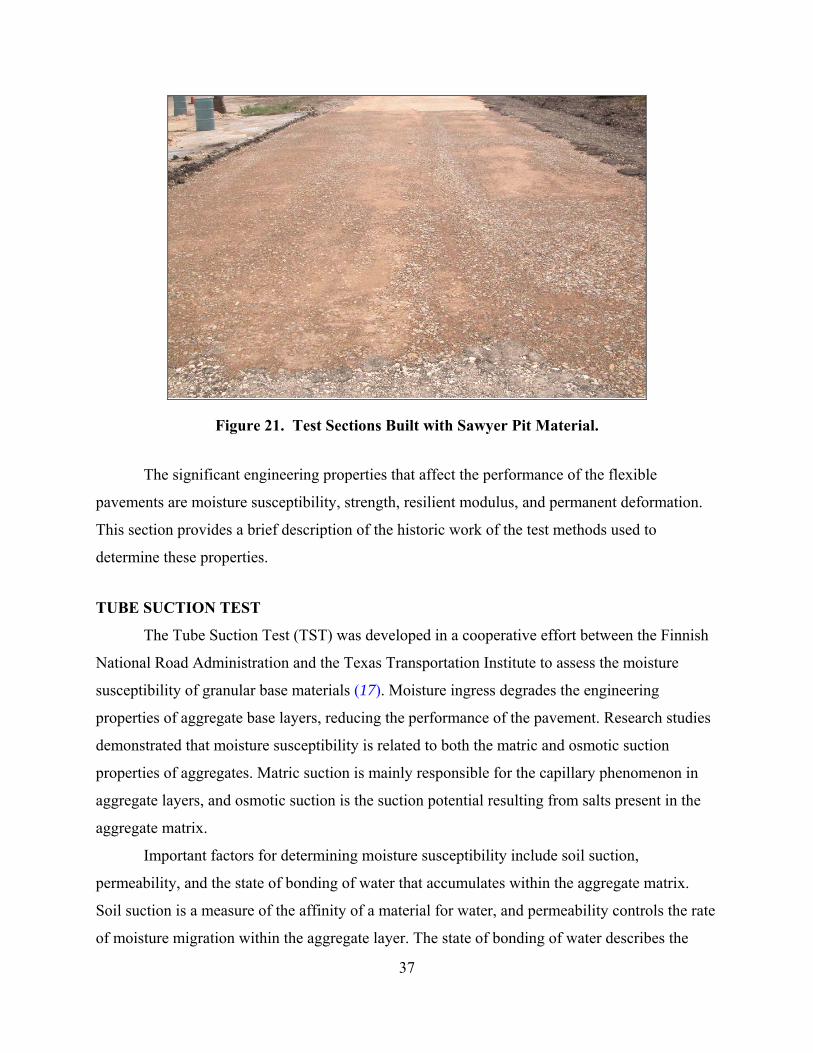
Figure 21. Test Sections Built with Sawyer Pit Material.
The significant engineering properties that affect the performance of the flexible
pavements are moisture susceptibility, strength, resilient modulus, and permanent deformation.
This section provides a brief description of the historic work of the test methods used to
determine these properties.
TUBE SUCTION TEST
The Tube Suction Test (TST) was developed in a cooperative effort between the Finnish
National Road Administration and the Texas Transportation Institute to assess the moisture
susceptibility of granular base materials (17). Moisture ingress degrades the engineering
properties of aggregate base layers, reducing the performance of the pavement. Research studies
demonstrated that moisture susceptibility is related to both the matric and osmotic suction
properties of aggregates. Matric suction is mainly responsible for the capillary phenomenon in
aggregate layers, and osmotic suction is the suction potential resulting from salts present in the
aggregate matrix.
Important factors for determining moisture susceptibility include soil suction,
permeability, and the state of bonding of water that accumulates within the aggregate matrix.
Soil suction is a measure of the affinity of a material for water, and permeability controls the rate
of moisture migration within the aggregate layer. The state of bonding of water describes the

38
structuring of the water molecules within the aggregate matrix. Water is classified as both
bonded and un-bonded moisture. The bound (adsorbed) water molecules are arranged in layers
around aggregate particles, where the electrical attraction between water molecules is relatively
strong. This moisture is very difficult to displace and generally does not have a large impact on
base performance. The unbound (viscous or capillary) water is beyond the zone of electrical
capture. This moisture is loosely bound to the aggregates but it can migrate within the base
under the influence of environmental factors (freeze-thaw cycles) or heavy loads. It is the
amount of unbound water in a base that influences the engineering properties in the field,
including load-carrying capability and resistance to freeze-thaw cycles. The quantity and
distribution of unbound water thus plays a very important role in the moisture damage
mechanism. The amount of unbound water that exists within an aggregate base material is
directly related to the dielectric value of the base as measured in the TST (18, 19).
TEXAS TRIAXIAL TEST
In this project the Texas triaxial test was conducted as part of the TST. This is one of the
advantages of the TST, wherein the Texas triaxial test is merged within the TST, enabling the
determination of moisture susceptibility and strength on the same specimen (20). The TST is
currently run using Tex Method 144 E where the sample is enclosed in a latex membrane. After
moisture conditioning the unconfined compressive strength is measured on the moisture
conditioned sample. Thus, estimation of strength in soaked condition gives an estimate of the
property of the granular material under the worst circumstances.
PERMANENT DEFORMATION AND RESILIENT MODULUS TEST
The resilient properties of the base materials are determined using the repeated load
triaxial test. Repeated loading properties like resilient modulus and permanent deformation
accumulation are major factors that influence the structural response and performance of
conventional flexible pavements. These parameters are typically determined in a resilient
modulus test, which determines the permanent deformation property and the resilient modulus. It
is performed by placing a specimen in a triaxial cell and applying repeated axial load. After
subjecting the specimen to confining pressure, measurements are taken of the recoverable axial
deformation and the applied load. Both resilient (recoverable) and permanent axial deformation
39
responses of the specimen are recorded and used to calculate the resilient modulus and the
permanent deformation, respectively. Permanent deformation is the unrecovered deformation
during the testing, and resilient modulus is the ratio of the peak axial repeated deviator stress to
the peak recoverable axial strain of the specimen.
The test procedure followed for the present project is adapted from the standard test
methods given by the VESYS user manual, NCHRP 1-28A report, and AASHTO T307, TP46
(4, 8, 9, 10).
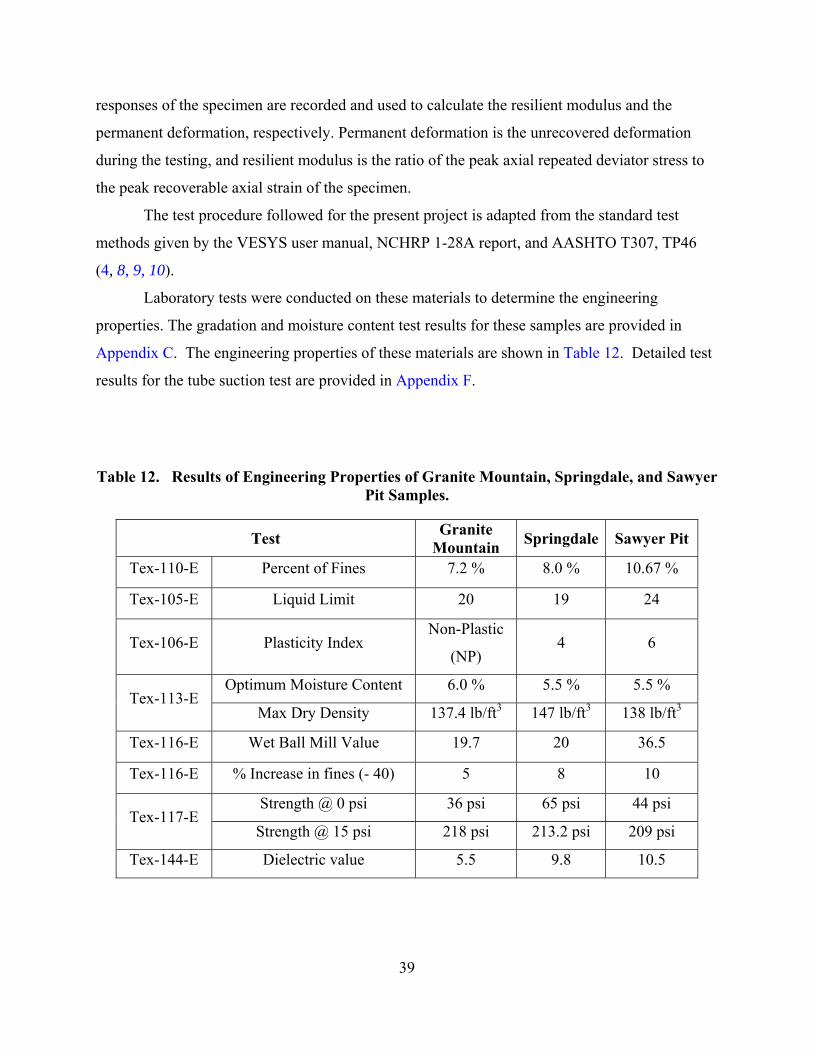
Laboratory tests were conducted on these materials to determine the engineering
properties. The gradation and moisture content test results for these samples are provided in
Appendix C. The engineering properties of these materials are shown in Table 12. Detailed test
results for the tube suction test are provided in Appendix F.
Table 12. Results of Engineering Properties of Granite Mountain, Springdale, and Sawyer Pit Samples.
Test Granite Mountain Springdale Sawyer Pit
Tex-110-E Percent of Fines 7.2 % 8.0 % 10.67 %
Tex-105-E Liquid Limit 20 19 24
Tex-106-E Plasticity Index Non-Plastic
(NP) 4 6
Optimum Moisture Content 6.0 % 5.5 % 5.5 % Tex-113-E
Max Dry Density 137.4 lb/ft3 147 lb/ft3 138 lb/ft3
Tex-116-E Wet Ball Mill Value 19.7 20 36.5
Tex-116-E % Increase in fines (- 40) 5 8 10
Strength @ 0 psi 36 psi 65 psi 44 psi Tex-117-E
Strength @ 15 psi 218 psi 213.2 psi 209 psi
Tex-144-E Dielectric value 5.5 9.8 10.5

40
The three materials, Granite Mountain, Springdale, and Sawyer Pit, have the fines content
close to the proposed Item 245 specifications (<10 percent, the sandstone was slightly higher
than the limit). With the exception of the strength requirement at 0 psi, confining the
engineering properties of all three bases are well above the traditional Item 247 requirement. In
particular, the percent increase in wet ball mill were all less than or equal to 10, well below the
allowable Item 247 value of 20. The strengths at 15 psi confining were all well above the 175
psi required in Item 247. The origin of these materials influences their quality and engineering
properties. The Plasticity Index (PI’s) of the materials are also very low; well below the 10 limit
of Grade 1 base in Item 247. It is the combination of the low fines and low plasticity that
directly impacts these materials strength at zero confining. Unlike typical Texas bases that
contain substantial fines, these materials have low strength in an unconfined state; however,
these bases will never be unconfined in the highway so the significance of that test on long-term
performance is questionable.
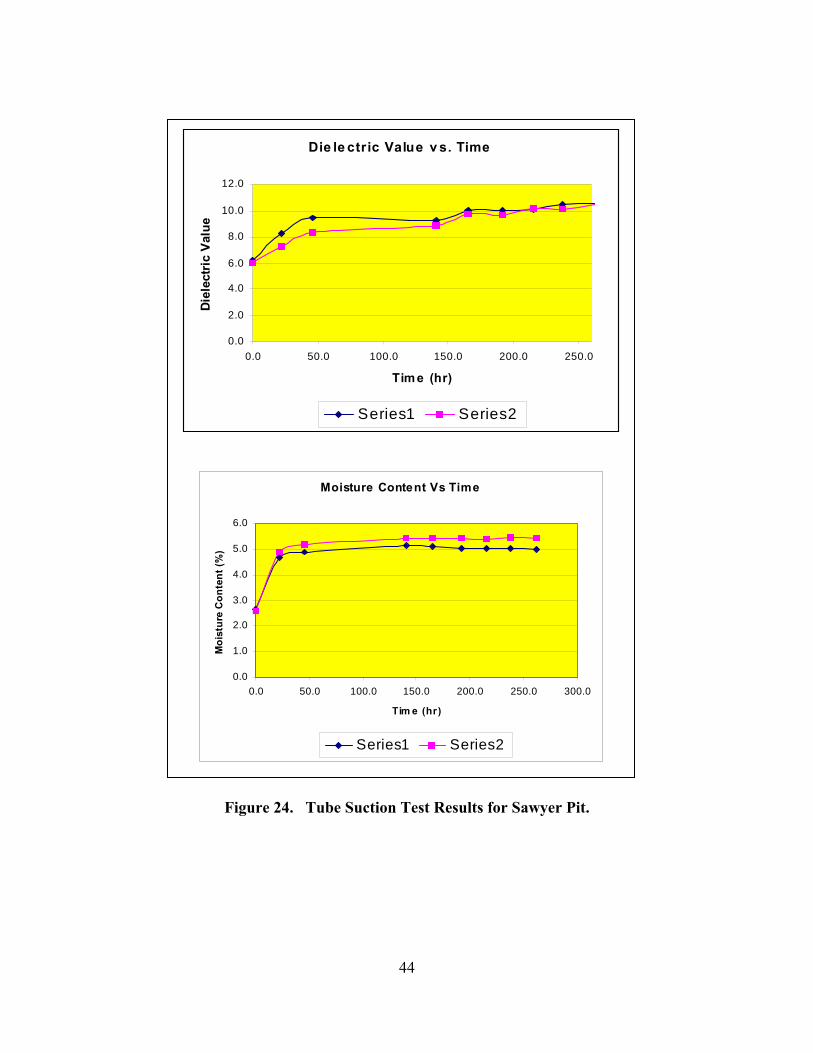
The Tube Suction test was conducted on two specimens of each material. The details are
presented in detail in the Appendix F; the summary of the results is presented in Table 13.
Table 13. Summary of TST Results. Sample Asymptotic
Dielectric Value, є
Gravimetric Water Content,
W (%) after TST
% Water Loss in Drying
Actual Density
(dry) (lb/ft3)
Actual Compaction
Moisture (%)
Target Dry
Density, lb/ft3
Target Compaction
Moisture (%)
Granite Mountain
5.5 6.0 54 135.5 6.0 137.4 6.0
Springdale 9.8 5.1 41.5 141.5 5.3 147.0 5.5 Sawyer
Pit 10.5 5.2 52.1 137.1 5.6 138 5.5
The asymptotic dielectric value is the final value attained at the end of the 10-day
capillary rise. This value is used to assess the material’s resistance to moisture ingress via
capillary rise. Based on the results shown in Table 13, the aggregates were ranked as shown in
Table 14.

41
Table 14. Resistance to Moisture Ingress as Measured by the TST.
Rank Sample Final Dielectric Value Rank
1 Granite Mountain 5.5 Excellent 2 Springdale 9.8 Excellent 3 Sawyer Pit 10.5 Good
Table 14 shows that both Granite Mountain and Springdale classify as excellent materials
in terms of resistance to moisture ingress. The results of TST are shown graphically in Figure 22,
Figure 23, and Figure 24.

42
Figure 22. Tube Suction Test Results for Granite Mountain.
Die le ctric Value v s. Time
0.0
1.0
2.0
3.0
4.0
5.0
6.0
7.0
0.0 50.0 100.0 150.0 200.0 250.0
Time (hr)
Diel
ectri
c V
alue
Series1 Series2
Moisture Content Vs Time
0.0
1.0
2.0
3.0
4.0
5.0
6.0
7.0
0.0 50.0 100.0 150.0 200.0 250.0 300.0 350.0
Tim e (hr)
Moi
stur
e C
onte
nt (%
)
Series1 Series2

43
Figure 23. Tube Suction Test Results for Springdale.
Die le ctr ic Value v s. Time
0.0
2.0
4.0
6.0
8.0
10.0
12.0
0.0 50.0 100.0 150.0 200.0 250.0
Tim e (hr)
Die
lect
ric V
alue
Series1 Series2
Moisture Content Vs Time
0.0
1.0
2.0
3.0
4.0
5.0
6.0
0.0 50.0 100.0 150.0 200.0 250.0 300.0
Tim e (hr)
Moi
stur
e C
onte
nt (%
)
Series1 Series2
44
Figure 24. Tube Suction Test Results for Sawyer Pit.
Die le ctric Value v s. Time
0.0
2.0
4.0
6.0
8.0
10.0
12.0
0.0 50.0 100.0 150.0 200.0 250.0
Tim e (hr)
Diel
ectr
ic V
alue
Series1 Series2
Moisture Content Vs Time
0.0
1.0
2.0
3.0
4.0
5.0
6.0
0.0 50.0 100.0 150.0 200.0 250.0 300.0
Tim e (hr)
Moi
stur
e C
onte
nt (%
)
Series1 Series2
45
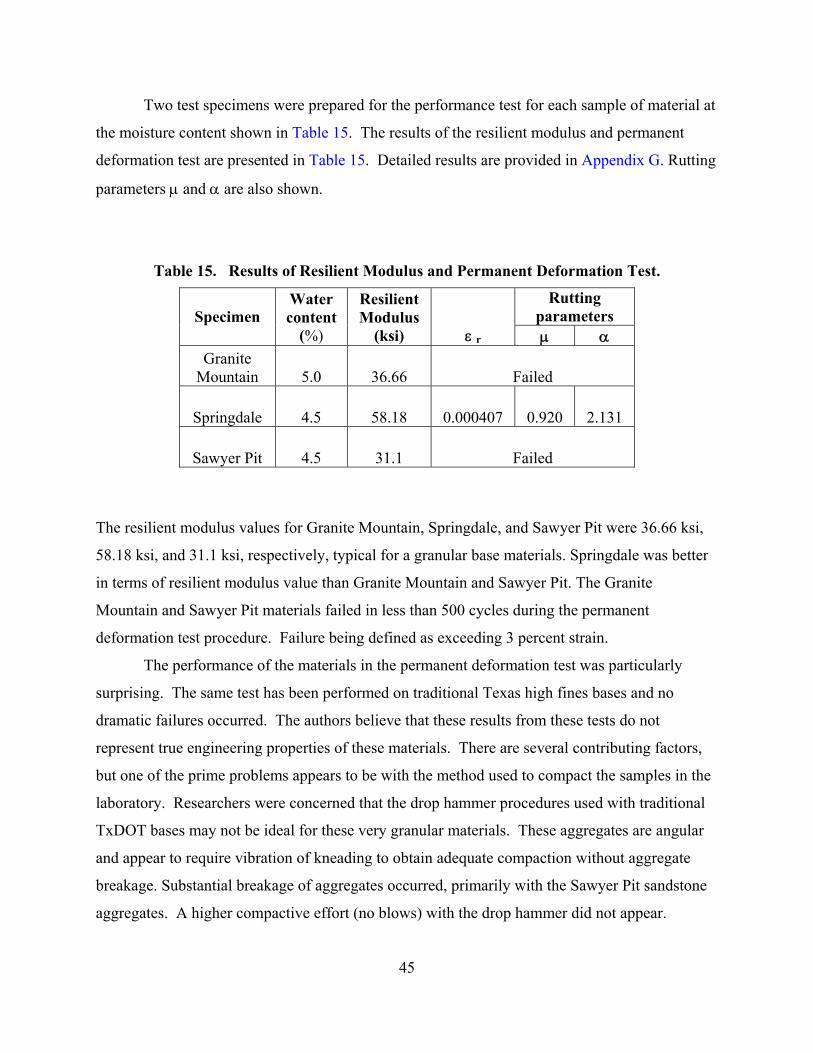
Two test specimens were prepared for the performance test for each sample of material at
the moisture content shown in Table 15. The results of the resilient modulus and permanent
deformation test are presented in Table 15. Detailed results are provided in Appendix G. Rutting
parameters µ and α are also shown.
Table 15. Results of Resilient Modulus and Permanent Deformation Test.
Rutting parameters Specimen
Water content
(%)
Resilient Modulus
(ksi) ε r µ α Granite
Mountain 5.0 36.66 Failed
Springdale 4.5 58.18 0.000407 0.920 2.131
Sawyer Pit 4.5 31.1 Failed
The resilient modulus values for Granite Mountain, Springdale, and Sawyer Pit were 36.66 ksi,
58.18 ksi, and 31.1 ksi, respectively, typical for a granular base materials. Springdale was better
in terms of resilient modulus value than Granite Mountain and Sawyer Pit. The Granite
Mountain and Sawyer Pit materials failed in less than 500 cycles during the permanent
deformation test procedure. Failure being defined as exceeding 3 percent strain.
The performance of the materials in the permanent deformation test was particularly
surprising. The same test has been performed on traditional Texas high fines bases and no
dramatic failures occurred. The authors believe that these results from these tests do not
represent true engineering properties of these materials. There are several contributing factors,
but one of the prime problems appears to be with the method used to compact the samples in the
laboratory. Researchers were concerned that the drop hammer procedures used with traditional
TxDOT bases may not be ideal for these very granular materials. These aggregates are angular
and appear to require vibration of kneading to obtain adequate compaction without aggregate
breakage. Substantial breakage of aggregates occurred, primarily with the Sawyer Pit sandstone
aggregates. A higher compactive effort (no blows) with the drop hammer did not appear.

46
These problems led the research team to evaluate how these low-fines granular bases are
compacted in other Departments of Transportation (DOTs) and research agencies around the
world. Contacts were made with the Minnesota DOT and with researchers in Finland and Israel.
The main conclusion from these surveys was that the drop hammer is not ideal for these
materials and that the compaction procedure should include some form of vibration similar to the
vibratory rollers used to compact these bases in the field. Consequently, in Year 3 of this project
TTI designed and built the new vibratory compactor shown in Figure 25, largely based on
recommendations from Dr. Jacob Uzan in Technion in Israel.
Figure 25. TTI’s New Base Vibratory Compactor.
In the final year of project 0-4358 the research team proposes to use this compactor to study its
efficiency at compacting heavy-duty bases. Comparative studies on parameters such as
aggregate breakage, sample uniformity, and particle orientation will be undertaken.

47
CHAPTER 6
SUMMARY
Repeatability analysis of the modified resilient modulus and permanent deformation test
procedure was conducted on the 6 in. (152 mm) diameter by 12 in. (305 mm) height specimen.
Further, the influence of stress ratios on these properties was discussed. Statistical procedures
estimated the number of test specimens necessary for a desired level of tolerance. After
estimation of sample size, it was found that for a tolerance level of 12 percent three replicate
specimens must be tested. Three specimens of 6 in. (152 mm) diameter by 8 in. (203 mm) height
were prepared for conducting the performance test. The Student’s t-test was used to investigate
the influence of the specimen size on the test results. There was no statistically significant
difference for a confidence level of 95 percent between the test results for both resilient modulus
and permanent deformation properties.
Three materials, Granite Mountain, Springdale, and Sawyer Pit, were evaluated using
laboratory test procedures for their performance parameters. Granite Mountain performed best
in the Tube Suction Test (TST), and all three materials were classified as either excellent or good
materials in terms of the TST results. In the laboratory all of the materials had properties well in
excess of those required for standard Item 247 bases, except in the unconfined strength test
conducted as part of Tex Method 117-E.
All three materials were incorporated into experimental sections being constructed at
TTI’s Riverside campus. The performance of these sections will be discussed in the final year of
Project 0-4358.
Problems were encountered with running resilient modulus and in particular permanent
deformation tests on samples of these materials molded with the Tex Method 113-E drop
hammer. In general, molding these low fines bases with this procedure is problematic. In
several instances the samples collapsed when extruded from the compaction mold. The resilient
modulus and permanent deformation values obtained were not thought to be related to the true
engineering properties (or reported field performance) of these materials. Instead it was assumed
that these values are more related to compaction problems with drop hammer compaction of
bases with low fines contents. These results led us to review the methods used to compact
samples. As a result, a new vibratory compaction system has been built. It is proposed that this

48
system be studied further in the final year of this project. Also it is recommended that this new
compaction procedure be incorporated into the work plan of Project 0-5136 “Improving
Correlation between Field Construction of Soils and Bases and Laboratory Prepared Samples.”
49
REFERENCES
1. Lekarp, F., U. Isacsson, and A. R. Dawson. State of the Art. I: Resilient Response of
Unbound Aggregates. Journal of Transportation Engineering, Vol. 126, No. 1,
January/February 2000, pp. 66-75.
2. Barksdale, R. D. The Aggregate Handbook. National Stone Association, Sheridan Books,
Inc., Elliot Place, Washington, D.C., 2001.
3. Magnusdottir, B., and S. Erlingsson. Repeated Load Triaxial Testing for Quality
Assessment of Unbound Granular Base Course Materials.
http://iii.is/aggregate/abstracts_12.pdf. Accessed May 20, 2003.
4. Andrei, D. Development of a Harmonized Test Protocol for the Resilient Modulus of
Unbound Materials Used in Pavement Design. M.S. Thesis. Department of Civil and
Environmental Engineering, University of Maryland, College Park, Maryland, 1999.
5. Lekarp, F., U. Isacsson, and A. R. Dawson. State of the Art. II: Permanent Strain Response
of Unbound Aggregates. Journal of Transportation Engineering, Vol. 126, No. 1,
January/February 2000, pp. 76-84.
6. Texas Department of Transportation. Manual of Testing Procedures. Austin, TX, 2002.
7. American Association of State Highway and Transportation Officials. Standard Method of
Test for Laboratory Determination of Moisture Content of Soils, AASHTO Designation
265-93, Standard Specifications for Transportation Materials and Methods of Sampling and
Testing, Part II Tests, 1997.
8. VESYS User Manual. Federal Highway Administration, Washington, D.C., 2000.
9. American Association of State Highway and Transportation Officials. Standard Method of
Test for Resilient Modulus of Subgrade Soils and Untreated Base/Subbase Materials,
AASHTO Designation 307, Standard Specifications for Transportation Materials and
Methods of Sampling and Testing, Part II Tests, 2002.
10. Long-Term Pavement Performance Protocol P46, Resilient Modulus of Unbound Granular
Base/Subbase Materials and Subgrade Soils. U.S. Department of Transportation, Federal
Highway Administration, Washington, D.C., August 1996.
http://www.tfhrc.gov/pavement/ltpp/pdf/p46.pdf. Accessed May 29, 2003.
50
11. Nazarian, S., R. Pezo, and M. Picornell. Testing Methodology for Resilient Modulus of
Base Materials. Research Report 1336-1. Center for Geotechnical and Highway Materials
Research. University of Texas El Paso, July 1996.
12. Thompson M. R., and D. Naumann. Rutting Rate Analyses of the AASHO Road Test
Flexible Pavements. In Transportation Research Record 1384. Transportation Research
Board, National Research Council, Washington, D.C., 1993.
13. Bonaquist, R. M., and M. Witzack. Plasticity Modeling Applied to the Permanent
Deformation Response of Granular Materials in Flexible Pavement Systems. In
Transportation Research Record 1540, Transportation Research Board, National Research
Council, Washington, D.C., 1996, pp. 7-14.
14. Standard Practice for Conducting an Interlaboratory Study to Determine Precision of a Test
Method. E177, ASTM, Philadelphia, PA.
15. Standard Practice for Conducting an Interlaboratory Study to Determine Precision of a Test
Method. E691-99, ASTM, Philadelphia, PA.
16. Ott, R. L., and M. Longnecker. An Introduction to Statistical Methods and Data Analysis,
Fifth Edition. Duxbury, Pacific Grove, California, 2001.
17. Saarenketo, T., T. Scullion, and P. Kolisoja. Moisture Susceptibility and Electrical
Properties of Base Course Aggregates. Proc., Fifth International Conference on the Bearing
Capacity of Roads and Airfields, Trondheim, Norway, 1998, pp. 1401-1410.
18. Guthrie, W. S., and T. Scullion. Assessing Aggregate Strength and Frost Susceptibility
Characteristics with the Tube Suction Test. Proceedings of the Texas Section Fall Meeting,
American Society of Civil Engineers, El Paso, TX, 2000, pp. 197-206.
19. Guthrie, W. S., P. Ellis, and T. Scullion. Repeatability and Reliability of the Tube Suction
Test. In Transportation Research Record 1772, Transportation Research Board, National
Research Council, Washington, D.C., 2001, pp. 151-157.
20. Guthrie, W. S., S. Sebesta, and T. Scullion. Modulus Matters for Cement-Treated
Materials. Proceedings of the Texas Section Spring Meeting, American Society of Civil
Engineers, Arlington, TX, 2002, pp. 233-242.
51
APPENDIX A:
TEST PROTOCOLS

53
TUBE SUCTION TEST
This test method evaluates the moisture susceptibility of granular base materials used in
pavements.
Significance and Use
The selection of base materials with adequate resistance to damage under traffic and
environmental loading is important in maximizing the life of a pavement. Moisture ingress is a
primary catalyst for pavement damage, and moisture susceptibility, or the degree to which
moisture ingress degrades the engineering properties of aggregates, plays a key role in the
performance of these materials in the field.
Research studies demonstrate that moisture susceptibility is related to the matric and
osmotic suction properties of aggregates. Matric suction is mainly responsible for the capillary
phenomenon in aggregate layers, and osmotic suction is the suction potential resulting from salts
present in the pore water of an aggregate matrix.
The tube suction test (TST) rates the resistance of aggregates to moisture damage as very
good, good, marginal, and poor. This moisture susceptibility ranking is based on the final surface
dielectric values of compacted specimens after a 10-day capillary soak in the laboratory. The
Adek PercometerTM, a 50 MHz dielectric probe, is employed in the test to measure the dielectric
values of specimens.
The dielectric value of a three-phase system comprising aggregate particles, air, and
water depends on the volumetric percentages and dielectric values of each constituent. The
dielectric value of dry aggregate particles generally varies from 4 to 6, and the dielectric value of
air is 1. The dielectric value of water depends on its state of bonding in the aggregate matrix.
Tightly bound, or adsorbed, water has a dielectric value of about 3 or 4, but the dielectric value
of unbound water is substantially higher at 81. Unbound water can migrate within the pavement
structure to balance changes in suction caused by chemical contamination, changes in the pore
structure, or fluctuations in the water content.
For materials with high suction potential and sufficient permeability, substantial amounts
of unbound water rise within the aggregate matrix during soaking and lead to higher dielectric
values in the test. Conversely, non-moisture-susceptible materials maintain a strong moisture
54
gradient throughout the test, with little moisture reaching the surface, and have lower dielectric
values at the end of testing. Beneficiation techniques such as stabilization, blending, or reducing
the fines content should be considered for effectively reducing the moisture susceptibility of
poor-performing aggregates.
Apparatus
• Apparatus outlined in test method Tex-101-E, part II
• Apparatus outlined in test method Tex-103-E, part I
• Apparatus outlined in test method Tex-113-E
• Triaxial cells, lightweight stainless steel cylinders
• Cylindrical plastic molds with inside diameter of 6 in. (152.4 mm) and minimum
height of 50.8 mm (2 in.)
• Power drill with 1.5 mm (1/16 in.) drill bit
• Drying oven maintained at 60 + 5 oC (140 + 9 oF)
• Flat-bottomed plastic pan, wide and shallow, for soaking specimens
• Adek PercometerTM
• Ice chest for enclosing cylindrical specimens
Materials
• Distilled water
Sample Preparation
• Prepare the sample as in Test Method-101-E, part II
Test Record Forms
• Record sample preparation and testing data on the Tube Suction Test Data Collection Form.
• After tests are completed, summarize results on the Tube Suction Test Data Analysis Report.

55
Procedure
• Use test method Tex-113-E for determining the optimum moisture content (OMC) and
maximum dry density (MDD) of the material for molding the test specimens.
• Obtain cylindrical plastic molds. At approximately 1/4 in. (6 mm) above the outside bottom
of each mold, drill 1/16 in. (1.5 mm) diameter holes around the circumference of the mold at
a horizontal spacing of 1/2 in. (12.5 mm). This equates to 38 or 39 holes around the mold
base. Also drill one 1/16 in. (1.5 mm) diameter hole in each quadrant of the bottom of the
mold about 2 in. (50 mm) from the center. Trim the cylinder as necessary to a height of 2 in.
(50 mm) to create a reusable plastic base cap. Make two vertical cuts in each base cap,
equally spaced around the circumference, to enable easier installation and removal. Place a 6
in. (152.4 mm) diameter circle of filter paper or paper towel in the bottom of each cap.
Weigh the caps to the nearest 0.0022 lb (1 g) and record as WCAP.
• Obtain a representative sample of prepared material in sufficient quantity to prepare three
specimens. Bring the material to optimum moisture using distilled water. (Ions in regular tap
water can influence the results of the test by increasing the osmotic suction component of the
aggregate.)
• Compact three specimens at optimum moisture and maximum dry density according to test
method Tex-113-E. The specimens should be 6 in. (152.4 mm) in diameter and 8 + 0.25 in.
(203.2 + 6.4 mm) in height and should be wetted, mixed, molded, and finished as nearly
identical as possible. The surface of each specimen should be made as smooth as possible
after compaction. Remove or reposition any coarse aggregate protruding from the specimen
surface and fill any large voids as necessary. (Application of fines across the whole specimen
surface should be avoided, however.)
• After removal of specimens from the compaction sleeve, install a base cap on the bottom of
each specimen. Weigh three clean, dry triaxial cells to the nearest 1 g (0.0022 lb), and record
as WCELL. Slide the triaxial cell down over the specimen so that only lower 1 in. (25 mm) of
the base cap remains exposed. Weigh the specimen with the base cap and triaxial cell to the
nearest 0.0022 lb (1 g) and record as WOMC.
• Place the specimens in an oven maintained at 140 + 9 oF (60 + 5 oC) for 48 + 4 hours.
• Remove the specimens from the drying oven and weigh each specimen with base cap and
triaxial cell to the nearest 0.0022 lb (1 g) and record as WDRY. Use the Adek PercometerTM to

56
take six initial dielectric readings on each specimen surface. Five readings should be equally
spaced around the perimeter of the specimen, and the sixth should be in the center. Press
down on the probe with a force of 20 ± 5 lb (9.1 ± 2.3 kg) to ensure adequate contact of the
probe on the specimen surface. Follow this pattern each time dielectric values are measured.
• Place the samples inside an ice chest on a level surface in a laboratory room maintained at
77 ± 9 oF (25 ± 5 oC) and fill the ice chest with distilled water to a depth of 1/2 ± 1/8 in.
(12.5 ± 3.2 mm). Maintain the water bath at this depth throughout the testing. Avoid
splashing the specimen surfaces with water during the test. Close the ice chest lid.
• Take six dielectric readings on each specimen surface once a day for 10 days. If the water
content is to be monitored through time, record the sample weight daily to the nearest
0.0022 lb (1 g) as WWET at each time interval. Wipe the bottom of the mold dry before
weighing. Close the ice chest lid after taking measurements.
• The test is complete when the elapsed time exceeds 240 hours. Measure and record final
surface dielectric values and weights. If triaxial strength testing is desired in this soaked
condition, carefully remove the base cap and peform the test.
• Determine the final moisture content of each specimen according to test method Tex-103-E,
part I but use the entire sample in the procedure. Wash all aggregate particles from the base
cap and interior of the triaxial cell, as well as from any porous stones used in triaxial testing,
into the drying pan. Record the weight of the oven-dry aggregate particles as WS. Though the
moisture content determined in this way after triaxial testing may not represent the moisture
content at the conclusion of soaking, the value of the latter can be calculated using WS as
shown in the next section.
Calculations
• Calculate the actual gravimetric water content (WCOMC, %) of each specimen just after
compaction at the optimum moisture content,
WCOMC = 100 (WOMC – WCAP – WCELL – WS)/WS
where:
WOMC = weight of specimen with base cap and triaxial cell just after compaction, lb (g)
WCAP = weight of specimen with base cap and triaxial cell just after compaction, lb (g)
WCELL = weight of clean, dry triaxial cell, lb (g)
WS = weight of oven-dry aggregate particles, lb (g)

57
• Calculate the gravimetric water content (WCDRY, %) of each specimen just after the two-day
drying period,
WCDRY = 100 (WDRY – WCAP – WCELL – WS)/WS
where:
WDRY = weight of specimen with base cap and triaxial cell after two-day drying period, g
(lb.)
WCAP = weight of plastic base cap, lb (g)
WCELL = weight of clean, dry triaxial cell, lb (g)
WS = weight of oven-dry aggregate particles, lb (g)
• Calculate the percentage of water loss (PLOSS, % of OMC) for each specimen during the two-
day period,
PLOSS = 10000 [(WOMC – WDRY) / WS] / WCOMC
where:
WOMC = weight of specimen with base cap and triaxial cell just after compaction, lb (g)
WDRY = weight of specimen with base cap and triaxial cell after two-day drying period, lb (g)
WS = weight of oven-dry aggregate particles, lb (g)
WCOMC = gravimetric water content just after compaction, %
• Calculate the average percentage of water loss for the three specimens.
• Calculate the gravimetric water content (WCWET, %) of each specimen at each time interval
during the soaking period,
WCWET = 100 (WWET – WCAP – WCELL – WS)/WS
where:
WWET = weight of specimen with base cap and triaxial mold at time of interest during
soaking period, lb (g)
WCAP = weight of plastic base cap, lb (g)
WCELL = weight of clean, dry triaxial cell, lb (g)
WS = weight of oven-dry aggregate particles, lb (g)
• Calculate the average gravimetric water content of the three specimens at the end of the
soaking period.
58
• For each specimen at each time interval, discard the highest and lowest dielectric readings.
Calculate the average dielectric value from the remaining four readings for plotting against
time.
• Calculate the average final mean dielectric value of the three specimens to determine an
overall moisture susceptibility ranking. Aggregates with final dielectric values less than 10
are expected to provide good performance, while those with dielectric values above 16 are
expected to provide poor performance as base materials. Aggregates having final dielectric
values between 10 and 16 are expected to be marginally moisture susceptible.
Graphs
• Plot the dielectric-time curve for each specimen.
• Plot the moisture-time curve for each specimen if requested.
Test Report
• Report the average final dielectric value after soaking and the corresponding moisture
susceptibility ranking of good, marginal, or poor.
• Report the average final gravimetric water content of the specimens after soaking and the
average percentage of water loss with respect to OMC during the two-day drying period.
• The former is indicative of the water content this aggregate may attain in the field given the
availability of water, and the latter, if less than 50 percent, suggests that special construction
considerations may be required in moist conditions to avoid trapping water in the pavement.

Tube Suction Test Data Collection Form Aggregate Technician
Source Year Lab. No.
Specimen Preparation Measurement 0 1 2 3 4 5 6 7 8 9 10
OMC, % Date, mm/dd MDD, kg/m3
(pcf) Time, hr:min Specimen No. WWET, g (lb)
Specimen Testing 1 WCAP, g (lb) 2 WCELL, g (lb) Dielectric 3 WOMC, g (lb) Value 4 WDRY, g (lb) 5
WS, g (lb) 6
Specimen No. WWET, g (lb)
Specimen Testing 1 WCAP, g (lb) 2 WCELL, g (lb) Dielectric 3 WOMC, g (lb) Value 4 WDRY, g (lb) 5
WS, g (lb) 6
59
60
Recommended Standard Method for Permanent Deformation and Resilient Modulus Testing of
Unbound Granular Base/Subbase Materials
1 Scope
1.1 This test method is used to determine the permanent deformation properties, k1, k2, k3
parameters along with the resilient modulus (Mr) values of unbound granular
base/subbase materials for pavement performance prediction. The stress conditions
used in this test represent the range of stress states likely to be developed beneath
flexible pavements subjected to moving wheel loads. This test procedure has been
adapted from the standard test methods given by VESYS user manual, NCHRP 1-28A
report, and AASHTO designations: T307 and TP46.
1.2 The method described herein is applicable to laboratory-molded samples of unbound
granular base/subbase materials.
1.3 The stress-dependency of materials is considered in determining the permanent
deformation and resilient modulus values. These values are the measures of the
permanent deformation properties and the elastic modulus of unbound granular
base/subbase materials.
1.4 K1, K2, K3 values are used to calculate the resilient modulus values, which can be used
with structural analysis models to calculate the pavement structural response to wheel
loads. Also, resilient modulus and permanent deformation properties are used with
pavement design procedures to predict rutting performance.
1.5 This standard may involve the use of hazardous materials, operations, and equipment.
This standard does not purport to address all of the safety problems associated with its
use. It is the responsibility of the user of this standard to consult and establish
appropriate safety and health practices and to determine the applicability of regulatory
limitations prior to use.
61
2 Referenced Documents
2.1 AASHTO Standards:
2.1.1 T88 Particle size analysis of soils
2.1.2 T89 Determining the liquid limit of soils
2.1.3 T90 Determining the plastic limit and the plasticity index of soils
2.1.4 T100 Specific gravity of soils
2.1.5 T180 Moisture – Density relations of soils using a 10 lb (4.54 kg) rammer and 18
in. (457 mm) drop
2.1.6 T233 Density of soil-in-place by block, chunk, or core sampling
2.1.7 T292-91 Resilient modulus of subgrade soils and untreated base/subbase
materials
2.1.8 T296 Strength parameters of soils by triaxial compression
2.1.9 T265 Laboratory determination of moisture content of soils
3 Terminology
3.1 Unbound granular base and subbase materials – These include soil-aggregate mixtures
and naturally occurring materials. A binding or stabilizing agent is not used to prepare
unbound granular base or subbase layers. These materials are classified as Type 1 and
Type 2, defined subsequently in Sections 3.2 and 3.3.
3.2 Material Type 1 – Includes all unbound granular base and subbase materials with
maximum particle sizes greater than 3/8 in. (9.5 mm). All material greater than 1.0 in.
(25.4 mm) shall be scalped off prior to testing. Materials classified as Type 1 shall be
modified in either a 6 in. (152 mm) diameter mold or a 4 in. (102 mm) diameter mold.
Materials classified as Type 1 shall be compacted by impact or vibratory compaction.
3.3 Material Type 2 – Includes all unbound granular base and subbase materials, which
have a maximum particle size less than 3/8 in. (9.5 mm) and which meet the criteria of
less than 10 percent passing the 75 µm (no. 200) sieve. Materials classified as Type 2
shall be molded in a 4 in. (102 mm) diameter mold and compacted by vibratory
compaction.
62
3.4 Permanent Deformation – Permanent deformation is the unrecovered deformation
during the testing, determined by repeated load compression tests on specimens of the
unbound materials.
3.5 Resilient Modulus – Resilient modulus (MR) is the ratio of the peak axial repeated
deviatoric stress to the peak recoverable axial strain of the specimen, determined by
repeated load compression tests on specimens of the unbound materials.
3.6 Loading WaveForm – Test specimens are loaded using a haversine-shaped load pulse
with 0.1 second loading time and 0.9 second rest period.
3.7 Maximum Applied Axial Load (Pmax) – The load applied on the sample consisting of
the contact load and the cyclic load (confining pressure is not included):
Pmax = Pcontact + Pcyclic
3.8 Contact Load (Pcontact) – Vertical load placed on the specimen to maintain a positive
contact between the loading ram and the specimen top cap. The contact load includes
the weight of top cap and the static load applied by the ram of the loading system.
3.9 Cyclic Axial Load – Repetitive load applied to a test specimen:
Pcyclic = Pmax – Pcontact
3.10 Maximum Applied Axial Stress (Smax) – The axial stress applied on the sample
consisting of the contact stress and the cyclic stress (confining stress is not included):
Smax = Pmax /A
where: A = cross sectional area of the sample.
3.11 Cyclic Axial Stress – The cyclic (resilient) stress applied on sample:
Scyclic = Pcyclic /A
3.12 Contact Stress (Scontact) – Axial stress applied on a test specimen to maintain a positive
contact between the specimen cap and the specimen:
Scontact = Pcontact /A
The contact stress shall be maintained to apply a constant anisotropic confining stress
ratio:
(Scontact + S3)/S3 = 1.2
where: S3 = the confining pressure.
3.13 S3 is the applied confining pressure in the triaxial chamber (that is, the minor principal
stress σ3).
63
3.14 er is the resilient (recoverable) axial deformation due to Scyclic.
3.15 εr is the resilient (recoverable) axial strain due to Scyclic:
εr = er /L
where: L = distance between measurement points for resilient axial deformation, er.
3.16 ep is the permanent (unrecoverable) axial deformation due to Scyclic.
3.17 εp is the permanent (unrecoverable) axial strain due to Scyclic:
εp= ep /L
where: L = distance between measurement points for permanent axial deformation, ep.
3.18 Resilient Modulus (MR) is defined as:
Mr = Scyclic /εr
3.19 Load duration is the time interval for which the specimen is subjected to a cyclic stress
pulse.
3.20 Cycle duration is the time interval between the successive applications of a cyclic stress
(usually 1.0 sec).
4 Summary of Method
4.1 This test is performed by placing a specimen in a triaxial cell and applying repeated
axial load. After subjecting the specimen to all-round confining pressure, measurements
are taken of the recoverable axial deformation and the applied load. Both total resilient
(recoverable) and permanent axial deformation responses of the specimen are recorded
and used to calculate the permanent deformation property and the resilient modulus.
Permanent deformation is the unrecovered deformation during the testing, and resilient
modulus is the ratio of the peak axial repeated deviatoric stress to the peak recoverable
axial strain of the specimen.
5. Significance and Use
5.1 The permanent deformation and resilient modulus test simulates the conditions in a
pavement with moving wheel loads. The resilient modulus test results provide a basic
constitutive relationship between stiffness and stress state of pavement materials for use
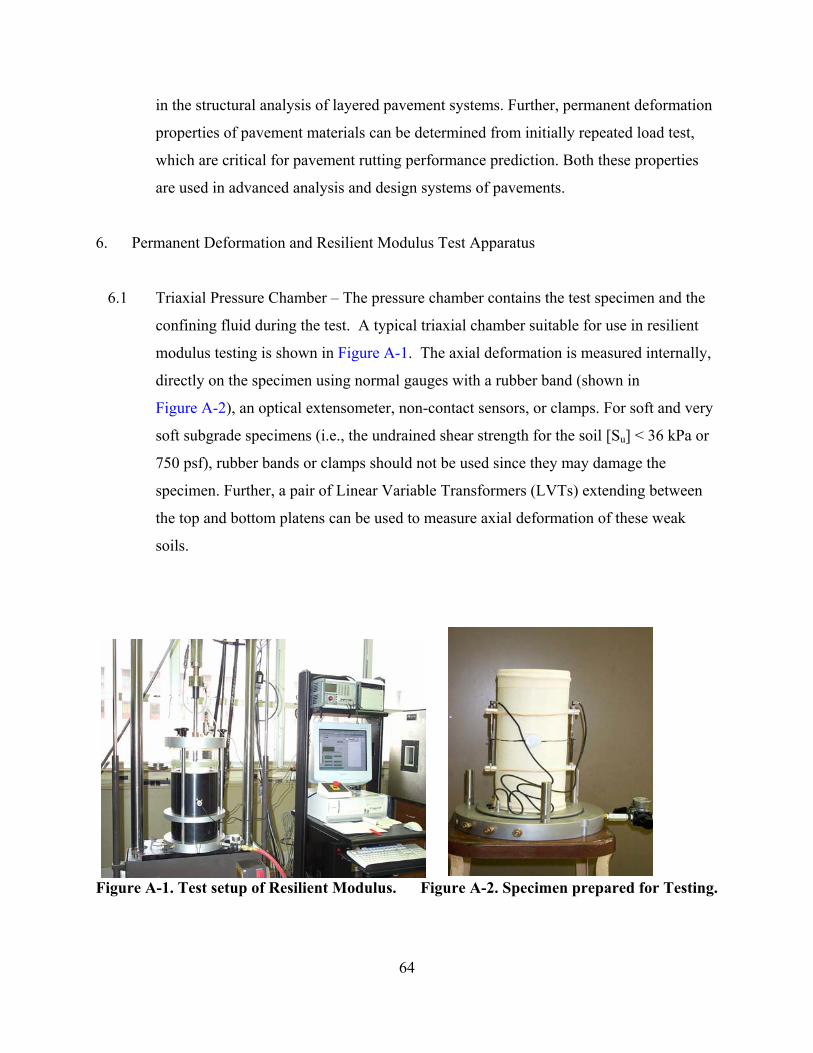
64
in the structural analysis of layered pavement systems. Further, permanent deformation
properties of pavement materials can be determined from initially repeated load test,
which are critical for pavement rutting performance prediction. Both these properties
are used in advanced analysis and design systems of pavements.
6. Permanent Deformation and Resilient Modulus Test Apparatus
6.1 Triaxial Pressure Chamber – The pressure chamber contains the test specimen and the
confining fluid during the test. A typical triaxial chamber suitable for use in resilient
modulus testing is shown in Figure A-1. The axial deformation is measured internally,
directly on the specimen using normal gauges with a rubber band (shown in
Figure A-2), an optical extensometer, non-contact sensors, or clamps. For soft and very
soft subgrade specimens (i.e., the undrained shear strength for the soil [Su] < 36 kPa or
750 psf), rubber bands or clamps should not be used since they may damage the
specimen. Further, a pair of Linear Variable Transformers (LVTs) extending between
the top and bottom platens can be used to measure axial deformation of these weak
soils.
Figure A-1. Test setup of Resilient Modulus. Figure A-2. Specimen prepared for Testing.

65
The following guidelines are to be checked for the triaxial chamber.
6.1.1 Air shall be used in the triaxial chamber as the confining fluid for all testing.
6.1.2 The chamber shall be made of suitable transparent material (such as polycarbonate).
6.2 Loading Device – The loading device shall be a top-loading, closed-loop electro-
hydraulic testing machine with a function generator capable of applying repeated cycles
of a haversine-shaped load pulse. Each pulse shall have a 0.1 second duration followed
by a rest period of 0.9 second duration for base/subbase materials. For nonplastic
granular material, it is permissible, if desired, to reduce the rest period to 0.4 second to
shorten testing time; the loading time may be increased to 0.15 second if required.
6.2.1 All conditioning and testing shall be conducted using a haversine-shaped load
pulse. The electro-hydraulic system generated haversine waveform and the response
waveform shall be displayed to allow the operator to adjust the gains to ensure they
coincide during conditioning and testing.
6.3 Load and specimen response measuring equipment:
6.3.1 The axial load measuring device should be an electronic load cell, which shall
preferably be located inside the triaxial cell. The load cell should have the
capacities, presented in Table A-1.
Table A-1. Load Cell Capacity.
Sample Diameter mm (in.) Max. Load Capacity kN (lb) Required Accuracy N (lb)
102 (4.0) 8.9 (2000) + 17.8 (+ 4) 152 (6.0) 22.24 (5000) + 22.24 (+ 5)
Note 1: During periods of permanent deformation and resilient modulus testing, the load cell shall be monitored and checked once every two weeks or after every 50 permanent deformation and resilient modulus tests with a calibrated proving ring to ensure that the load cell is operating properly. An alternative to using a proving ring is to inset an additional calibrated load cell and independently measuring the load applied by the original cell. Additionally, the load cell shall be checked at any time there is a suspicion of a load cell problem. The test shall not be conducted if the testing system is found to be out of calibration.

66
6.3.2 The chamber pressures shall be monitored with conventional pressure gauges,
manometers, or pressure transducers accurate to 0.69 kPa (0.1 psi)
6.3.3 Axial Deformation – Axial deformation is to be measured with the displacement
transducers referenced to gauge points contacting the specimen with rubber band as
shown in Figure A-2. Deformation shall be measured over approximately the
middle ½ of the specimen. Axial deformation shall be measured at a minimum of
two locations 180o apart (in plan view), and a pair of spring-loaded LVDTs are
placed on the specimen at ¼ point. Spring-loaded LVDTs maintain a positive
contact between the LVDTs and the surface on which the tips of the transducers
rest. Table A-2 summarizes the specifications for spring-loaded LVDTs.
Table A-2. Specifications for Axial LVDTs.
Material/Specimen Size Min. range (in.)
Approximate resilient specimen displacement (in.)
6 in. diameter specimen
+ 0.25 0.001 Aggregate Base
4 in. diameter specimen
+ 0.10 0.00065
Subgrade soil (sand and cohesive)
4 in. diameter + 0.25 0.0014
Note 2: Misalignment or dirt on the shaft of the transducer can cause the shafts of the LVDTs to stick. The laboratory technician shall depress and release the LVDT back and forth a number of times prior to each test to ensure that they move freely and are not sticking. A cleaner/lubricant specified by the manufacturer shall be applied to the transducer shafts on a regular basis.
6.3.4 Data Acquisition – An analog-to-digital (A/D) data acquisition system is required.
The overall system should include automatic data reduction to minimize production.
Suitable signal excitation, conditioning, and recording equipment is required for
simultaneous recording of axial load and deformations. The system should meet or
exceed the following additional requirements: (1) 25 µs A/D conversion time; (2)
12 bit resolution; (3) single or multiple channel throughput (gain = 1), 30 kHz; (4)
software selectable gains; (5) measurement accuracy of full scale (gain = 1) of
+0.02 percent; and (6) nonlinearity (LSBS) of + 0.5 percent. The signal shall be

67
clean and free of noise. Filtering the output signal during or after data acquisition is
discouraged. If a filter is used, it should have a frequency of 10 to 20 Hz. A
supplemental study should be made to ensure correct peak readings are obtained
with filtered data compared to unfiltered data. A minimum of 200 points from each
LVDT shall be recorded per load cycle.
6.4 Specimen Preparation Equipment – A variety of equipment is required to prepare
compacted specimens that are representative of field conditions. Use of different
materials and different compaction methods in the field requires the use of varying
compaction techniques in the laboratory. Specimen preparation is described in
Appendix B.
6.5 Miscellaneous Apparatus – This includes calipers, micrometer gauge, steel rule
(calibrated to 0.02 in [0.5 mm].), rubber membranes from 0.02 to 0.031 in. (0.25 to 0.79
mm) thickness, rubber O-rings, vacuum source with bubble chamber and regulator,
membrane expander, porous stones (subgrade), 0.25 in. (6.4 mm) thick porous stones or
bronze discs (base/subbase), scales, moisture content cans, and data sheets.
6.6 Periodic System Calibration – The entire system (transducers, signal conditioning, and
recording devices) shall be calibrated every two weeks or after every 50 tests. Daily and
other periodic checks of the system may also be performed as necessary. No permanent
deformation and resilient modulus testing will be conducted unless the entire system
meets the established calibration requirements.
7. Preparation of Test Specimens
7.1 The following guidelines, based on the sieve analysis test results, shall be used to
determine the test specimen size:
7.1.1 Use 6.0 in. (152 mm) diameter by 12 in. (305 mm) high specimens for all materials
with maximum particle sizes greater than 0.75 in. (19 mm). All materials greater
than 1.0 in. (25.4 mm) shall be scalped off prior to testing.
7.1.2 Use 4.0 in. (102 mm) diameter by 8.0 in. (203 mm) high specimens for all materials
with maximum particle sizes less than 0.75 in. (19 mm).

68
7.2 Laboratory Compacted Specimens – Reconstituted test specimens of all types shall be
prepared to the specified or insitu dry density (γd) and moisture content (w). Laboratory
compacted specimens shall be prepared for all unbound granular base and subbase
materials.
7.2.1 Moisture Content – For in situ materials, the moisture content of the laboratory
compacted specimen shall be the in situ moisture content for that layer obtained in
the field using AASHTO T238. If data are not available on in situ moisture content,
refer to Section 7.2.3.
7.2.1.1 The moisture content of the laboratory compacted specimen should not vary
from the required value by more than ±0.5 percent for all materials.
7.2.2 Density: The density of a compacted specimen shall be the in-place dry density
obtained in the field for that layer using AASHTO T239 or other suitable methods.
If these data are not available on in situ density, then refer to Section 7.2.3.
7.2.2.1 The dry density of a laboratory compacted specimen should not vary more
than +1.0 percent from the target dry density for that layer.
7.2.3 If either the in situ moisture content or the in-place dry density is not available, then
use the optimum moisture content and 95 percent of the maximum dry density by
using AASHTO T180 for the base/subbase.
7.2.3.1 The moisture content of the laboratory compacted specimen should not vary
from the required value by more than +0.5 percent for all materials. The dry
density of a laboratory compacted specimen should not vary more than
+1.0 percent from the target dry density for that layer.
7.2.4 Sample Reconstitution: Reconstitute the specimen for all materials in accordance
with the provisions given in Appendix B. The target moisture content and density to
be used in determining the required qualities are given in Section 7.2. Appendix B
69
also provides guidelines to obtain a sufficient amount of material to prepare the
appropriate specimen type at the designated moisture content and density. After
ascertaining the amount of material required, begin the specimen compaction.
7.3 Compaction Methods and Equipment for Reconstituting Specimens:
7.3.1 Specimens of type 1 materials shall be compacted by vibratory or impact
compaction. The general method of vibratory compaction is given in
AASHTO T307. The general method of impact compaction is given in
AASHTO T307.
7.3.2 Specimens of type 2 materials shall be compacted by vibratory compaction. The
general method of vibratory compaction is presented in AASHTO T307.
8. Test Procedure
The permanent deformation and resilient modulus test is performed using the following test
procedure. This procedure is applicable to all granular bases and subbases.
8.1 Assembly of the triaxial cell: If not already in place, place the specimen with end
platens into a position on the pedestal of the triaxial cell. Proper positioning of the
specimen is extremely critical in applying a concentric load to the specimen. Couple the
loading device to the specimen using a smooth steel ball. To center the specimen,
slowly rotate the ball as the clearance between the load piston ball decreases and a
small amount of load is applied to the specimen. Be sure the ball is concentric with the
piston that applies the load (watch the gap around the ball). Shift the specimen laterally
to achieve a concentric loading.
8.2 Check and adjust the axial displacement measurement system, load cell, and data
acquisition system and make sure they are working properly.
8.3 If not already connected, connect the air pressure supply line to the triaxial chamber.
8.4 Open all valves on drainage lines leading to the inside of the specimen. This step is
necessary to develop a confining pressure on the specimen.
70
8.5 Apply the specified confining pressure of 103.5 kPa (15.0 psi) to the test specimen. A
contact stress equal to 20 percent of the confining pressure shall be applied to the
specimen so that the load piston stays in contact with the top platen at all times.
8.6 Preconditioning: Apply 100 repetitions of a load equivalent to a maximum axial stress
of 41.4 kPa (6.0 psi) and a corresponding cyclic stress of 20.7 kPa (3 psi) using a
haversine-shaped, 0.1 second load pulse followed by 0.9 second rest period.
8.7 Permanent Deformation Test
8.7.1 Apply the haversine loading (Pcyclic) equivalent to a maximum axial stress of
227.7 kPa (33 psi) and a corresponding cyclic stress of 207 kPa (30 psi) using a
haversine- shaped, 0.1 second load pulse followed by a 0.9 second rest period, and
continue until 10,000 cycles (2.8 hours) or until the vertical permanent strain
reaches 5 percent during the testing, whichever comes first. The total number of
cycles or the testing time will depend on the stress levels applied.
8.7.2 During the load applications, record the load applied and the axial deformation
measured from the two LVDTs through the data acquisition system. Signal-to-noise
ratio should be at least 10. All data should be collected in real time and
collected/processed so as to minimize phase errors due to sequential channel
sampling. In order to save storage space during data acquisition for 10,000 cycles, it
is recommended to use the data acquisition of the cycles shown in Table A-3.

71
Table A-3. Suggested Data Collection for Triaxial Repeated Load Permanent Deformation Test.
Data Collection during Cycles
Data Collection during Cycles
Data Collection during Cycles
Data Collection during Cycles
1-15 450 1300 4000 20 500 1400 4500 30 550 1500 5000 40 600 1600 5500 60 650 1700 6000 80 700 1800 6500 100 750 1900 7000 130 800 2000 7500 160 850 2200 8000 200 900 2400 8500 250 950 2600 9000 300 1000 2800 9500 350 1100 3000 10000 400 1200 3500
8 Resilient Modulus Test
8.8.1 Specimen Testing – If the vertical permanent strain did not reach 5 percent during
the permanent deformation test, use the same specimen to perform the resilient
modulus test following the load sequence shown in Table A-4. Begin by decreasing
the maximum axial stress to 14.5 kpa (2.1 psi) (Sequence No. 1 Table A-4) and set
the confining pressure to 20.7 kpa (3.0 psi).
8.8.2 If the vertical permanent strain reached 5 percent during the permanent deformation
test, mold a new specimen and repeat the process described in Sections 8.1 to 8.7.
In addition, reduce the load repetitions from 10,000 to 5,000 during repeated load
permanent deformation test. If the sample again reaches 5 percent total vertical
permanent strain during the repeated load test, then terminate the test. No further
testing of this material is necessary. If not, perform the resilient modulus test
following the load sequence in Table A-4. Begin by decreasing the maximum axial
stress to 14.5 kPa (2.1 psi) (Sequence No. 1 Table A-4) and set the confining
pressure to 20.7 kPa (3 psi).
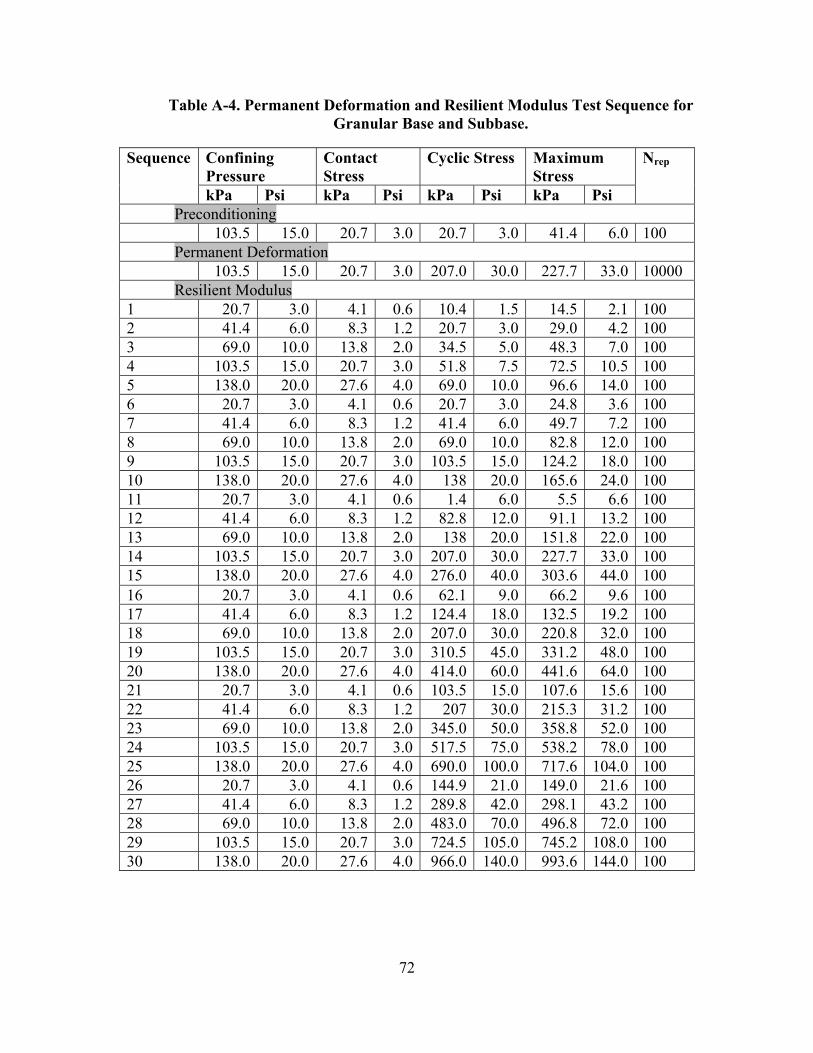
72
Table A-4. Permanent Deformation and Resilient Modulus Test Sequence for Granular Base and Subbase.
Confining Pressure
Contact Stress
Cyclic Stress Maximum Stress
Sequence
kPa Psi kPa Psi kPa Psi kPa Psi
Nrep
Preconditioning 103.5 15.0 20.7 3.0 20.7 3.0 41.4 6.0 100 Permanent Deformation 103.5 15.0 20.7 3.0 207.0 30.0 227.7 33.0 10000 Resilient Modulus
1 20.7 3.0 4.1 0.6 10.4 1.5 14.5 2.1 100 2 41.4 6.0 8.3 1.2 20.7 3.0 29.0 4.2 100 3 69.0 10.0 13.8 2.0 34.5 5.0 48.3 7.0 100 4 103.5 15.0 20.7 3.0 51.8 7.5 72.5 10.5 100 5 138.0 20.0 27.6 4.0 69.0 10.0 96.6 14.0 100 6 20.7 3.0 4.1 0.6 20.7 3.0 24.8 3.6 100 7 41.4 6.0 8.3 1.2 41.4 6.0 49.7 7.2 100 8 69.0 10.0 13.8 2.0 69.0 10.0 82.8 12.0 100 9 103.5 15.0 20.7 3.0 103.5 15.0 124.2 18.0 100 10 138.0 20.0 27.6 4.0 138 20.0 165.6 24.0 100 11 20.7 3.0 4.1 0.6 1.4 6.0 5.5 6.6 100 12 41.4 6.0 8.3 1.2 82.8 12.0 91.1 13.2 100 13 69.0 10.0 13.8 2.0 138 20.0 151.8 22.0 100 14 103.5 15.0 20.7 3.0 207.0 30.0 227.7 33.0 100 15 138.0 20.0 27.6 4.0 276.0 40.0 303.6 44.0 100 16 20.7 3.0 4.1 0.6 62.1 9.0 66.2 9.6 100 17 41.4 6.0 8.3 1.2 124.4 18.0 132.5 19.2 100 18 69.0 10.0 13.8 2.0 207.0 30.0 220.8 32.0 100 19 103.5 15.0 20.7 3.0 310.5 45.0 331.2 48.0 100 20 138.0 20.0 27.6 4.0 414.0 60.0 441.6 64.0 100 21 20.7 3.0 4.1 0.6 103.5 15.0 107.6 15.6 100 22 41.4 6.0 8.3 1.2 207 30.0 215.3 31.2 100 23 69.0 10.0 13.8 2.0 345.0 50.0 358.8 52.0 100 24 103.5 15.0 20.7 3.0 517.5 75.0 538.2 78.0 100 25 138.0 20.0 27.6 4.0 690.0 100.0 717.6 104.0 100 26 20.7 3.0 4.1 0.6 144.9 21.0 149.0 21.6 100 27 41.4 6.0 8.3 1.2 289.8 42.0 298.1 43.2 100 28 69.0 10.0 13.8 2.0 483.0 70.0 496.8 72.0 100 29 103.5 15.0 20.7 3.0 724.5 105.0 745.2 108.0 100 30 138.0 20.0 27.6 4.0 966.0 140.0 993.6 144.0 100
73
8.8.3 Apply 100 repetitions of the corresponding cyclic axial stress using a haversine-
shaped load pulse consisting of a 0.1 second load followed by a 0.9 second rest
period. Record the average recovered deformations from each LVDT separately for
the last five cycles.
8.8.4 Increase the maximum axial stress to a 30 kPa (4.2 psi) and the confining pressure
to 41.4 kPa (6.0 psi) (Sequence No. 2 Table A-4) and repeat the previous step at
this new stress level.
8.8.5 Continue the test for the remaining stress sequences in Table A-4 (3 to 30),
recording the vertical recovered deformation. If at any time the total permanent
strain of the sample exceeds 5 percent, end the test and report the result on the
appropriate worksheet.
8.8.6 At the completion of this test, reduce the confining pressure to zero and remove the
sample from the triaxial chamber.
8.8.7 Remove the membrane from the specimen and use the entire specimen to determine
moisture content in accordance with AASHTO T265.
9.0 Calculations
Calculation of Permanent Strain
9.1 Calculate the average axial deformation for each specimen by averaging the readings
from the two axial LVDTs. Convert the average deformation values to the total axial
strain by dividing with the gauge length, L (6 in. [152 mm] for 6 in. diameter sample;
4 in. (102 mm) for 4 in. diameter sample).
9.2 Compute the cumulative axial permanent strain and resilient strain (εr) at the 200th load
repetition.
9.3 Plot the cumulative axial permanent strain versus the number of loading cycles in log
space (shown in Figure A-3). Determine the permanent deformation parameters,
intercept (a) and slope (b), from the linear portion of the permanent strain curve (log-
log scale), which is also demonstrated on Figure A-3.

74
Figure A-3. Permanent Strain vs. Number of Load Applications.
9.4 Compute the rutting parameters – Alpha (α) and Mu (µ)
Calculation of Resilient Modulus
9.5 Perform the calculations to obtain the resilient modulus values and then average the
resilient modulus values computed from each of the last five cycles of each load
sequence. The data reduction process should be fully automated to minimize the chance
for human error.
9.6 Fit using nonlinear regression techniques the following resilient modulus model to the
data obtained from the applied procedure.
r
ab
ε=µ
b1 −=α
y = 0.0062x 0.1061
0
0.002
0.004
0.006
0.008
0.01
0.012
0.014
0.016
0.018
0.02
0 2000 4000 6000 8000 10000 12000Number of Load Repetitions
Perm
anen
t Str
ain
V-LVDT1 V-LVDT2 Ave.V-LVDTs Ave.V-LVDTs from 500 Regression-Ave.

75
The resilient modulus is calculated by the following:
32
76
13
k
a
octk
aar k
PPk
PkM ⎟⎟⎠
⎞⎜⎜⎝
⎛+⎟⎟
⎠
⎞⎜⎜⎝
⎛ −=
τθ
k1, k2 ≥0
k3, k6 ≤0
k7 ≥1
where:
Mr = resilient modulus
θ = bulk stress = σ1+σ2+σ3
τoct = octahedral shear stress
σ1, σ2, σ3 = πrincipal stresses
ki = regression constants
Pa = atmospheric pressure
Assign initial values of k6 = 0 and k7 = 1; restrain all regression constants according to the model.
Report the constants k1, k2, k3, k6, and k7, the ratio of the standard error of estimate to the
standard deviation, and the square of the correlation coefficient.
10 Report
10.1 Permanent deformation test:
10.1.1 Report all specimen basic information including specimen identification, dates of
manufacturing and testing, specimen diameter, and length.
10.1.2 Report confining pressure, stress levels used, and axial permanent deformation
parameters: α and µ (or εr, a, and b).
( )232
231
221 )()()(
31 σσσσσστ −+−+−=oct
76
10.2 Resilient Modulus Test:
10.2.1 Report all specimen basic information including specimen identification, dates of
manufacturing and testing, specimen diameter, and length.
10.2.2 Report the average peak stress (σo) and strain (εo) for each confining pressure-
cyclic stress combination tested.
10.2.3 Report for each confining pressure-cyclic stress combination tested, the resilient
modulus for each replicate test specimen.
10.2.4 Report the nonlinear resilient modulus model and the model parameters: k1, k2, k3,
k6, and k7.
77
APPENDIX B:
SAMPLE PREPARATION

79
1. Scope
1.1 The following information provides guidelines for reconstituting the material to be
tested so as to produce a sufficient amount of material to prepare the appropriate
sample type (type 1, 2, or 3) at the designated moisture content and density.
2. Preparation for Compaction
2.1 Sample Conditioning: If the sample is damp when received from the field, dry it until it
becomes friable. Drying may be in air or by use of a drying apparatus such that the
temperature does not exceed 60 oC (140 oF). Then thoroughly break up the aggregations
in such a manner so as to avoid reducing the natural size of individual particles.
Moderate pressure is applied using a rubber-covered implement to push the particles
through a 4.75 mm (no. 4) sieve.
2.2 Sample Preparation: Determine the moisture content (w1) of the sample as per
AASHTO T265. The mass of the sample for moisture determination shall not weigh
less than 200 g for samples with a maximum particle size smaller than the 4.75 mm
(no. 4) sieve.
2.2.1 Determine the appropriate total volume (V) of the compacted specimen to be
prepared. The total volume is based on the height of compacted specimen slightly
greater than that required for resilient testing to allow for trimming of the specimen
ends if necessary. Compacting to a height/diameter ratio of 2.1 to 2.2 will provide
adequate material for this purpose.
2.2.2 Determine the mass of oven dry soil solids (Ws) required to obtain the desired dry
density (γd) and moisture content (w) as follows:
Ws = 453.59 γd V
where:
Ws = mass of oven-dry solids, g
γd = desired dry density, lb/ft3
V = total volume of compacted specimen, ft3

80
2.2.3 Determine the mass of the dried sample, (Wad), with moisture content (w1) required
to obtain Ws plus an additional amount Was of at least 500 g to provide material for
the determination of moisture content at the time of compaction.
where:
Waw = mass of water needed to obtain water content w, g
w = desired water content of compacted material, percent
2.2.4 Determine the mass of water (Waw) required to change the water content from the
existing water content, w1, to the desired compaction water content, w.
where:
Wad = mass of sample at water content w1, g
Was = mass of moisture content specimen (usually 500 g), g
w1 = Water content of prepared material, percent
2.2.5 Place a sample of mass Wad into a mixing pan.
2.2.6 Add the mass of water (Waw) needed to change the water content from w1 to w to
the sample in small amounts and mix thoroughly after each addition.
2.2.7 Place the mixture into a plastic bag. Seal the bag, place it in a second bag and seal
it. Cure the sample for 4 hours, determine the mass of wet soil and container to the
nearest gram and record this value as appropriate.
2.2.8 The material is now ready for compaction.
2.3 Compaction
2.3.1 Refer to ASTM for vibratory, impact, and kneading compaction methods.
( ) ⎟⎠⎞
⎜⎝⎛ −
+=100
wwWWW 1
assaw
( ) ⎥⎦⎤
⎢⎣⎡ ++=
100w1WWW 1
assad
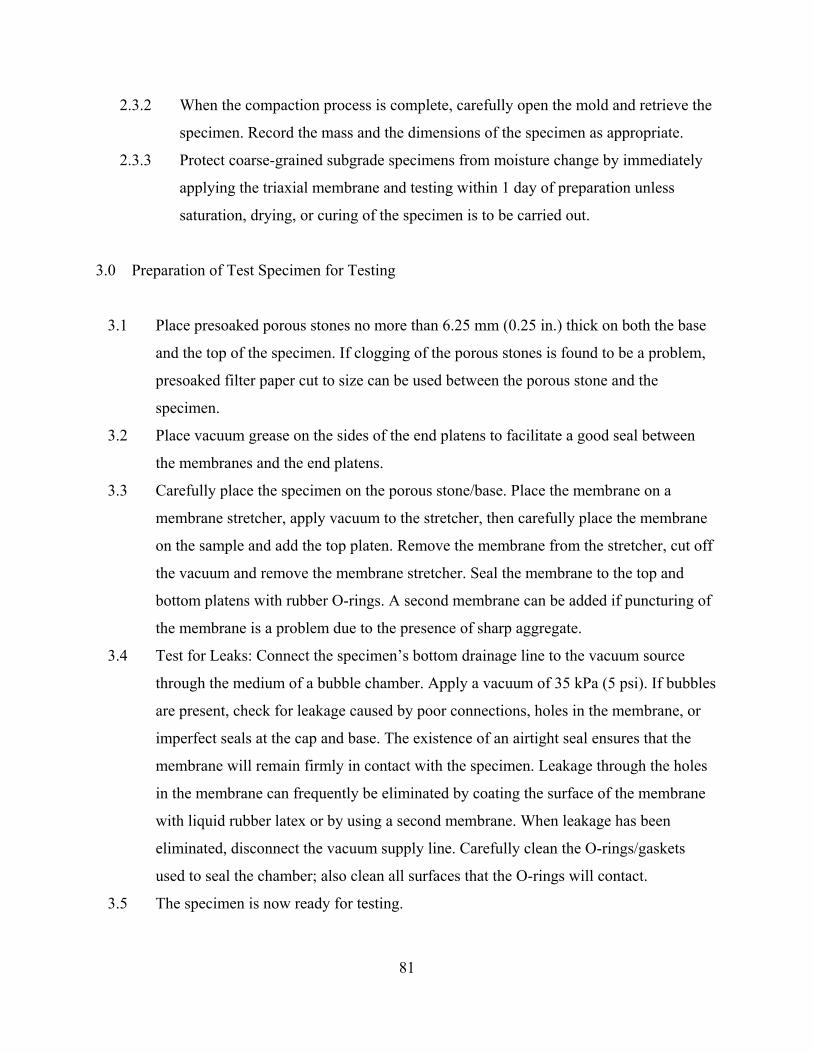
81
2.3.2 When the compaction process is complete, carefully open the mold and retrieve the
specimen. Record the mass and the dimensions of the specimen as appropriate.
2.3.3 Protect coarse-grained subgrade specimens from moisture change by immediately
applying the triaxial membrane and testing within 1 day of preparation unless
saturation, drying, or curing of the specimen is to be carried out.
3.0 Preparation of Test Specimen for Testing
3.1 Place presoaked porous stones no more than 6.25 mm (0.25 in.) thick on both the base
and the top of the specimen. If clogging of the porous stones is found to be a problem,
presoaked filter paper cut to size can be used between the porous stone and the
specimen.
3.2 Place vacuum grease on the sides of the end platens to facilitate a good seal between
the membranes and the end platens.
3.3 Carefully place the specimen on the porous stone/base. Place the membrane on a
membrane stretcher, apply vacuum to the stretcher, then carefully place the membrane
on the sample and add the top platen. Remove the membrane from the stretcher, cut off
the vacuum and remove the membrane stretcher. Seal the membrane to the top and
bottom platens with rubber O-rings. A second membrane can be added if puncturing of
the membrane is a problem due to the presence of sharp aggregate.
3.4 Test for Leaks: Connect the specimen’s bottom drainage line to the vacuum source
through the medium of a bubble chamber. Apply a vacuum of 35 kPa (5 psi). If bubbles
are present, check for leakage caused by poor connections, holes in the membrane, or
imperfect seals at the cap and base. The existence of an airtight seal ensures that the
membrane will remain firmly in contact with the specimen. Leakage through the holes
in the membrane can frequently be eliminated by coating the surface of the membrane
with liquid rubber latex or by using a second membrane. When leakage has been
eliminated, disconnect the vacuum supply line. Carefully clean the O-rings/gaskets
used to seal the chamber; also clean all surfaces that the O-rings will contact.
3.5 The specimen is now ready for testing.


83
APPENDIX C:
PERMANENT DEFORMATION RESULTS FOR SPICEWOOD SPRINGS


SPECIMEN # 1
Figure C- 1. Permanent Deformation Result for Specimen #1.
500th cycle's resilient strain = 0.000546, Mr = 54.18 ksiAlpha = 0.86 Mu = 1.478
y = 0.0058x 0.1397
0.001
0.01
0.1
1 1 10 100 1000 10000
Number of Load Repetitions
Perm
anen
t Str
ain
V-LVDT1 V-LVDT2 Ave.V-LVDTs Ave.V-LVDTs from 500 Regression-Ave.
85

Figure C- 2. εp/εr vs. Number of Load Cycles for Specimen #1.
εp/εr vs. N
y = 2.0871x0.3821
R2 = 0.9823
1
10
100
1 10 100 1000 10000
Number of Load Cycles (N)
ε p
/εr 86

SPECIMEN # 2
Figure C- 3. Permanent Deformation Result for Specimen #2.
500th cycle's resilient strain = 0.000485, Mr = 59.73 ksiAlpha = 0.925 Mu = 0.799
y = 0.0052x 0.0752
0.001
0.01
0.1
11 10 100 1000 10000
Number of Load Repetitions
Perm
anen
t Str
ain
V-LVDT1 V-LVDT2 Ave.V-LVDTs Ave.V-LVDTs from 500 Regression-Ave.
87
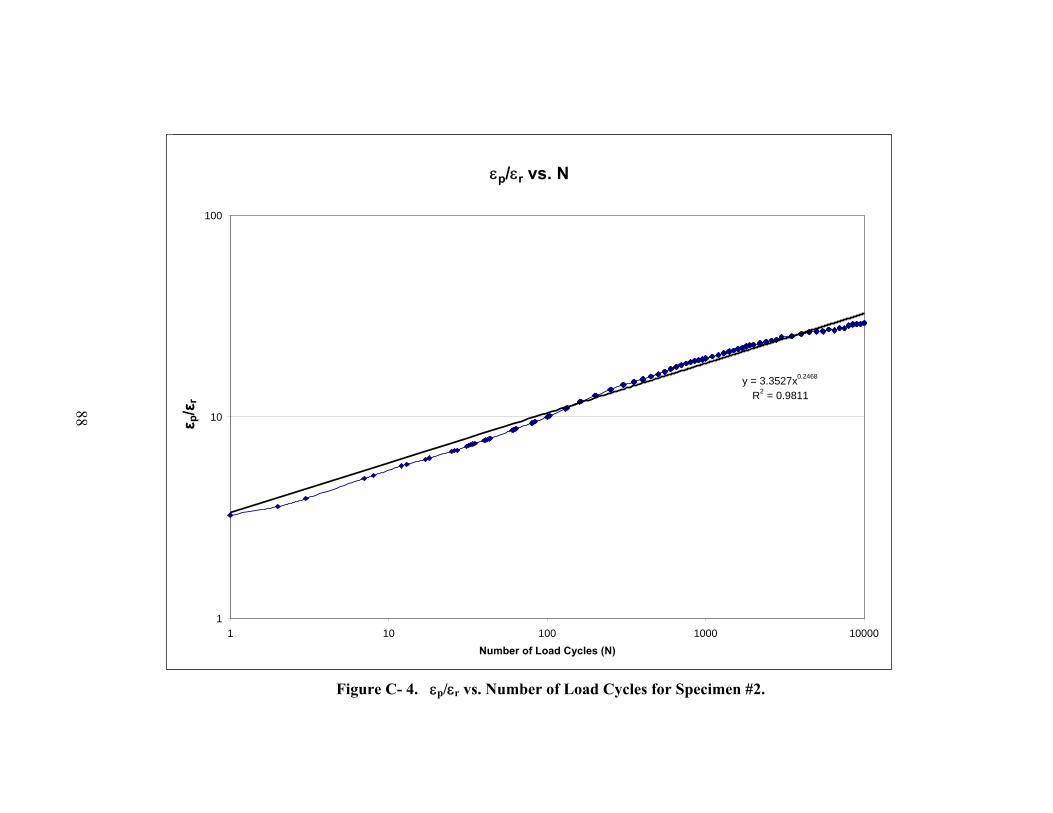
Figure C- 4. εp/εr vs. Number of Load Cycles for Specimen #2.
εp/εr vs. N
y = 3.3527x0.2468
R2 = 0.9811
1
10
100
1 10 100 1000 10000Number of Load Cycles (N)
ε
p/εr
88

SPECIMEN # 3
Figure C- 5. Permanent Deformation Result for Specimen #3.
500th cycle's resilient strain = 0.00058, Mr = 50.78 ksiAlpha = 0.921 Mu = 1.271
y = 0.0094x 0.0788
0.0001
0.001
0.01
0.1
11 10 100 1000 10000
Number of Load Repetitions
Perm
anen
t Str
ain
V-LVDT1 V-LVDT2 Ave.V-LVDTs Ave.V-LVDTs from 500 Regression-Ave.
89

Figure C- 6. εp/εr vs. Number of Load Cycles for Specimen #3.
εp/εr vs. N
y = 2.6475x0.3533
R2 = 0.9857
1
10
100
1 10 100 1000 10000
Number of Load Cycles (N)
ε
p /ε r
90

SPECIMEN # 4
Figure C- 7. Permanent Deformation Result for Specimen #4.
500th cycle's resilient strain = 0.000619, Mr = 48.71 ksiAlpha = 0.912 Mu = 1.28
y = 0.009x 0.0883
0.001
0.01
0.1
11 10 100 1000 10000
Number of Load Repetitions
Perm
anen
t Str
ain
V-LVDT1 V-LVDT2 Ave.V-LVDTs Ave.V-LVDTs from 500 Regression-Ave.
91

Figure C- 8. εp/εr vs. Number of Load Cycles for Specimen #4.
εp/εr vs. N
y = 4.2256x0.2819
R2 = 0.9839
1
10
100
1 10 100 1000 10000
Number of Load Cycles (N)
ε p
/εr
92

SPECIMEN # 5
Figure C- 9. Permanent Deformation Result for Specimen #5.
500th cycle's resilient strain = 0.000641, Mr = 45.51 ksiAlpha = 0.911 Mu = 1.47
y = 0.0106x 0.0889
0.001
0.01
0.1
11 10 100 1000 10000
Number of Load Repetitions
Perm
anen
t Str
ain
V-LVDT1 V-LVDT2 Ave.V-LVDTs Ave.V-LVDTs from 500 Regression-Ave.
93
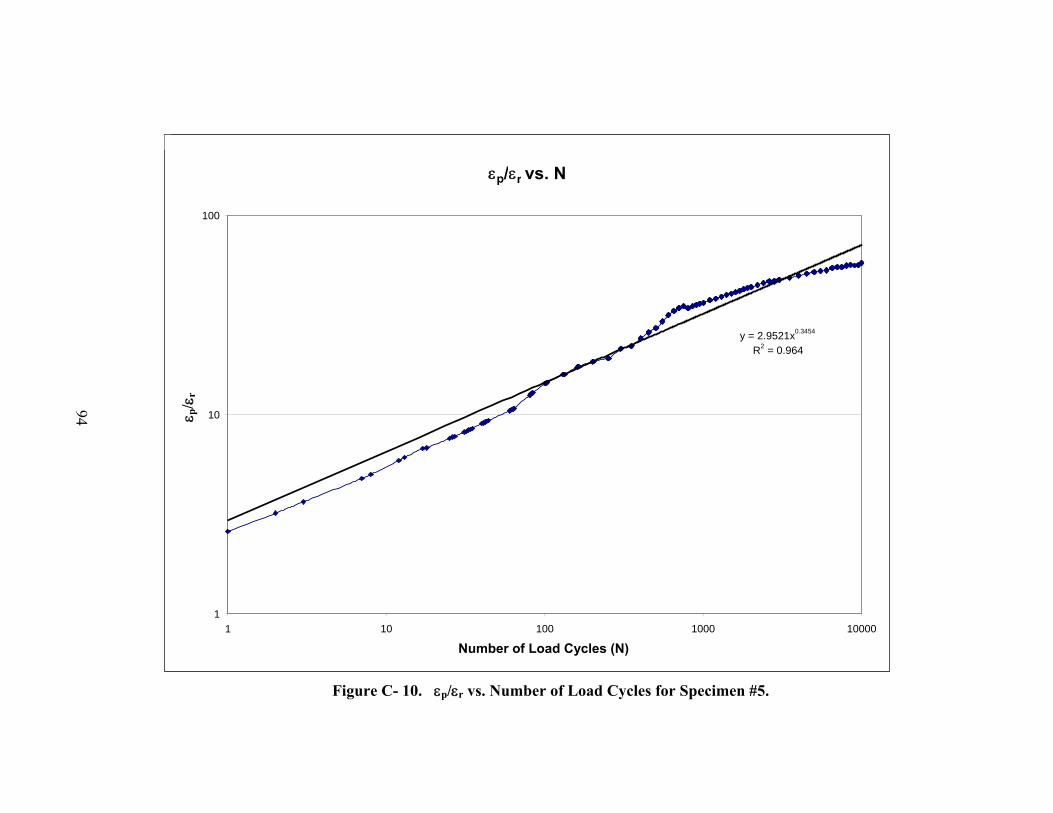
Figure C- 10. εp/εr vs. Number of Load Cycles for Specimen #5.
εp/εr vs. N
y = 2.9521x0.3454
R2 = 0.964
1
10
100
1 10 100 1000 10000
Number of Load Cycles (N)
ε p
/εr
94

SPECIMEN # 6
Figure C- 11. Permanent Deformation Result for Specimen #6.
500th cycle's resilient strain = 0.000687, Mr = 44.33 ksiAlpha = 0.933 Mu = 0.844
y = 0.0087x 0.0665
0.0001
0.001
0.01
0.1
11 10 100 1000 10000
Number of Load Repetitions
Perm
anen
t Str
ain
V-LVDT1 V-LVDT2 Ave.V-LVDTs Ave.V-LVDTs from 500 Regression-Ave.
95
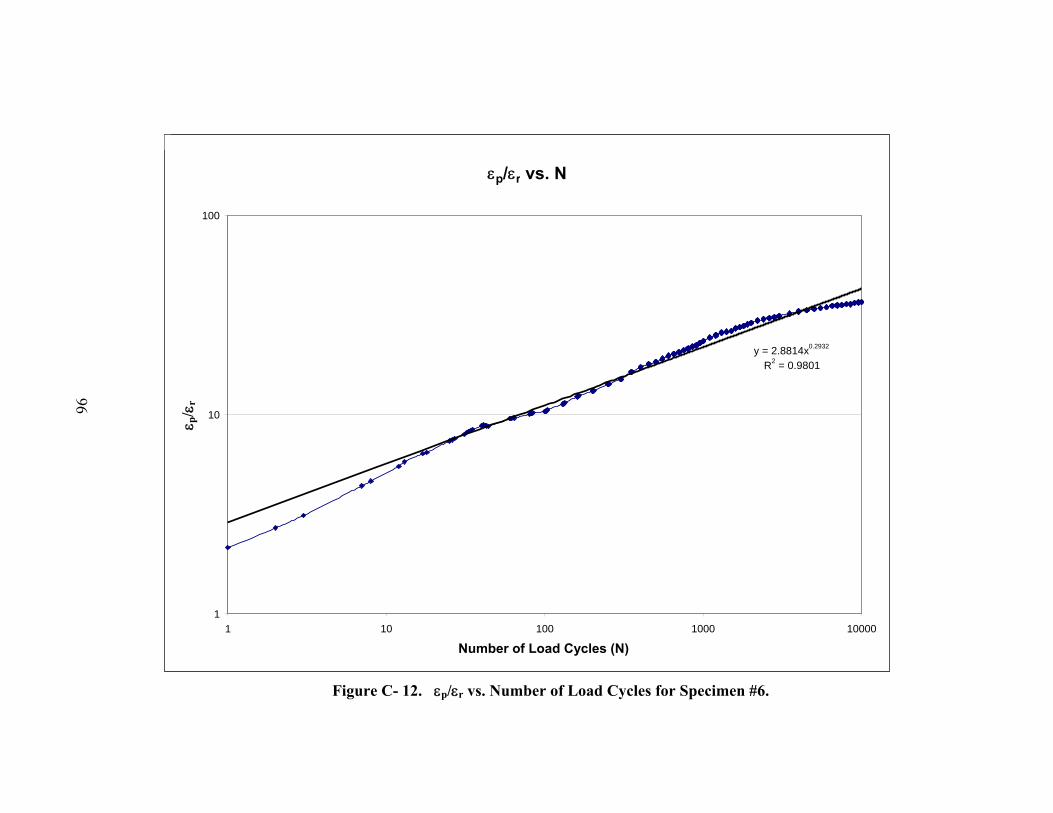
Figure C- 12. εp/εr vs. Number of Load Cycles for Specimen #6.
εp/εr vs. N
y = 2.8814x0.2932
R2 = 0.9801
1
10
100
1 10 100 1000 10000
Number of Load Cycles (N)
ε p/ε
r
96

SPECIMEN # 7
Figure C- 13. Permanent Deformation Result for Specimen #7.
500th cycle's resilient strain = 0.000589, Mr = 50.07 ksiAlpha = 0.926 Mu = 1.544
y = 0.0122x 0.0745
0.001
0.01
0.1
11 10 100 1000 10000
Number of Load Repetitions
Perm
anen
t Str
ain
V-LVDT1 V-LVDT2 Ave.V-LVDTs Ave.V-LVDTs from 500 Regression-Ave.
97

Figure C- 14. εp/εr vs. Number of Load Cycles for Specimen #7.
εp/εr vs. N
y = 2.6592x 0.3882
R2 = 0.9903
1
10
100
1 10 100 1000 10000
Number of Load Cycles (N)
εp/ε
r
98
99
APPENDIX D:
RESILIENT MODULUS RESULTS FOR SPICEWOOD SPRINGS

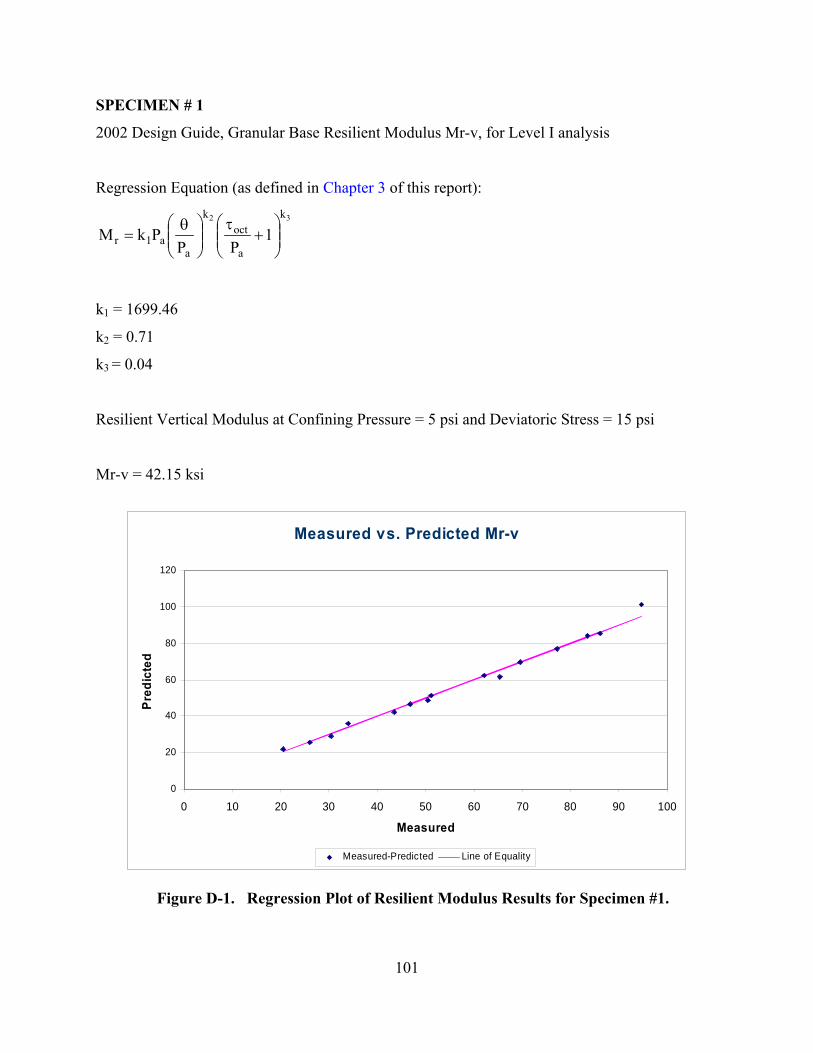
101
SPECIMEN # 1
2002 Design Guide, Granular Base Resilient Modulus Mr-v, for Level I analysis
Regression Equation (as defined in Chapter 3 of this report):
32 k
a
octk
aa1r 1
PPPkM ⎟⎟
⎠
⎞⎜⎜⎝
⎛+
τ⎟⎟⎠
⎞⎜⎜⎝
⎛ θ=
k1 = 1699.46
k2 = 0.71
k3 = 0.04
Resilient Vertical Modulus at Confining Pressure = 5 psi and Deviatoric Stress = 15 psi
Mr-v = 42.15 ksi
Measured vs. Predicted Mr-v
0
20
40
60
80
100
120
0 10 20 30 40 50 60 70 80 90 100
Measured
Pred
icte
d
Measured-Predicted Line of Equality
Figure D-1. Regression Plot of Resilient Modulus Results for Specimen #1.

102
SPECIMEN # 2
2002 Design Guide, Granular Base Resilient Modulus Mr-v, for Level I analysis
Regression Equation:
32 k
a
octk
aa1r 1
PPPkM ⎟⎟
⎠
⎞⎜⎜⎝
⎛+
τ⎟⎟⎠
⎞⎜⎜⎝
⎛ θ=
k1 = 2424.13
k2 = 1.13
k3 = -0.99
Resilient Vertical Modulus at Confining Pressure = 5 psi and Deviatoric Stress = 15 psi
Mr-v = 54.21 ksi
Measured vs. Predicted Mr-v
0
20
40
60
80
100
120
140
160
180
0 20 40 60 80 100 120 140 160
Measured
Pred
icte
d
Measured-Predicted Line of Equality
Figure D-2. Regression Plot of Resilient Modulus Results for Specimen #2.

103
SPECIMEN # 3
2002 Design Guide, Granular Base Resilient Modulus Mr-v, for Level I analysis
Regression Equation:
32 k
a
octk
aa1r 1
PPPkM ⎟⎟
⎠
⎞⎜⎜⎝
⎛+
τ⎟⎟⎠
⎞⎜⎜⎝
⎛ θ=
k1 = 2591.25
k2 = 1.02
k3 = -0.98
Resilient Vertical Modulus at Confining Pressure = 5 psi and Deviatoric Stress = 15 psi
Mr-v = 53.63 ksi
Measured vs. Predicted Mr-v
0
20
40
60
80
100
120
140
0 20 40 60 80 100 120 140
Measured
Pred
icte
d
Measured-Predicted Line of Equality
Figure D-3. Regression Plot of Resilient Modulus Results for Specimen #3.
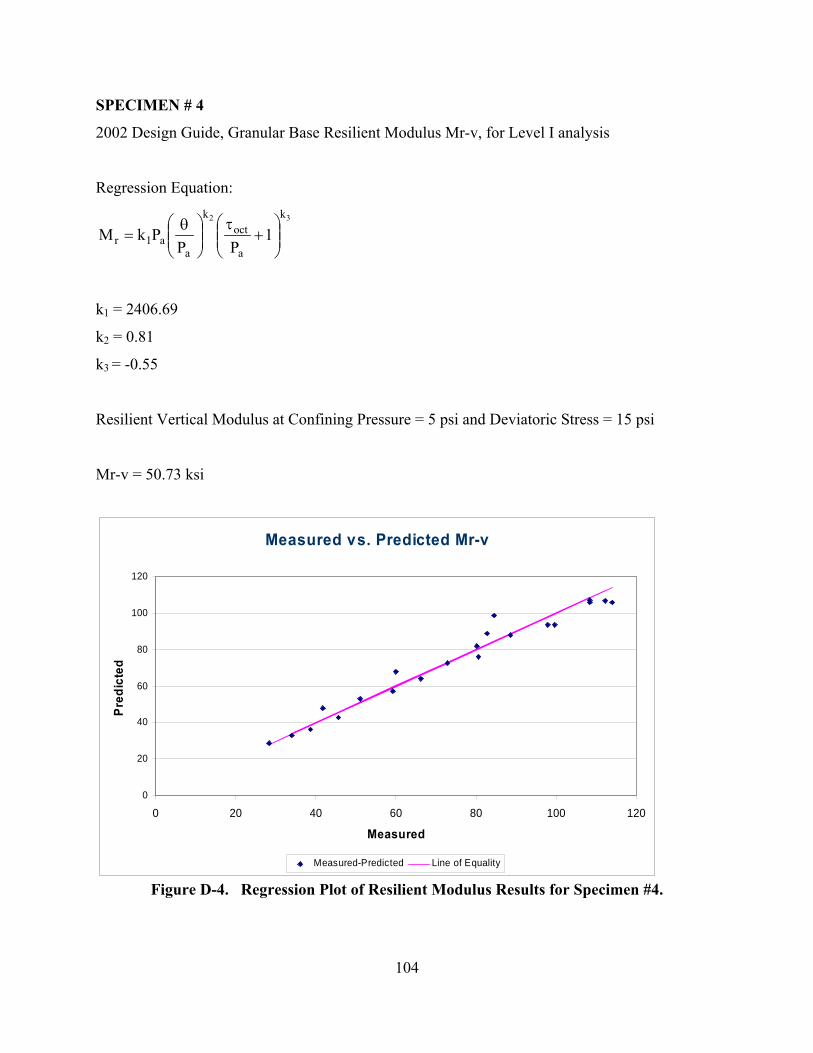
104
SPECIMEN # 4
2002 Design Guide, Granular Base Resilient Modulus Mr-v, for Level I analysis
Regression Equation:
32 k
a
octk
aa1r 1
PPPkM ⎟⎟
⎠
⎞⎜⎜⎝
⎛+
τ⎟⎟⎠
⎞⎜⎜⎝
⎛ θ=
k1 = 2406.69
k2 = 0.81
k3 = -0.55
Resilient Vertical Modulus at Confining Pressure = 5 psi and Deviatoric Stress = 15 psi
Mr-v = 50.73 ksi
Measured vs. Predicted Mr-v
0
20
40
60
80
100
120
0 20 40 60 80 100 120
Measured
Pred
icte
d
Measured-Predicted Line of Equality
Figure D-4. Regression Plot of Resilient Modulus Results for Specimen #4.

105
SPECIMEN # 5
2002 Design Guide, Granular Base Resilient Modulus Mr-v, for Level I analysis
Regression Equation:
32 k
a
octk
aa1r 1
PPPkM ⎟⎟
⎠
⎞⎜⎜⎝
⎛+
τ⎟⎟⎠
⎞⎜⎜⎝
⎛ θ=
k1 = 2321.15
k2 = 1.05
k3 = -0.83
Resilient Vertical Modulus at Confining Pressure = 5 psi and Deviatoric Stress = 15 psi Mr-v = 51.97 ksi
Measured vs. Predicted Mr-v
0
20
40
60
80
100
120
140
0 20 40 60 80 100 120 140
Measured
Pred
icte
d
Measured-Predicted Line of Equality
Figure D-5. Regression Plot of Resilient Modulus Results for Specimen #5.

106
SPECIMEN # 6
2002 Design Guide, Granular Base Resilient Modulus Mr-v, for Level I analysis
Regression Equation:
32 k
a
octk
aa1r 1
PPPkM ⎟⎟
⎠
⎞⎜⎜⎝
⎛+
τ⎟⎟⎠
⎞⎜⎜⎝
⎛ θ=
k1 = 2002.96
k2 = 0.74
k3 = -0.45
Resilient Vertical Modulus at Confining Pressure = 5 psi and Deviatoric Stress = 15 psi
Mr-v = 41.94 ksi
Measured vs. Predicted Mr-v
0
10
20
30
40
50
60
70
80
90
100
0 10 20 30 40 50 60 70 80 90 100
Measured
Pred
icte
d
Measured-Predicted Line of Equality
Figure D-6. Regression Plot of Resilient Modulus Results for Specimen #6.
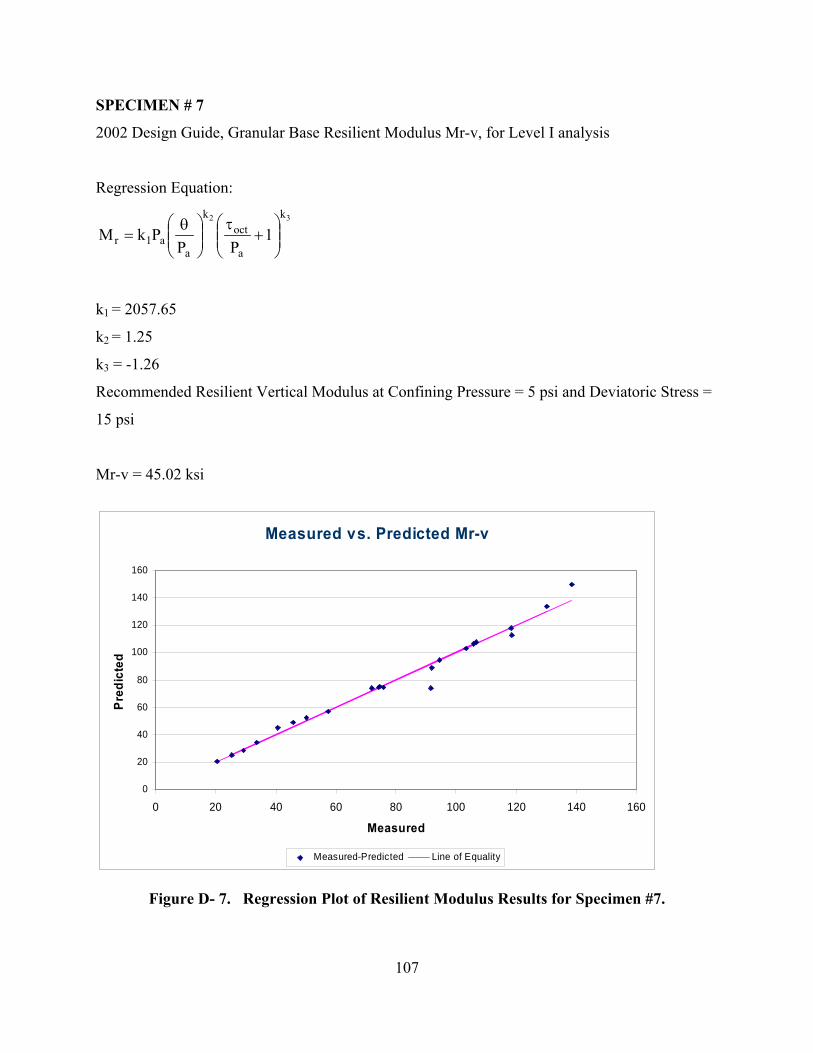
107
SPECIMEN # 7
2002 Design Guide, Granular Base Resilient Modulus Mr-v, for Level I analysis
Regression Equation:
32 k
a
octk
aa1r 1
PPPkM ⎟⎟
⎠
⎞⎜⎜⎝
⎛+
τ⎟⎟⎠
⎞⎜⎜⎝
⎛ θ=
k1 = 2057.65
k2 = 1.25
k3 = -1.26
Recommended Resilient Vertical Modulus at Confining Pressure = 5 psi and Deviatoric Stress =
15 psi
Mr-v = 45.02 ksi
Measured vs. Predicted Mr-v
0
20
40
60
80
100
120
140
160
0 20 40 60 80 100 120 140 160
Measured
Pred
icte
d
Measured-Predicted Line of Equality
Figure D- 7. Regression Plot of Resilient Modulus Results for Specimen #7.

109
APPENDIX E:
PRELIMINARY TEST RESULTS FOR GRANITE MOUNTAIN AND SAWYER PIT MATERIALS

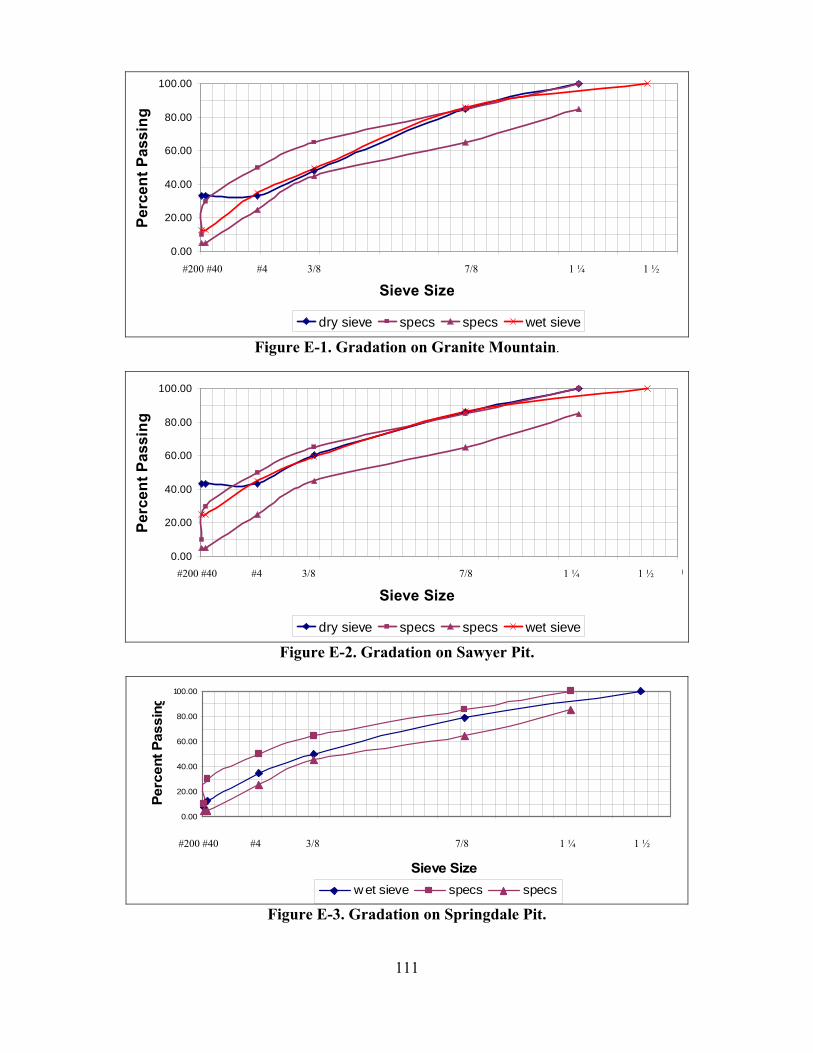
111
0.00
20.00
40.00
60.00
80.00
100.00
0 5 10 15 20 25 30 35 40
Sieve Size (mm)
Perc
ent P
assi
ng
dry sieve specs specs wet sieve
Figure E-1. Gradation on Granite Mountain.
0.00
20.00
40.00
60.00
80.00
100.00
0 5 10 15 20 25 30 35 40
Sieve Size (mm)
Perc
ent P
assi
ng
dry sieve specs specs wet sieve
Figure E-2. Gradation on Sawyer Pit.
0.00
20.00
40.00
60.00
80.00
100.00
Sieve Size
Perc
ent P
assi
ng
wet sieve specs specs
Figure E-3. Gradation on Springdale Pit.
#200 #40 #4 3/8 7/8 1 ¼ 1 ½
#200 #40 #4 3/8 7/8 1 ¼ 1 ½
#200 #40 #4 3/8 7/8 1 ¼ 1 ½

112
Wet Ball Mill (WBM) for Granite Mountain
Weight before WBM wear = 3502.5 g Sieve Analysis after WBM Wear
Sieve Individual Weight (g)
Cumulative Weight (g) Cumulative %
1 3/4 1 1/4 7/8 521.4 14.88651 5/8 946.2 27.014989 3/8 1468.2 41.91863
#4 1931 55.132049#10 2330 66.523911#20 2618.3 74.755175#40 2812.6 80.302641-40 2897 82.712348
Wet Ball Mill Value = 19.7%
Wet Ball Mill for Sawyer Pit Weight before WBM wear = 3504.7 g Sieve Analysis after WBM Wear
Sieve Individual Weight (g)
Cumulative Weight (g) Cumulative %
1 3/4 1 1/4 7/8 102.7 2.930351 5/8 497.7 14.20093 3/8 785 22.39849
#4 1133 32.32802#10 1487.3 42.4373#20 1934 55.18304#40 2140.7 61.08083-40 2226.8 63.53754
2270.4 64.78158 Wet Ball Mill Value = 36.5%

113
APPENDIX F:
TUBE SUCTION TEST RESULTS


TUBE SUCTION TESTData Analysis Report Batch Date:
Base Cap Mass (g) 62 Wet Total Mass (g) 10675 Optimum Moisture Content (%) 7.0Triaxial Cell Mass (g) 2166 Wet Soil Mass (g) 8447 Actual Compaction Moisture (%) 6.3Sample Diameter (in) 6.00 Dry Soil Mass (g) 7947 Maximum Dry Density (lb/ft 3̂) 137.4Sample Height (in) 8.00 Actual Dry Density (lb/ft^3) 133.8Sample Volume (ft 3̂) 0.131 Relative Density (%) 97.4
Time (hr) 0.0 46.2 60.2 95.7 166.4 181.0 214.7 238.5 262.9 324.0Total Mass (g) 10446 10605 10613 10618 10622 10618 10620 10620 10623 10626Soil Mass (g) 8218 8377 8385 8390 8394 8390 8392 8392 8395 8398Moisture (%) 3.4 5.4 5.5 5.6 5.6 5.6 5.6 5.6 5.6 5.7
No. 1 4.5 5.1 7.3 7.1 6.9 6.7 6.8 6.5 6.6 6.5No. 2 3.6 4.9 4.5 4.9 5.7 4.7 5.2 5.7 5.6 5.7No. 3 3.2 4.8 5.2 5.4 5.2 5.4 3.6 5.5 5.1 5.0No. 4 4.0 5.0 6.0 6.3 5.4 5.2 5.1 5.6 5.4 5.4
Average 3.8 5.0 5.8 5.9 5.8 5.5 5.2 5.8 5.7 5.7
Dielectric Values
SAMPLE TESTING
SPECIMEN 1: Granite MountainJuly 5, 2004
SAMPLE PREPARATION
Dielectric Value Vs Time
0.0
1.0
2.0
3.0
4.0
5.0
6.0
7.0
0.0 50.0 100.0 150.0 200.0 250.0
Time (hr)
Die
lect
ric
Valu
e
Moisture Content Vs Time
0.0
1.0
2.0
3.0
4.0
5.0
6.0
0.0 50.0 100.0 150.0 200.0 250.0 300.0 350.0
Time (hr)
Moi
stur
e C
onte
nt (%
)
115

TUBE SUCTION TESTData Analysis Report Batch Date:
Base Cap Mass (g) 62 Wet Total Mass (g) 10811 Optimum Moisture Content (%) 7.0Triaxial Cell Mass (g) 2085 Wet Soil Mass (g) 8664 Actual Compaction Moisture (%) 7.7Sample Diameter (in) 6.00 Dry Soil Mass (g) 8047 Maximum Dry Density (lb/ft 3̂) 137.4Sample Height (in) 7.90 Actual Dry Density (lb/ft^3) 137.2Sample Volume (ft 3̂) 0.129 Relative Density (%) 99.9
Time (hr) 0.0 46.2 60.2 95.7 166.4 181.0 214.7 238.5 262.9 324.0Total Mass (g) 10438 10665 10709 10718 10724 10721 10722 10720 10725 10729Soil Mass (g) 8291 8518 8562 8571 8577 8574 8575 8573 8578 8582Moisture (%) 3.0 5.8 6.4 6.5 6.6 6.5 6.6 6.5 6.6 6.6
No. 1 4.1 5.9 5.9 5.8 5.1 5.9 5.8 6.0 5.7 5.4No. 2 3.0 5.0 5.2 5.4 5.1 5.4 5.0 5.2 5.3 5.1No. 3 3.0 4.9 5.9 5.3 4.9 6.2 5.3 5.3 5.5 5.3No. 4 3.9 5.5 5.5 5.8 5.6 4.7 5.9 5.4 5.1 5.4
Average 3.5 5.3 5.6 5.6 5.2 5.6 5.5 5.5 5.4 5.3
Dielectric Values
SAMPLE TESTING
SPECIMEN 2: Granite MountainJuly 5, 2004
SAMPLE PREPARATION
Dielectric Value Vs Time
0.0
1.0
2.0
3.0
4.0
5.0
6.0
0.0 50.0 100.0 150.0 200.0 250.0
Time (hr)
Die
lect
ric
Valu
e
Moisture Content Vs Time
0.0
1.0
2.0
3.0
4.0
5.0
6.0
7.0
0.0 50.0 100.0 150.0 200.0 250.0 300.0 350.0
Time (hr)
Moi
stur
e C
onte
nt (%
)
116

TUBE SUCTION TESTData Analysis Report Batch Date:
Time (hr) 0.0 46.2 60.2 95.7 166.4 181.0 214.7 238.5 262.9 324.0
Specimen No1 3.8 5.0 5.8 5.9 5.8 5.5 5.2 5.8 5.7 5.72 3.5 5.3 5.6 5.6 5.2 5.6 5.5 5.5 5.4 5.3
Specimen No1 3.4 5.4 5.5 5.6 5.6 5.6 5.6 5.6 5.6 5.72 3.0 5.8 6.4 6.5 6.6 6.5 6.6 6.5 6.6 6.6
Average Final Dielectric Value 5.5 Average Final Gravimetric Water Content (%) 6.2Moisture Susceptibility Ranking Average Water Loss in Drying (% of OMC) 54.0
SUMMARY:July 5, 2004
Granite Mountain
Good
Average Dielectric Value
SAMPLE TESTING
Average Water Content During Soaking (%)
Dielectric Value vs. Time
0.0
1.0
2.0
3.0
4.0
5.0
6.0
7.0
0.0 50.0 100.0 150.0 200.0 250.0
Time (hr)
Diel
ectri
c V
alue
Series1 Series2
Moisture Content Vs Time
0.0
1.0
2.0
3.0
4.0
5.0
6.0
7.0
0.0 50.0 100.0 150.0 200.0 250.0 300.0 350.0
Time (hr)
Moi
stur
e C
onte
nt (%
)
Series1 Series2
117
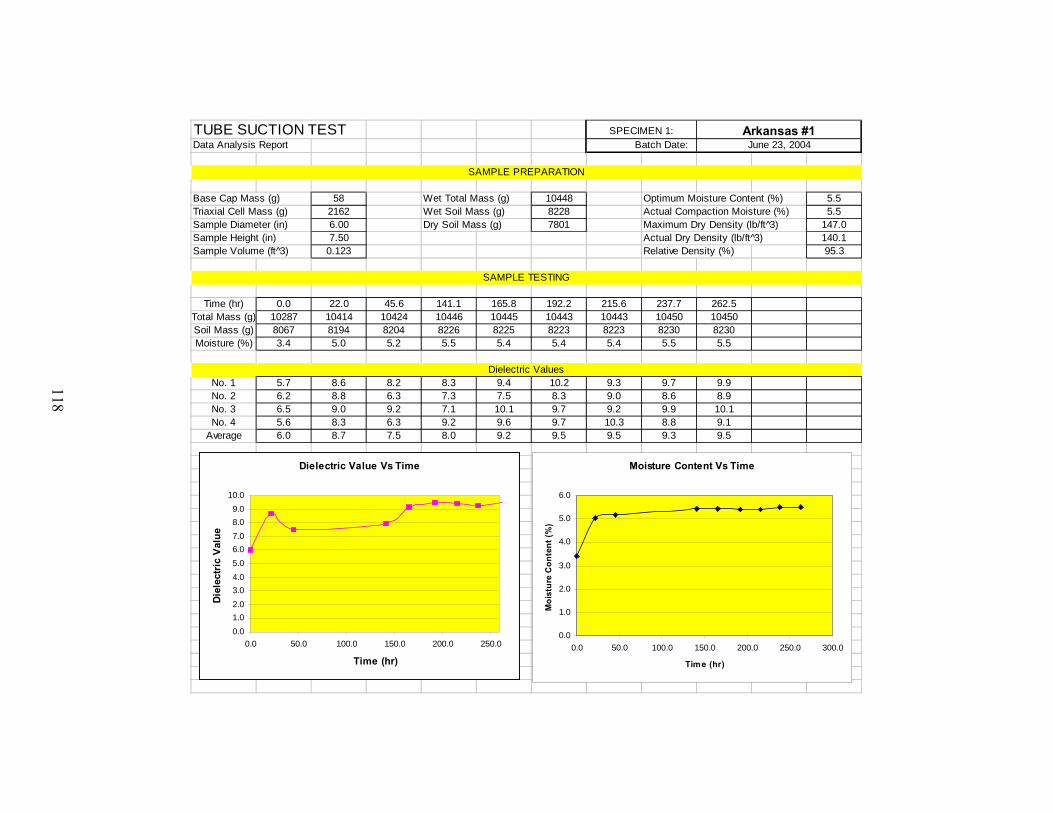
TUBE SUCTION TESTData Analysis Report Batch Date:
Base Cap Mass (g) 58 Wet Total Mass (g) 10448 Optimum Moisture Content (%) 5.5Triaxial Cell Mass (g) 2162 Wet Soil Mass (g) 8228 Actual Compaction Moisture (%) 5.5Sample Diameter (in) 6.00 Dry Soil Mass (g) 7801 Maximum Dry Density (lb/ft 3̂) 147.0Sample Height (in) 7.50 Actual Dry Density (lb/ft^3) 140.1Sample Volume (ft 3̂) 0.123 Relative Density (%) 95.3
Time (hr) 0.0 22.0 45.6 141.1 165.8 192.2 215.6 237.7 262.5Total Mass (g) 10287 10414 10424 10446 10445 10443 10443 10450 10450Soil Mass (g) 8067 8194 8204 8226 8225 8223 8223 8230 8230Moisture (%) 3.4 5.0 5.2 5.5 5.4 5.4 5.4 5.5 5.5
No. 1 5.7 8.6 8.2 8.3 9.4 10.2 9.3 9.7 9.9No. 2 6.2 8.8 6.3 7.3 7.5 8.3 9.0 8.6 8.9No. 3 6.5 9.0 9.2 7.1 10.1 9.7 9.2 9.9 10.1No. 4 5.6 8.3 6.3 9.2 9.6 9.7 10.3 8.8 9.1
Average 6.0 8.7 7.5 8.0 9.2 9.5 9.5 9.3 9.5
Dielectric Values
SAMPLE TESTING
SPECIMEN 1: Arkansas #1June 23, 2004
SAMPLE PREPARATION
Dielectric Value Vs Time
0.01.02.03.04.05.06.07.08.09.0
10.0
0.0 50.0 100.0 150.0 200.0 250.0
Time (hr)
Die
lect
ric
Valu
e
Moisture Content Vs Time
0.0
1.0
2.0
3.0
4.0
5.0
6.0
0.0 50.0 100.0 150.0 200.0 250.0 300.0
Time (hr)
Moi
stur
e C
onte
nt (%
)
118

TUBE SUCTION TESTData Analysis Report Batch Date:
Base Cap Mass (g) 65 Wet Total Mass (g) 10439 Optimum Moisture Content (%) 5.5Triaxial Cell Mass (g) 2121 Wet Soil Mass (g) 8253 Actual Compaction Moisture (%) 5.1Sample Diameter (in) 6.00 Dry Soil Mass (g) 7851 Maximum Dry Density (lb/ft 3̂) 147.0Sample Height (in) 7.40 Actual Dry Density (lb/ft^3) 143.0Sample Volume (ft 3̂) 0.121 Relative Density (%) 97.2
Time (hr) 0.0 22.0 45.6 141.1 165.8 192.2 215.6 237.7 262.5Total Mass (g) 10276 10384 10397 10420 10418 10407 10408 10409 10406Soil Mass (g) 8090 8198 8211 8234 8232 8221 8222 8223 8220Moisture (%) 3.0 4.4 4.6 4.9 4.8 4.7 4.7 4.7 4.7
No. 1 6.4 9.6 8.2 7.1 12.8 13.0 12.7 9.9 13.5No. 2 9.1 13.1 6.8 7.8 9.7 10.9 10.3 8.0 10.4No. 3 5.6 7.0 13.0 12.0 8.0 8.1 8.1 13.2 8.2No. 4 7.6 10.8 6.4 6.6 7.4 7.2 8.0 7.8 8.1
Average 7.2 10.1 8.6 8.4 9.5 9.8 9.8 9.7 10.1
Dielectric Values
SAMPLE TESTING
SPECIMEN 2: Arkansas #1June 23, 2004
SAMPLE PREPARATION
Dielectric Value Vs Time
0.0
2.0
4.0
6.0
8.0
10.0
12.0
0.0 50.0 100.0 150.0 200.0 250.0
Time (hr)
Die
lect
ric
Valu
e
Moisture Content Vs Time
0.0
1.0
2.0
3.0
4.0
5.0
6.0
0.0 50.0 100.0 150.0 200.0 250.0 300.0
Time (hr)
Moi
stur
e C
onte
nt (%
)
119

TUBE SUCTION TESTData Analysis Report Batch Date:
Time (hr) 0.0 22.0 45.6 141.1 165.8 192.2 215.6 237.7 262.5
Specimen No1 6.0 8.7 7.5 8.0 9.2 9.5 9.5 9.3 9.52 7.2 10.1 8.6 8.4 9.5 9.8 9.8 9.7 10.1
Specimen No1 3.4 5.0 5.2 5.5 5.4 5.4 5.4 5.5 5.52 3.0 4.4 4.6 4.9 4.8 4.7 4.7 4.7 4.7
Average Final Dielectric Value 9.8 Average Final Gravimetric Water Content (%) 0.0Moisture Susceptibility Ranking Average Water Loss in Drying (% of OMC) 41.5
SUMMARY:June 23, 2004
Arkansas #1
Good
Average Dielectric Value
SAMPLE TESTING
Average Water Content During Soaking (%)
Dielectric Value vs. Time
0.0
2.0
4.0
6.0
8.0
10.0
12.0
0.0 50.0 100.0 150.0 200.0 250.0
Time (hr)
Diel
ectri
c V
alue
Series1 Series2
Moisture Content Vs Time
0.0
1.0
2.0
3.0
4.0
5.0
6.0
0.0 50.0 100.0 150.0 200.0 250.0 300.0
Time (hr)
Moi
stur
e C
onte
nt (%
)
Series1 Series2
120
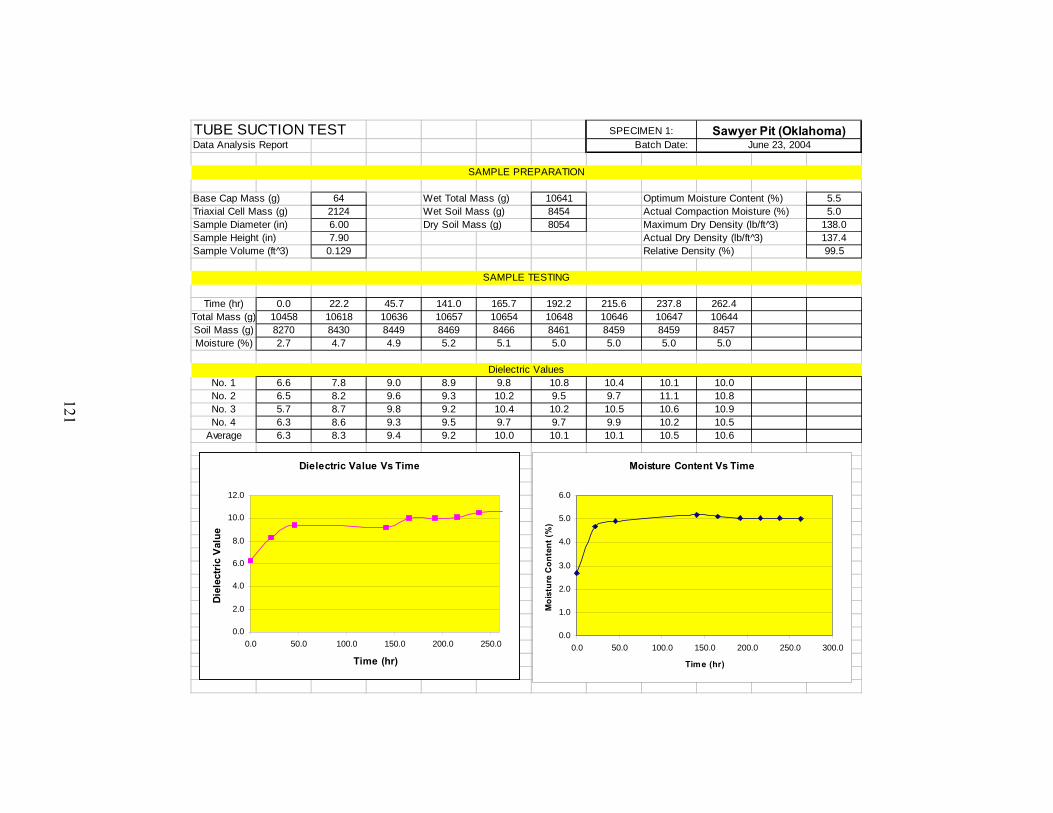
TUBE SUCTION TESTData Analysis Report Batch Date:
Base Cap Mass (g) 64 Wet Total Mass (g) 10641 Optimum Moisture Content (%) 5.5Triaxial Cell Mass (g) 2124 Wet Soil Mass (g) 8454 Actual Compaction Moisture (%) 5.0Sample Diameter (in) 6.00 Dry Soil Mass (g) 8054 Maximum Dry Density (lb/ft 3̂) 138.0Sample Height (in) 7.90 Actual Dry Density (lb/ft^3) 137.4Sample Volume (ft 3̂) 0.129 Relative Density (%) 99.5
Time (hr) 0.0 22.2 45.7 141.0 165.7 192.2 215.6 237.8 262.4Total Mass (g) 10458 10618 10636 10657 10654 10648 10646 10647 10644Soil Mass (g) 8270 8430 8449 8469 8466 8461 8459 8459 8457Moisture (%) 2.7 4.7 4.9 5.2 5.1 5.0 5.0 5.0 5.0
No. 1 6.6 7.8 9.0 8.9 9.8 10.8 10.4 10.1 10.0No. 2 6.5 8.2 9.6 9.3 10.2 9.5 9.7 11.1 10.8No. 3 5.7 8.7 9.8 9.2 10.4 10.2 10.5 10.6 10.9No. 4 6.3 8.6 9.3 9.5 9.7 9.7 9.9 10.2 10.5
Average 6.3 8.3 9.4 9.2 10.0 10.1 10.1 10.5 10.6
Dielectric Values
SAMPLE TESTING
SPECIMEN 1: Sawyer Pit (Oklahoma)June 23, 2004
SAMPLE PREPARATION
Dielectric Value Vs Time
0.0
2.0
4.0
6.0
8.0
10.0
12.0
0.0 50.0 100.0 150.0 200.0 250.0
Time (hr)
Die
lect
ric
Valu
e
Moisture Content Vs Time
0.0
1.0
2.0
3.0
4.0
5.0
6.0
0.0 50.0 100.0 150.0 200.0 250.0 300.0
Time (hr)
Moi
stur
e C
onte
nt (%
)
121

TUBE SUCTION TESTData Analysis Report Batch Date:
Base Cap Mass (g) 62 Wet Total Mass (g) 10765 Optimum Moisture Content (%) 5.5Triaxial Cell Mass (g) 2184 Wet Soil Mass (g) 8519 Actual Compaction Moisture (%) 6.1Sample Diameter (in) 6.00 Dry Soil Mass (g) 8027 Maximum Dry Density (lb/ft 3̂) 138.0Sample Height (in) 7.90 Actual Dry Density (lb/ft^3) 136.9Sample Volume (ft 3̂) 0.129 Relative Density (%) 99.2
Time (hr) 0.0 22.2 45.7 141.0 165.7 192.2 215.6 237.8 262.4Total Mass (g) 10481 10667 10690 10710 10710 10708 10707 10711 10709Soil Mass (g) 8235 8421 8444 8464 8464 8462 8461 8465 8463Moisture (%) 2.6 4.9 5.2 5.4 5.4 5.4 5.4 5.5 5.4
No. 1 6.2 7.4 9.0 9.1 9.8 10.0 10.0 10.2 10.5No. 2 5.7 7.0 8.1 9.0 9.6 9.1 9.9 9.6 10.2No. 3 6.2 6.7 7.9 8.5 10.2 9.4 10.4 10.3 10.7No. 4 6.1 8.0 8.5 8.8 9.4 10.1 10.3 10.2 10.4
Average 6.1 7.3 8.4 8.9 9.8 9.7 10.2 10.1 10.5
Dielectric Values
SAMPLE TESTING
SPECIMEN 2: Sawyer Pit (Oklahoma)June 23, 2004
SAMPLE PREPARATION
Dielectric Value Vs Time
0.0
2.0
4.0
6.0
8.0
10.0
12.0
0.0 50.0 100.0 150.0 200.0 250.0
Time (hr)
Die
lect
ric
Valu
e
Moisture Content Vs Time
0.0
1.0
2.0
3.0
4.0
5.0
6.0
0.0 50.0 100.0 150.0 200.0 250.0 300.0
Time (hr)
Moi
stur
e C
onte
nt (%
)
122

TUBE SUCTION TESTData Analysis Report Batch Date:
Time (hr) 0.0 22.2 45.7 141.0 165.7 192.2 215.6 237.8 262.4
Specimen No1 6.3 8.3 9.4 9.2 10.0 10.1 10.1 10.5 10.62 6.1 7.3 8.4 8.9 9.8 9.7 10.2 10.1 10.5
Specimen No1 2.7 4.7 4.9 5.2 5.1 5.0 5.0 5.0 5.02 2.6 4.9 5.2 5.4 5.4 5.4 5.4 5.5 5.4
Average Final Dielectric Value 10.5 Average Final Gravimetric Water Content (%) 5.2Moisture Susceptibility Ranking Average Water Loss in Drying (% of OMC) 52.1
SUMMARY:June 23, 2004
Sawyer Pit (Oklahoma)
Good
Average Dielectric Value
SAMPLE TESTING
Average Water Content During Soaking (%)
Dielectric Value vs. Time
0.0
2.0
4.0
6.0
8.0
10.0
12.0
0.0 50.0 100.0 150.0 200.0 250.0
Time (hr)
Diel
ectri
c V
alue
Series1 Series2
Moisture Content Vs Time
0.0
1.0
2.0
3.0
4.0
5.0
6.0
0.0 50.0 100.0 150.0 200.0 250.0 300.0
Time (hr)
Moi
stur
e C
onte
nt (%
)
Series1 Series2
123

125
APPENDIX G:
RESILIENT MODULUS AND PERMANENT DEFORMATION TEST RESULTS

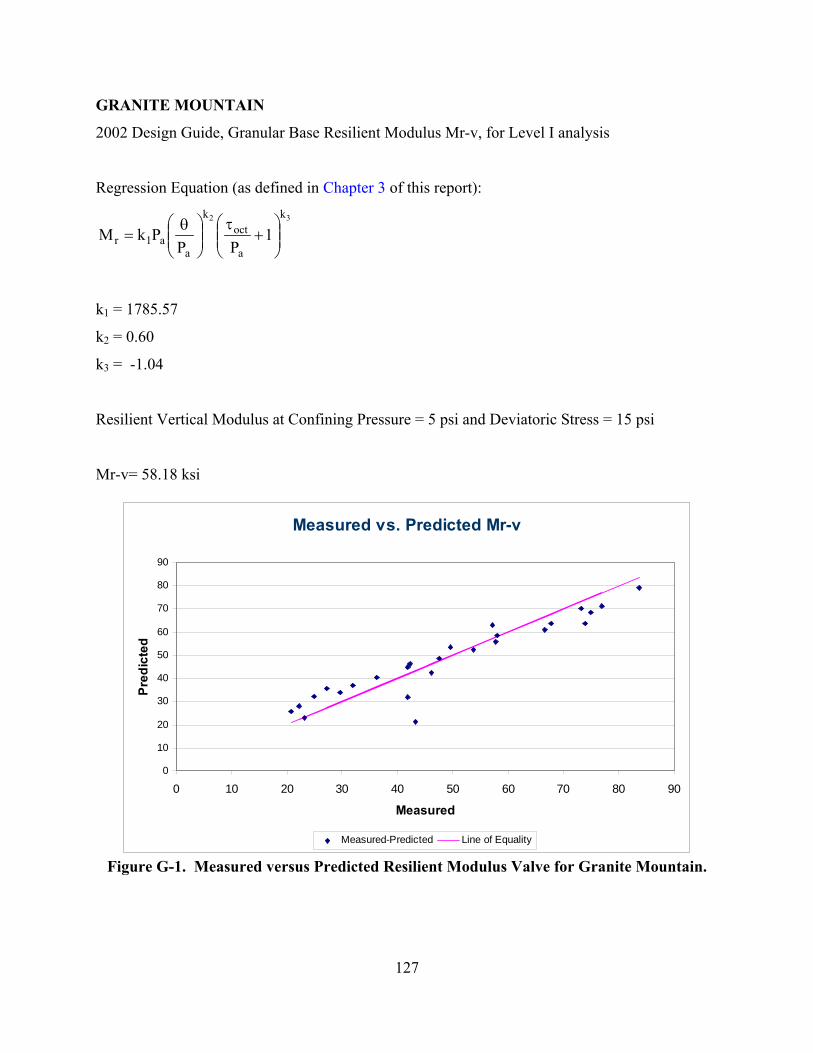
127
GRANITE MOUNTAIN
2002 Design Guide, Granular Base Resilient Modulus Mr-v, for Level I analysis
Regression Equation (as defined in Chapter 3 of this report):
32 k
a
octk
aa1r 1
PPPkM ⎟⎟
⎠
⎞⎜⎜⎝
⎛+
τ⎟⎟⎠
⎞⎜⎜⎝
⎛ θ=
k1 = 1785.57
k2 = 0.60
k3 = -1.04
Resilient Vertical Modulus at Confining Pressure = 5 psi and Deviatoric Stress = 15 psi
Mr-v= 58.18 ksi
Measured vs. Predicted Mr-v
0
10
20
30
40
50
60
70
80
90
0 10 20 30 40 50 60 70 80 90
Measured
Pred
icte
d
Measured-Predicted Line of Equality
Figure G-1. Measured versus Predicted Resilient Modulus Valve for Granite Mountain.

128
SPRINGDALE
2002 Design Guide, Granular Base Resilient Modulus Mr-v, for Level I analysis
Regression Equation:
32 k
a
octk
aa1r 1
PPPkM ⎟⎟
⎠
⎞⎜⎜⎝
⎛+
τ⎟⎟⎠
⎞⎜⎜⎝
⎛ θ=
k1 = 2903.52
k2 = 1.01
k3 = -0.24
Resilient Vertical Modulus at Confining Pressure = 5 psi and Deviatoric Stress = 15 psi
Mr-v= 36.66 ksi
Measured vs. Predicted Mr-v
0
20
40
60
80
100
120
140
160
0 20 40 60 80 100 120 140
Measured
Pred
icte
d
Measured-Predicted Line of Equality
Figure G-2. Measured versus Predicted Resilient Modulus Valve for Springdale.

129
SAWYER PIT
2002 Design Guide, Granular Base Resilient Modulus Mr-v, for Level I analysis
Regression Equation:
32 k
a
octk
aa1r 1
PPPkM ⎟⎟
⎠
⎞⎜⎜⎝
⎛+
τ⎟⎟⎠
⎞⎜⎜⎝
⎛ θ=
k1 = 1525.34
k2 = 0.64
k3 = -0.34
Resilient Vertical Modulus at Confining Pressure = 5 psi and Deviator Stress = 15 psi
Mr-v= 31.11 ksi
Measured vs. Predicted Mr-v
010203040506070
0 10 20 30 40 50 60 70
Measured
Pred
icte
d
Measured-Predicted Line of Equality
Figure G-3. Measured versus Predicted Resilient Modulus Valve for Sawyer Pit.

Permanent Deformation Test Result for Springdale Material
500th cycle's resilient strain = 0.000407, Mr = 68.73 ksi Alpha = 0.920 Mu = 2.131
y = 0.0107x0.0977
0
0.005
0.01
0.015
0.02
0.025
0.03
0 2000 4000 6000 8000 10000 12000
Number of Load Repetitions
Perm
anen
t Str
ain
V-LVDT1 V-LVDT2 Ave.V-LVDTs Ave.V-LVDTs from 500 Regression-Ave.
130