Heavy-duty Diesel Engine NOX Reduction with Nitrogen ... · Final Report: Heavy-duty Diesel Engine...
69
Final Report: Heavy-duty Diesel Engine NO X Reduction with Nitrogen-Enriched Combustion Air Contract # 02-VTCE-GS-009 As a CRADA Program with Mack Truck Principal Investigator: Steve McConnell Research Engineer Center for Transportation Research Argonne National Laboratory DOE monitor Gurpreet Singh Program Office OHVT
-
Upload
truongduong -
Category
Documents
-
view
219 -
download
0
Transcript of Heavy-duty Diesel Engine NOX Reduction with Nitrogen ... · Final Report: Heavy-duty Diesel Engine...
Final Report:
Heavy-duty Diesel Engine NOX Reduction with Nitrogen-Enriched Combustion Air
Contract # 02-VTCE-GS-009
As a CRADA Program with Mack Truck
Principal Investigator: Steve McConnell
Research Engineer Center for Transportation Research
Argonne National Laboratory
DOE monitor Gurpreet Singh Program Office OHVT
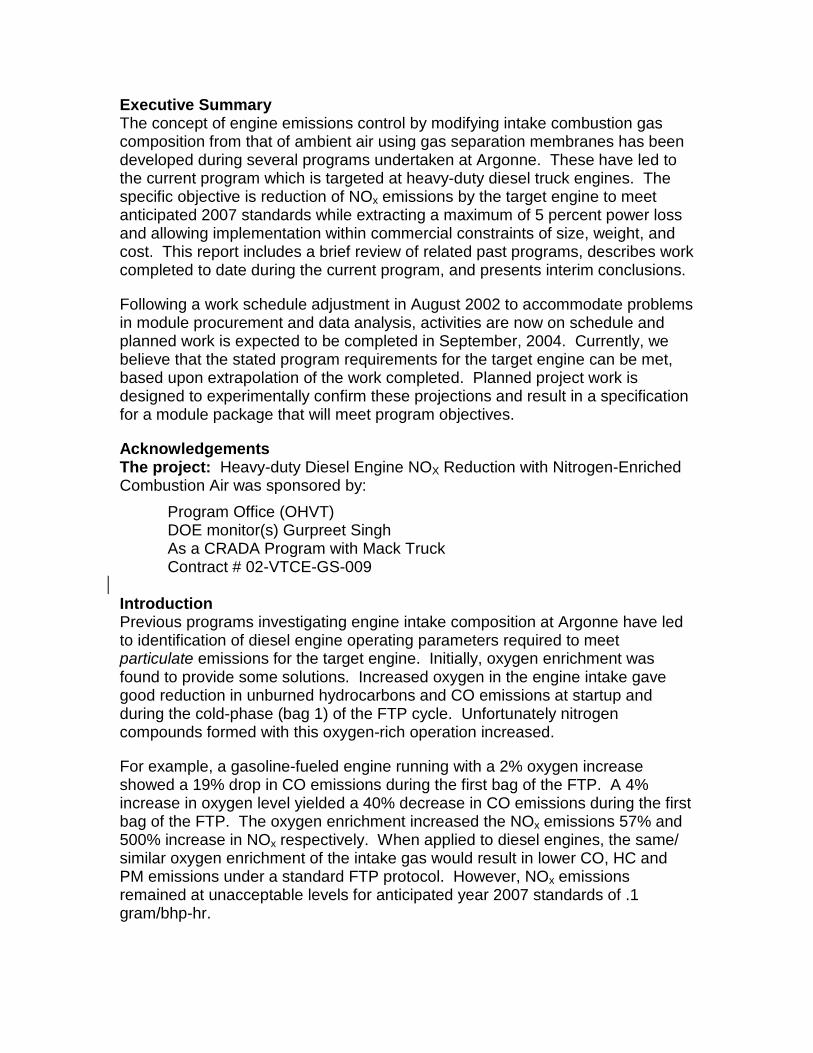
Executive Summary The concept of engine emissions control by modifying intake combustion gas composition from that of ambient air using gas separation membranes has been developed during several programs undertaken at Argonne. These have led to the current program which is targeted at heavy-duty diesel truck engines. The specific objective is reduction of NOx emissions by the target engine to meet anticipated 2007 standards while extracting a maximum of 5 percent power loss and allowing implementation within commercial constraints of size, weight, and cost. This report includes a brief review of related past programs, describes work completed to date during the current program, and presents interim conclusions.
Following a work schedule adjustment in August 2002 to accommodate problems in module procurement and data analysis, activities are now on schedule and planned work is expected to be completed in September, 2004. Currently, we believe that the stated program requirements for the target engine can be met, based upon extrapolation of the work completed. Planned project work is designed to experimentally confirm these projections and result in a specification for a module package that will meet program objectives.
Acknowledgements The project: Heavy-duty Diesel Engine NOX Reduction with Nitrogen-Enriched Combustion Air was sponsored by:
Program Office (OHVT) DOE monitor(s) Gurpreet Singh As a CRADA Program with Mack Truck Contract # 02-VTCE-GS-009
Introduction Previous programs investigating engine intake composition at Argonne have led to identification of diesel engine operating parameters required to meet particulate emissions for the target engine. Initially, oxygen enrichment was found to provide some solutions. Increased oxygen in the engine intake gave good reduction in unburned hydrocarbons and CO emissions at startup and during the cold-phase (bag 1) of the FTP cycle. Unfortunately nitrogen compounds formed with this oxygen-rich operation increased.
For example, a gasoline-fueled engine running with a 2% oxygen increase showed a 19% drop in CO emissions during the first bag of the FTP. A 4% increase in oxygen level yielded a 40% decrease in CO emissions during the first bag of the FTP. The oxygen enrichment increased the NOx emissions 57% and 500% increase in NOx respectively. When applied to diesel engines, the same/ similar oxygen enrichment of the intake gas would result in lower CO, HC and PM emissions under a standard FTP protocol. However, NOx emissions remained at unacceptable levels for anticipated year 2007 standards of .1 gram/bhp-hr.
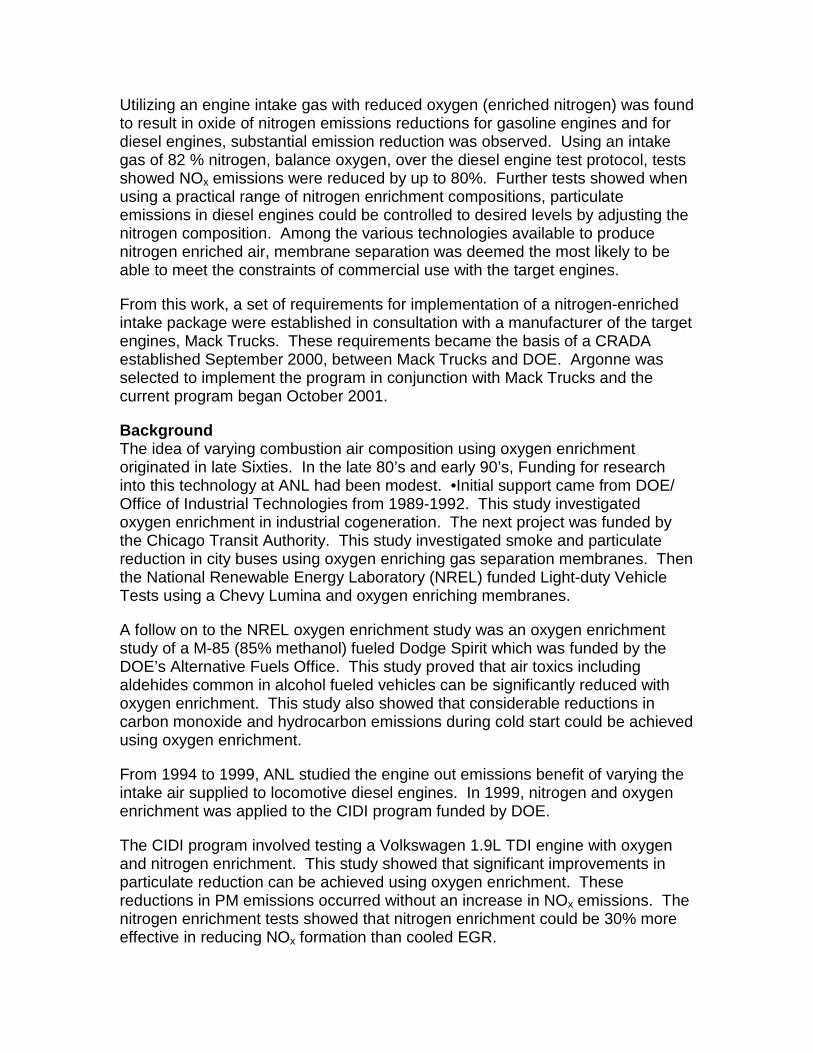
Utilizing an engine intake gas with reduced oxygen (enriched nitrogen) was found to result in oxide of nitrogen emissions reductions for gasoline engines and for diesel engines, substantial emission reduction was observed. Using an intake gas of 82 % nitrogen, balance oxygen, over the diesel engine test protocol, tests showed NOx emissions were reduced by up to 80%. Further tests showed when using a practical range of nitrogen enrichment compositions, particulate emissions in diesel engines could be controlled to desired levels by adjusting the nitrogen composition. Among the various technologies available to produce nitrogen enriched air, membrane separation was deemed the most likely to be able to meet the constraints of commercial use with the target engines.
From this work, a set of requirements for implementation of a nitrogen-enriched intake package were established in consultation with a manufacturer of the target engines, Mack Trucks. These requirements became the basis of a CRADA established September 2000, between Mack Trucks and DOE. Argonne was selected to implement the program in conjunction with Mack Trucks and the current program began October 2001.
Background The idea of varying combustion air composition using oxygen enrichment originated in late Sixties. In the late 80’s and early 90’s, Funding for research into this technology at ANL had been modest. •Initial support came from DOE/ Office of Industrial Technologies from 1989-1992. This study investigated oxygen enrichment in industrial cogeneration. The next project was funded by the Chicago Transit Authority. This study investigated smoke and particulate reduction in city buses using oxygen enriching gas separation membranes. Then the National Renewable Energy Laboratory (NREL) funded Light-duty Vehicle Tests using a Chevy Lumina and oxygen enriching membranes.
A follow on to the NREL oxygen enrichment study was an oxygen enrichment study of a M-85 (85% methanol) fueled Dodge Spirit which was funded by the DOE’s Alternative Fuels Office. This study proved that air toxics including aldehides common in alcohol fueled vehicles can be significantly reduced with oxygen enrichment. This study also showed that considerable reductions in carbon monoxide and hydrocarbon emissions during cold start could be achieved using oxygen enrichment.
From 1994 to 1999, ANL studied the engine out emissions benefit of varying the intake air supplied to locomotive diesel engines. In 1999, nitrogen and oxygen enrichment was applied to the CIDI program funded by DOE.
The CIDI program involved testing a Volkswagen 1.9L TDI engine with oxygen and nitrogen enrichment. This study showed that significant improvements in particulate reduction can be achieved using oxygen enrichment. These reductions in PM emissions occurred without an increase in NOx emissions. The nitrogen enrichment tests showed that nitrogen enrichment could be 30% more effective in reducing NOx formation than cooled EGR.
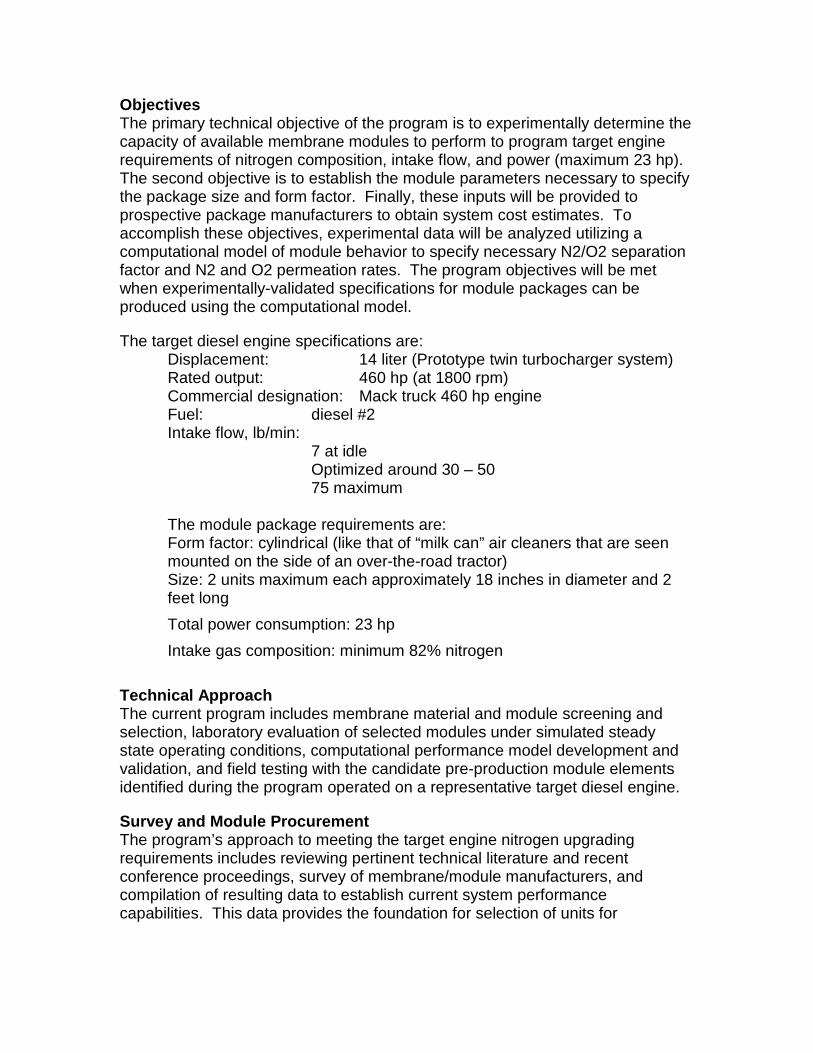
Objectives The primary technical objective of the program is to experimentally determine the capacity of available membrane modules to perform to program target engine requirements of nitrogen composition, intake flow, and power (maximum 23 hp). The second objective is to establish the module parameters necessary to specify the package size and form factor. Finally, these inputs will be provided to prospective package manufacturers to obtain system cost estimates. To accomplish these objectives, experimental data will be analyzed utilizing a computational model of module behavior to specify necessary N2/O2 separation factor and N2 and O2 permeation rates. The program objectives will be met when experimentally-validated specifications for module packages can be produced using the computational model.
The target diesel engine specifications are: Displacement: 14 liter (Prototype twin turbocharger system) Rated output: 460 hp (at 1800 rpm) Commercial designation: Mack truck 460 hp engine Fuel: diesel #2 Intake flow, lb/min: 7 at idle Optimized around 30 – 50 75 maximum The module package requirements are: Form factor: cylindrical (like that of “milk can” air cleaners that are seen mounted on the side of an over-the-road tractor) Size: 2 units maximum each approximately 18 inches in diameter and 2 feet long Total power consumption: 23 hp Intake gas composition: minimum 82% nitrogen
Technical Approach The current program includes membrane material and module screening and selection, laboratory evaluation of selected modules under simulated steady state operating conditions, computational performance model development and validation, and field testing with the candidate pre-production module elements identified during the program operated on a representative target diesel engine.
Survey and Module Procurement The program’s approach to meeting the target engine nitrogen upgrading requirements includes reviewing pertinent technical literature and recent conference proceedings, survey of membrane/module manufacturers, and compilation of resulting data to establish current system performance capabilities. This data provides the foundation for selection of units for
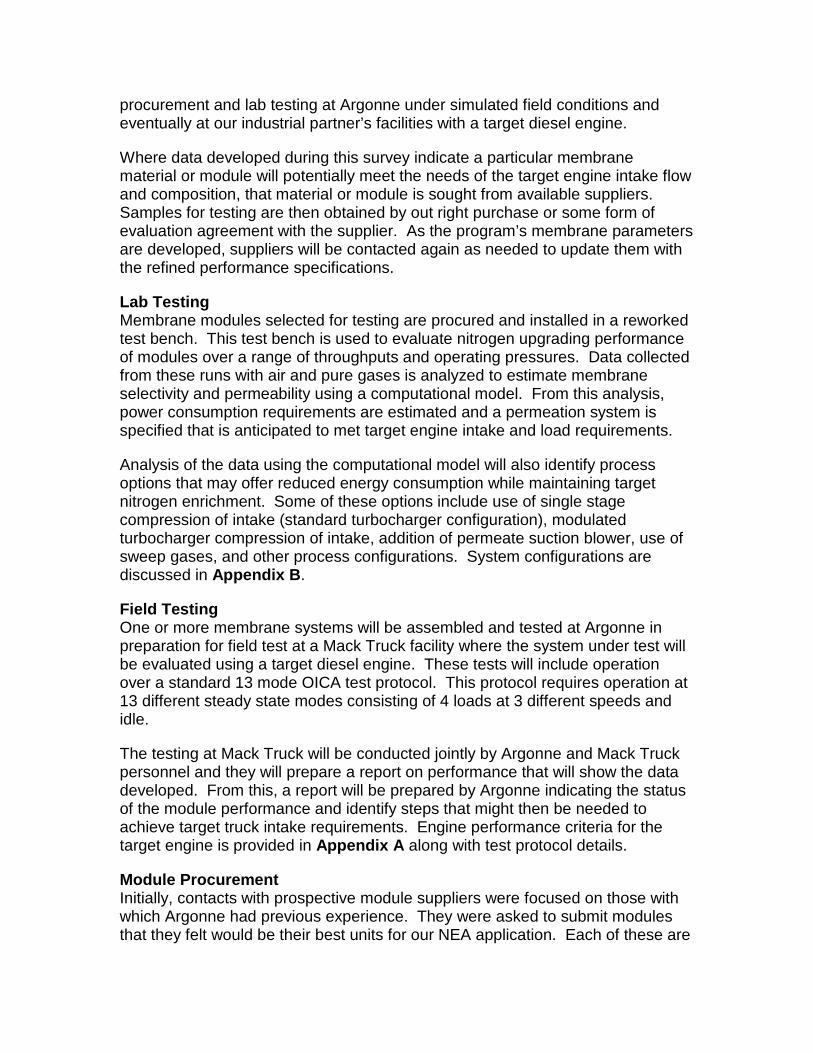
procurement and lab testing at Argonne under simulated field conditions and eventually at our industrial partner’s facilities with a target diesel engine.
Where data developed during this survey indicate a particular membrane material or module will potentially meet the needs of the target engine intake flow and composition, that material or module is sought from available suppliers. Samples for testing are then obtained by out right purchase or some form of evaluation agreement with the supplier. As the program’s membrane parameters are developed, suppliers will be contacted again as needed to update them with the refined performance specifications.
Lab Testing Membrane modules selected for testing are procured and installed in a reworked test bench. This test bench is used to evaluate nitrogen upgrading performance of modules over a range of throughputs and operating pressures. Data collected from these runs with air and pure gases is analyzed to estimate membrane selectivity and permeability using a computational model. From this analysis, power consumption requirements are estimated and a permeation system is specified that is anticipated to met target engine intake and load requirements.
Analysis of the data using the computational model will also identify process options that may offer reduced energy consumption while maintaining target nitrogen enrichment. Some of these options include use of single stage compression of intake (standard turbocharger configuration), modulated turbocharger compression of intake, addition of permeate suction blower, use of sweep gases, and other process configurations. System configurations are discussed in Appendix B.
Field Testing One or more membrane systems will be assembled and tested at Argonne in preparation for field test at a Mack Truck facility where the system under test will be evaluated using a target diesel engine. These tests will include operation over a standard 13 mode OICA test protocol. This protocol requires operation at 13 different steady state modes consisting of 4 loads at 3 different speeds and idle.
The testing at Mack Truck will be conducted jointly by Argonne and Mack Truck personnel and they will prepare a report on performance that will show the data developed. From this, a report will be prepared by Argonne indicating the status of the module performance and identify steps that might then be needed to achieve target truck intake requirements. Engine performance criteria for the target engine is provided in Appendix A along with test protocol details.
Module Procurement Initially, contacts with prospective module suppliers were focused on those with which Argonne had previous experience. They were asked to submit modules that they felt would be their best units for our NEA application. Each of these are
described briefly below and further details are provided in the referenced appendices.
Anticipating need for further improvement in module performance, we initiated utilization of a computational model to guide our module specification. This model is being validated during the laboratory tests to enable better specification of permeation parameters to be provided to prospective suppliers.
To increase the range of available materials and systems, systematic literature and patent searches are being conducted with the objective of identifying additional, new candidates for our NEA modules.
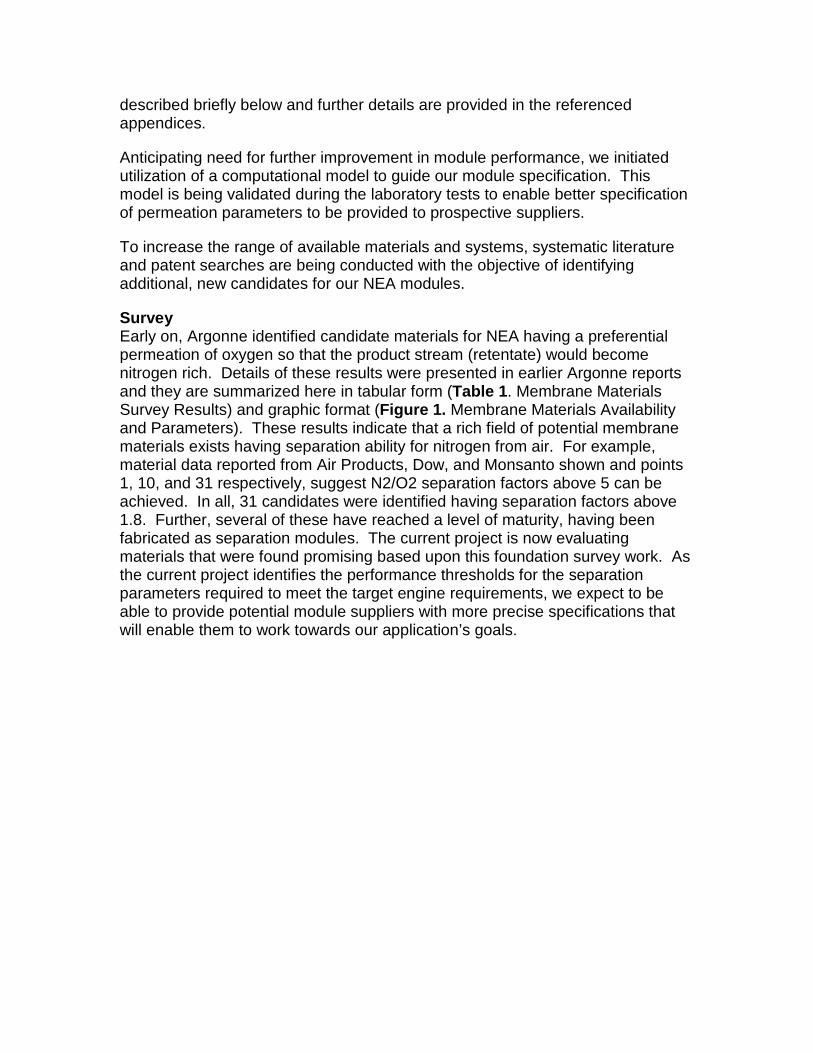
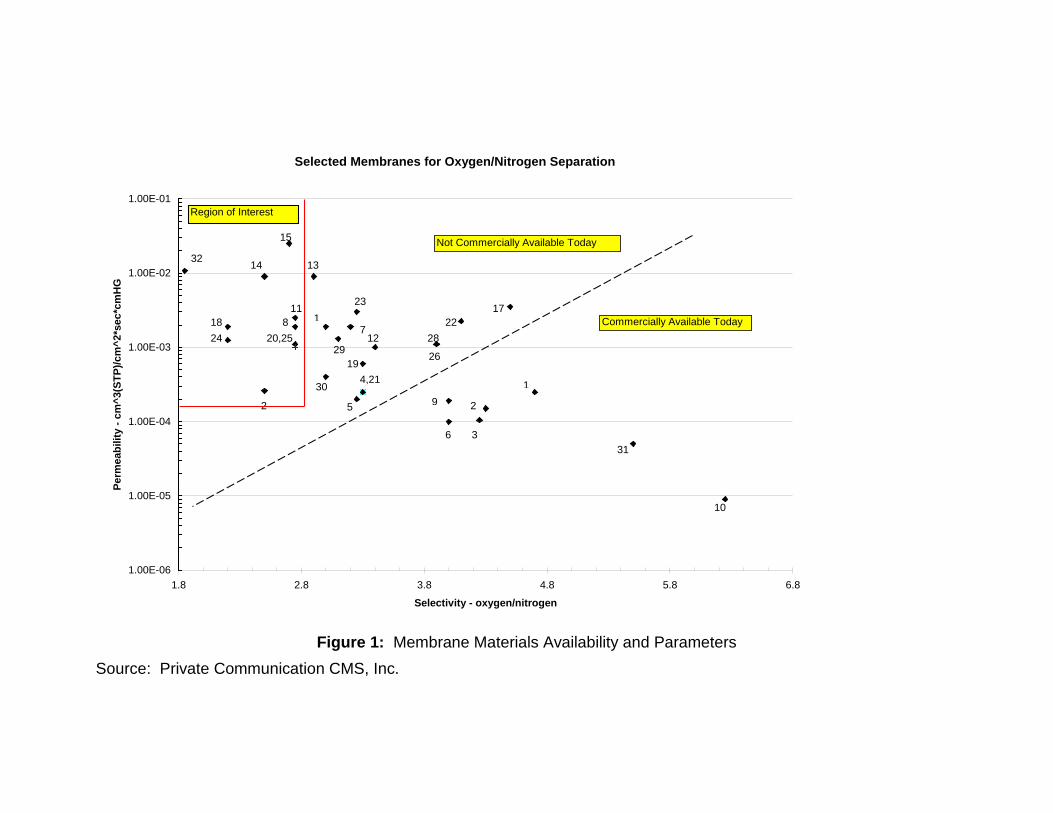
Survey Early on, Argonne identified candidate materials for NEA having a preferential permeation of oxygen so that the product stream (retentate) would become nitrogen rich. Details of these results were presented in earlier Argonne reports and they are summarized here in tabular form (Table 1. Membrane Materials Survey Results) and graphic format (Figure 1. Membrane Materials Availability and Parameters). These results indicate that a rich field of potential membrane materials exists having separation ability for nitrogen from air. For example, material data reported from Air Products, Dow, and Monsanto shown and points 1, 10, and 31 respectively, suggest N2/O2 separation factors above 5 can be achieved. In all, 31 candidates were identified having separation factors above 1.8. Further, several of these have reached a level of maturity, having been fabricated as separation modules. The current project is now evaluating materials that were found promising based upon this foundation survey work. As the current project identifies the performance thresholds for the separation parameters required to meet the target engine requirements, we expect to be able to provide potential module suppliers with more precise specifications that will enable them to work towards our application’s goals.
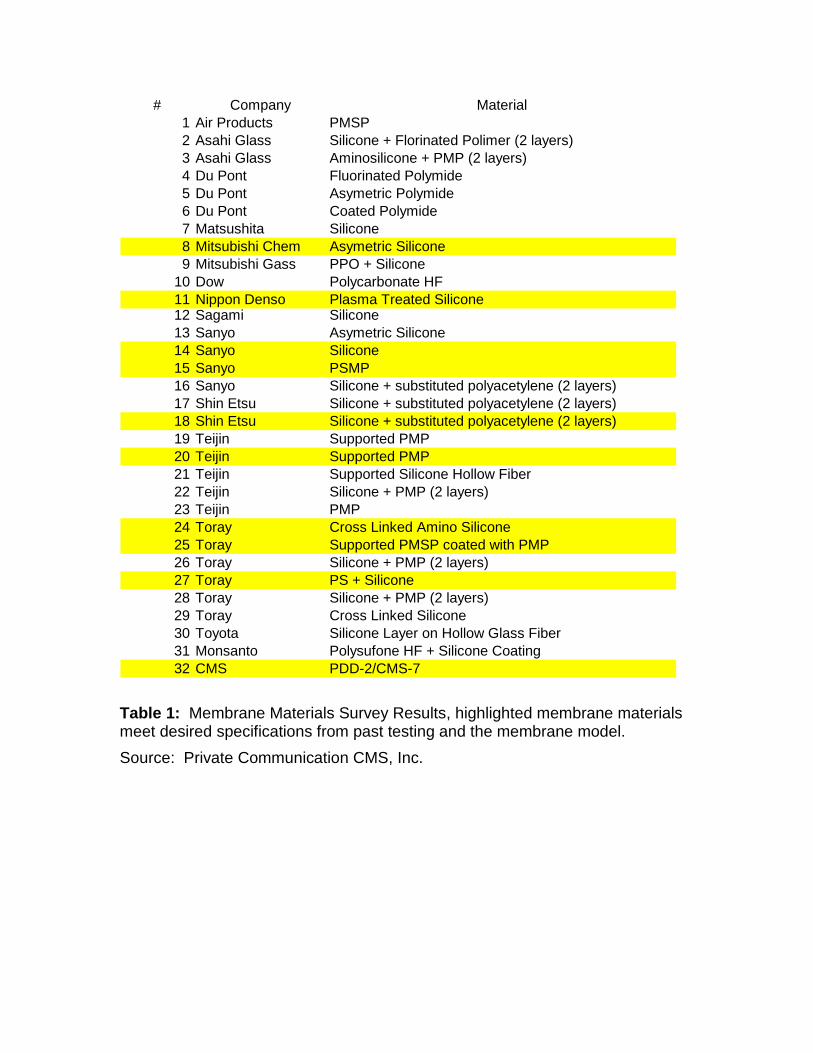
# Company Material1 Air Products PMSP2 Asahi Glass Silicone + Florinated Polimer (2 layers)3 Asahi Glass Aminosilicone + PMP (2 layers)4 Du Pont Fluorinated Polymide5 Du Pont Asymetric Polymide6 Du Pont Coated Polymide7 Matsushita Silicone8 Mitsubishi Chem Asymetric Silicone9 Mitsubishi Gass PPO + Silicone
10 Dow Polycarbonate HF11 Nippon Denso Plasma Treated Silicone12 Sagami Silicone13 Sanyo Asymetric Silicone14 Sanyo Silicone15 Sanyo PSMP16 Sanyo Silicone + substituted polyacetylene (2 layers)17 Shin Etsu Silicone + substituted polyacetylene (2 layers)18 Shin Etsu Silicone + substituted polyacetylene (2 layers)19 Teijin Supported PMP20 Teijin Supported PMP21 Teijin Supported Silicone Hollow Fiber22 Teijin Silicone + PMP (2 layers)23 Teijin PMP24 Toray Cross Linked Amino Silicone25 Toray Supported PMSP coated with PMP26 Toray Silicone + PMP (2 layers)27 Toray PS + Silicone28 Toray Silicone + PMP (2 layers)29 Toray Cross Linked Silicone30 Toyota Silicone Layer on Hollow Glass Fiber31 Monsanto Polysufone HF + Silicone Coating32 CMS PDD-2/CMS-7
Table 1: Membrane Materials Survey Results, highlighted membrane materials meet desired specifications from past testing and the membrane model. Source: Private Communication CMS, Inc.
Selected Membranes for Oxygen/Nitrogen Separation
1.00E-06
1.00E-05
1.00E-04
1.00E-03
1.00E-02
1.00E-01
1.8 2.8 3.8 4.8 5.8 6.8
Selectivity - oxygen/nitrogen
Perm
eabi
lity
- cm
^3(S
TP)/c
m^2
*sec
*cm
HG
Not Commercially Available Today
Commercially Available Today
1
2
3
9
631
10
1722
26
28
5
4,21
2
30
19
127
23
29
111
820,25
15
1314
1824
32
Region of Interest
Figure 1: Membrane Materials Availability and Parameters
Source: Private Communication CMS, Inc.
Our ongoing survey effort is being carried out to maintain the currency of this survey data as new materials and methods are developed in the polymer/membrane/module industry.
Module Procurement Three membrane suppliers were originally identified for the project from the results of the Argonne membrane/module survey work. The three suppliers were MEDAL, Prism Membrane and Compact Membrane Systems. A fourth module candidate, manufactured by Avir, and available from a previous program at Argonne, was used for first tests runs with our reworked test bench.
MEDAL MEDAL is short for MEmbrane Separation Systems Dupont Air Liquide. MEDAL is the membrane research division of Air Liquide. It was believed that MEDAL may be a promising supplier of membranes because Renault has a relationship with Air Liquide. After a number of attempts to obtain test modules from MEDAL, they indicated that they were not going to participate in this program as a consequence of their priorities for allocation of their resources. However, they did provide an analysis of their system. We plan to contact this supplier in the third quarter to determine if their priorities have changed and if they will be able to participate in this program by supplying module samples. Details of our contacts with MEDAL and a copy of their report are provided in Appendix D.
Avir Modules made by Avir made for evaluation purposes and available from previous program(s) at Argonne were selected for first tests under the current program. These tests were conducted to verify our reworked test bench performance and were not expected to yield acceptable nitrogen enrichment performance with required throughput. However, acceptable nitrogen enrichment was achieved but with unacceptable throughput and concomitant horsepower limits. Details of the tests with the three module elements tested are given in Appendix E. Avir is no longer in business so no further procurement efforts are planned with these units.
Prism Membrane Prism Membrane is the research division of Air Products and a manufacturer of nitrogen generation systems. The Prism Membrane module was expected to show promising results based upon data they had developed. Initial discussions with Prism led to their offering Argonne a prototype with analysis that would be purchased for this program. The procurement was completed and a sample was received August 2002. This unit was tested at Argonne and showed adequate nitrogen enrichment but the throughput at acceptable horsepower was deemed marginal. However, the tests showed good agreement with the computational model used during this program. Analysis of the data taken is continuing and is
planned for reporting in a subsequent report. Data and results to date for this module are provided in Appendix F. Following review of their analysis and our data, we plan to contact Prism to present them with our findings and the module permeation specifications we are developing to determine if they will be able to best the performance of the prototype they have supplied for these tests.
Compact Membrane Systems, Inc. Compact Membrane Systems, Inc. (CMS) provides modules for gas separations using technology licensed from Dupont Company for totally fluorinated polymeric membrane applications. CMS was contacted because they had worked with ANL in the past on both nitrogen and oxygen enriched air applications and had made modules that were able to meet the current program’s nitrogen enrichment goals. However, data was not available to adequate characterize their modules for the current program so tests with this module were deemed necessary. Protracted negotiations with CMS finally resulted in an agreement that will provide this program with a test module by fourth quarter. Details of our contacts with CMS and the agreement reached are presented in Appendix G.
Parker Hanifin A module manufactured by Parker Hanifin was procured from them following discussions with them providing our general requirements. The unit we received will be characterized on our module test bench during the third quarter. The available information on this module and it’s procurement is compiled in Appendix G. Model Development As data was developed with modules over a range of conditions, it became apparent that a computational model would be necessary to enable comparison of the performance of the different types of modules and enable accurate specification of performance levels necessary to achieve the target engine requirements. Further, the model would enable projection of attainment of size and energy consumption goals, both critical to bringing this technology into the field. By August 2002, additional staff was brought on to the project with expertise in membrane module development and modeling. This effort is continuing and results to date are presented here. Objective There are two main objectives to achieve with the computational modeling work. One is to provide a method for analyzing lab/field module data and planning testing (e.g. model brings disparate data into a unified design tool). The other is to enable evaluation of alternative process designs to meet project objectives while avoiding extended test runs (e.g. evaluation of multi-pass and permeate sweep schemes). These objectives come together to provide the primary goal of the project- to specify a module system that will enable the target engine to meet the prescribed 2007 emission specifications for NOx.
Model Description The model is an iterative computational procedure derived from physical principles. It has been used in studies covering feed pressures from near atmospheric to 1000 psig, feed compositions from fractions of a percent to over 30 percent, permeate pressures from near vacuum to hundreds of psi, and a wide range of through puts. It has performed well for both tubular and various flat sheet materials. It is primarily a practical design tool that achieves it’s greatest potential in evaluation of process configurations based on hard lab data, allowing that data to provide “effective selectivity” that practically represents achievable performance and enables assessment of process options. Given good test data, it allows users to carry out ‘what if’ studies with confidence that results will be practically achievable.
Model Principles The gas permeation through polymers is based upon the driving force (partial pressure differential) of individual gases with relative smaller pressure losses along module (feed to retentate ports). The membrane’s selectivity is defined as the ratio of individual gas permeation rates.
Model Parameters The model considers the membrane module to have three ports under typical operating situations: feed, retentate, permeate. The primary parameters at these ports are the absolute pressure (psia), flow (SCF/min), and composition, % (nitrogen, balance oxygen)
The model incorporates the ratio of permeation rates as the selectivity (unitless: O2 permeation rate / N2 permeation rate) which can be taken from pure gas data as an “idealized selectivity” or from performance data as an “effective selectivity”
The permeation rate (SCF/min/sqft-psi) is defined for the retained gas, nitrogen. The module size is defined in terms of the membrane area (sqft). Status Initially, the model was used to examine the data on hand and identify trends to follow in the refurbishing of the test bench and procurement of test modules. Although most of the initial data was developed at relatively low pressure drops, it was apparent that the model was working accurately. Subsequent laboratory data taken was analyzed in comparison with the model and projected trends were observed in the data. Further examination of the data and model validation are in progress. As the validity is established, the model application work will then focus on establishing module parameters necessary to meet target engine requirements.
Consolidation of existing lab data As used for this project to develop a preliminary analysis for the available data, the model was run with all the lab data for a single module. Inputs were: feed pressure, flow, and composition; retentate pressure and composition and
permeate pressure. Area and permeation were estimated from the module size and flow data. Module outputs were retentate flow, permeate flow, and permeate composition. These were compared with the model predictions by calculation of average deviations. An effective selectivity for a particular module was determined from evaluation of permeate composition data. Note that the effective selectivity can vary from the ‘ideal’ selectivity due to different module behavior with mixed gases (typically a minimal effect for nitrogen and oxygen) and leakage across the surface of the module from feed-retentate side to the permeate side. Other factors include flow patterns from feed to retentate and along the permeate surface. The effect of water vapor was not included. Specific results of the average deviations as a percentage of readings of module data and model output for all 21 lab tests of Module 25 were: retentate flow 8%, permeate flow 3%, and permeate composition nitrogen 2%.
Process Evaluation Based upon the general agreement of model and available data for the two modules, an example parametric study was run to illustrate a single stage module using only feed pressure as the driving force. The analysis shows the benefits that may be achieved by increased feed pressures while avoiding the use of permeate suction.
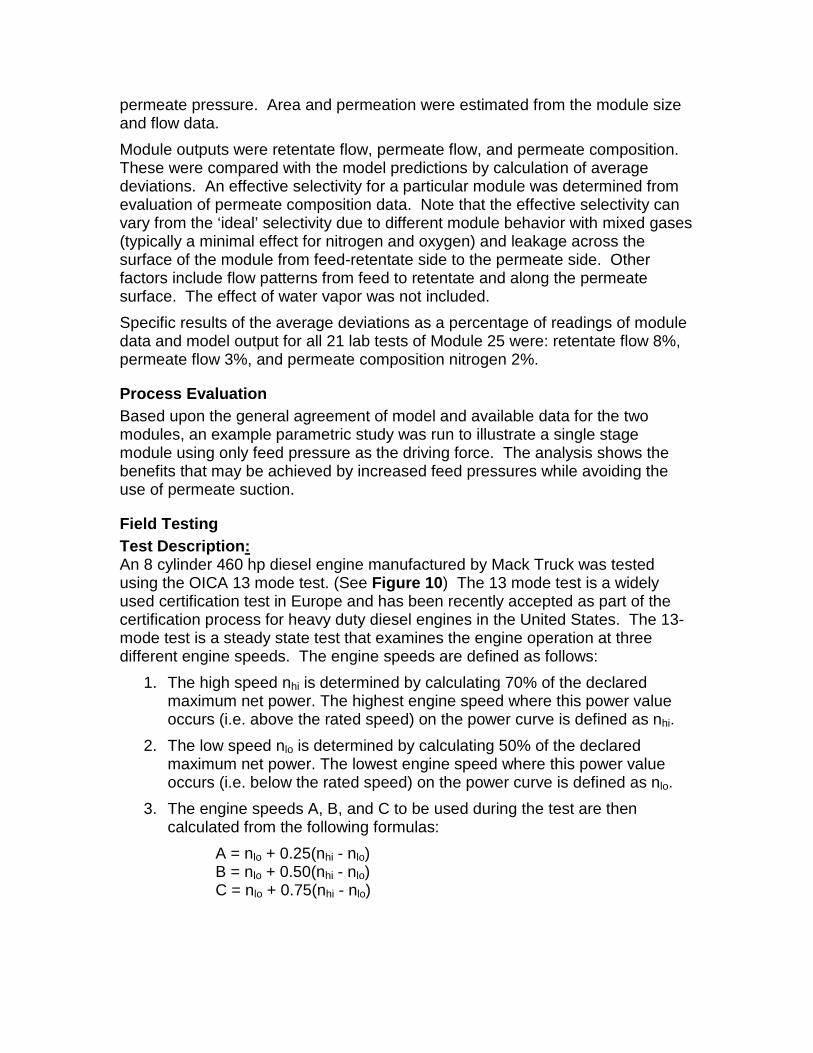
Field Testing Test Description: An 8 cylinder 460 hp diesel engine manufactured by Mack Truck was tested using the OICA 13 mode test. (See Figure 10) The 13 mode test is a widely used certification test in Europe and has been recently accepted as part of the certification process for heavy duty diesel engines in the United States. The 13-mode test is a steady state test that examines the engine operation at three different engine speeds. The engine speeds are defined as follows:
1. The high speed nhi is determined by calculating 70% of the declared maximum net power. The highest engine speed where this power value occurs (i.e. above the rated speed) on the power curve is defined as nhi.
2. The low speed nlo is determined by calculating 50% of the declared maximum net power. The lowest engine speed where this power value occurs (i.e. below the rated speed) on the power curve is defined as nlo.
3. The engine speeds A, B, and C to be used during the test are then calculated from the following formulas:
A = nlo + 0.25(nhi - nlo) B = nlo + 0.50(nhi - nlo) C = nlo + 0.75(nhi - nlo)
There are 4 loads applied to the engine at these speeds, 100% load, 75% load, 50% load and 25% load. The final test operating point is idle. First the engine is operated without Exhaust Gas Recirculation (EGR) at a given mode, with advanced fuel injection timing. After the data for this point is collected, the Beginning of Injection (BOI) timing is retarded and the fuel rate to the engine is increased to bring the engines power back to the designated test point and data is collected. This is repeated until there is four BOI timing data points per test point. Next EGR is added and the process is repeated for three EGR rates. The engine data that was recorded was the engines speed, torque, BOI timing, EGR flow, intake air flow, break mean effective pressure (BMEP), fuel flow, turbine pressure and temperature, compressor pressure and temperature and intercooler inlet and outlet temperatures and pressures.
13 Mode Test for a 460 hp Mack V8 Engine
0.0
200.0
400.0
600.0
800.0
1000.0
1200.0
1400.0
1600.0
1800.0
500 700 900 1100 1300 1500 1700 1900
Engine Speed (RPM)
Torq
ue (l
b-ft)
Idle
A-25
A-50
A-75
A-100 (Peak Torque)
B-100
B-75
B-50
B-25
C-100(Peak Power)
C-75
C-50
C-25
Engines performance curve
Intermediat Speed
Figure 2: Engine test points for the 13-mode test used in the baseline tests
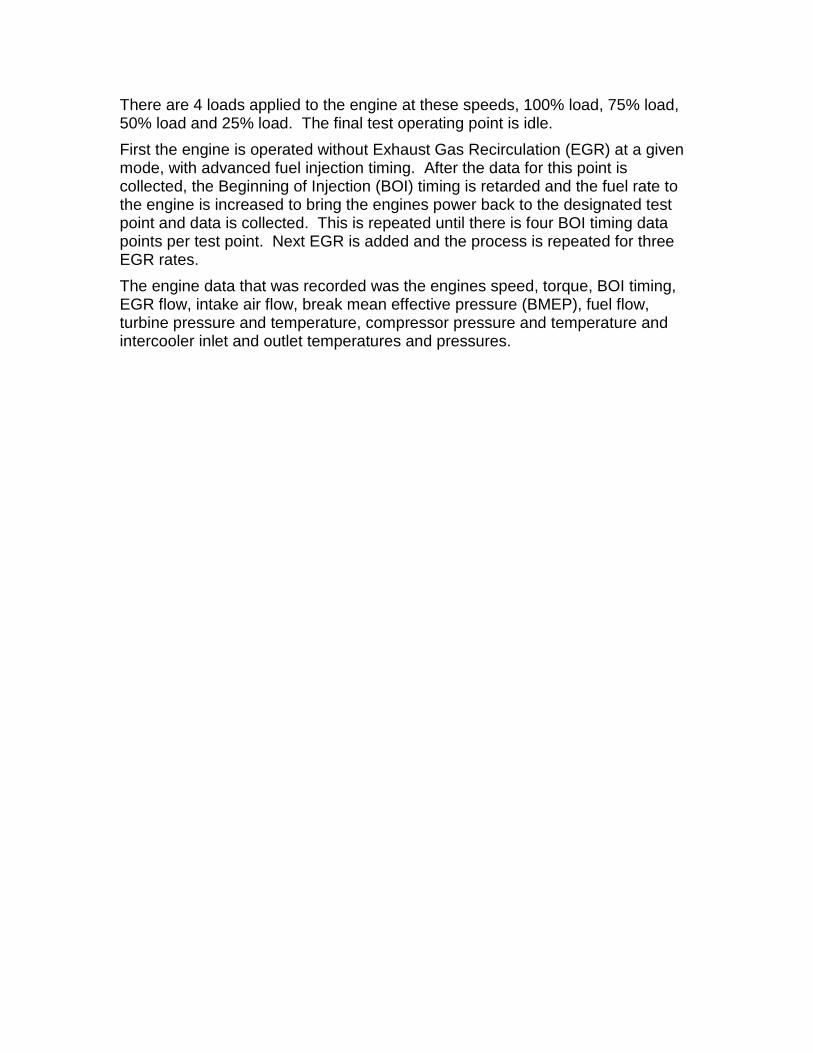
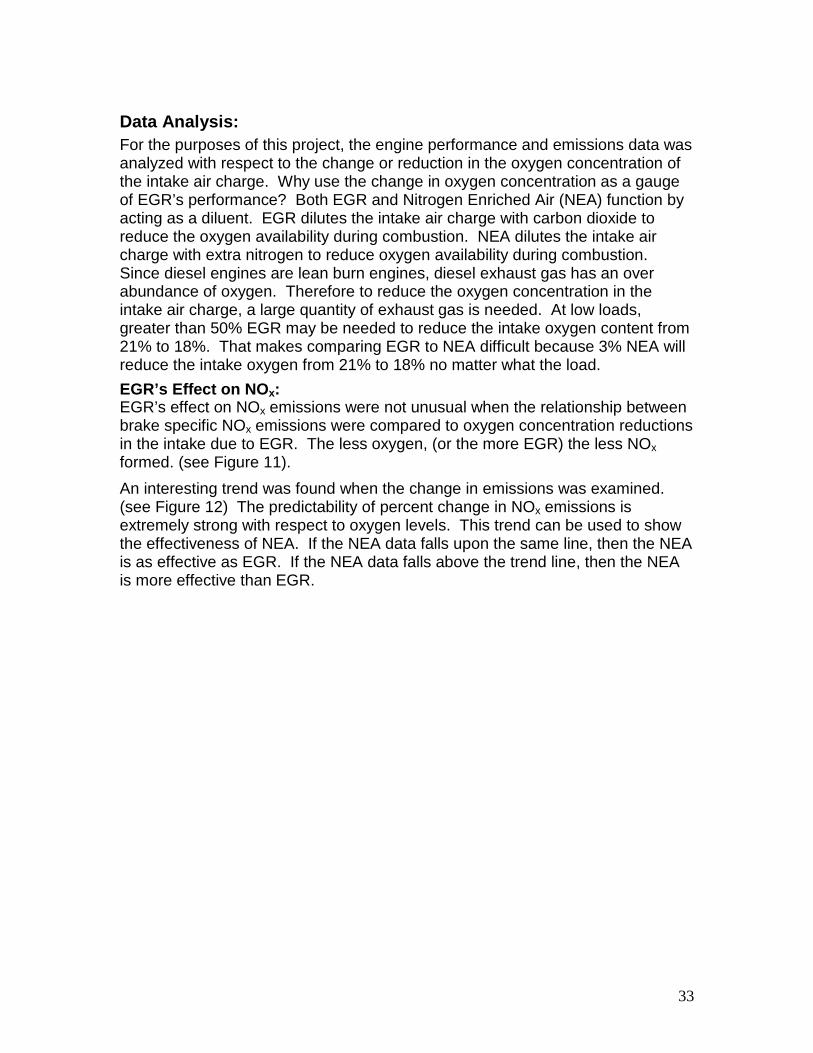
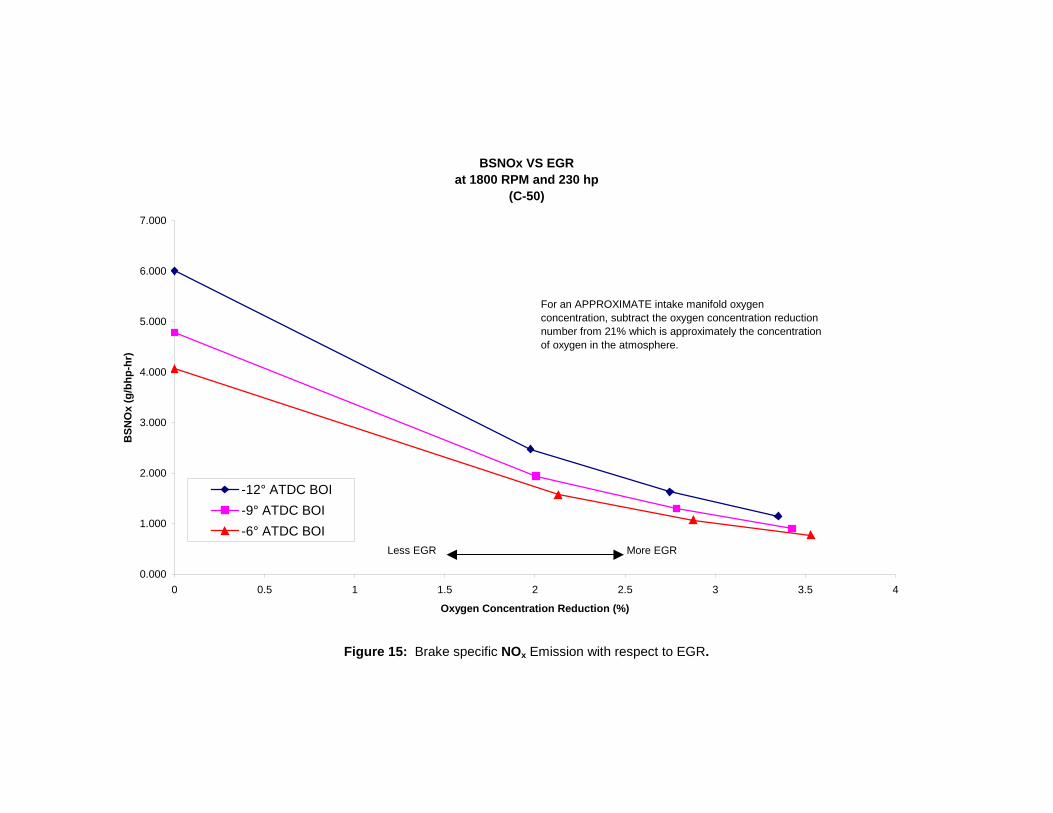
Baseline Data Analysis: For the purposes of this project, the engine performance and emissions data was analyzed with respect to the change or reduction in the oxygen concentration of the intake air charge. Why use the change in oxygen concentration as a gauge of EGR’s performance? Both EGR and Nitrogen Enriched Air (NEA) function by acting as a diluent. EGR dilutes the intake air charge with carbon dioxide to reduce the oxygen availability during combustion. NEA dilutes the intake air charge with extra nitrogen to reduce oxygen availability during combustion. Since diesel engines are lean burn engines, diesel exhaust gas has an over abundance of oxygen. Therefore to reduce the oxygen concentration in the intake air charge, a large quantity of exhaust gas is needed. At low loads, greater than 50% EGR may be needed to reduce the intake oxygen content from 21% to 18%. That makes comparing EGR to NEA difficult because 3% NEA will reduce the intake oxygen from 21% to 18% no matter what the load. EGR’s Effect on NOx (Baseline Data): EGR’s effect on NOx emissions were not unusual when the relationship between brake specific NOx emissions were compared to oxygen concentration reductions in the intake due to EGR. The less oxygen, (or the more EGR) the less NOx formed. (see Figure 11). An interesting trend was found when the change in emissions was examined. (see Figure 12) The predictability of percent change in NOx emissions is extremely strong with respect to oxygen levels. This trend can be used to show the effectiveness of NEA. If the NEA data falls upon the same line, then the NEA is as effective as EGR. If the NEA data falls above the trend line, then the NEA is more effective than EGR.
BSNOx VS EGRat 1800 RPM and 230 hp
(C-50)
0.000
1.000
2.000
3.000
4.000
5.000
6.000
7.000
0 0.5 1 1.5 2 2.5 3 3.5 4
Oxygen Concentration Reduction (%)
BSN
Ox
(g/b
hp-h
r)
-12° ATDC BOI-9° ATDC BOI-6° ATDC BOI
For an APPROXIMATE intake manifold oxygen concentration, subtract the oxygen concentration reduction number from 21% which is approximately the concentration of oxygen in the atmosphere.
Less EGR More EGR
Figure 3: Brake specific NOx Emission with respect to EGR

7
Emissions Reduction with Respect to Oxygen Reduction and DI BOI Timingat 1800 RPM and 230 hp
(C-50)
-120.0%
-100.0%
-80.0%
-60.0%
-40.0%
-20.0%
0.0%
20.0%
40.0%
60.0%
80.0%
100.0%
0 0.5 1 1.5 2 2.5 3 3.5 4
Oxygen Concentration Reduction (%)
Emis
sion
s R
educ
tion
(%)
% CO Reduction (-12° ATDC BOI)% NOx Reduction (-12° ATDC BOI)% CO Reduction (-9° ATDC BOI)% NOx Reduction (-9° ATDC BOI)% CO Reduction (-6° ATDC BOI)% NOx Reduction (-6° ATDC BOI)
Less EGR More EGR
Negative emissions reductions are actually and increase in emissions.
For an APPROXIMATE intake manifold oxygen concentration, subtract the oxygen concentration reduction number from 21% w hich is approximately the concentration of oxygen in the atmosphere.
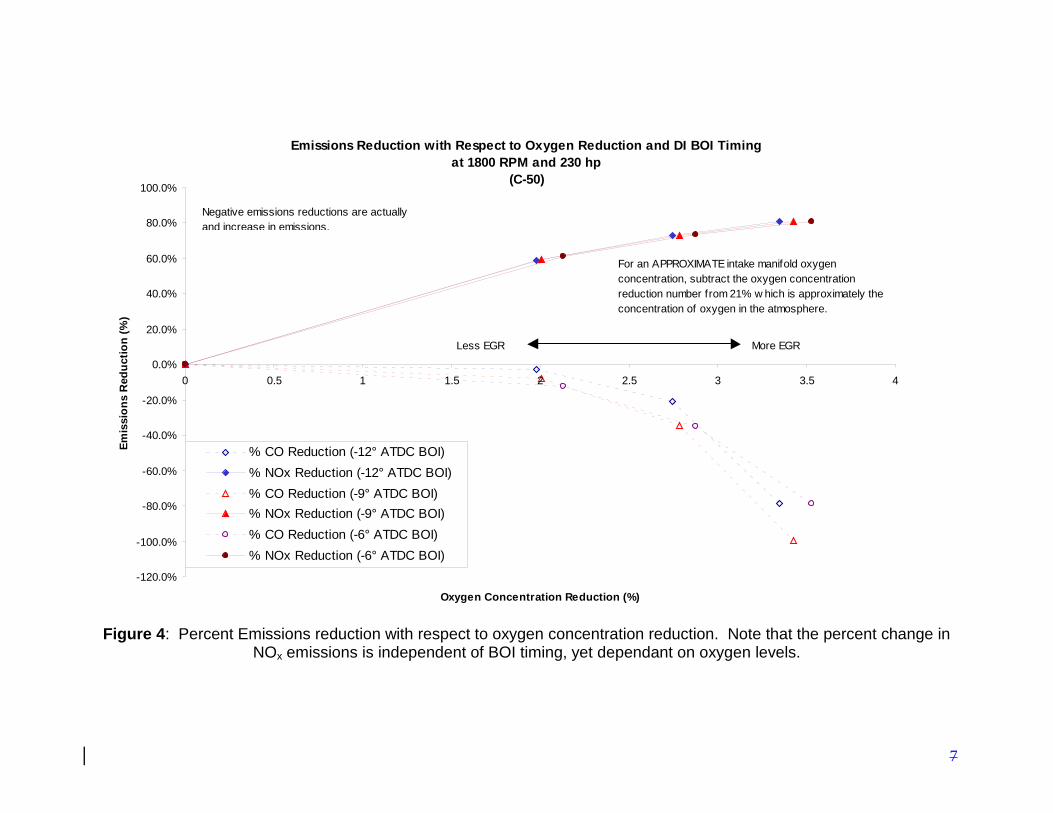
Figure 4: Percent Emissions reduction with respect to oxygen concentration reduction. Note that the percent change in NOx emissions is independent of BOI timing, yet dependant on oxygen levels.
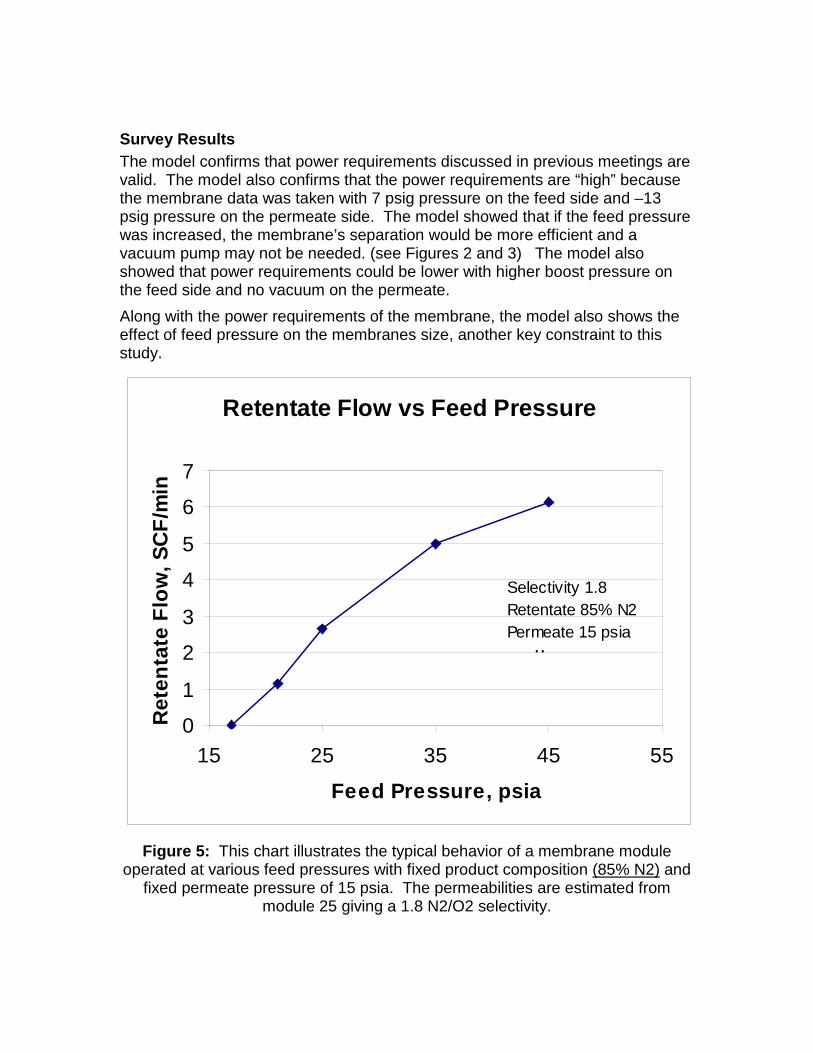
Survey Results The model confirms that power requirements discussed in previous meetings are valid. The model also confirms that the power requirements are “high” because the membrane data was taken with 7 psig pressure on the feed side and –13 psig pressure on the permeate side. The model showed that if the feed pressure was increased, the membrane’s separation would be more efficient and a vacuum pump may not be needed. (see Figures 2 and 3) The model also showed that power requirements could be lower with higher boost pressure on the feed side and no vacuum on the permeate. Along with the power requirements of the membrane, the model also shows the effect of feed pressure on the membranes size, another key constraint to this study.
Retentate Flow vs Feed Pressure
0
1
2
3
4
5
6
7
15 25 35 45 55
Feed Pressure, psia
Ret
enta
te F
low
, SC
F/m
in
..
Selectivity 1.8Retentate 85% N2Permeate 15 psia
Figure 5: This chart illustrates the typical behavior of a membrane module
operated at various feed pressures with fixed product composition (85% N2) and fixed permeate pressure of 15 psia. The permeabilities are estimated from
module 25 giving a 1.8 N2/O2 selectivity.
20
Retentate Flow vs Membrane Area
0
5000
10000
15000
15 25 35 45 55
Feed Pressure, psia
Mem
bran
e A
rea,
sqf
t
Selectivity 1.8Retentate 85% N2Permeate 15 psia
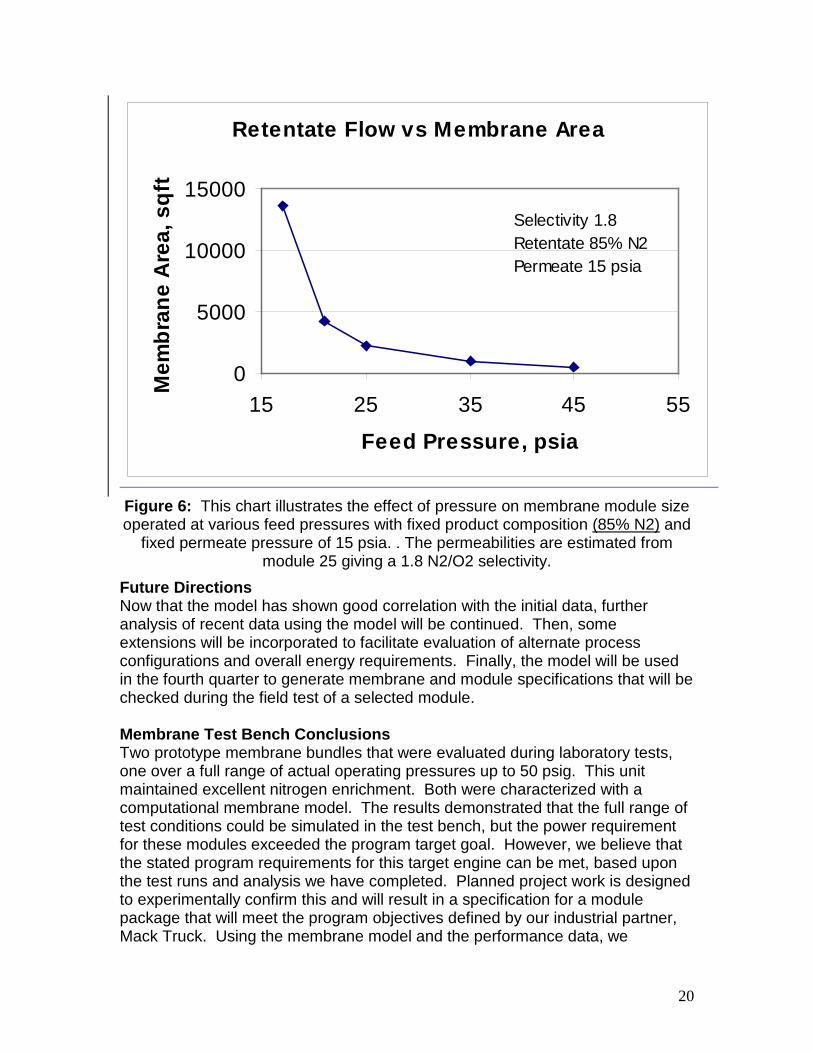
Figure 6: This chart illustrates the effect of pressure on membrane module size operated at various feed pressures with fixed product composition (85% N2) and
fixed permeate pressure of 15 psia. . The permeabilities are estimated from module 25 giving a 1.8 N2/O2 selectivity.
Future Directions Now that the model has shown good correlation with the initial data, further analysis of recent data using the model will be continued. Then, some extensions will be incorporated to facilitate evaluation of alternate process configurations and overall energy requirements. Finally, the model will be used in the fourth quarter to generate membrane and module specifications that will be checked during the field test of a selected module. Membrane Test Bench Conclusions Two prototype membrane bundles that were evaluated during laboratory tests, one over a full range of actual operating pressures up to 50 psig. This unit maintained excellent nitrogen enrichment. Both were characterized with a computational membrane model. The results demonstrated that the full range of test conditions could be simulated in the test bench, but the power requirement for these modules exceeded the program target goal. However, we believe that the stated program requirements for this target engine can be met, based upon the test runs and analysis we have completed. Planned project work is designed to experimentally confirm this and will result in a specification for a module package that will meet the program objectives defined by our industrial partner, Mack Truck. Using the membrane model and the performance data, we
21
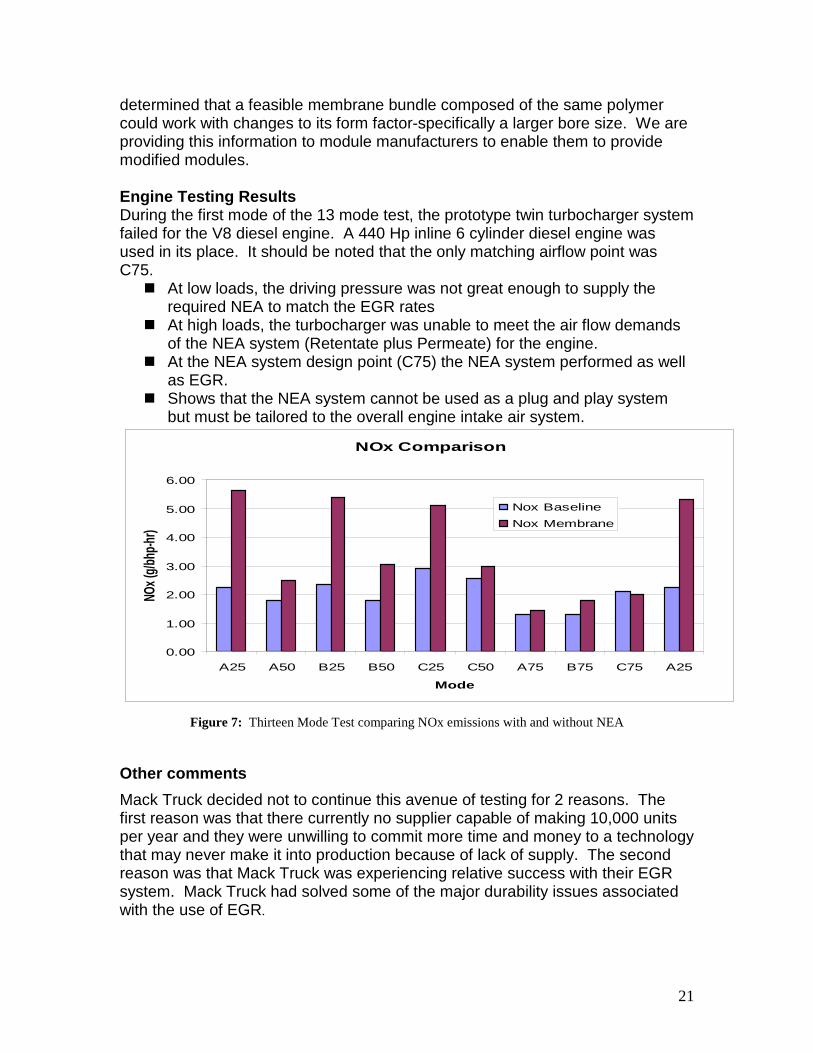
determined that a feasible membrane bundle composed of the same polymer could work with changes to its form factor-specifically a larger bore size. We are providing this information to module manufacturers to enable them to provide modified modules. Engine Testing Results During the first mode of the 13 mode test, the prototype twin turbocharger system failed for the V8 diesel engine. A 440 Hp inline 6 cylinder diesel engine was used in its place. It should be noted that the only matching airflow point was C75. At low loads, the driving pressure was not great enough to supply the
required NEA to match the EGR rates At high loads, the turbocharger was unable to meet the air flow demands
of the NEA system (Retentate plus Permeate) for the engine. At the NEA system design point (C75) the NEA system performed as well
as EGR. Shows that the NEA system cannot be used as a plug and play system
but must be tailored to the overall engine intake air system.
NOx Comparison
0.00
1.00
2.00
3.00
4.00
5.00
6.00
A25 A50 B25 B50 C25 C50 A75 B75 C75 A25
Mode
NOx (
g/bhp
-hr)
Nox BaselineNox Membrane
Figure 7: Thirteen Mode Test comparing NOx emissions with and without NEA
Other comments Mack Truck decided not to continue this avenue of testing for 2 reasons. The first reason was that there currently no supplier capable of making 10,000 units per year and they were unwilling to commit more time and money to a technology that may never make it into production because of lack of supply. The second reason was that Mack Truck was experiencing relative success with their EGR system. Mack Truck had solved some of the major durability issues associated with the use of EGR.
22
Appendix A Lab Test Facilities Previous Test Benches The project began anticipating using a membrane characterization bench used at Argonne during previous studies of membrane modules for engine feed gas enrichment. As modules were obtained for the current program, it became apparent that higher operating pressures and increased accuracy in flow measurement was needed to enable full-range measurements required by the target engine operating parameters. To meet these needs, the test bench was reworked following the program schedule adjustment made August 2002. Since then, the bench has been proven out during numerous test runs with several modules.
Original Configuration The original membrane module characterization bench was designed to analyze membrane performance in a low-pressure pressure driven configuration or a vacuum driven configuration. The bench consisted of a positive displacement blower for the membrane feed and a liquid ring blower to provide vacuum on the permeate side of the membrane. A oxygen analyzer was used to measure the oxygen content of the feed, permeate and retentate flows. Permeate, feed and retentate pressures were also measured. Retentate and permeate flows were measured using a relative flow measurement method- hot wire anemometry.
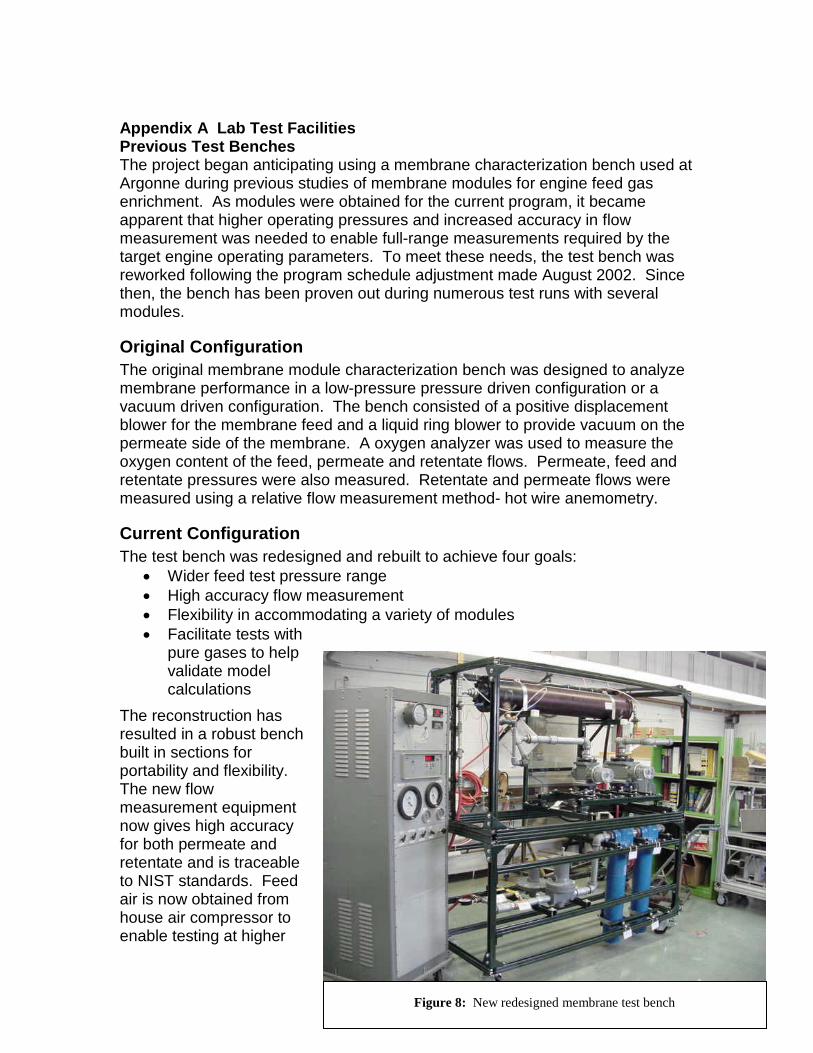
Current Configuration The test bench was redesigned and rebuilt to achieve four goals:
• Wider feed test pressure range • High accuracy flow measurement • Flexibility in accommodating a variety of modules • Facilitate tests with
pure gases to help validate model calculations
The reconstruction has resulted in a robust bench built in sections for portability and flexibility. The new flow measurement equipment now gives high accuracy for both permeate and retentate and is traceable to NIST standards. Feed air is now obtained from house air compressor to enable testing at higher
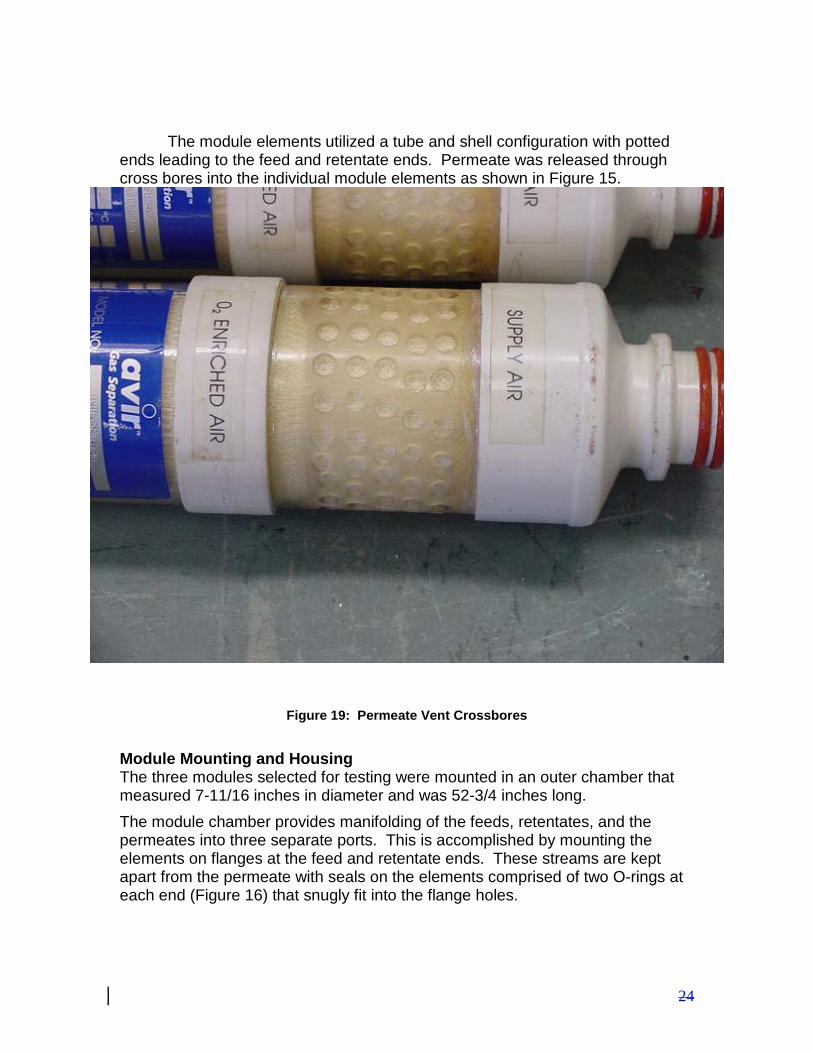
Figure 8: New redesigned membrane test bench
23
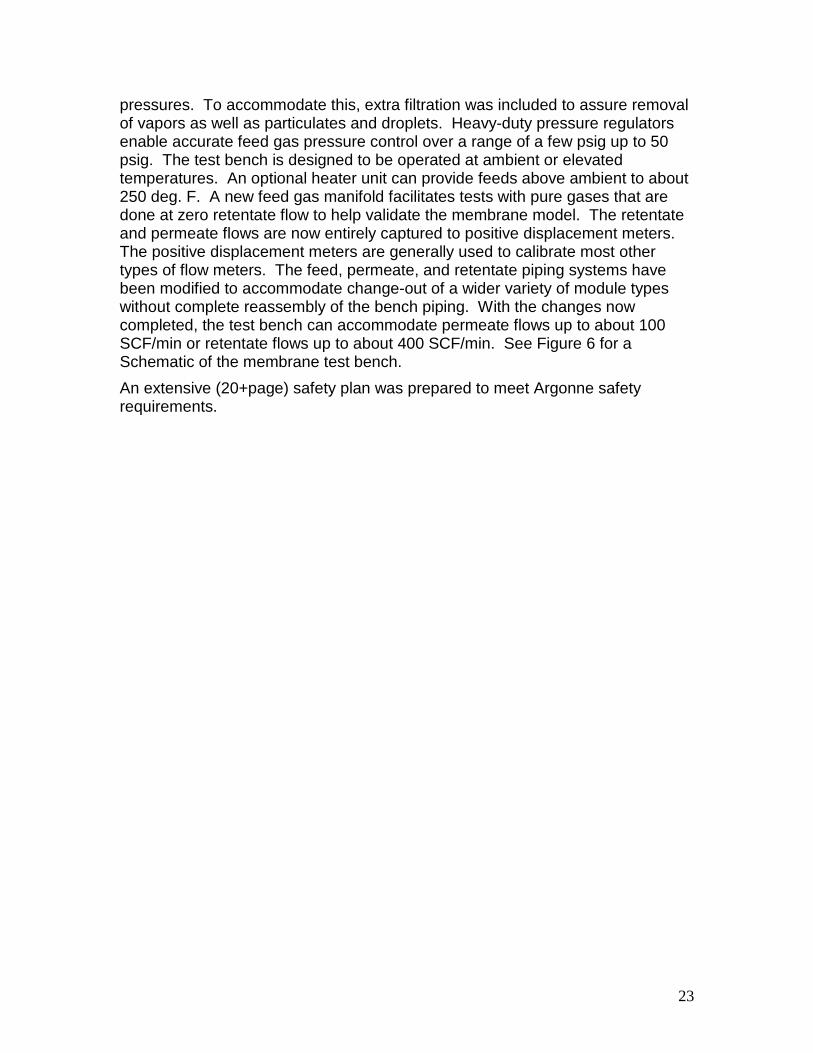
pressures. To accommodate this, extra filtration was included to assure removal of vapors as well as particulates and droplets. Heavy-duty pressure regulators enable accurate feed gas pressure control over a range of a few psig up to 50 psig. The test bench is designed to be operated at ambient or elevated temperatures. An optional heater unit can provide feeds above ambient to about 250 deg. F. A new feed gas manifold facilitates tests with pure gases that are done at zero retentate flow to help validate the membrane model. The retentate and permeate flows are now entirely captured to positive displacement meters. The positive displacement meters are generally used to calibrate most other types of flow meters. The feed, permeate, and retentate piping systems have been modified to accommodate change-out of a wider variety of module types without complete reassembly of the bench piping. With the changes now completed, the test bench can accommodate permeate flows up to about 100 SCF/min or retentate flows up to about 400 SCF/min. See Figure 6 for a Schematic of the membrane test bench. An extensive (20+page) safety plan was prepared to meet Argonne safety requirements.
Figure 9: Schematic of the Current Membrane Characterization Bench
For these runs, feed air was obtained from a house air compressor at feeds up to 50 psig. The extra filtration provided by the bench was used to assure removal of vapors as well as particulates and droplets. During the runs with the Prism module, the test bench retentate flows ranged up to about 30 SCF/min. Pure gas runs were made with pressurized cylinders containing industrial grade gases.
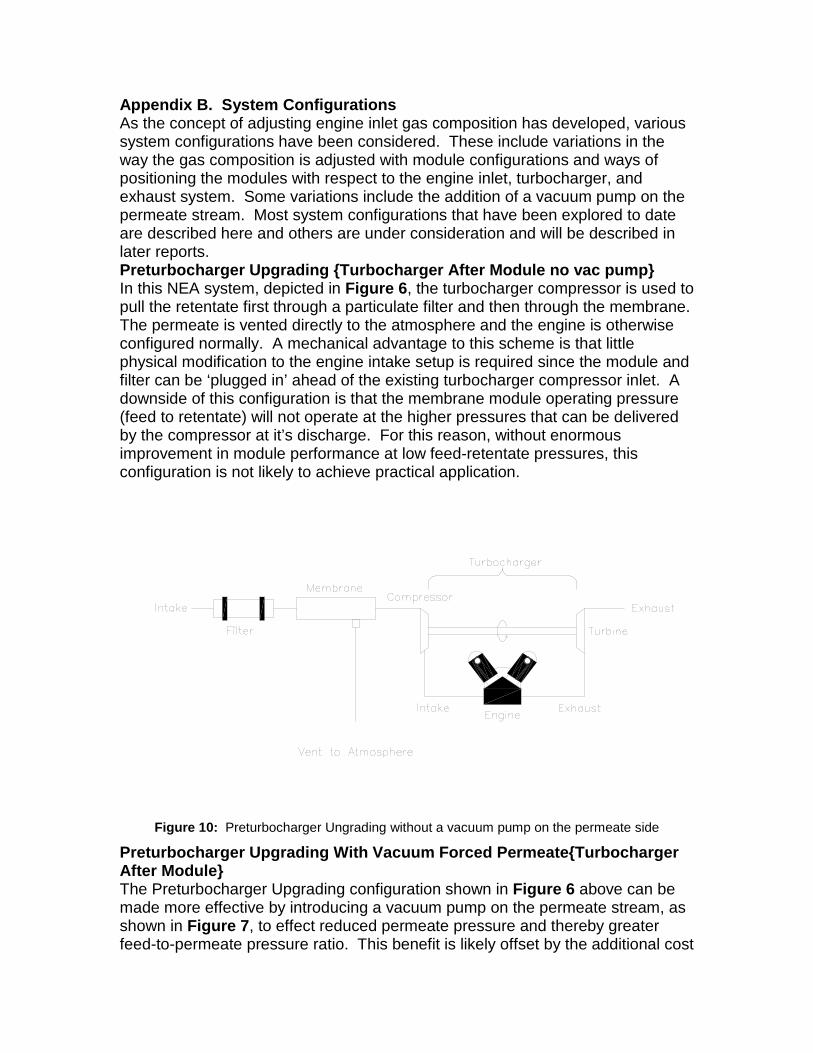
Appendix B. System Configurations As the concept of adjusting engine inlet gas composition has developed, various system configurations have been considered. These include variations in the way the gas composition is adjusted with module configurations and ways of positioning the modules with respect to the engine inlet, turbocharger, and exhaust system. Some variations include the addition of a vacuum pump on the permeate stream. Most system configurations that have been explored to date are described here and others are under consideration and will be described in later reports. Preturbocharger Upgrading {Turbocharger After Module no vac pump} In this NEA system, depicted in Figure 6, the turbocharger compressor is used to pull the retentate first through a particulate filter and then through the membrane. The permeate is vented directly to the atmosphere and the engine is otherwise configured normally. A mechanical advantage to this scheme is that little physical modification to the engine intake setup is required since the module and filter can be ‘plugged in’ ahead of the existing turbocharger compressor inlet. A downside of this configuration is that the membrane module operating pressure (feed to retentate) will not operate at the higher pressures that can be delivered by the compressor at it’s discharge. For this reason, without enormous improvement in module performance at low feed-retentate pressures, this configuration is not likely to achieve practical application.
Figure 10: Preturbocharger Ungrading without a vacuum pump on the permeate side
Preturbocharger Upgrading With Vacuum Forced Permeate{Turbocharger After Module} The Preturbocharger Upgrading configuration shown in Figure 6 above can be made more effective by introducing a vacuum pump on the permeate stream, as shown in Figure 7, to effect reduced permeate pressure and thereby greater feed-to-permeate pressure ratio. This benefit is likely offset by the additional cost
27
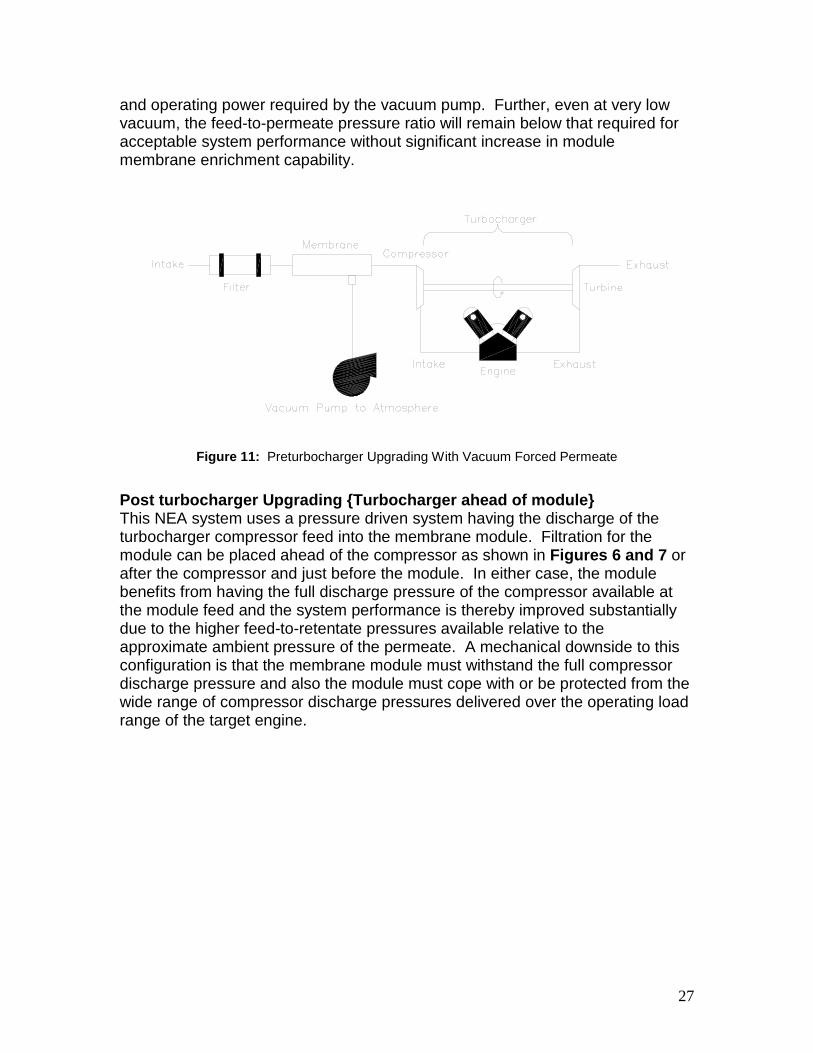
and operating power required by the vacuum pump. Further, even at very low vacuum, the feed-to-permeate pressure ratio will remain below that required for acceptable system performance without significant increase in module membrane enrichment capability.
Figure 11: Preturbocharger Upgrading With Vacuum Forced Permeate
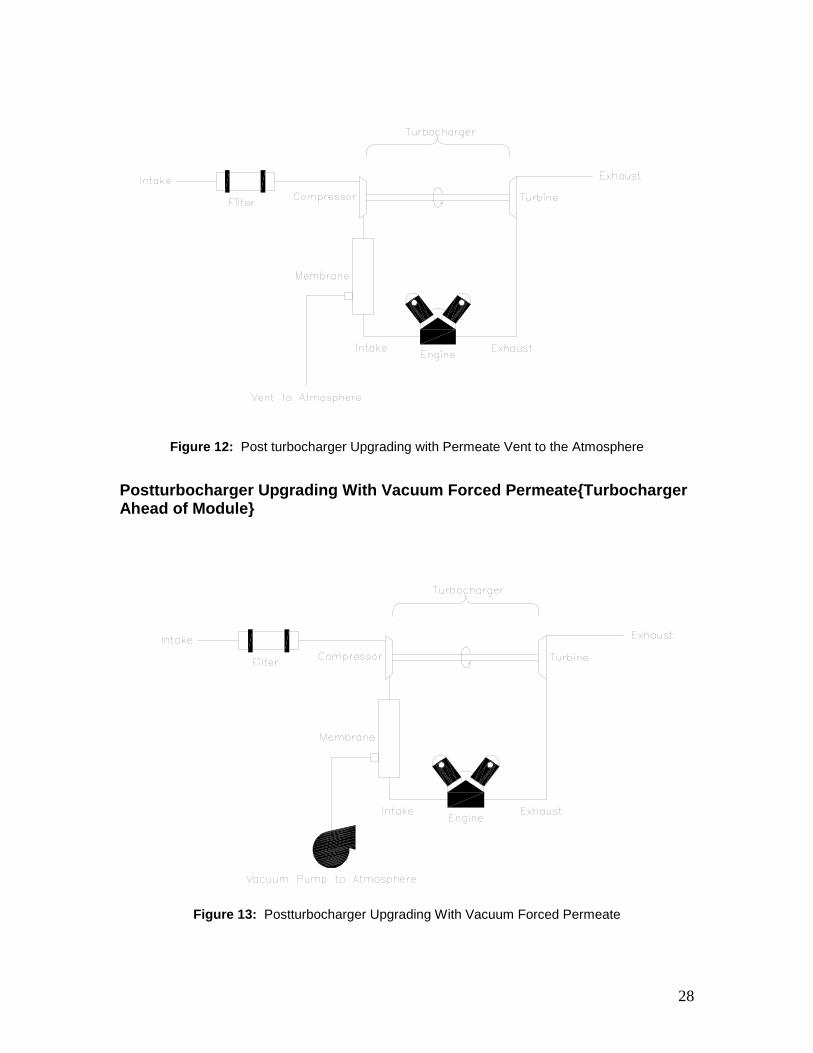
Post turbocharger Upgrading {Turbocharger ahead of module} This NEA system uses a pressure driven system having the discharge of the turbocharger compressor feed into the membrane module. Filtration for the module can be placed ahead of the compressor as shown in Figures 6 and 7 or after the compressor and just before the module. In either case, the module benefits from having the full discharge pressure of the compressor available at the module feed and the system performance is thereby improved substantially due to the higher feed-to-retentate pressures available relative to the approximate ambient pressure of the permeate. A mechanical downside to this configuration is that the membrane module must withstand the full compressor discharge pressure and also the module must cope with or be protected from the wide range of compressor discharge pressures delivered over the operating load range of the target engine.
28
Figure 12: Post turbocharger Upgrading with Permeate Vent to the Atmosphere
Postturbocharger Upgrading With Vacuum Forced Permeate{Turbocharger Ahead of Module}
Figure 13: Postturbocharger Upgrading With Vacuum Forced Permeate
29
Figure 9 (Postturbocharger Upgrading With Vacuum Forced Permeate) shows a variant of the system shown in Figure 8 that includes addition of a vacuum pump on the permeate discharge of the module. This can improve the feed-reject to permeate pressure ratio and thereby increase system separation performance. These are realized at the additional cost of the vacuum pump and its driving energy as well as possible increases in module costs due to the need to have vacuum-capable porting installed at the module permeate port. Further, design consideration must be given to the possible module failure mode of the module resulting from high pressures in the feed-retentate zone of the module causing a high pressure in at the module permeate side and on into the vacuum pump and its lines. Note that this failure mode would not be significant using the system shown in Figure 7 (Preturbocharger Upgrading With Vacuum Forced Permeate) which has the feed-retentate pressures near ambient and consequently little effect upon the permeate port or vacuum pump of that configuration.
30
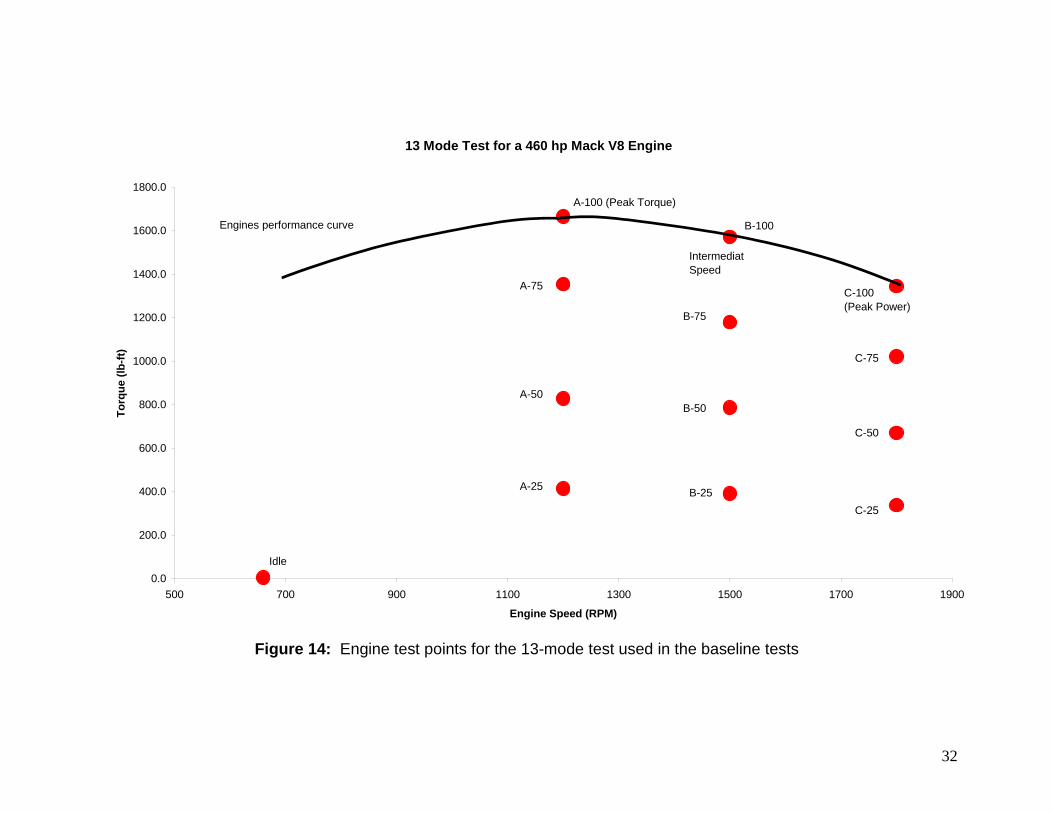
Appendix C. Field Test Facilities Test Unit Preparation At Argonne The most effective module selected during the laboratory testing and modeling activities will be prepared for installation in the engine test laboratory of the industrial partner, Mack Truck. This will include the baseline performance testing under steady and non-steady state conditions and corresponding model validation. Subsequent to these tests, the module will be suitably mounted for operation in the engine testing facility. Accurate flow and pressure measurements will require some modification to the test setup to accommodate the actual flows anticipated during dynamic testing on the target test engine. Adequate filtration must be included and the set up must be prepared to handle the range of ambient temperatures anticipated. Test Plan At Industrial Partner A full-scale target engine will be set up on the industrial partner’s engine test bed by their staff. The Argonne nitrogen enrichment module assembly will be integrated into the test engine using the system configuration selected during the current program’s bench scale testing. The partner’s test cell meets all federal engine test standards for heavy duty compression ignition engines and can perform the required protocols for the 13 mode test specified in the code of federal regulations, section 40, over all the target engine operating ranges required for the tests. These modes include idle, and four percentages at each of the peak torque, intermediate torque-power point, and peak power (C100 point). A typical 13 mode test showing actual typical target engine torque vs speed is depicted in Figure 10. The tests, including the 13 mode test, will relate the NEA test assembly performance to previous baseline tests performed by the partner on the target engine using EGR. Analysis earlier during this project at Argonne of the baseline data was used to guide selection of nitrogen enrichment criteria for the laboratory bench scale tests. A summary of that analysis is presented below. Baseline Data and Evaluation of Test Results Test Description: An 8 cylinder 460 hp diesel engine manufactured by Mack Truck was tested using the OICA 13 mode test. (See Figure 10) The 13 mode test is a widely used certification test in Europe and has been recently accepted as part of the certification process for heavy duty diesel engines in the United States. The 13-mode test is a steady state test that examines the engine operation at three different engine speeds. The engine speeds are defined as follows:
4. The high speed nhi is determined by calculating 70% of the declared maximum net power. The highest engine speed where this power value occurs (i.e. above the rated speed) on the power curve is defined as nhi.
5. The low speed nlo is determined by calculating 50% of the declared maximum net power. The lowest engine speed where this power value occurs (i.e. below the rated speed) on the power curve is defined as nlo.
31
6. The engine speeds A, B, and C to be used during the test are then calculated from the following formulas:
A = nlo + 0.25(nhi - nlo) B = nlo + 0.50(nhi - nlo) C = nlo + 0.75(nhi - nlo)
There are 4 loads applied to the engine at these speeds, 100% load, 75% load, 50% load and 25% load. The final test operating point is idle. First the engine is operated without Exhaust Gas Recirculation (EGR) at a given mode, with advanced fuel injection timing. After the data for this point is collected, the Beginning of Injection (BOI) timing is retarded and the fuel rate to the engine is increased to bring the engines power back to the designated test point and data is collected. This is repeated until there is four BOI timing data points per test point. Next EGR is added and the process is repeated for three EGR rates. The engine data that was recorded was the engines speed, torque, BOI timing, EGR flow, intake air flow, break mean effective pressure (BMEP), fuel flow, turbine pressure and temperature, compressor pressure and temperature and intercooler inlet and outlet temperatures and pressures.
32
13 Mode Test for a 460 hp Mack V8 Engine
0.0
200.0
400.0
600.0
800.0
1000.0
1200.0
1400.0
1600.0
1800.0
500 700 900 1100 1300 1500 1700 1900
Engine Speed (RPM)
Torq
ue (l
b-ft)
Idle
A-25
A-50
A-75
A-100 (Peak Torque)
B-100
B-75
B-50
B-25
C-100(Peak Power)
C-75
C-50
C-25
Engines performance curve
Intermediat Speed
Figure 14: Engine test points for the 13-mode test used in the baseline tests
33
Data Analysis: For the purposes of this project, the engine performance and emissions data was analyzed with respect to the change or reduction in the oxygen concentration of the intake air charge. Why use the change in oxygen concentration as a gauge of EGR’s performance? Both EGR and Nitrogen Enriched Air (NEA) function by acting as a diluent. EGR dilutes the intake air charge with carbon dioxide to reduce the oxygen availability during combustion. NEA dilutes the intake air charge with extra nitrogen to reduce oxygen availability during combustion. Since diesel engines are lean burn engines, diesel exhaust gas has an over abundance of oxygen. Therefore to reduce the oxygen concentration in the intake air charge, a large quantity of exhaust gas is needed. At low loads, greater than 50% EGR may be needed to reduce the intake oxygen content from 21% to 18%. That makes comparing EGR to NEA difficult because 3% NEA will reduce the intake oxygen from 21% to 18% no matter what the load. EGR’s Effect on NOx: EGR’s effect on NOx emissions were not unusual when the relationship between brake specific NOx emissions were compared to oxygen concentration reductions in the intake due to EGR. The less oxygen, (or the more EGR) the less NOx formed. (see Figure 11). An interesting trend was found when the change in emissions was examined. (see Figure 12) The predictability of percent change in NOx emissions is extremely strong with respect to oxygen levels. This trend can be used to show the effectiveness of NEA. If the NEA data falls upon the same line, then the NEA is as effective as EGR. If the NEA data falls above the trend line, then the NEA is more effective than EGR.
BSNOx VS EGRat 1800 RPM and 230 hp
(C-50)
0.000
1.000
2.000
3.000
4.000
5.000
6.000
7.000
0 0.5 1 1.5 2 2.5 3 3.5 4
Oxygen Concentration Reduction (%)
BSN
Ox
(g/b
hp-h
r)
-12° ATDC BOI-9° ATDC BOI-6° ATDC BOI
For an APPROXIMATE intake manifold oxygen concentration, subtract the oxygen concentration reduction number from 21% which is approximately the concentration of oxygen in the atmosphere.
Less EGR More EGR
Figure 15: Brake specific NOx Emission with respect to EGR.
7
Emissions Reduction with Respect to Oxygen Reduction and DI BOI Timingat 1800 RPM and 230 hp
(C-50)
-120.0%
-100.0%
-80.0%
-60.0%
-40.0%
-20.0%
0.0%
20.0%
40.0%
60.0%
80.0%
100.0%
0 0.5 1 1.5 2 2.5 3 3.5 4
Oxygen Concentration Reduction (%)
Emis
sion
s R
educ
tion
(%)
% CO Reduction (-12° ATDC BOI)% NOx Reduction (-12° ATDC BOI)% CO Reduction (-9° ATDC BOI)% NOx Reduction (-9° ATDC BOI)% CO Reduction (-6° ATDC BOI)% NOx Reduction (-6° ATDC BOI)
Less EGR More EGR
Negative emissions reductions are actually and increase in emissions.
For an APPROXIMATE intake manifold oxygen concentration, subtract the oxygen concentration reduction number from 21% w hich is approximately the concentration of oxygen in the atmosphere.
Figure 16: Percent Emissions reduction with respect to oxygen concentration reduction. Note that the percent change in NOx emissions is independent of BOI timing, yet dependant on oxygen levels.
24
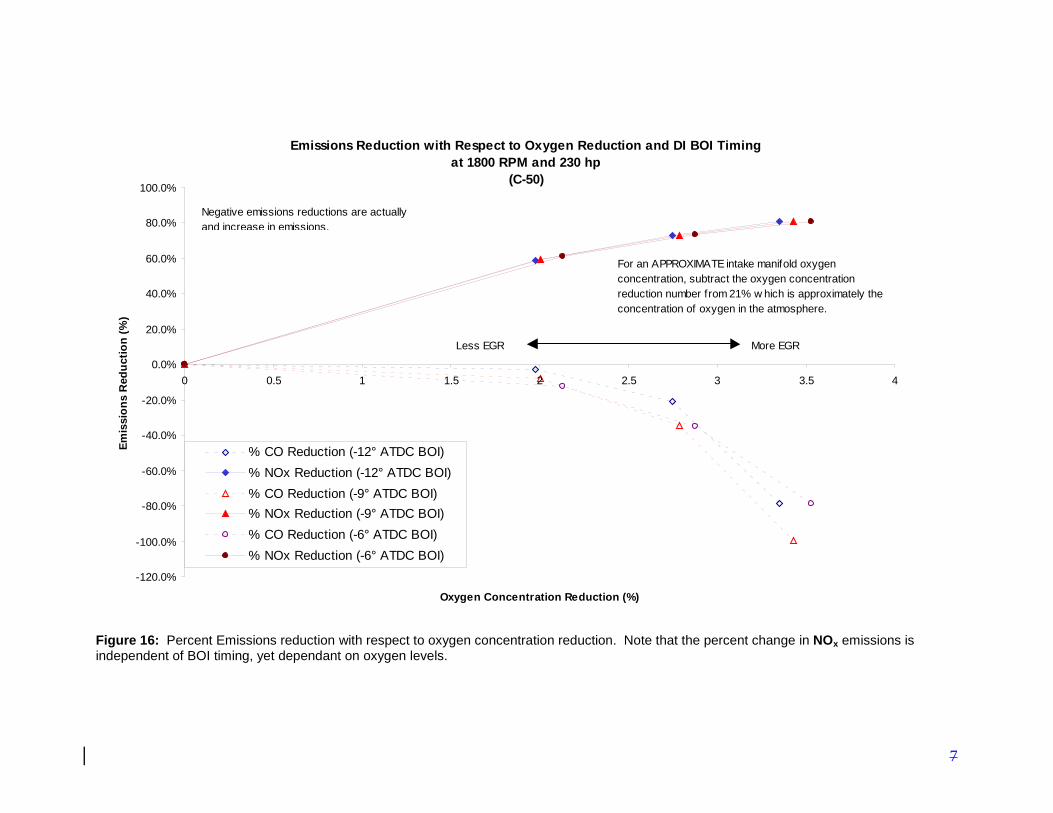
Appendix D. MEDAL Modules Test Objectives As MEDAL provided analysis of their system as presented below, but did not provide hardware for test, no test program was undertaken to confirm their reported results. Supplier’s Data The following report was provided at Argonne’s request for NEA membrane modules. As indicated above, their design criteria differ from those provided initially by Mack Truck and Argonne, but the report does provide useful information on potential module configurations.
MEDAL MEmbrane Separation Systems Du Pont Air Liquide
Jan 31, 2002 From: Ian Roman (MEDAL) Greg Fleming (MEDAL) To: Steve McConnell (Argonne) Raj Sekar (Argonne) Air Separation Membranes for NOx Reduction in Diesel Engines. Membrane Upstream of the Turbocompressor Summary:
An earlier analysis by MEDAL defined the need and opportunity for a new process for NOx reduction in heavy-duty diesel engines and mapped out the requirements for a membrane-based solution. The membrane was placed downstream of the turbocompressor. It enriched the air stream from the turbocompressor to 81% inerts, with about 12% loss of the of the original feed stream. The energy of compression was provided by simply sizing the turbocompressor up by 12%. The analysis considered a broad range of membrane performance, encompassing commercially available high-selectivity membranes for industrial N2 as well as new high-permeance membranes under development. Our conclusion was that a stand-alone membrane in this design would not be efficient due to excessive membrane size, cost or percentage loss of compressed air. Addition of a vacuum pump to help extract the permeate would help, but the economics were still marginal. An alternative design solution is examined in the present analysis. The membrane is placed before the turbocompressor, with a dedicated vacuum pump to extract the permeate. This design is easier to retrofit on existing engines and provides a definite advantage in process control and a small advantage in energy cost compared to the post-turbocompressor design with or without vacuum pump. However, our analysis indicates that it would require markedly higher membrane size and cost due to the smaller transmembrane pressure difference. Even with fully-optimized high-permeance membrane, we estimate an excessively large membrane area. Background
24
Reduction of emissions of nitrogen oxides (NOx) from diesel engines is required by increasingly stringent government regulations. This is forcing diesel engine manufacturers to look for new technology to manage NOx. The most direct solution is after-treatment of the exhaust to remove NOx. However, the cost of after-treatment with available methods is too high. Another solution is to reduce the formation of NOx in combustion, by slightly reducing the O2 concentration in the feed air to reduce the combustion temperature. Replacing 21% O2 with 19% O2 reduces NOx by as much as 70%. While this approach cannot eliminate all NOx, it is attractive because it can be applied with available technology. Exhaust gas recirculation, or EGR, reduces O2 concentration by adding a fraction of the O2-poor exhaust to the feed. EGR is cost-effective in spark-ignition engines but doesn't work as well in diesel engines, which produce dirtier exhaust. EGR increases particulates, another emission that must be managed. EGR also increases (and feeds back to the engine) carbon and sulfur, which may reduce engine life. A further problem is that the exhaust gas is hot and must be cooled before recirculation to avoid reducing engine power. In spite of the drawbacks, EGR is the solution most widely studied for NOx reduction so far. A cleaner method to reduce the O2 concentration in the feed air is to use a N2-enrichment membrane. In this case, a small part of the feed air is forfeited as a waste stream enriched in oxygen; the loss is equivalent to added compression cost. Several other technical solutions to reduce NOx have been examined by the diesel engine manufacturers, but none appear competitive with EGR or membrane in the timeframe needed. Membrane and process requirements 1. The size and weight of the membrane plus related system must be small. In earlier discussions with diesel engine manufacturers, an informal first-cut target size was set based on practical considerations: a single bundle, roughly the size of a 12"-diameter Medal bundle. Small membrane size is made possible by a combination of high O2 permeance, small fiber size, and adequately high feed/permeate pressure difference. 2. The cost of the membrane plus related system must be low. A tentative figure based on the estimated ultimate cost of the EGR system is $1500. This figure is only a starting point, but it defines the order of magnitude. 3. The added cost of compression must be less than 12% of that of the turbocompressor. Low cost is favored by high O2/N2 in the membrane and high feed/permeate pressure ratio. 4. The loss of pressure from feed to N2-enriched nonpermeate in the membrane is a compression cost and must be small. Low pressure loss is best achieved with shell-side feed. 5. The membrane must have good resistance to fouling in service because the cost and size requirements preclude membrane replacement and feed air pretreatment. 6. The membrane must have performance with shallow dependence on temperature, since the feed is now uncompressed atmospheric air with temperature in a broad range. This requirement will impose additional cost for high-selectivity membranes. Simulated performance of membranes
24
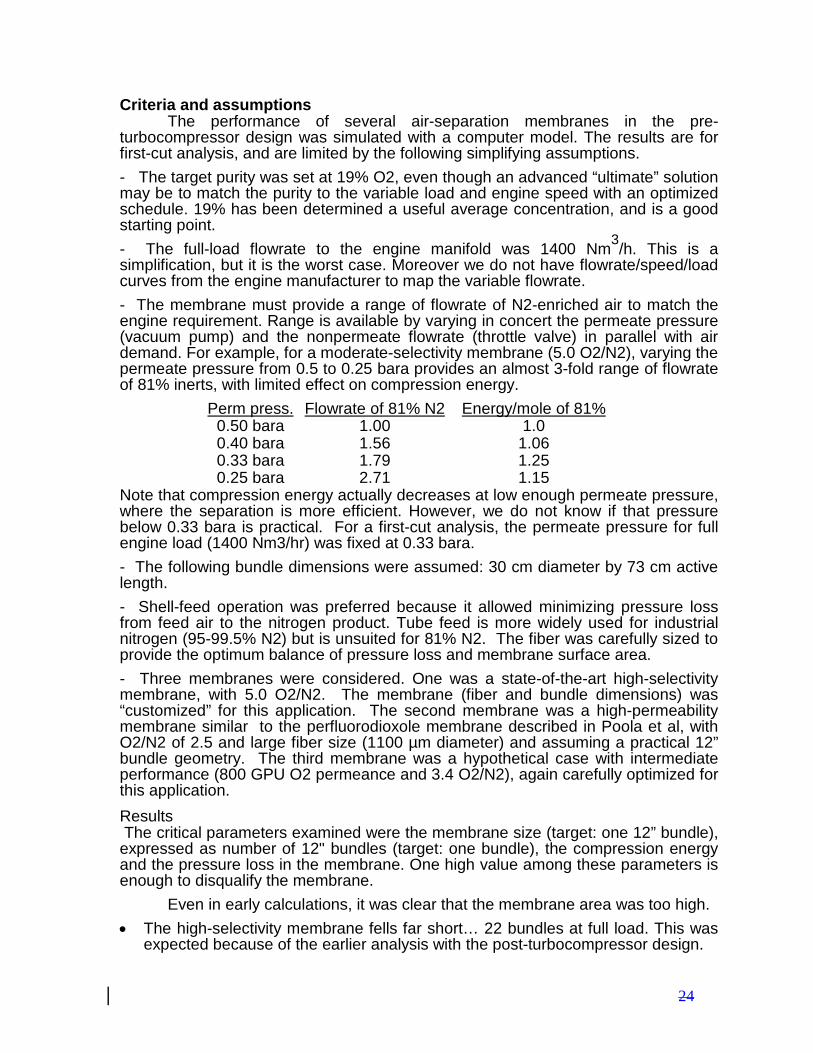
Criteria and assumptions The performance of several air-separation membranes in the pre-turbocompressor design was simulated with a computer model. The results are for first-cut analysis, and are limited by the following simplifying assumptions. - The target purity was set at 19% O2, even though an advanced “ultimate” solution may be to match the purity to the variable load and engine speed with an optimized schedule. 19% has been determined a useful average concentration, and is a good starting point. - The full-load flowrate to the engine manifold was 1400 Nm3/h. This is a simplification, but it is the worst case. Moreover we do not have flowrate/speed/load curves from the engine manufacturer to map the variable flowrate. - The membrane must provide a range of flowrate of N2-enriched air to match the engine requirement. Range is available by varying in concert the permeate pressure (vacuum pump) and the nonpermeate flowrate (throttle valve) in parallel with air demand. For example, for a moderate-selectivity membrane (5.0 O2/N2), varying the permeate pressure from 0.5 to 0.25 bara provides an almost 3-fold range of flowrate of 81% inerts, with limited effect on compression energy.
Perm press. Flowrate of 81% N2 Energy/mole of 81% 0.50 bara 1.00 1.0
0.40 bara 1.56 1.06 0.33 bara 1.79 1.25 0.25 bara 2.71 1.15
Note that compression energy actually decreases at low enough permeate pressure, where the separation is more efficient. However, we do not know if that pressure below 0.33 bara is practical. For a first-cut analysis, the permeate pressure for full engine load (1400 Nm3/hr) was fixed at 0.33 bara. - The following bundle dimensions were assumed: 30 cm diameter by 73 cm active length. - Shell-feed operation was preferred because it allowed minimizing pressure loss from feed air to the nitrogen product. Tube feed is more widely used for industrial nitrogen (95-99.5% N2) but is unsuited for 81% N2. The fiber was carefully sized to provide the optimum balance of pressure loss and membrane surface area. - Three membranes were considered. One was a state-of-the-art high-selectivity membrane, with 5.0 O2/N2. The membrane (fiber and bundle dimensions) was “customized” for this application. The second membrane was a high-permeability membrane similar to the perfluorodioxole membrane described in Poola et al, with O2/N2 of 2.5 and large fiber size (1100 µm diameter) and assuming a practical 12” bundle geometry. The third membrane was a hypothetical case with intermediate performance (800 GPU O2 permeance and 3.4 O2/N2), again carefully optimized for this application. Results The critical parameters examined were the membrane size (target: one 12” bundle), expressed as number of 12" bundles (target: one bundle), the compression energy and the pressure loss in the membrane. One high value among these parameters is enough to disqualify the membrane. Even in early calculations, it was clear that the membrane area was too high. • The high-selectivity membrane fells far short… 22 bundles at full load. This was
expected because of the earlier analysis with the post-turbocompressor design.
24
• The high-permeability membrane required 3 bundles, still too high. Moreover, the membrane also fell clearly short of the compression energy target, as in the post-turbocompressor design. The compression energy per mole of 81% N2 was 50% higher than for the high-selectivity membrane.
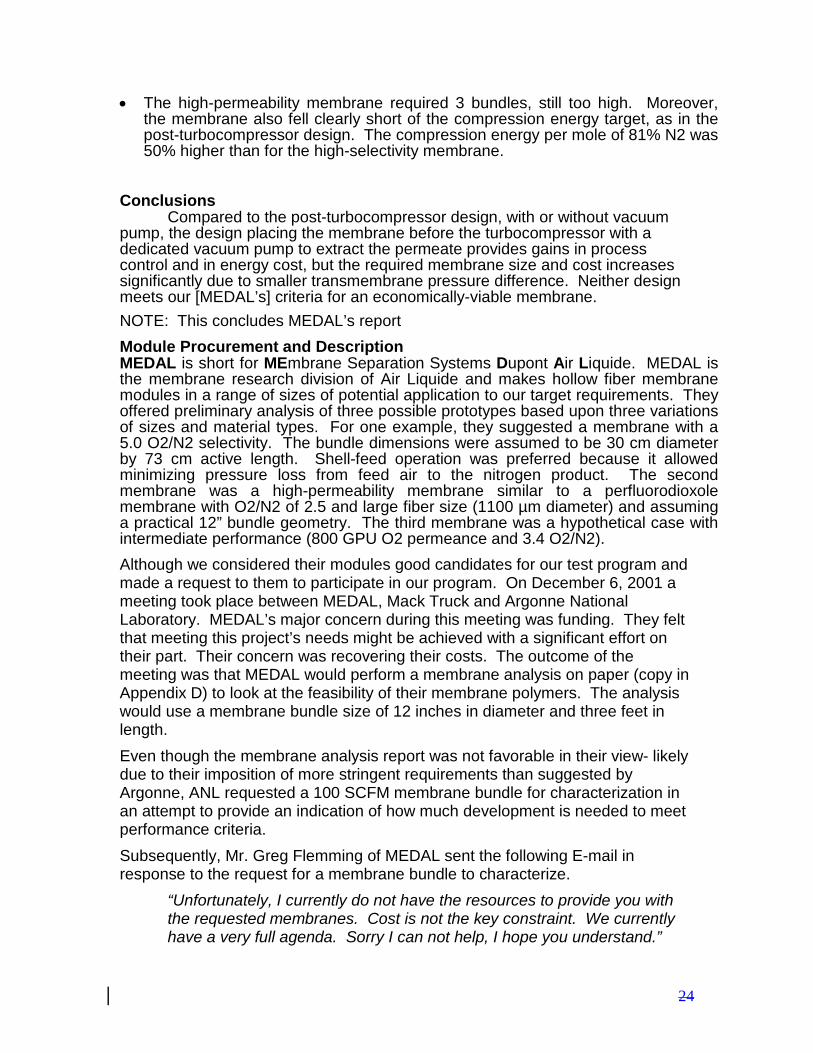
Conclusions Compared to the post-turbocompressor design, with or without vacuum pump, the design placing the membrane before the turbocompressor with a dedicated vacuum pump to extract the permeate provides gains in process control and in energy cost, but the required membrane size and cost increases significantly due to smaller transmembrane pressure difference. Neither design meets our [MEDAL’s] criteria for an economically-viable membrane. NOTE: This concludes MEDAL’s report Module Procurement and Description MEDAL is short for MEmbrane Separation Systems Dupont Air Liquide. MEDAL is the membrane research division of Air Liquide and makes hollow fiber membrane modules in a range of sizes of potential application to our target requirements. They offered preliminary analysis of three possible prototypes based upon three variations of sizes and material types. For one example, they suggested a membrane with a 5.0 O2/N2 selectivity. The bundle dimensions were assumed to be 30 cm diameter by 73 cm active length. Shell-feed operation was preferred because it allowed minimizing pressure loss from feed air to the nitrogen product. The second membrane was a high-permeability membrane similar to a perfluorodioxole membrane with O2/N2 of 2.5 and large fiber size (1100 µm diameter) and assuming a practical 12” bundle geometry. The third membrane was a hypothetical case with intermediate performance (800 GPU O2 permeance and 3.4 O2/N2). Although we considered their modules good candidates for our test program and made a request to them to participate in our program. On December 6, 2001 a meeting took place between MEDAL, Mack Truck and Argonne National Laboratory. MEDAL’s major concern during this meeting was funding. They felt that meeting this project’s needs might be achieved with a significant effort on their part. Their concern was recovering their costs. The outcome of the meeting was that MEDAL would perform a membrane analysis on paper (copy in Appendix D) to look at the feasibility of their membrane polymers. The analysis would use a membrane bundle size of 12 inches in diameter and three feet in length. Even though the membrane analysis report was not favorable in their view- likely due to their imposition of more stringent requirements than suggested by Argonne, ANL requested a 100 SCFM membrane bundle for characterization in an attempt to provide an indication of how much development is needed to meet performance criteria. Subsequently, Mr. Greg Flemming of MEDAL sent the following E-mail in response to the request for a membrane bundle to characterize.
“Unfortunately, I currently do not have the resources to provide you with the requested membranes. Cost is not the key constraint. We currently have a very full agenda. Sorry I can not help, I hope you understand.”
24
Anticipated Performance MEDAL’s analysis of the three different membranes (copy of report given in Appendix D) was based on parameters from a previous study that were considerably different than those proposed by Argonne and Mack Truck for the current target engine. Consequently, their conclusions may not directly pertain to our target engine requirements, but their report does provide significant information on potential modules. Because MEDAL chose not to supply modules for our testing, but did provide some data and analysis, we have only reviewed this material to develop anticipated performance. From the data provided, we concluded that some of their membrane materials had good potential for high separation factors (up to 5 O2/N2), but that their gas permeation rates were apparently not adequate to provide acceptable size or form factor without some further development or modification. However, we still deem these of interest for testing because they offer the possibility of higher separation factors than any of the other modules we have tested to date. Work in Prospect Although MEDAL has not yet agreed to provide modules for our testing, we will continue to evaluate the data provided in their report utilizing the results of our computational modeling and attempt to maintain contact with them to assess their recent developments and develop laboratory data with their modules.
24
Appendix E. Avir Modules Test Objectives We chose to make the first runs on our rebuilt bench using modules that, if damaged during the bench shakedown tests, would not delay the program. The modules selected were on hand and had been previously subjected to a variety of tests. The test runs were selected to enable characterizing the modules over the range of anticipated target engine pressures, but at ambient temperatures, while establishing the correct operation of our reworked test bench. Test Program and Parameters During preliminary leak testing, limited test results were obtained for the (Avir) module at pressures under the 15 psig level: 5, 10, and 15 psig feed. The feed (house air) was thoroughly filtered of droplets and dusts as well as conditioned with a vapor absorber. Retentate flows were varied from zero to about 20 SCF/hr. Three modules were installed in a single chamber. These were manifolded at each end with double end caps using O-rings. The permeate was manifolded into the containing chamber and out a side port. Supplier’s Data The three elements installed for these tests were marked as follows:
A/G Technology Corporation Avir Gas Separation ® US Patent 4,681,605 34 Wexford Street Needham MA 02194 Model No. GSP-SEI-75M Maximum Air Supply 110 psig Maximum Air Temperature 40 C
Element 1 Element 2 Element 3
Serial No. 7A8A9A302201AL 2A3A4A302301AL 16A30123A301301JD
Nominal Capacity, SCFM
10 12 12
Oxygen, % 30 31 31
Temperature, C 24 24 22
Pressure, psig 60 60 60
Table 2: Avir Gas Separation Module specifications
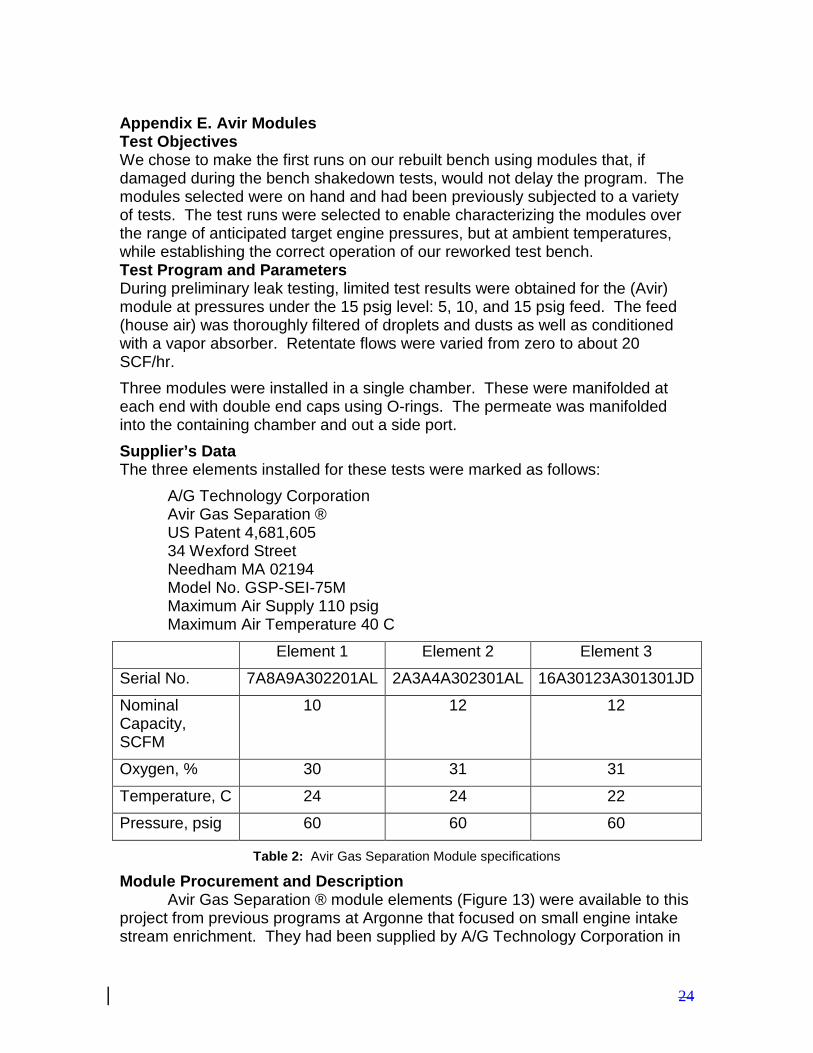
Module Procurement and Description Avir Gas Separation ® module elements (Figure 13) were available to this
project from previous programs at Argonne that focused on small engine intake stream enrichment. They had been supplied by A/G Technology Corporation in
24
Needham MA. Three module elements were selected from this group of modules and enclosed in a single chamber (Figure 14), in effect, operated in parallel, with individual feeds, retentates, and permeates manifolded to result in a three port module. Each element measured 51 inches long (full diameter distance) and 3 inches in diameter.
Figure 17: Single Avir membrane module element
51 inches long
3 inch dia.
Permeate
Feed Retentate
24
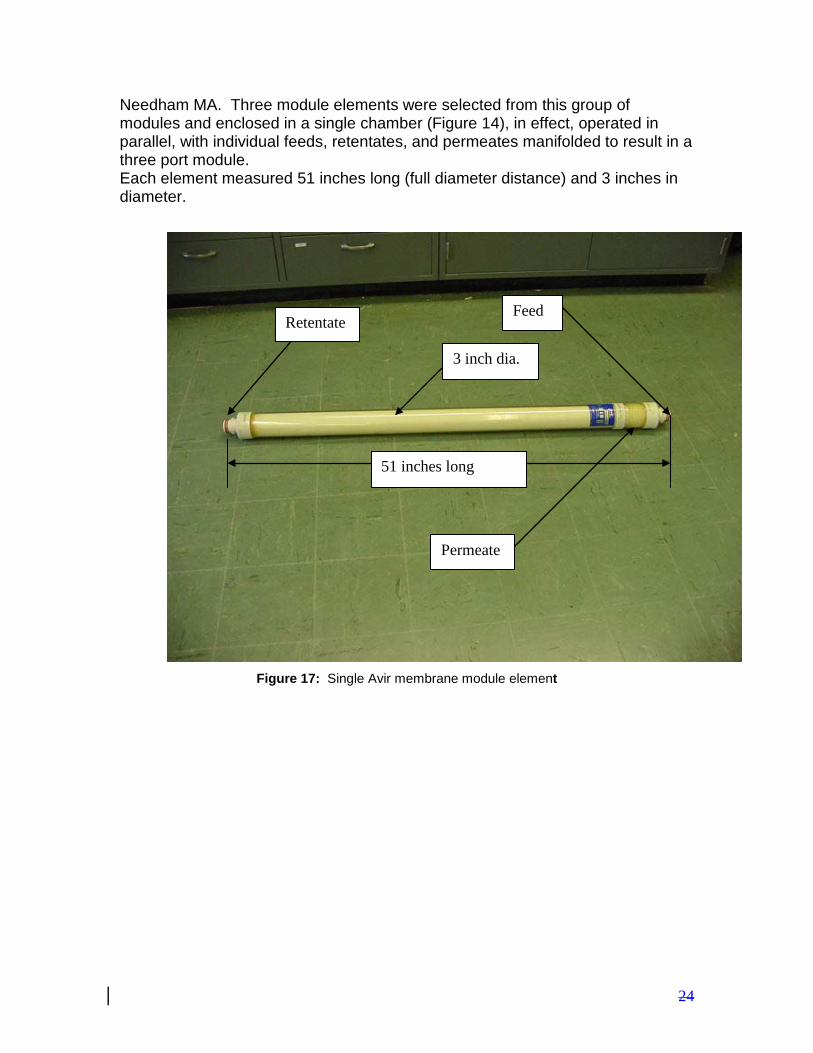
Figure 18: Membrane Module Chamber
Permeate Port
Retentate Port
Feed Port
Membrane Module Chamber, 7 inches in diameter, 57 inches long
24
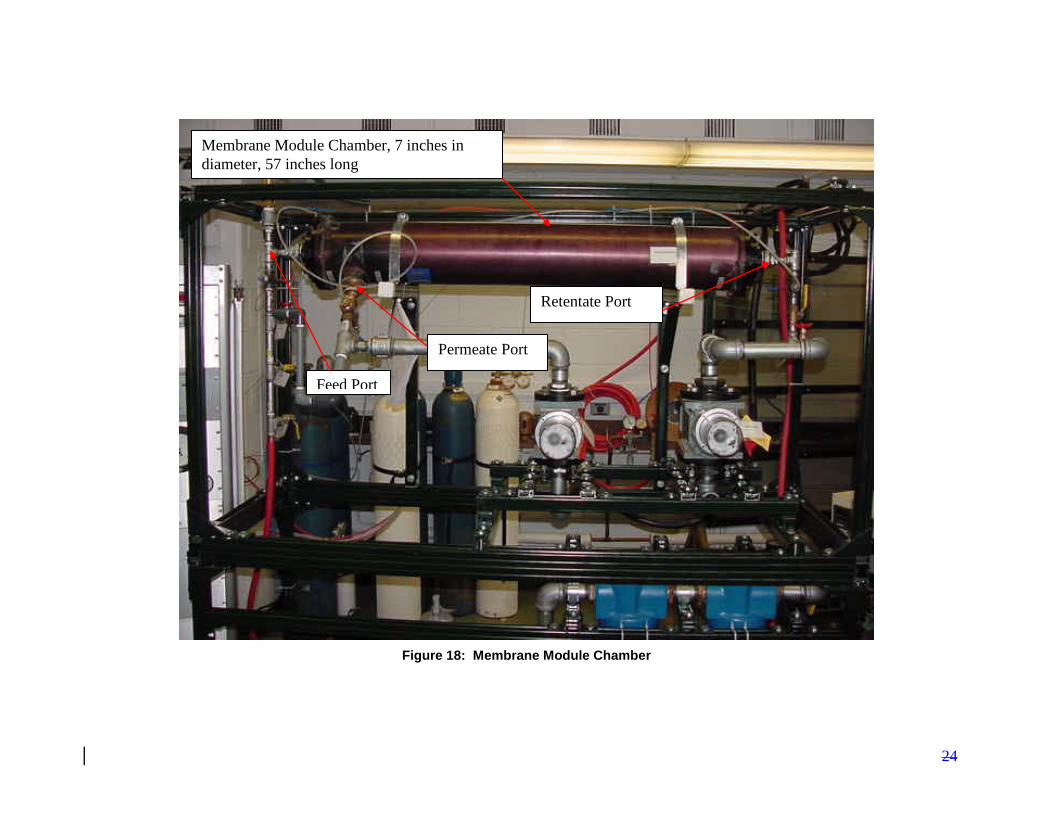
The module elements utilized a tube and shell configuration with potted
ends leading to the feed and retentate ends. Permeate was released through cross bores into the individual module elements as shown in Figure 15.
Figure 19: Permeate Vent Crossbores
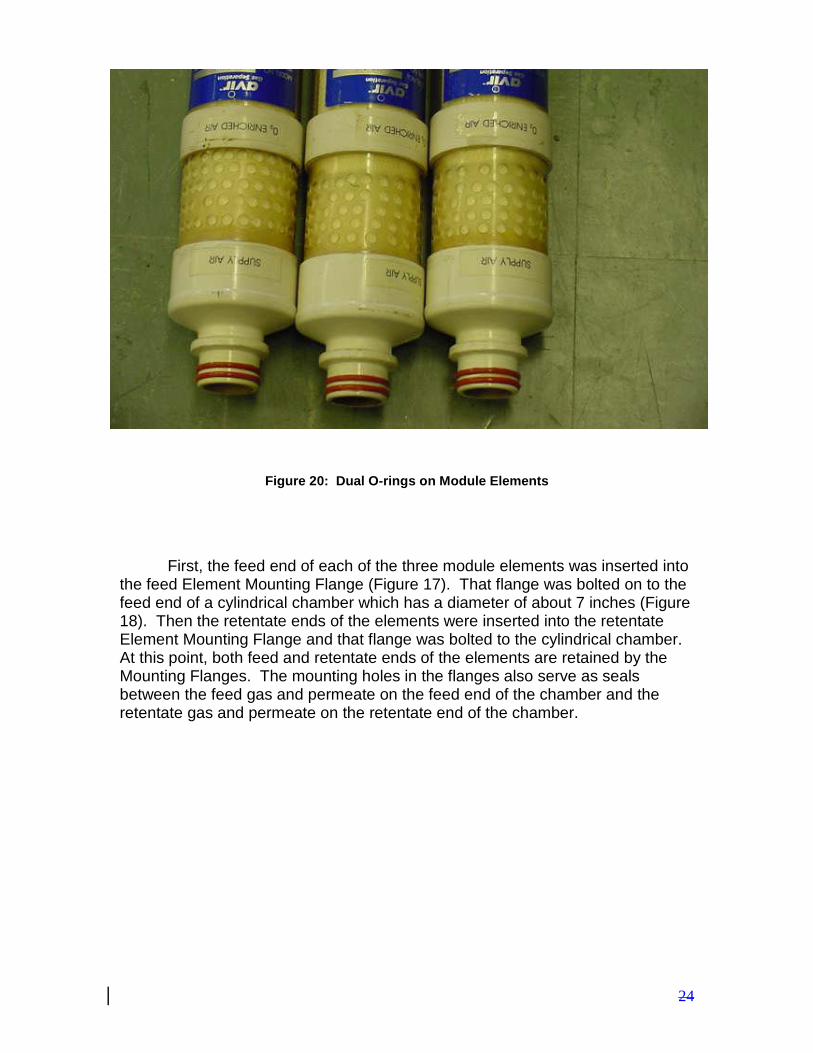
Module Mounting and Housing The three modules selected for testing were mounted in an outer chamber that measured 7-11/16 inches in diameter and was 52-3/4 inches long. The module chamber provides manifolding of the feeds, retentates, and the permeates into three separate ports. This is accomplished by mounting the elements on flanges at the feed and retentate ends. These streams are kept apart from the permeate with seals on the elements comprised of two O-rings at each end (Figure 16) that snugly fit into the flange holes.
Permeate Vent Ports
24
Figure 20: Dual O-rings on Module Elements
First, the feed end of each of the three module elements was inserted into the feed Element Mounting Flange (Figure 17). That flange was bolted on to the feed end of a cylindrical chamber which has a diameter of about 7 inches (Figure 18). Then the retentate ends of the elements were inserted into the retentate Element Mounting Flange and that flange was bolted to the cylindrical chamber. At this point, both feed and retentate ends of the elements are retained by the Mounting Flanges. The mounting holes in the flanges also serve as seals between the feed gas and permeate on the feed end of the chamber and the retentate gas and permeate on the retentate end of the chamber.
Dual O-rings
24
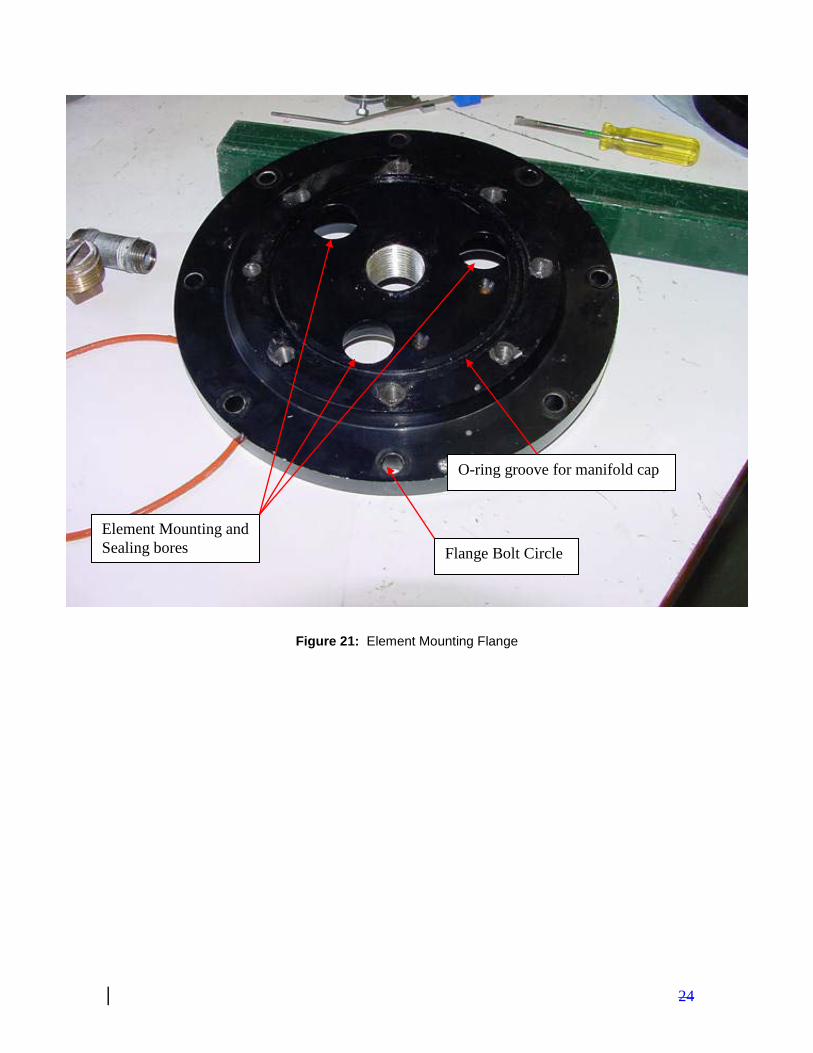
Figure 21: Element Mounting Flange
Element Mounting and Sealing bores
O-ring groove for manifold cap
Flange Bolt Circle
24
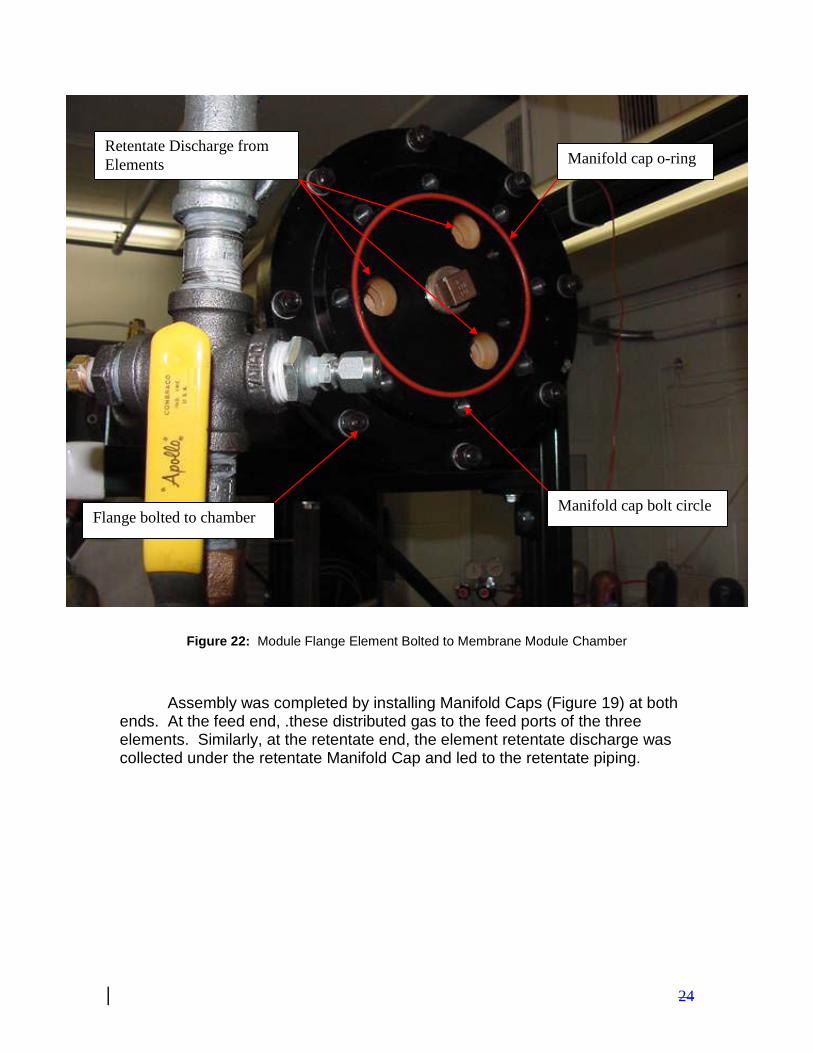
Figure 22: Module Flange Element Bolted to Membrane Module Chamber
Assembly was completed by installing Manifold Caps (Figure 19) at both
ends. At the feed end, .these distributed gas to the feed ports of the three elements. Similarly, at the retentate end, the element retentate discharge was collected under the retentate Manifold Cap and led to the retentate piping.
Retentate Discharge from Elements
Flange bolted to chamber Manifold cap bolt circle
Manifold cap o-ring
24
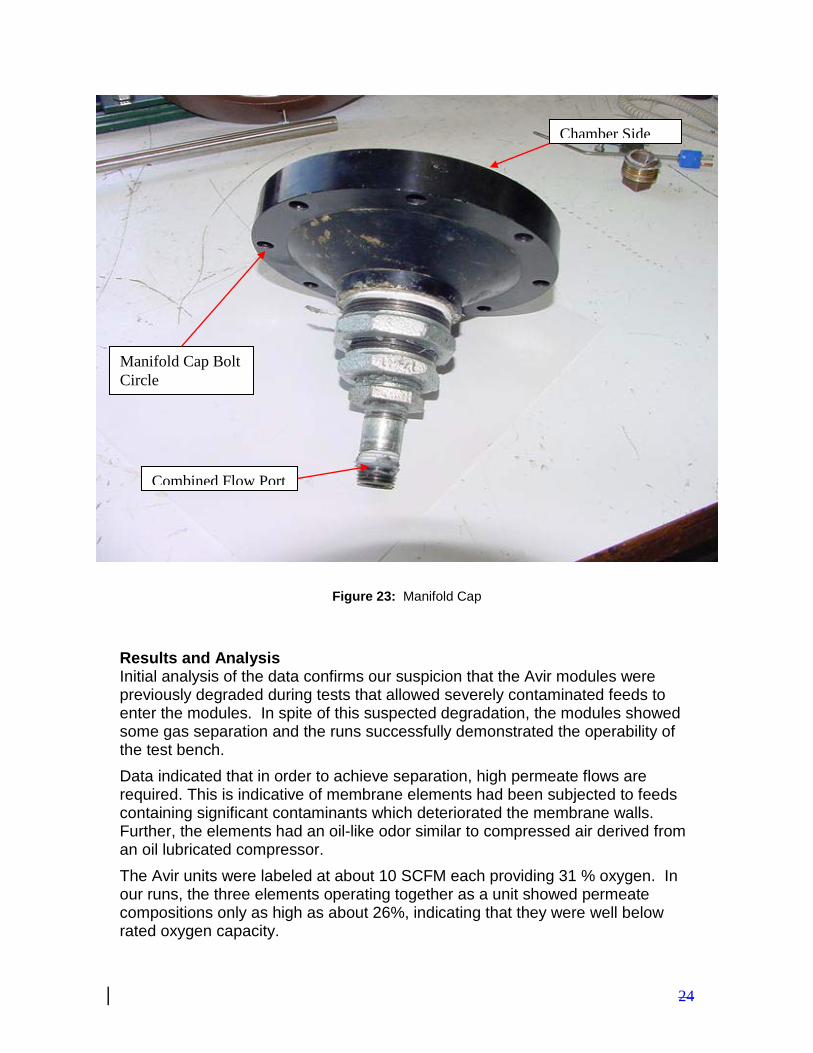
Figure 23: Manifold Cap
Results and Analysis Initial analysis of the data confirms our suspicion that the Avir modules were previously degraded during tests that allowed severely contaminated feeds to enter the modules. In spite of this suspected degradation, the modules showed some gas separation and the runs successfully demonstrated the operability of the test bench. Data indicated that in order to achieve separation, high permeate flows are required. This is indicative of membrane elements had been subjected to feeds containing significant contaminants which deteriorated the membrane walls. Further, the elements had an oil-like odor similar to compressed air derived from an oil lubricated compressor. The Avir units were labeled at about 10 SCFM each providing 31 % oxygen. In our runs, the three elements operating together as a unit showed permeate compositions only as high as about 26%, indicating that they were well below rated oxygen capacity.
Chamber Side
Manifold Cap Bolt Circle
Combined Flow Port
24
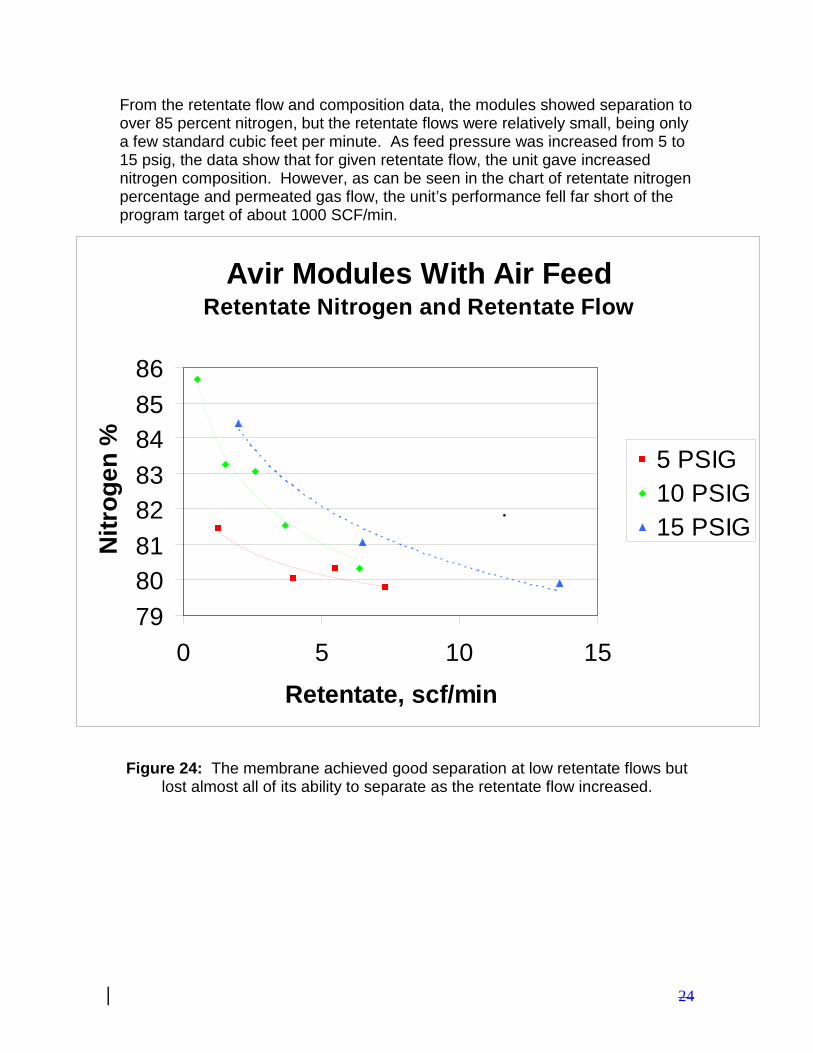
From the retentate flow and composition data, the modules showed separation to over 85 percent nitrogen, but the retentate flows were relatively small, being only a few standard cubic feet per minute. As feed pressure was increased from 5 to 15 psig, the data show that for given retentate flow, the unit gave increased nitrogen composition. However, as can be seen in the chart of retentate nitrogen percentage and permeated gas flow, the unit’s performance fell far short of the program target of about 1000 SCF/min.
Avir Modules With Air FeedRetentate Nitrogen and Retentate Flow
7980818283848586
0 5 10 15
Retentate, scf/min
Nitr
ogen
% 5 PSIG10 PSIG15 PSIG
.
Figure 24: The membrane achieved good separation at low retentate flows but
lost almost all of its ability to separate as the retentate flow increased.
24
Avir Modules With Air FeedRetentate Nitrogen and Permeate Flow
7980818283848586
0 1 2 3 4 5 6
Permeate, scf/min
Nitr
ogen
% 5 PSIG10 PSIG15 PSIG
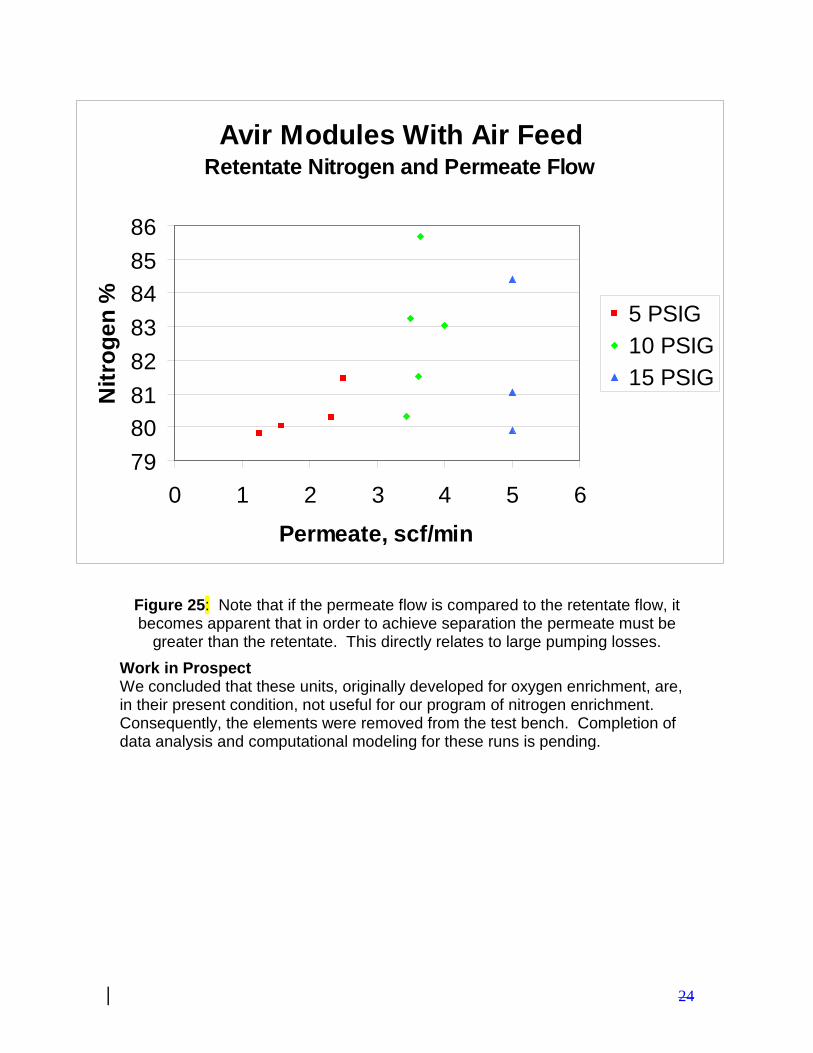
Figure 25: Note that if the permeate flow is compared to the retentate flow, it becomes apparent that in order to achieve separation the permeate must be
greater than the retentate. This directly relates to large pumping losses. Work in Prospect We concluded that these units, originally developed for oxygen enrichment, are, in their present condition, not useful for our program of nitrogen enrichment. Consequently, the elements were removed from the test bench. Completion of data analysis and computational modeling for these runs is pending.
24
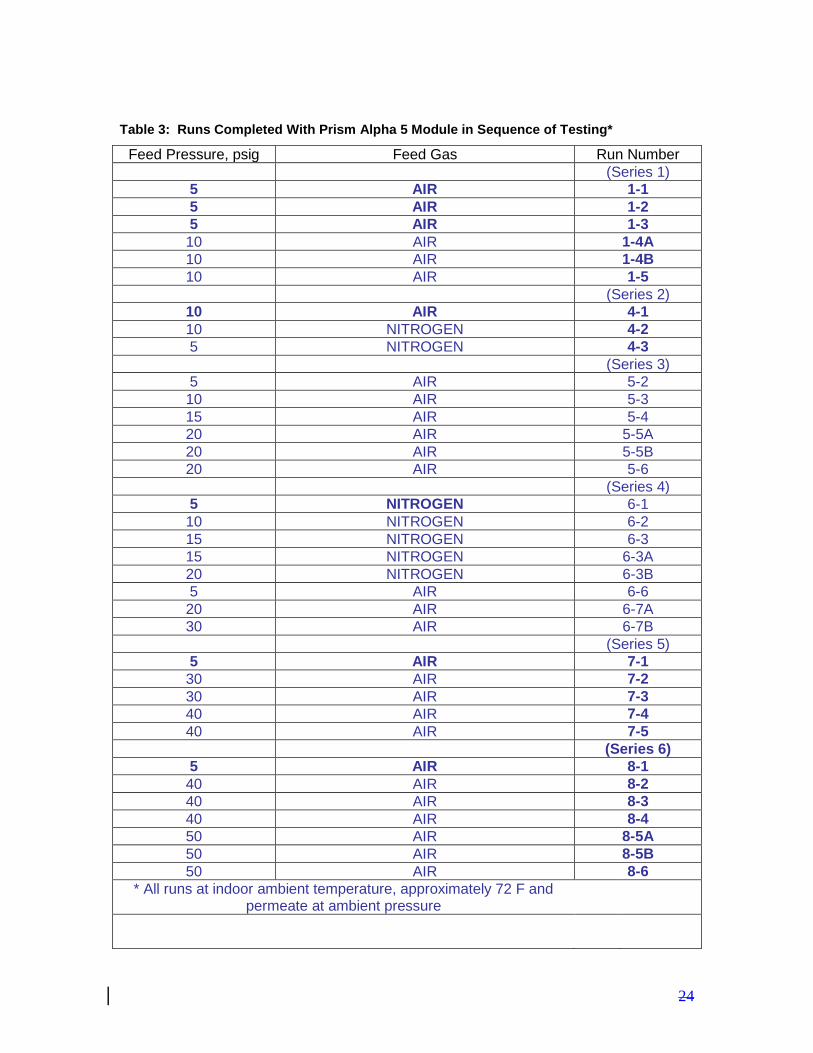
Appendix F. Prism Modules Test Objectives The Prism unit was the first new module to be tested under the current program. Although this unit appeared promising for our application, little data was available from the manufacturer that directly pertained to the operating conditions we anticipated for operation with the target engine. Consequently, a full mapping out of the module’s permeation parameters was planned so that the results could be analyzed with the computational model. These would lead to an initial specification of minimum performance needed to achieve target engine objectives. Test Program and Parameters The tests were completed using as feed gas fully filtered house air at indoor ambient temperatures from 5 psig up to 50 psig. Pure gas tests with nitrogen and carbon dioxide from 5 to 10 psig feed were conduced at ambient temperatures. Permeate was collected at ambient pressure (less than about an inch of water column pressure resulting from pressure drop across exit lines and flow meter) retentate flows were set from about 1 to 30 SCF/min. Table 3 gives the run conditions and sequence in which they were conducted. Due to a gage limitation of 5 psi from feed to retentate, runs at higher flows were restricted to about 23 SCF/min retentate. Runs were limited to 50-psig feed, as this was the manufacturer’s upper operating pressure. All runs were carried out with the permeate at about ambient pressure. Test runs were initiated at 5 psig with the fully filtered house air. Generally, three retentate flows were set at a given pressure. Then, the feed pressure was changed and another set of retentate flows was run. This continued over a series of tests up to 50-psig feed designed to detect noticeable degradation in performance related solely to exposure to pressure. Running the modules through a cycle of increasing pressures and returning to lower reference pressures accomplished this. Further, tests were made with pure gases at 5, 10, 15, and 10 psig to establish a base line of permeate flow. Higher pure gas test runs were not made, as these were the maximum we could supply at the needed flows. Pure gas runs at these pressures were deemed adequate for later data analysis.
24
Table 3: Runs Completed With Prism Alpha 5 Module in Sequence of Testing*
Feed Pressure, psig Feed Gas Run Number (Series 1)
5 AIR 1-1 5 AIR 1-2 5 AIR 1-3 10 AIR 1-4A 10 AIR 1-4B 10 AIR 1-5 (Series 2)
10 AIR 4-1 10 NITROGEN 4-2 5 NITROGEN 4-3 (Series 3)
5 AIR 5-2 10 AIR 5-3 15 AIR 5-4 20 AIR 5-5A 20 AIR 5-5B 20 AIR 5-6 (Series 4)
5 NITROGEN 6-1 10 NITROGEN 6-2 15 NITROGEN 6-3 15 NITROGEN 6-3A 20 NITROGEN 6-3B 5 AIR 6-6 20 AIR 6-7A 30 AIR 6-7B (Series 5)
5 AIR 7-1 30 AIR 7-2 30 AIR 7-3 40 AIR 7-4 40 AIR 7-5 (Series 6)
5 AIR 8-1 40 AIR 8-2 40 AIR 8-3 40 AIR 8-4 50 AIR 8-5A 50 AIR 8-5B 50 AIR 8-6
* All runs at indoor ambient temperature, approximately 72 F and permeate at ambient pressure
24
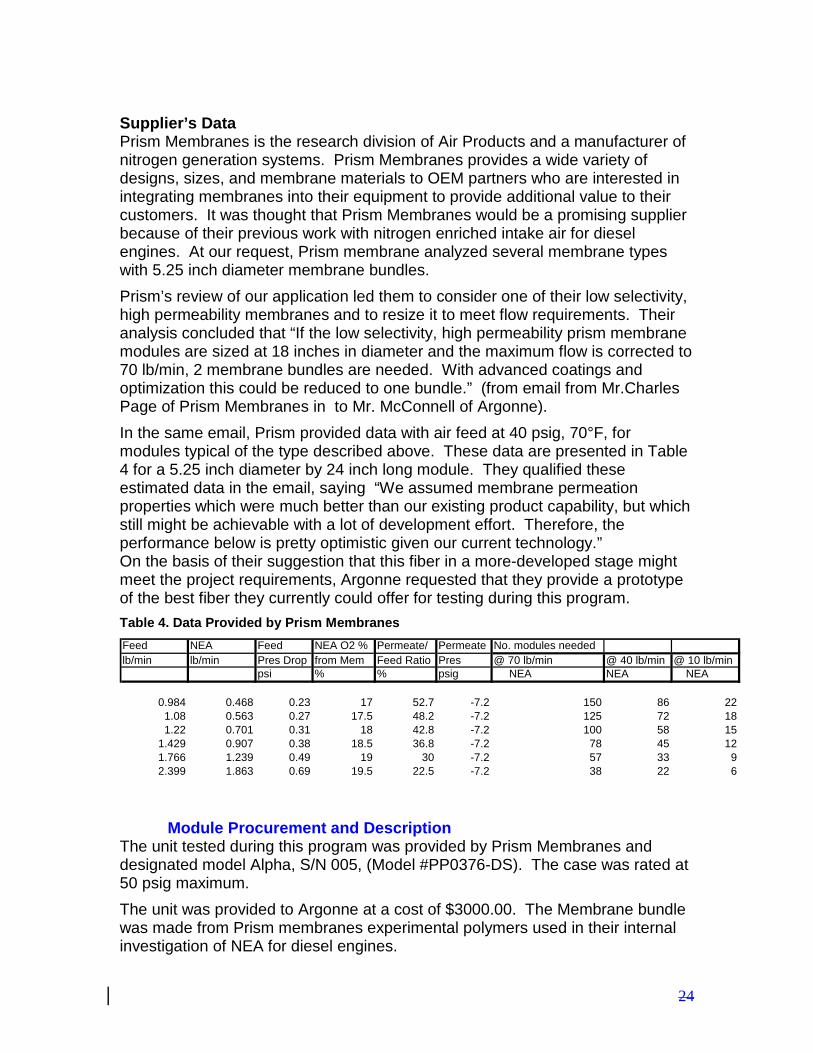
Supplier’s Data Prism Membranes is the research division of Air Products and a manufacturer of nitrogen generation systems. Prism Membranes provides a wide variety of designs, sizes, and membrane materials to OEM partners who are interested in integrating membranes into their equipment to provide additional value to their customers. It was thought that Prism Membranes would be a promising supplier because of their previous work with nitrogen enriched intake air for diesel engines. At our request, Prism membrane analyzed several membrane types with 5.25 inch diameter membrane bundles. Prism’s review of our application led them to consider one of their low selectivity, high permeability membranes and to resize it to meet flow requirements. Their analysis concluded that “If the low selectivity, high permeability prism membrane modules are sized at 18 inches in diameter and the maximum flow is corrected to 70 lb/min, 2 membrane bundles are needed. With advanced coatings and optimization this could be reduced to one bundle.” (from email from Mr.Charles Page of Prism Membranes in to Mr. McConnell of Argonne). In the same email, Prism provided data with air feed at 40 psig, 70°F, for modules typical of the type described above. These data are presented in Table 4 for a 5.25 inch diameter by 24 inch long module. They qualified these estimated data in the email, saying “We assumed membrane permeation properties which were much better than our existing product capability, but which still might be achievable with a lot of development effort. Therefore, the performance below is pretty optimistic given our current technology.” On the basis of their suggestion that this fiber in a more-developed stage might meet the project requirements, Argonne requested that they provide a prototype of the best fiber they currently could offer for testing during this program. Table 4. Data Provided by Prism Membranes Feed NEA Feed NEA O2 % Permeate/ Permeate No. modules neededlb/min lb/min Pres Drop from Mem Feed Ratio Pres @ 70 lb/min @ 40 lb/min @ 10 lb/min
psi % % psig NEA NEA NEA
0.984 0.468 0.23 17 52.7 -7.2 150 86 221.08 0.563 0.27 17.5 48.2 -7.2 125 72 181.22 0.701 0.31 18 42.8 -7.2 100 58 15
1.429 0.907 0.38 18.5 36.8 -7.2 78 45 121.766 1.239 0.49 19 30 -7.2 57 33 92.399 1.863 0.69 19.5 22.5 -7.2 38 22 6
Module Procurement and Description
The unit tested during this program was provided by Prism Membranes and designated model Alpha, S/N 005, (Model #PP0376-DS). The case was rated at 50 psig maximum. The unit was provided to Argonne at a cost of $3000.00. The Membrane bundle was made from Prism membranes experimental polymers used in their internal investigation of NEA for diesel engines.
24
The Prism Alpha 5 module was supplied in a single chamber with three ports. Two of these ports were used to bring out connections to the module’s feed and retentate. The permeate was vented from the module through ports opening from the circumference of the chamber. The unit measured 24-1/2 inches long (full diameter distance) and about 4 inches in diameter. The module is shown in Figure 22. The module was obtained as the result of a meeting that took place between staff of Prism Membrane, Mack Truck and Argonne National Laboratory. The major concern expressed by Prism Membranes during this meeting was that if a module supplied by Prism Membranes could not meet our requirements, they would not be paid for their work. The solution to the funding problem was to allow the development work to be rolled into the cost of the prototype. The final outcome of the meeting was that Prism Membrane would perform analysis on paper to look at the feasibility of their membrane. Prism Membrane subsequently agreed to supply a prototype membrane module for this study. The membrane fiber production line was shut down and enough fibers for several prototype membrane modules were spun. After several attempts to build a prototype, the sealing issues were solved and Prism Membrane supplied a working membrane module to ANL for characterization. This module is the best membrane they have for our application. They are providing this membrane as an indicator of what Prism’s membrane performance is with respect to this application. It will also provide an indication of how much development is needed to meet our performance criteria.
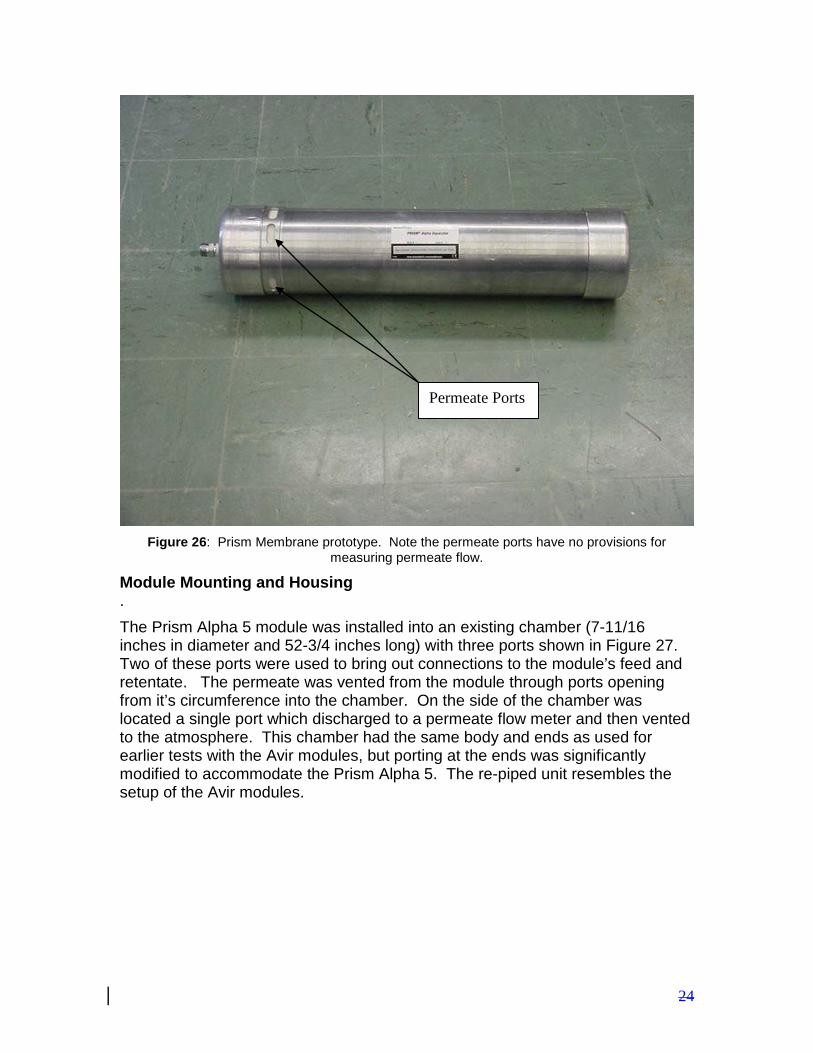
24
Figure 26: Prism Membrane prototype. Note the permeate ports have no provisions for
measuring permeate flow.
Module Mounting and Housing . The Prism Alpha 5 module was installed into an existing chamber (7-11/16 inches in diameter and 52-3/4 inches long) with three ports shown in Figure 27. Two of these ports were used to bring out connections to the module’s feed and retentate. The permeate was vented from the module through ports opening from it’s circumference into the chamber. On the side of the chamber was located a single port which discharged to a permeate flow meter and then vented to the atmosphere. This chamber had the same body and ends as used for earlier tests with the Avir modules, but porting at the ends was significantly modified to accommodate the Prism Alpha 5. The re-piped unit resembles the setup of the Avir modules.
Permeate Ports
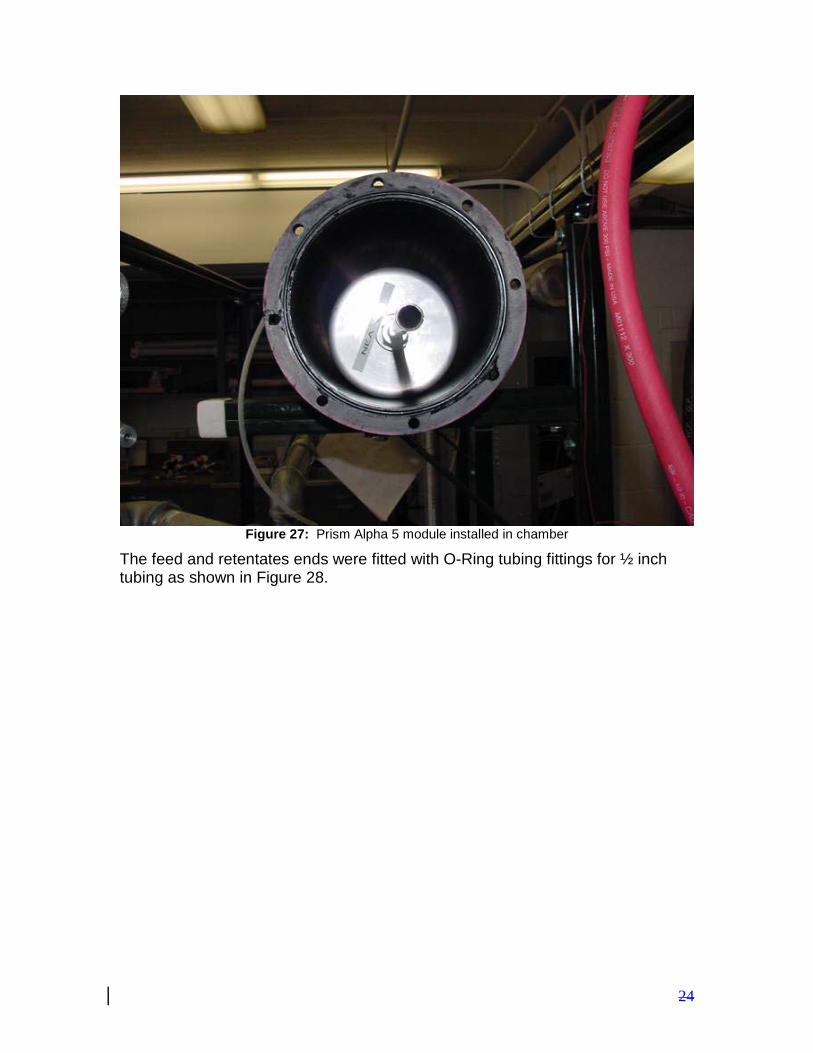
24
Figure 27: Prism Alpha 5 module installed in chamber
The feed and retentates ends were fitted with O-Ring tubing fittings for ½ inch tubing as shown in Figure 28.
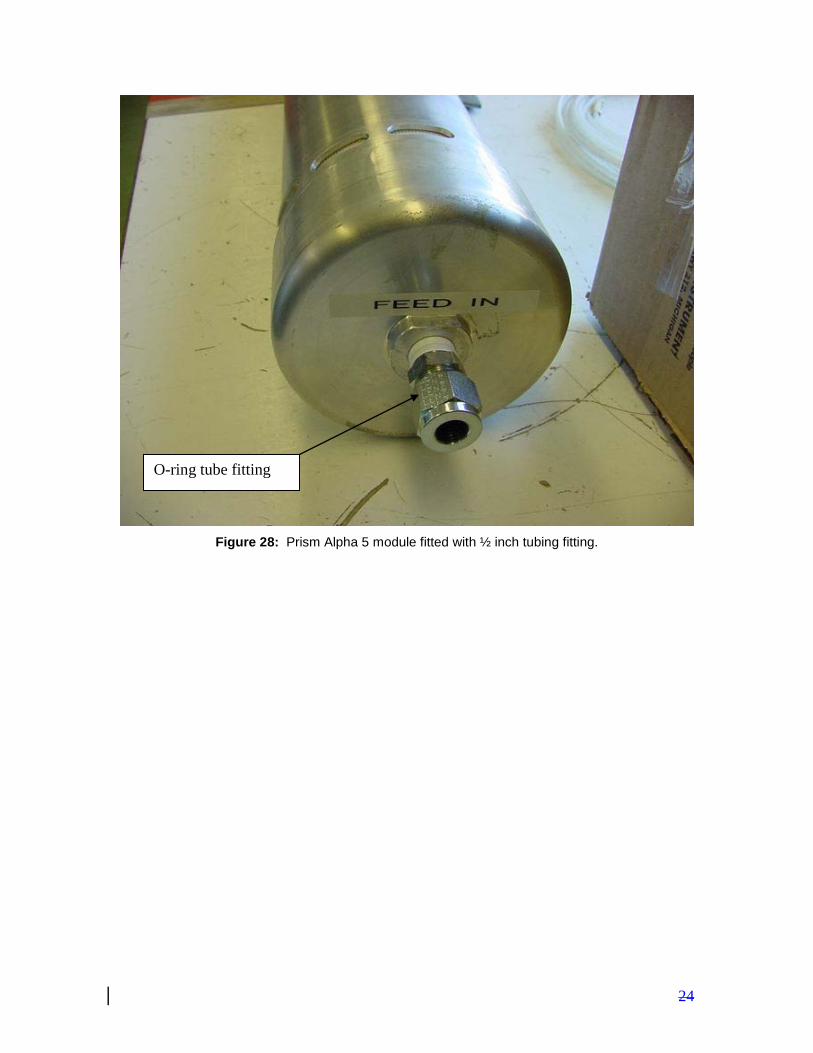
24
Figure 28: Prism Alpha 5 module fitted with ½ inch tubing fitting.
O-ring tube fitting
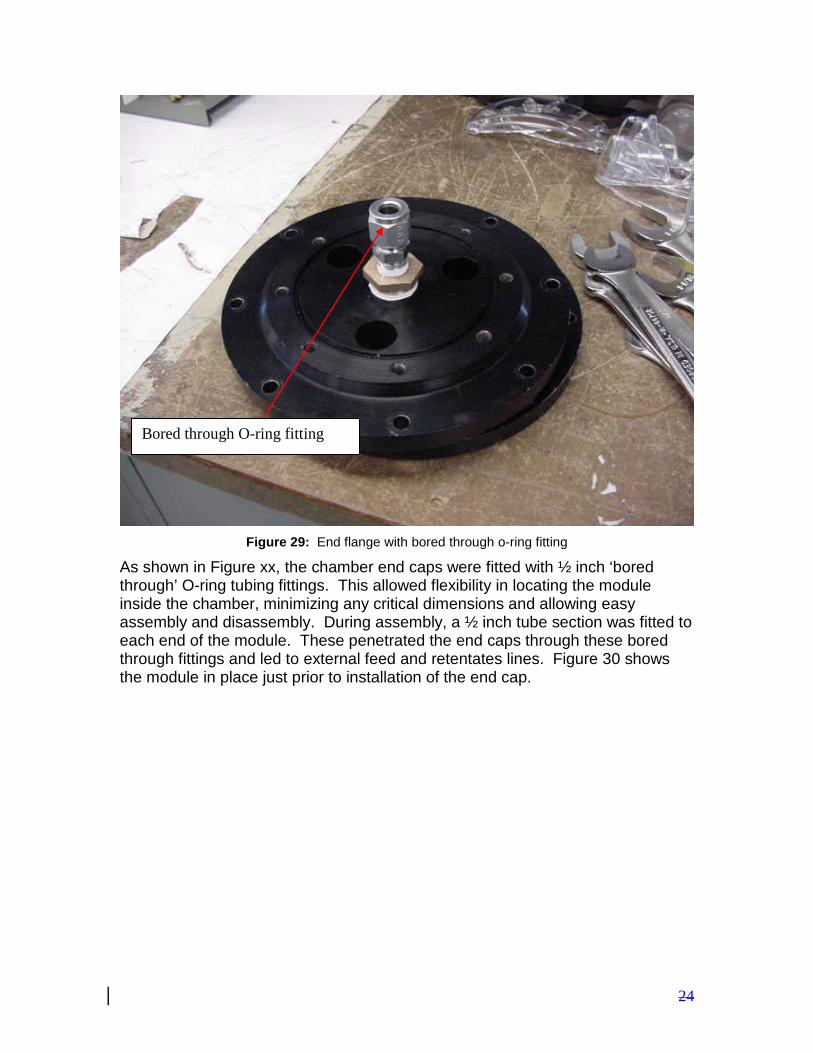
24
Figure 29: End flange with bored through o-ring fitting
As shown in Figure xx, the chamber end caps were fitted with ½ inch ‘bored through’ O-ring tubing fittings. This allowed flexibility in locating the module inside the chamber, minimizing any critical dimensions and allowing easy assembly and disassembly. During assembly, a ½ inch tube section was fitted to each end of the module. These penetrated the end caps through these bored through fittings and led to external feed and retentates lines. Figure 30 shows the module in place just prior to installation of the end cap.
Bored through O-ring fitting
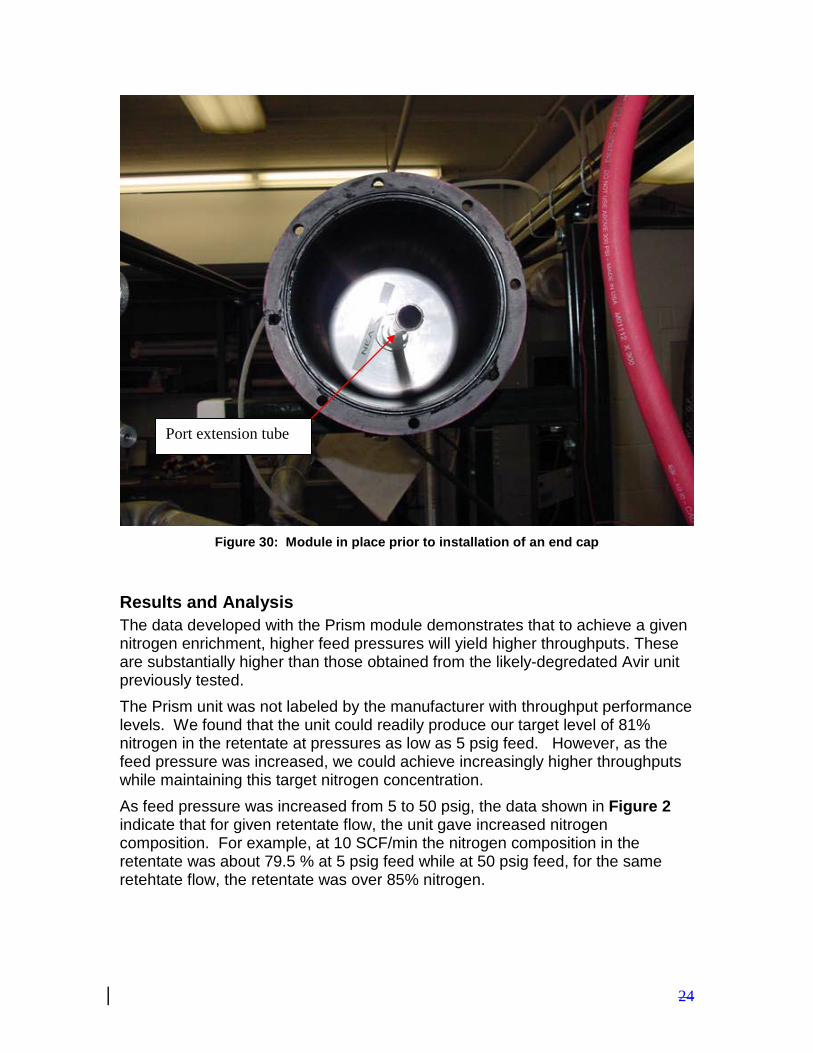
24
Figure 30: Module in place prior to installation of an end cap
Results and Analysis The data developed with the Prism module demonstrates that to achieve a given nitrogen enrichment, higher feed pressures will yield higher throughputs. These are substantially higher than those obtained from the likely-degredated Avir unit previously tested. The Prism unit was not labeled by the manufacturer with throughput performance levels. We found that the unit could readily produce our target level of 81% nitrogen in the retentate at pressures as low as 5 psig feed. However, as the feed pressure was increased, we could achieve increasingly higher throughputs while maintaining this target nitrogen concentration. As feed pressure was increased from 5 to 50 psig, the data shown in Figure 2 indicate that for given retentate flow, the unit gave increased nitrogen composition. For example, at 10 SCF/min the nitrogen composition in the retentate was about 79.5 % at 5 psig feed while at 50 psig feed, for the same retehtate flow, the retentate was over 85% nitrogen.
Port extension tube
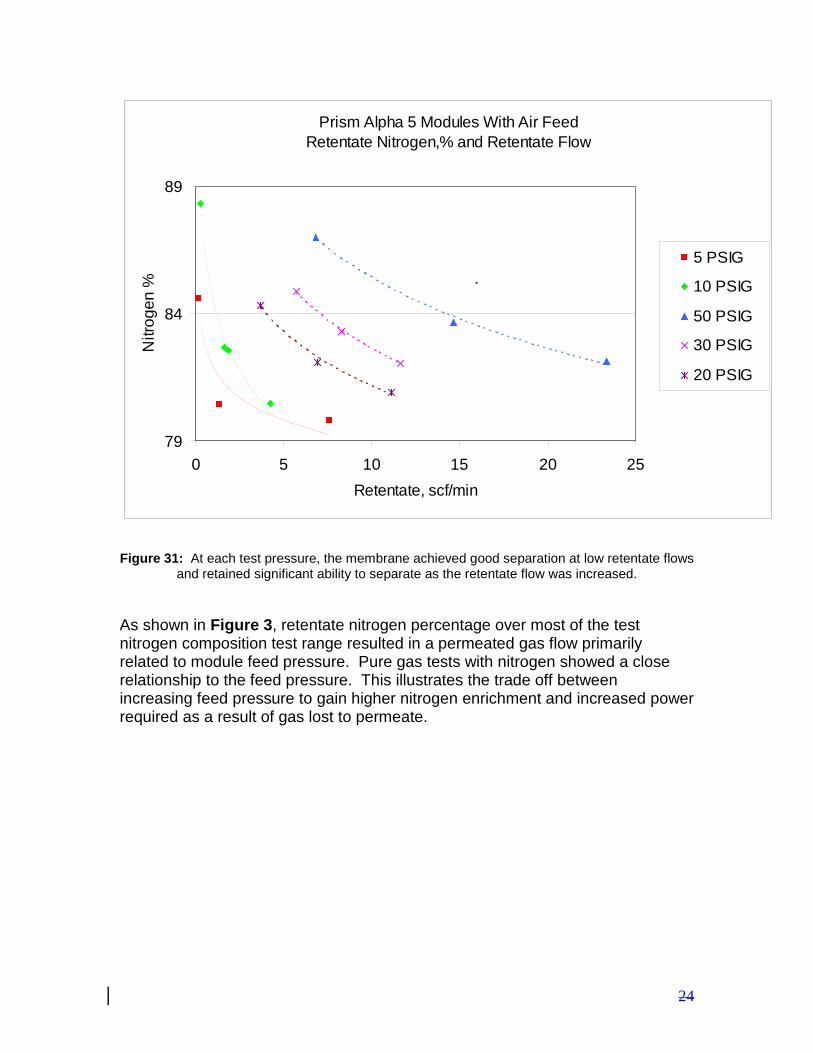
24
Prism Alpha 5 Modules With Air FeedRetentate Nitrogen,% and Retentate Flow
79
84
89
0 5 10 15 20 25Retentate, scf/min
Nitr
ogen
%
5 PSIG
10 PSIG
50 PSIG
30 PSIG
20 PSIG
.
Figure 31: At each test pressure, the membrane achieved good separation at low retentate flows
and retained significant ability to separate as the retentate flow was increased.
As shown in Figure 3, retentate nitrogen percentage over most of the test nitrogen composition test range resulted in a permeated gas flow primarily related to module feed pressure. Pure gas tests with nitrogen showed a close relationship to the feed pressure. This illustrates the trade off between increasing feed pressure to gain higher nitrogen enrichment and increased power required as a result of gas lost to permeate.
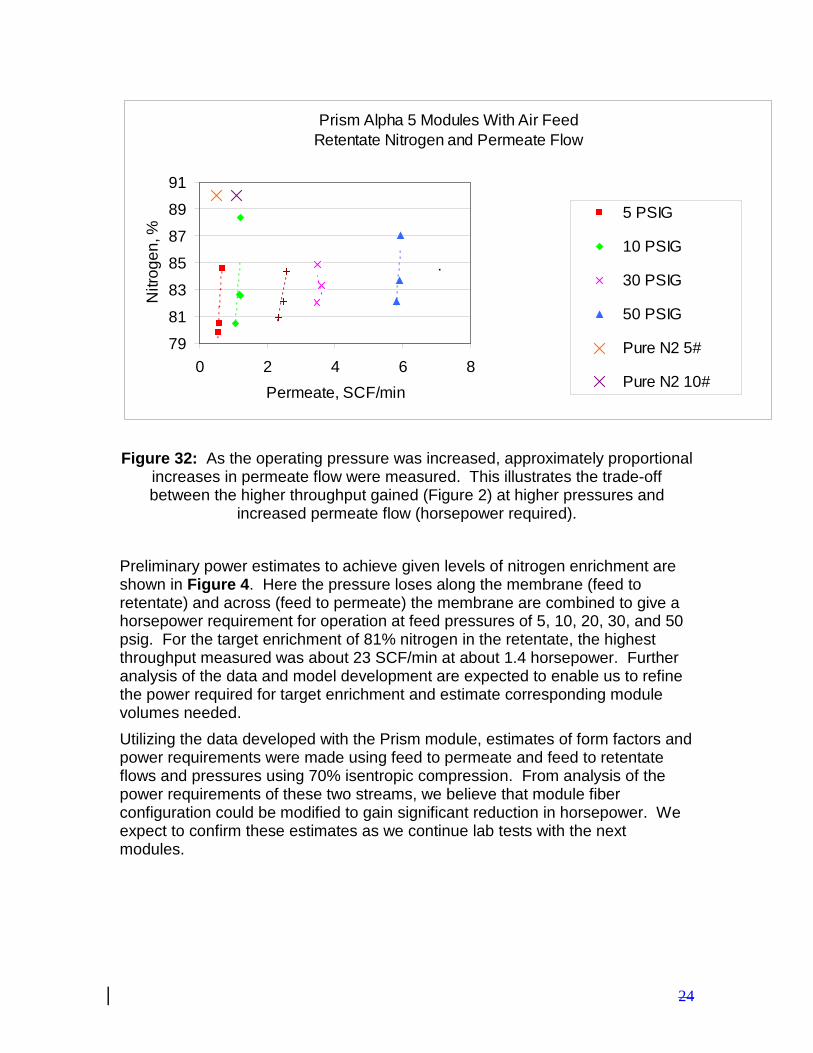
24
Prism Alpha 5 Modules With Air FeedRetentate Nitrogen and Permeate Flow
79
81
83
85
87
89
91
0 2 4 6 8Permeate, SCF/min
Nitr
ogen
, %
5 PSIG
10 PSIG
30 PSIG
50 PSIG
Pure N2 5#
Pure N2 10#
.
Figure 32: As the operating pressure was increased, approximately proportional increases in permeate flow were measured. This illustrates the trade-off between the higher throughput gained (Figure 2) at higher pressures and
increased permeate flow (horsepower required). Preliminary power estimates to achieve given levels of nitrogen enrichment are shown in Figure 4. Here the pressure loses along the membrane (feed to retentate) and across (feed to permeate) the membrane are combined to give a horsepower requirement for operation at feed pressures of 5, 10, 20, 30, and 50 psig. For the target enrichment of 81% nitrogen in the retentate, the highest throughput measured was about 23 SCF/min at about 1.4 horsepower. Further analysis of the data and model development are expected to enable us to refine the power required for target enrichment and estimate corresponding module volumes needed. Utilizing the data developed with the Prism module, estimates of form factors and power requirements were made using feed to permeate and feed to retentate flows and pressures using 70% isentropic compression. From analysis of the power requirements of these two streams, we believe that module fiber configuration could be modified to gain significant reduction in horsepower. We expect to confirm these estimates as we continue lab tests with the next modules.
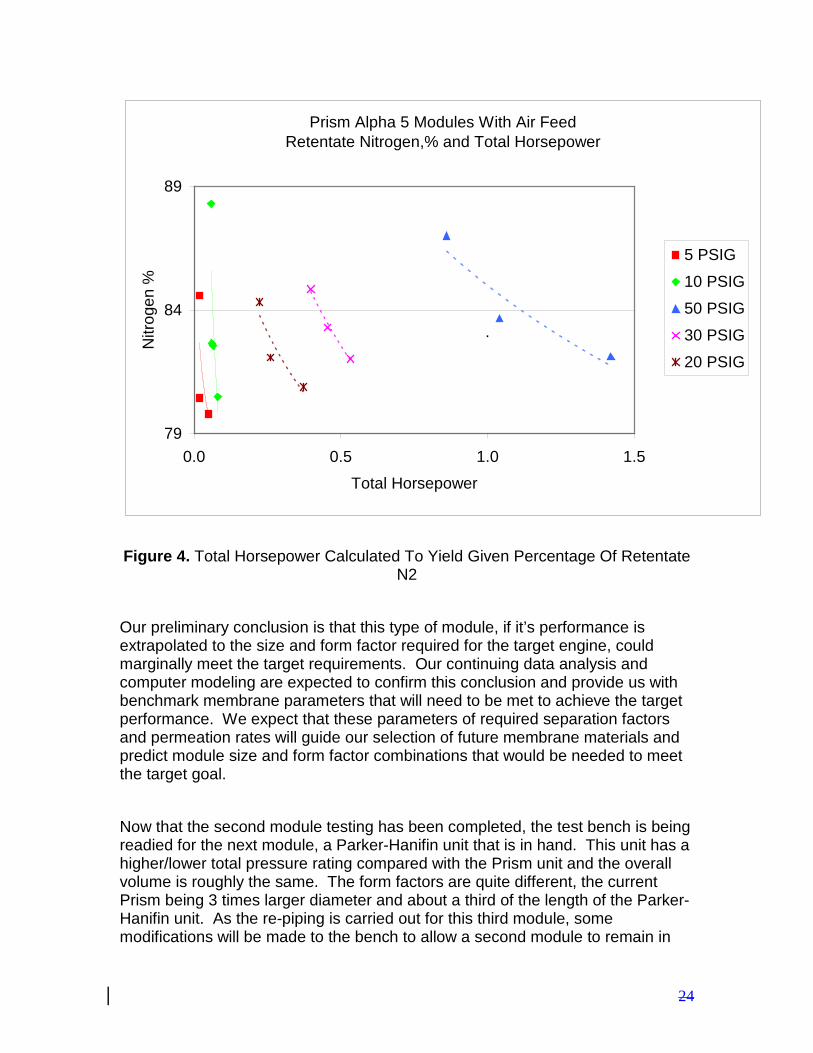
24
Prism Alpha 5 Modules With Air FeedRetentate Nitrogen,% and Total Horsepower
79
84
89
0.0 0.5 1.0 1.5
Total Horsepower
Nitr
ogen
%
5 PSIG
10 PSIG
50 PSIG
30 PSIG
20 PSIG
.
Figure 4. Total Horsepower Calculated To Yield Given Percentage Of Retentate
N2 Our preliminary conclusion is that this type of module, if it’s performance is extrapolated to the size and form factor required for the target engine, could marginally meet the target requirements. Our continuing data analysis and computer modeling are expected to confirm this conclusion and provide us with benchmark membrane parameters that will need to be met to achieve the target performance. We expect that these parameters of required separation factors and permeation rates will guide our selection of future membrane materials and predict module size and form factor combinations that would be needed to meet the target goal. Now that the second module testing has been completed, the test bench is being readied for the next module, a Parker-Hanifin unit that is in hand. This unit has a higher/lower total pressure rating compared with the Prism unit and the overall volume is roughly the same. The form factors are quite different, the current Prism being 3 times larger diameter and about a third of the length of the Parker-Hanifin unit. As the re-piping is carried out for this third module, some modifications will be made to the bench to allow a second module to remain in
24
position while a main module is tested. This will allow us to proceed with the new module while holding the current module in place in the case some additional tests are deemed necessary following complete data analysis. At this time, however, we believe that the current Prism module has been completely characterized to allow us to complete data analysis and determine the module’s anticipated suitability for the target 440 hp diesel truck engines. During these tests, nitrogen concentrations upwards of 90% were achieved at lower retentate flows and reject flows of over 20 SCF/min were sustained while producing retentate having over 80% nitrogen. Initial horsepower estimates were also made combining the pressure drop along the module (feed to retentate) and across the membrane (feed to permeate). These results show this single module element capable of providing about 3 % of the intake flow needs of the target engine (1024 SCF/min) at upwards of 3% enrichment of nitrogen (82%)while consuming 1.5 total horsepower. Preliminary extrapolation of these results to the target engine requirements suggest that the performance of a cluster of these modules would provide marginal performance. For example, if the module feed-to-retentate pressure drop were reduced by fiber reconfiguration and the effective separation factor was slightly increased, a target package of two 18 inch diameter bundles of 24 inch length with a 50 psig feed could be achieved at an estimated horsepower less than about 25. Our next module candidate (from Parker-Hanifin) is expected, based upon data supplied by the manufacturer, to exceed the parameters of the current Prism unit under test. These estimates and actual performance levels will be confirmed during our next lab tests.
24
Appendix G. Parker Hanifin and CMS Modules Test results with the Parker-Hanifin module showed generally improved performance compared with the Avir and Prism modules tested previously. This module provided more than adequate nitrogen enrichment with retentate flows higher and permeate flows as low or lower than modules previously tested. With the fibers and form factor as currently configured, we believe that this type of module could meet the intake NEA requirements set by our CRADA partner, Mack Truck, Inc. for a 440 hp diesel truck engine. However, as it is currently configured, we deem it not acceptable to reach the target energy requirements they specify. We believe this module does show promise because it was not designed specifically for our application but was able to produce the required target nitrogen level at the anticipated turbocharger operating pressures. Since the last report, the second module type tested, a Prism module (Alpha 5) manufactured by Air Products, was left in place in the test bench and decoupled from the bench gas flow system. Then, the Parker-Hanifin module was installed in the test bench and runs were carried out at feed pressures of 5, 20 and 30 psig. Following these tests, the module manifold was modified to allow installation of a module from CMS, Inc. This was completed and initial runs were undertaken at 5 and 10 psig feed pressure. All tests were conducted at indoor ambient temperatures with the permeate at ambient pressure. The experimental work planned for the Parker-Hanifin module has now been sufficiently completed to allow data reduction and evaluation. These results are presented in this report. During these tests with the Parker-Hanifin module, nitrogen concentrations up to almost 90% were achieved at retentate flows of over 2 SCF/min (20 psig feed). At the target 83% nitrogen NEA the module produced over 16 SCF/min (30 psig feed). The permeate flows ranged from about 1 to 5 SCF/min over the range of testing (5 to 30 psig feed). Initial horsepower estimates were made combining the pressure drop along the module (feed to retentate) and across the membrane (feed to permeate). These results show this single module element requires about 0.05 horsepower per SCF/min of 83% nitrogen NEA produced at 5 psig feed pressure. Considering that the target engine requires 866 SCF/min (70 lbs/min) of 83% NEA, this module, if packaged in a set and run in it’s current configuration, would require about 43 horsepower- a figure greater than the estimated acceptable horsepower for the Mack Truck target engine allocation of 23 or less. Because the permeation rate of the CMS, Inc. module exceeded the bench test measuring capacity for the permeate flow when feed pressures exceeded 10 psig, the data set for this module was not completed. We plan to resize the flow measurement equipment and then develop data at the higher feed pressures.
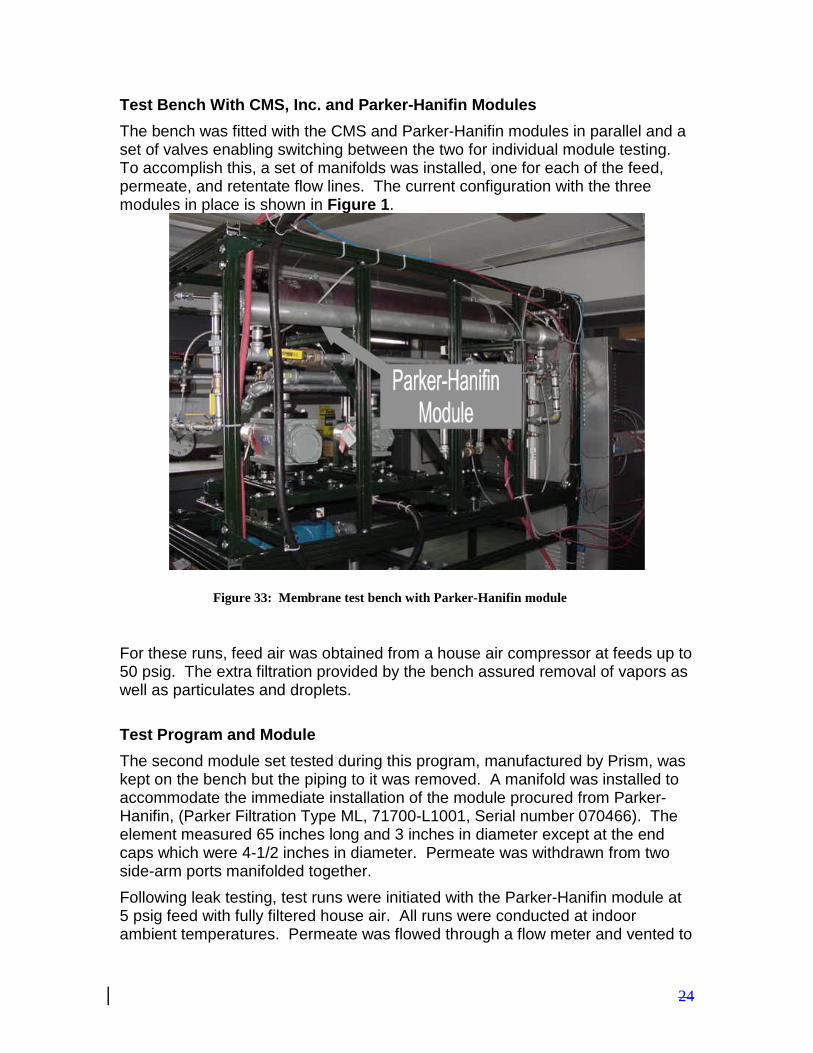
24
Test Bench With CMS, Inc. and Parker-Hanifin Modules The bench was fitted with the CMS and Parker-Hanifin modules in parallel and a set of valves enabling switching between the two for individual module testing. To accomplish this, a set of manifolds was installed, one for each of the feed, permeate, and retentate flow lines. The current configuration with the three modules in place is shown in Figure 1.
For these runs, feed air was obtained from a house air compressor at feeds up to 50 psig. The extra filtration provided by the bench assured removal of vapors as well as particulates and droplets. Test Program and Module The second module set tested during this program, manufactured by Prism, was kept on the bench but the piping to it was removed. A manifold was installed to accommodate the immediate installation of the module procured from Parker-Hanifin, (Parker Filtration Type ML, 71700-L1001, Serial number 070466). The element measured 65 inches long and 3 inches in diameter except at the end caps which were 4-1/2 inches in diameter. Permeate was withdrawn from two side-arm ports manifolded together. Following leak testing, test runs were initiated with the Parker-Hanifin module at 5 psig feed with fully filtered house air. All runs were conducted at indoor ambient temperatures. Permeate was flowed through a flow meter and vented to
Figure 33: Membrane test bench with Parker-Hanifin module
24
atmosphere. Generally, three retentate flows were set at a given pressure. Then, the feed pressure was changed and another set of retentate flows was run. This continued over a series of tests up to 30-psig feed designed to detect noticeable degradation in performance related solely to exposure to pressure. Running the modules through a cycle of increasing pressures and returning to lower reference pressures accomplished this. Subsequently, a module obtained from CMS, Inc. (Designated IMS #72, 591-76) was mounted on the bench and plumbed up to the manifold. This module was prepared and tested under similar conditions, but only at 5 and 10 psig feed pressures. Because of the high permeate flows encountered as the feed pressure was increased beyond 10 psig, we will need to modify the flow measurement equipment to accommodate the higher flows. Tests Completed Tests with the Parker-Hanifin module were completed at pressures of 5, 20, and 30 psig with air at indoor ambient temperature. All runs were carried out with the permeate at about ambient pressure (less than about an inch of water column pressure resulting from pressure drop across exit lines and flow meter). Tests with the CMS module were put on hold pending modification of the permeate flow measurement equipment to accommodate the higher-than-anticipated permeate flows encountered at feed pressures about 10 psig. Test Results Data analysis was completed for the Parker-Hanifin module. Results indicate that the module could be repeatedly operated up to 30 psig feed pressure and up to 5 psi feed to retentate pressure drop without indication of short term deterioration of performance. During the test runs, air could be upgraded to near 90% nitrogen. Data analyzed to date are seen in graphic form in Figures 1 and 2.
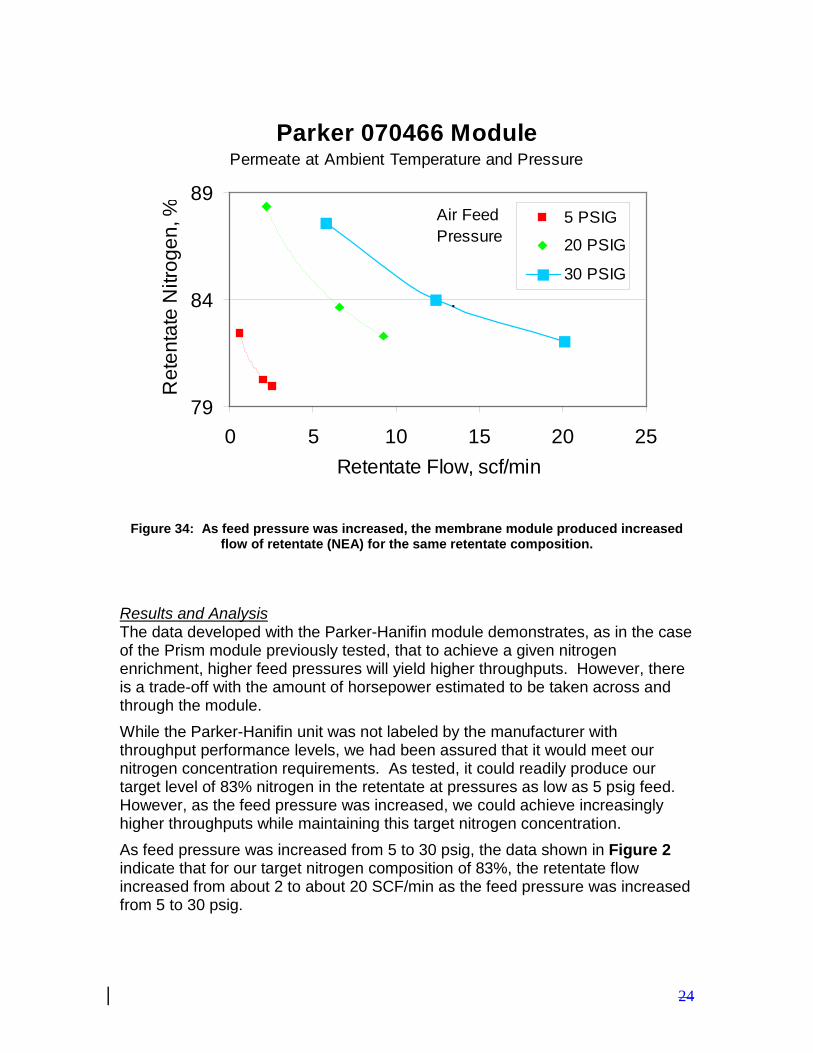
24
Parker 070466 ModulePermeate at Ambient Temperature and Pressure
79
84
89
0 5 10 15 20 25Retentate Flow, scf/min
Ret
enta
te N
itrog
en, % 5 PSIG
20 PSIG
30 PSIG
.
Air Feed Pressure
Figure 34: As feed pressure was increased, the membrane module produced increased flow of retentate (NEA) for the same retentate composition.
Results and Analysis The data developed with the Parker-Hanifin module demonstrates, as in the case of the Prism module previously tested, that to achieve a given nitrogen enrichment, higher feed pressures will yield higher throughputs. However, there is a trade-off with the amount of horsepower estimated to be taken across and through the module. While the Parker-Hanifin unit was not labeled by the manufacturer with throughput performance levels, we had been assured that it would meet our nitrogen concentration requirements. As tested, it could readily produce our target level of 83% nitrogen in the retentate at pressures as low as 5 psig feed. However, as the feed pressure was increased, we could achieve increasingly higher throughputs while maintaining this target nitrogen concentration. As feed pressure was increased from 5 to 30 psig, the data shown in Figure 2 indicate that for our target nitrogen composition of 83%, the retentate flow increased from about 2 to about 20 SCF/min as the feed pressure was increased from 5 to 30 psig.
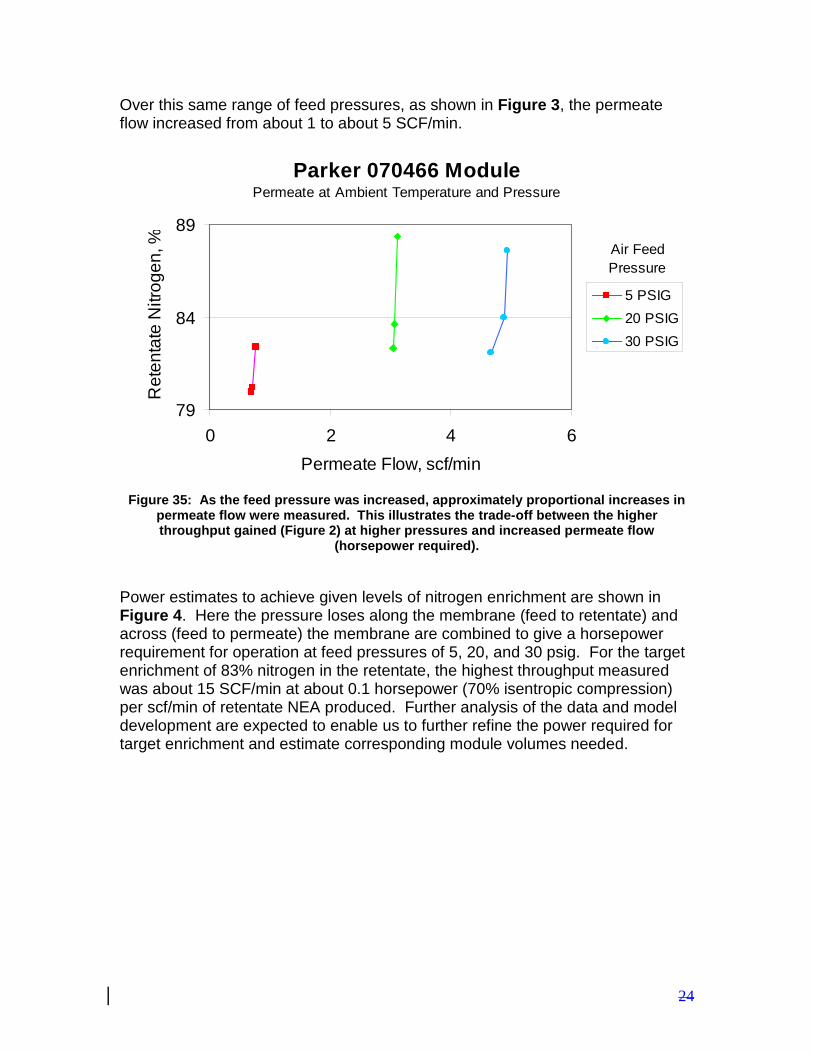
24
Over this same range of feed pressures, as shown in Figure 3, the permeate flow increased from about 1 to about 5 SCF/min.
Parker 070466 ModulePermeate at Ambient Temperature and Pressure
79
84
89
0 2 4 6Permeate Flow, scf/min
Ret
enta
te N
itrog
en, %
5 PSIG20 PSIG30 PSIG
Air Feed Pressure
Figure 35: As the feed pressure was increased, approximately proportional increases in
permeate flow were measured. This illustrates the trade-off between the higher throughput gained (Figure 2) at higher pressures and increased permeate flow
(horsepower required).
Power estimates to achieve given levels of nitrogen enrichment are shown in Figure 4. Here the pressure loses along the membrane (feed to retentate) and across (feed to permeate) the membrane are combined to give a horsepower requirement for operation at feed pressures of 5, 20, and 30 psig. For the target enrichment of 83% nitrogen in the retentate, the highest throughput measured was about 15 SCF/min at about 0.1 horsepower (70% isentropic compression) per scf/min of retentate NEA produced. Further analysis of the data and model development are expected to enable us to further refine the power required for target enrichment and estimate corresponding module volumes needed.
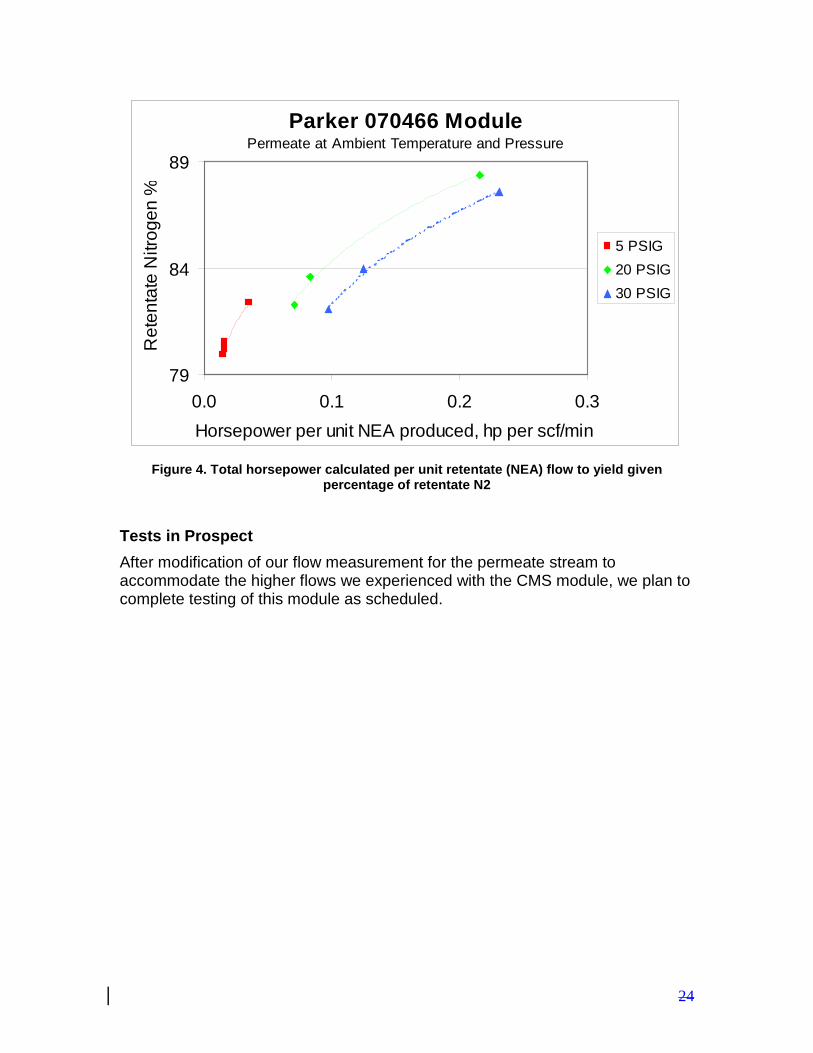
24
Parker 070466 ModulePermeate at Ambient Temperature and Pressure
79
84
89
0.0 0.1 0.2 0.3Horsepower per unit NEA produced, hp per scf/min
Ret
enta
te N
itrog
en %
5 PSIG20 PSIG30 PSIG
Figure 4. Total horsepower calculated per unit retentate (NEA) flow to yield given
percentage of retentate N2
Tests in Prospect After modification of our flow measurement for the permeate stream to accommodate the higher flows we experienced with the CMS module, we plan to complete testing of this module as scheduled.