
Heave, Roll and Pitch Damping of a Deepwater CALM … · Heave, Roll and Pitch Damping of a...
8
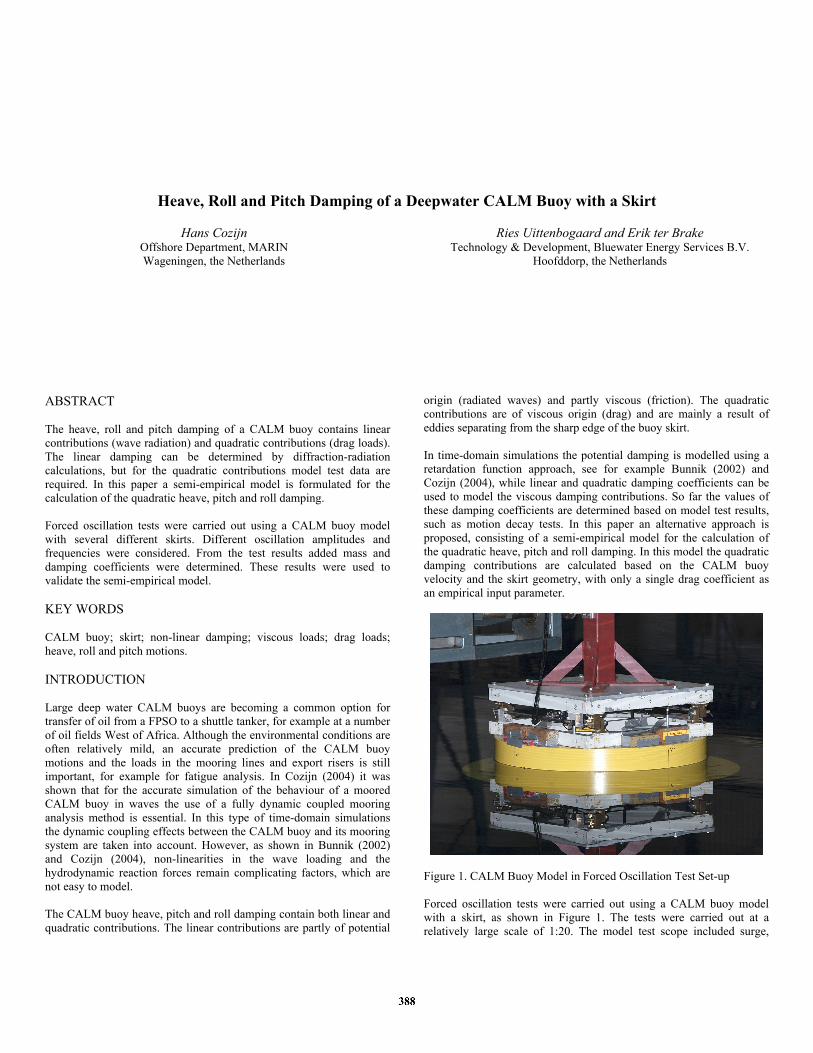
Heave, Roll and Pitch Damping of a Deepwater CALM Buoy with a Skirt Hans Cozijn Offshore Department, MARIN Wageningen, the Netherlands Ries Uittenbogaard and Erik ter Brake Technology & Development, Bluewater Energy Services B.V. Hoofddorp, the Netherlands ABSTRACT The heave, roll and pitch damping of a CALM buoy contains linear contributions (wave radiation) and quadratic contributions (drag loads). The linear damping can be determined by diffraction-radiation calculations, but for the quadratic contributions model test data are required. In this paper a semi-empirical model is formulated for the calculation of the quadratic heave, pitch and roll damping. Forced oscillation tests were carried out using a CALM buoy model with several different skirts. Different oscillation amplitudes and frequencies were considered. From the test results added mass and damping coefficients were determined. These results were used to validate the semi-empirical model. KEY WORDS CALM buoy; skirt; non-linear damping; viscous loads; drag loads; heave, roll and pitch motions. INTRODUCTION Large deep water CALM buoys are becoming a common option for transfer of oil from a FPSO to a shuttle tanker, for example at a number of oil fields West of Africa. Although the environmental conditions are often relatively mild, an accurate prediction of the CALM buoy motions and the loads in the mooring lines and export risers is still important, for example for fatigue analysis. In Cozijn (2004) it was shown that for the accurate simulation of the behaviour of a moored CALM buoy in waves the use of a fully dynamic coupled mooring analysis method is essential. In this type of time-domain simulations the dynamic coupling effects between the CALM buoy and its mooring system are taken into account. However, as shown in Bunnik (2002) and Cozijn (2004), non-linearities in the wave loading and the hydrodynamic reaction forces remain complicating factors, which are not easy to model. The CALM buoy heave, pitch and roll damping contain both linear and quadratic contributions. The linear contributions are partly of potential origin (radiated waves) and partly viscous (friction). The quadratic contributions are of viscous origin (drag) and are mainly a result of eddies separating from the sharp edge of the buoy skirt. In time-domain simulations the potential damping is modelled using a retardation function approach, see for example Bunnik (2002) and Cozijn (2004), while linear and quadratic damping coefficients can be used to model the viscous damping contributions. So far the values of these damping coefficients are determined based on model test results, such as motion decay tests. In this paper an alternative approach is proposed, consisting of a semi-empirical model for the calculation of the quadratic heave, pitch and roll damping. In this model the quadratic damping contributions are calculated based on the CALM buoy velocity and the skirt geometry, with only a single drag coefficient as an empirical input parameter. Figure 1. CALM Buoy Model in Forced Oscillation Test Set-up Forced oscillation tests were carried out using a CALM buoy model with a skirt, as shown in Figure 1. The tests were carried out at a relatively large scale of 1:20. The model test scope included surge,
Transcript of Heave, Roll and Pitch Damping of a Deepwater CALM … · Heave, Roll and Pitch Damping of a...
Heave, Roll and Pitch Damping of a Deepwater CALM Buoy with a Skirt
Hans Cozijn Offshore Department, MARIN Wageningen, the Netherlands
Ries Uittenbogaard and Erik ter Brake Technology & Development, Bluewater Energy Services B.V.
Hoofddorp, the Netherlands
ABSTRACT The heave, roll and pitch damping of a CALM buoy contains linear contributions (wave radiation) and quadratic contributions (drag loads). The linear damping can be determined by diffraction-radiation calculations, but for the quadratic contributions model test data are required. In this paper a semi-empirical model is formulated for the calculation of the quadratic heave, pitch and roll damping. Forced oscillation tests were carried out using a CALM buoy model with several different skirts. Different oscillation amplitudes and frequencies were considered. From the test results added mass and damping coefficients were determined. These results were used to validate the semi-empirical model. KEY WORDS CALM buoy; skirt; non-linear damping; viscous loads; drag loads; heave, roll and pitch motions. INTRODUCTION Large deep water CALM buoys are becoming a common option for transfer of oil from a FPSO to a shuttle tanker, for example at a number of oil fields West of Africa. Although the environmental conditions are often relatively mild, an accurate prediction of the CALM buoy motions and the loads in the mooring lines and export risers is still important, for example for fatigue analysis. In Cozijn (2004) it was shown that for the accurate simulation of the behaviour of a moored CALM buoy in waves the use of a fully dynamic coupled mooring analysis method is essential. In this type of time-domain simulations the dynamic coupling effects between the CALM buoy and its mooring system are taken into account. However, as shown in Bunnik (2002) and Cozijn (2004), non-linearities in the wave loading and the hydrodynamic reaction forces remain complicating factors, which are not easy to model. The CALM buoy heave, pitch and roll damping contain both linear and quadratic contributions. The linear contributions are partly of potential
origin (radiated waves) and partly viscous (friction). The quadratic contributions are of viscous origin (drag) and are mainly a result of eddies separating from the sharp edge of the buoy skirt. In time-domain simulations the potential damping is modelled using a retardation function approach, see for example Bunnik (2002) and Cozijn (2004), while linear and quadratic damping coefficients can be used to model the viscous damping contributions. So far the values of these damping coefficients are determined based on model test results, such as motion decay tests. In this paper an alternative approach is proposed, consisting of a semi-empirical model for the calculation of the quadratic heave, pitch and roll damping. In this model the quadratic damping contributions are calculated based on the CALM buoy velocity and the skirt geometry, with only a single drag coefficient as an empirical input parameter.
Figure 1. CALM Buoy Model in Forced Oscillation Test Set-up Forced oscillation tests were carried out using a CALM buoy model with a skirt, as shown in Figure 1. The tests were carried out at a relatively large scale of 1:20. The model test scope included surge,
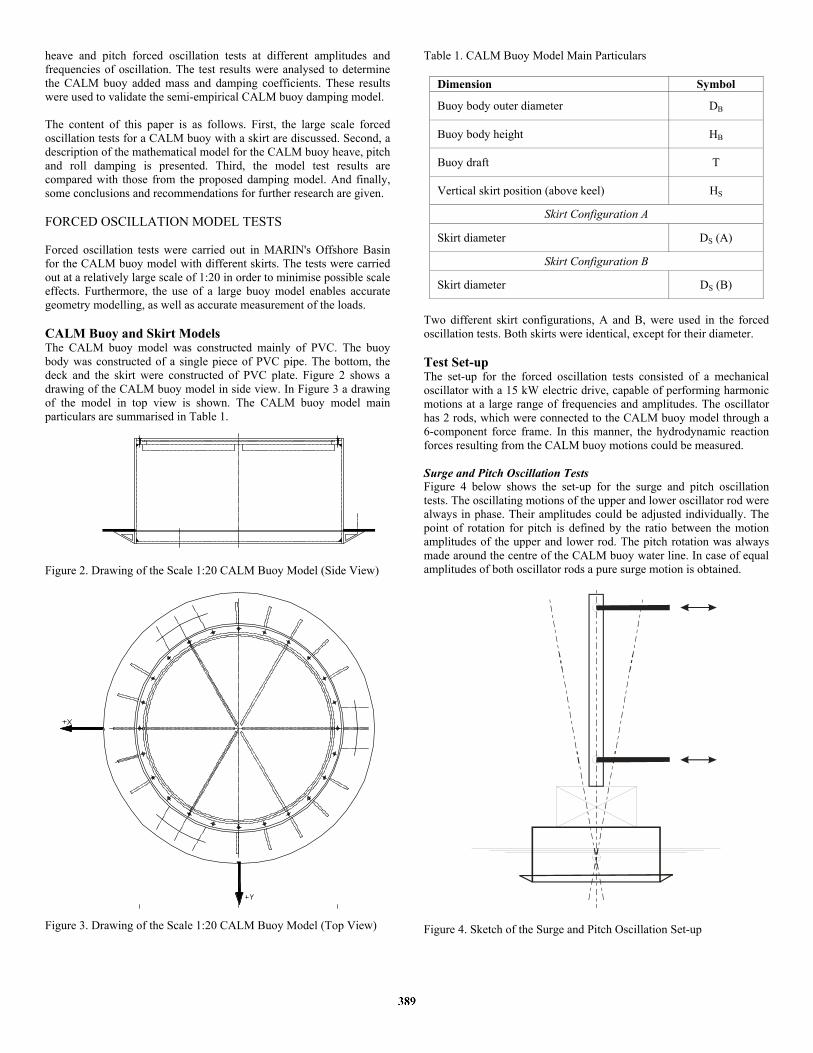
heave and pitch forced oscillation tests at different amplitudes and frequencies of oscillation. The test results were analysed to determine the CALM buoy added mass and damping coefficients. These results were used to validate the semi-empirical CALM buoy damping model. The content of this paper is as follows. First, the large scale forced oscillation tests for a CALM buoy with a skirt are discussed. Second, a description of the mathematical model for the CALM buoy heave, pitch and roll damping is presented. Third, the model test results are compared with those from the proposed damping model. And finally, some conclusions and recommendations for further research are given. FORCED OSCILLATION MODEL TESTS Forced oscillation tests were carried out in MARIN's Offshore Basin for the CALM buoy model with different skirts. The tests were carried out at a relatively large scale of 1:20 in order to minimise possible scale effects. Furthermore, the use of a large buoy model enables accurate geometry modelling, as well as accurate measurement of the loads. CALM Buoy and Skirt Models The CALM buoy model was constructed mainly of PVC. The buoy body was constructed of a single piece of PVC pipe. The bottom, the deck and the skirt were constructed of PVC plate. Figure 2 shows a drawing of the CALM buoy model in side view. In Figure 3 a drawing of the model in top view is shown. The CALM buoy model main particulars are summarised in Table 1.
Figure 2. Drawing of the Scale 1:20 CALM Buoy Model (Side View)
Figure 3. Drawing of the Scale 1:20 CALM Buoy Model (Top View)
Table 1. CALM Buoy Model Main Particulars
Dimension Symbol Buoy body outer diameter DB
Buoy body height HB
Buoy draft T
Vertical skirt position (above keel) HS
Skirt Configuration A
Skirt diameter DS (A)
Skirt Configuration B
Skirt diameter DS (B)
Two different skirt configurations, A and B, were used in the forced oscillation tests. Both skirts were identical, except for their diameter. Test Set-up The set-up for the forced oscillation tests consisted of a mechanical oscillator with a 15 kW electric drive, capable of performing harmonic motions at a large range of frequencies and amplitudes. The oscillator has 2 rods, which were connected to the CALM buoy model through a 6-component force frame. In this manner, the hydrodynamic reaction forces resulting from the CALM buoy motions could be measured. Surge and Pitch Oscillation Tests Figure 4 below shows the set-up for the surge and pitch oscillation tests. The oscillating motions of the upper and lower oscillator rod were always in phase. Their amplitudes could be adjusted individually. The point of rotation for pitch is defined by the ratio between the motion amplitudes of the upper and lower rod. The pitch rotation was always made around the centre of the CALM buoy water line. In case of equal amplitudes of both oscillator rods a pure surge motion is obtained.
Figure 4. Sketch of the Surge and Pitch Oscillation Set-up
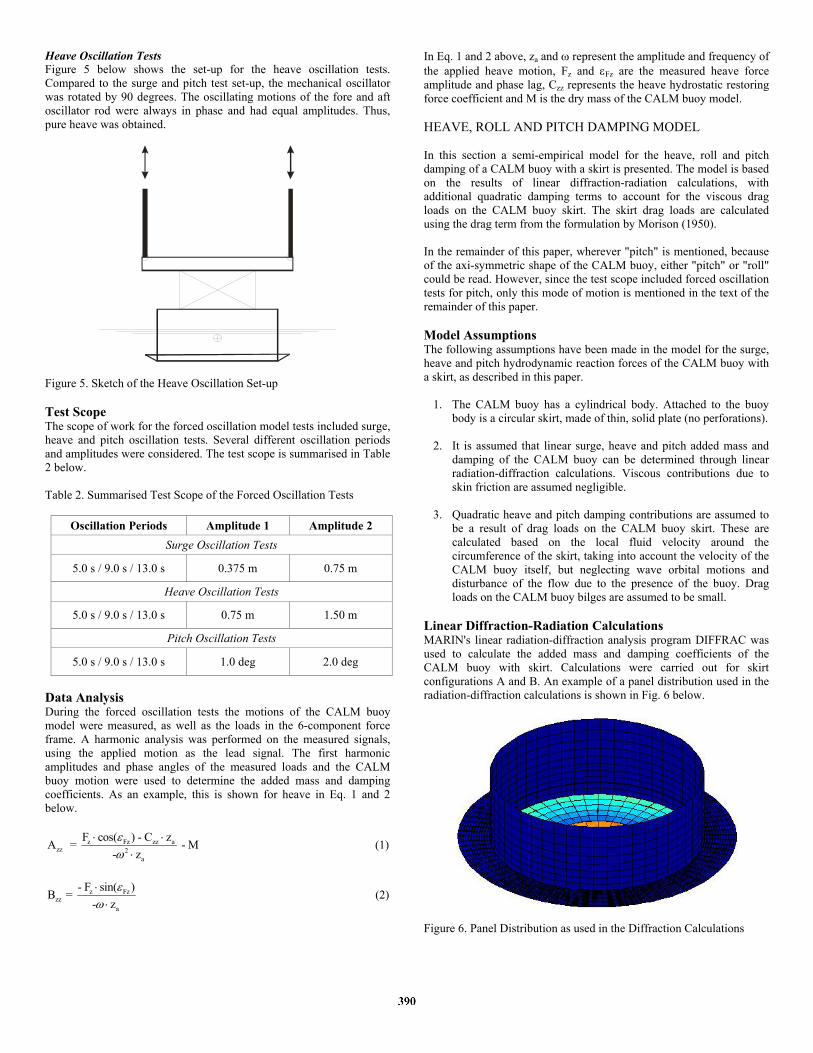
Heave Oscillation Tests Figure 5 below shows the set-up for the heave oscillation tests. Compared to the surge and pitch test set-up, the mechanical oscillator was rotated by 90 degrees. The oscillating motions of the fore and aft oscillator rod were always in phase and had equal amplitudes. Thus, pure heave was obtained.
Figure 5. Sketch of the Heave Oscillation Set-up Test Scope The scope of work for the forced oscillation model tests included surge, heave and pitch oscillation tests. Several different oscillation periods and amplitudes were considered. The test scope is summarised in Table 2 below. Table 2. Summarised Test Scope of the Forced Oscillation Tests
Oscillation Periods Amplitude 1 Amplitude 2 Surge Oscillation Tests
5.0 s / 9.0 s / 13.0 s 0.375 m 0.75 m
Heave Oscillation Tests
5.0 s / 9.0 s / 13.0 s 0.75 m 1.50 m
Pitch Oscillation Tests
5.0 s / 9.0 s / 13.0 s 1.0 deg 2.0 deg
Data Analysis During the forced oscillation tests the motions of the CALM buoy model were measured, as well as the loads in the 6-component force frame. A harmonic analysis was performed on the measured signals, using the applied motion as the lead signal. The first harmonic amplitudes and phase angles of the measured loads and the CALM buoy motion were used to determine the added mass and damping coefficients. As an example, this is shown for heave in Eq. 1 and 2 below.
z Fz zz azz 2
a
F cos( ) - C zA = - M- zεω
⋅ ⋅⋅
(1)
z Fz
zza
- F sin( )B = - z
εω⋅⋅
(2)
In Eq. 1 and 2 above, za and ω represent the amplitude and frequency of the applied heave motion, Fz and εFz are the measured heave force amplitude and phase lag, Czz represents the heave hydrostatic restoring force coefficient and M is the dry mass of the CALM buoy model. HEAVE, ROLL AND PITCH DAMPING MODEL In this section a semi-empirical model for the heave, roll and pitch damping of a CALM buoy with a skirt is presented. The model is based on the results of linear diffraction-radiation calculations, with additional quadratic damping terms to account for the viscous drag loads on the CALM buoy skirt. The skirt drag loads are calculated using the drag term from the formulation by Morison (1950). In the remainder of this paper, wherever "pitch" is mentioned, because of the axi-symmetric shape of the CALM buoy, either "pitch" or "roll" could be read. However, since the test scope included forced oscillation tests for pitch, only this mode of motion is mentioned in the text of the remainder of this paper. Model Assumptions The following assumptions have been made in the model for the surge, heave and pitch hydrodynamic reaction forces of the CALM buoy with a skirt, as described in this paper.
1. The CALM buoy has a cylindrical body. Attached to the buoy body is a circular skirt, made of thin, solid plate (no perforations).
2. It is assumed that linear surge, heave and pitch added mass and
damping of the CALM buoy can be determined through linear radiation-diffraction calculations. Viscous contributions due to skin friction are assumed negligible.
3. Quadratic heave and pitch damping contributions are assumed to
be a result of drag loads on the CALM buoy skirt. These are calculated based on the local fluid velocity around the circumference of the skirt, taking into account the velocity of the CALM buoy itself, but neglecting wave orbital motions and disturbance of the flow due to the presence of the buoy. Drag loads on the CALM buoy bilges are assumed to be small.
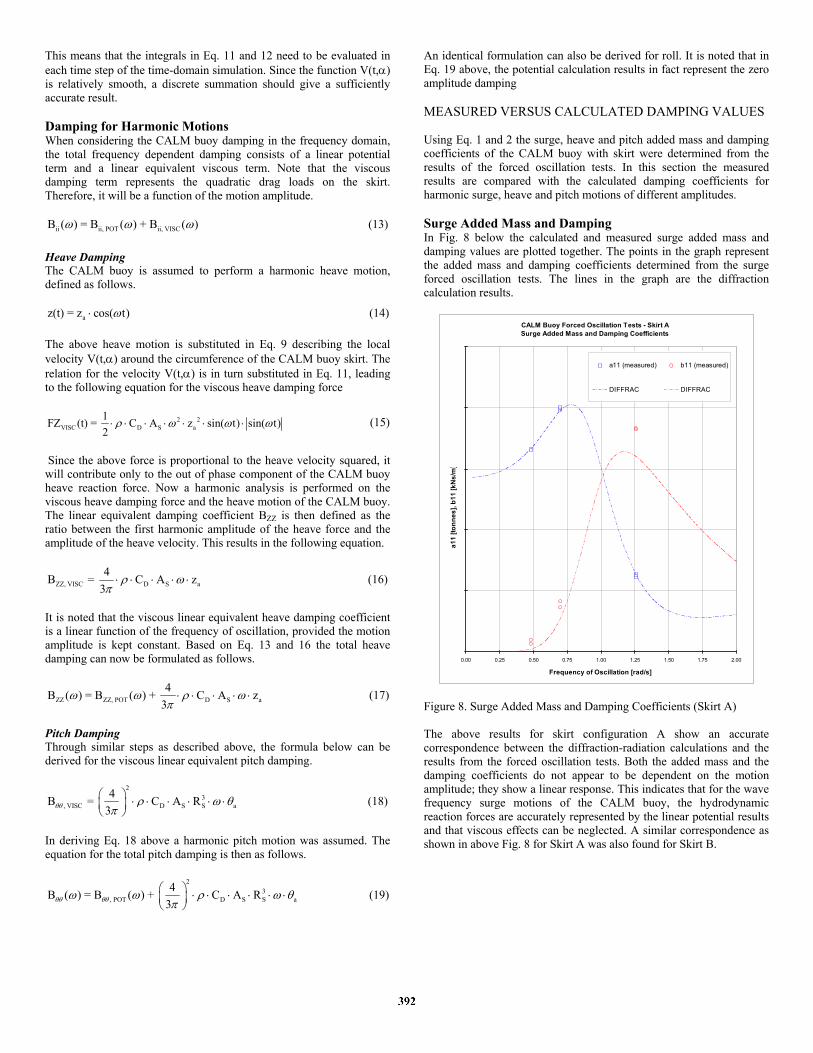
Linear Diffraction-Radiation Calculations MARIN's linear radiation-diffraction analysis program DIFFRAC was used to calculate the added mass and damping coefficients of the CALM buoy with skirt. Calculations were carried out for skirt configurations A and B. An example of a panel distribution used in the radiation-diffraction calculations is shown in Fig. 6 below.
Figure 6. Panel Distribution as used in the Diffraction Calculations

The results of the calculations include the linear added mass and damping coefficients of the CALM buoy, representing the contributions of potential origin. The quadratic viscous contributions are of course not included in the diffraction calculation results. Viscous Damping Contributions The viscous contributions in the CALM buoy heave and pitch damping are calculated using a semi-empirical model including the drag term from the formulation by Morison (1950). In the following sections first the geometry of the CALM buoy skirt is described, after which the load on a skirt segment can be calculated. Integration of this force around the circumference of the skirt results in expressions for the quadratic heave and pitch damping loads. Skirt Geometry The geometry of the CALM buoy skirt can be described by the skirt diameter DS and the buoy body diameter DB. An angle α is used as a coordinate to define the tangential position around the circumference of the skirt.
X
Y
dA
RS
DS
DB
r
Figure 7. Description of the CALM Buoy Skirt Geometry Assuming a circular CALM buoy with a circular skirt the skirt area can be calculated as follows.
( )2 2S S BA = D - D
4π⋅ (3)
The width of the CALM buoy skirt, measured from the outside of the buoy body to the outer rim of the skirt, is defined as follows.
S BS
D - DW = 2
(4)
Then a representative skirt radius RS is defined as follows. It defines the location at which the local drag loads on the skirt are assumed to apply.
S BS
D + DR = 4
(5)
Using the coordinate α around the CALM buoy skirt, the position coordinates x and y can be calculated using the following formulas.
Sx( ) = R cos( )α α⋅ (6)
Sy( ) = R sin ( )α α⋅ (7) Drag Loads on a Skirt Section An infinitesimal part of the skirt area, at which the local drag loads apply, is defined as follows.
2 2S BD - DdA = d
8α⋅ (8)
The local velocity at the area dA is a function of the heave (z), roll (φ) and pitch (θ) velocities and can be calculated as follows. V(t, ) = z(t) + y( ) (t) - x( ) (t)α α φ α θ⋅ ⋅& && (9) Finally, the drag load dF on area dA at position α can be calculated as follows.
D1dF(t, ) = - V(t, ) V(t, ) C dA2
α ρ α α⋅ ⋅ ⋅ ⋅ ⋅ (10)
In Eq. 10 above the value for CD is the only empirical parameter in the model for which a suitable value needs to be selected. Keulegan and Carpenter (1958) found that in oscillating flow conditions the dimensionless drag coefficient CD may depend on the motion amplitude, often expressed in terms of the dimensionless KC number. In the present case, it means that the value of CD may depend on the amplitude of motion of the skirt section under consideration. Because the considered drag loads on the CALM buoy skirt are related to flow separation and generation of eddies at a sharp edge, it is assumed that the CD value does not depend on the Re number. The Re independency in case of oscillating flow past sharp-edged plates was also mentioned by Sarpkaya (1996). Damping for Random Motions In time-domain simulations the potential damping contributions can be modelled using a retardation function approach, as shown in Bunnik (2002) and Cozijn (2004). The viscous damping contributions, on the other hand, are taken into account by modelling them as an external load on the body. Total Viscous Damping Loads The total viscous damping loads on the CALM buoy skirt are calculated by integration of Eq. 9 and 10 along the circumference of the buoy, or from α = 0 to α = 2π. Because the drag loads are perpendicular to the skirt surface, they only contribute to the heave, roll and pitch damping of the CALM buoy, but not to the surge, sway and yaw damping. The viscous damping loads can now be calculated using the following equations.
2S
VISC D0
1 AFZ (t) = - C V(t, ) V(t, ) d2 2
π
ρ α α απ
⋅
⋅ ⋅ ⋅ ⋅ ⋅ ⋅⋅ ∫ (11)
2
SVISC D S
0
1 AMY (t) = C R cos( ) V(t, ) V(t, ) d2 2
π
ρ α α α απ
⋅
⋅ ⋅ ⋅ ⋅ ⋅ ⋅ ⋅ ⋅⋅ ∫ (12)
For the moment MYVISC an expression similar to Eq. 12 can be derived.
This means that the integrals in Eq. 11 and 12 need to be evaluated in each time step of the time-domain simulation. Since the function V(t,α) is relatively smooth, a discrete summation should give a sufficiently accurate result. Damping for Harmonic Motions When considering the CALM buoy damping in the frequency domain, the total frequency dependent damping consists of a linear potential term and a linear equivalent viscous term. Note that the viscous damping term represents the quadratic drag loads on the skirt. Therefore, it will be a function of the motion amplitude.
ii ii, POT ii, VISCB ( ) = B ( ) + B ( )ω ω ω (13) Heave Damping The CALM buoy is assumed to perform a harmonic heave motion, defined as follows.
az(t) = z cos( t)ω⋅ (14) The above heave motion is substituted in Eq. 9 describing the local velocity V(t,α) around the circumference of the CALM buoy skirt. The relation for the velocity V(t,α) is in turn substituted in Eq. 11, leading to the following equation for the viscous heave damping force
2 2VISC D S a
1FZ (t) = C A z sin( t) sin( t)2
ρ ω ω ω⋅ ⋅ ⋅ ⋅ ⋅ ⋅ ⋅ (15)
Since the above force is proportional to the heave velocity squared, it will contribute only to the out of phase component of the CALM buoy heave reaction force. Now a harmonic analysis is performed on the viscous heave damping force and the heave motion of the CALM buoy. The linear equivalent damping coefficient BZZ is then defined as the ratio between the first harmonic amplitude of the heave force and the amplitude of the heave velocity. This results in the following equation.
ZZ, VISC D S a4B = C A z
3ρ ω
π⋅ ⋅ ⋅ ⋅ ⋅ (16)
It is noted that the viscous linear equivalent heave damping coefficient is a linear function of the frequency of oscillation, provided the motion amplitude is kept constant. Based on Eq. 13 and 16 the total heave damping can now be formulated as follows.
ZZ ZZ, POT D S a4B ( ) = B ( ) + C A z
3ω ω ρ ω
π⋅ ⋅ ⋅ ⋅ ⋅ (17)
Pitch Damping Through similar steps as described above, the formula below can be derived for the viscous linear equivalent pitch damping.
23
, VISC D S S a4B = C A R
3θθ ρ ω θπ
⎛ ⎞ ⋅ ⋅ ⋅ ⋅ ⋅ ⋅⎜ ⎟⎝ ⎠
(18)
In deriving Eq. 18 above a harmonic pitch motion was assumed. The equation for the total pitch damping is then as follows.
23
, POT D S S a4B ( ) = B ( ) + C A R
3θθ θθω ω ρ ω θπ
⎛ ⎞ ⋅ ⋅ ⋅ ⋅ ⋅ ⋅⎜ ⎟⎝ ⎠
(19)
An identical formulation can also be derived for roll. It is noted that in Eq. 19 above, the potential calculation results in fact represent the zero amplitude damping MEASURED VERSUS CALCULATED DAMPING VALUES Using Eq. 1 and 2 the surge, heave and pitch added mass and damping coefficients of the CALM buoy with skirt were determined from the results of the forced oscillation tests. In this section the measured results are compared with the calculated damping coefficients for harmonic surge, heave and pitch motions of different amplitudes. Surge Added Mass and Damping In Fig. 8 below the calculated and measured surge added mass and damping values are plotted together. The points in the graph represent the added mass and damping coefficients determined from the surge forced oscillation tests. The lines in the graph are the diffraction calculation results.
CALM Buoy Forced Oscillation Tests - Skirt ASurge Added Mass and Damping Coefficients
0.00 0.25 0.50 0.75 1.00 1.25 1.50 1.75 2.00
Frequency of Oscillation [rad/s]
a11
[tonn
es],
b11
[kN
s/m
]
a11 (measured) b11 (measured)
DIFFRAC DIFFRAC
Figure 8. Surge Added Mass and Damping Coefficients (Skirt A) The above results for skirt configuration A show an accurate correspondence between the diffraction-radiation calculations and the results from the forced oscillation tests. Both the added mass and the damping coefficients do not appear to be dependent on the motion amplitude; they show a linear response. This indicates that for the wave frequency surge motions of the CALM buoy, the hydrodynamic reaction forces are accurately represented by the linear potential results and that viscous effects can be neglected. A similar correspondence as shown in above Fig. 8 for Skirt A was also found for Skirt B.
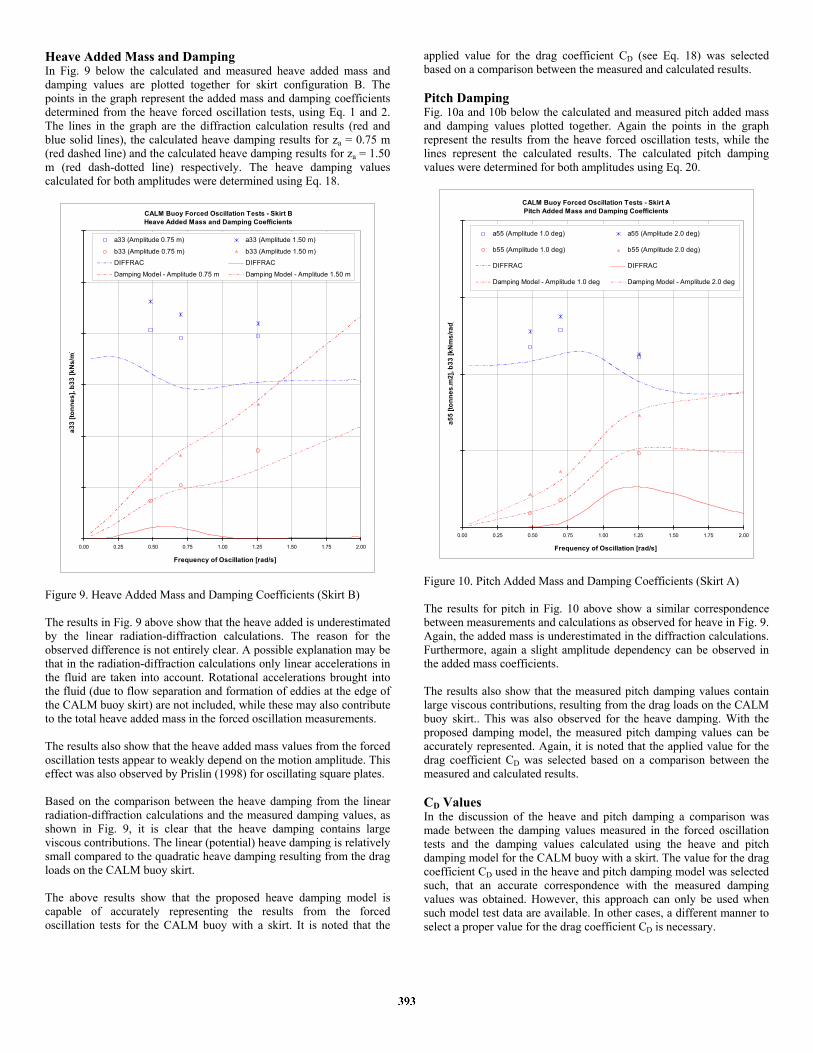
Heave Added Mass and Damping In Fig. 9 below the calculated and measured heave added mass and damping values are plotted together for skirt configuration B. The points in the graph represent the added mass and damping coefficients determined from the heave forced oscillation tests, using Eq. 1 and 2. The lines in the graph are the diffraction calculation results (red and blue solid lines), the calculated heave damping results for za = 0.75 m (red dashed line) and the calculated heave damping results for za = 1.50 m (red dash-dotted line) respectively. The heave damping values calculated for both amplitudes were determined using Eq. 18.
CALM Buoy Forced Oscillation Tests - Skirt BHeave Added Mass and Damping Coefficients
0.00 0.25 0.50 0.75 1.00 1.25 1.50 1.75 2.00
Frequency of Oscillation [rad/s]
a33
[tonn
es],
b33
[kN
s/m
]
a33 (Amplitude 0.75 m) a33 (Amplitude 1.50 m)
b33 (Amplitude 0.75 m) b33 (Amplitude 1.50 m)
DIFFRAC DIFFRAC
Damping Model - Amplitude 0.75 m Damping Model - Amplitude 1.50 m
Figure 9. Heave Added Mass and Damping Coefficients (Skirt B) The results in Fig. 9 above show that the heave added is underestimated by the linear radiation-diffraction calculations. The reason for the observed difference is not entirely clear. A possible explanation may be that in the radiation-diffraction calculations only linear accelerations in the fluid are taken into account. Rotational accelerations brought into the fluid (due to flow separation and formation of eddies at the edge of the CALM buoy skirt) are not included, while these may also contribute to the total heave added mass in the forced oscillation measurements. The results also show that the heave added mass values from the forced oscillation tests appear to weakly depend on the motion amplitude. This effect was also observed by Prislin (1998) for oscillating square plates. Based on the comparison between the heave damping from the linear radiation-diffraction calculations and the measured damping values, as shown in Fig. 9, it is clear that the heave damping contains large viscous contributions. The linear (potential) heave damping is relatively small compared to the quadratic heave damping resulting from the drag loads on the CALM buoy skirt. The above results show that the proposed heave damping model is capable of accurately representing the results from the forced oscillation tests for the CALM buoy with a skirt. It is noted that the
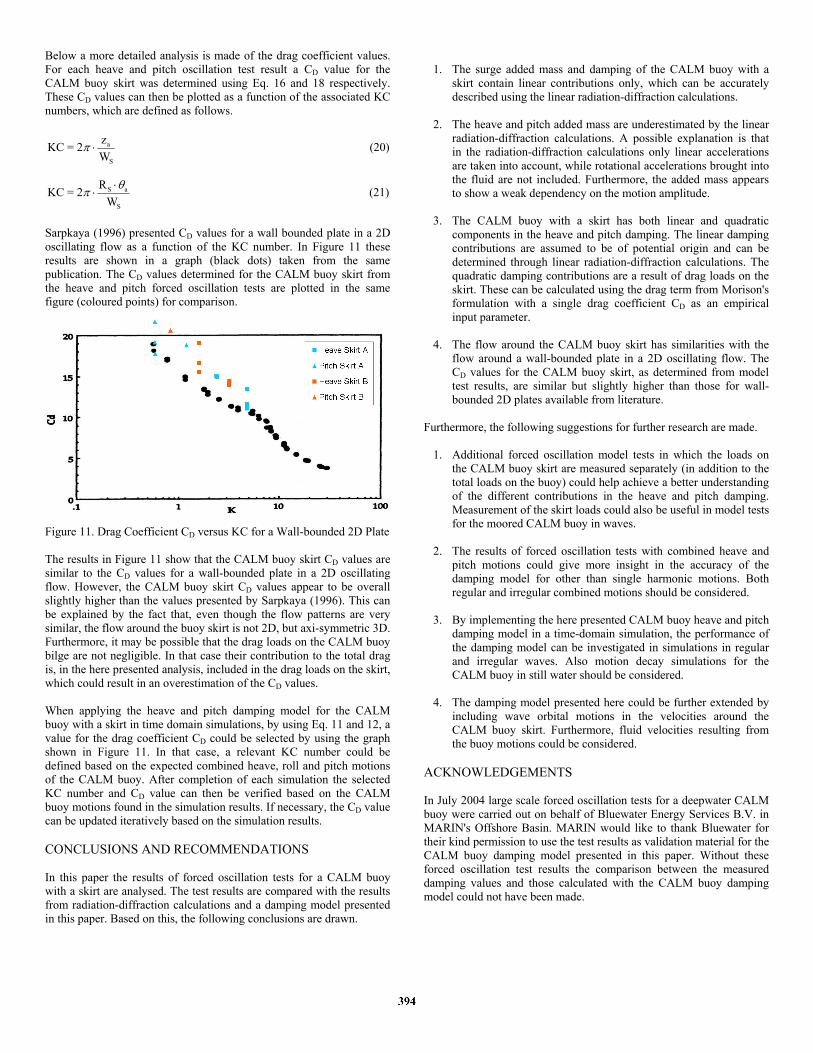
applied value for the drag coefficient CD (see Eq. 18) was selected based on a comparison between the measured and calculated results. Pitch Damping Fig. 10a and 10b below the calculated and measured pitch added mass and damping values plotted together. Again the points in the graph represent the results from the heave forced oscillation tests, while the lines represent the calculated results. The calculated pitch damping values were determined for both amplitudes using Eq. 20.
CALM Buoy Forced Oscillation Tests - Skirt APitch Added Mass and Damping Coefficients
0.00 0.25 0.50 0.75 1.00 1.25 1.50 1.75 2.00
Frequency of Oscillation [rad/s]
a55
[tonn
es.m
2], b
33 [k
Nm
s/ra
d]
a55 (Amplitude 1.0 deg) a55 (Amplitude 2.0 deg)
b55 (Amplitude 1.0 deg) b55 (Amplitude 2.0 deg)
DIFFRAC DIFFRAC
Damping Model - Amplitude 1.0 deg Damping Model - Amplitude 2.0 deg
Figure 10. Pitch Added Mass and Damping Coefficients (Skirt A) The results for pitch in Fig. 10 above show a similar correspondence between measurements and calculations as observed for heave in Fig. 9. Again, the added mass is underestimated in the diffraction calculations. Furthermore, again a slight amplitude dependency can be observed in the added mass coefficients. The results also show that the measured pitch damping values contain large viscous contributions, resulting from the drag loads on the CALM buoy skirt.. This was also observed for the heave damping. With the proposed damping model, the measured pitch damping values can be accurately represented. Again, it is noted that the applied value for the drag coefficient CD was selected based on a comparison between the measured and calculated results. CD Values In the discussion of the heave and pitch damping a comparison was made between the damping values measured in the forced oscillation tests and the damping values calculated using the heave and pitch damping model for the CALM buoy with a skirt. The value for the drag coefficient CD used in the heave and pitch damping model was selected such, that an accurate correspondence with the measured damping values was obtained. However, this approach can only be used when such model test data are available. In other cases, a different manner to select a proper value for the drag coefficient CD is necessary.
Below a more detailed analysis is made of the drag coefficient values. For each heave and pitch oscillation test result a CD value for the CALM buoy skirt was determined using Eq. 16 and 18 respectively. These CD values can then be plotted as a function of the associated KC numbers, which are defined as follows.
a
S
zKC = 2W
π ⋅ (20)
S a
S
RKC = 2Wθπ ⋅
⋅ (21)
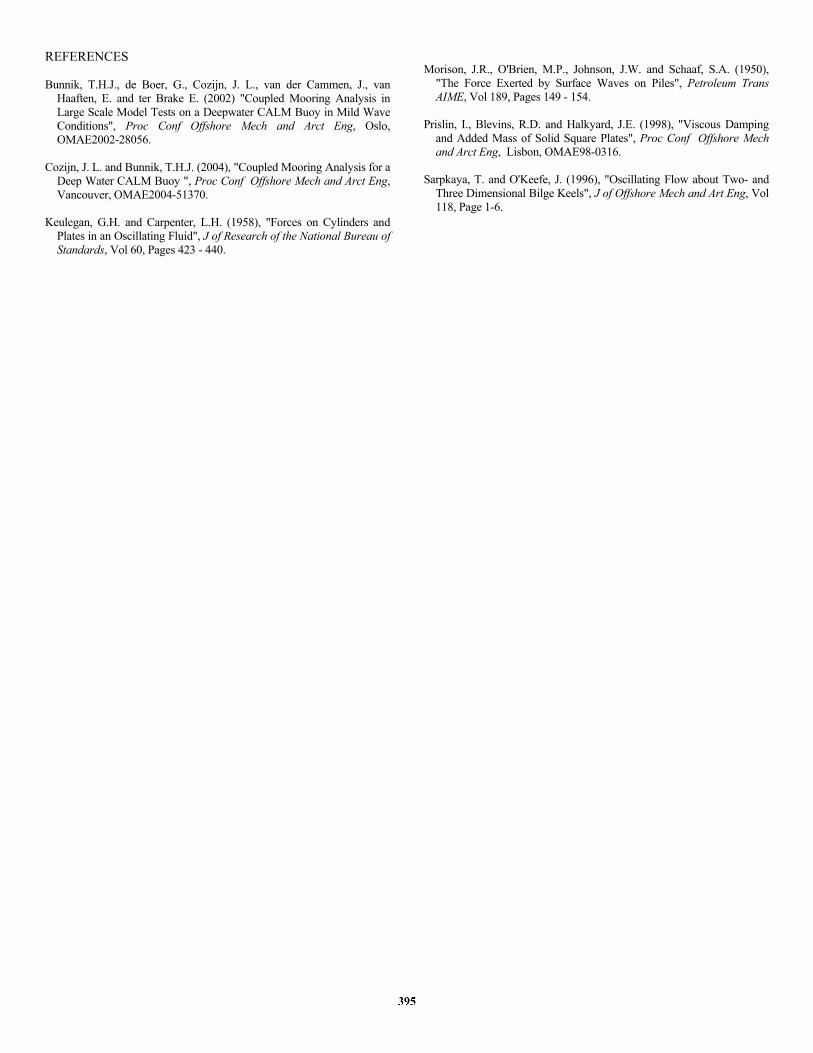
Sarpkaya (1996) presented CD values for a wall bounded plate in a 2D oscillating flow as a function of the KC number. In Figure 11 these results are shown in a graph (black dots) taken from the same publication. The CD values determined for the CALM buoy skirt from the heave and pitch forced oscillation tests are plotted in the same figure (coloured points) for comparison.
Figure 11. Drag Coefficient CD versus KC for a Wall-bounded 2D Plate The results in Figure 11 show that the CALM buoy skirt CD values are similar to the CD values for a wall-bounded plate in a 2D oscillating flow. However, the CALM buoy skirt CD values appear to be overall slightly higher than the values presented by Sarpkaya (1996). This can be explained by the fact that, even though the flow patterns are very similar, the flow around the buoy skirt is not 2D, but axi-symmetric 3D. Furthermore, it may be possible that the drag loads on the CALM buoy bilge are not negligible. In that case their contribution to the total drag is, in the here presented analysis, included in the drag loads on the skirt, which could result in an overestimation of the CD values. When applying the heave and pitch damping model for the CALM buoy with a skirt in time domain simulations, by using Eq. 11 and 12, a value for the drag coefficient CD could be selected by using the graph shown in Figure 11. In that case, a relevant KC number could be defined based on the expected combined heave, roll and pitch motions of the CALM buoy. After completion of each simulation the selected KC number and CD value can then be verified based on the CALM buoy motions found in the simulation results. If necessary, the CD value can be updated iteratively based on the simulation results. CONCLUSIONS AND RECOMMENDATIONS In this paper the results of forced oscillation tests for a CALM buoy with a skirt are analysed. The test results are compared with the results from radiation-diffraction calculations and a damping model presented in this paper. Based on this, the following conclusions are drawn.
1. The surge added mass and damping of the CALM buoy with a
skirt contain linear contributions only, which can be accurately described using the linear radiation-diffraction calculations.
2. The heave and pitch added mass are underestimated by the linear
radiation-diffraction calculations. A possible explanation is that in the radiation-diffraction calculations only linear accelerations are taken into account, while rotational accelerations brought into the fluid are not included. Furthermore, the added mass appears to show a weak dependency on the motion amplitude.
3. The CALM buoy with a skirt has both linear and quadratic
components in the heave and pitch damping. The linear damping contributions are assumed to be of potential origin and can be determined through linear radiation-diffraction calculations. The quadratic damping contributions are a result of drag loads on the skirt. These can be calculated using the drag term from Morison's formulation with a single drag coefficient CD as an empirical input parameter.
4. The flow around the CALM buoy skirt has similarities with the
flow around a wall-bounded plate in a 2D oscillating flow. The CD values for the CALM buoy skirt, as determined from model test results, are similar but slightly higher than those for wall-bounded 2D plates available from literature.
Furthermore, the following suggestions for further research are made.
1. Additional forced oscillation model tests in which the loads on the CALM buoy skirt are measured separately (in addition to the total loads on the buoy) could help achieve a better understanding of the different contributions in the heave and pitch damping. Measurement of the skirt loads could also be useful in model tests for the moored CALM buoy in waves.
2. The results of forced oscillation tests with combined heave and
pitch motions could give more insight in the accuracy of the damping model for other than single harmonic motions. Both regular and irregular combined motions should be considered.
3. By implementing the here presented CALM buoy heave and pitch
damping model in a time-domain simulation, the performance of the damping model can be investigated in simulations in regular and irregular waves. Also motion decay simulations for the CALM buoy in still water should be considered.
4. The damping model presented here could be further extended by
including wave orbital motions in the velocities around the CALM buoy skirt. Furthermore, fluid velocities resulting from the buoy motions could be considered.
ACKNOWLEDGEMENTS In July 2004 large scale forced oscillation tests for a deepwater CALM buoy were carried out on behalf of Bluewater Energy Services B.V. in MARIN's Offshore Basin. MARIN would like to thank Bluewater for their kind permission to use the test results as validation material for the CALM buoy damping model presented in this paper. Without these forced oscillation test results the comparison between the measured damping values and those calculated with the CALM buoy damping model could not have been made.
REFERENCES Bunnik, T.H.J., de Boer, G., Cozijn, J. L., van der Cammen, J., van
Haaften, E. and ter Brake E. (2002) "Coupled Mooring Analysis in Large Scale Model Tests on a Deepwater CALM Buoy in Mild Wave Conditions", Proc Conf Offshore Mech and Arct Eng, Oslo, OMAE2002-28056.
Cozijn, J. L. and Bunnik, T.H.J. (2004), "Coupled Mooring Analysis for a
Deep Water CALM Buoy ", Proc Conf Offshore Mech and Arct Eng, Vancouver, OMAE2004-51370.
Keulegan, G.H. and Carpenter, L.H. (1958), "Forces on Cylinders and
Plates in an Oscillating Fluid", J of Research of the National Bureau of Standards, Vol 60, Pages 423 - 440.
Morison, J.R., O'Brien, M.P., Johnson, J.W. and Schaaf, S.A. (1950),
"The Force Exerted by Surface Waves on Piles", Petroleum Trans AIME, Vol 189, Pages 149 - 154.
Prislin, I., Blevins, R.D. and Halkyard, J.E. (1998), "Viscous Damping
and Added Mass of Solid Square Plates", Proc Conf Offshore Mech and Arct Eng, Lisbon, OMAE98-0316.
Sarpkaya, T. and O'Keefe, J. (1996), "Oscillating Flow about Two- and
Three Dimensional Bilge Keels", J of Offshore Mech and Art Eng, Vol 118, Page 1-6.


![Wave heave energy conversion using modular multistability Energy/wave heave modualr... · 2014-06-29 · Wave heave energy conversion using modular multistability ... [3–6], while](https://static.fdocuments.in/doc/165x107/5e3515fd28986c6ed857f62f/wave-heave-energy-conversion-using-modular-energywave-heave-modualr-2014-06-29.jpg)
