Heating or eating - Citizens Advice › wp-content › ... · Heating or Eating The reality of...
33
Heating or Eating The reality of living with high fuel costs in Bath & North East Somerset B&NES Citizens Advice Bureaux June 2015
Transcript of Heating or eating - Citizens Advice › wp-content › ... · Heating or Eating The reality of...

Heating or Eating The reality of living with high fuel costs
in Bath & North East Somerset
B&NES Citizens Advice Bureaux June 2015


NB: Throughout the report, names have been changed but all other details are accurate.
Barbara, disabled, in her 50s, living with partner. On benefits, living in social housing & on a prepayment meter.
My heating costs have gone up a lot recently, and meeting them now is a complete struggle. I only heat the rooms I use – I can’t afford to heat the others and I can’t afford to put the temperature up so we sit with a rug over us. We shop as cheaply as we can and only eat cheaper food.
I’m not at home a lot because heating is so expensive. I go to friends and family a lot because I just can’t afford it. I can’t afford food either but my friends feed me too. My family have given me lots of help – I’d go under without them.
Christine, in her 60s, living alone, was victim of domestic abuse. Working,
owner-occupier, pays quarterly.
I have to watch how much I put in the meter because I may run
out of money before my next benefits payments. Sometimes I go
without food in order to have enough money to put in the meter.
Maureen, in her 40s, disabled, living alone. On ESA, in social housing & on a
prepayment meter.
The majority of our money goes on gas and electricity. We are giving up family life to keep the bills down.
Stuart & Tina, in their 50s living with their ill adult son. On ESA, in social housing & on
a prepayment meter.

Heating or Eating – the reality of living with high fuel costs
in Bath & North East Somerset
Contents
Foreword . . . . . . . . . . . . . . 1
Summary & Key Findings . . . . . . . . . . . . . . 2
Recommendations . . . . . . . . . . . . . . 3
The project . . . . . . . . . . . . . . 5
Our sample . . . . . . . . . . . . . . 5
What we found . . . . . . . . . . . . . . 5
Income 5
Those living in the household . . . . . . . . . . . . . . 6
Living accommodation . . . . . . . . . . . . . . 6
Paying fuel costs . . . . . . . . . . . . . . 8
Types of heating used . . . . . . . . . . . . . . 9
How the heating is used . . . . . . . . . . . . . . 10
Cooking and eating . . . . . . . . . . . . . . 12
Fuel costs . . . . . . . . . . . . . . 12
The impact of fuel costs . . . . . . . . . . . . . . 14
Follow-up support & feedback . . . . . . . . . . . . . . 17
Appendix 1 – Our sample . . . . . . . . . . . . . . 19
Appendix 2 – The interview group . . . . . . . . . . . . . . 20
Appendix 3 – The interviews . . . . . . . . . . . . . . 22
Bibliography . . . . . . . . . . . . . . 28
1
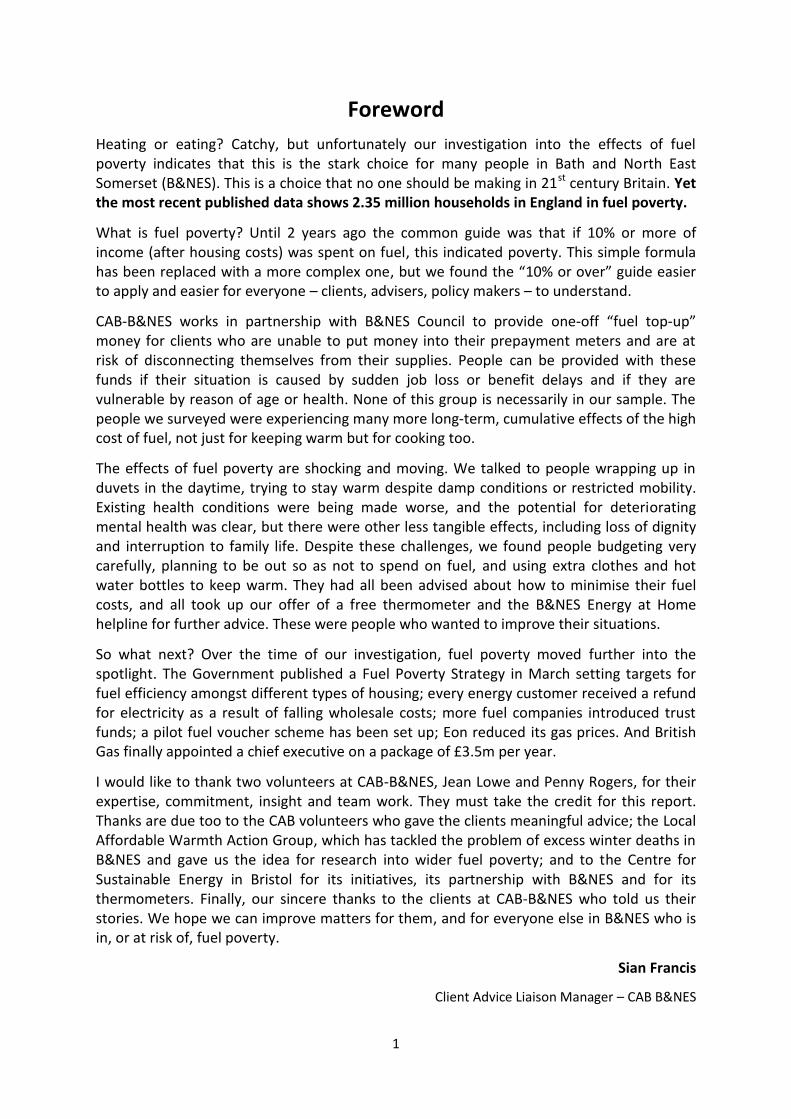
Foreword
Heating or eating? Catchy, but unfortunately our investigation into the effects of fuel poverty indicates that this is the stark choice for many people in Bath and North East Somerset (B&NES). This is a choice that no one should be making in 21st century Britain. Yet the most recent published data shows 2.35 million households in England in fuel poverty.
What is fuel poverty? Until 2 years ago the common guide was that if 10% or more of income (after housing costs) was spent on fuel, this indicated poverty. This simple formula has been replaced with a more complex one, but we found the “10% or over” guide easier to apply and easier for everyone – clients, advisers, policy makers – to understand.
CAB-B&NES works in partnership with B&NES Council to provide one-off “fuel top-up” money for clients who are unable to put money into their prepayment meters and are at risk of disconnecting themselves from their supplies. People can be provided with these funds if their situation is caused by sudden job loss or benefit delays and if they are vulnerable by reason of age or health. None of this group is necessarily in our sample. The people we surveyed were experiencing many more long-term, cumulative effects of the high cost of fuel, not just for keeping warm but for cooking too.
The effects of fuel poverty are shocking and moving. We talked to people wrapping up in duvets in the daytime, trying to stay warm despite damp conditions or restricted mobility. Existing health conditions were being made worse, and the potential for deteriorating mental health was clear, but there were other less tangible effects, including loss of dignity and interruption to family life. Despite these challenges, we found people budgeting very carefully, planning to be out so as not to spend on fuel, and using extra clothes and hot water bottles to keep warm. They had all been advised about how to minimise their fuel costs, and all took up our offer of a free thermometer and the B&NES Energy at Home helpline for further advice. These were people who wanted to improve their situations.
So what next? Over the time of our investigation, fuel poverty moved further into the spotlight. The Government published a Fuel Poverty Strategy in March setting targets for fuel efficiency amongst different types of housing; every energy customer received a refund for electricity as a result of falling wholesale costs; more fuel companies introduced trust funds; a pilot fuel voucher scheme has been set up; Eon reduced its gas prices. And British Gas finally appointed a chief executive on a package of £3.5m per year.
I would like to thank two volunteers at CAB-B&NES, Jean Lowe and Penny Rogers, for their expertise, commitment, insight and team work. They must take the credit for this report. Thanks are due too to the CAB volunteers who gave the clients meaningful advice; the Local Affordable Warmth Action Group, which has tackled the problem of excess winter deaths in B&NES and gave us the idea for research into wider fuel poverty; and to the Centre for Sustainable Energy in Bristol for its initiatives, its partnership with B&NES and for its thermometers. Finally, our sincere thanks to the clients at CAB-B&NES who told us their stories. We hope we can improve matters for them, and for everyone else in B&NES who is in, or at risk of, fuel poverty.
Sian Francis
Client Advice Liaison Manager – CAB B&NES

2
Summary & Key Findings
Bath & North East Somerset is often seen from outside as affluent, but advisers and gateway assessors at the Citizens Advice Bureaux in this area are aware that many of their clients are struggling with high fuel costs, and it is likely that we have at least the all-England average of 10.4% of households in fuel poverty.
We looked in depth at the impact of these high fuel costs on the lives of a small sample of clients who had sought financial help from the CABs in our area, and whose financial statements showed they were spending 10% or more of their incomes on energy once their housing costs had been met. While this sample is not representative of Bath & North East Somerset as a whole, it does provide a detailed picture of the impact of fuel poverty on the most vulnerable groups in our area.
The majority of our sample (68.4%) were in social housing, with just under half working or on pensions, and just over half on benefits alone. Over a third of our households included dependent children, and well over half included someone with disabilities or long-term illnesses.
While all their homes had at least one form of insulation such as double-glazing, close to half also had significant problems with damp, condensation or draughts which made these homes much harder to heat.
No one in our group was using their heating extravagantly. The opposite was true – we uncovered a range of poignant self-rationing strategies for reducing energy costs by cutting heating to a bare minimum, meaning that, during the winter months, most people were cold much of the time and were cutting back on other living costs to meet their bills. The most shocking finding of all was that 5 people spontaneously mentioned buying less or cheaper food in order to have enough money to pay for their heating.
79% of our sample said they were on prepayment meters, with all but one of them saying they had chosen this payment method to help them manage their budgets. While just one of those interviewed mentioned the much higher cost they were paying for energy as a consequence of being on a prepayment meter, the impact of those higher costs, taken on voluntarily, showed in very upsetting accounts of trying to live with minimal heating, wrapped in duvets, cutting back on food, and feeling permanently cold.
Finally,
Two thirds of our group said they were having problems meeting their fuel costs,
with nearly as many saying they were worried about being able to meet these
costs.
Four fifths said they were giving up everyday necessities in order to meet their fuel
costs.
Two thirds said lack of heating was having an adverse impact on their health or
that of their family.

3
Recommendations
For energy suppliers:
All customers
Provide all customers with clear, easily understood information about tariffs.
Reduce the range of tariffs and simplify and standardise them.
Provide simple, well-publicised initiatives to help those on low incomes.
Provide information about trust funds to reduce arrears to all customers.
Prepayment customers
Ensure that prepayment customers are not disadvantaged by restricted choice of
tariffs or by energy unit costs.
Tell all prepayment customers exactly when and how they can switch to quarterly or
direct debit payment contracts.
Commit to improving communications with prepayment customers. Provide new
and existing PPM users with a user guide to how prepayment meters work that gives
clear information about energy and standing charges, and clarifies how the emer-
gency credit works and any adverse impact on costs of using it.
Give those on prepayment meters with arrears to pay off, regular and clear updates
on how much has been paid so far and the sum left owing, and let them know as
soon as the arrears have been cleared.
For landlords: Work positively with tenants to reduce damp, mould and condensation because
good maintenance benefits property as well as tenants.
Make a commitment to supporting energy efficiency standards.
For all consumers: Take regular advice about discounts and different suppliers.
Use free budgeting tools and advice (e.g. at CABs) to get the best deals and to
maximise your income.
For prepayment meter users: Ask your energy suppliers to tell you about all the tariffs available to prepayment
meter customers.
Ask your energy suppliers to tell you when and how you can switch to quarterly or direct debit payment contracts.
Use free budgeting tools and advice (e.g. at CABs) to get the best deals and to maximise your income.

4
For Government: Require energy companies to make more discounts and publicise these initiatives
more widely.
Prioritise low-income and fuel-poor households in all policy initiatives.
Link benefit rates and fuel costs either by providing automatic lower tariffs or higher
rates of benefit
Make Winter Fuel Payments payable to disabled people under pension age in receipt
of specific benefits.
Make the improvement of fuel-poor homes a local responsibility by transferring the
delivery of energy efficient measures currently sitting with energy companies, to-
gether with the nearly £1 billion annual levy on consumers’ bills, to local authorities.
Encourage and empower local authorities, in addition to energy companies, to
develop initiatives supporting those on low incomes.
Empower local councils to regulate and advise private landlords.
Introduce rent-capping measures to free up tenants’ income for fuel.
Overall, our findings strongly support the recommendations highlighted in
the Citizens Advice Fair Pay for Prepay campaign
and their ‘Closer to Home’ report.

5
The project
CABs in B&NES had been concerned at how much clients on low incomes were paying for fuel costs for some time, and we decided to look more closely at this issue. We were aware of the powerful national report from Citizens Advice, Topping-up or Dropping-out, which highlights the problems facing those on prepayment meters, and we believed this was a factor in fuel poverty in our area too. We wanted to continue to put pressure on the Big Six energy firms to further cut energy bills, especially for prepayment customers, now that wholesale prices have dropped, and we hoped that real-life stories about the effects of high fuel costs on people’s lives would be an effective way to do this.
We felt that a combination of the hard data filed when clients seek financial or benefit advice at the CABs in B&NES, together with more qualitative data obtained through interviews with these clients, would give us the best balance of information for this purpose.
Our sample
We took a 20% systematic sample of clients (30) with financial statements completed over a 4 month period by Bath, Midsomer Norton and Keynsham CABs, and whose fuel costs came to 10% or more of their net income (details of how this was done are in Appendix 1).
We used a telephone questionnaire and were able to complete interviews with 63.3% of our sample – 19 clients. We checked to see if any group had effectively been excluded from the interviews through non-response (see Appendix 2). While the non-response group was slightly more likely to be male, on average younger and entirely resident in Bath when compared with the respondents’ group, the only category which was not represented at all in the interview group due to non-response were 16–24 year olds.
What we found
Income
We asked respondents about their current monthly income (see Appendix 3, Table 9), and these ranged from £2,203.50 down to a mere £346.66 per month, which is clearly totally inadequate even for a single-person household.
We also asked about the sources of this income, and while the majority (52.6%) were on benefits or benefits and tax credits, the remainder were either in work (42.1%) or drawing a pension (5.3%) (see Appendix 3, Table 10). A number of those who were working felt they were facing more of a struggle than those in receipt of benefits.
Laura, single parent in her 40s living with a disabled child.
Working & on benefits. In social housing & on a prepayment meter.
I feel I’m being penalised as a working parent – I know people who are on benefits who get their rent and council tax paid but we have to find money for those now I’m working. I’m very worried about the council tax – we owe £2,000 and we haven’t been able to pay the sum that was agreed for the arrears.

6
Those living in the household
We asked about who lived in the respondent’s house or flat and whether anyone living there was ill or disabled, because these factors would influence their heating costs.
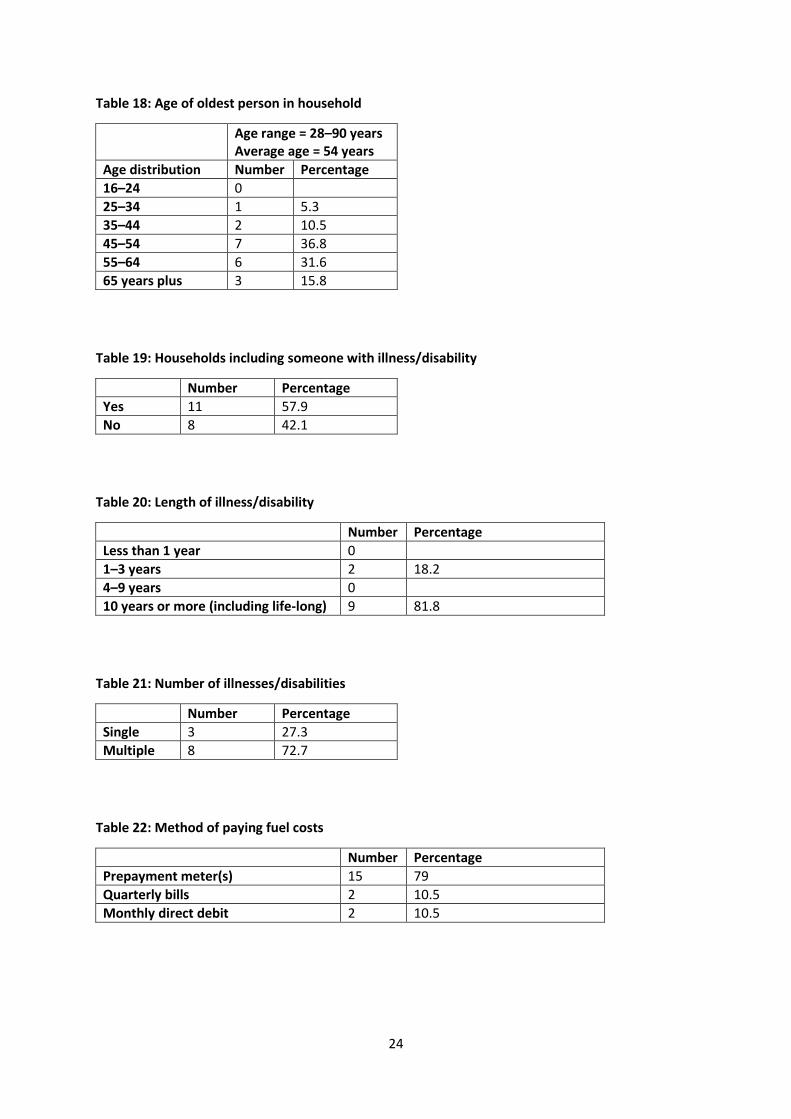
Over a third were in single-person households, under half in 2-person units and a fifth in 3-person households (see Appendix 3, Table 16). Only one household had a child under 5 years, but over a third had dependent children under 20 years living with them (see Appendix 3, Table 17). The age of the oldest person living in the household ranged from 28 to 90 years, with the majority (67.7%) aged 45–64 (see Appendix 3, Table 18).
Well over half of the households in our sample (57.9%) included someone who was ill or had a disability (see Appendix 3, Table 19). They were more likely to have multiple health problems or disabilities (72.7%) rather than just one, and the great majority (81.8%) had had these problems for over 10 years (see Appendix 3, Tables 20 & 21). High heating costs had a particularly adverse impact on those with disabilities or illnesses.
Living accommodation
We asked a range of questions about their accommodation, covering tenure, size, age of property, what insulation was installed and any problems they had in heating it.
68.4% were in social housing, with 15.8% in privately rented accommodation and 15.8% owner occupiers (see Appendix 3, Table 11). The size of the accommodation varied between 2 and 6 rooms, plus kitchen and bathroom (see Appendix 3, Table 12) with 63% having 3 or 4 living rooms/bedrooms.
The question about the age of the property was not easy for respondents to answer and many admitted they were guessing (see Appendix 3, Table 13). But it was clear that most were living in older properties, with only 21% believing their home was under 50 years old, a half thinking it was over 50 years old, and 10% believing it was over 100 years old.
More encouraging were the responses to our questions about insulation (see Appendix 3, Table 14). All respondents said they had double glazing throughout, but a number said it was no longer effective on one or more of their windows.
I have had pneumonia and still have breathing problems and use an inhaler so I would like to be warm. In the winter we go to bed early and take a hot water bottle – we don’t sit as a family as it’s far too cold. It’s all quite different in the summer. My son has depression, may be bi-polar, and living like this is not helping him at all.
Stuart & Tina, in their 50s, living with their adult son. On ESA, in social housing & on a
prepayment meter.

7
Several respondents said they knew their loft insulation was not up to current standards and needed replacing or adding to, and several said they thought they might have cavity wall insulation but were unsure about this.
We also asked respondents about whether there were any problems with the accommodation that might make it harder to heat. Over a third said there were no problems like these, but most of the other two thirds reported long-term multiple problems, like condensation and draughts, as impacting heavily on their lives and on their heating costs (see Appendix 3, Table 15).
We have double glazing but it doesn’t work. The windows are permanently taped up to seal them – it’s been like that for over 11 years. And we have to seal under the doors and it’s worse when it’s windy. And there is a leak in the bedroom, from over the window – the curtains are soaking and there is a puddle on the floor.
Nick, in his 40s, living with his young son. Working, in social housing & on a
prepayment meter.
The damp and condensation are really severe in the bathroom, the curtains and the photos in the living room get black mould, and my son’s room is the worst. His room stays really cold whatever we do and it has lots of damp and mould. We had to get rid of his last wardrobe as it was full of black mould and his clothes were ruined. Now we’re finding the same thing is happening with the new wardrobe and his clothes feel damp all the time. It’s really affecting his health a lot, he has had 4 or 5 colds over this winter and he has asthma, when he used to be really healthy before we were moved here. Recently we even came home several times to find the inside of the front door streaming with condensation, and this was when no-one was in, cooking or anything.
Pauline, in her 40s, living with her young son. Working, in social housing & on a
prepayment meter.
There are bad damp problems in the flat – my bedroom has mould on the walls and ceiling. I’ve told the landlord lots of times but he’s taken no action. There are also drafts in my daughter’s bedroom and mine, but actually I have to keep the windows open a bit to try to get rid of the mould.
Paul & Linda, in their 40s, living with their young daughter. Working & on benefits.
Private landlord & on a prepayment meter.

8
Only one client told us about successful eradication of damp by her (private) landlord. Many other respondents spoke of the long-term difficulties they faced in trying to get serious problems with damp, draughts and condensation fixed in order to make their homes easier to heat.
Paying fuel costs
We next asked respondents about how they pay for their gas and electricity. Nearly four fifths of our sample (79%) were on prepayment meters, with the remaining fifth paying their bills monthly by direct debit or quarterly (see Appendix 3, Table 22).
The large majority using prepayment meters were then asked why they were on this method of payment. All but one of our respondents (93.3%) told us they had chosen to be on meters to aid them in keeping within budget, rather than being required to have a meter by the energy supplier (see Appendix 3, Table 23). This choice echoed the findings in the 2014 CAB report Topping-up or Dropping-out, and in the 2013 CAB report Left Out in the Cold. Some clients had done this even though they knew the costs on prepayment meters were higher, but they emphasised how unfair and discriminatory they thought this was.
One respondent had discovered through the CAB how much cheaper her fuel bills could be when not on a prepayment meter and she was, unusually, allowed to transfer.
Anne, in her 40s, living with her young child. Working, in social housing & on a
prepayment meter.
I do everything that the landlord says to do to cure the damp but nothing helps. And we have huge problems with the landlord over maintenance and repairs. I keep telling them about all the problems but they either do nothing or someone comes round but the problem isn’t sorted.
I chose to have a prepayment meter because I think it’s better to pay as you go, but it costs a lot more, which is unfair. I’ve never been in arrears but I am penalised even though I’m paying in cash in advance. And I still have a meter reader who comes round, which I don’t understand as I don’t get a bill. I’m told it’s in case I’m rigging my meter!
Wendy, in her 40s, living with her adult disabled son. Working, owner-occupier &
on a prepayment meter.

9
Some clients said they felt they had not been given clear enough information about the charges they were required to pay, and some were confused and worried about how the £5 emergency allowance worked.
Because we knew of instances where prepayment meters had been put in inaccessible places, we also asked where the meters were and if they were easy to access. While all respondents said their meters were in conventional places (such as on an outside wall, in a kitchen cupboard or high up in the hall), some of those with disabilities reported finding these hard to access when topping-up.
Types of heating used
Next we asked about the type(s) of heating available in the accommodation. All respondents had either gas central heating (84.2%) or electric storage heaters (15.7%) installed, and a few had auxiliary heat sources such as coal fires, gas fires or freestanding or built-in electric fires (see Appendix 3, Table 24). However, we were frequently told that these latter two were too expensive to use.
I used to be very worried about fuel costs and just couldn’t afford to keep warm. I had nearly £200 arrears when I saw the CAB last year, but my gas and electricity costs have dropped massively now. I was on a meter before but the supplier agreed to me moving to direct debit – it’s much cheaper AND I get a “home discount”. It’s made a huge difference and I can stick to my budget.
Rosie, in her 50s, living with her young child. On benefits, private landlord & now
on direct debit.
When the meter runs out, we’re too scared to use the emergency allowance for gas or electricity because if you do, you get struck with a hidden charge of £10 as well as the £5 to get the heating back on. Both my previous supplier and my new supplier do this. I think it is underhand – they’re taking money from people who don’t have it.
Laura, in her 40s, disabled, living with her partner & young child. Working & on
benefits. In social housing & on a prepayment meter.
We hardly use the electric fire as it uses far too much electricity.
Anne, in her 40s, living with her young child. In work, in social housing, on prepayment meter. .meter.

10
Those with gas central heating were asked about the age of their boiler and the number of radiators in the accommodation. While the majority did not know their boiler’s age, often because it had been in the premises when they moved in, the rest were evenly split between saying it was under 4 years, and over 5 years old (see Appendix 3, Table 25).
Asked about the numbers of radiators in the accommodation, two respondents could not give us a figure, though the rest reported having between 4 and 10 radiators installed (see Appendix 3, Table 26).
How the heating is used
We asked how respondents used their heating in the winter and in the summer.
The responses for winter use revealed a variety of strategies aimed at restricting heating costs, with no instance of heating being left on day and night (see Appendix 3, Table 27).
Nearly a third had their heating on only in the mornings and evenings, even if someone was in the accommodation during the day. A further fifth had it on just in the mornings (with occasional top-up when it became too cold to bear) or just in the evenings.
While these self-rationing strategies might effectively keep heating costs down, several clients mentioned that there were health consequences as a result for themselves or their family.
Three clients with disabilities had the heating on all day as otherwise they could be ill, and a further two clients had it on in the day but only in the rooms that were in use.
Many respondents talked about wrapping up in extra layers or even retreating to bed when they couldn’t afford to keep the heating on.
Paul & Linda, in their 40s, living with young daughter. Working & on benefits.
Private landlord, on a prepayment meter.
The only way we cope with the costs is restricting when we use the heating. It’s only on in the evenings between 5 and 10pm. It’s not on otherwise even though we’re in and we’re cold. We just use a blanket or dressing gown to keep warm, but my daughter has lots of colds.
Nick, in his 40s, living with his young son. Working, in social housing & on a
prepayment meter.
We put the heating on for a few hours in the mornings and then seal the room to keep the heat in. We don’t even have the hot water switched on every evening, otherwise the electricity bill is far too high.

11
A number of clients mentioned going to stay with friends or family to help them reduce their costs, with some relying heavily on this support in order to meet their bills.
Some clients mentioned that the downside of this tactic was that their homes were even colder and harder to warm up when they returned.
Strategies for the use of heating in summer were much simpler – the majority (16 respondents or 84.2%) never use it at all, with only 3 using it very occasionally, mostly because those with disabilities were less mobile and so felt the cold more on chilly days (see Appendix 3, Table 28).
Energy costs are so high that I spend most weekends with my partner (outside Bath). The problem with this is that if the storage heaters have not been on at the weekend, the flat is freezing.
Alan, in his 50s, disabled and living alone. On benefits, in social housing & on a
prepayment meter.
When you rang I was in the bedroom hiding under the duvet just to try to keep warm because we switch the heating off while my daughter is at school.
Laura, in her 40s, disabled, living with her partner & young child. Working & on
benefits. In social housing & on a prepayment meter.
Most of the time when I am at home I use a hot water bottle and a duvet just to keep warm.
Christine, in her 60s, living alone. Working, owner-occupier, & pays for fuel quarterly.
The flat is so damp and hard to heat that we use it as little as possible and spend as much time as we can with friends rather than be here.
Pauline, in her 40s, living with young son. Working, in social housing, on prepayment meter.
12
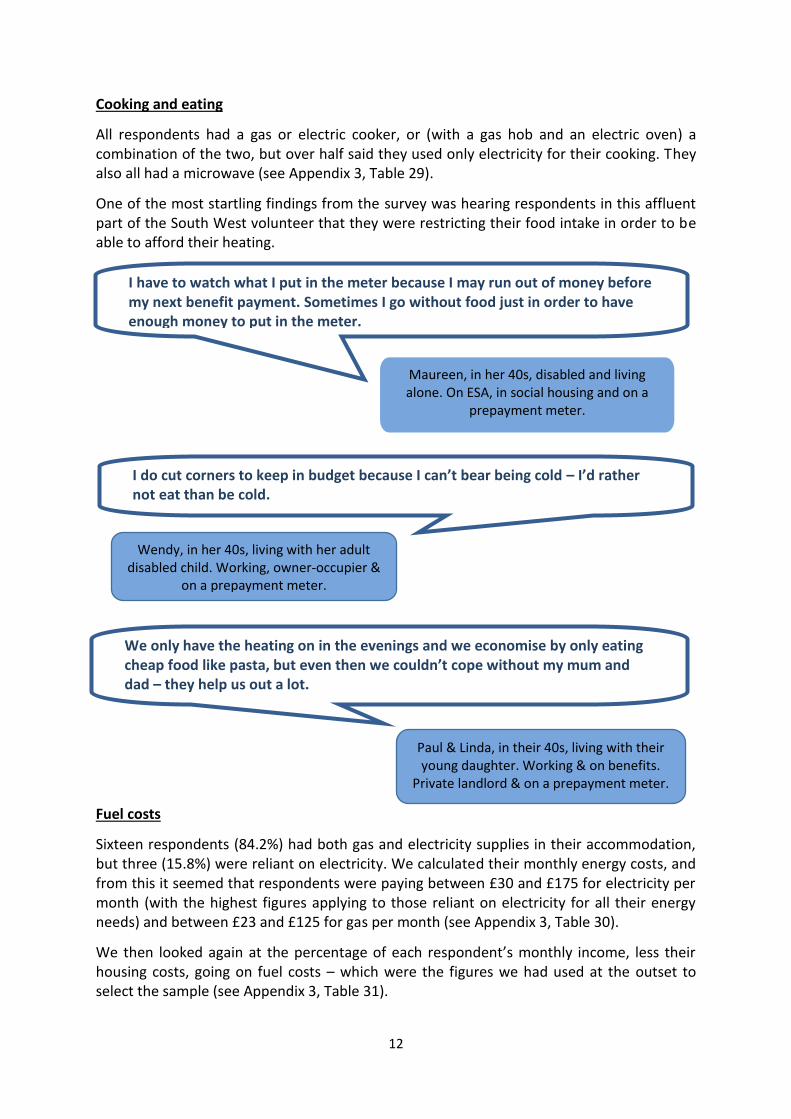
Cooking and eating
All respondents had a gas or electric cooker, or (with a gas hob and an electric oven) a combination of the two, but over half said they used only electricity for their cooking. They also all had a microwave (see Appendix 3, Table 29).
One of the most startling findings from the survey was hearing respondents in this affluent part of the South West volunteer that they were restricting their food intake in order to be able to afford their heating.
Fuel costs
Sixteen respondents (84.2%) had both gas and electricity supplies in their accommodation, but three (15.8%) were reliant on electricity. We calculated their monthly energy costs, and from this it seemed that respondents were paying between £30 and £175 for electricity per month (with the highest figures applying to those reliant on electricity for all their energy needs) and between £23 and £125 for gas per month (see Appendix 3, Table 30).
We then looked again at the percentage of each respondent’s monthly income, less their housing costs, going on fuel costs – which were the figures we had used at the outset to select the sample (see Appendix 3, Table 31).
Maureen, in her 40s, disabled and living alone. On ESA, in social housing and on a
prepayment meter.
I have to watch what I put in the meter because I may run out of money before my next benefit payment. Sometimes I go without food just in order to have enough money to put in the meter.
I do cut corners to keep in budget because I can’t bear being cold – I’d rather not eat than be cold.
.
Wendy, in her 40s, living with her adult disabled child. Working, owner-occupier &
on a prepayment meter.
We only have the heating on in the evenings and we economise by only eating cheap food like pasta, but even then we couldn’t cope without my mum and dad – they help us out a lot.
Paul & Linda, in their 40s, living with their young daughter. Working & on benefits.
Private landlord & on a prepayment meter.

13
From those figures, we knew that everyone in the sample was spending 10% or more of their income, less housing costs. But while the largest group (6 respondents or 31.6%) were paying a heavy but sustainable 10–15%, the rest were paying higher proportions – 2 paying 20–24%, 3 paying 25–29%, one paying 30%–34% and one poor person paying an extraordinary and totally unsustainable 81.1% of their available income on energy costs. This made it very clear indeed why some of our respondents were having such an impossible struggle to make ends meet.
The respondent paying the highest level of income on fuel costs in our group commented:
We also asked respondents if they were repaying any arrears as part of their fuels costs, and only three (15.8%) reported that they were. All three, when asked about how much they still owed, were unable to give a figure because they said they had not been told by their energy company how much still remained to be paid off.
10% - 14.9% 15% - 19.9% 20% - 24.9% 25% - 29.9% 30% - 34.9% 35% - 39.9% OVER 80%
0
1
2
3
4
5
6
7
Percentage of income (less housing costs) on fuel costs
We have lived here for 30 years, since the first of our children was born. We used to pay £10 a week for fuel for the whole family, now it’s £60 just for me. I’m trying to move to a smaller property. This would help reduce fuel bills.
Peggy, in her 50s, disabled & living alone. On benefits, in social housing & on a prepayment
meter.

14
The impact of fuel costs
In the final section of the questionnaire, we asked respondents about the effects of fuel costs on them and their family. Firstly, we put four questions to them, recording “yes” or “no” answers, and then we asked them to tell us in their own words how they felt about their heating and their fuel bills (see Appendix 3, Table 32).
Two thirds said they were worried about their fuel costs, and slightly more said they had problems meeting these costs. Two thirds also said the lack of heating had an impact on their own or their family’s health, and a massive four fifths of our sample said they were giving up things in order to meet their fuel costs.
We were told about the kinds of sacrifices people were making, or strategies they were adopting, in order to meet their fuel bills. Although we did not ask specifically about food, as already mentioned in the section on cooking and eating, cutting back on this spontaneously emerged as a recurrent theme in the ways that people said they were economising.
When I saw the CAB, I owed about £200 in arrears and I’ve been paying it off, but now I haven’t been told if I still owe anything. The bills are very difficult to read and work out and they don’t say what you owe or how it is going down.
Rosie, in her 50s, living with young child. On benefits, a private landlord & only
recently on direct debit.
We originally owed £1,200 and are paying back £50 per month, but we don’t know how much it has gone down by.
Tom & Alice, pensioners in their 70s. Owner occupiers & paying by direct debit.
I had huge debts to Southern Electric – about £500, and I know I’ve been paying this off but I have no idea by how much, they don’t tell you. You just keep paying through the meter and I’ve been doing this for 4 or 5 months now, but they don’t let you know how much has been paid off.
Pauline, in her 40s, living with young son. Working, in social housing & on a prepayment
meter.

15
I’m not at home a lot because heating is so expensive. I go to friends and family a lot because I just can’t afford it. I can’t afford food either but my friends feed me too.
Christine, in her 60s, living alone. Working,
owner-occupier, pays bills quarterly.
I don’t buy clothes for myself (only for my son), I don’t drink and I don’t go out with friends because we just can’t afford it.
Nick, in his 40s, living with his young son. In work, in social housing, on a prepayment meter.
My heating costs have gone up a lot recently, and meeting them now is a complete struggle. I only heat the rooms I use – I can’t afford to heat the others and I can’t afford to put the temperature up so we sit with a rug over us. We shop as cheaply as we can and only eat cheaper food.
Barbara, disabled, in her 50s, living with her partner. On benefits, in social housing
& on a prepayment meter.
The majority of our money goes on gas and electricity. We are giving up family life to keep the bills down. I have breathing problems so would like to be warm. In the winter we go to bed early and take a hot water bottle – we don’t sit as a family as it’s far too cold. It’s all quite different in the summer. My son has depression … and living like this is not helping him at all.
Stuart & Tina, in their 50s, living with their adult ill son. On ESA, in social housing & on
a prepayment meter.

16
I have a good system to make sure I can afford my fuel costs – I make sure I only use what I can afford, I don’t go out, and I go to bed at 8.30pm when it’s chilly. I do need to keep warm, otherwise it does affect my health.
Fred, in his late 60s, ill with cancer, living alone. On benefits, in social housing, & on
a prepayment meter.
The flat is so damp and hard to heat that we use it as little as possible and spend as much time with friends rather than be here. The boiler is quite new, just over a year old, but it’s broken down several times already. We only use the heating when we’re in, and even then only for a few hours in the mornings and evenings, and my son’s room doesn’t heat up at all.
Pauline, in her 40s, living with her young son. Working, in social housing & on a
prepayment meter.
My health problems mean I have to be warm but meeting the costs mean I can’t do things like going out any more.
Malcolm, in his 60s, disabled, living alone. On ESA, in social housing & on a prepayment
meter.
I budget very carefully so I don’t have to worry about energy costs. My elderly mother is very sensitive to the cold. My mother and I spend a lot of time in our bedrooms because the sitting room is so cold – it needs another radiator and I’ve told the landlord about this. There are lots of time a month I don’t use my car when I would like to so that I have enough money for gas and electricity.
Andrew, in his 50s, disabled, living with his mother in her 90s. On benefits &
pension. In social housing & on a prepayment meter.

17
While most clients said that meeting bills was a struggle, just one respondent reported being able to keep warm without making major sacrifices:
Follow-up support & feedback
We wanted to thank our respondents for their help, so we ended the interview by asking them about any further support they would find useful.
All our respondents were happy to have a home heating thermometer to check how warm or cold their homes were. With this we sent them information and phone numbers for several local projects set up to help them save money on their heating, including B&NES Energy at Home which offers free phone advice and, in some cases, carries out a home assessment to suggest ways of saving on energy costs.
We also asked if they needed any further advice on benefits or financial matters. While two thirds said that the CAB had sorted out their benefits or financial problems when they last spoke to an adviser and said they were confident that they didn’t need any further help with these issues, 6 people (31.6%) did ask for an adviser to contact them to provide additional support, which was done.
All the people we spoke to responded warmly to knowing we were from the CAB, and we were very touched that some wanted to go on record with their gratitude to the CAB for the help it had given them.
Not being able to afford to keep warm makes you feel isolated.
Laura, in her 40s, disabled, living with her partner & young child. Working with some
benefits. In social housing & on a prepayment meter.
I am currently in hospital with a severe chest infection, but when I am at home in my bungalow, the benefits cover the fuel costs well so I don’t have problems with this. I have to keep warm, so that is just as well.
Trevor, in his 50s, disabled, living alone. On benefits, in social housing & on a
prepayment meter.

18
The CAB was very helpful indeed when we got into difficulties.
Tom & Alice, in their 70s. Pensioners, owner-occupiers & paying bills by direct
debit.
Bath CAB has provided a brilliant service so far. They have been unbelievably helpful. It is so nice to be able to talk to people who sympathise with your problems.
Richard & Ann, in their 40s, living with their 2 children. Working, with private landlord, &
paying bills quarterly.

19
Appendix 1: Our sample
We took the 254 financial statements completed over a 4-month period (1 July to 31 October 2014) for all clients attending Bath, Midsomer Norton and Keynsham CABs, and calculated the percentage of fuel costs recorded against the income for each household after basic housing costs (rent or mortgage payments) had been deducted. We removed all clients with fuel costs of less than 10%, which left 149 clients – 105 (70.5%) from Bath CAB, 37 (24.8%) from Midsomer Norton CAB and 7 (4.7%) from Keynsham CAB. We then took a 20% systematic sample of these clients, giving us a total of 30 clients, with the following distribution:
Table 1: Postcode of clients in sample
Postcode Number Percentage
BA1 4 13.3
BA2 19 63.3
BA3 3 10
BS31 1 3.3
BS39 3 10
Table 2: Gender of clients in sample
Gender Number Percentage
Male 15 50
Female 15 50
Table 3: Age of clients in sample
Age range = 20–71 years Average age = 44 years
Age distribution Number Percentage
16-24 3 10
25-34 3 10
35-44 4 13.3
45-54 10 33.3
55-64 7 23.3
65 years plus 2 6.7
Age not recorded 1 3.3
Table 4: Percentages in sample of household income (less housing costs) spent on fuel costs
Range = 11.5–134.3%
Percentage on fuel costs Number Percentage
10–14.9 11 36.7
15–19.9 6 20
20–24.9 2 6.7
25–29.9 3 10
30–34.9 1 3.3
35–39.9 2 6.7
40% and over* 3 10
Note: some of these very high percentages may be due to incomplete information being recorded in
the financial statements.

20
Appendix 2: The interview group
We devised a telephone questionnaire and carried out interviews in March 2015. We made up to 5 attempts to contact all the clients in the sample at a range of times of day and evening, and successfully completed 19 interviews. The remaining 11 clients were either unobtainable or (in 2 cases) declined to take part. This gave us a non-contact rate of 36.7%.
To check if any group had effectively been excluded from the interview stage through non-response, we compared the 2 groups by postcode, gender, age and percentages spent on fuel costs, as follows:
Table 5: Postcodes of respondents and non-respondents
Group of 19 Respondents Group of 11 Non-respondents
Postcode Number Percentage of group Number Percentage of group
BA1 3 15.8 1 9.1
BA2 9 47.4 10 90.9
BA3 3 15.8 0
BS31 1 5.3 0
BS39 3 15.8 0
Table 6: Gender of respondents and non-respondents
Group of 19 Respondents Group of 11 Non-respondents
Gender Number Percentage of group Number Percentage of group
Male 9 47.4 6 54.5
Female 10 52.6 5 45.5
Table 7: Age of respondents and non-respondents
Group of 19 Respondents Group of 11 Non-respondents
Age range = 28–71 years Average age = 53 years
Age range = 20–59 years Average age = 36 years
Age distribution Number Percentage Number Percentage
16–24 0 3 27.3
25–34 1 5.3 2 18.2
35–44 2 10.5 2 18.2
45–54 8 42.1 2 18.2
55–64 6 31.6 1 9.1
65 years plus 2 10.5 0
Age not recorded 0 1 9.1

21
Table 8: Household income (less housing costs) of respondents and non-respondents spent on fuel
costs
Group of 19 Respondents Group of 11 Non-respondents
Range: 11.5–81% Range: 11.5–134.3%
Percentage on fuel costs Number Percentage Number Percentage
10–14.9 5 26.3 6 54.5
15–19.9 5 26.3 2 18.2
20–24.9 2 10.5 0
25–29.9 3 15.8 0
30–34.9 1 5.3 0
35–39.9 2 10.5 1 9.1
40% and over 1 5.3 2 18.2

22
Appendix 3: The interviews
The responses to all the questions asked in interviews were as follows:
Table 9: Monthly income of respondents
Range = £346.66–2,203.50 per month
Number Percentage
Under £400 1 5.3
£400–599 1 5.3
£600–799 4 21.1
£800–999 2 10.5
£1,000–1,499 7 36.8
£1,500–1,999 2 10.5
£2,000–2,499 2 10.5
Table 10: Source(s) of monthly income of respondents
Source(s) Number Percentage
Benefits only 9 47.3
Benefits and tax credits 1 5.3
Wages only 3 15.8
Wages and tax credits 1 5.3
Wages and benefits 2 10.5
Wages, benefits and tax credits 2 10.5
Pensions only 1 5.3
Table 11: Tenure of respondents
Tenure Number Percentage
Owner/occupier 3 15.8
Rented social housing 13 68.4
Privately rented accommodation 3 15.8
Table 12: Number of rooms, in addition to kitchens and bathrooms
Rooms apart from kitchen and bathroom Number Percentage
2 rooms 4 21.1
3 rooms 5 26.3
4 rooms 7 36.8
5 rooms 2 10.5
6 rooms 1 5.3

23
Table 13: Age of property
Age Number Percentage
Over 20 years old 4 21.1
Over 50 years old 10 52.6
Over 100 years old 2 10.5
Don’t know the age 3 15.8
Table 14: Insulation installed
Insulation Number Percentage
Loft insulation 14 73.6
Cavity wall insulation 8 42.1
Solid wall insulation 0
Double glazing to all windows 19 100
Solar panels 0
Table 15: Problem(s) making the premises hard to heat
Problem(s) reported Number Percentage
Damp 7 36.8
Condensation 8 42.1
Draughts 6 31.6
Poor insulation 2 10.5
Double glazing doesn’t work properly 1 5.3
Size of accommodation and/or living room 2 10.5
No problems reported 7 36.8
Table 16: Number living in the household
Number Percentage
1 person 7 36.8
2 people 8 42.2
3 people 2 10.5
4 people 2 10.5
Table 17: Children living in the household
Dependent children under 20 years Children under 5 yrs
Number Percentage Number Percentage
None 12 63.2 18 94.7
1 5 26.3 0
2 2 10.5 1 5.3
24
Table 18: Age of oldest person in household
Age range = 28–90 years Average age = 54 years
Age distribution Number Percentage
16–24 0
25–34 1 5.3
35–44 2 10.5
45–54 7 36.8
55–64 6 31.6
65 years plus 3 15.8
Table 19: Households including someone with illness/disability
Number Percentage
Yes 11 57.9
No 8 42.1
Table 20: Length of illness/disability
Number Percentage
Less than 1 year 0
1–3 years 2 18.2
4–9 years 0
10 years or more (including life-long) 9 81.8
Table 21: Number of illnesses/disabilities
Number Percentage
Single 3 27.3
Multiple 8 72.7
Table 22: Method of paying fuel costs
Number Percentage
Prepayment meter(s) 15 79
Quarterly bills 2 10.5
Monthly direct debit 2 10.5

25
Table 23: Reason for using prepayment meters
Number Percentage of those with prepayment meters
Voluntarily, to assist in budgeting 14 93.3
Required by energy supplier 1 6.7
Table 24: Type of heating
Number Percentage
Gas central heating 16 84.2
Electric storage heaters 3 15.7
Other built-in electric/gas fires 1 5.3
Freestanding electric fires 6 31.6
Coal fires 1 5.3
Table 25: Age of gas central heating boiler
Number Percentage
1–4 years 5 26.3
5–9 years 5 26.3
No idea/ there when we moved in 6 31.6
Table 26: Number of radiators
Number of radiators in premises Number Percentage
4 2 10.5
5 4 21.1
6 2 10.5
7 1 5.3
8 1 5.3
9 2 10.5
10 2 10.5
No idea of number 2 10.5

26
Table 27: Heating use in winter
Heating use in winter Number Percentage
On for a few hours in the morning only 1 5.3
On for a few hours in the morning & when I feel cold 1 5.3
On in the morning and in the evening 6 31.6
On in the evenings only 2 10.5
On all day (clients with disabilities) 3 15.8
On all day but only in rooms in use (able bodied clients) 2 10.5
No routine/turn it off when out/turn it off whenever I can 3 15.7
Have storage heaters so on charge overnight 2 10.5
Table 28: Heating use in summer
Heating use in summer Number Percentage
Do not use 16 84.2
Occasional use when particularly cold 3 15.8
Table 29: Fuel used for cooking
Number Percentage
Electric cooker only 11 57.8
Gas cooker only 4 21.1
Gas hob and electric oven 4 21.1
Microwave 19 100
Table 30: Fuel costs
Electricity (19) Gas (16)
Range = £30–175 per month Average = £73.55 per month
Range = £23–125 per month Average = £64.46 per month
Number Percentage Number Percentage
£20–39.99 1 5.3 3 18.8
£40–59.99 8 72.7 4 25
£60–79.99 3 15.8 3 18.8
£80–99.99 2 10.5 3 18.8
£100–199.99 3 15.8 2 12.5
£120–139.99 1 5.3 1 6.25
£140–159.99 0 0
£160–179.99 1 5.3 0

27
Table 31: Percentage household income (less housing costs) spent on fuel costs
Range = 11.5–81.1%
Percentage on fuel costs Number Percentage
10–14.9 6 31.6
15–19.9 4 21.1
20–24.9 2 10.5
25–29.9 3 15.8
30–34.9 1 5.3
35–39.9 2 10.5
OVER 80% 1 5.3
Table 32: The effects of fuel costs
Question Number Percentage
Are you worried about your fuel costs? Yes 12 63.2
No 7 36.8
Are you having problems meeting these fuel costs? Yes 13 68.4
No 6 31.6
Does a lack of heating have any impact on your &/or your family’s health?
Yes 12 63.2
No 7 36.8
Are you giving up things in order to meet fuel costs? Yes 15 78.9
No 4 21.1

28
Bibliography
For a general overview of fuel poverty Fuel Poverty Advisory Group, Annual Report 2013–14,
www.gov.uk/government/uploads/system/uploads/attachment_data/file/405588/fpag_12th_annual_report_2013_2014.pdf
Department of Energy & Climate Change, Fuel Poverty Statistics Report 2015, www.gov.uk/government/statistics/annual-fuel-poverty-statistics-report-2015 Citizens Advice, Are Vulnerable Consumers Getting a Raw Deal on Energy? (28 May 2015) https://blogs.citizensadvice.org.uk/blog/are-vulnerable-consumers-getting-a-raw-deal-on-their-energy/ Public Health England, Statistics for Excess Winter Deaths 2012, www.gov.uk/government/uploads/system/uploads/attachment_data/file/229819/Excesswinter_mortal
ity_2012.pdf Government strategy to cut fuel poverty Fuel Poverty Strategy for England, Cutting the Cost of Keeping Warm (March 2015), www.gov.uk/government/publications/cutting-the-cost-of-keeping-warm About prepayment meters and fuel poverty Citizens Advice campaign Fair Play for Prepay, www.citizensadvice.org.uk/fairprepay Citizens Advice Scotland and Citizens Advice, Topping-up or Dropping-out: Self-disconnection among Prepayment Meter Users (October 2014), www.citizensadvice.org.uk/index/policy/policy_publications/topping_up_or_dropping_out.htm Stratford-upon-Avon and District CAB with the Legal Advice Warwickshire Social Policy Group and Consumer Empowerment Partnership, Left Out in the Cold: Why Prepayment Meter Users Need a Better Deal (April 2013), https://stratforduponavoncab.org.uk/wp-content/uploads/2014/12/LEFT-OUT-IN-THE-COLD-
December-2013.pdf For advice about saving on fuel costs B&NES advice for saving energy, www.energyathome.org.uk/ Big Energy Saving Week campaign, www.citizensadvice.org.uk/index/aboutus/bigenergysavingweek.htm Citizens Advice, Energy Best Deal, advice for reducing energy bills, www.citizensadvice.org.uk/about-us/how-we-provide-advice/our-prevention-work/financial-skills-for-
life/financial-skills-for-life-projects/energy-best-deal/ Citizens Advice reports about policies to reduce fuel poverty Citizens Advice, Taking Control: The Potential for Policies to Help Consumers Use Less, Waste Less and Pay Less (October 2014), www.citizensadvice.org.uk/index/policy/policy_publications/energy_policy_and_the_potential_for_ene
rgy_consumers_to_take_control_of_their_bills.htm Citizens Advice, Closer to Home (May 2015) www.citizensadvice.org.uk/about-us/policy/policy-research-topics/essential-services-policy-
research/closer-to-home/ Centre for Sustainable Energy (CSE) for Citizens Advice, Energy Tariff Options for Customers in Vulnerable Situations (May 2015), www.citizensadvice.org.uk/about-us/policy/policy-research-topics/essential-services-policy-
research/energy-tariff-options-for-consumers-in-vulnerable-situations/ National Energy Action (NEA) for Citizens Advice, Developing an Extra Help Scheme for Vulnerable Smart Meter Customers (September 2014), www.citizensadvice.org.uk/about-us/policy/policy-research-topics/essential-services-policy-
research/developing-an-extra-help-scheme-for-vulnerable-smart-meter-customers/ Citizens Advice, Raising Standards Cutting Bills www.citizensadvice.org.uk/about-us/policy/policy-research-topics/essential-services-policy-
research/raising-standards-cutting-bills/