Heating in Poland - Forum Energii
44
Heating in Poland Edition 2019 www.forum-energii.eu
Transcript of Heating in Poland - Forum Energii

Heating in Poland Edition 2019
www.forum-energii.eu

Heating in Poland
2
AUTHOR:
Rafał Macuk, Forum Energii
COOPERATION:
Joanna Maćkowiak-Pandera PhD, Andrzej Rubczyński, Forum Energii
EDITING:
Brien Barnett
GRAPHIC DESIGN:
Karol Koszniec
MANY THANKS
We would like to thank the Institute for Structural Research, Chamber of Commerce Polish District Heating, and the National Energy Conservation Agency for their cooperation and assistance in obtaining data necessary to prepare this publication.
DATE OF PUBLICATION:
December 2019
Forum Energii is a think-tank focused on the energy sector. Our mission is to create the foundations for an effective, safe, clean and innovative
energy sector based on data and analyses.
All analyses and publications by Forum Energii are made available free-of-charge and may be reproduced provided that the source and authors are
identified.

Heating in Poland
3
Foreword (Dr. Joanna Maćkowiak-Pandera) 05
Heating - definition and access to data 06
Main conclusions 07
The greatest amount of heat is generated in individual households 08
Buildings and energy efficiency 09
Heat production is dominated by solid fuels 10
The most of buildings were built before 1988 11
Energy standard of buildings in Poland is low 12
Most of the energy in households is used for heating 13
Fuels and emissions 14
The heating sector is dominated by coal 15
CO2 emissions are still high 16
The main source of smog is the combustion of solid fuels in individually heated households 17
Households in Poland consume the most coal in the European Union 18
Energy poverty 19
Defining energy poverty 20
Most of the energy poor live in single-family buildings constructed between 1961 and 1995 21
Most of the energy poor live in single-family houses in the countryside 22
TABLE OF CONTENTS
DECEMBER 2019

Heating in Poland
4
District heating current state and challenges 23The main heat consumers of district heating are households 24
Only 66% of heat is generated through cogeneration 25
No action has been taken to change the heating fuel mix 26
As much as 80% of the heating systems in Poland are inefficient 27
Smaller cities, lower efficiency 28
The heating sector has adapted to the current challenges, but the most serious are yet to come 29
Heat sales are falling despite an increase in the number of customers 30
District heating financial aspects 31
Average prices of heat from heat-only units 32
Large district heating systems in cities reduce average heat prices for the region 33
The price of heat from coal is becoming less and less competitive 34
Heat producers’ costs exceed their income 35
District heating in the European Union 36
Poland has the largest number of district heating customers among all EU countries 37
Poland is second in Europe when it comes to the amount of consumed heat produced in district heating systems 38
Despite the extensive heating system in Poland, the share of cogeneration compared to the EU is relatively small 39
For more than 30 years, the fuel mix in the EU has been changing rapidly 40
District heating fuel mix of selected EU countries in 1990-2017 41
District heating fuel mix of selected EU countries in 1990-2017 42
DECEMBER 2019

Heating in Poland
5
Foreword
Poland suffers from smog, especially in winter. To start to improve air quality, heating must first be seen in the broad perspective, composed of
both district heating networks and household heat supply. As much as 70% of heat is generated in individual heating systems. The remaining 30% is
produced in district heating systems—one of the most developed district heating networks in Europe. This distinction is now threatened with gradual
degeneration and the loss of opportunities to provide an external development impulse. As much as 80% of the heating systems in Poland do not meet
the requirements of the Energy Efficiency Directive and this eliminates the possibility of support from EU funds.
One of the main barriers to clean heat is not only the lack of a comprehensive strategy for this area but, above all, the lack of publicly available data to
describe the condition of this sector. It is striking that the supply of heat—a major environmental and social issue in Poland—is so poorly described and
recognised. There is no data on the status of the energy efficiency of individual buildings, heating sources, and many other source points. Fragmentary
information is collected by the Central Statistical Office, the Energy Regulatory Office, and the Energy Market Agency. However, they are not easily
accessible. The lack of knowledge about the sector results in low interest in key institutions and it is difficult to propose corrective solutions if the
problem is not well diagnosed.
We present this report in order to share the collected data in an accessible form and to support the discussion on the strategy of supplying clean heat
to Polish homes.
Enjoy your read,
Dr. Joanna Maćkowiak-Pandera
President of Forum Energii
Heating in Poland
6
Heating - definition and access to data
We define heating in a broad sense, both as district heating, which includes district heating networks with generation sources, and non-system
heating, i.e., individual heating systems in households.
This report is based on the most up-to-date data and materials published by the Central Statistical Office (GUS), Energy Market Agency (ARE), Energy
Regulatory Office (ERO), National Energy Conservation Agency (KAPE), National Centre for Balancing and Emissions Management (KOBiZE), Chamber
of Commerce Polish District Heating (IGCP), Eurostat, and others.
While preparing this publication, we have noticed problems that may be a barrier not only in creating an objective and complete picture of the heating
sector in Poland but also in introducing necessary changes in this field. These are:
•• Lack of access to data—either they are not collected or not made public; and,
•• Lack of methodological consistency in published data—statistical institutions apply their own method, which makes it impossible to create
a coherent picture of the examined issue.
For example, the ERO data on district heating included in this report concern only licensed companies with a capacity greater than 5 MW. Therefore,
enterprises with smaller capacities were omitted.
The lack of data is a barrier to the transformation of the energy sector in Poland. The supply of heat is a public domain and concerns every Polish
household. Data on, e.g., energy efficiency, pollutant emissions, or forms of heating should be regularly collected and made available to the public.

Heating in Poland
7
Main conclusions
•• For years, politicians in Poland have not been interested in the problem of heating, seeing it as difficult to address (dispersed structure),
socially sensitive (heating costs), and political (pressure to use traditional coal instead of cleaner forms of heat generation).
•• The effect of the negligence in improving the quality of heating is the worst air pollution in the EU as a result of emissions from more than
4 million homes heated by their own solid fuel heat sources. Domestic households in Poland account for 87% of the coal consumed by all
households in the European Union.
•• Due to the scale of the problem and the dispersion of individual heat sources, responsibility for changes in heating is shared between different
levels of government and local administration. The lack of a coordinator for heating issues in general has resulted not only in poor air quality
but also in low energy efficiency of buildings, large losses of primary energy, as well as a lack of development impulses for small and medium-
sized enterprises cooperating with construction and heating.
•• There is a lack of both long-term energy efficiency policy and modernisation of the heating sector, as well as indications to domestic industry
of key technologies, which are the foundation of the transformation and, at the same time, the source of business development.
•• The less-than-fully planned policy of privatisation of the heating sector in the 1990s became a development impulse for large heating companies
but it left undercapitalised small heating systems to their fate. As a result, currently about 80% of heating companies in Poland (responsible
for the production of 38% of district heating) are classified as inefficient.
•• The lack of a vision for the development of district heating and its long-term goals has led the government administration to focus almost
exclusively on controlling prices in heating systems.
•• The lack of a precise national energy policy, combined with keeping heat prices as low as possible, stopped the modernisation of the heating
system and led to accumulated problems.
•• Ineffective social policies to prevent energy poverty (which affects about 12% of the population) are blocking the modernisation of heating.
•• It is necessary to define modernisation goals for the heating sector in the perspective of 2030 and to develop mechanisms to support their
implementation and business models that introduce changes.

Heating in Poland
8
The greatest amount of heat is generated in individual households
•• District heating is a quarter of the heat stream.
•• The state’s energy and environmental policies should cover both district heating systems and individual heating.
INDIVIDUAL HEATING: 76%
HOUSEHOLDS: 49%
HOUSEHOLDS: 17%
TRADE, SERVICES AND OTHERS: 7%
TRADE, SERVICES AND OTHERS: 2%
INDUSTRY AND CONSTRUCTION: 20%
INDUSTRY AND CONSTRUCTION: 5%
DISTRICT HEATING: 24%
HEA
T CO
NSU
MPT
ION
: 10
0%
Chart 1. Structure of heat consumption in Poland Source: based on data from the National Agency for Energy Conservation (KAPE), Central Statistical Office (GUS) and Energy Regulatory Office (ERO).

Heating in Poland
9
Buildings and energy efficiency

Heating in Poland
10
Heat production is dominated by solid fuels
•• As many as 3.5 million buildings use inefficient solid-fuel heat sources for heating.
Chart 2. Domestic heating solution by energy carrier in 2015Source: based on CSO data.
ELECTRICITY2%
NATURAL GAS9%
DISTRICT HEATING 41%
SOLID FUELS 47%
OTHER1%

Heating in Poland
11
The most buildings were built before 1988
•• Until 1988, energy efficiency was of marginal importance in construction. This translates into high energy consumption for heating purposes
today.
0
1500
1000
500
Before 1918
Thou
sand
s of
bui
ldin
gs
1918–1944 1945–1970 1971–1978 1979–1988 1989–2002 2003–2007 2008–2011 underconstruction
unspecified
Chart 3. Age structure of the housing stock as of 2012 Source: based on National Census of Population and Housing 2011, CSO, Warsaw.

Heating in Poland
12
Energy standard of buildings in Poland is low
•• Almost two-thirds of buildings in Poland are characterised by low energy efficiency.
•• Poorly performing thermomodernisation has hindered the improvement of energy efficiency for many years.
Chart 4. The standard of thermal insulation of buildings in Poland in 2017Source: based on data from the Institute of Environmental Economics.
VERY HIGH1%
HIGH11%
MEDIUM25%
VERY LOW41%
LOW22%

Heating in Poland
13
ELECTRICAL APPLIANCES10%
INDOOR HEATING66%
WATER HEATING15%
COOKING MEALS9%
Most of the energy in households is used for heating
•• The relatively high share of energy for space heating is due to the low energy efficiency of buildings and Poland’s climate zone.
•• The constant increase in average daily temperatures observed in recent years will reduce heating energy consumption.
Chart 5. Energy consumption structure in households in 2017 Source: based on CSO data.

Heating in Poland
14
Fuels and emissions

Heating in Poland
15
OILS0.5%
OTHER6.0%
COAL 47.7%
OTHER1.1%
COAL72.5%
GAS31.1%
GAS8.6%
OILS4.8%
BIOMASS AND OTHER RES8.1%
BIOMASSAND OTHER
RES19.6%
INDIVIDUAL HEATING2017
DISTRICT HEATING2018
The heating sector is dominated by coal
•• The consumption of coal for heating purposes is 24 million tonnes, of which as much as 12 million tonnes is burned in households heated
individually and by other small consumers of coal.
Chart 6. Fuel consumption for heating purposes Source: based on data from KAPE, CSO, and ERO.

Heating in Poland
16
HOUSEHOLDS DISTRICT HEATING
0
5
10
15
20
25
30
35
40
45
50
Mill
ion
tonn
es o
f CO
2
2007 2008 2009 2010 2011 2012 2013 2014 2015 2016 2017
Chart 7. CO2 emissions from heating, including district heating companies and householdsSource: based on data from EEA and ERO.
CO2 emissions are still high
•• CO2 emissions from individual household heating remain consistently high.
•• The specific CO2 emission per GJ of district heating has decreased by about 10% since 2007, due to a lack of investment leading to
the substitution of generation sources.

Heating in Poland
17
The main source of smog is the combustion of solid fuels in individually heated households
•• Other significant sources of air pollution are industry and transport.
PM2.5
16%
2%
10%
4%
21%
47%
PM10
16%
12%
8%
5%
13%
46%
BENZO(A)PYRENE AND OTHER POPS*
12%2%
1%0.1%
0.9%
84%
COMBUSTION PROCESSES IN INDUSTRY
COMBUSTION PROCESSES IN ENERGY PRODUCTION/ENERGY TRANSITION
COMBUSTION PROCESSES IN INDIVIDUAL HEATING
AGRICULTURE OTHER
ROAD TRANSPORT
Chart 8. Sources of air pollution in 2017 Source: based on KOBIZE data. *POP – persistent organic pollutant

Heating in Poland
18
0%
10%
20%
30%
40%
UE POLAND
NATURALGAS
ELECTRICITY SOLIDBIOMASS
LIGHT HEATING OIL
DISTRICTHEATING
HARD COAL
LPG HEATPUMPS
SOLARTHERMAL
OTHER
Chart 9. Comparison of the structure of energy consumption in households in the EU and Poland in 2017Source: based on Eurostat and CSO data.
Households in Poland consume the most coal in the European Union
•• Polish households consume 87% of the coal burned in EU households, which is directly connected to air pollution and smog formation.
•• The high share of district heating in the domestic heating of households should be assessed positively.
•• Poland stands out in comparison with the EU in terms of the relatively low share of natural gas and electricity in final consumption in
households.
Heating in Poland
19
Energy poverty

Heating in Poland
20
Figure 1. Definition of energy povertySource: Institute for Structural Research (IBS).
ENERGY POVERTY
LOW INCOME
HIGH ENERGYCOST
LOW ENERGYEFFICIENCY
UBÓSTWO ENERGETYCZNE NISKIE DOCHODY GOSPODARSTW DOMOWYCH
WYSOKI KOSZT ENERGII NISKA EFEKTYWNOŚĆ ENERGETYCZNA
Defining energy poverty
•• 4.6 million people, i.e., 12% of the Polish population, suffer from energy poverty.
A household is considered to be energy poor when it has difficulties in meeting its energy needs due to low income or the characteristics of
the housing. Energy needs are the total consumption of heat, as well as electricity, necessary for a decent standard of living, i.e., heating the
apartment, heating water, lighting, preparing meals, and using basic household equipment. If the cost of meeting an energy need is so high that
household members are faced with the dilemma of whether to reduce this need or save on other goods such as food, medicine, or education,
then we are talking about energy poverty.

Heating in Poland
21
Thou
sand
s of
hou
seho
lds
0To 1960 1961-1995 After 1995
100
200
300
400
500
SINGLE-FAMILY BUILDINGS MULTI-FAMILY BUILDINGS
Chart 10. Number of energy-poor households by type and age of building in 2018Source: IBS.
Most of the energy poor live in single-family buildings constructed between 1961 and 1995
•• According to the current regulations, only the energy poor living in multi-family buildings can receive energy allowances.
•• All energy poor should be supported.

Heating in Poland
22
Most of the energy poor live in single-family houses in the countryside
•• In cities, the problem concerns multi-family buildings.
MULTI-FAMILY BUILDINGCOUNTRYSIDE
6%
SINGLE-FAMILY BUILDINGCOUNTRYSIDE
50%
MULTI-FAMILY BUILDINGCITY28%
SINGLE-FAMILY BUILDING CITY16%
Chart 11. Energy poverty by building type and location in 2016Source: based on IBS data.

Heating in Poland
23
District heating current state and challenges

Heating in Poland
24
The main heat consumers of district heating are households
OF WHICH THROUGH COGENERATION
238 617.4 TJ
HEAT PRODUCTION
376 010.2 TJ
HEAT SUPPLIED TO CUSTOMERS CONNECTED TO THE NETWORK
233 674.2 TJHEAT GIVEN UP TO
THE NETWORK
267 222.2 TJ
HEAT CONSUMPTION FOR OWN USE AND INDUSTRY
144 419.2 TJ
LOSSES 33 548.0 TJ
RECOVERED HEAT
35 631.2 TJ
Figure 2. Production and distribution of heat in 2018Source: based on ERO data.
Heating in Poland
25
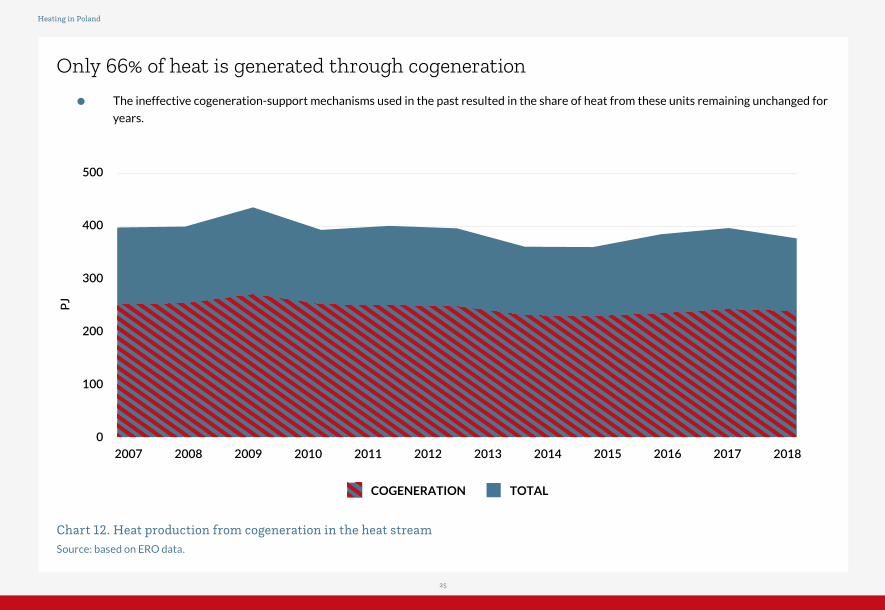
Only 66% of heat is generated through cogeneration
•• The ineffective cogeneration-support mechanisms used in the past resulted in the share of heat from these units remaining unchanged for
years.
PJ
0
500
400
300
200
100
2007 2008 2009 2010 2011 2012 2015 2016 2017 20182013 2014
COGENERATION TOTAL
Chart 12. Heat production from cogeneration in the heat stream Source: based on ERO data.

Heating in Poland
26
No action has been taken to change the heating fuel mix
•• The use of gas has increased by 3.5 p.p. and of RES by 3 p.p. over the last decade.
0%
100%
90%
80%
70%
60%
50%
40%
30%
20%
10%
OIL NATURAL GAS BIOMASS AND OTHER RES WASTE OTHERCOAL
2007 2008 2009 2010 2011 2012 2015 2016 2017 20182013 2014
Chart 13. Heating fuels by type Source: based on ERO data.

Heating in Poland
27
EFFICIENT SYSTEMS
INEFFICIENT SYSTEMS
As much as 80% of the heating systems in Poland are inefficient
•• The high share of inefficient systems and the lack of pressure to change the situation pose a threat to the functioning of district heating in
Poland.
•• The legal limitation of state aid for inefficient district heating systems hinders their modernisation and transition to low-emission technologies.
An efficient district heating and cooling system are ones using at least 50% renewable energy, 50% waste heat, 75% cogenerated heat or 50%
of a combination of such energy and heat.
Figure 3. Efficient and inefficient district heating systems in Poland in 2015.Source: IGCP.

Heating in Poland
28
Smaller cities, lower efficiency
•• Among the challenges is the high share of inefficient systems in the production of heat for small and medium-sized towns.
99.4%
70.9%
46.0%
27.5%13.8%
29.1%
54.0%
72.5%86.2%
0%
10%
20%
30%
40%
50%
60%
70%
80%
90%
100%
above 500 thousand 200-499 thousand 100-199 thousand 20-99 thousand below 20 thousand
CITY POPULATION
0.6%
INEFFICIENT SYSTEMEFFICIENT SYSTEM
Chart 14. Share of heat supplied from efficient systems in cities of different sizes in 2016Source: Prepared based on data from the Energy Market Agency (ARE) (including generation capacity from 1 MW), Forum Energii.

Heating in Poland
29
Mill
ion
tonn
es
0
50
40
30
20
10
CO2
0
50
100
150
200
2007 2008 2009 2010 2011 2012 2013 2014 2015 2016 2017 2018 2007 2008 2009 2010 2011 2012 2013 2014 2015 2016 2017 2018
SO2 NOX DUST
Thou
sand
tonn
es
The heating sector has adapted to the current challenges, but the most serious are yet to come
•• Heating companies have directed their main investment efforts to comply with stricter gas- (SOx, NO
x) and dust-emission standards.
•• Few investments in new gas and biomass generation sources has led to a relatively small decrease in CO2 emissions in the past decade.
•• Due to the large share of coal in the production of heat, the Polish heating sector will have to bear increasingly higher costs of purchasing
CO2 emission allowances.
Chart 15. Gas and dust emissions from district heatingSource: based on ERO data.

Heating in Poland
30
Heat sales are falling despite an increase in the number of customers
•• The strategic challenge for the heating sector is how to serve a market in which energy efficiency is constantly increasing.
•• Despite the increase of the district heating network and the heated area of buildings, the volume of heat sold has been decreasing.
2007 2008 2009 2010 2011 2012 2013 2014 2015 2016 2017 2018
SALES OF HEAT FROM THE NETWORK AREA OF BUILDINGS LENGTH OF THE NETWORK
0
0.2
0.4
0.6
0.8
1
1.2
1.4
Chart 16. Heat sales compared to the heated area of buildings and network length (index values compared to 2007)Source: based on data from ERO and the Central Statistical Office.

Heating in Poland
31
District heatingfinancial aspects

Heating in Poland
32
Average prices of heat from heat-only units
•• Heat prices reflect to a small extent the recent rapid changes in fuel and CO2 emission allowances prices.
•• The lack of biomass co-firing in the power industry has increased the price attractiveness of biomass in district heating. It can be assumed
that if co-firing is resumed, the price of biomass heat will start to rise.
PLN
/GJ
0
200
150
50
100
COAL GAS OIL RES
2008 2009 2010 2011 2012 2013 2014 2015 2016 2017 2018
Chart 17. Average prices of heat from heat-only units (without transmission) by fuel Source: based on ERO data.
Heating in Poland
33
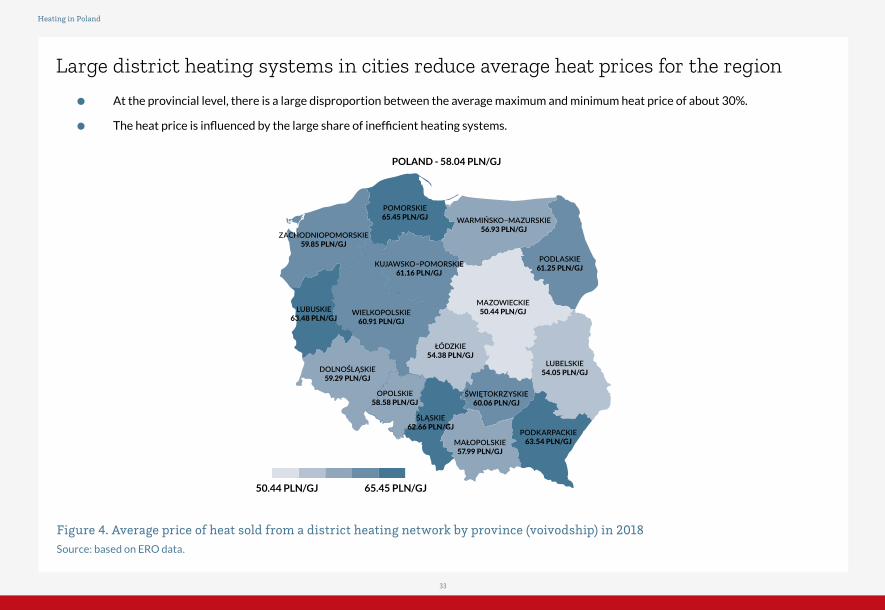
Large district heating systems in cities reduce average heat prices for the region
•• At the provincial level, there is a large disproportion between the average maximum and minimum heat price of about 30%.
•• The heat price is influenced by the large share of inefficient heating systems.
50.44 PLN/GJ 65.45 PLN/GJ
POMORSKIE65.45 PLN/GJ WARMIŃSKO−MAZURSKIE
56.93 PLN/GJ
ŁÓDZKIE54.38 PLN/GJ
LUBELSKIE54.05 PLN/GJ
PODKARPACKIE63.54 PLN/GJ
ŚWIĘTOKRZYSKIE60.06 PLN/GJ
MAŁOPOLSKIE57.99 PLN/GJ
PODLASKIE61.25 PLN/GJ
MAZOWIECKIE50.44 PLN/GJ
KUJAWSKO−POMORSKIE61.16 PLN/GJ
WIELKOPOLSKIE60.91 PLN/GJ
DOLNOŚLĄSKIE59.29 PLN/GJ
OPOLSKIE58.58 PLN/GJ
ŚLĄSKIE62.66 PLN/GJ
LUBUSKIE63.48 PLN/GJ
ZACHODNIOPOMORSKIE59.85 PLN/GJ
POLAND - 58.04 PLN/GJ
Figure 4. Average price of heat sold from a district heating network by province (voivodship) in 2018 Source: based on ERO data.

Heating in Poland
34
The price of heat from coal is becoming less and less competitive
•• The trend of increasing the price of heat from coal will intensify because of the rising cost of CO2 emission allowances and increasingly
stringent environmental standards.
PLN
/GJ
HIGH-METHANE NATURAL GAS
BIOMASS HARD COAL OTHER RES MUNICIPAL WASTE
ESTIMATED COST OF CO2
HEATING COSTAVERAGE TRANSMISSION CHARGE
AVERAGE PRICE OF HEAT
0
10
20
30
40
50
60
70
80
Chart 18. Average price of district heat from different fuels in 2018Source: based on ERO data.

Heating in Poland
35
Heat producers’ costs exceed their income
•• The permanent lack of profitability from production prevents investment in clean technologies.
•• Revenues from distribution allow the network to develop successively.
PROFIT
TRANSMISSION AND DISTRIBUTION
TOTAL REVENUES TOTAL COSTS
-0.5 -0.8 -0.6 -0.8 -0.6-1.0
0.0
-0.4
1.10.5
-0.4
-2
0
2
4
6
8
10
12
0.6 0.7 1.0 0.7 1.0 1.1 0.9 0.9 1.0 1.1 1.0
-2
0
2
4
6
8
10
12
PLN
Bill
ion
PLN
Bill
ion
PRODUCTION
Chart 19. Total revenues, costs, and profit of district heating companies in 2018 by type of activitySource: based on ERO data.

Heating in Poland
36
District heating in the European Union

Heating in Poland
37
Poland has the largest number of district heating customers among all EU countries
0
2
4
6
8
10
12
14
16
18
Pola
nd
Ger
man
y
Fran
ce
Swed
en
Czec
hia
Italy
Den
mar
k
Rom
ania
Finl
and
Aus
tria
Serb
ia
Slov
akia
Lith
uani
a
Hun
gary
Bulg
aria
Uni
ted
King
dom
The
Net
herla
nds
Latv
ia
Croatia
Esto
nia
Switz
erla
nd
Icel
and
Slov
enia
Irela
nd
Mill
ion
peo
ple
Chart 20. Population using district heating in Europe in selected European countries in 2015Source: based on data from Euroheat & Power, European Commission.

Heating in Poland
38
Poland is second in Europe when it comes to the amount of consumed heat produced in district heating systems
0
10
20
30
40
50
60
70
80G
erm
any
Pola
nd
Swed
en
Finl
and
Den
mar
k
Fran
ce
Czec
hia
Aus
tria
Uni
ted
King
dom
Slov
akia
Italy
Icel
and
Hun
gary
The
Net
herla
nds
Lith
uani
a
Esto
nia
Serb
ia
Latv
ia
Switz
erla
nd
Bulg
aria
Croatia
Slov
enia
Irela
nd
TW
h
Chart 21. District heat consumption in selected European countries in 2015 Source: based on data from Euroheat & Power, European Commission.
Heating in Poland
39
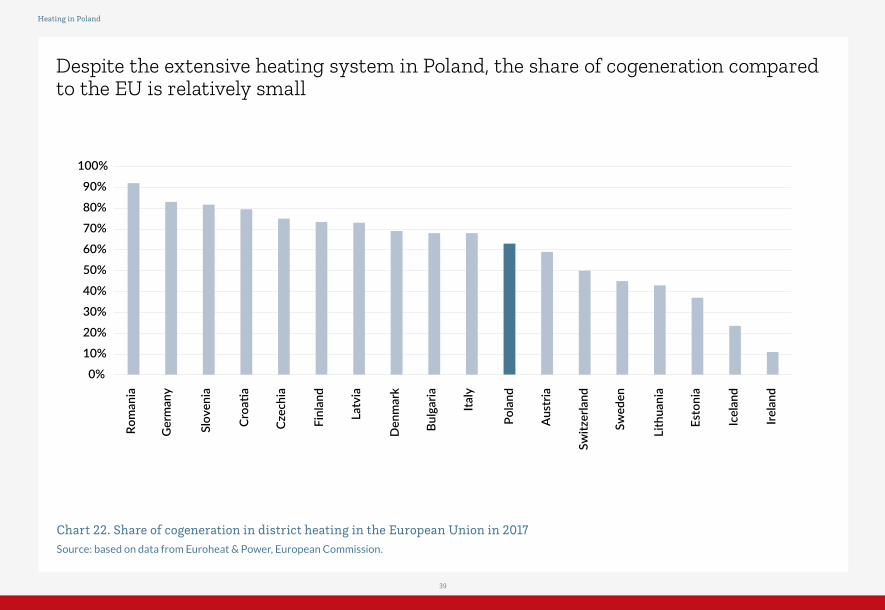
Despite the extensive heating system in Poland, the share of cogeneration compared to the EU is relatively small
0%
10%
20%
30%
40%
50%
60%
70%
80%
90%
100%G
erm
any
Pola
nd
Swed
en
Rom
ania
Finl
and
Den
mar
k
Czec
hia
Aus
tria
Slov
enia
Italy
Icel
and
Lith
uani
a
Esto
nia
Latv
ia
Switz
erla
nd
Bulg
aria
Croatia
Irela
nd
Chart 22. Share of cogeneration in district heating in the European Union in 2017 Source: based on data from Euroheat & Power, European Commission.

Heating in Poland
40
Chart 23. Structure of fuels used to produce district heating in the European Union Source: based on Eurostat and European Commission data.
OIL GAS NUCLEAR RES NON-RENEWABLE WASTE OTHERSOLID FUELS
0%
10%
20%
30%
40%
50%
60%
70%
80%
90%
100%
1990 1991 1992 1993 1994 1995 1996 1997 1998 1999 2000 2001 2002 2003 2004 2005 2006 2007 2008 2009 2010 2011 2012 2013 2014 2015 2016 2017
For more than 30 years, the fuel mix in the EU has been changing rapidly
•• In recent years, RES has been developing quite dynamically.

Heating in Poland
41
CZECHIA
0%
10%
20%
30%
40%
50%
60%
70%
80%
90%
100%DENMARK POLAND
20
16
19
90
19
92
19
94
19
96
19
98
20
00
20
02
20
04
20
06
20
08
20
10
20
12
20
14
0%
10%
20%
30%
40%
50%
60%
70%
80%
90%
100%
20
16
19
90
19
92
19
94
19
96
19
98
20
00
20
02
20
04
20
06
20
08
20
10
20
12
20
14
0%
10%
20%
30%
40%
50%
60%
70%
80%
90%
100%
20
16
19
90
19
92
19
94
19
96
19
98
20
00
20
02
20
04
20
06
20
08
20
10
20
12
20
14
OIL GAS NUCLEAR RES NON-RENEWABLE WASTE OTHERSOLID FUELS
Chart 24. Structure of fuels used to produce district heating in Poland, Chechia and Denmark Source: based on Eurostat and European Commission data.
District heating fuel mix of selected EU countries in 1990-2017

Heating in Poland
42
District heating fuel mix of selected EU countries in 1990-2017
LITHUANIAGERMANY SLOVAKIA
0%
10%
20%
30%
40%
50%
60%
70%
80%
90%
100%
20
16
19
90
19
92
19
94
19
96
19
98
20
00
20
02
20
04
20
06
20
08
20
10
20
12
20
14
0%
10%
20%
30%
40%
50%
60%
70%
80%
90%
100%
20
16
19
90
19
92
19
94
19
96
19
98
20
00
20
02
20
04
20
06
20
08
20
10
20
12
20
14
0%
10%
20%
30%
40%
50%
60%
70%
80%
90%
100%
20
16
19
90
19
92
19
94
19
96
19
98
20
00
20
02
20
04
20
06
20
08
20
10
20
12
20
14
OIL GAS NUCLEAR RES NON-RENEWABLE WASTE OTHERSOLID FUELS
Chart 25. Structure of fuels used to produce district heating in Germany, Lithuania, and Slovakia Source: based on Eurostat and European Commission data.


Heating in Poland Edition 2019