Heat Transfer Related to Gas Hydrate...
27
24 Heat Transfer Related to Gas Hydrate Formation/Dissociation Bei Liu, Weixin Pang, Baozi Peng, Changyu Sun and Guangjin Chen State Key Laboratory of Heavy Oil Processing, China University of Petroleum, Beijing 102249, P. R. China 1. Introduction Gas hydrates are ice-like crystalline compounds comprised of small guest molecules, such as methane or other light hydrocarbons, which are trapped in cages of a hydrogen-bonded water framework. It has drawn attention in the gas and oil industry since 1930s because it was found that the formation of gas hydrates may block oil/gas pipelines (Sloan and Koh, 2007). However, with the gradual discovery of huge reserve of natural gas hydrates in the earth as well as the understanding of the peculiar properties of gas hydrates, more and more studies have focused on how to benefit from gas hydrates in recent decades. The most important aspect of gas hydrates research is attributed to the exploration and exploitation of natural gas hydrates. Additionally, people also try a lot in the development of novel technologies based on hydrates, such as separation of gas mixture via forming hydrates, storage of natural gas or hydrogen in the form of solid hydrates, and sequestration of CO 2 , etc. As the formation of gas hydrates is an exothermic process, heat transfer always accompanies hydrate formation or dissociation. The understanding of heat transfer mechanism is critical to the modeling of formation/dissociation kinetic process of gas hydrates, which favors the best exploitation of natural gas hydrates and the best design of reactor for hydrate production or decomposer for hydrate dissociation with respect to different kinds of hydrate application objects. In recent years, a variety of experimental and theoretical works focused on heat transfer involved in formation/dissociation of gas hydrates have been reported. They are summarized in this chapter accompanying presentation of our new work relevant to this topic. This chapter is organized as follows. In section 2, we present progresses in experimental measurement of the thermal conductivities of different kinds of gas hydrates, including pure gas hydrates and hydrate-bearing sediments. The achievements on mechanism and modeling of heat transfer occurring in the growth of hydrate film at the guest/water interface, as well as its influence upon the hydrate film growth rate are summarized in section 3. Our new experimental study on heat transfer in stirring or flowing hydrate system is given in section 4. Section 5 presents our recent work on the experimental and modeling studies on heat transfer in quiescent reactors for producing or decomposing big blocks of hydrates, and the formulation of the influence of heat transfer upon the hydrate formation/dissociation rate. In section 6, the mechanism of heat transfer in hydrate www.intechopen.com
Transcript of Heat Transfer Related to Gas Hydrate...

24
Heat Transfer Related to Gas Hydrate Formation/Dissociation
Bei Liu, Weixin Pang, Baozi Peng, Changyu Sun and Guangjin Chen State Key Laboratory of Heavy Oil Processing,
China University of Petroleum, Beijing 102249, P. R. China
1. Introduction
Gas hydrates are ice-like crystalline compounds comprised of small guest molecules, such as
methane or other light hydrocarbons, which are trapped in cages of a hydrogen-bonded
water framework. It has drawn attention in the gas and oil industry since 1930s because it
was found that the formation of gas hydrates may block oil/gas pipelines (Sloan and Koh,
2007). However, with the gradual discovery of huge reserve of natural gas hydrates in the
earth as well as the understanding of the peculiar properties of gas hydrates, more and more
studies have focused on how to benefit from gas hydrates in recent decades. The most
important aspect of gas hydrates research is attributed to the exploration and exploitation of
natural gas hydrates. Additionally, people also try a lot in the development of novel
technologies based on hydrates, such as separation of gas mixture via forming hydrates,
storage of natural gas or hydrogen in the form of solid hydrates, and sequestration of CO2,
etc. As the formation of gas hydrates is an exothermic process, heat transfer always
accompanies hydrate formation or dissociation. The understanding of heat transfer
mechanism is critical to the modeling of formation/dissociation kinetic process of gas
hydrates, which favors the best exploitation of natural gas hydrates and the best design of
reactor for hydrate production or decomposer for hydrate dissociation with respect to
different kinds of hydrate application objects.
In recent years, a variety of experimental and theoretical works focused on heat transfer
involved in formation/dissociation of gas hydrates have been reported. They are summarized
in this chapter accompanying presentation of our new work relevant to this topic. This
chapter is organized as follows. In section 2, we present progresses in experimental
measurement of the thermal conductivities of different kinds of gas hydrates, including
pure gas hydrates and hydrate-bearing sediments. The achievements on mechanism and
modeling of heat transfer occurring in the growth of hydrate film at the guest/water
interface, as well as its influence upon the hydrate film growth rate are summarized in
section 3. Our new experimental study on heat transfer in stirring or flowing hydrate system
is given in section 4. Section 5 presents our recent work on the experimental and modeling
studies on heat transfer in quiescent reactors for producing or decomposing big blocks of
hydrates, and the formulation of the influence of heat transfer upon the hydrate
formation/dissociation rate. In section 6, the mechanism of heat transfer in hydrate
www.intechopen.com

Developments in Heat Transfer
478
bearing-sediment are analyzed and discussed. Finally, some concluding remarks are given
in section 7.
2. Thermal conductivity of gas hydrate
Thermal conductivity is a kind of basic data for studying the heat transfer of hydrates involved systems. In recent decades, a number of researchers have made their efforts to measure the thermal conductivities of different types of gas hydrates at different conditions. Regarding to measurement technique, the most widely adopted ones are standard needle
probe technique and transient plane source (TPS) technique (Gustafsson et al., 1979, 1986).
For example, thermal conductivity of methane hydrate has been determined by deMartin
(2001), Krivchikov et al. (2005), and Waite et al. (2007) using the needle probe technique.
With same technique, thermal conductivities of several other gas hydrates, such as
tetrohydrofuran (THF) hydrate (Cortes et al., 2009), xenon hydrate (Krivchikov et al., 2006),
HCFC-141b hydrate (Huang et al., 2004), and CFC-11 hydrate (Huang et al., 2004) have been
measured. Transient plane source (TPS) technique in double- and single-sided configurations
has been used more recently to measure thermal conductivity of gas hydrates (Huang and
Fan, 2004; Li et al., 2010; Rosenbaum et al., 2007). This technique is based on the transient
method and the needle probe, but it has a very small probe (Gustafsson et al., 1979, 1986). It
allows measurements without any disturbance from the interfaces between the sensor and
the bulk samples. In addition, it is possible to measure thermal conductivity, thermal
diffusivity, and heat capacity per unit volume simultaneously (Gustafsson et al., 1979). It is
hard to draw a definite conclusion that which technique is better for pure gas hydrate
samples synthesized in laboratory; however, for in-situ determination of the thermal
properties of hydrate-containing sediments, the single-sided TPS technique may be more
suitable as the needle probe and double-sided TPS techniques need the probe to be
surrounded by the hydrates (English and Tse, 2010).
There are several factors, such as the porosity of the samples, temperature, pressure, and
measurement time, that influence thermal conductivity of gas hydrates. As pointed out by
English and Tse (2010), for relatively pure hydrates, reducing the porosity of the samples
by compacting them is critical for obtaining the reliable thermal conductivity in the
intermediate temperature range. For hydrate-bearing sediments, Tzirita (1992) concluded
that porosity is also a critical factor in controlling the thermal conductivity. More recently,
Cortes et al. (2009) carried out a systematic measurement of the thermal conductivity of
THF-hydrate saturated sand and clay samples. They found the influence is a complex
interplay among particle size, effective stress, porosity, and fluid-versus-hydrate filled
pore spaces, not only porosity. With respect to temperature effect, many studies found
that hydrates exhibit a glass-like temperature dependence of thermal conductivity
(Andersson and Ross, 1983; Handa and Cook, 1987; Krivchikov et al., 2005, 2006; Ross et
al., 1981; Ross and Andersson, 1982; Tse and White, 1988). Among these studies, the
works of Krivchikov et al. (2005, 2006) are interesting as they found that both methane
and xenon hydrates show crystal-like temperature dependence below 90 K, while
exhibiting glass-like behavior above 90 K. The effect of pressure has also been
investigated by many groups (Andersson and Ross, 1983; Rosenbaum et al., 2007; Waite et
al., 2007). Only weak pressure dependency was observed by them. Finally, the
relationship between thermal conductivity and measurement time for methane hydrate
www.intechopen.com

Heat Transfer Related to Gas Hydrate Formation/Dissociation
479
has been studied by Li et al. (2010) very recently. They found that in 24h, thermal
conductivity increases 5.45% at 268.15 K; however, at 263.15 K, the increment is 196.29%.
From their results we may say that measurement time needs to be considered for thermal
conductivity studies at relatively low temperatures.
To give readers a clear picture of measured thermal conductivities of different kinds of gas
hydrates, the results of pure gas hydrates and hydrate-bearing sediments are listed in
Table 1.
compound T / K P / MPa λ / W m-1 K-1 Ref
pure gas hydrates
methane 253 - 290 31.5 ~ 0.62 Waite et al., 2007
methane (compacted samples)
263.05 – 277.97 6.6 ~ 0.57 Huang and Fan, 2004
methane (compacted samples)
261.5 – 277.4 3.8 – 14.2 ~ 0.68 Rosenbaum et al., 2007
tetrahydrofuran 15 -100 0.04 - 0.12 Tse and White, 1988
tetrahydrofuran·17 H2O 261 0.5 Waite et al., 2005
tetrahydrofuran·17 H2O 261 0.05 - 1 0.58 Cortes et al., 2009
xenon 245 ~ 0.05 0.36 Handa and Cook, 1987
ethylene oxide 263 0.49 Cook and Laubitz, 1983
cyclobutanone 260 100 ~ 0.47 Andersson and Ross,
1983
1,3 – dioxolane 260 100 ~ 0.51 Andersson and Ross,
1983
propane 275 1 ~ 0.4 Stoll and Bryan, 1979
sodium sulphide·9 H2O 295 0.001 0.12 Lunden et al., 1986
HCFC-141b ~ 250 0.1 ~ 0.5 Huang et al., 2004
CFC-11 ~ 250 0.1 ~ 0.5 Huang et al., 2004
hydrate-bearing sediments
natural methane hydrate-layer sand
263 -283 0.1 3.8 – 5.8 Yamamoto et al., 2008
sand with 100% THF·17 H2O hydrate
261 0.05 - 1 4.1 – 4.5 Cortes et al., 2009
clay with 100% THF·17 H2O hydrate
261 0.05 - 1 2.8 – 3.0 Cortes et al., 2009
Table 1. Thermal conductivities, λ, of pure gas hydrates and hydrate-bearing sediments
www.intechopen.com

Developments in Heat Transfer
480
3. Heat transfer in growth of hydrate film
Generally, because most of hydrate formers (guests) are water insoluble, the initial formation of hydrate occurs at the guest/water interface, taking the form of thin porous crystalline film. The further growth of hydrate is controlled by mass transfer of water or hydrate former through the film. Many experimental and/or theoretical studies on the growth of hydrate film have been carried out by several groups (Freer et al., 2001; Ma et al., 2002; Mochizuki and Mori, 2006; Mori, 2001; Ohmura et al., 2000, 2005; Peng et al., 2007, 2008, 2009; Saito et al., 2010, 2011; Sun et al., 2007; Taylor et al., 2007; Uchida et al., 1999, 2002), including the morphology of hydrate film, the growth rate of hydrate film, the thickness of hydrate film, the mechanism of hydrate film growth, and so on. However, so far it is still a controversial topic on the growth mechanism of hydrate film. Recently, more attention has been paid to the mechanism of heat transfer on hydrate film growth at the guest/water interface than intrinsic kinetic and mass transfer mechanisms. In this part, different hydrate film growth models, especially heat transfer models that have been developed by various research groups are summarized. Experimental and molecular dynamic simulation studies on the initial formation of hydrate at the guest/water interface suggest that the interface where there is a significant concentration gradient is the place to initiate and sustain hydrate formation (Moon, et al. 2003; Vysniauskas and Bishnoi, 1983). Englezos et al. (1987a, 1987b) studied the kinetics of formation of methane, ethane, and their mixture hydrates in a semi-batch stirred tank reactor. They presented an intrinsic kinetic model for the hydrate particle growth and the rate of growth per particle was given by:
( )P eqP
dnK A f f
dt∗⎛ ⎞ = −⎜ ⎟⎝ ⎠ (1)
with
1 1 1
r dK KK∗ = + (2)
where n is the moles of gas consumed, t is the hydrate reaction time, K∗ is the combined
rate parameter, PA is the surface area of particles, f is the gas fugacity, eqf is the
equilibrium fugacity, rK and dK are the reaction rate constant and mass transfer coefficient
around the particle, respectively. Similarly, based on the assumption that the intrinsic
kinetics is the control step of hydrate formation and growth, Ma et al. (2002) developed a
model to correlate the lateral growth rate of hydrate film. The model was formulated as the
following form:
( )/( )1
B g RTfr A e
−Δ⎡ ⎤= × −⎢ ⎥⎣ ⎦ (3)
where fr is the lateral growth of hydrate film. Parameters A and B are system composition
dependent and were determined by fitting experimental data. The Gibbs free energy
difference ( gΔ ) was selected as the driving force to describe the hydrate growth process.
The experimental results indicated that this model could correlate the lateral film growth
rate perfectly (Ma et al., 2002; Sun et al., 2007).
www.intechopen.com

Heat Transfer Related to Gas Hydrate Formation/Dissociation
481
Except for the models described above, some researchers suggested that the growth rate of hydrate film is controlled by heat diffusion and some models were developed correspondingly. For example, Uchida et al. (1999) presented a model analysis of the two-dimensional growth of a carbon dioxide hydrate film (Figure 1).
H2O
CO2 liquidh
rc
rv
T
Teq
Texp T
B
Fig. 1. Hydrate film model of Uchida et al (1999)
In this model, they assumed that one half of the film is in water phase, and the other half is in guest phase. The hydrate film has a semicircular front and is uniform in thickness. In addition, this model assumes that hydrate crystals successively form only at the front of the hydrate film and the front is maintained at the three-phase (water/guest-fluid/hydrate) equilibrium temperature. The heat released by the hydrate crystal formation is diffused away from the film front and into the water and guest-fluid phase. Based on these assumptions, they formulated the heat balance at the edge of the film as
/f h h w cv h T rρ λΔ = Δ (4)
where fv is the rate of linear growth of the film, hρ is the mass density of the film, hhΔ is the heat of hydrate formation (per unit mass of hydrate), wλ is the thermal conductivity of water, TΔ is the difference between the temperature at the film edge, eqT , and the undisturbed temperature in the fluid phases, BT , and cr is the radius of curvature of the edge. Uchida et al. (1999) correlated their experimental data on fv versus TΔ by means of a linear regression analysis as follows:
(1.73 0.16)fv T= ± Δ (5)
In Uchida et al.’s model (Uchida et al., 1999), the conductive heat transfer from the film front was deduced from the temperature gradient, which was deemed as with little physical reasoning (Mochizuki and Mori, 2006; Mori, 2001). Mori (2001) presented an alternative model of hydrate film growth based on the idea that the front of hydrate film, which grew on the interface between stagnant water and guest fluid, could be viewed to be held in stratified flow of the two fluids with the velocity which was opposite in sign but equal in magnitude to the velocity of the hydrate film front. In his work, the heat removed from the film front to the liquid phases was treated as a steady convective heat transfer and other assumptions were same as those of Uchida et al. (1999). The heat balance over the hemicircular front of the film was formulated as follows:
www.intechopen.com
Developments in Heat Transfer
482
( )1
4w gf g hv h Tδρ πδ α αΔ = + Δ (6)
Mori (2001) assumed that the heat transfer coefficients, wα and gα , could be given by the simplest type of convective heat transfer correlation in a dimensionless form and deduced a δ - fv relation correspondingly:
3/2f C Tv δ = Δ (7)
where
3/2
1/3 1/31/3 1/3
1Pr Pr
4g
gww
h h w g
A
hC
λλπρ ν ν
⎡ ⎤⎛ ⎞⎢ ⎥⎜ ⎟+⎜ ⎟Δ⎢ ⎥⎝ ⎠⎣ ⎦= (8)
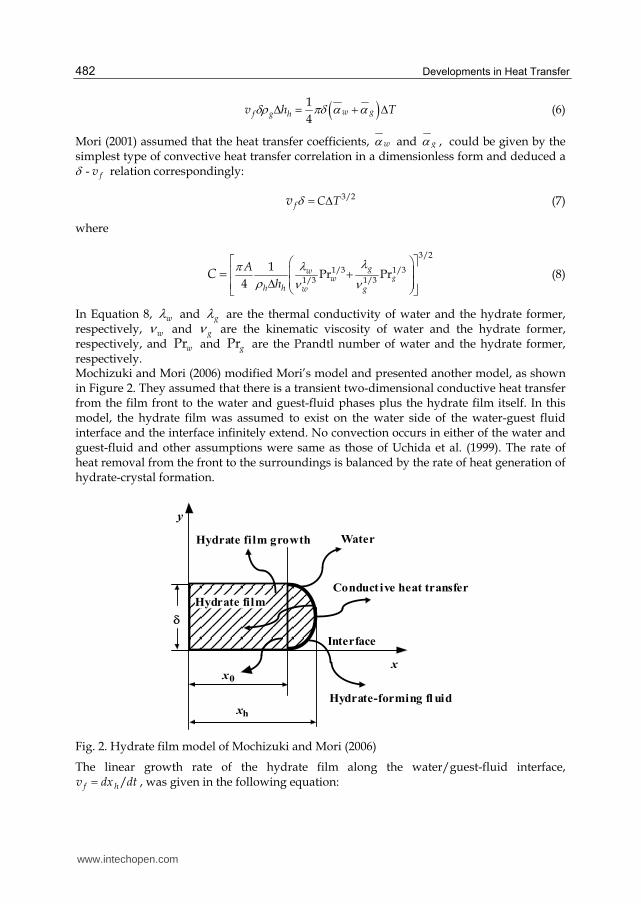
In Equation 8, wλ and gλ are the thermal conductivity of water and the hydrate former, respectively, wν and gν are the kinematic viscosity of water and the hydrate former, respectively, and Prw and Prg are the Prandtl number of water and the hydrate former, respectively. Mochizuki and Mori (2006) modified Mori’s model and presented another model, as shown in Figure 2. They assumed that there is a transient two-dimensional conductive heat transfer from the film front to the water and guest-fluid phases plus the hydrate film itself. In this model, the hydrate film was assumed to exist on the water side of the water-guest fluid interface and the interface infinitely extend. No convection occurs in either of the water and guest-fluid and other assumptions were same as those of Uchida et al. (1999). The rate of heat removal from the front to the surroundings is balanced by the rate of heat generation of hydrate-crystal formation.
Hydrate film growth Water
Conductive heat transfer
Interface
Hydrate-forming fl uid
δ
y
xx0
xh
Hydrate film
Fig. 2. Hydrate film model of Mochizuki and Mori (2006)
The linear growth rate of the hydrate film along the water/guest-fluid interface, /f hv dx dt= , was given in the following equation:
www.intechopen.com

Heat Transfer Related to Gas Hydrate Formation/Dissociation
483
/2
/2h h
h H f h w hr r r r
T Th v r d
r r
ππρ δ λ λ θ− = − = +
⎛ ⎞∂ ∂⎜ ⎟Δ = −⎜ ⎟∂ ∂⎝ ⎠∫ (9)
where /hr r
T r = −∂ ∂ and /hr r
T r = +∂ ∂ are the radial temperature gradients on the hydrate side
and the fluid side, respectively, at hr r= (i.e., the x position of the hydrate-film front). It
should be pointed out that this model is computationally complicated and hence cumbersome to use. In addition, the assumptions adopted in this model, that is, the film front is in the water phase or one half in water phase and the other half in guest-fluid phase are too arbitrary. Therefore, Peng et al. (2007) proposed another hydrate film model based on Mori’s model. In their model, they assumed part of thickness x of hydrate film is in guest phase and another part of thickness xδ − is in water phase, as shown in Figure 3. The value of x is guest composition dependent.
δ rc
Teq
TBTexp
vfwater
Gasx
δ - x
Fig. 3. Hydrate film model of Peng et al. (2007)
In Peng et al.’s model (Peng et al., 2007), the thickness of hydrate film was assumed to vary with driving force inversely, i.e.,
/k Tδ = Δ (10)
The lateral rate of hydrate film was then correlated by the following equation:
52
f
Cv T
k= Δ (11)
where the constant C in Mori’s model was reformulated by a generalized expression, as shown below:
3/2
2/3 1/3 1/3 2/3 1/3 1/3, ,
1 2 2arccos(1 ) arccos(1 )
6w w p w g g p g
h h
x xC c c
hλ ρ π λ ρρ δ δ
⎡ ⎤⎛ ⎞⎛ ⎞= − − + −⎢ ⎥⎜ ⎟⎜ ⎟Δ ⎝ ⎠⎝ ⎠⎣ ⎦ (12)
The modified convection heat transfer model presented by Peng et al.(2007), i.e., Equation 11, has been used to correlate the lateral growth rate of hydrate film of different crystal structures in wide temperature and pressure ranges (Peng et al., 2007, 2009). It can be concluded that validity of Equation 11 is independent of the composition of hydrate former and the structure type of hydrates (Peng et al., 2007).
www.intechopen.com

Developments in Heat Transfer
484
For investigating the growth mechanism of the hydrate film, Freer et al. (2001) also studied methane hydrate film growth on the water/methane interface experimentally and proposed a model of lateral hydrate film growth. They calculated the fv of methane hydrate film by assuming that one dimensional conductive heat transferred from the film front to water. As the calculated fv was much lower than the experimentally measured fv , they suggested that the hydrate film growth was controlled by both intrinsic kinetics and heat transfer. Their model was expressed as:
( )eq Bh h fv K T Tλ ρ = − (13)
1 1 1
K k h= + (14)
where hλ is the thermal conductivity of hydrate, K is the total resistance, h is the heat transfer coefficient, and k is the methane hydrate kinetic rate constant. Additionally, for investigating which step is the main contribution to the hydrate film growth, Peng et al. (2008) also presented a model based on the assumption that hydrate lateral film growth is controlled by both intrinsic kinetics and heat transfer, as shown in Figure 4.
H2O
Gas
δ rcvf
T
Ts
Texp
vf dt
TB
Fig. 4. Hydrate film model of Peng et al. (2008)
This model is similar to the model of Uchida et al. (1999). However, in this model Peng et al. kept the hydrate film at ST rather than at the three-phase (water/guest/hydrate) equilibrium temperature and they proposed the intrinsic rate of hydrate film growth should not be of a linear relation with the driving force. Therefore, the balance of the heat removed from the film front with that generated by the hydrate formation was formulated by the equation proposed by Freer et al. (2001),
1( )S Bf h hv h k T Tρ Δ = − (15)
and the intrinsic kinetic equation was adopted as following:
2( )eq S nfv k T T= − (16)
www.intechopen.com

Heat Transfer Related to Gas Hydrate Formation/Dissociation
485
From Equations 15 and 16, the following equation can be obtained:
1/
1 2
nf eq Bh h
f
vhv T T T
k k
ρ ⎛ ⎞Δ + = − = Δ⎜ ⎟⎜ ⎟⎝ ⎠ (17)
Based on their experiment data, Peng et al. calculated the temperature differences between the hydrate film front and the bulk water at different driving forces, which were taken as an important factor on judging the dominating contribution for hydrate film growth at the gas/water interface. They found that the effect of heat transfer on hydrate film growth is much smaller than that of intrinsic kinetics, and suggested that the intrinsic kinetic is the main control step for hydrate film growth of methane and carbon dioxide hydrate. It should be pointed out that for the models mentioned above, the parameters were obtained by correlating with different experimental data set. As the experimental data were obtained in different experiment apparatus and the stochastic induction time of hydrate nucleation may also affect the measurement of hydrate film growth rate for different experiment device, it is hard to draw a definite conclusion that which model is better. More efforts need to be made on hydrate film growth in the future.
4. Heat transfer in stirring or flowing hydrate system
Stirring is an important technique that can enhance heat and mass transfer, and thus accelerating the speed of hydrate formation/dissociation. The state of hydrates formed under stirring is usually in slurry, which is also the case when hydrates are formed in gas-oil-water multi-phase flowing systems containing hydrate anti-agglomerants (AA). As a result, the determination of heat transfer coefficient of hydrate slurry is crucial for investigating the heat transfer in hydrate forming/dissociating processes under stirring or flowing. Unfortunately, there are very few publications up to date, and thus only some results obtained by our group are introduced in this part.
4.1 Experimental apparatus
The experimental equipments adopted in our work are shown in Figure 5, which mainly contain the reactor with stirrer, constant temperature water bath, and temperature/pressure sensor.
Stirrer
Water Bath
P
RTD
RTD
Hydrate Slurry
Fig. 5. The schematic outline of the experimental apparatus
www.intechopen.com

Developments in Heat Transfer
486
4.2 Experimental principals and steps
In our work the measurements were performed via the following steps:
1. The equipments were washed three to four times using distilled water;
2. The reactor was wetted using the experimental liquid, then the experimental liquid was
added to the reactor until the stirrer reaches half of the height of liquid added;
3. The experimental temperature and pressure was set. We started stirring until the
hydrate slurry was formed completely, then we closed the stirrer;
4. When the hydrate slurry was formed completely and the temperature was constant, the
temperature of the water bath was quickly decreased by about 10 K to make a
difference in temperature between hydrate slurry and water bath;
5. The stirrer was open at a certain stirring speed and the temperatures of both water bath
and hydrate slurry were recorded at a certain interval. The stirring was stopped when
the change in temperature is very small in both the water bath and the reactor.
4.3 Experimental data analysis
(1) Calculation of the total heat transfer coefficient
If we assume the heat released by the slurry in the reactor is equal to that adsorbed by the
water bath, that is, we neglect the heat loss during the measurement, the amount of heat
transfer, Q, can be calculated with the following equation:
( )dTdt
Q cm= − (18)
where m is the mass of the hydrate slurry, dTdt
is the temperature increase/decrease per
unit time, and c is the specific heat of the experimental liquid. The amount of heat transfer
can also be calculated using the following equation:
t mQ K A T= Δ (19)
where K is the total heat transfer coefficient, A denotes the total area of heat transfer, and
mTΔ is the temperature difference between the water bath and the experimental liquid. The
total heat transfer coefficient can be calculated from Equations 18 and 19:
cm(- )/t m
dTK A T
dt= Δ (20)
(2) Calculation of the heat transfer coefficient 1α of hydrate slurry
The total heat transfer coefficient can be expressed by:
2 2
1 21
1 1 1mt
d dbK d dα αλ= + + (21)
where 1 2, , md d d represent the inner, outer, and the averaged radius of the reactor,
respectively, and λ is the heat conduction coefficient of the reactor. Since in each run,
2
2
1m
dbd αλ + was kept constant, and thus this term can be eliminated by measuring the total
www.intechopen.com

Heat Transfer Related to Gas Hydrate Formation/Dissociation
487
heat transfer coefficient of pure water and hydrate slurry, and calculating the difference in the reciprocal total heat transfer coefficients of pure water and the hydrate slurry. The heat transfer coefficient of hydrate slurry can be calculated by Equation 22 then.
2 2
1 1
1 1 1 1water slurrywater slurry
d d
K K d dα α− = − (22)
4.4 Experimental results
The heat transfer coefficients for both pure water and diesel oil/hydrate slurry systems with the volume fraction of hydrates of 5%, 10%, 15%, and 20% were measured at 270 K or so. The results are shown in Figure 6.
5% 10% 15% 20%
20
40
60
80
100
120
140
Hea
t tr
an
sfer
co
eff
icie
nt,
W/(
m2. K
)
Vol ume per cent age of hydr at e i n sl ur r y, %
Fig. 6. Variation of heat transfer coefficient of hydrate slurry of different hydrate volume percentage
Figure 6 shows that the heat transfer coefficient decreases with increasing the content of hydrates in slurry, which can be attributed to the fact that the heat conductivity of hydrates is very small.
5. Heat transfer in quiescent hydrate formation/dissociation reactor
It has been well known that the hydrate formation rate can be increased drastically by adding low dose of suitable surfactants, such as sodium dodecyl sulfate (SDS). This kind of additives can enhance mass transfer involved in hydrate formation by decreasing gas/liquid interfacial tension and increasing the solubility of gas in liquid water. Then it is possible to produce gas hydrate rapidly without stirring (Lin et al., 2004; Xie et al., 2005; Zhong and Rogers, 2000). The advantage of quiescent formation of hydrate is that the cost on manufacture and maintenance of the reactor could be reduced largely. Although the mass transfer has been enhanced satisfyingly by adding SDS to water, the heat transfer becomes a serious limitation to the application of quiescent reactor as hydrate formation is an exothermic process. Rogers et al. (2005) designed a scaled-up quiescent process to store 5000
www.intechopen.com

Developments in Heat Transfer
488
scf of natural gas in a vessel. They thought that the primary challenge of the scale-up design was to provide a surface area/volume ratio in the larger vessel. Therefore they devised an arrangement of finned-tube heat exchanger inside the hydrate formation vessel. Their elementary tests on this process indicated that the hydrate formation in the vessel lasted more than 9 hours, which is still too long for real applications. In order to suit the large scale industrial applications, we devised a multi-deck cell-type vessel as the internals of the reactor to reduce or eliminate the scale-up effect, which is schematically shown in Figure 7 (Pang et al., 2007). The vessel basically consists of a series of uniform boxes stacked up vertically and each box is divided into a series of uniform cells by metal plates. The metal plates were welded on the heat transfer tubes; therefore they also became the cool solid surface during the hydrate formation. The SDS aqueous solution was loaded in these cells with the same level. There are interspaces between two neighboring boxes such that the hydrate forming gas can flow into each deck of the vessel easily. The multi-deck cell-type vessel was placed in the high pressure reactor so that hydrate can form in each cell of the vessel uniformly and simultaneously. In this case, the reaction time depends mainly on the cell volume and the quantity of water loaded, and little on the total volume of the vessel and total quantity of water loaded. Thus the scale-up effect can be eliminated to a large extent as concluded by Pang et al. (2007). Since then, we carried out a systematical study on heat transfer in hydrate formation/dissociation process using this vessel. Experimental details and most recent results obtained by our group which have not been published are introduced in this part.
Metal
Plate
Heat
Transfer
Tube
Interspace
Vessel
Stanchion
Inlet of
the Coolant
Outlet of
the Coolant
(a) Outline (b) Cell-type inner structure
Fig. 7. The schematic outline of multi-deck cell-type vessel
5.1 Experimental apparatus
In order to investigate the heat transfer performance of this kind of inner structure during hydrate formation/dissociation, a middle scale reactor of a volume of 10 liter as well as an inner multi-deck cell-type vessel suitable for this reactor were manufactured and an experimental set-up, as shown in Figure 8, was established correspondingly. The reactor is 200 mm in diameter, 320 mm in height, and has a volume of 10 L. It was sealed with a blank flange bolted to its top.
www.intechopen.com

Heat Transfer Related to Gas Hydrate Formation/Dissociation
489
RTD
RTD
Coolant
Bath
DPT
Gas CylinderReactor
Cooling
Jacket
Gas Booster
DPT
RTD
Spinner
Flowmeter
Spinner
Flowmeter
Hot Water
Bath
RTD
Mass Flow
Meter
Computer
RT D
Fig. 8. Flow diagram of the experimental apparatus
Besides the stainless steel quiescent reactor, the primary components of the experimental
apparatus consist of a refrigeration system and a coolant or hot water recycling system. A
cooling/heating jacket was welded to the outside of the reactor and coiled copper tubes
were placed inside the multi-deck cell-type vessel uniformly. Coolant or hot water was
circulated through the copper tubes to cool or heat the reactant system for the hydrate
formation or dissociation. The flow rate of the coolant or hot water was measured using a
spinner flow meter. The coolant is a mixture of water and glycol and has a freezing point
lower than 253 K. The coolant bath was controlled by the refrigeration system within a
temperature range from 253 K to ambient with an uncertainty of 0.1 K. For the sake of
accuracy, another platinum resistance thermometer of ±0.1 K accuracy was placed behind
the outlet of the pump to measure the temperatures of the coolant. In addition, a gas recycle
system was used to recover the residual gas after the completion of hydrate formation as
well as the gas released during hydrate dissociation. Two platinum resistance thermometers
of ±0.1 K accuracy were placed into the reactor from the flange to measure the temperatures
of the vapor phase and the liquid (or hydrate) phase, respectively. The pressure in the
reactor and the gas cylinder was measured using two calibrated Heise pressure gauges with
a precision of 0.05 MPa. A mass flow meter and computer system were used to measure and
record the flow rate of methane gas during the process of hydrates dissociation at
atmospheric pressure. The accuracy of the flow meter is ±1% F.S and the interval of record
time is 5s.
5.2 Experimental procedures 5.2.1 Hydrate formation
Prior to any experiments the reactor was washed with water, loaded with 1920 g aqueous
solution of 2000 mg/L SDS, and evacuated to remove air. The refrigeration system and
coolant pump were then turned on to set the temperature of the aqueous solution in the
reactor to 276.15 K. After the desired temperature of the aqueous solution was achieved,
methane gas was charged into the reactor until the desired pressure was achieved. During a
www.intechopen.com

Developments in Heat Transfer
490
hydrate formation process, the gas was charged into the reactor continuously to keep the
pressure within the range of 6.4 to 6.8 MPa. When the drop in system pressure was less than
0.1 MPa over 20 minutes, the hydrate formation process was assumed to be complete.
Subsequently, the hydrate was frozen for dissociation test. In the experiment, the temperature
or flux of coolant was changed to determine the effect of heat transfer on the hydrate
formation rate. In each experimental run, the change of the pressure and temperature of the
gas in the reactor with the elapsing time was recorded, and the mole number, inΔ , of
methane consumed in the time period of itΔ was then determined with the following
equation:
i i
i i
t t t tt ti
t t t t t t
P VPVn
Z RT Z RT
+Δ +Δ+Δ +Δ
Δ = − (23)
where tV , tT , tP , and tZ are the volume, temperature, pressure, and compressibility of the
gas phase in the reactor at time t , respectively. t tV +Δ , t tT +Δ , t tP +Δ , and t tZ +Δ are the volume,
temperature, pressure, and compressibility of the gas phase in the reactor at the time t t+ Δ ,
respectively. It should be noted that no gas was charged into the reactor from the gas
cylinder during the time period of itΔ . The cumulative moles of gas consumed could be
calculated readily through
ii
n nΔ = Δ∑ (24)
5.2.2 Hydrate dissociation
After hydrate samples were formed with the procedure described above and cooled down
to 268.15 K, the system was left for about 3 hours with a less than 0.1 K fluctuation in reactor
temperature. Next, the vent was opened slowly to reduce the system pressure gradually to a
bit above the equilibrium formation pressure of methane hydrate at the set temperature.
Subsequently, the system was depressurized rapidly to near the atmospheric pressure of 0.1
MPa and the vent was then turned off. The methane hydrate samples were then heated with
hot water at a fixed temperature to a complete dissociation. The history of pressure and
temperature of the reactor, and the temperatures of the inlet and vent hot water were
recorded with the elapsed time. During the dissociation process, the hot water was charged
only into the coiled copper tubes and the coolant in the cooling jacket was expelled by air
before the dissociation experiment.
The cumulative moles of methane dissociated at time t without considering the shrinking of
methane hydrates volume during the dissociation can be calculated with the following
equation (Pang et al., 2009)
t i i it
t t i i
PV PVn
Z RT Z RTΔ = − (25)
where tT , tP , and tZ are the temperature, pressure, and compressibility, respectively, of
the gas phase in the reactor at time t . iP , iV , iT , and iZ are the initial dissociation
pressure, initial volume, initial temperature, and initial compressibility, respectively, of the
gas phase in the reactor.
www.intechopen.com

Heat Transfer Related to Gas Hydrate Formation/Dissociation
491
5.3 Modeling of heat transfer dependence of hydrate formation
Englezos et al. (1987a) proposed that the hydrate formation rate was proportional to its driving force and reaction area. In our work we defined the supercooling, i.e., the difference between the equilibrium temperature and the actual reaction temperature, as the driving force, then the rate of gas consumed for hydrate growth could be formulated as
( )d gl e w
dnK A T T
dt= − (26)
where dK is the intrinsic hydrate formation rate constant, glA is the formation area, and eT and wT are the equilibrium temperature and actual temperature of bulk water, respectively. As an exothermic reaction, the temperature of the water solution will increase with the formation of hydrate. Thus the metal plates were welded on the heat transfer tubes to remove the formation heat in the multi-deck cell-type vessel. Because of the temperature difference between the bulk water and the metal plates, the heat transfer happened and the reaction heat of hydrate formation could be expressed by
( )
( )p
h w l m
d mC TdnH K T T A
dt dtΔ = − + (27)
where ΔΗ is the reaction heat of hydrate formation, hK is the heat transfer coefficient, lT is the temperature of coolant, mA is the heat transfer area(it is assumed to be equal to the area of the metal plates), m is the total quantity of water and hydrate in the vessel, pC is the heat capacity of mixture of water and hydrate in the vessel, and T is the temperature of water and hydrate in the vessel (here we assumed that the temperature of water and hydrate is same). As the change of temperature is not obvious during the hydrate formation, it can be assumed that most of the formation heat of hydrate formation is removed by the coolant. So Equation 27 can be simplified as
( )h w l m
dnH K T T A
dtΔ = − (28)
Combining Equations 26 and 28 yields
1
( )1 e l
h m d gl
dnT T
HdtK A K A
⎛ ⎞⎜ ⎟⎜ ⎟= −⎜ ⎟Δ +⎜ ⎟⎝ ⎠ (29)
Considering that the gas/water interface area decreases with the proceeding of hydrate formation, the formation area glA in Equation 29 is empirically formulated as
1
b
gl ss
nA A
n
⎛ ⎞= −⎜ ⎟⎝ ⎠ (30)
where sA is the interface area of water and gas at the beginning of reaction, sn is the total quantity of consumed gas at the end of the reaction, n is the quantity of consumed gas at
www.intechopen.com

Developments in Heat Transfer
492
time t, and b is the reduced exponent of reaction area. In our work, the shape of vessel is round, and the vessel was divided into a series of uniform cells by metal plates with a 25 mm span. So the shape of most of the cells is square except the cell at the edge of the vessel, which is not regular. In our model, those irregular cells were transformed into the square cell according to the volume ratio, and the reaction status of hydrate formation in every cell was assumed to be same. The dependence of dK on temperature is formulated with the following Arrhenius-type equation,
0
E
RTdK k e
Δ−= (31)
where 0k is the pre-exponential coefficient and EΔ is the activation energy of intrinsic hydrate formation.
5.4 Heat transfer dependence in quiescent hydrate formation
Heat transfer is very important for the hydrate formation. The heat of hydrate formation must be removed in time; otherwise the hydrate formation could not proceed continuously. There are two factors significantly affecting the heat transfer rate: one is the structure of the reactor, i.e., total area for heat exchange and the other one is the coolant. The effect of the structure of the reactor has been investigated by Pang et al. (2007). Our present work focuses on the effect of the coolant on the hydrate formation, including the influence of the temperature and flux of the coolant. To study the effect of the coolant on the hydrate formation and ensure all of the hydrate formation experiments are performed on the same basis, the initial temperature of reaction system, the pressure, the mass of water solution, and the concentration of surfactant SDS were uniformly specified as 276.15 K, 6.4-6.8 MPa, 1920 g, and 2000 mg/L, respectively. By changing the temperature and flux of coolant, a series of experiments have been performed, and the results are shown in Figures 9 and 10, where the hydrate formation rate was manifested by the cumulative mole numbers of consumed gas vs. elapsed time.
5.4.1 Influence of coolant temperature
The effect of the temperature of coolant on the hydrate formation rate is shown in Figure 9. One can see that hydrate formation rate increases with the decreasing of the coolant temperature. This is easy to understand as when the temperature of coolant is lower, the formation heat can be more easily removed. As a result, the temperature of the water solution keeps lower and the driving force of hydrate formation keeps larger, resulting in the hydrate forms faster. However, when the temperature of coolant is low enough, the consumed rate of methane gas changed little with the decreasing of the coolant temperature. It means that the effect of coolant temperature on the hydrate formation rate is limited. When the temperature of coolant is low enough, the further decreasing of temperature have little effect on the hydrate formation rate. At that time, the hydrate formation rate is not controlled by the heat transfer, but controlled by the intrinsic kinetics of hydrate formation. For comparison, the calculated results by Equation 29 are also presented in Figure 9. One can see that the agreement between experimental data and calculated results is satisfying. The parameters of model were correlated using the experimental data and are shown in Table 2, where the flux of the coolant was fixed at 5.5 L/min and the hydrate formation heat was set to 54.20 KJ/mol (Makogon,1997).
www.intechopen.com

Heat Transfer Related to Gas Hydrate Formation/Dissociation
493
0 25 50 75 100 125 150 175 200 225 250 275 300 325
0
2
4
6
8
10
12
14
16
18
20
Con
sum
ed
gas
(mol)
Time (min)
275.15 K
273.15 K
272.15 K
271.15 K
Cal.
0 25 50 75 100 125 150 175 200 225 250 275 300 325
0
2
4
6
8
10
12
14
16
18
20
Con
sum
ed
gas
(mol)
Time (min)
275.15 K
273.15 K
272.15 K
271.15 K
Cal.
(a) (b)
Fig. 9. The effect of the coolant temperature on hydrate formation rate at different flux of coolant: (a) 2.0 L/min and (b) 3.5 L/min
Temperature of coolant
K
System temperature
K
Heat transfer coefficient
KW·m-2·K-1
Reaction rate constant
mol·m-2·K-1·s-1 b
EΔ KJ·mol-1
0k mol·m-2· K-1·s-1
275.15 281.4096 0.1662 0.0723 1.0030273.15 280.8802 0.1582 0.0688 0.8052272.15 280.1633 0.1808 0.0635 0.9670271.15 279.3663 0.1784 0.0589 1.0938270.15 279.3233 0.1987 0.0585 0.9145
66.467 1.5754×10¹¹
Table 2. Model parameters in Equation 29 and the correlated value of EΔ and 0k
5.4.2 Influence of coolant flux
Experimental results showing the influence of the coolant flux on the hydrate formation rate are plotted in Figure 10. It could be seen that the hydrate formation rate increases with the increasing of coolant flux when the temperature is fixed. The effect of coolant flux on the formation rate is more significant when the temperature of coolant is higher. When the temperature of coolant is low enough, the further increase of coolant flux has little effect on increasing hydrate formation rate. In this case, hydrate formation is controlled not by the heat transfer, but by the intrinsic kinetics of hydrate formation.
5.5 Heat transfer dependence in quiescent hydrate dissociation
We performed a series of experiments to reveal the effect of heating on methane hydrate dissociation in the quiescent reactor (Pang et al., 2009). Representative profiles of pressure, temperature, and cumulative mole number of evolved methane during hydrate dissociation are depicted in Figure 11, where hydrate was formed from 1920 g water of 2000 mg/L SDS, the initial temperature of hydrate was set to 268.15 K, the temperature of the input hot water was set to 298.15 K, and the flow rate was set to 2.0 liter per minute (LPM). As shown in Figure 11, at the beginning of hydrate dissociation, the temperature of hydrate decreased drastically and rapidly, which indicates a brief-but-rapid dissociation induced by the rapid
www.intechopen.com

Developments in Heat Transfer
494
depressurization in a short time period. During this initial degassing event, the temperature of sample typically dropped 3 to 7 K due to adiabatic cooling of methane gas expansion as well as heat absorption of hydrate dissociation (Stern et al., 2001).
0 25 50 75 100 125 150 175 200 225 250 275
0
2
4
6
8
10
12
14
16
18
Co
nsu
med
ga
s (m
ol)
Time (min)
7.0 L/min
5.5 L/min
3.5 L/min
2.0 L/min
0 25 50 75 100 125 150 175 200 225 250 275 300 325
0
2
4
6
8
10
12
14
16
18
20
Con
sum
ed
gas
(mo
l)
Time (min)
7.0 L/min
5.5 L/min
3.5 L/min
2.0 L/min
(a) (b)
Fig. 10. The effect of the coolant flux on hydrate formation rate at different coolant temperatures: (a) 273.15 K and (b) 271.15 K
0 100 200 300 400 500 600 700 800 900 100011001200
260
265
270
275
280
285
290
295
300
305
310
Temperature
Pressure
Time (min)
Tem
per
atu
re (
K)
0
1
2
3
4
5
Pre
ssure (M
Pa
)
0 100 200 300 400 500 600 700 800 900 1000110012000
2
4
6
8
10
12
14
16
18
Evo
lved
met
ha
ne
(mo
l)
time (min)
(a) (b)
Fig. 11. Typical profiles of pressure, temperature and cumulative mole number of evolved methane during hydrate dissociation, heated by 298.15 K hot water of a flux of 2.0 LPM in a closed system
The temperature of hydrate and pressure of system increased sharply after the vent was turned off as the hydrates dissociated rapidly. This brief but rapid hydrate dissociation is driven mainly by the thermodynamic driving force, i.e., the difference between the equilibrium pressure and the present system pressure. Figure 12(a) shows the comparison of the experimental dissociation temperature/pressure locus with the equilibrium temperature/pressure curve of methane hydrate. It can be seen that the experimental pressure is obviously lower than the equilibrium pressure at this stage, which implies the driving force is large.
www.intechopen.com

Heat Transfer Related to Gas Hydrate Formation/Dissociation
495
Then a stage of buffered dissociation occurred when the hydrates was heated to approach
the melting point of ice. During this period, the sample temperature remains within a
narrow range near the ice point, rises slowly with the proceeding of the hydrate
dissociation, and the corresponding dissociation rate is very low. As shown in Figure 12(a),
the temperature/pressure locus is very close to the equilibrium temperature/pressure
curve, which implies that the hydrate is closely at equilibrium state at this buffering stage
and the thermodynamic driving force for hydrate dissociation is very low. At this stage, the
ice coming from the hydrate dissociation is heated to produce liquid water and much larger
amount of heat is required for the thaw of ice. This phase transition process buffers the
system temperature at nearly fixed temperature and pressure and the rate of heat transfer is
the key rate-limiting factor for the hydrate dissociation. Circone et al. (2003, 2004) and Stern
et al. (2003) also found this kind of thermal buffering during decomposing methane
hydrates by heating them from low temperature through the melting point of ice. After the
buffered dissociation stage, the rate of methane hydrate dissociation increases with the
increasing of temperature of heating water. Therefore, the rate of heat transfer is an
important factor that controls the rate of hydrate dissociation, especially during the
buffering stage. In this buffering region, the hydrate dissociation rate is very low, which is
obviously unfavorable to both the recovery of gas from hydrate in the NGH technology and
the gas production from in situ natural gas hydrates with heating method. Measures should
be taken to eliminate this effect.
255 258 261 264 267 270 273 276 279 282 285 2880
1
2
3
4
5
6
7
8
9
10
11
12
13
Pres
sure
(M
Pa)
Temperature (K)
Experimental temperature / pressure locus
-------- Equilibrium temperature/pressure line
0 100 200 300 400 500 600 700 800 900 1000110012000
10
20
30
40
50
60
70
80
90
100
Dis
soci
ati
on
per
cen
tage
(%)
Time (min)
289.15 K
298.15 K
303.15 K
308.15 K
313.15 K
(a) (b)
Fig. 12. (a) Comparison of the experimental dissociation temperature/pressure locus with the equilibrium temperature/pressure curve of methane hydrate, and (b) The influence of the temperature of heating water upon hydrate dissociation rate
Our previous work (Pang et al., 2009) demonstrated that the buffering effect can be
eliminated and the dissociation rate can be improved by increasing the temperature of
heating water or reducing the dissociation pressure. Figure 12(b) shows the influence of the
temperature of heating water upon the dissociation rate of hydrate, where the dissociation
rate is manifested by changing of cumulative dissociation percentage of hydrate with the
elapsed time. It can be seen that the thermal buffering period can be shortened obviously by
increasing heating water temperature, which suggests the important role of heat transfer in
controlling the dissociation of hydrate.
www.intechopen.com

Developments in Heat Transfer
496
6. Heat transfer in hydrate bearing sediment
6.1 Heat effect during hydrate formation in sediment
Hydrate formation process in sediment is an exothermic process. The variation of
temperature is related to the hydrate formation rate and amount. For hydrate formation in
large scale of sediment, the fluctuations of temperatures at different locations will be
therefore different but will coincide with specified rules. A three-dimensional apparatus has
been used by our group recently to study the heat transfer process during hydrate formation
in sediment (Yang et al., 2010). Sixteen thermocouples were inserted into the sediment to
detect the variation of temperature, which were placed in different radius and different
depth of the reactor. Figures 13 and 14 show the pressure and temperature distribution
during the hydrate formation using the three-dimensional apparatus. From point A to B in
Figure 13, the top pressure decreases gradually, showing the process of hydrate formation.
At the same time, the temperatures at different locations in the reactor first rise to a
maximum value and then decreases, as shown in Figure 14. At the initial period, the hydrate
formation rate is high and temperatures rise due to the exothermic reaction. With the
decline of hydrate formation rate due to the decrease of the pressure driving force and pore
space, the rising trend of temperature weakens and the temperatures even decrease
gradually because the exothermic effect of hydrate formation can not make up the
refrigeration effect of the water bath. From point B to C, the pores of the sediment are
packed with formed hydrate, which resulting in that gas at the top of the reactor can hardly
permeate into the inner of sediment. Therefore, little hydrate forms and pressure and
temperature nearly keep constant in this stage. From point C to D, hydrate continues to
form again, which can be implied from the magnitude of pressure decrease in Figure 13 and
the temperatures increase in Figure 14. After point D, no hydrate formed and the top
pressure and temperature kept constant gradually.
0 5 10 15 20 25 30
0
2
4
6
8
D
B
C
A
Pre
ssu
re
(MP
a)
Time (h)
Fig. 13. Variation of pressure of the reactor versus time during hydrate formation
www.intechopen.com

Heat Transfer Related to Gas Hydrate Formation/Dissociation
497
During the whole process of hydrate formation, there are two stages (from A to B and C to D) of rapid increase of temperature caused by the exothermic effect of hydrate formation. The heat transfer during hydrate formation in sediment can then be characterized from the appearance sequence of the temperature peak and its magnitude.
0 5 10 15 20 25 30
272.5
273.0
273.5
274.0
274.5
275.0
275.5
276.0
T1
T2
T3
T4
Tem
per
atu
re (
K)
Time (h)
Fig. 14. Temperature distribution during hydrate formation with the same depth but different radius: T1, T2, T3, T4 were placed in different radius of 132 mm, 99 mm, 66 mm, and 33 mm, respectively
6.2 Heat effect during hydrate dissociation in sediment Depressurization, to depressurize the gas hydrates reservoir below the equilibrium pressure at specified temperature, has been considered as one of conventional methods of producing gas from hydrate bearing sediment. Heat effect will arise from the Joule-Thomson effect and endothermic process of hydrate dissociation. For a typical hydrate depressurizing decomposition in a three-dimensional environment (Su et al., 2010), three steps were adopted. First, free gas is discharged until the pressure decreases to a specified value, which is close to the equilibrium pressure at the current temperature. Afterward, gas is discharged rapidly and the system pressure attains the experimental dissociation value quickly. During the rapid depressurizing stage, there exists Joule-Thomson effect, and remarkable temperature drop was observed. Hereafter, hydrate begins to decompose. The temperature begins to rise under the heat transfer of air bath and endothermic process of hydrate dissociation. The extent of temperature variation can be used to reflect the quantity of hydrate decomposed. The difference between temperature value before and after rapid depressurizing, ΔT, can be used to analyze the dissociation process. For the value of ΔT at different positions, both Joule-Thomson effect and thermal effect of hydrate decomposition contribute to ΔT. Since both are endothermic process, the quantity of hydrate decomposition can be indicated by ΔT value. If assuming that hydrate in the reactor decomposing at the same drive force and at the same apparent decomposition rate, the position sequence of hydrate decomposition can also be connected with ΔT value. That is, the larger the ΔT is, the
www.intechopen.com

Developments in Heat Transfer
498
earlier decomposition reaction begins. Hydrate at the top and bottom of the reactor decomposes earlier than that in the inner of the reactor. Thermal stimulation, to produce gas from hydrates by increasing the temperature of the gas hydrates reservoir above the equilibrium temperature at specified pressure, is also an important method to produce gas from hydrate bearing sediment. Selim and Sloan (1990) found that the dissociation rate was a strong function of the thermal properties of the system and the porosity of the porous medium. Kamata et al. (2005) applied thermal recovery method to dissociate methane hydrate in hydrate sediment sample by hot-water injection from one side, gas production from another side. It was found that temperature and pressure in the sample fluctuated between stability region and decomposition region of methane hydrate sample when temperature of the hot water was high. We (Yang et al., 2010) studied the temperature distributions in the reactor during gas production by cyclic injecting hot water method. Figure 15 shows the variation of temperatures with time at different locations during the first cycle and the second cycle. It can be found that the overall temperature trend increases with hot-water injection and decreases with gas production. At initial stage of water injection, the temperatures rise slowly due to much heat is consumed to warm the flowing channel of hot-water. Afterward, the temperatures at different locations rise rapidly. It is noted that for the local positions of hydrate sample which are away from the injecting well and near the reactor wall, the temperature-jump phenomenon is not observed. It is known that the hot-water can hardly spread to those locations in a shorter time. Strong heat exchange with environment may also occur on those positions near the reactor wall with high conductivity. In contrast, at other locations, in view of low conductivity of hydrate sample, the fluctuation of temperature mainly depends on the seepage rate of hot-water in sediments instead of thermal diffusion. That is to say, the seepage flow controls the heat transport in this process at these locations. In addition, the temperature distribution also implied the injected hot-water distribution in the reactor to a certain extent. The location of well has an important effect on the temperature distribution in hydrate sediment, thereby affecting the gas production.
-5 0 5 10 15 20 25 30 35 40 45 50
276
280
284
288
292
296
300
304
308
T1
T2
T3
T4
Tem
per
atu
re
(K)
Time (min)
-5 0 5 10 15 20 25 30 35 40 45 50
275
280
285
290
295
300
305
310
315
T1
T2
T3
T4
Tem
per
atu
re (
K)
Time (min)
(a) first cycle (b) second cycle
Fig. 15.Variation of temperature with time at different locations with the same depth during the first cycle: T1, T2, T3, T4 were placed in different radius of 132 mm, 99 mm, 66 mm, and 33 mm, respectively
www.intechopen.com

Heat Transfer Related to Gas Hydrate Formation/Dissociation
499
7. Conclusion
In this chapter we have discussed heat transfer involved in formation/dissociation of gas hydrates. The state of the art for the studies of the experimental measurement of thermal conductivities of different kinds of gas hydrates, the mechanism and modeling of heat transfer occurring in the growth of hydrate film at the guest/water interface, our experimental study on macroscopic heat transfer in stirring reactors or flowing pipes, the experimental and modeling studies on the heat transfer in quiescent reactors, and the mechanism of heat transfer in hydrate bearing-sediment are summarized. We believe this chapter will be helpful for readers to understand the critical position of heat transfer in the hydrate formation/dissociation kinetics, favor the ongoing hydrate formation/dissociation kinetic research, and promote the application of gas hydrate.
8. Acknowledgement
The financial supports of the NSFC (Nos. 20925623, 21006126), the Research Funds of China University of Petroleum, Beijing (BJBJRC-2010-01), and the National Basic Research Program of China (2009CB219504) are greatly appreciated.
9. References
Andersson P. & Ross R. G. (1983). Effect of guest molecule size on the thermal conductivity and heat capacity of clathrate hydrates. J. Phys. C, Vol. 16, pp. 1423-1432.
Circone S., Stern L. A., Kirby S. H., Durham W. B., Chakoumakos B. C., Rawn C. J., Rondinone A. J. & Ishii Y. (2003). CO2 hydrate: synthesis, composition, structure, dissociation behavior, and a comparison to structure I CH4 hydrate. J. Phys. Chem. B, Vol. 107, pp. 5529-5539.
Circone S., Stern L. A. & Kirby S. H. (2004). The role of water in gas hydrate dissociation. J. Phys. Chem. B, Vol. 108, pp. 5747-5755.
Cook J. G. & Laubitz M. J. (1983). In Thermal Conductiuity; Hust J. G., Ed.; Plenum: New York, Vol. 17, pp. 745.
Cortes D. D., Martin A. I., Yun T. S., Francisca F. M., Santamarina J. C. & Ruppel C. (2009). Thermal conductivity of hydrate-bearing sediments. J. Geophys. Res., Vol. 114, pp. B11103.
deMartin B. J. (2001). Laboratory measurements of the thermal conductivity and thermal diffusivity of methane hydrate at simulated in-situ conditions. Georgia Institute of Technology: Atlanta, GA, USA.
Englezos P., Kalogerakis N. E., Dholabhai P. D. & Bishnoi P. R. (1987a). Kinetics of formation of methane and ethane gas hydrates. Chem. Eng. Sci., Vol. 42, pp. 2647-2658.
Englezos P., Kalogerakis N. E., Dholabhai P. D. & Bishnoi P. R. (1987b). Kinetics of gas hydrate formation from mixtures of methane and ethane. Chem. Eng. Sci., Vol. 42, pp. 2659-2666.
English, N. J. & Tse, J. S. (2010). Perspectives on hydrate thermal conductivity. Energies, Vol. 3, pp. 1934-1942.
Freer, E. M., Selim, M. S. & Sloan, E. D. (2001). Methane hydrate film growth kinetics. Fluid Phase Equilib., Vol. 185, pp. 65-75.
www.intechopen.com

Developments in Heat Transfer
500
Gustafsson S. E., Karawacki E. & Khan M. N. (1979). Transient hot-strip method for simultaneously measuring thermal conductivity and thermal diffusivity of solid sand fluids. J. Phys. D: Appl. Phys., Vol. 12, pp.1411.
Gustafsson S. E., Karawacki E. & Chohan M. A. (1986). Thermal transport studies of electrically conducting materials using the transient hot-strip technique. J. Phys. D: Appl. Phys., Vol. 19, pp. 727.
Handa Y. P. & Cook J. G. (1987). Thermal conductivity of xenon hydrate. J. Phys. Chem., Vol. 91, pp. 6327-6328.
Huang D. Z. & Fan S. S. (2004). Thermal conductivity of methane hydrate formed from sodium dodecyl sulfate solution. J. Chem. Eng. Data, Vol. 49, pp. 1479–1482.
Huang D. Z., Fan S. S. & Shi L. (2004). Thermal conductivity of gas hydrate. Huaxuetongbao, Vol. 10, pp. 737-742. (in Chinese)
Kamata Y., Ebinuma T., Omura R., Minagawa H., Narita H., Masuda Y. & Konno Y. (2005). Decomposition experiment of methane hydrate sediment by thermal recovery method. Proceedings of the 5th International Conference on Gas Hydrates, Trondheim, Norway, pp. 81-85.
Krivchikov A. I., Gorodilov B. Y., Korolyuk O. A., Manzhelii V. G., Conrad H. & Press W. (2005). Thermal conductivity of methane-hydrate. J. Low Temp. Phys., Vol. 139, pp. 693–702.
Krivchikov A. I., Gorodilov B. Y., Korolyuk O. A., Manzhelii V. G., Romantsova O. O., Conrad H., Press W., Tse J. S. & Klug D. D. (2006). Thermal conductivity of Xe clathrate hydrate at low temperatures. Phys. Rev. B, Vol. 73, pp. 064203.
Li D. L., Liang D. Q., Fan S. S. & Peng H. (2010). Estimation of ultra-stability of methane hydrate at 1 atm by thermal conductivity measurement. J. Nat. Gas. Chem., Vol. 19, pp. 229-233.
Lin W., Chen G. J., Sun C. Y., Guo X. Q., Wu Z. K., Liang M. Y., Chen L. T. & Yang L. Y. (2004). Effect of surfactant on the formation and dissociation kinetic behavior of methane hydrate. Chem. Eng. Sci., Vol. 59, pp. 4449-4455.
Lunden A., Trolle U., Azoulay M. & de Pablo J. (1986). Determination of kinetics and thermal conductivity of hydrates simultaneously by using thermogravimetry and transient hot strip method. Thermochimica Acta, Vol. 105, pp. 369-373.
Ma C. F., Chen G. J. & Guo T. M. (2002). Kinetics of hydrate formation using gas bubble suspended in water. Science in China (Series B), Vol. 45, pp. 208-215.
Makogon Y. F. (1997). Hydrates of Hydrocarbons. Tulsa, Oaklahoma: Penn Well books. Mochizuki T. & Mori Y. H. (2006). Clathrate-hydrate film growth along water/hydrate-
former phase boundaries-numerical heat-transfer study. J. Crystal. Growth, Vol. 290, pp. 642-652.
Moon C., Taylor P. C. & Rodger P. M. (2003). Molecular dynamic study of gas hydrate formation. J. Am. Chem. Soc., Vol. 125, pp. 4706-4707.
Mori Y. H. (2001). Estimating the thickness of hydrate films from their lateral growth rates: application of a simplified heat transfer model. J. Crystal. Growth, Vol. 223, pp. 206-212.
Ohmura R., Kashiwazaki S. & Mori Y. H. (2000). Measurements of clathrate-hydrate film thickness using laser interferometry. J. Crystal. Growth, Vol. 218, pp. 372-380.
Ohmura R., Matsuda S., Uchida T., Ebinuma T. & Narita H. (2005). Clathrate hydrate crystal growth in liquid water saturated with a guest substance: observations in a methane + water system. Cryst. Growth Des., Vol. 5, pp. 953-957.
www.intechopen.com

Heat Transfer Related to Gas Hydrate Formation/Dissociation
501
Pang W. X., Chen G. J., Dandekar A., Sun C. Y. & Zhang C. L. (2007). Experimental study on the scale-up effect of gas storage in the form of hydrate in a quiescent reactor. Chem. Eng. Sci., Vol. 62, pp. 2198-2208.
Pang W. X., Xu W. Y., Sun C. Y., Zhang C. L. & Chen G. J. (2009). Methane hydrate dissociation experiment in middle-sized quiescent reactor using thermal method. Fuel, Vol. 88, pp. 497-503.
Peng B. Z., Chen G. J., Sun C. Y., Yang L. Y. & Luo H. (2008). Is the gas hydrate film growth controlled by intrinsic kinetic or heat transfer? Proceedings of the 6th international conference on gas hydrates, Vancouver, British Columbia, Canada.
Peng B. Z., Dandekar A., Sun C. Y., Luo H., Ma Q. L., Pang W. X. & Chen G. J. (2007). Hydrate film growth on the surface of a gas bubble suspended in water. J. Phys. Chem. B, Vol. 111, pp. 12485-12493.
Peng B. Z., Sun C. Y., Chen G. J., Yang L. Y., Zhou W. & Pang W. X. (2009). Hydrate film growth at the interface between gaseous CO2 and sodium chloride solution. Science in China Series B: Chemistry, Vol. 52, pp. 676-682.
Rogers R. E., Zhong Y., Etheridge J. A., Arunkumar R., Pearson L. E. & Hogancamp T. K. (2005). Micellar gas hydrates storage process. Proceedings of the 5th international conference on gas hydrates, Trondheim, Norway, pp. 1361-1365.
Rosenbaum E. J., English N. J., Johnson J. K., Shaw D. W. & Warzinski R. P. (2007). Thermal conductivity of methane hydrate from experiment and molecular simulation. J. Phys. Chem. B, Vol. 111, pp. 13194–13205.
Ross R. G. & Andersson P. (1982). Clathrate and other solid phases in the tetrahydrofuran–water system: thermal conductivity and heat capacity under pressure. Can. J. Chem., Vol. 60, pp. 881-892.
Ross R. G., Andersson P. & Backstrom G. (1981). Unusual PT dependence of thermal-conductivity for a clathrate hydrate. Nature, Vol. 290, pp. 322.
Saito K., Kishimoto M., Tanaka R. & Ohmura R. (2011). Crystal growth of clathrate hydrate at the interface between hydrocarbon gas mixture and liquid water. Crystal. Growth & Design, Vol.11, pp. 295-301.
Saito K., Sum A. K. & Ohmura R. (2010). Correlation of hydrate-film growth rate at the guest/liquid-water interface to mass transfer resistance. Ind. Eng. Chem. Res., Vol. 49, pp. 7102-7103.
Selim M. S. & Sloan E. D. (1990). Hydrate dissociation in sediments. SPE Reserv. Eng., Vol. 5, pp. 245-251.
Sloan E. D. & Koh C. A. (2007). Clathrate hydrate of natural gases. 3rd ed, CRC Press: Boca Raton, FL.
Stern L. A., Circone S., Kirby S. H. & Durham W. B. (2001). Anomalous preservation of pure methane hydrate at 1 atm. J. Phys. Chem. B, Vol. 105, pp. 1756-1762.
Stern L. A., Circone S., Kirby S. H. & Durham W. B. (2003). Temperature, pressure, and compositional effects on anomalous or “self” preservation of gas hydrates. Can. J. Phys., Vol. 81, pp. 271-283.
Stoll R. D. & Bryan, G. M. (1979). Physical properties of sediments containing gas hydrates. J. Geophys. Res., Vol. 84, pp. 1629-1634.
Su K. H., Sun C. Y., Yang X., Chen G. J. & Fan S. S. (2010). Experimental investigation of methane hydrate decomposition by depressurizing in porous media with 3-Dimension device. J. Nat. Gas Chem., Vol. 19, pp. 210–216.
www.intechopen.com

Developments in Heat Transfer
502
Sun C. Y., Chen G. J., Ma C. F., Huang Q., Luo H. & Li Q. P. (2007). The growth kinetics of hydrate film on the surface of gas bubble suspended in water or aquesou surfactant solution. J. Crystal. Growth, Vol. 306, pp. 491-499.
Taylor C. J., Miller K. Y., Koh C. A. & Sloan E. D. (2007). Macroscopic investigation of hydrate film growth at the hydrocarbon/water interface. Chem. Eng. Sci., Vol. 62, pp. 6524-6533.
Tse J. S. & White M. A. (1988). Origin of glassy crystalline behavior in the thermal properties of clathrate hydrates: A thermal conductivity study of tetrahydrofuran hydrate. J. Phys. Chem., Vol. 92, pp. 5006-5011.
Tzirita A. (1992). In situ detection of natural gas hydrates using electrical and thermal properties. Ph.D. thesis, Texas A&M Univ., College Station.
Uchida T., Ebinuma T., Kawabata J. & Narita H. (1999). Microscopic observations of formation processes of clathrate-hydrate films at an interface between water and carbon dioxide. J. Crystal. Growth, Vol. 204, pp. 348-356.
Uchida T., Ikeda I. Y., Yakeya S., Ebinuma T., Nagao J. & Narita H. (2002). CO2 hydrate film formation at the boundary between CO2 and water: effects of temperature, pressure and additives on the formation rate. J. Crystal. Growth, Vol. 237, pp. 383-387.
Vysniauskas Y. & Bishnoi P. R. (1983). A kinetic study of methane hydrate formation. Chem. Eng. Sci., Vol. 38, pp. 1061-1072.
Waite W. F., Gilbert L. Y., Winters W. J. & Mason D. H. (2005). Thermal property measurements in Tetrahydrofuran (THF) hydrate and hydrate bearing sediment between -25 and +4 0C, and their application to methane hydrate. Paper presented at 5th International Conference on Gas Hydrates, Tapir Acad., Trondheim, Norway.
Waite W. F., Stern L. A., Kirby S. H., Winters W. J. & Mason D. H. (2007). Simultaneous determination of thermal conductivity, thermal diffusivity and specific heat in sI methane hydrate. Geophys. J. Int., Vol. 169, pp. 767–774.
Xie Y. M., Guo K. H., Liang D. Q., Fan S. S. & Gu J.M. (2005). Steady gas hydrate growth along vertical heat transfer tube without stirring. Chem. Eng. Sci., Vol. 60, pp. 777-786.
Yamamoto Y., Ohtake M., Kawamura T., Tsuji T. & Tsukada Y. (2008). Thermal conductivity measurement of methane hydrate with soil. Proceedings of the 6th international conference on gas hydrates, Vancouver, British Columbia, Canada.
Yang X., Sun C. Y., Yuan Q., Ma P. C. & Chen G. J. (2010). Experimental study on gas production from methane hydrate-bearing sand by hot-water cyclic injection. Energy & Fuels, Vol. 24, pp. 5912–5920.
Zhong Y. & Rogers R. E. (2000). Surfactant effects on gas hydrate formation. Chem. Eng. Sci., Vol. 55, pp. 4175-4187.
www.intechopen.com

Developments in Heat TransferEdited by Dr. Marco Aurelio Dos Santos Bernardes
ISBN 978-953-307-569-3Hard cover, 688 pagesPublisher InTechPublished online 15, September, 2011Published in print edition September, 2011
InTech EuropeUniversity Campus STeP Ri Slavka Krautzeka 83/A 51000 Rijeka, Croatia Phone: +385 (51) 770 447 Fax: +385 (51) 686 166www.intechopen.com
InTech ChinaUnit 405, Office Block, Hotel Equatorial Shanghai No.65, Yan An Road (West), Shanghai, 200040, China
Phone: +86-21-62489820 Fax: +86-21-62489821
This book comprises heat transfer fundamental concepts and modes (specifically conduction, convection andradiation), bioheat, entransy theory development, micro heat transfer, high temperature applications, turbulentshear flows, mass transfer, heat pipes, design optimization, medical therapies, fiber-optics, heat transfer insurfactant solutions, landmine detection, heat exchangers, radiant floor, packed bed thermal storage systems,inverse space marching method, heat transfer in short slot ducts, freezing an drying mechanisms, variableproperty effects in heat transfer, heat transfer in electronics and process industries, fission-trackthermochronology, combustion, heat transfer in liquid metal flows, human comfort in underground mining, heattransfer on electrical discharge machining and mixing convection. The experimental and theoreticalinvestigations, assessment and enhancement techniques illustrated here aspire to be useful for manyresearchers, scientists, engineers and graduate students.
How to referenceIn order to correctly reference this scholarly work, feel free to copy and paste the following:
Bei Liu, Weixin Pang, Baozi Peng, Changyu Sun and Guangjin Chen (2011). Heat Transfer Related to GasHydrate Formation/Dissociation, Developments in Heat Transfer, Dr. Marco Aurelio Dos Santos Bernardes(Ed.), ISBN: 978-953-307-569-3, InTech, Available from: http://www.intechopen.com/books/developments-in-heat-transfer/heat-transfer-related-to-gas-hydrate-formation-dissociation