Heat Stress Monitor Manual - Romteck Manual for... · 2015-07-28 · Printed on 3 October, 2012...
33
Printed on 3 October, 2012 Heat Stress Monitor Operation Manual For Version 2.06 Firmware V1.08 CALOR
Transcript of Heat Stress Monitor Manual - Romteck Manual for... · 2015-07-28 · Printed on 3 October, 2012...

Printed on 3 October, 2012
Heat Stress Monitor
Operation Manual For Version 2.06 Firmware
V1.08
CALOR

Copyright © 2003-2012 Calor Instruments Pty Ltd. All rights reserved
The software contains proprietary information of Calor Instruments Pty Ltd; it is provided under a
licence agreement containing restrictions on use and disclosure and is also protected by copyright law.
Reverse engineering of the software is prohibited.
Due to continued product development this information may change without notice. The information
and intellectual property contained herein is confidential between Calor Pty Ltd. and the client and
remains the exclusive property of Calor Pty Ltd. If you find any problems in the documentation, please
report them to us in writing. Calor Instruments Pty Ltd does not warrant that this document is error-free.
No part of this publication may be reproduced, stored in a retrieval system, or transmitted in any form
or by any means, electronic, mechanical, photocopying, recording or otherwise without the prior written
permission of Calor Instruments Pty Ltd.
Microsoft Word, Microsoft Office, Windows®, Windows 95™, Windows 98™, Windows NT®,
Windows XP® and Windows 7™, are trademarks of the Microsoft Corporation.
All other trademarks remain the property of their respective owners.
Calor Instruments Pty Ltd 37 Collingwood Street
Osborne Park
Western Australia 6017
AUSTRALIA
+61 (8) 9244 3011
E-Mail: [email protected]
Web: http://www.calor.com.au

i
Contents
About This Manual iii
Purpose of this Manual...................................................................................................................................... iii Who should use this Manual ............................................................................................................................. iii Help and Additional Information ...................................................................................................................... iii Conventions used in this manual ....................................................................................................................... iv
Introduction 1
What is the Calor Heat Stress Monitor? ............................................................................................................. 1 Where is it used ? ............................................................................................................................................... 1 The Risk of Working in a HOT Environment .................................................................................................... 1 What Does the HSM Measure? .......................................................................................................................... 2 The HSM Features ............................................................................................................................................. 2
Important Notes 3
Precautions ......................................................................................................................................................... 3 Maintenance ....................................................................................................................................................... 3 Calibration .......................................................................................................................................................... 3
Using The HSM 4
Front Panel Buttons ............................................................................................................................................ 5 Starting the Heat Stress Monitor ........................................................................................................................ 6 Stopping the Heat Stress Monitor ...................................................................................................................... 6 Deploying the Sensors ....................................................................................................................................... 6 Using the Menus ................................................................................................................................................ 6
Entering Data .......................................................................................................................................... 7 System Setup ...................................................................................................................................................... 7
Date ......................................................................................................................................................... 7 Time ........................................................................................................................................................ 7 Mode (Hour format) ................................................................................................................................ 7 Units (Measurement Units) ..................................................................................................................... 7 Contrast ................................................................................................................................................... 7 Light Timeout (Backlight Timeout) ........................................................................................................ 8
Real-Time (Display) .......................................................................................................................................... 8
Environmental Analysis 9
Overview ............................................................................................................................................................ 9 Begin Analysis ................................................................................................................................................... 9 Heat Strain Model ............................................................................................................................................ 11 Understanding the Results................................................................................................................................ 12
Thermal Work Limit ............................................................................................................................. 12 Thermal Work Limit (Values) ............................................................................................................. 13 Work/Rest Results (Heat Strain Model) ............................................................................................... 13 Environment Data ................................................................................................................................. 14 Error Results ......................................................................................................................................... 14

ii Contents
Data Logging 15
Datalog Menu ................................................................................................................................................... 15 Datalog Setup ................................................................................................................................................... 15
Start Time .................................................................................................................................. 15 Duration ..................................................................................................................................... 15 Interval ....................................................................................................................................... 15
Datalog Start .................................................................................................................................................... 15 Datalog Review ................................................................................................................................................ 16 Datalog Download ........................................................................................................................................... 16 PC Interface ..................................................................................................................................................... 16
Menu System 19
Troubleshooting 20
Error Results .................................................................................................................................................... 20 Calibration ........................................................................................................................................................ 21
Glossary 21
Terms and Abbreviations ................................................................................................................................. 21
Definitions 22
Acclimatisation ................................................................................................................................................ 22 Air Cooling Power ........................................................................................................................................... 22 Dew Point ......................................................................................................................................................... 22 Dry-Bulb Temperature ..................................................................................................................................... 23 Mean Radiant Temperature (MRT) .................................................................................................................. 23 Relative Humidity ............................................................................................................................................ 23 Thermal Work Limit ........................................................................................................................................ 23 Wet Bulb Temperature (WB) ........................................................................................................................... 24 Wet Bulb Globe Temperature (WBGT) ........................................................................................................... 24
Specifications 25
Physical ............................................................................................................................................................ 25 Electrical .......................................................................................................................................................... 25 Sensor ............................................................................................................................................................... 25
Accessories 26
Notes 27

iii
ABOUT THIS MANUAL
Purpose of this Manual This manual provides detailed information about the installation of the CALOR Heat Stress Monitor
(HSM). It is designed to help users to follow the recommended installation procedure, as well as to help
troubleshoot the HSM. This is intended as a reference manual. The manual is intended for firmware 2.03
with only minor differences between versions 2.0 where 2.03 presents more error messages and has a
shortcut to the Heat Strain Menu. For more information regarding changes see the release notes that are
available on the website mentioned below.
Who should use this Manual This manual is for users installing and using the CALOR HSM with firmware 2.0 and above.
The manual provides step-by-step procedures and description for configuring and using the HSM. The
manual is organised in a sequential manor for first time users.
Help and Additional Information
Customer Support Information
If you need more information about the CALOR HSM that is not contained in this document, or have
problems with the HSM, please contact our Project Coordinator at:
CALOR INSTRUMENTS PTY LIMITED
37 Collingwood Street
Osborne Park
Western Australia 6017
Phone: 61 8 9244 3011
Fax: 61 8 9244 2649
CALOR office hours are Monday through Friday
8.30 am - 5.00 pm (Western Australian Time which is GMT+8 hours)
Web Site: www.calor.com.au
Email: [email protected]

iv Contents
How this manual is organised This manual is organised into seven chapters.
Chapter 1: Introduction. An overview of the CALOR INSTRUMENTS - HSM, with a general
description of its components.
Chapter 2: Important Notes. This chapter will help you to prepare for using the HSM, including what
tools are required, how to unpack and to mount HSM.
Chapter 3: Using The HSM. Provides step-by-step procedures for using the HSM for the first time.
Chapter 4: Environmental Analysis. Describes how to obtain environmental data.
Chapter 5: Data Logging. Describes how to run the logger functionality
Chapter 6: Menu System. A map of the HSM menu system.
Chapter 7: Troubleshooting. This section is for resolving problems that you may encounter when
operating the HSM.
Conventions used in this manual There are a few formatting conventions used in this manual to make it easier to read and understand.
They are listed below.
1,2,3 Steps in a procedure are numbered consecutively
This Note points out information that helps you perform a step in a procedure
This is a Warning message that alerts you for a vital step to be taken, or a condition to be
observed, before taking a particular step of a procedure. Failing to do so may result in
damage to equipment.

1
C H A P T E R 1
INTRODUCTION
What is the Calor Heat Stress Monitor? The Heat Stress Monitor (HSM) is an Environmental Monitoring Instrument designed to provide accurate
information relating to the environmental parameters of its location as well as providing health and safety
information relating to work load.
The Calor HSM provides two sets of results based on two, internationally recognised algorithms:
The Heat Stress Model is based on the wet bulb globe temperature (WGBT) and the “Air Cooling
Power (ACP) which is recommended by the industry standard ISO 7243 for assessing the level of heat
stress within a given environment. From this algorithm a number of recommendations are output along with
a calculated Air Cooling Power.
The Thermal Work Limit (TWL) algorithm developed by Dr G Bates is revised and updated from the
Heat Stress Model and produces a rating of the environment where the measurements were taken. Within
this manual is a series of recommendations associated with each rating.
The HSM allows viewing of environmental data in real-time for monitoring purposes. Data is collected for
2 mins, averaged, and updated once per second. There is also a capability to perform unattended logging of
data.
Where is it used ?
The small and convenient Heat Stress Monitor (HSM) has applications in military combat and training
exercises, mining, foundries, agriculture, offshore oil and gas operations, endurance sports, and many
industrial work situations particularly in harsh, hot tropical and arid environments. It is an essential tool for
Occupation Health and Safety officers to evaluate work locations to verify that environmental conditions
including temperature, humidity and air flow, and that work clothing and personal hydration practices are
appropriate and effective for the prevention of Heat Stress.
The HSM is used by engineers and architects to measure airflow and other environmental parameters in
industrial and commercial buildings where thermal stress balance is the priority. In addition Health
inspectors can assess food outlets for compliance with local health regulations.
The Risk of Working in a HOT Environment Heat stress causes discomfort, reduces productivity and can lead to more serious health effects such as
accidents, illness and even death. Prolonged exposure to high temperatures alone can lead to excessive fluid
loss, shock, or heat stroke. High humidity compounds the effects of temperature by reducing the cooling
effects of sweating. Extended and strenuous exercise, or labour that increases the heat produced by muscles,
also contributes to the risk of illness in the form of cramps, exhaustion, or heat stroke. Internal body
temperatures, normally 37°C, are considered hazardous between 39-41°C. Death is likely to occur at 42°C
and above.
Beating the heat requires monitoring the full range of stress-inducing parameters. Not just the obvious ones,
such as ambient temperature, radiant heat and humidity, but also such contributing factors as air flow,
clothing, physical exertion, and in some instances barometric pressure.

2 Introduction
What Does the HSM Measure? The environmental parameters typically measured to identify heat stress are the dry bulb, wet bulb, and
black globe radiant temperatures. From these three readings the wet bulb globe temperature (WBGT) index
is calculated.
In addition to these parameters the HSM also measures wind speed, which significantly affects evaporative
cooling, and barometric pressure. This data is combined with user inputs of clothing type and work level.
The degree of acclimatisation status in a specific group under surveillance can also be factored. All data is
then combined using algorithms derived from original field and laboratory studies. The output of the model
provides specific guidance on selected features such as optimal work/rest cycles, the maximum safe
duration of a work shift, and hourly water requirements to replace sweat loss.
In a mining environment one of the few variables that can be adjusted to reduce thermal strain to workers is
air velocity. There is an existing strain index that incorporates wind speed in its computation, however, in
the past it has not been extensively used, as no single instrument has been able to simultaneously measure
all the needed parameters.
The HSM Features Foldaway Sensor system – Sensors can be rotated and stowed away in the protection of a rear
compartment. This allows the module to be deployed without danger of contamination and reduces
the risk of breakage.
Removable environmental data sensor system (module) that can be easily disconnected for
replacement or repair.
All calibration data and signal conditioning electronics are contained in the sensor module.
Liquid crystal display (LCD) with low power consumption and good contrast in sunlight as well as
indoor lighting.
Backlight for use in very low light conditions.
The HSM is equipped with thermistor-based sensors to measure air temperature, wind speed, and
solar radiation.
Capacitive polymer-based sensor to measure humidity.
Piezo-resistive absolute pressure sensor for measuring barometric pressure and estimating altitude.
Fast response black globe system. Using single piece of copper of 0.15mm wall thickness.
Simulated 6 inch Globe with fast response time.
Environmental data may be displayed in real time.
Unattended data logging with time stamping.
Interfaces to a Personal Computer to allow downloading of data logs for analysis.
Data logging results can be viewed on screen.
Tripod mount option for data logging mode.

Important Notes 3
C H A P T E R 2
IMPORTANT NOTES
Precautions The HSM is a sophisticated electronic instrument and whilst it is small and compact it still needs to be
treated with care to ensure the reliability of the data it provides you.
We recommend that the HSM be kept in the hard case provided with the instrument when not in use. At
other times it should be kept in a dry and clean environment.
Avoid knocking or dropping the instrument and it should be kept away from water or other liquids.
The unique design of the HSM sensors with their ability to be folded away within the device helps protect
the sensors from knocks and general wear and tear. For protection, sensors should be folded back in the
HSM when not in use.
The HSM requires batteries for operation and these are contained
within the rear cover of the device. A small rubber cover protects the
batteries and should be refitted whenever batteries are exchanged.
The recommended batteries are 4 off ‘AA’ type Alkaline or better
batteries.
Take care to ensure the correct orientation of the
batteries so as not to short them out.
Batteries can be affected by heat and this will reduce the life of the battery. It is therefore recommended
that the device be kept out of direct sunlight and that the unit is turned off when not required. An automatic
turn off function can be initiated through the SYSTEM SETUP menu within the HSM.
Maintenance The Heat Stress Meter takes real time readings from the environment and therefore the sensors must be
clean and undamaged.
To clean the sensors, gently wipe the thermistors (the chrome tops of the masts) with dilute ethanol or
methylated spirits (a lens cleaning wipe is sufficient). The globe and case can be cleaned with a 30%
solution of alcohol.
When not in use always keep the sensors in the non-deployed position; that is in the main enclosure.
The Black Globe Radiant Sensor is made of very thin copper and can be dented by dropping the instrument.
The sensors are protected when they are in their casings. If the sensors are allowed to get dirty, it may effect
the performance of the sensors and hence the readings.
Calibration The sensors of the HSM require regular annual calibration where the HSM is returned to Calor Instruments
Pty Ltd the address shown on Page iii of this manual.

4 Using The HSM
C H A P T E R 3
USING THE HSM
Using the HSM is very simple and once set up should not require changes in general use. It has an internal
setup menu system and configuration menu that is used through the front buttons.

Using The HSM 5
HOLD DOWN ON/OFF KEY
TO POWER ON SYSTEM
Front Panel Buttons The buttons on the front of the HSM are used as follows:
ON/OFF
&
Backlight
ON/OFF
This button is used to turn the HSM, ON and OFF. Press the
button and hold for about 2 seconds until the display
indicates that it is turning on and then display the start-up
screen of the HSM.
To turn OFF the HSM press the button and hold. The screen
will indicate that it is turning off in 2 seconds. Continue to
hold the button until the screen closes down.
BACKLIGHT
The ON/OFF button is also used to turn on and off the backlight for the LCD display so
that it can be seen clearly in low light conditions. The screen will brighten and a small
globe symbol will show in the top left of the screen.
The backlight can be toggled ON and OFF by pressing the button momentarily when the
display is on. It is recommended that this only be turned on when required so as to extend
the battery life.
Cursor Pad
CURSOR PAD
The HSM uses a 4 way cursor pad to navigate through menu specific selections or control
functions such as the LCD contrast level.
The cursor pad has Up, Down, Left and Right operations indicated by the four white dots
on the cursor pad. Press the chosen direction once for each step you wish to make.
PAGE
Is used to step the current displayed screen from one menu screen to another. Each press of
the button will step one screen.
ENTER
Will allow you access into the current menu screen shown. This will then display a menu
of other options that can be accessed by the cursor pad.
QUIT
Is used to step back out of menus and return to earlier menu options or cancel input
operations.

6 Using The HSM
Starting the Heat Stress Monitor
To turn the HSM on you press and hold down the (ON/OFF) button on
the front panel for about 2 seconds until the splash “HEAT STRESS
MONITOR II” screen appears. You can then release the button. If the
button is not held on long enough it will automatically turn off when you
release the button.
After the splash screen with the version has been displayed for a few seconds
the HSM will then display the HSM STATUS page shown on the right. This
page shows the current Date, Time, LCD Contrast (centre bar graph) and
percentage of Battery Charge Level (bottom bar graph).
From this page you can also adjust the contrast of the LCD display with the
CURSOR PAD left and right arrows.
Press to move to the Main HSM MENU as described in the Using the
Menu section.
Stopping the Heat Stress Monitor
To turn off the HSM you press and hold down the (ON/OFF) for about
1 second the HSM will display a small popup counter counting down from 2
seconds, continue to hold the until the unit turns off. This can be done
from within any menu.
Deploying the Sensors
To allow the HSM to take any environmental readings for you must firstly
deploy sensors from the rear panel by opening the rear panel and turning the
dial on the side of the HSM (left side if observed from the rear).
Using the Menus
The HSM offers an extensive range of functions, which are grouped into
menus. The main menu is shown to the right. To move the highlight bar to
select an item on the menu use the Up and Down buttons of the CURSOR
PAD. To access a selected item press .
The HSM will then present you with a new menu or display results. To
return to the previous menu press .
HEAT STRESS MONITOR I I
Version 2.06
HSM MENU
STATUS __ __ ENVIRON. ANALYSIS REAL TIME ANALYSIS DATA LOGGING SYSTEM SETUP HEAT STRAIN MODEL
OFF IN 2
HSM MENU
DATALOG SETUP_____
DATALOG REVIEW
DATALOG DOWNLOAD OFF IN 2
HSM MENU
STATUS __ __ ENVIRON. ANALYSIS REAL TIME ANALYSIS DATA LOGGING SYSTEM SETUP HEAT STRAIN MODEL
HSM STATUS
Date: JAN 08, 2009 Time: 02:50:12 pm
Batt Remaining: 100%
E F

Using The HSM 7
Entering Data
When entering data via the menu system the will save the data and the will allow you to back out
and return to the item selection.
System Setup The first time you run your HSM you will most likely need to correctly configure it for your locality and
policies. The SYSTEM SETUP menu allows you to set the Time and Date, 24 or 12 hour time, Metric or
Imperial (English) units and adjust the Backlight Timeout.
Date
To set the DATE move the cursor bar over the Date: and press the . The cursor bar will reduce to a
small cursor, you can then increment or decrement the days with the cursor pad. When you have set the
date then press the to save or to return to the main menu.
If you press and hold the cursor pad the days will auto increment/decrement. If you keep holding
down the cursor button for a further few seconds the auto rate will increase and start to change months.
Time Setting the TIME is a similar to setting the date. You move the cursor bar down to the Time: and press the
. The cursor will change to and the Up and Down cursor buttons will increment or decrement the
minutes. To adjust the hours press and hold the cursor pad.
Mode (Hour format)
The HSM supports 12 hour or 24 hour time format. To change this setting, select the Mode: press .
Pressing the cursor pad will cause the format to toggle back and forth between 12 and 24. Press the to
save this or press to return to the main menu.
Units (Measurement Units) The HSM supports two types of units the standard METRIC format and the IMPERIAL system. The HSM
will let you toggle between the two.
Contrast The contrast of the LCD can be adjusted to best suit the lighting conditions. The cursor pad will increase or
decrease the contrast which will be indicated by the bar graph.
HSM MENU
STATUS ENVIRON. ANALYSIS REAL TIME ANALYSIS DATA LOGGING SYSTEM SETUP ____________ HEAT STRAIN MODEL
SYSTEM SETUP
Date: NOV 19, 2010 Time: 03:00pm Mode: 12 hr Meas. Units: METRIC Contrast: _____________ Light Timeout: 10sec

8 Using The HSM
Light Timeout (Backlight Timeout)
To increase battery life you can adjust the time that the backlight is held on for after you press the
whilst the unit is already on. The HSM backlight time out can be set to the following number of seconds:
10, 15, 30, 60, 120, 240 or None.
To change the Timeout value, select the Light Timeout: and move through a list of timeout values with the
cursor pad. Then press to save the selection or to exit back to the main menu.
Real-Time (Display) The REALTIME DISPLAY menu function provides a snapshot of some of the environmental values that
the HSM can obtain. The screen is continually updated with the current and ongoing real time readings.
Make sure the sensors are deployed to allow the HSM to obtain valid readings.
There are two columns of data values in the Real-time Display.
Value Definition Units Comment
Metric Imperial
DB Dry Bulb Degrees
Celsius
Degrees
Fahrenheit Ambient temperature value
WB Wet Bulb Degrees
Celsius
Degrees
Fahrenheit The Wet bulb temperature is a measurement that reflects the
physical properties of a system with a mix of gas and vapour.
G Globe Degrees
Celsius
Degrees
Fahrenheit Black Globe Temperature. Radiated / solar temperature.
WBGT Wet Bulb
Globe
Temperature
Degrees
Celsius
Degrees
Fahrenheit Is a composite temperature used to estimate the effect of
temperature, humidity, wind speed and solar radiation on
humans. The WBGT is a part of the ISO 7243 standard.
(See definitions for more information)
Second Column
RH Relative
Humidity
% % Percentage of water vapour within the air compared to
saturated amount.
WS Wind Speed Metres per
second
Miles per
hour The airspeed of the wind travelling across the HSM
P Pressure Kilo-
pascals
Inches of
mercury The atmospheric / barometric air pressure.
MRT Mean
Radiant
Temperature
Degrees
Celsius
Degrees
Fahrenheit MRT is the most important parameter governing human
energy balance. (See definitions section for more
information)

Environmental Analysis 9
C H A P T E R 4
ENVIRONMENTAL ANALYSIS
Overview The HSM contains two similar algorithms for processing the environmental data. One algorithm is called
the “Thermal Work Limit (TWL)” which classifies the area as a zone with a work limit. This algorithm
was developed by Dr G Bates.
The other algorithm is “Heat Strain Model” which allows some configuration of clothing and provides
recommendations for work rest cycles and fluid intake. This resultant information is discussed later in the
section titled “Understanding the Results”. The “Heat Strain Model” is based on Wet Bulb Globe
Temperature (WBGT) developed by the United States Army Research Institute of Environmental Medicine
(USARIEM).
You can preset the “Heat Strain Model” clothing and work level before doing an analysis. This is accessible
via the Heat Strain Model menu accessible from the main menu.
Begin Analysis This is the main function of the HSM. Firstly you must deploy the sensors from the rear panel by opening
the rear panel and turning the dial on the right hand side of the HSM.
At this point you must consider how you are going to take your measurement. For best results you should
try to place the HSM on a tripod in the centre of the work area.
When taking measurements with the HSM you must consider the following factors:
Area flow: Avoid placing the HSM near the outlet of an air-conditioner or in the path a fan unless
you are intending to make a comparison of the environment. Also corridors, chimneys and
stairways produce airflow.
Movement: Walking with the HSM whilst taking measurements will produce an air-flow which
the HSM will calculate as wind. The movement will also alter the radiated heat measurement as you
pass objects that are radiating such as the roof, walls, vehicles, heaters etc.
Radiated heat: Avoid placing near heaters, on vehicles, on the ground, computers, machines or
fridges. Even groups of people may affect the results.
HEAT STRAIN MODEL
Clothing:
SHORTS AND T-SHIRT
Work: LEV2 Accl: YES
BACK _
HSM MENU
STATUS ENVIRON. ANALYSIS
REAL TIME ANALYSIS
DATA LOGGING
SYSTEM SETUP
HEAT STRAIN MODEL

10 Environmental Analysis
Do NOT place on the Ground DO PLACE IT ON A TRIPOD Do NOT place on Vehicles
To begin analysis select ENVIRON. ANALYSIS and press then select either a 2 minute or 30 minute
collection cycle then press to start and the DATA COLLECTION IN PROGRESS display will be
shown and will display the minutes and seconds remaining for the environmental sample.
The remaining minutes and seconds will count down on this screen After a while the screen may go blank
to save batteries. You can press enter to wake up the screen at any time. On completion the following set of
pages/displays can be presented. You can cycle through each of the result pages shown below using the
button.
The WORK/REST RESULTS also provides the option to modify some parameters of such as clothing and
work level.
When the HSM has completed the “Data Collection” it will stay in this mode and retain the data for
up to 2 hours if you do not QUIT. If you leave the unit unattended it will go into sleep mode after 10
minutes. Pressing any key from this mode will wake up the HSM and return to the results menus above. If
you leave the HSM idle after it has gone into sleep you must wake it up before 2 hours if you wish to
review or display the information. If you want to retain the data for longer periods then use the “Data
Logging” Mode.
DATA COLLECTION
IN PROGRESS . . .
Press QUIT to abort
Remaining: 1m 39s
HSM MENU
STATUS ENVIRON. ANALYSIS REAL TIME ANALYSIS DATA LOGGING SYSTEM SETUP HEAT STRAIN MODEL
DURATION
2 Minutes 30 Minutes
Press ENTER to begin
or QUIT to abort

Environmental Analysis 11
Heat Strain Model The HEAT STRAIN MODEL menu is a configuration menu that provides information to the calculations.
This menu allows a customised model to be applied to the workplace environmental factors to assess the
Heat Strain factors applicable to this defined scenario.
The configuration menu can be accessed via either the results menu or also via the Main Menu. When
accessed via the Main Menu you can preset the clothing type and work level.
The Heat Strain Model, calculates work/rest minutes and water requirements for avoiding heat stress. It was
originally developed by the U.S. Army.
Within the HEAT STRAIN MODEL menu the following parameters can be altered by moving the cursor to
the item, pressing then moving the cursor pad to step or toggle through the possible options. When you
have completed you configuration move the cursor and select the BACK which will save and return to the
previous menu.
Clothing
Clothing worn. There are two preset types of clothing to choose from, either SHORTS AND T-SHIRT or
Trousers with Long Sleeve Shirt - TROUSERS+L.S. SHIRT.
Work
Work Rate. This is a Level of work rate with Level 1 being sedentary and Level 5 being the maximum
rate. Normal work rate for an 8-12 hour shift would be a Level 2 or intermittently Level 3.
Level 4 or 5 would only be used for flat out short bursts of activity. Values: Lev1 to Lev5
WORK RATE TABLE
Level Rate Watts of
Allowable work
General Examples
Lev1 Resting / sedentary < 105 watts Resting
Lev2 Very Light work rate 105- 150 watts Sitting driving a car or standing in observation.
Light Hand and arm work.
Lev3 Light work rate 150-250 watts Standing to controlling machines. Arm and trunk. Casual
walking.
Lev4 Moderate work rate 250-425 watts Walking at around 4.5 Km/h, light digging. Moving light
wheelbarrow.
Sustained hand, arm and trunk work i.e. hammering.
HEAT STRAIN MODEL
Clothing:
SHORTS AND T-SHIRT
Work: LEV2 Accl: YES
BACK _
HSM MENU
STATUS ENVIRON. ANALYSIS REAL TIME ANALYSIS DATA LOGGING SYSTEM SETUP HEAT STRAIN MODEL

12 Environmental Analysis
Lev5 Heavy work rate (Flat
out short bursts of
activity)
425-600 watts Sawing hard wood, Carry heavy materials. Moving
heavily loaded wheelbarrows, carrying loads upstairs or
digging. Intense arm and trunk work.
Accl
Acclimatisation. This is the acclimatised status of the person (i.e.: are they used to working in the Heat)
this only has a value of YES or NO.
Understanding the Results
Thermal Work Limit The Thermal Work Limit (TWL) is measured in W/m² or Watts of allowable work in the environment
being assessed.
TWL
GOOD BAD
> 220 220 - 140 140 - 115 < 115
The screen will rate the environment of workplace zones rating with one of the following four ratings:
Zone TWL (W/m²) Recommendations
Unrestricted Work > 220 No limits on self-paced work for educated, hydrated, acclimatised
workers.
Acclimatisation
Zone
220 – 140 Affects new workers or those who have been off work for more than
14 days due to illness or leave (outside the tropics), should follow the
Buffer Zone recommendations.
Buffer Zone 140 – 115 Any practicable intervention to reduce heat stress should be
implemented e.g. provide shade, improve ventilation etc.
Working alone should be avoided if possible.
Un-acclimatised workers not to work in this zone.
Fluid intake of ≥ 1 litre per hour required.
Work-rest cycling or rotation required.
Withdrawal
Zone
< 115 Work limited to essential maintenance or rescue operations.
No person to work alone.
No un-acclimatised person to work.
Documentation required authorising work in hostile thermal
conditions for specific purpose.
Specific induction required emphasising hydration and
identifying signs of heat strain.
Apply 20 minutes work - 40 minutes rest schedule.
Dehydration testing recommended at end of shift.
Personal water bottle (2 litres) must be available at all times.

Environmental Analysis 13
Thermal Work Limit (Values)
Value Definition Units Comment
Metric Imperial
DB Dry Bulb Degrees
Celsius
Degrees
Fahrenheit Ambient temperature value.
WB Wet Bulb Degrees
Celsius
Degrees
Fahrenheit The Wet Bulb temperature is a measurement that reflects the
physical properties of a system with a mix of gas and vapour.
G Globe Degrees
Celsius
Degrees
Fahrenheit Black Globe Temperature. Radiated / solar temperature.
Second Column
WS Wind Speed Metres per
second
Miles per
hour The airspeed of the wind travelling across the HSM
The HSM should be stationary.
SR Sweat Rate Litres per
hour
Quarts per
hour Amount of water being expired from the body.
TWL Thermal
Work Limit
Watts/m² Watts/m² A rating or index of thermal stress
(See definitions for more information).
Work/Rest Results (Heat Strain Model) The Heat Strain Model is derived from the WBGT and gives a maximal
exposure limit in a measured environment, a work rest cycling regime and
recommended water intake.
Work / Rest Results
Work/Rest
No Limit No limit required for this environment when optimum water is supplied.
Ext Cool External cooling is required with optimum water.
xx min/hr Continuous work and rest cycle of xx minutes per hour, with optimum water.
For example 11 minutes work with the 49 remaining minutes rest.
Max Work xx min The maximum number of minutes you can work continuously without a rest.
Opt Water Optimum intake of water in Litres or Quarts per hour
Max Water Maximum intake of water in Litres or Quarts per hour
THERMAL WK LIMIT
DB:30.0C WS:1.00m/s
WB:24.7C SR:098 l/hr
G:36.4C TWL:222W/m2
Unrestricted Work
Press PAGE or QUIT.

14 Environmental Analysis
Environment Data The Environmental Data display contains identical information to the
Real-Time Display, data covered in Chapter 3 with the addition of ACP
which is a value specifically for the “Heat Strain Model”. The ACP is can
be referenced against the following table below as a guide and must
always be greater than the work rate.
Value Definition Units Comment
Metric Imperial
DB Dry Bulb Degrees
Celsius
Degrees
Fahrenheit Ambient Temperature value
WB Wet Bulb Degrees
Celsius
Degrees
Fahrenheit The Wet bulb temperature is a measurement that reflects the
physical properties of a system with a mix of gas and vapour.
G Globe Degrees
Celsius
Degrees
Fahrenheit Black Globe Temperature. Radiated / solar temperature
WBGT Wet Bulb
Globe
Temperature
Degrees
Celsius
Degrees
Fahrenheit Is a composite temperature used to estimate the effect of
temperature, humidity, wind speed and solar radiation on
humans. The WBGT is a part of the ISO 7243 standard. (See
definitions for more information)
ACP Air Cooling
Power
watts / m2
Watts over Metres
squared
Equivalent to Watts of allowable work.
This value must always be greater than the work rate to avoid
heat stress (in conjunction with other guidelines such as
work/rest cycles and water intake)
(See definitions for more information)
Second Column
RH Relative
Humidity
% % Percentage of water vapor within the air compared to
saturated amount.
WS Wind Speed Metres
per
second
Miles per
hour
The airspeed of the wind travelling across the HSM.
The HSM should be stationary.
P Pressure Kilo-
Pascal’s
Inches of
mercury The atmospheric / barometric air pressure.
MRT Mean
Radiant
Temperature
Degrees
Celsius
Degrees
Fahrenheit MRT is the most important parameter governing human
energy balance. See the definitions section.
Error Results When the HSM range of measurement has been exceeded or the environment conditions where too unstable
the following results may be displayed instead of actual values.
The values TWL, ACP or SR may be displayed as INVALID or OUT OF RANGE depending on space on
the screen.
The wind speed WS value may be displayed as TOO HIGH if above <10 m/s or will be displayed as
UNKNOWN if the wind was too unstable during the Environmental Analysis period.
Data Logging 15
C H A P T E R 5
DATA LOGGING
Datalog Menu
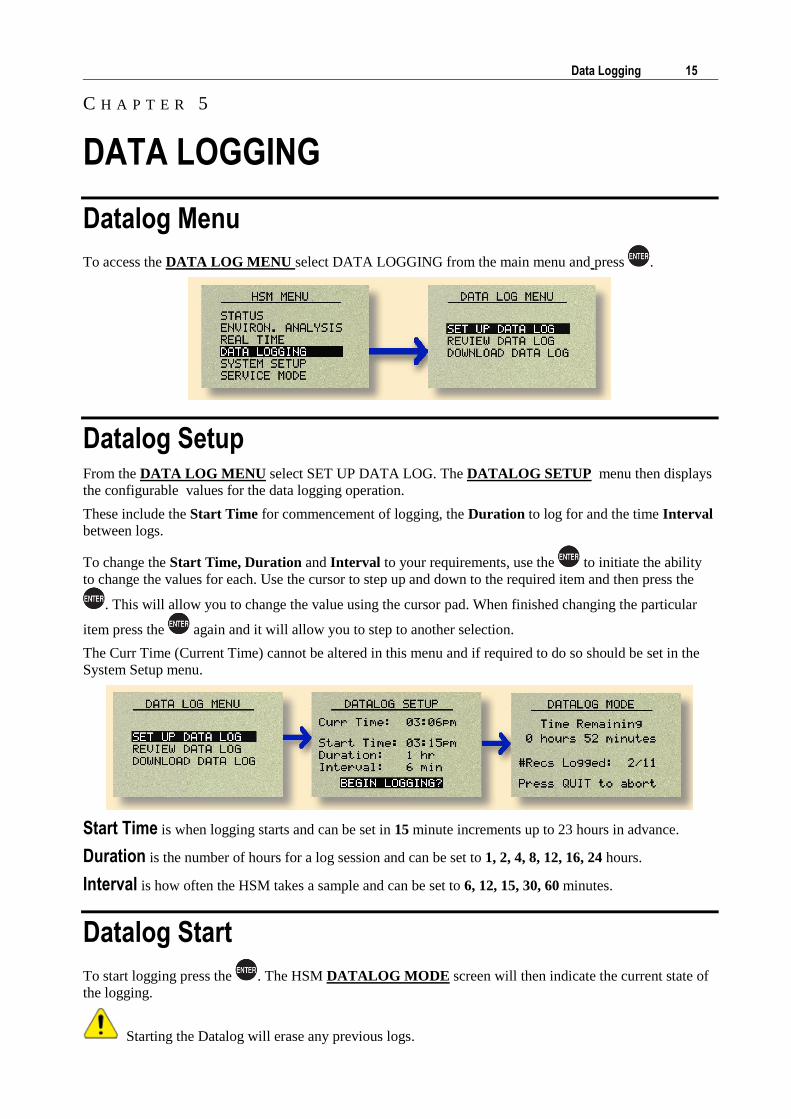
To access the DATA LOG MENU select DATA LOGGING from the main menu and press .
Datalog Setup From the DATA LOG MENU select SET UP DATA LOG. The DATALOG SETUP menu then displays
the configurable values for the data logging operation.
These include the Start Time for commencement of logging, the Duration to log for and the time Interval
between logs.
To change the Start Time, Duration and Interval to your requirements, use the to initiate the ability
to change the values for each. Use the cursor to step up and down to the required item and then press the
. This will allow you to change the value using the cursor pad. When finished changing the particular
item press the again and it will allow you to step to another selection.
The Curr Time (Current Time) cannot be altered in this menu and if required to do so should be set in the
System Setup menu.
Start Time is when logging starts and can be set in 15 minute increments up to 23 hours in advance.
Duration is the number of hours for a log session and can be set to 1, 2, 4, 8, 12, 16, 24 hours.
Interval is how often the HSM takes a sample and can be set to 6, 12, 15, 30, 60 minutes.
Datalog Start
To start logging press the . The HSM DATALOG MODE screen will then indicate the current state of
the logging.
Starting the Datalog will erase any previous logs.

16 Data Logging
This mode has a 30 second screen shutdown mode to save battery power. The screen display will be blank
but can be re-activated by briefly pressing any button on the HSM.
#Recs Logged is the Number of records logged of the number of records to be logged within then duration
selected.
When logging has reached the duration that you have set and finished, the screen will display the total
number of logged records and a message indicating LOGGING COMPLETE.
Datalog Review The REVEW DATA LOG allows each individual log to be viewed. The number of records logged, and the
current record being viewed are displayed at the top of the screen. When you select REVIEW DATA LOG
it will start from the first record in the log.
To view other records use the Cursor pad RIGHT arrow to move forward through the record numbers and
LEFT to step backwards. The UP and DOWN arrows will also step you forwards and backwards to the
required records. Press to return to the DATA_LOG_MENU.
Datalog Download The HSM can be connected to a computer to download logged information captured by the HSM. The data
is presented in a format that can be imported into Microsoft Excel™. When connecting to the PC the screen
shown below will be displayed.
PC Interface A software download package called the HSM Tool v1.0 is available on CD when purchased with the
optional Download Cable. See the “Accessories” section at the end of this manual. This will allow
connection between the HSM and the computer for downloading the logged data.

Data Logging 17
Install the HSM Tool from your CD onto your PC by running the setup.exe then do the following steps.
1. Plug the HSM Download Cable into the side of the HSM and make sure it is connected to a serial port
on your PC (USB Serial Cables also work).
2. Start the HSM Tool Program. The HSM Tool will display the following screen.
3. Select the Serial / COM (communication) port on the Computer you are using from the pull down list.
Then then click on the Get Data Logs From HSM button.
4. Then then click on the Get Data Logs From HSM button.
5. If the HSM is NOT plugged in or the Serial COM Port is incorrect then then a Dialog will then prompt
you to Check serial port and make sure HSM is in DOWNLOAD DATA LOG page. To place the
HSM into download mode see previous section in this manual titled “Datalog Download”.
6. After the utility has transferred the data logs from the HSM it will be display as below.
Communication
Serial Port
Selection
RS-232
Cable

18 Data Logging
7. To save the data as a file. Press the Export Logs as CSV button and the following screen will appear.
8. Give the file a name preferably containing the current date and then press the Open Button to save.
This will then create a CSV file suitable for use with Microsoft Excel™.
You can now open the saved logs with Microsoft Excel or any program that can read CSV formatted files.

Menu System 19
C H A P T E R 6
MENU SYSTEM
The diagram below shows the general structure of the menu system with emphasis placed on the two main
functional groups such as Environmental Analysis and Data Logging.
The SERVICE MODE is for factory calibration only. Pressing any button will exit this mode.

20 Troubleshooting
C H A P T E R 7
TROUBLESHOOTING
The HSM is a sophisticated electronic instrument and whilst it is small and compact it still needs to be
treated as delicate equipment. This means keeping it protected when not in use and with the external
sensors folded back into the HSM case.
Fault finding is confined to a few simple procedures that can be performed by the user.
NO DISPLAY
The HSM will indicate when batteries are getting low. But if they are completely drained then the HSM
cannot display anything. See BATTERY PROBLEMS below.
SENSORS NOT WORKING OR DISPLAYING CORRECTLY
Check that the sensors have not been broken or damaged in any way. It is unlikely that the electronics
would be faulty and more likely to be sensor damage or failure.
The HSM may display a SENSOR ERROR message which will require the HSM to be returned to Calor
Instruments Pty Ltd at the address shown on Page iii of this manual or to your local distributor.
LCD DISCOLOURING
In extreme direct heat the LCD, even though it is a high temperature device may discolour and go dark.
This is normal but if this should happen it is better to provide some form of shade to allow the LCD unit to
cool down. Once cooled down the display will return to normal operation.
DATA LOGGING DOWNLOAD CABLE
The data logging download cable, if purchased, is wired to fit between a HSM and the Serial
communications port (RS-232) of your computer. If you have trouble with the cable not working please
check with your computer manual as it may be wired in a different manner than the HSM standard cable.
BATTERY PROBLEMS
A single flat battery can prevent good batteries from working so either check each battery with a multimeter
or a battery tester if available. If in doubt then replace ALL the batteries with known good ones.
Check that the battery terminal clips on the HSM wires have not been broken or corroded. These are
located in the sealed black rubber cover in the sensor storage void.
Do not leave the batteries in the unit for extended periods – such as longer than 1 year as poor quality
batteries may leak chemicals into the HSM corrode the contacts and even destroy the circuitry.
Use only Alkaline or better batteries as these have longer shelf lives, but even these batteries can leak if
they become fully discharged.
Error Results When the HSM range of measurement has been exceeded or the environment conditions where too
unstable, then several values / results will display errors such as, INVALID, OUT OF RANGE, TOO HIGH
or UNKNOWN. For more information see the paragraph titled Error Results on page 14 within the section
called Understanding the Results.

Glossary 21
Calibration The sensors of the HSM require calibration on a regular basis, preferably annually. This should be
scheduled in a maintenance program to ensure correct information is provided to the user. The calibration
requires specialised equipment to do this and as such the unit should be returned to your distributor or to
Calor Instruments Pty Ltd at the address shown on Page iii of this manual.
GLOSSARY
Terms and Abbreviations
ACP Air Cooling Power
BGT Black Globe Temperature. Measurement of Radiated / solar temperature.
Celsius The Metric unit of temperature also known as Centigrade. °C = (°F − 32) × 5⁄9
CD CD-ROM. Compact Disk – Read Only Memory.
COM Communication. Usually Communications port such as serial.
CSV Comma Separated Values
DB Dry Bulb (Ambient Temperature value)
Fahrenheit The Imperial / English unit of temperature. °F = °C × 9⁄5 + 32
G Globe. See BGT
grams Metric (SI) unit of mass
HSM Heat Stress Monitor
Kilopascal 1000 Metric Pascal units of air pressure
LCD Liquid Crystal Display
m Metres
Metric Metric System of Measurement. (See SI)
Miles Imperial unit of distance
MRT Mean Radiant Temperature
NIOSH National Institute for Occupational Safety and Health
P Pressure. (The atmospheric / barometric air pressure)
Pascal Metric unit of Air pressure
PC Personal Computer
RH Relative Humidity. See Definitions for more information.
Relative Humidity Percentage of humidity. The amount of water vapor within the air.
RS-232 Recommended Standard 232. A standard of serial communications for computers.
SI International System of Units
SR Sweat Rate
TWL Thermal Work Limit
USARIEM United States Army Research Institute of Environmental Medicine

22 Definitions
W Watt. Derived unit of power. One watt is equivalent to 1 joule of energy per
second.
WB Wet Bulb
WBGT Wet Bulb Globe Temperature
WS Wind Speed
DEFINITIONS
Acclimatisation It has been well documented that when people work in a hot environment for the first time, their work
performance is reduced, their heart rate and core temperature increases, and they are more prone to heat
disorders, such as heat syncope and heat exhaustion and the far more serious condition of heat stroke.
Acclimatisation advantages a person by:
Increasing the plasma volume by up to 25%.
Reducing the sodium lost in sweat by up to 50%
Increasing the sweat rate
Initiating sweat onset earlier
Redistributing blood to the periphery more efficiently.
Production of heat shock proteins which reduces thermal injury to cells.
The duration of time it takes to bring about these adaptive changes varies depending on whether the person
is active in the heat and the duration of heat exposure. It is generally thought that 4-5 days is sufficient to
acquire a good percentage of the advantageous adaptation however, to fully acclimatise takes at least 14
days exposure.
A new worker may require work hardening and/or acclimatisation prior to commencing a physically
demanding job in a hostile climate; recognition of this must be incorporated into heat management
protocols.
Reference: www.pointhealth.com.au/pdf/heat%20illness
Air Cooling Power Is the cooling power of the air on a sweating person, measured in watts per square meter of body surface
area. Clothing has a major impact on the ability of the body to cool itself via sweating as the following Air
Cooling Power calculations shows:
Environmental conditions: 28º C wet bulb air temperature, air speed 1 m/s:
ACP for unclothed body 313 W/m2
ACP for lightly clothed body 168 W/m2
ACP for heavily clothed body. 127 W/m2
Key issues for clothing include: fabric vapour permeability and conductivity, clothing design (ventilation,
e.g. “bagginess”), amount of clothing and type of personal protective equipment. For example. Wearing
leather boots is better than impermeable rubber boots.
Dew Point The dew point is the temperature to which a given parcel of humid air must be cooled, at constant
barometric pressure, for water vapour to condense into water. The condensed water is called dew. The dew
point is a saturation temperature.

Definitions 23
The dew point is associated with relative humidity. A high relative humidity indicates that the dew point is
closer to the current air temperature. Relative humidity of 100% indicates the dew point is equal to the
current temperature and the air is maximally saturated with water. When the dew point remains constant
and temperature increases, relative humidity will decrease.
Dry-Bulb Temperature The dry-bulb temperature is the temperature of air measured by a thermometer freely exposed to the air but
shielded from radiation and moisture. Dry bulb temperature is the temperature that is usually thought of as
air temperature, and it is the true thermodynamic temperature.
Mean Radiant Temperature (MRT) Is defined as the uniform temperature of a surrounding surface giving off blackbody radiation (emissivity e
= 1) which results in the same radiation energy gain on a human body as the prevailing radiation fluxes
which are usually very varied under open space conditions.
MRT is the most important parameter governing human energy balance, especially on hot sunny days.
MRT also has the strongest influence on thermo physiological comfort indexes such as PET (Physiological
Equivalent Temperature) or PMV (Predicted Mean Vote) which are derived from heat exchange models.
Another definition of MRT is the MRT of non-uniform environment (e.g., walls, overhead, deck and
objects of different emissivity at different temperatures) is defined as the temperature of a uniform black
enclosure in which a solid body or an occupant would exchange the same amount of radiant heat as in the
given non-uniform environment. It is estimated from dry-bulb and globe temperatures and air movement
and is useful in determining radiative heat transfer (net gain or loss) relative to humans.
Relative Humidity The relative humidity of an air-water mixture is defined as the ratio of the partial pressure of water vapour
in the mixture to the saturated vapour pressure of water at a prescribed temperature. Relative humidity is
expressed as a percentage and is defined in the following manner.
Where:
RH is the relative humidity of the mixture being considered;
P(H2O) is the partial pressure of water vapour in the mixture; and
P*(H2O) is the saturated vapour pressure of water at the temperature of the mixture.
Thermal Work Limit Thermal Work Limit is a heat stress index designed primarily for self-paced workers. It represents the
limiting sustainable metabolic rate that a well hydrated, acclimatised worker can maintain in a specific
thermal environment within safe limits of core body temperature and sweat rate.

24 Definitions
Wet Bulb Temperature (WB) The wet-bulb temperature is a type of temperature measurement that reflects the physical properties of a
system with a mixture of a gas and a vapour, usually air and water vapour.
For air that is less than saturated (100 percent relative humidity), the wet-bulb temperature is lower than the
dry-bulb temperature; and the dew point temperature is less than the wet-bulb temperature.
Cooling of the human body through perspiration is inhibited as the wet-bulb temperature (and relative
humidity) of the surrounding air increases.
Wet Bulb Globe Temperature (WBGT) The wet bulb globe temperature (WBGT) is a calculated temperature that was developed in the late 1950’s
for the US Marine Corps Recruit Depot on Parris Island South Carolina, to minimize heat stress during
training. The index is calculated by measuring the natural wet bulb, globe temperature and dry bulb
temperature. The calculated WBGT values are compared to reference values corresponding to different
metabolic workloads to establish if the environment is excessive given the task being performed. Should the
environment be excessive a work/rest cycling can be implemented for work to continue. The value is a time
weighted average (TWA) based on the different tasks a particular person may perform over the shift. Some
of the benefits of the WBGT are; it is relatively easy to measure, the instrumentation is simple and not
excessively expensive. WBGT values are now used in the ISO 7243 standard and by NIOSH to set work
limits.

Specifications 25
SPECIFICATIONS
Physical Max Dimensions: 120mm x 94mm x 45mm (Due to the shape its volume is less)
Weight: 370grams (with batteries)
LCD: 119 x 73 pixel graphics
Electrical Uses four standard AA-sized, 1.5V, alkaline batteries.
Serial RS-232 Interface
The HSM uses the battery at different rates depending on the mode of operation as follows:
Mode Average Current Drain NOTES
Off 0 milliamps
Logging < 1 milliamp per hour
(averaged over 1 hour)
Most battery efficient mode. The HSM only wakes
up for a few milliseconds on each periodic to take a
sample.
Menus 10 milliamps Used when navigating through menus or reviewing,
logs and results.
Backlight 20 milliamps Backlight adds 20 milliamps to all display modes.
Real-Time Display 90 milliamps This mode should be used sparingly
This table is a guide to the best way to operate the unit to maximise battery life.
Sensor Dry bulb = ± 0.2 °C from 5-55 °C
Globe = ± 0.2 °C from 5-70 °C
Relative Humidity = ± 2% from 0-95% non condensing
Pressure = ± 1.5 KPA from 40-115 KPA
Wind speed = ± 0.2 m/sec or 10%, whichever is the greater, from 0.1-8.0 m/sec

26 Accessories
ACCESSORIES
HSM Manuals and Utilities CD (Software) Order Code: HSM CD
Replacement Sensor Module Order Code: HSM Sensor
DC Plug Pack & Download Cable – 2mtrs Order Code: HSM Serial [Cable – Plugpack]
Download Cable (Serial) – 2mtrs Order Code: HSM Serial [Cable]
Hard Case Order Code: HSM Case [Hard]
- Automatic Pressure Equalization Valve - Waterproof O-Ring Seal
- Easy Open Double-Throw Latches - Exterior Dimensions: 206 x 167 x 90 mm
Tripod (Large) Order Code: HSM Tripod[Lge]
Tripod (Small) Order Code: HSM Tripod [Sml]
Recalibration Service Order Code: HSM Recal
Tripod mounting plate Order Code: HSM Tripod[MP]
- 3 way head with QR plate - Flip leg locking system - Max Height: 1305mm - Min Height: 420mm - Closed Length: 445mm - Weight: 0.86kg - Load Capacity: 3.0kg
- Max Height: 210mm - Min Height: 125mm - Closed Length: 130mm - Weight: 0.1kg - Load Capacity: 1.0kg
Fits any tripod with a 1/4BSW thread
USB to RS232 Converter
Order Code: PID 8523
- Australian Format Plugpack AS3112 90V - 265V AC (Adaptor required for Countries other than
Australia)

Notes 27
NOTES
FOR YOU RECORDS AND FOR QUOTING WHEN SUPPORT OR REPAIR IS REQUIRED
Please enter your HSM Serial Number here. The Serial Number can be found on the inside of the battery
pack.
HSM Serial No ……………….………….……
Date of purchase ………………………………
Calibration Record.
Date. Calibrated by: Calibration Ref. No.
…..……..……. ………………………………. …..……………………
…..……..……. ………………………………. ………………..………
…..……..……. ………………………………. ……………..…………
…..……..……. ………………………………. …………..……………
…..……..……. ………………………………. …………..……………
…..……..……. ………………………………. …………..……………
…..……..……. ………………………………. ………..………………
…..……..……. ………………………………. …………..……………
…..……..……. ………………………………. ……………..…………
…..……..……. ………………………………. …………..……………