
Virtual Test Drive 2013 Infiniti QX56 Review – Egg Harbor Township, NJ 08234

Heat Release CapacityRichard N. Walters
Galaxy Scientific Corporation2500 English Creek AvenueEgg Harbor Township, NJ 08234
Richard E. LyonFederal Aviation
AdministrationFire Safety Section AAR-422
W.J. Hughes Tech CenterA.C Int’l Airport, NJ 08405

Outline
Background– Flammability Testing & Fire Processes– PCFC Instrument Description
Theory– PCFC– Heat Release Capacity– Fire Test Theory & Correlations– Molar Group Contributions
Conclusions
Flammability Testing
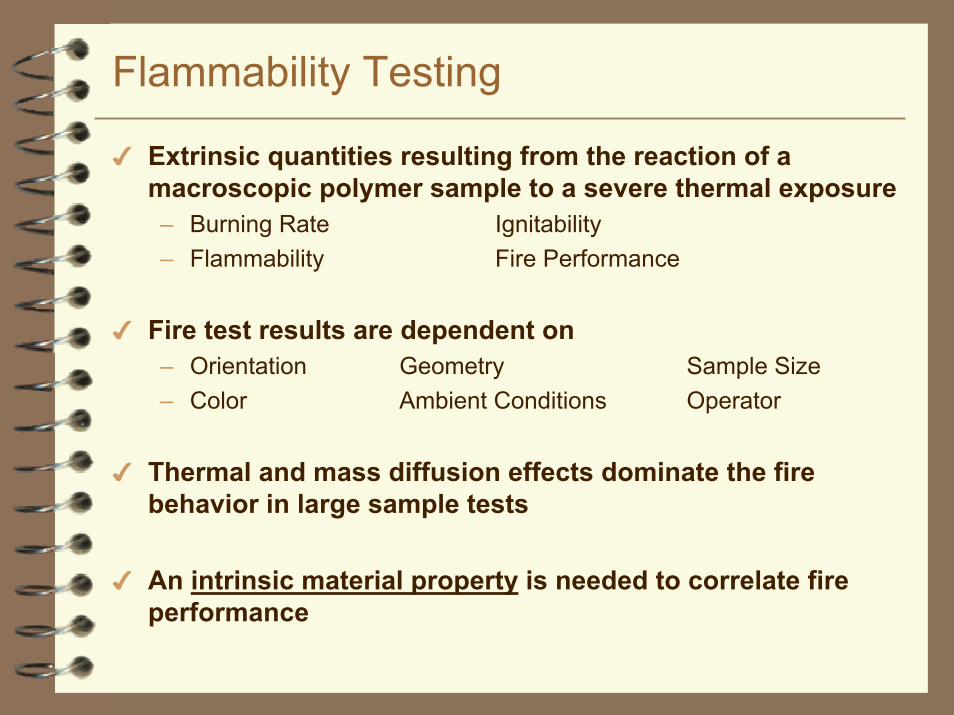
Extrinsic quantities resulting from the reaction of a macroscopic polymer sample to a severe thermal exposure– Burning Rate Ignitability– Flammability Fire Performance
Fire test results are dependent on– Orientation Geometry Sample Size– Color Ambient Conditions Operator
Thermal and mass diffusion effects dominate the fire behavior in large sample tests
An intrinsic material property is needed to correlate fire performance

Fuel Generation Process
Pyrolysis Combustion
Combustible & Non-Combustible Gases
Polymer
Thermal feedback from flame
Liquid Products & Tar
Solid Charred Residue
+ O2 Flame∆
Endothermic Exothermic
Char Formation
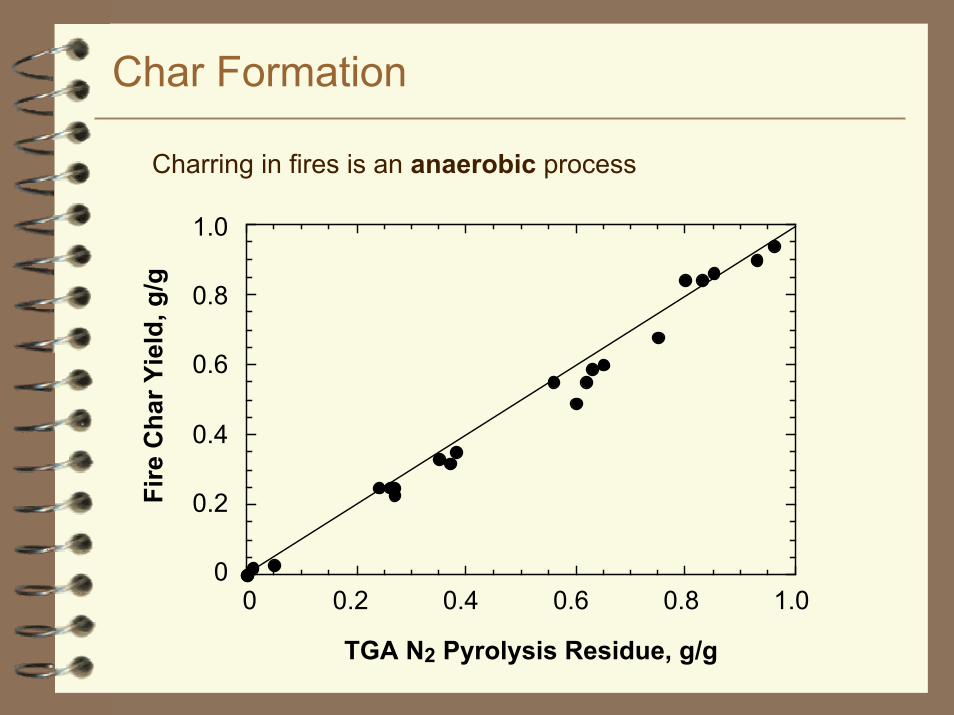
Charring in fires is an anaerobic process
0
0.2
0.4
0.6
0.8
1.0
0 0.2 0.4 0.6 0.8 1.0
Fire
Cha
r Yie
ld, g
/g
TGA N2 Pyrolysis Residue, g/g

Microcalorimeter Schematic
Pyrolysis Combustion
Sample
Pyrolyzer Combustor Scrubbers FlowMeter
O2Analyzer
O2N2
DAQ
Exhaust
Pyrolysis-Combustion Flow Calorimeter
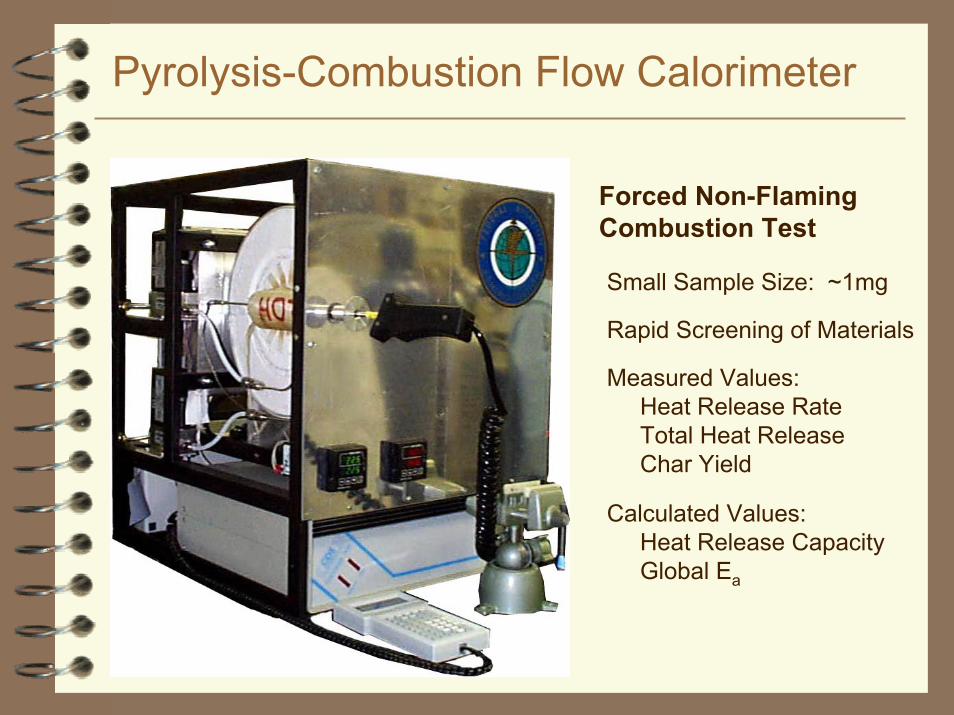
Forced Non-Flaming Combustion Test
Small Sample Size: ~1mg
Rapid Screening of Materials
Measured Values:Heat Release RateTotal Heat ReleaseChar Yield
Calculated Values:Heat Release CapacityGlobal Ea

Measured Heat Release Rates
0
500
1000
1500
2000
2500
3000
3500
4000
0 50 100 150 200 250 300 350
Mic
rosc
ale
Hea
t Rel
ease
Rat
e (W
/g)
Time (seconds)
Polyethylene
Polypropylene
Polystyrene
ABS
PMMA
PET
PEEK
PBI
Microcalorimeter Theory
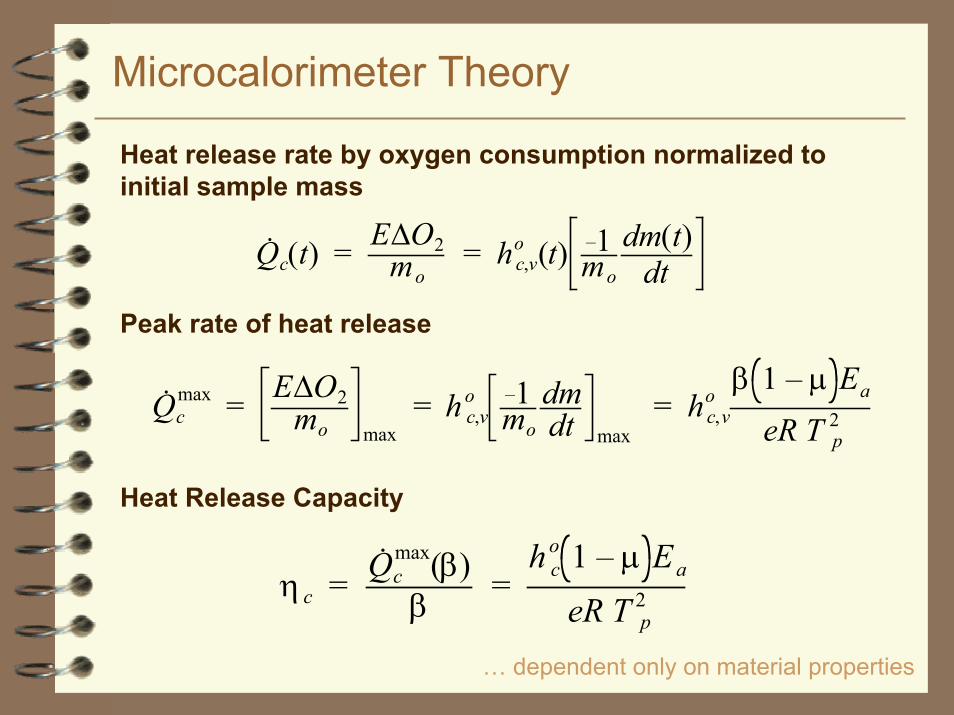
Heat release rate by oxygen consumption normalized to initial sample mass
Qc(t) = E∆O2
mo= h c,v
o (t) –1mo
dm(t)dt
Peak rate of heat release
Qcmax = E∆O2
mo max= h c,v
o –1mo
dmdt max
= hc,vo
β 1 – µ Ea
eR T p2
Heat Release Capacity
η c = Qcmax(β)β =
h co 1 – µ Ea
eR T p2
… dependent only on material properties

Material Property
Must satisfy the following conditions:
1. Independent of sample mass
2. Independent of heating rate
3. Measurable by different methods

Heat Release Capacity by TGA-GC/MS
0
500
1000
1500
2000
0 500 1000 1500 2000
Hea
t Rel
ease
Cap
acity
(PC
FC),
J/g-
K
β =
260
K/m
in
Heat Release Capacity (TGA-GC/MS), J/g-K β = 10 K/min
PP
PS
poly(α-methyl)styrene
PPONylon 66
PCPET
POM
PEEKKEVLAR
PPS
PI
PE1:1 Line
T.V. Inguizilian, Correlating Polymer Flammability Using Measured Pyrolysis Kinetics, MS Thesis, University of Massachusetts, Amherst, January 1999.

Flammability Character - UL-94V vs. LOI UL-94 - Vertical Bunsen Burner test based on operator observation
where materials are classified by their burning behavior
Oxygen Index - Minimum amount of oxygen needed to sustaina candle-like flame for 3 minutes based on operator observation
UL-94 LOIXXXXX
X
X
Vertical TestPreheating of sampleRadiant componentConvective componentConductive component
Upward versus Downward flame spread
UL-94 LOI
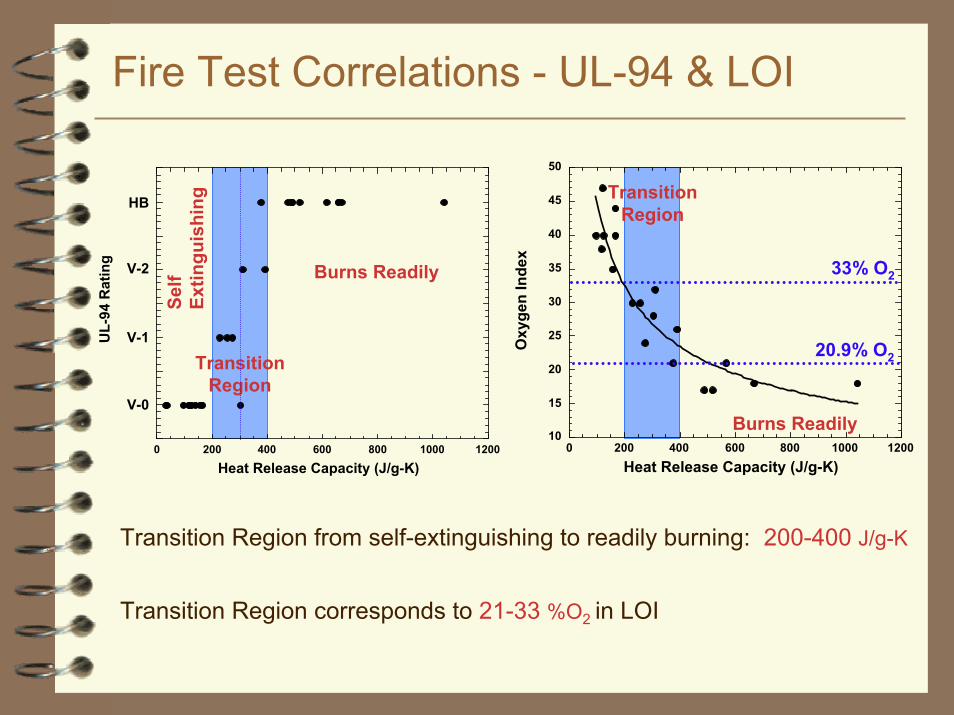
Fire Test Correlations - UL-94 & LOI
0 200 400 600 800 1000 1200
UL-
94 R
atin
g
Heat Release Capacity (J/g-K)
V-0
V-1
V-2
HB
Self
Extin
guis
hing
TransitionRegion
Burns Readily
10
15
20
25
30
35
40
45
50
0 200 400 600 800 1000 1200
Oxy
gen
Inde
x
Heat Release Capacity (J/g-K)
TransitionRegion
Burns Readily
20.9% O2
33% O2
Transition Region from self-extinguishing to readily burning: 200-400 J/g-K
Transition Region corresponds to 21-33 %O2 in LOI

Cone Calorimeter
Bench Scale Flaming Combustion Test
Sample Dimensions:10cm x 10 cm x 0.3cm
0-100 kW/m2 incident heat flux
Measured Values:heat release rate - O2 consumptionmass loss ratetime to ignitionCO & CO2smoke generation
Calculated Values:critical heat fluxheat of gasificationignition temperaturethermal inertia (κρc)
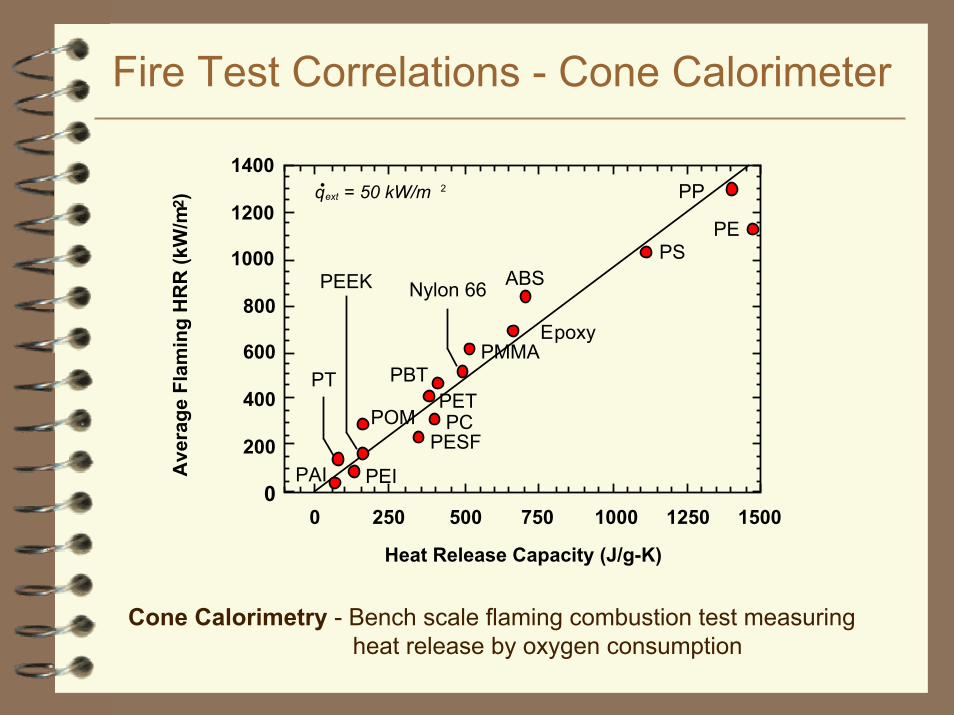
Fire Test Correlations - Cone Calorimeter
0
200
400
600
800
1000
1200
1400A
vera
ge F
lam
ing
HR
R (k
W/m
2 )
Heat Release Capacity (J/g-K)
250 15000 500 750 1000 1250
POM
PEPS
ABS
PBTPMMA
PESF
PEI
Nylon 66
Epoxy
PAI
PC
PEEK
PTPET
PPqext = 50 kW/m• 2
Cone Calorimetry - Bench scale flaming combustion test measuringheat release by oxygen consumption
Fire Test Summary
Fire Tests– Flaming combustion tests where physical attributes
influence the flammability– Samples can be designed to give false passes in the tests– Tests are hard to run and do not give quantitative results– Multiple tests and rigorous calculations needed to obtain
material properties
PCFC– Provides a material property directly– Quantitative results that represent the total fuel value of a
sample– Quick & easy to run
Group Contribution BackgroundMethods for predicting thermochemical data from molecular structure (Bensen 1968)
Interactions of several atoms summed and approximated by structural groups (VanKrevelen 1972)
Atomic-level bond topology used to predict molecular properties using connectivity indices (Bicerano, 1996)
Structural group contribution method for flammability (Walters 2000)
Group Contribution calculations can predict thermodynamic quantities such as:
– Heat of Combustion - Thermal Decomposition Temperature– Char Yield - Glass Transition Temperature– Heat Capacity
Theories of group contributions based on empirical correlations
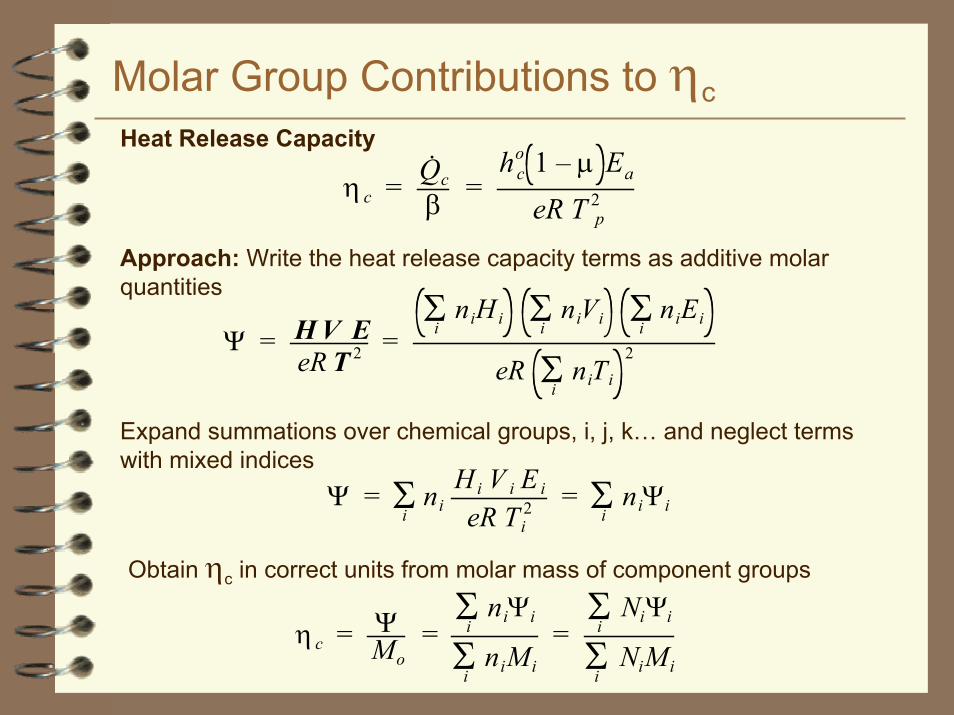
Molar Group Contributions to ηcHeat Release Capacity
η c = Qc
β =hc
o 1 – µ Ea
eR T p2
Approach: Write the heat release capacity terms as additive molar quantities
Ψ = H V EeR T 2 =
niHiΣi
niViΣi
niEiΣi
eR niTiΣi
2
Expand summations over chemical groups, i, j, k… and neglect terms with mixed indices
Ψ = niHi V i Ei
eR Ti2 = niΨiΣ
iΣi
Obtain ηc in correct units from molar mass of component groups
η c = ΨMo
=niΨiΣ
i
niMiΣi
=NiΨiΣ
i
NiMiΣi

Calculating Heat Release Capacity
If ηc is a material property it should be calculable from additive molar group contributions like other polymer properties (e.g., heat capacity, refractive index, solubility parameter, etc.)
CH2CH CH2 O C O
OCH2 CH
CH2 O
CH3
CH3
Example: Bisphenol A Epoxy has 6 distinct chemical groupscomprising the polymer repeat unit.
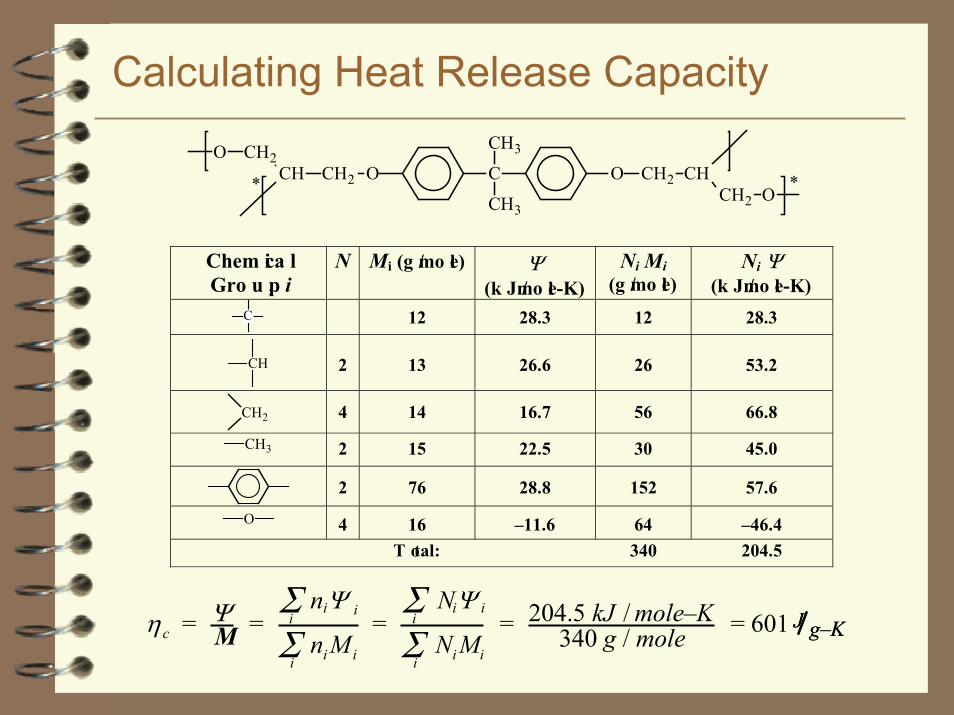
Calculating Heat Release Capacity
CH2CH CH2 O C
CH3
CH3
OO
CH2 CHCH2 O* *
ηc = Ψ
M =niΨ iΣ
i
niMiΣi
=NiΨ iΣ
i
NiMiΣi
= 204.5 kJ / mole–K340 g / mole = 601 J g–KJ g–K
Chem ica lGro u p, i
N Mi (g /mo le) Ψ(k J /mo le-K)
Ni Mi(g /mo le)
Ni Ψ(k J /mo le-K)
C 12 28.3 12 28.3
CH 2 13 26.6 26 53.2
CH2 4 14 16.7 56 66.8
CH3 2 15 22.5 30 45.0
2 76 28.8 152 57.6
O 4 16 –11.6 64 –46.4T otal: 340 204.5
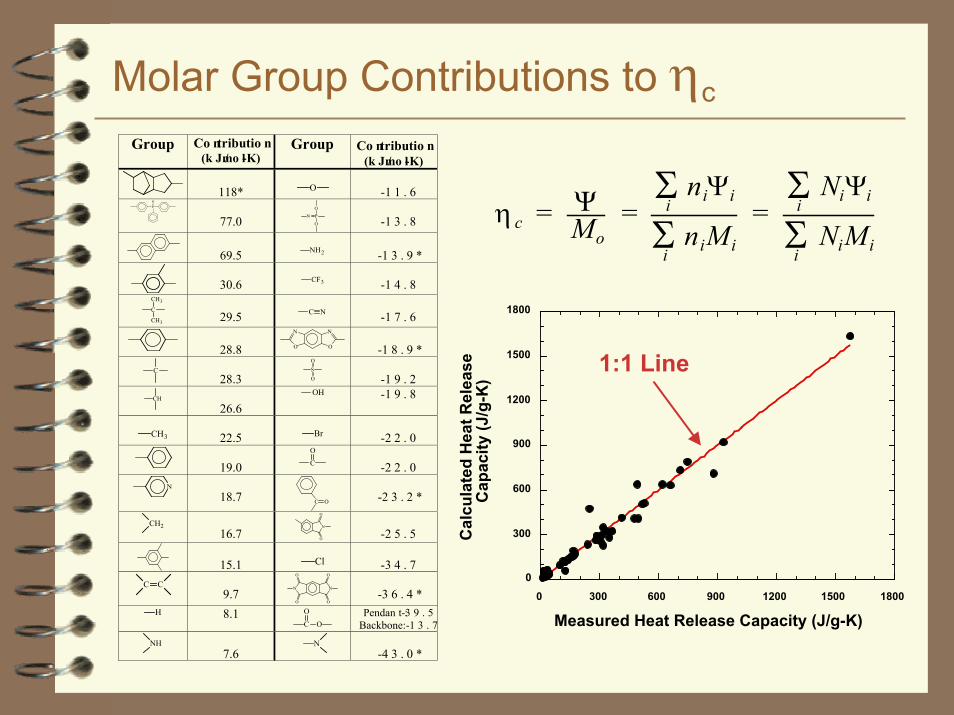
Molar Group Contributions to ηc
η c = Ψ
Mo=
niΨiΣi
niMiΣi
=NiΨiΣ
i
NiMiΣi
0
300
600
900
1200
1500
1800
0 300 600 900 1200 1500 1800
Cal
cula
ted
Hea
t Rel
ease
C
apac
ity (J
/g-K
)
Measured Heat Release Capacity (J/g-K)
Group Co ntributio n(k J /mo l-K)
Group Co ntributio n(k J /mo l-K)
118*
O -1 1 . 6 P
O
77.0
PN
O
O -1 3 . 8
69.5
NH2 -1 3 . 9 *
30.6
CF3 -1 4 . 8 C
CH3
CH3 29.5
C N -1 7 . 6
28.8 O
NN
O -1 8 . 9 * C
28.3
SO
O -1 9 . 2 CH
26.6
OH -1 9 . 8
CH3 22.5
Br -2 2 . 0
19.0
C
O
-2 2 . 0 N
18.7
C O -2 3 . 2 *
CH216.7
N
O
O -2 5 . 5
15.1
Cl -3 4 . 7 C C
9.7
N
O
O
N
O
O-3 6 . 4 *
H 8.1
C
O
OPendan t :-3 9 . 5
Backbone:-1 3 . 7 NH
7.6
N
-4 3 . 0 *
1:1 Line
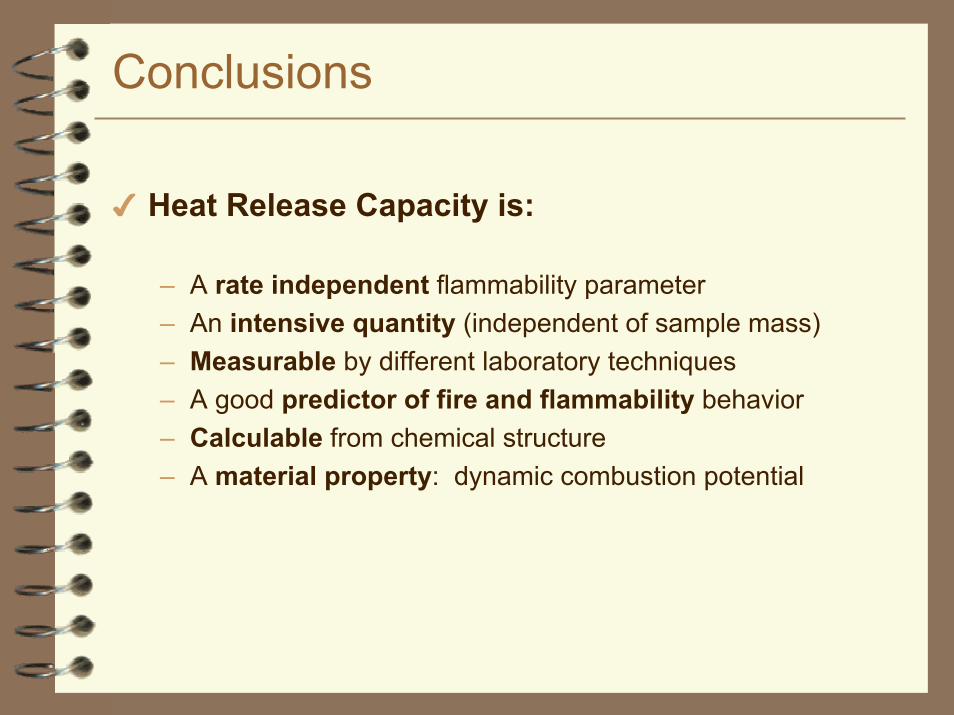
Conclusions
Heat Release Capacity is:
– A rate independent flammability parameter– An intensive quantity (independent of sample mass)– Measurable by different laboratory techniques– A good predictor of fire and flammability behavior– Calculable from chemical structure– A material property: dynamic combustion potential

Acknowledgements
FAA
Dr. Stanislav Stoliarov