Heat Pump Water Heaters Demonstration...
18
Heat Pump Water Heaters Demonstration Project Building America Stakeholder Meeting Ron Domitrovic Ammi Amarnath 3/1/2012 Austin, TX
Transcript of Heat Pump Water Heaters Demonstration...
Heat Pump Water Heaters Demonstration Project
Building America Stakeholder Meeting
Ron Domitrovic Ammi Amarnath
3/1/2012Austin, TX

2© 2011 Electric Power Research Institute, Inc. All rights reserved.
HPWH Field Demonstration:Research Objectives
• Assess heat pump water heater technology by measuring efficiency.
• Provide credible data on the performance and reliability of heat pump water heaters.
• Assess user satisfaction in a residential setting.

3© 2011 Electric Power Research Institute, Inc. All rights reserved.
Demonstration Host UtilitiesTarget: 40 Units per Utility
Installed and Potential Sites by
Climate Zone
Source: Department of Energy (DOE), Building America climate regions

4© 2011 Electric Power Research Institute, Inc. All rights reserved.
Installation Locations—Southern Company Region
Alabama Power
Georgia Power
Gulf Power
Mississippi
Power
5© 2011 Electric Power Research Institute, Inc. All rights reserved.
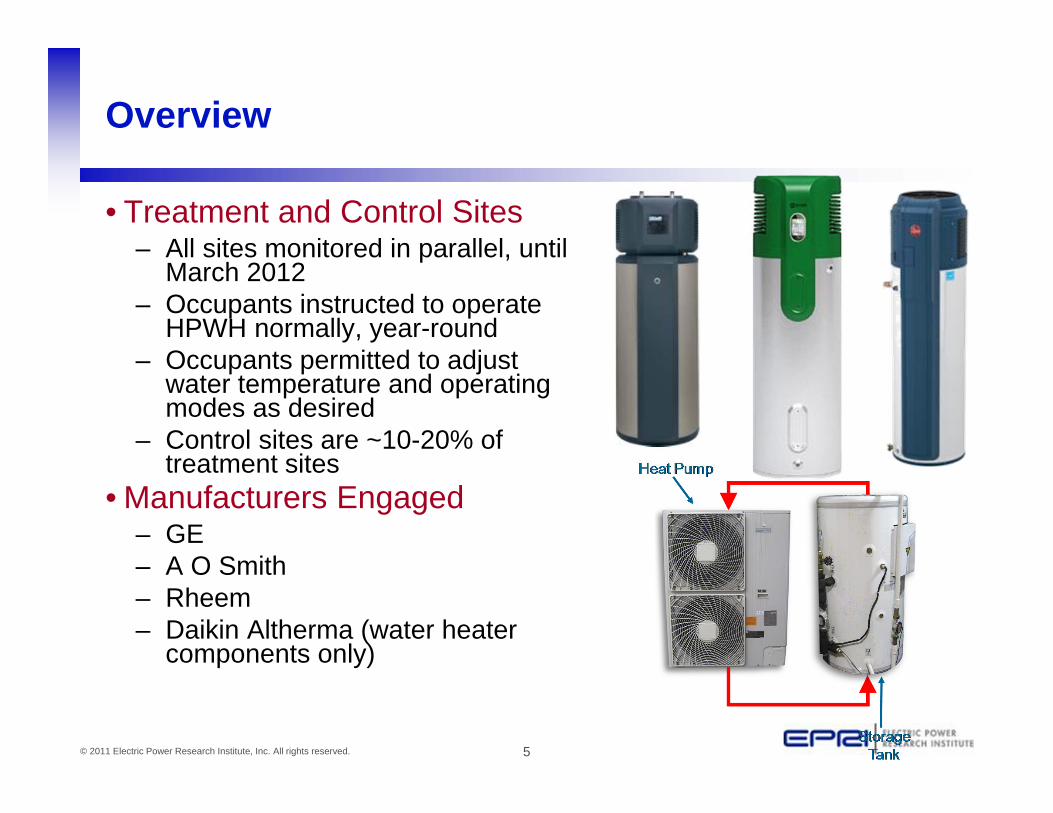
Overview
• Treatment and Control Sites– All sites monitored in parallel, until
March 2012– Occupants instructed to operate
HPWH normally, year-round– Occupants permitted to adjust
water temperature and operating modes as desired
– Control sites are ~10-20% of treatment sites
• Manufacturers Engaged– GE– A O Smith– Rheem– Daikin Altherma (water heater
components only)

6© 2011 Electric Power Research Institute, Inc. All rights reserved.
Full Instrumentation Package
Power meter (measures electricity of both
whole house and water heater)
Water meter2 thermistor immersion probes (for water inlet and
outlet temps)
WiFi base station (plugs into home
router)
Data-acquisition panel (data logger, ambient temp/humidity, and WiFi repeater), 24”x14”
3 CTs (2 for whole house, 1
for water heater)

7© 2011 Electric Power Research Institute, Inc. All rights reserved.
Installation Locations – Diverse
Attic Garage Conditioned Space
8© 2011 Electric Power Research Institute, Inc. All rights reserved.
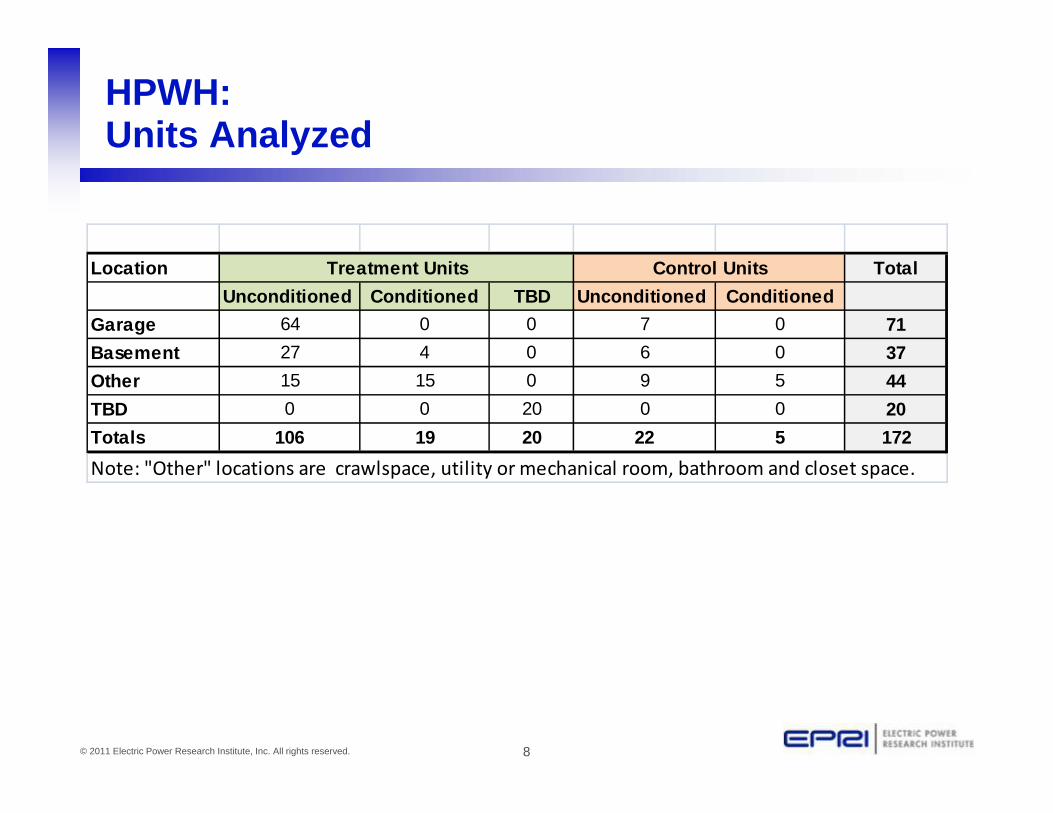
HPWH:Units Analyzed
Location TotalUnconditioned Conditioned TBD Unconditioned Conditioned
Garage 64 0 0 7 0 71Basement 27 4 0 6 0 37Other 15 15 0 9 5 44TBD 0 0 20 0 0 20Totals 106 19 20 22 5 172Note: "Other" locations are crawlspace, utility or mechanical room, bathroom and closet space.
Treatment Units Control Units

9© 2011 Electric Power Research Institute, Inc. All rights reserved.
Monthly COP vs. Ambient Temp for Most Sites,January 2011
Preliminary Results
0.0
1.0
2.0
3.0
4.0
5.0
40.0 45.0 50.0 55.0 60.0 65.0 70.0 75.0 80.0Monthly Average of the Temperature Measured Near the HPWH (°F)
Mon
thly
CO
P
Each Bubble Represents a Unique SiteBubble Size Approximates the Average Amount of Water Use per Day

10© 2011 Electric Power Research Institute, Inc. All rights reserved.
Monthly COP vs. Ambient Temp for Most Sites, January 2011
Preliminary Results
0.0
1.0
2.0
3.0
4.0
5.0
40.0 45.0 50.0 55.0 60.0 65.0 70.0 75.0 80.0Monthly Average of the Temperature Measured Near the HPWH (°F)
Mon
thly
CO
P
Model AModel BModel C
Each Bubble Represents a Unique SiteBubble Size Approximates the Average Amount of Water Use per Day
11© 2011 Electric Power Research Institute, Inc. All rights reserved.
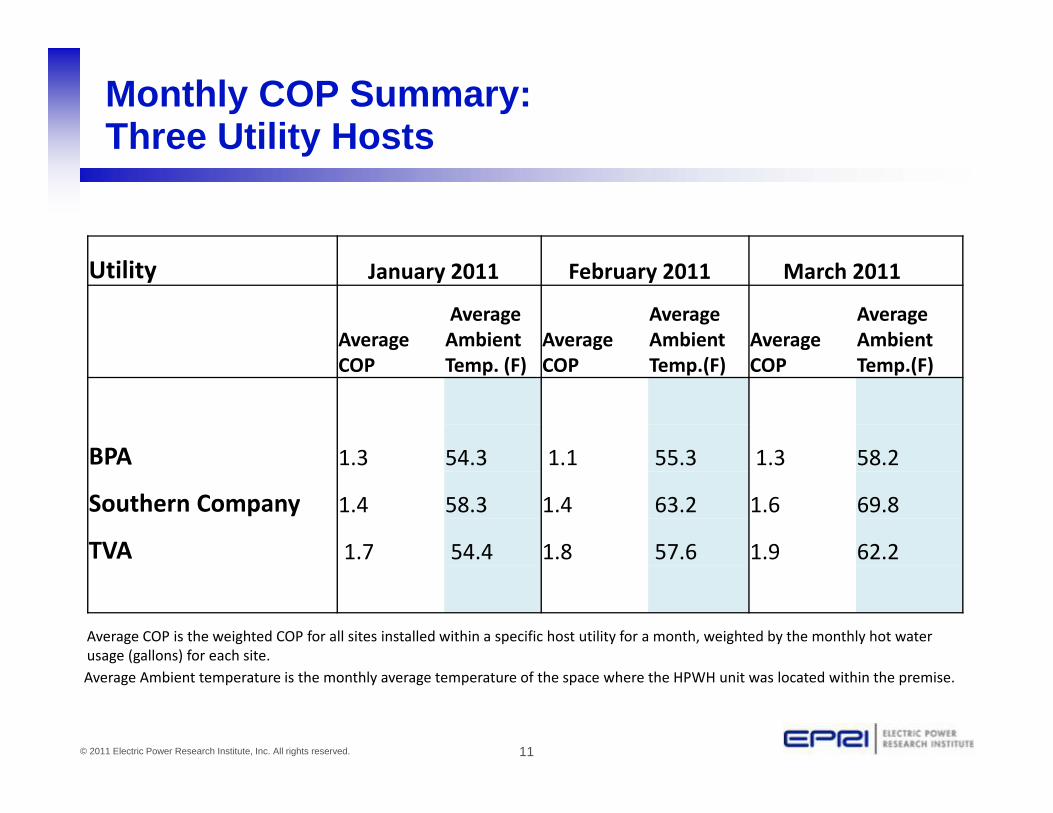
Monthly COP Summary:Three Utility Hosts
Utility January 2011 February 2011 March 2011
Average COP
Average Ambient Temp. (F)
Average COP
Average Ambient Temp.(F)
Average COP
Average Ambient Temp.(F)
BPA 1.3 54.3 1.1 55.3 1.3 58.2
Southern Company 1.4 58.3 1.4 63.2 1.6 69.8
TVA 1.7 54.4 1.8 57.6 1.9 62.2
Average COP is the weighted COP for all sites installed within a specific host utility for a month, weighted by the monthly hot water usage (gallons) for each site.Average Ambient temperature is the monthly average temperature of the space where the HPWH unit was located within the premise.

12© 2011 Electric Power Research Institute, Inc. All rights reserved.
Six Month COP Trend
Preliminary Results
Values above the bars show monthly Average Ambient temperature for unconditioned and conditioned sites.

13© 2011 Electric Power Research Institute, Inc. All rights reserved.
Coincident Peak Demand in Winter (System Peak Day)
Negligible impact on coincident peak demand in winter .Preliminary Results
Average Ambient temperature = 49 ° F
14© 2011 Electric Power Research Institute, Inc. All rights reserved.
Customer Satisfaction Survey
• Two HPWH post-installation surveys:– 1st was fielded in ~October 2010– 2nd was fielded in June 2011
• 28 and 33 Southern Company respondents respectively
• Survey gathered opinions regarding:– Satisfaction with:
• Water heater performance• Installation process
– Whether they noticed a difference in:• Hot water• Noise level• Temperature around water heater• Water or moisture on the floor

15© 2011 Electric Power Research Institute, Inc. All rights reserved.
Overall Satisfaction
Comments from those who “not satisfied”……from 1st survey:• “Water does not get very hot nor does it last more than
1 shower or 1 tub fill up.”–Distribution company worked with customer to rectify
issue…from 2nd survey (different respondent):• “…it takes up too much room and it is loud when it
comes on.”
Majority of respondents were satisfied with their new water heaters (from 1st and 2nd surveys).
Summary Statement

16© 2011 Electric Power Research Institute, Inc. All rights reserved.
Noticed a Difference with New Water Heater—Initially
For those that noticed a difference:• Some cited favorable reasons:
– Themes: More hot water, faster recovery, constant temperature
• Others cited unfavorable reasons: – Themes: Water not hot enough, not enough hot
water, slower recovery
Less than half noticed a difference with their new water heater (from 1st survey).
Summary Statement

17© 2011 Electric Power Research Institute, Inc. All rights reserved.
Questions?
18© 2011 Electric Power Research Institute, Inc. All rights reserved.
Together…Shaping the Future of Electricity
Questions?