Heat Generation Measurements of Prismatic Lithium Ion ...
98
Heat Generation Measurements of Prismatic Lithium Ion Batteries by Kaiwei Chen A thesis presented to the University of Waterloo in fulfilment of the thesis requirement for the degree of Master of Applied Science in Mechanical Engineering Waterloo, Ontario, Canada, 2013 c Kaiwei Chen 2013
Transcript of Heat Generation Measurements of Prismatic Lithium Ion ...
Heat Generation Measurements of
Prismatic Lithium Ion Batteries
by
Kaiwei Chen
A thesis
presented to the University of Waterloo
in fulfilment of the
thesis requirement for the degree of
Master of Applied Science
in
Mechanical Engineering
Waterloo, Ontario, Canada, 2013
c© Kaiwei Chen 2013

I hereby declare that I am the sole author of this thesis. This is a true copy of the thesis,
including any required final revisions, as accepted by my examiners.
I understand that my thesis may be made electronically available to the public.
ii

Abstract
Electric and hybrid electric vehicles are gaining momentum as a sustainable alternative to
conventional combustion based transportation. The operating temperature of the vehicle
will vary significantly over the vehicle lifetime and this variance in operating temperature
will strongly impact the performance, driving range, and durability of batteries used in the
vehicles.
In the first part of this thesis, an experimental facility is developed to accurately quan-
tify the effects of battery operating temperature on discharge characteristics through pre-
cise control of the battery operating temperatures, utilizing a water-ethylene glycol solu-
tion in a constant temperature thermal bath. A prismatic 20Ah LiFePO4 battery from
A123 is tested using the developed method, and temperature measurements on the battery
throughout discharge show a maximum variation of 0.3C temporally and 0.4C spatially
at a 3C discharge rate, in contrast to 13.1C temperature change temporally and 4.3C
spatially when using the conventional air convection temperature control method under
the same test conditions. A comparison of battery discharge curves using the two methods
show that the reduction in spatial and temporal temperature change in the battery has
a large effect on the battery discharge characteristics. The developed method of battery
temperature control yields more accurate battery discharge characterization due to both
the elimination of state-of-charge drift caused by spatial variations in battery tempera-
ture, and inaccurate discharge characteristics due to battery heat up at various discharge
and ambient conditions. Battery discharge characterization performed using the developed
method of temperature control exhibits a reduction in battery capacity of 95% when the
operating temperature is decreased from 20C to -10C at 3C discharge rate. A reduction
of 35% in battery capacity is observed when for the same temperature decrease at a 0.2C
discharge rate. The observed effect of operating temperature on the capacity of the tested
battery highlights the importance of an effective thermal management system, the design
of which requires accurate knowledge of the heat generation characteristics of the battery
under various discharge rates and operating temperatures.
In the second part of this thesis, a calorimeter capable of measuring the heat generation
rates of a prismatic battery is developed and verified by using a controllable electric heater.
The heat generation rate of a prismatic A123 LiFePO4 battery is measured for discharge
iii

rates ranging from 0.25C to 3C and operating temperature ranging from -10C to 40C.
Results show that the heat generation rates of Lithium ion batteries are greatly affected by
both battery operating temperature and discharge rate. At low rates of discharge the heat
generation is not significant, even becoming endothermic at the battery operating tem-
peratures of 30C and 40C. Heat of mixing is observed to be a non-negligible component
of total heat generation at discharge rates as low as 0.25C for all tested battery operat-
ing temperatures. A double plateau in battery discharge curve is observed for operating
temperatures of 30C and 40C. The developed experimental facility can be used for the
measurement of heat generation for any prismatic battery, regardless of chemistries. The
characterization of heat generated by the battery under various discharge rates and oper-
ating temperatures can be used to verify the accuracy of battery heat generation models
currently used, and for the design of an effective thermal management system for electric
and hybrid electric vehicles in the automotive industry.
iv

Acknowledgements
I would like to thank my supervisor, Dr. Xianguo Li, for teaching me how to express
myself effectively in technical writing, and for providing guidance and direction throughout
my research. I would also like to thank Dr. Zhongwei Chen and Dr. Zhongchao Tan for
taking the time to read and provide feedback on my thesis.
A sincere thank you to the members of our lab who were there to help me navigate the
ups and downs of experimental research: Aaron Pereira, for all the advice and ideas you
provided; Grant Unsworth, for all your help and advice on the design of the experiments,
and the time spent discussing different ideas for this project.
Finally, thanks to Brian Kettlewell, for your insight and guidance on the complex world
of mathematics.
This work is financially supported by the Ontario Research Fund-Research Excellence
(ORF-RE) program via contract number # RE-02-019 and the Natural Sciences and En-
gineering Research Council of Canada (NSERC) via the Discovery Grant.
v

Dedication
To the one I love, who continues to show me the beauty of the world and the importance
of achieving balance in life.
vi

Table of Contents
List of Tables ix
List of Figures x
1 Introduction 1
1.1 Lithium Ion Batteries . . . . . . . . . . . . . . . . . . . . . . . . . . . . . . 2
1.1.1 Lithium Ion Battery Components . . . . . . . . . . . . . . . . . . . 3
1.1.2 Electrochemical Mechanisms of the Lithium Ion Battery . . . . . . 5
1.1.3 Types of Lithium Ion Batteries . . . . . . . . . . . . . . . . . . . . 9
1.2 Motivation For This Work . . . . . . . . . . . . . . . . . . . . . . . . . . . 9
1.3 Scope and Outline of This Thesis . . . . . . . . . . . . . . . . . . . . . . . 11
2 Quantifying Temperature Effects
on the Performance of
Lithium Ion Batteries 13
2.1 Literature Review . . . . . . . . . . . . . . . . . . . . . . . . . . . . . . . . 13
2.2 Experimental Setup . . . . . . . . . . . . . . . . . . . . . . . . . . . . . . . 17
2.3 Comparison of Battery Temperature
Control Methods . . . . . . . . . . . . . . . . . . . . . . . . . . . . . . . . 21
2.4 Effect of Operating Temperature on
Battery Discharge Characteristics . . . . . . . . . . . . . . . . . . . . . . . 26
3 Calorimetric Measurements of Prismatic Li-ion Batteries 30
3.1 Literature Review . . . . . . . . . . . . . . . . . . . . . . . . . . . . . . . . 30
3.2 Apparatus Design . . . . . . . . . . . . . . . . . . . . . . . . . . . . . . . . 33
vii

3.3 Experimental Condition and Procedure . . . . . . . . . . . . . . . . . . . . 39
3.4 Data Reduction . . . . . . . . . . . . . . . . . . . . . . . . . . . . . . . . . 40
3.5 Calibration . . . . . . . . . . . . . . . . . . . . . . . . . . . . . . . . . . . 45
4 Results and Discussion 48
4.1 Effect of Discharge Rate on
Heat Generation Rate . . . . . . . . . . . . . . . . . . . . . . . . . . . . . 48
4.2 Effect of Operating Temperature on
Heat Generation Rate . . . . . . . . . . . . . . . . . . . . . . . . . . . . . 54
4.3 Validation of Results . . . . . . . . . . . . . . . . . . . . . . . . . . . . . . 58
5 Conclusions 61
5.1 Summary . . . . . . . . . . . . . . . . . . . . . . . . . . . . . . . . . . . . 61
5.2 Recommendations . . . . . . . . . . . . . . . . . . . . . . . . . . . . . . . . 63
References 65
Appendix A: Effect of Operating Temperature on Battery Discharge Curves 74
Appendix B: Effect of Discharge Rate on Battery Heat Generation 78
Appendix C: Effect of Operating Temperature on Battery Heat Generation 82
viii

List of Tables
1.1 Advantages and Disadvantages of Li-ion Batteries [67] . . . . . . . . . . . . 3
2.1 Spatial temperature variation of Li-ion batteries at various discharge rates
at the end of the discharge process . . . . . . . . . . . . . . . . . . . . . . 15
2.2 Comparison of various test methods and their respective temporal temper-
ature variations over the entire discharge cycles . . . . . . . . . . . . . . . 16
2.3 Summary of test results for batteries at 20C and various discharge rates,
outlining the average temporal and spatial temperature variation for the
discharge tests for both the water-ethylene glycol (WEG) and conventional
air convection (air) temperature control methods . . . . . . . . . . . . . . 26
3.1 Accuracy and standard deviation of heat generation measured by battery
calorimeter for varying operating temperatures . . . . . . . . . . . . . . . . 47
4.1 Summary of measured LiFePO4 heat generation rates at all tested discharge
rates and battery operating temperatures . . . . . . . . . . . . . . . . . . . 60
ix

List of Figures
1.1 Schematic of the electrochemical processes in a Li-ion cell [67] . . . . . . . 6
1.2 Polarization curve of a battery, showing the effect of activation polarization,
concentration polarization, and IR drop on open circuit voltage of a cell as
a function of cell current [67] . . . . . . . . . . . . . . . . . . . . . . . . . . 8
1.3 A comparison of the internal setup of coin, cylindrical, and prismatic bat-
teries [74] . . . . . . . . . . . . . . . . . . . . . . . . . . . . . . . . . . . . 10
2.1 Experimental setup for water-ethylene glycol (WEG) temperature control
method . . . . . . . . . . . . . . . . . . . . . . . . . . . . . . . . . . . . . 18
2.2 Thermocouple locations for battery temperature measurements (all mea-
surements in mm). A total of 16 thermocouples were used, with 8 at corre-
sponding locations on each side of the battery . . . . . . . . . . . . . . . . 19
2.3 Schematic of the conventional air convection temperature control method
test setup . . . . . . . . . . . . . . . . . . . . . . . . . . . . . . . . . . . . 20
2.4 Test schedule used in the present study for Li-ion batteries at various dis-
charge rates and operating temperatures . . . . . . . . . . . . . . . . . . . 21
2.5 Comparison of the increase in battery temperature when discharging at 20C
using the conventional air convection (Air) temperature control method (the
dashed curves) and the water-ethylene glycol (WEG) temperature control
method (the solid curves) at 1C, 2C, and 3C discharge rate. . . . . . . . . 22
2.6 Comparison of standard deviations of battery temperature at 16 thermocou-
ple locations (averaged over 5 repetitive tests) between the conventional air
convection and water-ethylene glycol (WEG) temperature control method
at 1C discharge rate and the set battery temperature of 20C. . . . . . . . 23
x
2.7 Comparison of battery discharge curves when discharging at 20C using the
conventional air convection (Air) temperature control method (the dashed
curves) and the water-ethylene glycol (WEG) temperature control method
(the solid curves) at 1C, 2C, and 3C discharge rate. . . . . . . . . . . . . . 24
2.8 Battery discharge curves of the test battery at various temperatures for 3C
discharge rate using the water-ethylene glycol temperature control method. 27
2.9 Relationship between battery energy and operating temperature for all dis-
charge rates and temperatures tested . . . . . . . . . . . . . . . . . . . . . 28
3.1 Exploded (left) and assembled (right) view of the experimental setup for the
measurement of heat generation of prismatic Li-ion batteries. HDPE stands
for high density polyethylene. . . . . . . . . . . . . . . . . . . . . . . . . . 35
3.2 Schematic of the complete experimental setup. . . . . . . . . . . . . . . . . 36
3.3 Thermal resistivity measurements of the High Density Polyethylene slab . . 38
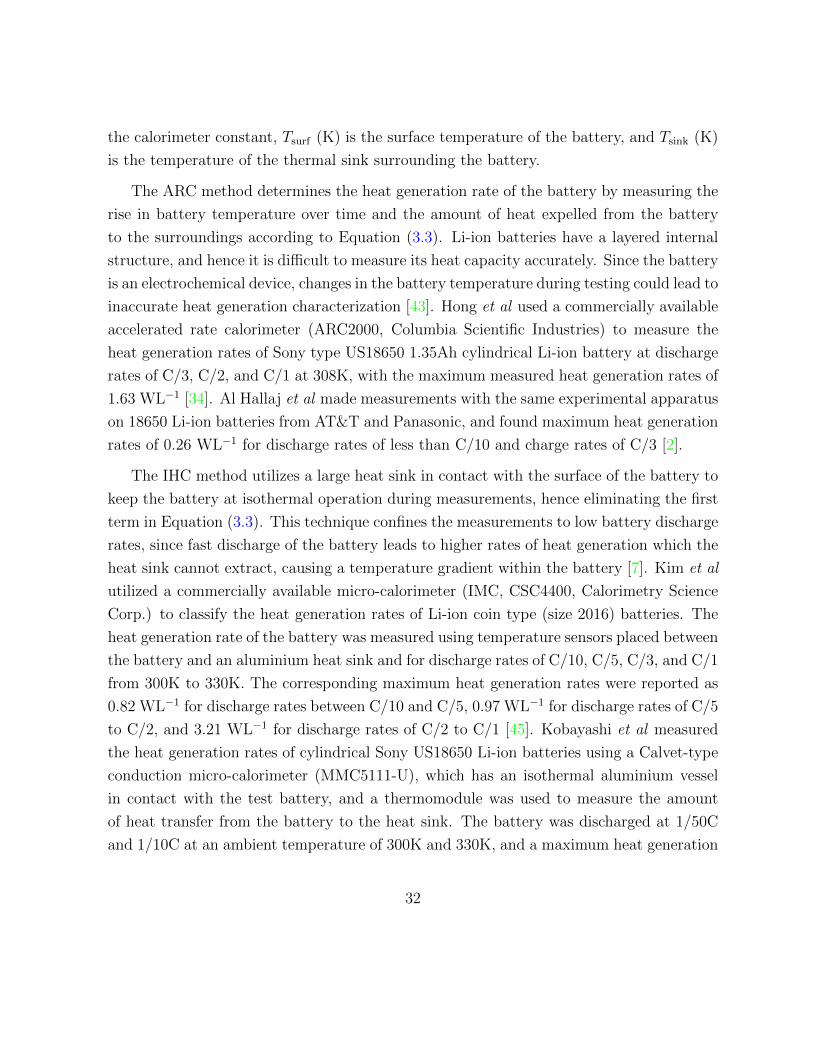
3.4 Test schedule used in the present study for charging and discharging of the
Li-ion battery. . . . . . . . . . . . . . . . . . . . . . . . . . . . . . . . . . . 40
3.5 Problem setup for the measurement of inner temperature of the high density
polyethylene (HDPE) slab Tmeasured from an imposed surface heat flux q′′ due
to the heat generated in the test battery. . . . . . . . . . . . . . . . . . . . 42
3.6 Comparison of the measured heat generation rate using Beck’s Method (solid
line) and the actual heat output from calibration heater (dashed line) at
10C for a step down in heat output. Surface temperature refers to the
temperature measured at the contact surface between the pseudo battery
and the high density polyethylene (HDPE) slab. . . . . . . . . . . . . . . 46
4.1 Effect of tested discharge rates on the heat generation rate of an A123
LiFePO4 battery at an operating temperature of 20C. . . . . . . . . . . . 49
4.2 Effect of discharge rate on the heat generation rate, non-dimensionalized by
electrical power drawn, of A123 LiFePO4 battery at an operating tempera-
ture of 20C. . . . . . . . . . . . . . . . . . . . . . . . . . . . . . . . . . . . 50
4.3 Effect of battery operating temperature on (a) heat generation rate and (b)
battery discharge curve for an A123 LiFePO4 battery at 0.5C discharge. . . 51
xi

4.4 Battery discharge curve and measured heat generation profile of an A123
LiFePO4 battery, for 1C discharge at 20C. Measurements show the presence
of additional heat generation post end of discharge. . . . . . . . . . . . . . 52
4.5 Battery discharge curve and measured heat generation profile of an A123
LiFePO4 battery, at 0.25C discharge, showing battery heat generation post
the end of discharge for operating temperatures of (a) 40C, and (b) -10C. 53
4.6 Effect of battery operating temperature on (a) the heat generation rate and
(b) the battery discharge curve of an A123 LiFePO4 battery, for 1C discharge. 54
4.7 Heat generation rate of an A123 LiFePO4 battery at (a) 40C and (b) 0C
for all tested discharge rates. Secondary plateauing in heat generation rate
at a depth of discharge of 0.8 can be observed for all discharge rates tested
at 40C. . . . . . . . . . . . . . . . . . . . . . . . . . . . . . . . . . . . . . 56
4.8 Heat generation rates and battery discharge curves for 0.25C discharge at
30C and 40C. Transitions between voltage discharge curve plateaus corre-
spond to regions of rapid change in the measured battery heat generation. 57
4.9 Comparison of the temperature measurements for the validation test and
actual battery discharge for 1C, 2C and 3C discharge rates at an operating
temperature of 20C. . . . . . . . . . . . . . . . . . . . . . . . . . . . . . . 59
1 Effect of operating temperature on the discharge curve of the test battery
at 0.25C constant current discharge . . . . . . . . . . . . . . . . . . . . . . 75
2 Effect of operating temperature on the discharge curve of the test battery
at 0.5C constant current discharge . . . . . . . . . . . . . . . . . . . . . . . 75
3 Effect of operating temperature on the discharge curve of the test battery
at 1C constant current discharge . . . . . . . . . . . . . . . . . . . . . . . . 76
4 Effect of operating temperature on the discharge curve of the test battery
at 2C constant current discharge . . . . . . . . . . . . . . . . . . . . . . . . 76
5 Effect of operating temperature on the discharge curve of the test battery
at 3C constant current discharge . . . . . . . . . . . . . . . . . . . . . . . . 77
6 Effect of battery discharge rate on the heat generation profile of the test
battery at an operating temperature of -10C . . . . . . . . . . . . . . . . 79
xii

7 Effect of battery discharge rate on the heat generation profile of the test
battery at an operating temperature of 0C . . . . . . . . . . . . . . . . . 79
8 Effect of battery discharge rate on the heat generation profile of the test
battery at an operating temperature of 10C . . . . . . . . . . . . . . . . . 80
9 Effect of battery discharge rate on the heat generation profile of the test
battery at an operating temperature of 20C . . . . . . . . . . . . . . . . . 80
10 Effect of battery discharge rate on the heat generation profile of the test
battery at an operating temperature of 30C . . . . . . . . . . . . . . . . . 81
11 Effect of battery discharge rate on the heat generation profile of the test
battery at an operating temperature of 40C . . . . . . . . . . . . . . . . . 81
12 Effect of operating temperature on the heat generation profile of the test
battery at 0.25C constant current discharge . . . . . . . . . . . . . . . . . 83
13 Effect of operating temperature on the heat generation profile of the test
battery at 0.5C constant current discharge . . . . . . . . . . . . . . . . . . 83
14 Effect of operating temperature on the heat generation profile of the test
battery at 1C constant current discharge . . . . . . . . . . . . . . . . . . . 84
15 Effect of operating temperature on the heat generation profile of the test
battery at 2C constant current discharge . . . . . . . . . . . . . . . . . . . 84
16 Effect of operating temperature on the heat generation profile of the test
battery at 3C constant current discharge . . . . . . . . . . . . . . . . . . . 85
xiii

Chapter 1
Introduction
Fossil fuel based transportation is one of the dominant contributors to global climate change
and the main factor to increased urban air quality degradation. The growing public concern
over climate change has propelled alternative forms of transportation to the forefront of
research in the automotive sector, and battery electric vehicles (BEVs) and hybrid electric
vehicles (HEVs) are being vehemently developed as the environmentally friendly alternative
to conventional combustion engine vehicles.
Automotive companies have developed multiple vehicles in the recent years to fuel the
public’s need for alternative forms of transport, with major automotive companies such as
Ford, Nissan, Chevrolet, and BMW releasing electric vehicles (EVs) [25]. The outlook for
the future of the electric vehicle is positive, with major financial incentives for researchers
and automotive manufacturers from the United States Administration, famously pushing
for one million EVs on the road by 2015 [23]. This ambitious goal, coupled with recent
advances in battery technology, has sparked the emergence and gain in popularity of several
specialized BEV companies such as Tesla Motors, whose Model S electric car has a wait
time of up to three months [20].
The sales of BEVs and HEVs are not at the level of that of their gasoline powered
counterparts despite the growing public interest. Total BEV sales in 2012 total to 14,600
units in the United States, which pales in comparison to the 316,000 vehicles of the same
class sold by Ford Motor Company alone [55, 78]. Relatively low penetration of EVs into
1

the automotive market has been due to two main reasons: ‘range anxiety’, or a fear of the
lack of range EVs have due to a limited size battery pack, and the varying mileage and
performance of the EVs during and after operation in extreme ambient conditions.
FleetCarma has explored the effect of vehicle operation in various ambient conditions
on the Nissan Leaf, gathering data from real world drivers on more than 5,400 individual
trips. They found a drastic decrease in total available mileage in cold weather operation,
with drivers reporting an average range of 60km from a fully charged battery during ve-
hicle operation at -25C, compared to an average range of 106km when operating at 30C
[39]. Conversely, for operation in higher environment temperatures, independent tests per-
formed by Nissan Leaf owners in Arizona have shown a permanent 15% loss in capacity
after operation for one summer[30]. These real world user generated results highlight the
importance of understanding and quantifying the effects of operating temperature on bat-
tery characteristics, and the need for a well designed thermal management system for EVs
due the short and long term effects that extreme environmental temperatures have on the
EV performance.
The performance of EVs and HEVs depends on the performance of their battery packs.
Batteries are electrochemical devices, hence their performance is greatly affected by tem-
perature. To realize the importance of temperature control on the battery, the effects of
temperature on the battery must be quantified. The detrimental effects of temperature
on the battery pack can be avoided through the use of an effective thermal management
system which can keep the battery at an optimum temperature during operation. The
design of such a system requires accurate knowledge of the heat generation of the battery
at all the operating and discharge conditions experienced by EVs and HEVs.
1.1 Lithium Ion Batteries
A battery is an energy storage device. The most common battery chemistry on the market
today for use in automotive applications is the Lithium ion battery (Li-ion), due to its
superior power density and minimal memory effects [7, 17]. Li-ion is also the only battery
chemistry that will be expected to attain a specific power level of 400W/kg in the near
2

Table 1.1: Advantages and Disadvantages of Li-ion Batteries [67]
Advantages
High energy density and specific energy
Long cycle life
Low self discharge rate
No memory effect
High open circuit voltage (approximately 4V)
Disadvantages
Potential safety problems due to explosions, fires, caused by thermal runaway
Relatively poor low-temperature performance
Degradation of battery chemistry at high temperatures
future [29]. The main advantages and disadvantages to Li-ion batteries are summarized in
Table 1.1.
Different battery components can provide various benefits for the overall battery system.
Desired characteristics that can be adjusted through the use of various battery components
include non-toxicity, decreased degradation at higher temperatures, and higher power to
weight ratio. The main components of a Li-ion battery system and their effects on battery
characteristics will be examined in the next section.
1.1.1 Lithium Ion Battery Components
A battery is composed of numerous cells, each of which consists of four major components
[67]:
1. Anode, or negative electrode, which gives up electrons to the external circuit; the
anode is oxidized during the electrochemical reaction.
2. Cathode, or positive electrode, which accepts electrons from the external circuit; the
cathode is reduced during the electrochemical reaction.
3

3. Electrolyte, or ionic conductor, which is the medium for the transfer of charge or ions
in the external circuit. The electrolyte is typically a liquid, containing salts, acids,
or alkalis to increases its ionic conductivity.
4. Separators, a micro-porous layer which electrically isolate the positive and electrodes
to prevent short circuiting during the electrochemical reaction.
The selection of battery components is integral to the capabilities of the Li-ion cell.
The components of the cell have to be chosen to increase the power to weight ratio of the
battery, and to increase cell voltage and capacity. The anode needs to be efficient as a
reducing agent, have a high coulombic output, and have high electrical conductivity [67].
Carbon based electrodes are commonly used due to their stable surface morphology, which
results in consistent safety properties throughout the battery lifetime [65].
For the cathode, the selected material must be an effective oxidizing agent, be chem-
ically stable while in contact with the electrolytic material, be able to incorporate large
quantities of lithium without structural change, and have high lithium ion diffusivity [67].
Cathodic materials are commonly made of oxides of transition metals. The performance
of cathodes depend on their micro-structure, since the exchange of lithium ions with the
electrolyte during charge and discharge occurs at the electrode-electrolyte interface [84].
Recently, a great amount of attention has gone into the development of nano-structured
electrodes (such as the LiFePO4 cathode) with increased surface and inter-facial areas
which improves electrolyte contact at the electrode interface, hence improving the overall
performance of the cell [9, 14, 52].
The electrolyte must be made of materials that have high ionic conductivity. Low
toxicity, thermal stability, and low reactivity with other cell components are among the
essential characteristics of the electrolyte [67]. The most commonly used electrolyte is
formulated with carbonate solvents which are aprotic, polar, and have a high dielectric
constant. Electrolytes can be specialized to low temperature applications by using low
viscosity solutions with low freezing points [67].
Separators are typically micro-porous films about 16µm to 40µm thick, made of poly-
olefin materials, due to their mechanical properties, chemical stability, and low cost [67].
Desired mechanical properties of the battery separator include high material strength to
4

allow automated winding during production of the battery, high resistance to perforations,
high wettability by the electrolyte, and compatibility and stability with electrolyte and
electrode materials [22]. Currently, separators consist of polyethylene or polypropylene
materials which can act as a safety component due to the melting point of the polymer
at 135C an d 155C respectively. As the inner temperature of the battery reaches the
melting points of the polymers, the pores in the separators close and stop the transport
of Li+ ions from the electrodes, thus stopping the battery from discharging or charging
further and avoiding potential thermal runaway scenarios [67].
For this thesis, the battery chemistry used in all the experimentation is a prismatic
LiFePO4 20Ah battery from A123 Systems (A123M1HD-A) [36]. The LiFePO4 battery
is unique because it uses nano-structured electrodes to increase lithium ion transport in
order to facilitate high discharge rates, instead of an electrode with high electronic conduc-
tivity and lithium ion transport mobility like the conventional Li-ion chemistries [36]. The
LiFePO4 battery chemistry is very safe due to its non-reactive nature with electrolytes in
both charged or discharged state at high temperatures, making it an ideal candidate for
automotive applications [67].
1.1.2 Electrochemical Mechanisms of the Lithium Ion Battery
During the charging and discharging process of a Li-ion battery, lithium ions are inserted
or extracted from the interstitial space between the atomic layers within the conductive
materials. The movement of ions and electrons in a typical Li-ion cell is shown in Figure
1.1. The electrochemical reactions of the LiFePO4 cell can be characterized as follows [32],
Positive reaction Li1−xFePO4 + xLi+ + xe− LiFePO4
Negative reaction LixC6 C6 + xLi+ + xe− (1.1)
Total reaction Li1−xFePO4 + LixC6 LiFePO4 + C6
5

Figure 1.1: Schematic of the electrochemical processes in a Li-ion cell [67]
The reactions proceed from the left side to the right side during the discharge and
in the reverse direction during the charge cycle. The maximum electric energy that can
be extracted from any electrochemical cell depends on the change in Gibbs energy of the
overall reaction in the cell, ∆G [67],
∆G = −nFE (1.2)
where F is the Faraday constant, E is the electromotive force, and n is the number
of electrons that flow through the circuit. The maximum theoretical energy cannot be
achieved by a real cell however, due to the losses that occur in the cell due to current
6

flow. These losses can be classified mainly into activation polarization, concentration
polarization, and ohmic polarization.
Activation polarization drives the electrochemical reaction at the surfaces of the cathode
and anode [67]. Concentration gradients are formed at the interface between the electrolyte
and the electrode materials due to the natural resistance to mass transport in the cell [76].
Ohmic polarization, commonly referred to as IR drop in potential, is due to current flow
through the internal resistance of the battery [67]. The cell voltage due to effects of the
overpotentials can be calculated from [67],
E = Eo − [(ηap)a + (ηcp)a]− [(ηap)c + (ηcp)c]− IR (1.3)
where Eo [V] is the open circuit voltage of a cell; (ηap)a and (ηap)n [V] are the activation
polarization at the anode and cathode, (ηcp)a and (ηcp)n [V] are the concentration polar-
ization at the anode and cathode respectively; I [A] is the current flow of the cell; and R
[Ω] is the internal resistance of the cell. The effect of the overpotentials on battery voltage
is shown in Figure 1.2. It can be seen that polarization losses from all sources increases as
current flow increases, causing a larger deviation of actual cell voltage from open circuit
voltage.
7

Figure 1.2: Polarization curve of a battery, showing the effect of activation polarization,
concentration polarization, and IR drop on open circuit voltage of a cell as a function of
cell current [67]
Non-equilibrium effects due to current flow on the electrochemical reaction in the cell
are not described in Equation 1.3. The effect of current draw on the on the voltage of the
cell has an exponential relation, described by the Tafel equation [67],
η = a± b log i (1.4)
where η is polarization due to current flow within the cell, and a and b are constants.
Polarization of the cell causes the electrical energy to be converted to heat [67]. The
exact amounts of heat generation from polarization are hard to quantify, due to the propri-
etary make-up of the tested battery, and the effects that different battery additives have on
the polarization sources. Batteries are electrochemical devices, and therefore temperature
also has an effect on the cell open circuit voltage, as well as the polarizations that occur.
Low temperature operation causes higher charge transfer resistance, decreased diffusion
8
rates of salts, and decreased ionic conductivity in the battery, which negatively affect the
charging and discharging abilities of the battery [63, 89]. Battery operation at an high
temperatures accelerates the electrolyte decomposition and reduces the accessible surface
area of electrode particles, which leads to power and capacity fade when high temperature
operation is sustained [69, 80]. Therefore, to accurately characterize battery performance,
it is imperative to control and observe the effects of both temperature and current draw.
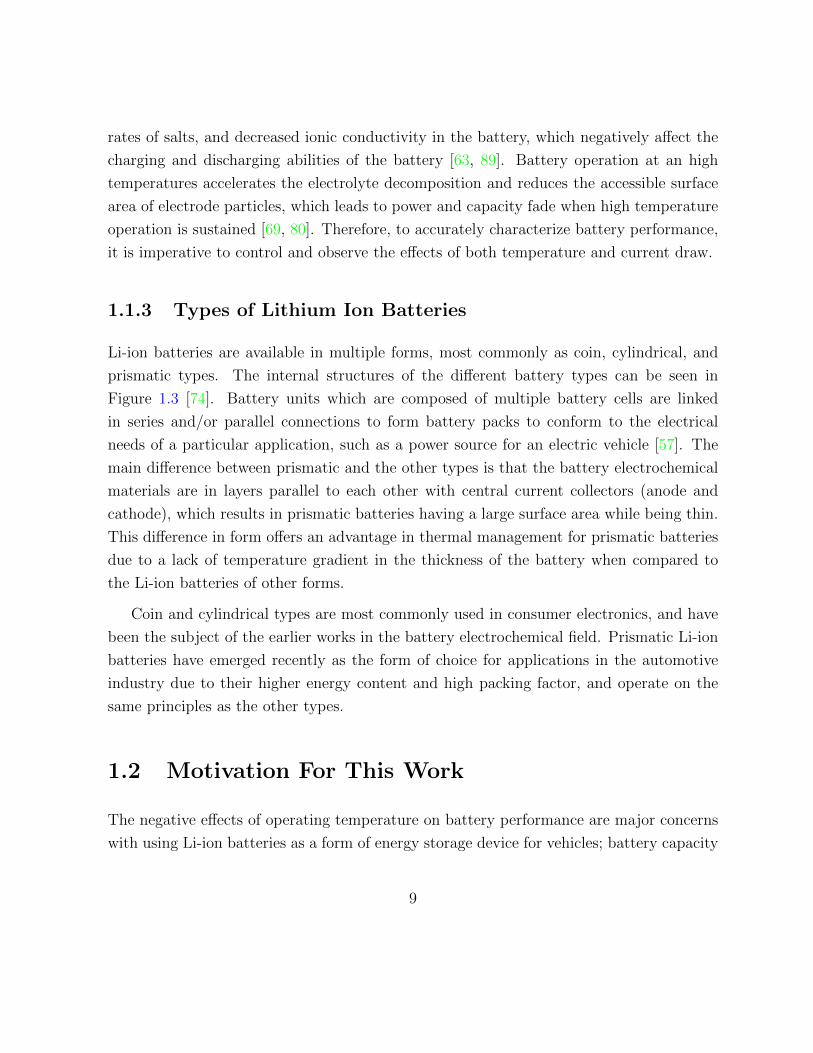
1.1.3 Types of Lithium Ion Batteries
Li-ion batteries are available in multiple forms, most commonly as coin, cylindrical, and
prismatic types. The internal structures of the different battery types can be seen in
Figure 1.3 [74]. Battery units which are composed of multiple battery cells are linked
in series and/or parallel connections to form battery packs to conform to the electrical
needs of a particular application, such as a power source for an electric vehicle [57]. The
main difference between prismatic and the other types is that the battery electrochemical
materials are in layers parallel to each other with central current collectors (anode and
cathode), which results in prismatic batteries having a large surface area while being thin.
This difference in form offers an advantage in thermal management for prismatic batteries
due to a lack of temperature gradient in the thickness of the battery when compared to
the Li-ion batteries of other forms.
Coin and cylindrical types are most commonly used in consumer electronics, and have
been the subject of the earlier works in the battery electrochemical field. Prismatic Li-ion
batteries have emerged recently as the form of choice for applications in the automotive
industry due to their higher energy content and high packing factor, and operate on the
same principles as the other types.
1.2 Motivation For This Work
The negative effects of operating temperature on battery performance are major concerns
with using Li-ion batteries as a form of energy storage device for vehicles; battery capacity
9

(a) Coin Battery (b) Cylindrical Battery
(c) Prismatic Battery
Figure 1.3: A comparison of the internal setup of coin, cylindrical, and prismatic batteries
[74]
10

is decreased at low operating temperatures, and battery degradation increases during sus-
tained operating at high temperatures. The broad effect of temperature on electrochemical
devices are well known, but the detrimental effects of temperature on prismatic batteries
need to be quantified to highlight the importance of an effective thermal management sys-
tem. In order to characterize the effect of temperature accurately, a method of battery
temperature control needs to be developed such that battery temperature can be kept at
isothermal conditions regardless of discharge rate or internal heat generation.
Quantification of the effects of temperature on battery characteristics highlights the
importance of developing an effective thermal management system that is capable of keep-
ing the batteries at an optimum operating temperature. The design of such a system
requires precise knowledge of the heat generation rates of Li-ion battery at varying operat-
ing temperatures and discharge conditions. Modelling the heat generation of the batteries
is difficult, due to the complexities in the heat generation and electrochemical mechanisms.
Hence, an experimental facility needs to be developed to accurately characterize the heat
generation rates of the battery at various discharge and operating conditions to exam-
ine the effects of operating temperature and discharge rate on the overall heat generation
characteristics of the battery.
1.3 Scope and Outline of This Thesis
In this thesis, experimental facilities are developed to aid in both the accurate quantifica-
tion of temperature effects on Li-ion battery performance, and the measurement of Li-ion
battery heat generation at various discharge rates and operating conditions. The developed
experimental techniques are applicable to large prismatic batteries, regardless of battery
chemistries. The tested battery in this thesis is a commercially available 20Ah LiFePO4
battery from A123, which is used in automotive applications. The results presented in this
thesis are of interest to both the research community and industry, providing benchmark
data for comparison to simulation results, as well as battery heat generation characteristics
to aid in the design of an effective thermal management system.
This thesis is divided into five chapters. In chapter one, the physical components of
batteries are highlighted, the electrochemical mechanisms behind Li-ion batteries are ex-
11

plored, and the differences and similarities between Li-ion batteries of different forms are
discussed. In chapter two, a new experimental technique that allows accurate battery
characterization at various operating conditions and discharge rates through precise tem-
perature control of the battery is developed, and the effect of operating temperature on
battery performance is quantified through experimentation. In chapter three, a literature
review of techniques used in experimental measurements of heat generation rates of various
Li-ion batteries is presented, an experimental apparatus is developed to accurately measure
the heat generation rates of prismatic Li-ion batteries, and the data reduction technique
and equipment calibration will be discussed. Chapter four discusses the results of the
measurement, concentrating on the underlying heat generation mechanisms of the battery.
Finally, chapter five summarizes the major conclusions and presents recommendations for
future work.
12

Chapter 2
Quantifying Temperature Effects
on the Performance of
Lithium Ion Batteries
2.1 Literature Review
Battery powered vehicles will operate in a multitude of conditions, from high temperature
conditions in the summer to low temperature conditions in the winter, and these tempera-
ture changes will strongly influence the performance, driving range, and durability of BEVs
and HEVs. Hence, it is very important to investigate the effect of operating temperature
on battery discharge characteristics, both to increase the accuracy of state-of-charge (SOC)
determination for BEV and HEV drivers, and to develop effective thermal management
systems to prolong the lifetime and output capabilities of the Li-ion battery systems.
A common method used in battery analysis is to use experimentally determined co-
efficients and electrochemical equations based on battery open circuit voltage, internal
resistance, discharge current, and state of charge. This technique is based on the work
of Shepherd [70], expanded by Tremblay and Dessaint [77], which is currently being used
by Simulink for electric vehicle modelling. Due to the nature of the experimentally de-
termined constants and the strong dependence of battery characteristics on temperature,
13

spatial and temporal temperature control of the battery is extremely important during
battery characterization tests, both of which could be challenging. Temporal temperature
control requires extracting the amount of heat generated internally by the battery, which
is a function of both temperature and SOC of the battery. Spatial temperature control
is difficult due to the typical dimensions of the prismatic Li-ion battery (20cm x 16cm x
0.7cm for this study). The order of magnitude difference between the thickness and the
other dimensions in the prismatic battery design lends itself to the edge collection of cur-
rent, leading to high temperatures near the current collection point due to joule heating.
The work of Tremblay and Dessaint did not specify the test procedure for the validation of
their model, only that it was compared to discharge curves provided by the manufacturer
[77]. It might be assumed that discharge in air convection environmental chamber is used,
as it is common practice by manufacturers to test batteries in that fashion.
Li-ion battery charging and discharging characteristics are strongly dependent on its
operating temperature. Zhang et al. found the performance of the Li-ion battery is affected
by the charge-transfer resistance of the battery, which increases exponentially at sub-zero
temperatures when compared to operation at a reference temperature of 20C, decreasing
the charging and discharging characteristics of the battery [89]. Choi and Lim demon-
strated that the electrical performance of 18650 Li-ion batteries depends significantly on
the operating temperature, with a decrease of approximately 95% in energy density for
the batteries at -40C when compared to the same discharge rate at 20C [19]. Andre et
al. showed a strong dependence of electrolyte (or ohmic) resistance and solid electrolyte
interface resistance on battery temperature, both of which affect charge transfer and ion
diffusion resistance [4]. Pals and Newman found a strong correlation between battery tem-
perature and performance, with an increase in battery performance due to higher diffusion
rate of salts and increased ionic conductivity at higher battery temperatures [63]. Both
Thomas et al. and Reynier et al. established the existence of a linear dependence of battery
open circuit potential with battery temperatures between 20C and 29C [68, 76].
Spatial control of Li-ion battery temperature is also extremely important for the accu-
racy of battery characterization testing. Fleckenstein et al found the cause of divergence
of the local SOC and electric inhomogeneities to be due to spatial temperature gradients
within the battery [28]. Various studies have shown large spatial temperature gradient
14

within the battery at the end of discharge due to varying current distributions within the
battery [6, 41, 46].
Simulations and experimental studies have been conducted to investigate the effect of
heat generation on the spatial temperature distribution in the battery, and results show
local temperature of the battery is the highest at the positive and negative terminals of
the batteries at the end of discharge due to the higher current density at these locations
[6, 41, 46]. For example, a maximum spatial temperature variation of 10C is shown to
occur at a high discharge rate of 5C [44]. Spatial temperature variation in the battery can
cause SOC drift and variations in current densities due to the temperature dependence of
both the ratio of charge to discharge pulse impedance and open circuit potential [28]. A
summary of the results of these studies is shown in Table 2.1.
Table 2.1: Spatial temperature variation of Li-ion batteries at various discharge rates at
the end of the discharge process
Author Battery UsedRate of
Spatial Temperature Variation
Dischargeat End of Discharge
Low High
Jeon et al
[41]
2Ah 18650
Cylindrical Li-ion Cell1C 36C 40C
Awarke et
al [6]
40Ah KOKAM
SLPB10021621H
Prismatic Li-ion Cell
4C 26C 37C
Kim et al
[44]
10Ah VLK07
Prismatic Li-ion Cell5C 48C 58C
Various authors have tried to determine the discharge and charge capabilities of a
variety of battery chemistries to increase accuracy in SOC estimation and characterize
battery performance at various temperatures [3, 6, 16, 34, 42, 60]. These studies employ
multiple methods of temperature control for the tests, using a variety of commercially
available convective air cooling chambers which are not effective for battery temperature
15

control due to the low specific heat value of air. To achieve effective temperature control
removing the heat generated in the battery, a large flow rate of air needs to be circulated
within the chamber, which is not usually done due to the inability of the chamber to
increase flow rate. In reality, this can cause large local temperature gradients within the
batteries, and hence is not commonly practised. Custom-built conduction chambers also
lack the ability to keep the battery isothermal due to the inability of the construction
material to conduct out the heat generated by the battery, especially at higher battery
heat generation rates occurring at high rates of discharge [3, 34]. Various experimental
methods and the temperature increase of the battery are shown in Table 2.2. It is seen
that substantial temperature increase, as large as 30C temporally, has been observed in
literature when using the conventional air convection temperature control method at a
discharge rate of 2C [16].
Table 2.2: Comparison of various test methods and their respective temporal temperature
variations over the entire discharge cycles
Author Experimental Method Battery Used
Temperature Variation
Over Disharge
1C 2C
Hallaj et
al [3, 34]
Insulative Conduction
Chamber
2Ah 18650
Cylindrical Li-ion Cell11C —
Onda et al
[42, 60]Convective Chamber
2Ah 18650
Cylindrical Li-ion Cell25C —
Awarke et
al [6]
Free Convection in
Ambience
40Ah KOKAM
SLPB10021621H
Prismatic Li-ion Cell
— 37C
Chacko et
al [16]Convective Chamber
Prismatic 20Ah
LiNiMnCoO2 Cell15C 30C
From the above literature review, it is apparent that battery temperature control is
extremely important, both spatially and temporally. The current battery temperature
16

control, using a method of air convective cooling either in the form of forced convective
cooling, in temperature control chamber or free convection in ambient conditions, is inad-
equate to ensure the accurate control of battery temperature during discharge. Therefore,
the objective of the work in this chapter is to develop a method for the accurate control
of the operating temperature of large prismatic batteries throughout discharge process, for
the discharge rates and operating temperatures typically encountered in electric vehicles.
In this section, a water-ethylene glycol mixture (WEG) in a thermal bath is used for bat-
tery temperature control, and a prismatic LiFePO4 battery from A123 is used to exhibit
the differences that can be observed in the battery characterization results when using
the developed technique versus the conventional method of battery temperature control.
It will be shown that this WEG temperature control method is effective at maintaining
the battery at isothermal conditions both temporally and spatially and significantly im-
proves the accuracy of battery characterization. A comparison with the conventional air
convective temperature control method will be made.
2.2 Experimental Setup
The test method employs a water-ethylene glycol mixture as the coolant for battery tem-
perature control. A mixture of 50-50 water-ethylene glycol is employed, allowing a battery
temperature range of -20C to 100C. The battery is immersed in a constant temperature
bath (ThermoFisher A25B, ±0.1C) with the terminals held above liquid level. A cover
with a thermal resistance value 0.87m2KW−1 measuring 0.23m by 0.25m and a thickness
of 0.005m is fitted over the batteries to decrease evaporation from the bath, and to prevent
heat loss from the bath to the ambient. The fluid mixture is agitated around the battery
through the use of the built-in agitator pump, creating a significant flow of the coolant
past the battery surface, providing enhanced heat transfer. The heat gained by the cooling
fluid via heat transfer from the battery is removed using a refrigeration coil built into the
bath. The experimental setup is shown in Figure 3.1.
17

Figure 2.1: Experimental setup for water-ethylene glycol (WEG) temperature control
method
Discharge tests are performed on a commercially available prismatic Li-ion battery
(LiFePO4) from A123, with a nominal capacity of 20Ah (A123M1HD-A). To normalize
the results for comparison purposes, discharge rates will be given in C-rates, where 1C
is the discharge rate at which the battery will be fully depleted in an hour (20A), 2C
is the discharge rate at which the battery will be fully depleted in 30min (40A), etc.
Surface temperature of the battery at 8 different locations on each face of the battery as
shown in Figure 2.2 is recorded using high accuracy thermocouple (accuracy ± 0.1C).
The test battery is cycled through 5 different discharge rates (0.2C, 0.5C, 1C, 2C, 3C)
at a six different operating temperatures (-10C, 0C, 10C, 20C, 30C, 40C) from an
open circuit voltage of 3.6V to a cutoff voltage of 2.6V. A Greenlight Innovations G12-200
battery test station is used to control the discharge and charge of batteries, which has an
accuracy of ± 0.2A in current source control, ± 0.05V in voltage source control, ±0.06%
full scale in current sink control, and ±0.10% full scale in current measurement.
18

Figure 2.2: Thermocouple locations for battery temperature measurements (all measure-
ments in mm). A total of 16 thermocouples were used, with 8 at corresponding locations
on each side of the battery
As a comparison, the conventional air convection temperature control method is also
tested using a Cincinnati Sub Zero BZ1 series environmental chamber as shown in Figure
2.3. The battery is shielded from forced convection using a custom-built cover to avoid local
hot spots caused by blowing air, and conduction to the chamber is avoided by mounting the
test batteries on top of low thermal conductivity stands made of 2mm diameter wooden
19

dowels, which only contact the battery on four corners. Both the battery cycling and
temperature measurements are performed as described earlier.
Figure 2.3: Schematic of the conventional air convection temperature control method test
setup
The batteries are discharged to cutoff voltage five times for conditioning purposes be-
fore testing, which allow irreversible capacity fade which is present in some unused Li-ion
batteries to occur [34]. The batteries are brought to the test temperature by the thermal
bath, and discharge testing is commenced after the batteries have reached the specified
temperature for one hour. The tests are performed in semi-random order, such that no
two subsequent discharge tests have the same operating conditions (both temperature and
discharge rate) to ensure no condition from the previous test skews the results for the
ensuing test. Charging of the battery at C/5 rate is started after a two-hour relaxation
period, which allows the battery chemistry to come to equilibrium. Charging of the bat-
teries follows the standard constant current to constant voltage charging scheme. The
next discharge cycle commences one hour after the batteries have attained the necessary
20

temperature. The test schedule is shown in Figure 2.4.
Figure 2.4: Test schedule used in the present study for Li-ion batteries at various discharge
rates and operating temperatures
2.3 Comparison of Battery Temperature
Control Methods
All battery characterization results shown in this and the subsequent sections are for a
single battery, averaged over 5 tests, in order to minimize capacity fade due to battery
cycling. Average battery temperatures are calculated using the average of 16 thermocouple
readings, and standard deviation, calculated for the average battery temperature over the
5 tests, are in the same order of magnitude as the thermocouple error for all discharge
rates for both methods of temperature control. This represents good repeatability in the
obtained experimental results.
21

Figure 2.5 shows that the maximum variation of temporal battery temperature for
the conventional air convection method of temperature control is approximately 13.1C,
11.2C, and 7.2C for the 3C, 2C, and 1C discharge rate, respectively. These values can
be compared to an increase of less than 0.3C, 0.2C, and 0.2C for the 3C, 2C, and
1C discharge rates, obtained using the WEG temperature control method. The average
increase in battery temperature across all 16 locations for the conventional air convection
method of temperature control is shown to be in the same order of magnitude as literature,
and is orders of magnitudes higher than the results obtained using the WEG temperature
control method.
Figure 2.5: Comparison of the increase in battery temperature when discharging at 20C
using the conventional air convection (Air) temperature control method (the dashed curves)
and the water-ethylene glycol (WEG) temperature control method (the solid curves) at
1C, 2C, and 3C discharge rate.
22

The standard deviations of the temperature across the 16 thermocouple locations are
shown in Figure 2.6 as a function of time for the 1C discharge rate and the initial battery
temperature of 20C, for both methods of battery temperature control. The standard de-
viation values are calculated using the average temperature at each thermocouple location
over 5 tests. This value can be used as a measure of the spatial temperature gradient in the
battery, with larger values signifying a higher deviation from the average battery temper-
ature. The rapid increase in the standard deviation value for air convection temperature
control at the end of battery discharge is due to the rapid increase in battery internal
heat generation near the end of the discharge test, and the ineffectiveness associated with
the lower heat removal rates of using air as a cooling media. The standard deviation of
temperature on the test battery using the WEG temperature control method is about ±0.1C, which is the same as the accuracy of the thermocouples used in the present measure-
ment and it is much lower than using the conventional air convection temperature control
method. This indicates the ability of the WEG method to reduce temperature gradients
in the battery throughout discharge.
Figure 2.6: Comparison of standard deviations of battery temperature at 16 thermocouple
locations (averaged over 5 repetitive tests) between the conventional air convection and
water-ethylene glycol (WEG) temperature control method at 1C discharge rate and the
set battery temperature of 20C.
23

The same Li-ion battery is tested using both the water-ethylene glycol and the con-
ventional air convection temperature control method at 20C with the discharge rates of
1C, 2C, and 3C to examine the effect of the temperature control on battery discharge
characteristics. The results are shown in Figure 2.7. It is seen that a significant difference
exists between the battery discharge curves obtained using the two different methods of
battery temperature control. In all cases, the measured capacity of the battery is higher
when using the conventional air convection temperature control method due to the higher
temperature achieved by the battery during the course of testing, as shown in Figure 2.5,
with an increase in capacity of 25%, 12%, and 18% for 1C, 2C, and 3C discharge rates,
respectively. Although an increase in battery capacity is desired, the results obtained are
not representative of the true battery discharge characteristics at the set temperature due
to the increase in battery temperature from battery internal heat generation.
Figure 2.7: Comparison of battery discharge curves when discharging at 20C using the
conventional air convection (Air) temperature control method (the dashed curves) and the
water-ethylene glycol (WEG) temperature control method (the solid curves) at 1C, 2C,
and 3C discharge rate.
24

A summary of spatial and temporal temperature variation at 20C and various discharge
rates is shown in Table 2.3. The average temporal temperature variation is calculated by
taking the difference in average battery temperature at the beginning and end of the dis-
charge cycle. It is seen that at high rates of discharge (3C, 2C), the average temporal
temperature difference is orders of magnitudes higher when the conventional air convec-
tion method of temperature control is used. At discharge rates lower than 1C, the results
show that the average temporal temperature variation in the battery is the same as the
thermocouple error when the WEG temperature control method is employed, essentially
maintaining the battery at isothermal conditions temporally. The spatial temperature vari-
ation is calculated by taking the standard deviations between the average temperatures
at each thermocouple location over 5 tests at the end of discharge, when the spatial tem-
perature variation throughout the battery is the highest. It can be seen that the spatial
temperature variations when using the WEG temperature control method is consistently
orders of magnitudes lower than the results obtained from using the conventional air con-
vection temperature control method. The results show that the location at which the
battery temperature is the highest is always kept to within 0.4C of the average battery
temperature for the WEG method of temperature control, whereas the conventional air
convection temperature control method shows a maximum spatial temperature deviation
of 4.3C from the average battery temperature. It can be seen that the spatial temper-
ature variation is kept to below 0.4C for all discharge conditions tested when using the
WEG temperature control method, and shows the ability of the WEG temperature con-
trol method to keep spatial temperature variation to a minimum compared to using the
conventional air convection method of temperature control.
25

Table 2.3: Summary of test results for batteries at 20C and various discharge rates,
outlining the average temporal and spatial temperature variation for the discharge tests for
both the water-ethylene glycol (WEG) and conventional air convection (air) temperature
control methods
Discharge
Condition
Average Temporal Maximum Spatial
Temperature Variation TemperatureVariation
WEG (C) Air (C) WEG (C) Air (C)
3C 0.3 13.1 0.4 4.3
2C 0.2 11.2 0.2 2.1
1C 0.2 7.2 0.1 1.2
0.5C 0.1 5.5 0.1 1.0
0.25C 0.1 4.5 0.1 1.0
The presented results show a clear advantage of using the WEG temperature control
method due to its ability to control the battery at near isothermal conditions temporally
in spite of the internal heat generation of the battery, and the drastic decrease of spatial
temperature deviation throughout the discharge tests, potentially eliminating SOC drift
and varying current density within the battery.
2.4 Effect of Operating Temperature on
Battery Discharge Characteristics
The battery discharge curves for various temperatures at 3C discharge rate, obtained using
the water-ethylene glycol temperature control method, is seen in Figure 2.8. Figure 2.8
shows the reduction in battery capacity with lower temperatures, due to the decrease
in the ionic conductivity of electrolyte and solid electrolyte interface, and a slowdown
of battery electrochemical reactions [89]. Battery capacity decreased by 95% when the
battery temperature is lowered from 20C to -10C. The optimum operating temperature
of the battery is between 20C and 30C, where the capacity is near maximum and the
26
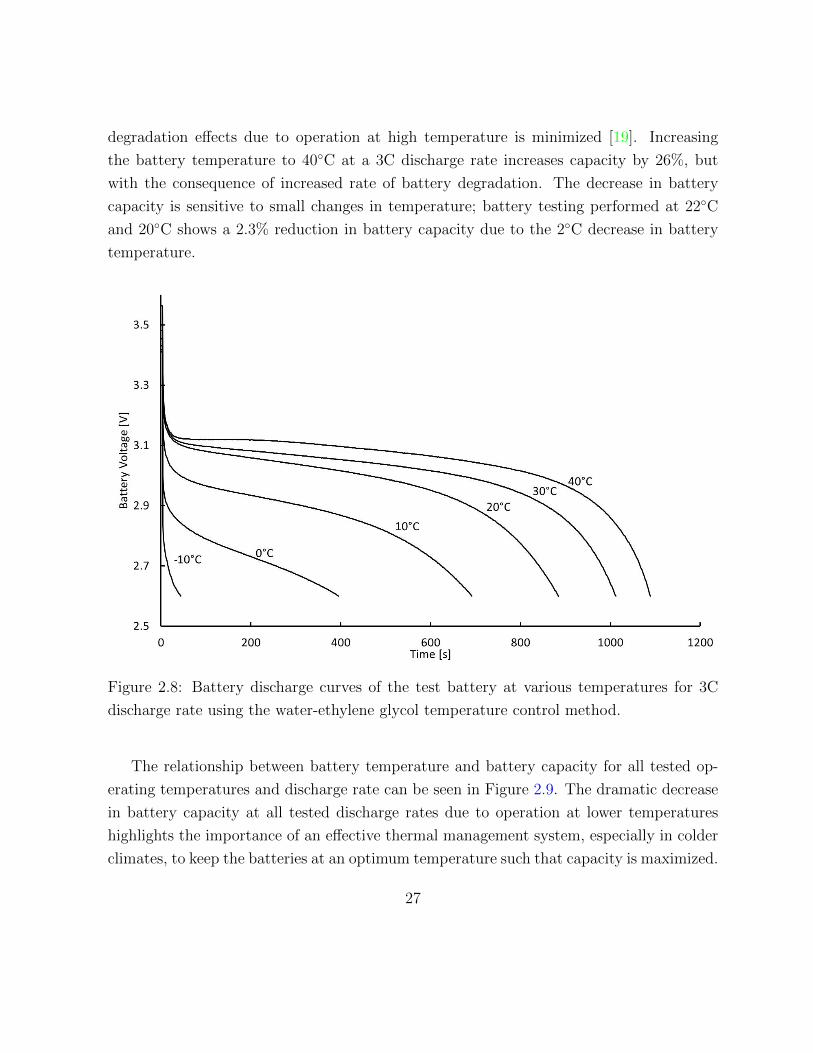
degradation effects due to operation at high temperature is minimized [19]. Increasing
the battery temperature to 40C at a 3C discharge rate increases capacity by 26%, but
with the consequence of increased rate of battery degradation. The decrease in battery
capacity is sensitive to small changes in temperature; battery testing performed at 22C
and 20C shows a 2.3% reduction in battery capacity due to the 2C decrease in battery
temperature.
Figure 2.8: Battery discharge curves of the test battery at various temperatures for 3C
discharge rate using the water-ethylene glycol temperature control method.
The relationship between battery temperature and battery capacity for all tested op-
erating temperatures and discharge rate can be seen in Figure 2.9. The dramatic decrease
in battery capacity at all tested discharge rates due to operation at lower temperatures
highlights the importance of an effective thermal management system, especially in colder
climates, to keep the batteries at an optimum temperature such that capacity is maximized.
27

Figure 2.9: Relationship between battery energy and operating temperature for all dis-
charge rates and temperatures tested
Through the observed phenomenon in this experiment, it is seen that conventional
methods of using air convection based temperature control chambers are inadequate in
keeping the battery at isothermal conditions temporally and spatially. A technique capable
of keeping the battery isothermal is developed using a thermal bath, with 50-50 water-
ethylene glycol (WEG) solution used as the working fluid in the thermal bath. It is seen
that the WEG method of temperature control is much more effective at keeping the battery
isothermal, and the differences in battery discharge characteristic due to the temperature
control methods are explored. Finally, the effect of battery temperature on the capacity
of the battery was examined, and results show drastic decreases in battery capacity when
operating at low temperatures for all discharge rates tested. This highlights the importance
of developing a thermal management system capable of keeping the battery at an optimum
28

operating temperature, and hence the need to accurately measure the heat generation rates
of the battery under various discharge and operating conditions.
29

Chapter 3
Calorimetric Measurements of
Prismatic Li-ion Batteries
3.1 Literature Review
The work in the previous chapter quantified the detrimental effects of temperature on
battery characteristics, and in order to extract to develop a system capable of keeping
the battery at isothermal conditions for various operating and discharge conditions, heat
generation mechanisms of Li-ion batteries need to be quantified and studied.
Heat generation in Li-ion batteries includes two main components: reversible heat
generation due to entropic changes in the battery, and irreversible heat generation due to
ohmic losses, charge-transfer overpotentials, and mass transfer limitations [12]. A widely
cited expression for the volumetric heat generation rate of the battery, q′′′ (Wm−3), is given
as follows [12]
q′′′ = i(Voc − V )− i(T ∂VOC
∂T) (3.1)
where i (Am−3) is the volumetric current density which is positive for discharge and neg-
ative for charge, Voc and V (V) are the open circuit voltage and the instantaneous voltage
of the battery respectively, and T (K) is the temperature of the battery.
30

Higher current densities at the current collectors create additional Joule heating. This
additional Joule heating is not an issue for smaller batteries like coin and cylindrical types
commonly used in consumer electronics, but is more apparent in batteries of larger form,
such as the prismatic type used in EVs and HEVs [31, 46, 47, 86]. An equation describing
volumetric heat generation in larger batteries has been developed, accounting for this
additional Joule heating due to higher current densities at the current collectors [31, 82],
q′′′ = aJ
[VOC − V − T
∂VOC
∂T
]+ aprpi
2p + anrni
2n
~ip = − 1
rp∇Vp
~in = − 1
rn∇Vn
(3.2)
where a (m−1) is the specific area of the battery; J (Am−2) is the current density;~ip and~in
(Am−1) are the current density vectors in the positive and negative electrodes; rp and rn (Ω)
are the resistances of the positive and negative electrodes; Vp and Vn (V) are the potentials
of the positive and negative electrodes; ap and an (m−1) are the specific areas of the
positive and negative electrodes, respectively. The addition of the third and fourth terms
account for the additional Joule heating of the positive and negative electrodes due to the
increased current densities at those sites [31, 82]. The parameters in Equations (3.1) and
(3.2) are temperature dependent, and their temperature dependence has to be measured
experimentally for specific batteries. These measurements are difficult to perform, owing
to the three dimensional distribution of current, the changing electrode resistivity due to
current and temperature effects, and the complex behaviour of inter-facial areas of the
electrode and electrolyte. Hence, heat generation in a battery is often measured directly.
Heat generation rates of Li-ion batteries are measured with two main methods: accel-
erated-rate calorimetry (ARC) and isothermal heat conduction calorimetry (IHC), both of
which apply a control volume around the battery, and measure the heat generation, q [W],
such that [7]
q = MCpdT
dt+ hA(Tsurf − Tsink) (3.3)
where M (kg) is the mass of the battery, Cp (Jkg−1K−1) is the heat capacity of the battery,
dT/dt (VK−1) is the change in battery temperature with respect to time, hA (WK−1) is
31
the calorimeter constant, Tsurf (K) is the surface temperature of the battery, and Tsink (K)
is the temperature of the thermal sink surrounding the battery.
The ARC method determines the heat generation rate of the battery by measuring the
rise in battery temperature over time and the amount of heat expelled from the battery
to the surroundings according to Equation (3.3). Li-ion batteries have a layered internal
structure, and hence it is difficult to measure its heat capacity accurately. Since the battery
is an electrochemical device, changes in the battery temperature during testing could lead to
inaccurate heat generation characterization [43]. Hong et al used a commercially available
accelerated rate calorimeter (ARC2000, Columbia Scientific Industries) to measure the
heat generation rates of Sony type US18650 1.35Ah cylindrical Li-ion battery at discharge
rates of C/3, C/2, and C/1 at 308K, with the maximum measured heat generation rates of
1.63 WL−1 [34]. Al Hallaj et al made measurements with the same experimental apparatus
on 18650 Li-ion batteries from AT&T and Panasonic, and found maximum heat generation
rates of 0.26 WL−1 for discharge rates of less than C/10 and charge rates of C/3 [2].
The IHC method utilizes a large heat sink in contact with the surface of the battery to
keep the battery at isothermal operation during measurements, hence eliminating the first
term in Equation (3.3). This technique confines the measurements to low battery discharge
rates, since fast discharge of the battery leads to higher rates of heat generation which the
heat sink cannot extract, causing a temperature gradient within the battery [7]. Kim et al
utilized a commercially available micro-calorimeter (IMC, CSC4400, Calorimetry Science
Corp.) to classify the heat generation rates of Li-ion coin type (size 2016) batteries. The
heat generation rate of the battery was measured using temperature sensors placed between
the battery and an aluminium heat sink and for discharge rates of C/10, C/5, C/3, and C/1
from 300K to 330K. The corresponding maximum heat generation rates were reported as
0.82 WL−1 for discharge rates between C/10 and C/5, 0.97 WL−1 for discharge rates of C/5
to C/2, and 3.21 WL−1 for discharge rates of C/2 to C/1 [45]. Kobayashi et al measured
the heat generation rates of cylindrical Sony US18650 Li-ion batteries using a Calvet-type
conduction micro-calorimeter (MMC5111-U), which has an isothermal aluminium vessel
in contact with the test battery, and a thermomodule was used to measure the amount
of heat transfer from the battery to the heat sink. The battery was discharged at 1/50C
and 1/10C at an ambient temperature of 300K and 330K, and a maximum heat generation
32

rate of 0.97 WL−1 was measured for discharge rates between C/10 and C/5 [50]. Onda et
al measured the heat generation rates of small cylindrical Sony US18650 Li-ion batteries
using a thermal bath as the constant temperature heat sink. The test battery was wrapped
in a thin film for electrical insulation, and the temperature of the battery was recorded
using a type K thermocouple. The battery was discharged at C/10, C/2, and C/1, with a
corresponding maximum measured heat generation rate of 11.0 WL−1, 27.5 WL−1m and
84.5 WL−1 [60]. Bang et al used the same equipment as Kim et al to perform in situ
heat generation rates of a LiMn2O4 coin type Li-ion cell. Measurements were performed
at discharge rates of C/10, C/7, C/3, and C/1 at battery temperatures between 300K and
330K. The results show a maximum heat generation rate of 0.63 WL−1 for discharge rates
of C/10 to C/5, 2.65 WL−1 for discharge rates of C/5 to C/2, and 7.51 WL−1 for discharge
rates of C/2 to C/1 [8].
From the above literature review, it is clear that the previous works on the heat gen-
eration measurement of Li-ion batteries have exhibited a wide range of results, even for
batteries of the same chemistry and form [7]; and they are limited to: (i) small sized
cylindrical or coin type batteries which are not applicable for HEV and EV use; (ii) low
rates of discharge (≤C/1) which are not representative of the electrical needs of the EV;
(iii) battery operation near room temperatures, which do not reflect the wide range of
operating temperatures of EVs. Therefore, the objective of the work in this chapter is to
measure the heat generation rates for large prismatic type of Li-ion batteries for a wide
range of discharge rates and operating temperatures, as encountered by EVs and HEVs.
In this chapter, an experimental technique that can accurately measure the heat genera-
tion rates of prismatic Li-ion batteries is developed, and the heat generation rates of an
A123 prismatic LiFePO4 battery with a 20Ah capacity for use in automotive applications
is measured and verified for various discharge and operating conditions.
3.2 Apparatus Design
The calorimeter is constructed by surrounding the battery with a material of known ther-
mal properties (hereafter referred to as calorimeter material) such that a temperature
profile within the material can be deduced for any battery heat generation rate. Prismatic
33

batteries have a high surface area to thickness ratio, which promotes heat transfer from its
front and back faces. Hence, the calorimeter is in the form of two identical slabs attached
to the front and back faces of the test battery. The heat generated by the battery is con-
ducted through the slabs into a constant temperature heat sink. Measured temperature
change within the calorimeter material due to the heat generated by the battery can be
used to infer the unknown heat generation rate of the battery. For the calorimeter design
process, heat generated by the battery is estimated to be in the range of 10W, and simula-
tions are performed to estimate the temperature rise in the different calorimeter materials
of various thickness due to the heat generation rate. High density polyethylene (HDPE)
is selected as the calorimeter material due to its stable thermal properties at the planned
test temperatures and its high temperature rise due to the estimated heat generation rate
of the battery.
An exploded view of the calorimeter is shown in Figure 3.1. The Li-ion battery is placed
between two HDPE slabs, both of which are five times the thickness of the battery. A coat-
ing of thermal grease is applied to the surface of the battery to minimize contact resistance
between the battery and HDPE surfaces. The HDPE slabs with the battery are placed
between two aluminium slabs. This prevents deformation of the softer HDPE material
during assembly to ensure good surface contact between the battery face and the HDPE.
The calorimeter is bolted together in eight locations, tightened in a criss-cross pattern to
ensure even tightening, and is immersed in a constant temperature bath (ThermoFisher
A25B, accuracy of ±0.1C). The working fluid within the thermal bath is a 50-50 mixture
of water-ethylene glycol, which allows measurements at sub-zero temperatures. Two high
accuracy thermocouples (with accuracy of ± 0.1C) are embedded 4mm away from the
battery contact surface vertically into the HDPE material (one in each slab), centred on
the battery. The placement of the thermocouple at the center of the battery minimizes
the edge effects of heat transfer from the HDPE to the surroundings. Two additional
thermocouples are placed at the surface of the battery to monitor the battery temperature
throughout testing (not shown in Figure 3.1). An insulating cover is placed over the as-
sembly such that the battery terminals are exposed to air, which minimizes heat transfer
from both the bath and the top of the calorimeter to the ambient. A schematic of the
experimental apparatus is shown in Figure 3.2.
34

Figure 3.1: Exploded (left) and assembled (right) view of the experimental setup for the
measurement of heat generation of prismatic Li-ion batteries. HDPE stands for high den-
sity polyethylene.
35

Figure 3.2: Schematic of the complete experimental setup.
The tested battery is the aforementioned LiFePO4 prismatic Li-ion battery from A123,
although any battery (Li-ion or otherwise) of prismatic shape can be used in the calorime-
ter. The battery is controlled via the Greenlight Innovations G12-200 multichannel battery
test station described in the previous chapter.
The temperature profile within the HDPE slab depends on its thermal properties;
inaccuracies in the thermal properties can lead to error in the measurements. Due to
the variance in thermal conductivity provided by various suppliers of HDPE material, the
thermal conductivity of the HDPE material is measured according to ASTM E1225-09 [5].
From ASTM E1225-09, the thermal conductivity of a material can be determined through
the measurement of the materials’ thermal resistivity. Detailed design of the experiment
36
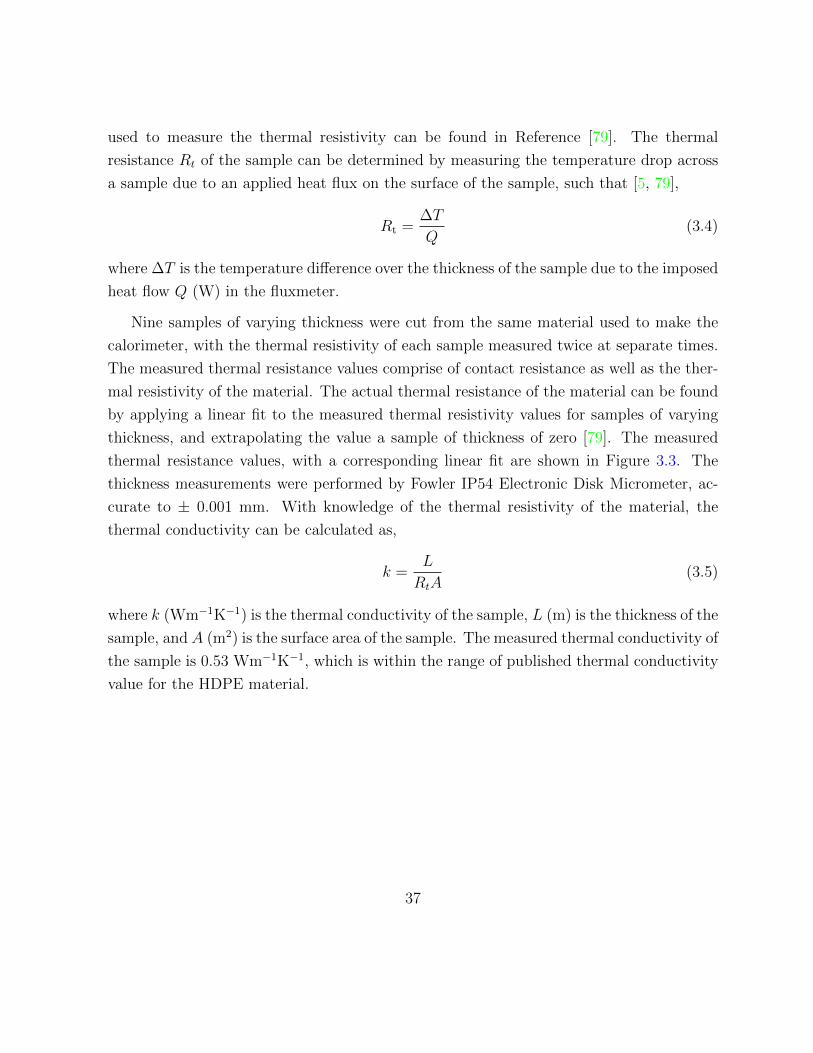
used to measure the thermal resistivity can be found in Reference [79]. The thermal
resistance Rt of the sample can be determined by measuring the temperature drop across
a sample due to an applied heat flux on the surface of the sample, such that [5, 79],
Rt =∆T
Q(3.4)
where ∆T is the temperature difference over the thickness of the sample due to the imposed
heat flow Q (W) in the fluxmeter.
Nine samples of varying thickness were cut from the same material used to make the
calorimeter, with the thermal resistivity of each sample measured twice at separate times.
The measured thermal resistance values comprise of contact resistance as well as the ther-
mal resistivity of the material. The actual thermal resistance of the material can be found
by applying a linear fit to the measured thermal resistivity values for samples of varying
thickness, and extrapolating the value a sample of thickness of zero [79]. The measured
thermal resistance values, with a corresponding linear fit are shown in Figure 3.3. The
thickness measurements were performed by Fowler IP54 Electronic Disk Micrometer, ac-
curate to ± 0.001 mm. With knowledge of the thermal resistivity of the material, the
thermal conductivity can be calculated as,
k =L
RtA(3.5)
where k (Wm−1K−1) is the thermal conductivity of the sample, L (m) is the thickness of the
sample, and A (m2) is the surface area of the sample. The measured thermal conductivity of
the sample is 0.53 Wm−1K−1, which is within the range of published thermal conductivity
value for the HDPE material.
37

Figure 3.3: Thermal resistivity measurements of the High Density Polyethylene slab
Ten cubes measuring 25.4cm by 25.4cm by 25.4cm of HDPE were cut from the same
material that was used to make the calorimeter in order to determine the HDPE material
density. The dimensions were measured using the aforementioned Fowler micrometer, and
the weight of the samples were measured by Denver Instruments TP-323 scale (± 0.003g).
The density of the samples were measured to be 956.91 kgm−3. The specific heat of the
HDPE material does not vary greatly within the range of tested temperatures, and is taken
as 2.25 kgkJ−1K−1 (specific heat of the material at 23C) [64].
38

3.3 Experimental Condition and Procedure
The discharge rates will be described in terms of C-rates, where 1C is the discharge rate
at which the battery will be fully depleted in one hour of operation (20A for the test
battery), 2C the rate at which the battery is fully depleted in 30 minutes (40A), etc. The
heat generation rates will be measured for five different battery discharge rates (0.25C,
0.5C, 1C, 2C, 3C), at six operating temperatures from -10C to 40C in 10C increments.
The battery is cycled five times to the cut-off voltage of 2.6V before testing, which allows
irreversible capacity fade that may be present in unused Li-ion batteries to occur [34].
At the end of discharge, the battery is allowed to rest for two hours before being
charged back to the open circuit voltage of 3.6V at a C/5 charge rate under a constant
voltage constant current charging scheme. Following the completion of charge, the battery
is allowed to rest for an hour to ensure the equilibration of battery chemistry. The details
of the charge and discharge schedule can be seen in Figure 3.4.
39
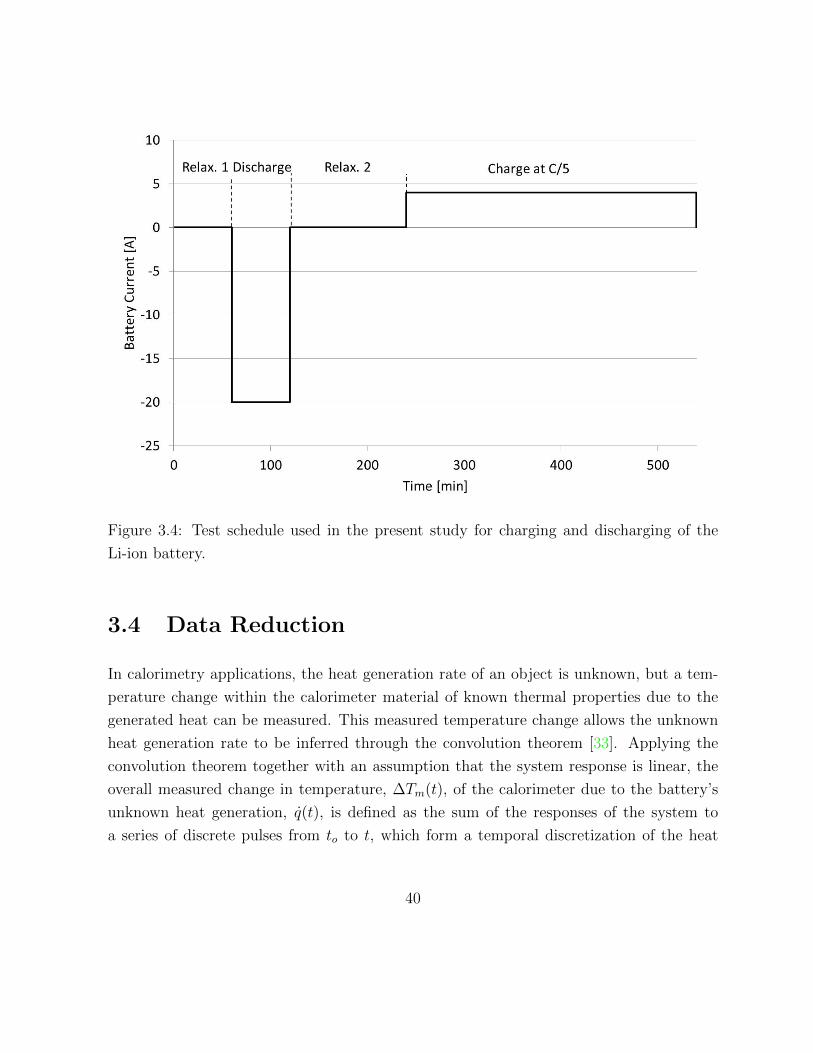
Figure 3.4: Test schedule used in the present study for charging and discharging of the
Li-ion battery.
3.4 Data Reduction
In calorimetry applications, the heat generation rate of an object is unknown, but a tem-
perature change within the calorimeter material of known thermal properties due to the
generated heat can be measured. This measured temperature change allows the unknown
heat generation rate to be inferred through the convolution theorem [33]. Applying the
convolution theorem together with an assumption that the system response is linear, the
overall measured change in temperature, ∆Tm(t), of the calorimeter due to the battery’s
unknown heat generation, q(t), is defined as the sum of the responses of the system to
a series of discrete pulses from to to t, which form a temporal discretization of the heat
40

generation rate [33]. This can be written as the convolution integral [33],
∆Tm =
∫ t
to
q(τ)φ(t− τ)d(τ) (3.6)
where φ(t − τ) is the apparatus function, which can be defined as the response of the
apparatus to a pulse heat generation. The apparatus function is typically measured through
the system response to a pulse in a calibrated heater. With a known apparatus function, the
real event of heat generation can be solved for by the deconvolution of Equation (3.6) either
by using the Fourier transform or the recursion method [33]. Solving Equation (3.6) by
Fourier transforms can lead to results that show periodicities and fluctuations that do not
reflect the actual processes being measured, and the application of recursion method does
not converge for all heat generation events, especially for abrupt changes and steps [33].
Since both solution methods use a measured apparatus function, errors in measurement
while obtaining the apparatus function are propagated forward in calculations of actual
heat generation rate.
In this thesis, obtaining the real event from the measured response of the system is done
by treating the problem as an inverse heat conduction problem (IHCP). IHCP is similar
to the aforementioned recursion method, but is distinct in two main ways: (i) the method
does not require a measured apparatus function, which eliminates the propagation of error
due to measurement of the apparatus function; (ii) the problem is broken down into two
separate and equal heat conduction problems where the volumetric heat generation rate
of the battery is determined as heat fluxes applied to the contact area between the HDPE
slab and the battery.
The experimental apparatus utilizes two HDPE slabs as the heat conduction medium.
The aluminium slabs are assumed to be at the temperature of the thermal bath due to its
high thermal conductivity compared to the HDPE slabs. Due to the aforementioned form
of the battery, the heat generated by the battery flowing through the calorimeter material
can be assumed to be one dimensional, such that the total heat generated by the battery,
q, is equivalent to two separate and equal heat fluxes, q′′, applied by the battery onto the
calorimeter material. Heat diffusion equations describing the calorimeter can be set up as
shown in Figure 3.5.
41

Figure 3.5: Problem setup for the measurement of inner temperature of the high density
polyethylene (HDPE) slab Tmeasured from an imposed surface heat flux q′′ due to the heat
generated in the test battery.
The measured temperature change at a specific location within the HDPE slabs due
to the imposed heat flux (q′′) by the battery can be defined as Tmeasured. The temperature
distribution within the HDPE slab is governed by Fick’s law, and the following boundary
and initial conditions
∂2T
∂2x=
1
α
∂T
∂t
T (x, 0) = Tb
T (L, t) = Tb
− k∂T∂x
(0, t) = q′′
(3.7)
where α (m2s−1) is the thermal diffusivity of the calorimeter material (HDPE in the present
study), subscripts 0 and L denote the locations on the HDPE slabs at the contact with the
42

battery and the aluminium slab respectively, and the subscript b denotes the temperature of
the constant temperature bath. The temperature of the aluminium slabs can be assumed to
be the same as the bath temperature due to its high thermal conductivity. The temperature
increase at the measurement location x within the HDPE slab for a unit step increase in
heat flux has to be found, such that
∆Tm = Tx(t)− Tb = q′′[φ(x, t)] (3.8)
where φ(x, t) is the temperature rise at point x due to the applied heat flux. φ(x, t) can
be found by solving the governing equations (Equation (3.7)) and (3.8), such that
Tx(t)− Tb = q′′
[∞∑n=1
−1
k
[8(−1)1+nL
π2(4n2 − 4n+ 1)
]sin
((2n− 1)πx
2L
)
exp
(−[
(2n− 1)π
2L
]2αt
)+x
k
] (3.9)
The convolution theorem can be applied using the apparatus function and the measured
temperature change within the heat conduction medium. Owing to the discrete nature
of the thermocouple measurements, Tx(t), a discretized approximation of the convolution
integral can be written as [11]
Tx(t)− Tb =M∑n=1
q′′n[φ(x, tM−n+1)− φ(tM−n)
](3.10)
Inverse heat conduction problems (IHCP) use a measured temperature change within
a material of known thermal properties to infer a heat flux that is applied to one of the
boundaries [11]. IHCPs are ill-posed, owing to the divergence of its solutions which may
occur due to small perturbations in the measured temperature from either noise or random
errors in the experiment [10, 85]. For this study, Beck’s Sequential Function Specification
Method (Beck’s Method) is used to introduce stability in the IHCP solution [11]. Beck’s
method increases the stability by introducing additional information about the problem by
specifying that the solution is temporally smooth. The method assumes that the unknown
heat flux q′′ is temporarily fixed over a number of future time steps, r, with each time step
43

having a period of ∆t. Using Beck’s Method, Equation (3.10) can be written in matrix
form as [11]
∆φ0
∆φ1 ∆φ0
......
. . .
∆φM−1 ∆φM−2 · · · ∆φ0
∆φM ∆φM−1 · · · ∆φ1 ∆φ0
∆φM+r−1 ∆φM+r−2 · · · · · · ∆φ1 ∆φ0
q1
q2...
qM
qM+1
qM+r−1
=
T1
T2...
TM
TM+1
TM+r−1
(3.11)
The matrix of ∆φ’s represent the apparatus functions, which have been derived analytically
from Equation (3.9). The matrix of T ’s represent the measured temperature change within
the HDPE slabs due to the heat flux applied by the battery. The unknown heat flux at the
surface of interest can be calculated using matrix manipulation techniques, after which it
is then integrated to obtain the transient total heat generation rate of the battery. Exact
solution to Equation (3.11) is obtained with a r value of 1, and the smoothness of the
solution is increased with increasing values of r. An increase in r causes a decrease in
sensitivity of the calculated heat flux at the surface of the HDPE slabs to oscillations in
the temperature measurements, introducing more stability into the solution. Increased r
values can also cause increased bias and decreased resolution in the calculated profile q′′,
decreasing the values of the peaks in heat measurement. Therefore, the tuning parameters
in Beck’s Method needs to be carefully tuned to provide accurate results.
To tune the parameters in Becks method, Woodbury and Thackur defined a ‘look ahead
parameter’, p, as [85]
p = r∆t (3.12)
and showed that the calculated heat flux at the surface of interest has the same resolution
and bias regardless of the value of r and ∆t as long as p remains constant [85]. They
concluded that adjustments need to be made to p such that the RMS error of the predicted
temperature at any arbitrary location within the material is equivalent to the amount of
noise in the measured data [85]. While manufacturer provided values for measurement
errors can be used, Woodbury suggested experimentally determining the measurement
44

errors to increase accuracy in ascertaining the value of p, which is the approach adopted
in the presented study and will be described in the following section [85].
3.5 Calibration
Noise in the temperature readings and steady state error of the calorimeter is determined
using a controllable pseudo battery. The pseudo battery is made using a silicone heating
pad (Omega Inc SRFR-609) with the same dimensions as the battery. The heat generation
rate of the pseudo battery is controlled via a variable voltage supply (Keithley 2700).
Calibration tests are performed with a heater output of 10W for two hours, during which
the response of the system reaches steady state. After two hours, the heater is turned off,
creating a step down in heat generation rate. The calorimeter is allowed to return to the
initial conditions, and the calibration process is repeated for all the operating temperatures
of the battery tests.
The standard deviation of the temperature measurements over 1000 seconds after the
calorimeter reached steady state is calculated for ten separate tests, with the same heat
generation rate and operating temperatures. The standard deviation values of the ten tests
are averaged and calculated to be 0.025C. Smoothing parameter p can be tuned using
the obtained value of measurement error. Beck’s method is applied to the temperature
measurements with various values of p in order to calculate the heat flux at the surface of
interest. The calculated heat flux is then used in Equation (3.9) to calculate the projected
temperature at a distance of 4mm away from the surface of interest (same location as
the thermocouple). Parameter p is adjusted such that the RMS error of the projected
temperature matched the standard deviation of the actual temperature measurement, with
the final, adjusted value of p being 100.
Beck’s method (with p = 100) is applied to the measured temperature data to calculate
the applied heat flux at the surface of interest for all operating temperatures tested. A
comparison between the calculated heat generation rate using Beck’s method and the actual
heat generation rate of the heater at an operating temperature of 10C is shown in Figure
3.6. The difference in the surface temperatures of the pseudo battery at the beginning of
validation test and the step down event in heat generation signifies that there is stored
45
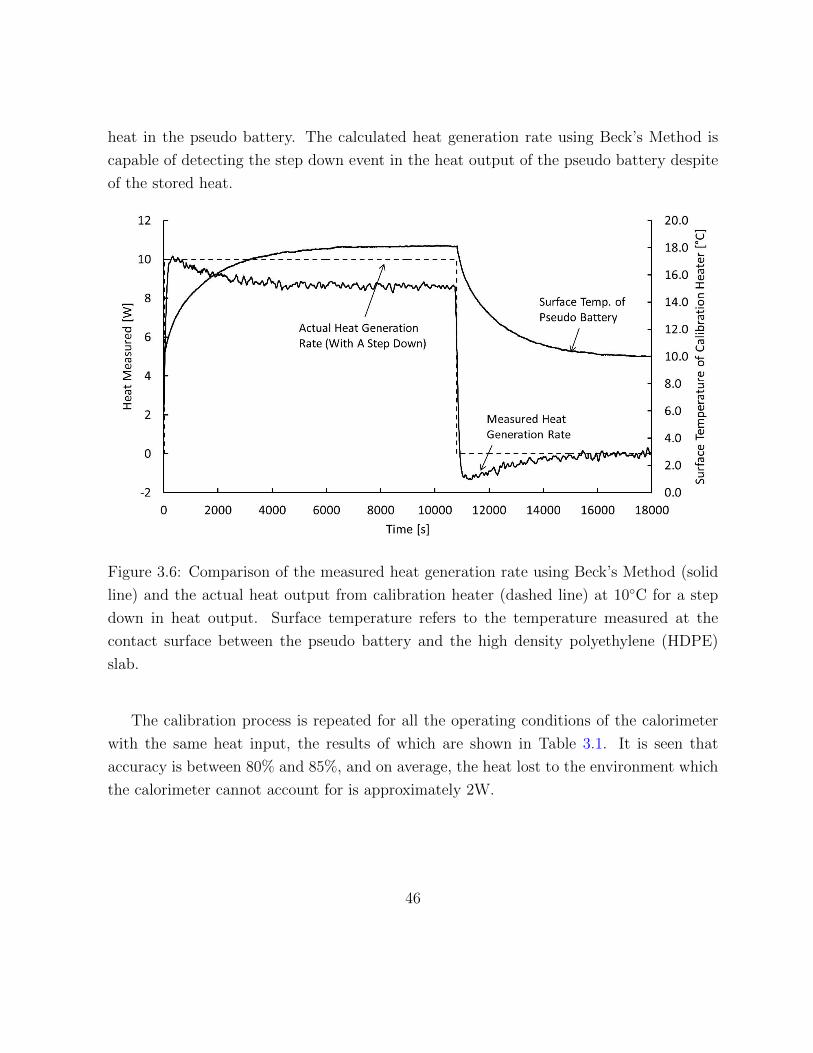
heat in the pseudo battery. The calculated heat generation rate using Beck’s Method is
capable of detecting the step down event in the heat output of the pseudo battery despite
of the stored heat.
Figure 3.6: Comparison of the measured heat generation rate using Beck’s Method (solid
line) and the actual heat output from calibration heater (dashed line) at 10C for a step
down in heat output. Surface temperature refers to the temperature measured at the
contact surface between the pseudo battery and the high density polyethylene (HDPE)
slab.
The calibration process is repeated for all the operating conditions of the calorimeter
with the same heat input, the results of which are shown in Table 3.1. It is seen that
accuracy is between 80% and 85%, and on average, the heat lost to the environment which
the calorimeter cannot account for is approximately 2W.
46

Table 3.1: Accuracy and standard deviation of heat generation measured by battery
calorimeter for varying operating temperatures
Operating Temp. 40C 30C 20C 10C 0C -10C
Accuracy 81% 84.4% 83.8% 84.1% 82.0% 80.1%
Standard Deviation 0.061W 0.052W 0.020W 0.041W 0.017W 0.066W
47

Chapter 4
Results and Discussion
The LiFePO4 battery is tested as described in Section 2.2. All results shown in this section
are average measurements of five repetitive tests. The maximum standard deviation in
battery voltage throughout discharge for all tested operating temperatures is 0.13V for 3C
discharge, while the open circuit voltage of the test battery is 3.6V.
From Equation (3.1) and (3.2), the rate of heat generation is dependent on two main
parameters, discharge current and battery temperature. The following sections will sum-
marize the observed effects of both battery discharge rate and operating temperature on
battery heat generation rates.
4.1 Effect of Discharge Rate on
Heat Generation Rate
Figure 4.1 shows the measured heat generation rates of the battery for all tested discharge
rates at 20C as a function of depth of discharge (varying from 0 to 1). There is a clear
increase in battery heat generation throughout discharge at increased rates of discharge due
to the higher irreversible heat generation. Irreversible heat generation is shown in Equation
(3.1) and (3.2) as a function of current squared, whereas reversible heat generation is a
linear function of current; therefore increasing the discharge current causes a corresponding
48

change in the proportion of the irreversible heat generation in the total heat generation of
the battery. The total battery heat generation at 0.25C is shown to be almost negligible
when compared to the total amount of heat generated when the battery is discharged at
3C at 20C.
Figure 4.1: Effect of tested discharge rates on the heat generation rate of an A123 LiFePO4
battery at an operating temperature of 20C.
The heat generation can be non-dimensionalized by dividing the heat generated during
battery discharge by the instantaneous amount of electrical power drawn from the battery.
Non-dimensionalized heat generation provides a clearer representation of the heat genera-
tion characteristics throughout the discharge test, as shown in Figure 4.2. It can be seen
that the proportion of heat generated to the instantaneous power drawn from the battery
is under 0.10 for all discharge rates, regardless of discharge current. This shows that the
proportion of electrical energy lost due to conversion to waste heat is on the same order of
magnitude for all discharge rates.
49

Figure 4.2: Effect of discharge rate on the heat generation rate, non-dimensionalized by
electrical power drawn, of A123 LiFePO4 battery at an operating temperature of 20C.
The increase in non-dimensionalized heat generation at the higher rates of discharge can
be related to two main factors: increased Joule heating at the battery current collectors
and increased battery overpotentials at higher rates of discharge. Increases in battery
discharge current directly increases the amplitude of the Joule heating due to increased
current density near the current collectors. The overpotentials of the battery increase as
the current drawn from the battery is increased according to the Tafel equation [67]. There
is an increased amount of noise in the determined heat generation value for discharge rates
less than 1C, caused by increased noise to signal ratio at lower battery heat generation
rates.
As the discharge rate of the battery is decreased to less than 1C, irreversible heat
generation (which is always exothermic) is reduced, and endothermic heat flow due to
reversible heat generation can be observed in the measured heat generation curves. Figure
50

4.3 shows the heat generation profile at 0.5C discharge rate with the corresponding voltage
discharge curves. Endothermic heat flow for 0.5C discharge rate can be observed for the
battery operating temperatures of 30C and 40C. At a 0.25C discharge rate, endothermic
heat flow during discharge can be observed for the battery operating temperatures from
0C to 40C (See Appendices for details).
(a) Heat generation (b) Battery discharge curve
Figure 4.3: Effect of battery operating temperature on (a) heat generation rate and (b)
battery discharge curve for an A123 LiFePO4 battery at 0.5C discharge.
Non-uniform current distribution and concentration gradients on the electrodes due to
limits in mass transfer can cause heat of mixing, which could be endothermic during the
discharge [76]. The development of current and concentration gradients in the battery is
caused by high discharge rates required of Li-ion batteries due to sudden EV acceleration.
The amount of heat absorbed during the formation of the gradients will be released after the
end of battery discharge, as the developed gradients relax to equilibrium. Heat of mixing
increases at higher rates of discharge, and has been cited as a significant contributor to
battery heat generation at discharge rates higher than 1C [2, 76].
As the battery discharge stops (and i goes to zero in Equation (3.1) and (3.2)), the
heat generated by the battery should theoretically go to 0. Therefore, the existence of
heat of mixing can be confirmed by examining the heat generation characteristics of the
battery after the end of discharge. Figure 4.4 shows the existence of heat generation after
51

battery discharge terminates at 1C and 20C where the heat generated by the battery after
the end of discharge is representative of 16% of the total heat generation. It is shown in
Section 3.5 that the data reduction technique is capable of detecting a step down in heat
generation rate despite heat stored in the calibration test apparatus, therefore it is unlikely
the observed heat generation phenomenon is due to the stored heat in the system.
Figure 4.4: Battery discharge curve and measured heat generation profile of an A123
LiFePO4 battery, for 1C discharge at 20C. Measurements show the presence of additional
heat generation post end of discharge.
Heat of mixing has been observed for small cylindrical Li-ion batteries, though only
for discharge rates higher than or equal to 1C [2, 34]. The contribution of heat of mixing
to the total heat generation of small cylindrical Li-ion batteries is generally neglected for
discharge rates lower than 1C [8, 54]. For this study, the heat of mixing can be observed
for the lowest discharge rate tested (0.25C), at both 40C and -10C, as seen in Figure
4.5a and Figure 4.5b respectively. Heat generation after the end of discharge contributes
significantly to the total heat generated by the battery, accounting for 13% of the total
52

heat generation at -10C. Therefore, heat of mixing for large prismatic Li-ion batteries
should not be ignored at discharge rates higher than 0.25C.
(a) 40C
(b) -10C
Figure 4.5: Battery discharge curve and measured heat generation profile of an A123
LiFePO4 battery, at 0.25C discharge, showing battery heat generation post the end of
discharge for operating temperatures of (a) 40C, and (b) -10C.
53

4.2 Effect of Operating Temperature on
Heat Generation Rate
Figure 4.6a shows the battery heat generation rate profiles at various battery operating
temperatures for a 1C discharge rate. It is seen that heat generation rates are greatly
increased at lower temperatures, signifying the degradation of battery performance sub-
stantially. The heat generation rates of the battery at 30C and 40C is very similar at a
1C discharge rate, which shows increased proportion of the reversible heat generation in
the total heat generation rate of the battery.
(a) Heat generation (b) Battery discharge curve
Figure 4.6: Effect of battery operating temperature on (a) the heat generation rate and
(b) the battery discharge curve of an A123 LiFePO4 battery, for 1C discharge.
Battery internal resistance, the main cause of the irreversible heating in Equation (3.1),
is dependent on the temperature. Previous work on small, cylindrical Li-ion batteries has
shown a strong dependence of battery internal resistance on temperature, and the in-
crease in battery internal resistance at low temperatures causes an increased amount of
irreversible heat generation [40, 42, 44]. Decreased battery heat generation at higher oper-
ating temperatures is also due to increased rates of mass transport and reduced activation
loss which decreases overpotential during discharge. Decreased overpotential translates to
the diminished rates of irreversible heat generation at the beginning of discharge.
54

Battery discharge curves corresponding to the heat generation profiles at 1C discharge
for all tested operating temperatures can be seen in Figure 4.6b. Discharge from -10C to
20C shows quasi-linear voltage drops with respect to depth of discharge, similar to what
is commonly seen in literature. At battery operating temperatures higher than 20C, two
low frequency fluctuations in battery discharge curve are visible, the first of which occurs
at a DOD of approximately 0.3, and the second at a DOD of approximately 0.8. This
phenomenon has not been seen in literature for LiFePO4 battery; it is commonly seen in
Li-ion batteries of LiMnO4 chemistry, and is caused by phase change mechanisms during
discharge [8, 45].
As the amount of irreversible heat decreases at higher battery operating temperatures,
additional features in the heat generation profile is more visible. Figure 4.6a shows a
distinct decrease in heat generation at a depth of discharge (DOD) of approximately 0.3,
with heat generation reaching a minimum at a DOD of approximately 0.5 for all battery
operating temperatures. At battery temperatures of 0C, 10C, and 20C, the decreased
rate of heat generation causes the overall measured heat generation profile to form a dis-
tinct S-shape, with a single peak in exothermic heat flow during discharge. For operating
temperatures higher than 20C, a plateauing of heat generation is observed at a DOD of
approximately 0.8 (shown as area A in Figure 4.6a). A comparison of the heat generation
profiles of the battery at 0C and 40C is shown in Figure 4.7. The secondary plateau in
heat generation rate can be observed for all discharge rates tested at 40C, as shown in
Figure 4.7a, but is not visible for battery operating temperature of 0C (Figure 4.7b). This
shows the dependence of the observed secondary plateauing phenomenon on the operating
temperature of the battery.
55

(a) 40C (b) 0C
Figure 4.7: Heat generation rate of an A123 LiFePO4 battery at (a) 40C and (b) 0C
for all tested discharge rates. Secondary plateauing in heat generation rate at a depth of
discharge of 0.8 can be observed for all discharge rates tested at 40C.
The observed features in the heat generation profile of the battery is more discernible
at high battery operating temperatures. The transitions between plateaus in the battery
discharge curve correspond to rapid change in the measured heat generation rates of the
battery for 0.25C discharge at 30C and 40C, as seen in Figure 4.8.
56

Figure 4.8: Heat generation rates and battery discharge curves for 0.25C discharge at 30C
and 40C. Transitions between voltage discharge curve plateaus correspond to regions of
rapid change in the measured battery heat generation.
The decrease in heat generation during discharge can be attributed to phase change
mechanisms, which corresponds to transition regions between voltage plateaus in the bat-
tery discharge curves of LiMnO4 batteries [3, 60]. Phase change mechanisms in LiFePO4
remain a topic of investigation, with the existence of multiple models that are supported
by experimental data [53]. Most models show the existence of only two phases in the phase
change process [72, 87], although recent developments have shown the existence of tran-
sient phase changes through in-situ observations [61]. Double plateaus in voltage curve
has been attributed to a double phase change in LiMnO4 batteries [8, 45] which leads to
the hypothesis that the presence of a double phase change is possible for LiFePO4 batteries
at higher battery operating temperatures at low discharge rates. The double plateau in
the battery voltage for LiFePO4 at higher battery operating temperatures have not been
57

reported in literature.
Through observations of heat generation phenomena in the tested LiFePO4 battery,
commonly used heat generation equations such as Equation (3.1) and (3.2) need to be mod-
ified to accurately model the complex heat generation characteristics of LiFePO4 batteries.
The fluctuations in heat generation rate and the double plateauing of the battery discharge
curve at increased operating temperatures and decreased discharge rates warrants further
investigation for better understanding of the phase change and heat generation mechanisms
of large prismatic Li-ion batteries.
4.3 Validation of Results
The calculated heat generation rates of the battery using Beck’s Method can be validated
using the same experimental validation setup as discussed in Section 3.5. The pseudo
battery comprising of the flexible silicone heater between two steel sheets takes the place
of the actual battery inside the calorimeter, and its heat output is that of the measured
heat generation rate of the actual battery. The temperature change within the HDPE slabs
due to the heat generated by both the pseudo and test batteries are compared. A high
coefficient of determination between the two system responses denotes that the measured
heat generation rates of the test battery is accurate.
The measured heat generation rates of the test battery at 1C, 2C, and 3C discharge
are used as heat output of the pseudo battery. Heat flow from the battery at discharge
rates of 0.25C and 0.5C at high battery operating temperatures can be endothermic, which
cannot be recreated by the pseudo battery and hence will be excluded from the validation
tests. A comparison of the temperature increase between the validation and actual battery
discharge tests at the temperature of 20C is shown in Figure 4.9. At 20C, the measured
temperature increase within the HDPE slab for both the validation and battery discharge
test is very close, achieving a R-squared value of above 0.99 for all discharge rates validated.
58

Figure 4.9: Comparison of the temperature measurements for the validation test and actual
battery discharge for 1C, 2C and 3C discharge rates at an operating temperature of 20C.
For other battery operating temperatures and discharge rates, the average temperature
increase within the HDPE slab for the validation test and actual battery discharge achieve
a minimum R-squared value of 0.98. The largest variations between the measured response
of the calorimeter during real battery testing and pseudo battery testing occurs at high
temperatures when the heat flow from the battery reaches near endothermic levels. This
shows that the obtained results using Beck’s method is a good representation of the actual
heat generation rates of the battery for all operating temperatures and discharge rates
investigated.
A summary of the measured total heat generation rates at the tested discharge rates
and temperatures is shown in Table 4.1. The results are shown as a range due to the
variation of heat generation rate of the battery throughout discharge. It can be seen that
the minimum measured heat flow from the battery are endothermic at 0.25C discharge,
59

for the majority of tested temperatures. Complete heat generation curves throughout
discharge for all tested discharge rates and battery operating temperatures are available in
the Appendices.
Table 4.1: Summary of measured LiFePO4 heat generation rates at all tested discharge
rates and battery operating temperatures
Battery
Temp.
Discharge Rate
0.25C 0.5C 1C 2C 3C
-10C 0 - 2.09W 0 - 5.29W 0 - 10.82W 0 - 24.71W —
0C -0.33 - 2.05W 0 - 5.20W 0 - 10.21W 0 - 19.52W 0 - 29.93W
10C -0.24 - 1.43W 0 - 4.37W 0 - 8.87W 0 - 16.72W 0 - 24.79W
20C -0.44 - 0.87W 0 - 3.32W 0 - 4.92W 0 - 13.78W 0 - 4.92W
30C -0.46 - 0.85W -0.33 - 1.86W 0 - 4.56W 0 - 10.39W 0 - 16.48W
40C -0.43 - 0.71W -0.44 - 1.62W 0 - 3.70W 0 - 7.88W 0 - 14.21W
60

Chapter 5
Conclusions
5.1 Summary
The work in this thesis can be broken into two sections. Firstly, a method of temperature
control for large prismatic batteries using water-ethylene glycol mixture is developed for
the accurate measurement of the battery discharge characteristics. It is shown for the
tested battery, a prismatic A123 LiFePO4 battery, that the temperature variation is lim-
ited to 0.3C over the time of the battery characterization test (from the beginning to
the end of the test) and 0.4C over the battery surface (spatial change) at the high dis-
charge rate of 3C. This is in contrast with the temperature variation of 13.1C temporally
and 4.3C spatially when using the conventional method of battery temperature control
through air convection under the same test condition. Battery capacity is significantly in-
fluenced by its operating temperature, and can have a difference of as much as 25% when
using the two different methods of battery temperature control due to the significant tem-
poral and spatial temperature differences during testing. The new method of temperature
control developed can yield more accurate characterization of battery discharge due to the
elimination of state-of-charge drift caused by spatial variations in battery temperature,
and inaccurate discharge characteristics due to battery heat up at various discharge and
operating conditions.
Battery characterization tests were performed at various operating temperatures using
61

the developed temperature control method. Low temperature operation of the battery
shows a dramatic decrease in battery capacity, with a decrease of approximately 95% in
available battery energy between battery discharged at 20C and -10C at a 3C discharge
rate. Reduction in available battery energy is less dramatic at lower discharge rates, show-
ing a decrease of approximately 36% at a discharge rate of 0.2C for the same temperature
change in battery operating temperature. The results of battery testing show the im-
portance of controlling the battery temperature at optimum levels, and the importance
of characterizing the heat generation rates of the battery such that an effective thermal
management system capable of holding the battery at these optimum temperatures can be
designed.
A method of heat generation measurement for a prismatic battery is developed in
the second part of the thesis, which is applicable to any prismatic battery regardless of
chemistries. The heat generation rate of a 20Ah prismatic A123 LiFePO4 battery is mea-
sured under a wide range of discharge rates and operating temperatures. It is shown that
the heat generation rate of the tested battery increases with the discharge rate, and de-
creases with the operating temperature. Heat of mixing, which is ignored in literature
for discharge rates lower than 1C is observed at a discharge rate as low as 0.25C for all
tested battery operating temperatures. The magnitude of the heat of mixing at -10C
for 0.25C discharge accounts for 13% of the overall heat generated during discharge and
hence cannot be ignored for prismatic LiFePO4 batteries. Measured heat generation rates
follow an S-shape profile, with exothermic heat flow at the beginning and end of dis-
charge, and a decrease in heat generation rate at a depth of discharge of approximately
0.3. For rates of discharge lower than 1C, the decrease in heat flow is reduced to en-
dothermic levels, especially at high battery operating temperatures. A visible secondary
plateau in heat generation can be observed for increased battery operating temperatures
at a depth of discharge of approximately 0.8. Transitions between the voltage discharge
curve plateaus correspond to regions of rapid change in measured battery heat generation.
Double plateaus in battery discharge curve show the possibility of a double phase change
mechanism at lower rates of discharge for high battery operating temperatures.
The measured heat generation is validated by using a controllable power supply and a
resistance heater, and it is shown that the present technique can accurately recreate the
62
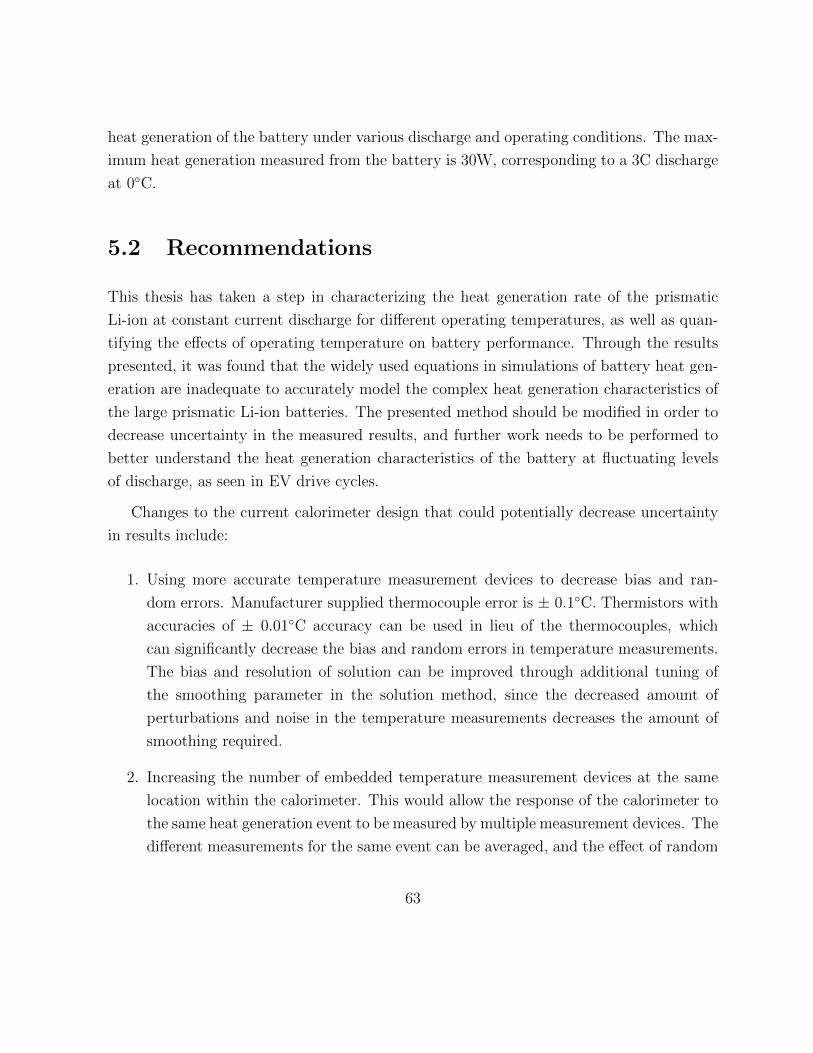
heat generation of the battery under various discharge and operating conditions. The max-
imum heat generation measured from the battery is 30W, corresponding to a 3C discharge
at 0C.
5.2 Recommendations
This thesis has taken a step in characterizing the heat generation rate of the prismatic
Li-ion at constant current discharge for different operating temperatures, as well as quan-
tifying the effects of operating temperature on battery performance. Through the results
presented, it was found that the widely used equations in simulations of battery heat gen-
eration are inadequate to accurately model the complex heat generation characteristics of
the large prismatic Li-ion batteries. The presented method should be modified in order to
decrease uncertainty in the measured results, and further work needs to be performed to
better understand the heat generation characteristics of the battery at fluctuating levels
of discharge, as seen in EV drive cycles.
Changes to the current calorimeter design that could potentially decrease uncertainty
in results include:
1. Using more accurate temperature measurement devices to decrease bias and ran-
dom errors. Manufacturer supplied thermocouple error is ± 0.1C. Thermistors with
accuracies of ± 0.01C accuracy can be used in lieu of the thermocouples, which
can significantly decrease the bias and random errors in temperature measurements.
The bias and resolution of solution can be improved through additional tuning of
the smoothing parameter in the solution method, since the decreased amount of
perturbations and noise in the temperature measurements decreases the amount of
smoothing required.
2. Increasing the number of embedded temperature measurement devices at the same
location within the calorimeter. This would allow the response of the calorimeter to
the same heat generation event to be measured by multiple measurement devices. The
different measurements for the same event can be averaged, and the effect of random
63

errors from the measurement devices on the calculated heat generation curve would
be reduced.
3. Low frequency filtering can be performed on the raw data to decrease the effect of
low frequency noise on the calculated heat generation rate. Low frequency noise
exists in the measured data due to the style of temperature control in the thermal
bath. The amount of low frequency noise in the temperature data can be obtained
from the signal by applying a high ordered polynomial curve fit to the temperature
measurements [37]. This curve fit represents the low frequency oscillations in the
data, which can then be subtracted from the actual temperature signal.
Changes to the current calorimeter design and testing procedures to increase function-
ality include:
1. Embedding additional temperature measurement devices at different locations in the
calorimeter material, which can provide heat generation rates at various locations in
the battery. This can be used to generate a surface plot of the heat generation rates
of the battery, and can allow areas of high heat generation (especially around the
current collectors) to be characterized.
2. Battery discharge schedule with non-constant rates of power draw such as those
based on driving cycles can be used to measure rate of heat generation during real
life driving conditions.
64

References
[1] S. Al Hallaj, H. Maleki, J.S. Hong, and J.R. Selman. Thermal modeling and design
considerations of lithium ion batteries. Journal of Power Sources, 83:1–8, 1999.
[2] S. Al Hallaj, J. Prakash, and J.R. Selman. Characterization of commercial li-ion
batteries using electrochemical-calorimetric measurements. Journal of Power Sources,
87:186–194, 2000. 32, 51, 52
[3] S. Al Hallaj, R. Venjatachalapath, J. Prakash, and Selman J.R. Entropy changes
due to structural transformation in the graphite anode and phase change of the licoo2
cathode. Journal of the Electrochemical Society, 147:2432–2436, 2000. 15, 16, 57
[4] D. Andre, M. Meiler, K. Steiner, C. Wimmer, T. Soczka-Guth, and D.U. Sauer.
Characterization of high-power lithium ion batteries by electrochemical impedance
spectroscopy. i. experimental investigation. Journal of Power Sources, 196:5334–5341,
2011. 14
[5] ASTM International. Standard Test Method for Thermal Conductivity of Solids by
Means of the Guarded-Comparative-Longitudinal Heat Flow Technique, 2009. 36, 37
[6] A. Awarke, M. Jaeger, O. Oezdemir, and S. Pischinger. Thermal analysis of a li-
ion battery module under realistic ev operating conditions. International Journal fo
Energy Research, pages 1099–114x, 2012. 15, 16
[7] T. M. Bandhauer, S. Garimella, and T. F. Fuller. A critical review of thermal issues
in lithium-ion batteries. Journal of the Electrochemical Society, 158:R1–R25, 2011. 2,
31, 32, 33
65

[8] H. Bang, H. Yang, Y. K. Sun, and J. Prakash. In situ studies of lixmn2o4 and
lixal0.17mn1.83o3.97o3.97s0.03 cathode by imc. Journal of The Electrochemical Society,
15:A421–A428, 2005. 33, 52, 55, 57
[9] F.F.C Bazito and R.M. Toressi. Cathodes for lithium ion batteries: The benefits of
using nanostructured materials. Journal of the Brazilian Chemistry Society, 17:627–
642, 2006. 4
[10] J.V. Beck, B. Blackwell, and A. Haji-Sheikh. Comparison of some inverse heat con-
duction methods using experimental data. Internation Journal of Heat and Mass
Transfer, 39:3649–3657, 1996. 43
[11] J.V. Beck, B. Blackwell, and C.R. St-Clair. Inverse Heat Conduction, Ill Posed Prob-
lems. John Wiley and Sons, Inc, 1985. 43, 44
[12] D. Bernardi, E. Pawlikowski, and J. Newman. A general energy balance for battery
systems. Journal of the Electrochemical Society, 132:5–12, 1985. 30
[13] G. Botte, B. Johnson, and R. White. Influence of some design variables on the thermal
behavior of a lithium-ion cell. Journal of the Electrochemical Society, 146(3):914–923,
1999.
[14] P.G. Bruce, B. Scrosati, and J. Tarascon. Nanomaterials for rechargeable lithium
batteries. Angewandte Chemie, 47:2930–2946, 2008. 4
[15] H.S. Carslaw and J.C. Jaeger. Conduction of Heat in Solids. Oxford University Press,
1959.
[16] S. Chacko and Y. Chung. Thermal modelling of li-ion polymer battery for electric
vehicle drive cycles. Journal of Power Sources, 213:296–303, 2012. 15, 16
[17] L. Chen, K. Chen, and F. Sun. Research on thermo-physical properties identifica-
tion and thermal analysis of ev li-ion battery. In IEEE Vehicle Power Propulsion
Conference, pages 1643–1648, 2009. 2
66

[18] Y. Chen and J. Evans. Heat transfer phenomena in lithium/polymer-electrolyte bat-
teries for electric vehicle application. Journal of the Electrochemical Society, 140:1833–
1838, 1993.
[19] S.S. Choi and H. Lim. Factors that affect cycle-life and possible degradation mecha-
nisms of a li-ion cell based on licoo2. Journal of Power Sources, 111:130–136, 2002.
14, 27
[20] Tesla Motor Company. Purchasing facts, 2013. 1
[21] U.S. Advanced Battery Consortium. Electric vehicle battery test procedures manual
rev. 2. Technical report, U.S. Advanced Battery Consortium, 1996.
[22] T.R. Crompton. Battery Reference Book. Elsevier Newnes, 2000. 5
[23] United States of America Department of Energy. One million electric vehicles by 2015,
february 2011 status report. Technical report. 1
[24] S. Dhameja. Electric Vehicle Battery Systems. Newnes, 2004.
[25] A. Dinger, Martin R., X. Mosquest, Rabl. M., D. Rizoulis, M. Russo, and G. Sticher.
Batteries for electric cars, challenges, opportunities, and the outlook to 2020. Technical
report. 1
[26] Y. Duan and G.F. Naterer. Heat transfer in phase change materials for thermal
management of electric vehicle battery modules. International Journal of Heat and
Mass Transfer, 53:5176–5182, 2010.
[27] J.W. Fergus. Recent developments in cathode materials for lithium ion batteries.
Journal of Power Sources, 195:939–954, 2010.
[28] M. Fleckenstein, O. Bohlen, M. Roscher, and B. Baker. Current density and state of
charge inhomogeneities in li-ion battery cells with lifepo4 as cathode material due to
temperature gradients. Journal of Power Sources, 196:4769–4778, 2011. 14, 15
[29] S. Gerssen-Gondelach and A.P.C Faaij. Performance of batteries for electric vehicles
on short and longer term. Journal of Power Sources, 212:111–129, 2012. 3
67

[30] N. Gordon-Bloomfield. Independent tests show nissan leaf electric cars lost range in
hot climates. Green Car Reports, September 2012. 2
[31] W.B. Gu and C.Y. Wang. Thermal-electrohemical modeling of battery systems. Jour-
nal of the Electrochemical Society, 147:2910–2922, 2000. 31
[32] C.H. Hamann, A. Hamnett, and W. Vielstich. Electrochemistry, second, completely
revised and updated edition. Wiley, 2007. 5
[33] W. Hemminger and G. Hoehne. Calorimetry, Fundamentals and Practice. Verlag
Chemie, 1984. 40, 41
[34] J.S. Hong, H. Maleki, S. Al Hallaj, L. Redey, and J.R. Selman. Electrochemical-
calorimetric studies of lithium-ion cells. Journal of the Electrochemical Society,
145:1489–1591, 1998. 15, 16, 20, 32, 39, 52
[35] H. Horie, T. Abe, and T. Kinoshite. A study on advanced lithium ion battery system
for evs. World Electric Vehile Journal, 2:25–30, 2008.
[36] A123 Systems Inc. Nanophosphate basics: An overview of the structure, properties
and benefits of a123 systems proprietry lithium ion battery technology. Technical
report. 5
[37] National Instruments Inc. Overview of curve fitting models and methods in labview.
Technical report. 64
[38] F. Incropera and D.P. DeWitt. Fundamentals of Heat and Mass Tranfer. Wiley, sixth
edition, 01.
[39] A. Ingram. Nissan leaf, how much does it lose in the cold. Green Car Reports,
February 2013. 2
[40] Y. Inui, Y. Kobayashi, Y. Watanabe, and Y. Watase. Simulation of temperature
distribution in cylindrical and prismatic lithium ion secondary batteries. Eneregy
Conversion Management, 48:2103–2109, 2007. 54
68

[41] D.H. Jeon and S.M. Baek. Thermal modeling of cylindrical lithium ion battery during
discharge cycle. Energy Conversion and Management, 52:2973–2981, 2011. 15
[42] H. Kameyama, T. Hanamoto, K. Ito, Y. Inui, and K. Onda. Study on heat genera-
tion behavior of small lithium ion secondary battery. IEEE Transactions on Energy
Conversion, 112:1192–1199, 2002. 15, 16, 54
[43] G. Kim, A. Pesaran, and R Spotnitz. A three-dimensional thermal abuse model for
lithium-ion cells. Journal of Power Sources, 170(2):476–489, 2007. 32
[44] J.H. Kim, S.J. Lee, J.M. Lee, and B.H. Cho. A new direct current internal resistance
and state of charge relationship for the li-ion battery pulse power estimation. In
International Conference on Power Electronics, pages 1173–1178, 2007. 15, 54
[45] J.S. Kim, J. Prakash, and J.R. Selman. Thermal characteristics of lixmn2o4 spinel.
Electrochemical and Solid-State Letters, 4:A141–A144, 2001. 32, 55, 57
[46] U.S. Kim, C.B. Shin, and C.S. Kim. Effect of electrode configuration on the thermal
behavior of a lithium polymer battery. Journal of Power Sources, 180:909–916, 2008.
15, 31
[47] U.S. Kim, C.B. Shin, and C.S. Kim. Modeling for the scale-up of a lithium-ion polymer
battery. Journal of Power Sources, 189:841–846, 2009. 31
[48] U.S. Kim, J. Yi, C.B. Shin, T. Han, and S. Park. Modelling the thermal behaviour of
a lithium ion battery during charge. Journal of Power Sources, 196:5115–5121, 2011.
[49] Y. Kim and H. Ha. Design of interface circuits with electrical battery models. IEEE
Transactions on Industrial Electronics, 44:81–86, 1997.
[50] Y. Kobayashi, H. Miyashiro, K. Kumao, T. Takei, K. Iwahori, and I. Uchida. Pre-
cise electrochemical calotimetry of licoo2/graphite lithium-ion cell. Journal of the
Electrochemcial Society, 149(8):A978–A982, 2002. 33
[51] B.Y. Liaw, P. Roth, R. Jungst, G. Nagasubramanian, H. Case, and D. Doughty.
Correlation of arrhenius behaviors in power and capacity fades with cell impedance
69

and heat generation in cylindrical lithium ion cells. Journal of Power Sources, 119:874–
886, 2003.
[52] H.K. Liu, G.X. Wang, Z. Guo, J. Wang, and K. Konstantinov. Nanomaterials for
lithium-ion rechargeable batteries. Journal of Nanosciece and Nanotechnology, 6:1–
15, 2006. 4
[53] C. T. Love, A. Korovina, C.J. Patridge, K.E. Swider-Lyones, M.E. Twigg, and D.E.
Ramaker. Review of lifepo4 phase transition mechanisms and new observations from
x-ray absorption spectroscopy. Journal of the Electrochemical Society, 160:A3151–
A3161, 2013. 57
[54] W. Lu, H. Yang, and J. Prakash. Determination of reversible and irreversible
heats of li0.8co0.2o2/mesocarbon microbead li-ion cell reactions using isothermal mi-
crocalorimetry. Electrochemica Acta, 51:1322–1329, 205. 52
[55] E. Merkle. Ford cars, utilities and trucks all post u.s. sales gains in 2012. Ford
Inverstor Relations News, January 2013. 1
[56] P.L. Moss, G. Au, E.J. Plichta, and J.P. Zheng. An electrical circuit for modeling the
dynamic response of li-ion polymer batteries. Journal of the Electrochemical Society,
155:A986–A994, 2008.
[57] P. Nelson, K. Amine, and A. Rousseau. Advanced lithium-ion batteries for plug in
hybrid electric vehicles. Technical report, Argonne National Laboratory, Argonne IL,
2000. 9
[58] Department of Energy and U.S. Environmental Protection Agency. Federal tax credits
for electric vehicles purchased, 2013.
[59] Ontario Ministry of Transportation. Electric and hybrid electric vehicle program
incentives, 2013.
[60] K. Onda, H. Kameyama, Hanamoto T., and K. Ito. Experimental study on the
heat generation behavior of small lithium-ion secondary batteries. Journal of the
Electrochemical Society, 150, 2003. 15, 16, 33, 57
70

[61] Y. Orikasa, T. Maeda, Y. Koyama, H. Murayama, K. Fukuda, H. Tanida, E. Arai, H.
amd Matsubara, Y. Uchinoto, and Z. Ogumi. Transient phase change in two phase
reaction between lifepo4 and fepo4 under battery operation. Chemistry of Materials,
25:1032–1039, 2013. 57
[62] M.N. Ozisik and H.R.B Orlande. Inverse Heat Transfer. Taylor & Francis, 2000.
[63] C.R. Pals and J. Newman. Thermal modeling of lithium/polymer battery. i. discharge
behavior of a single cell. Journal of the Electrochemical Society, 142:3274–3281, 1995.
9, 14
[64] A.J. Peacock. Handbook of Polyethylene, structures, properties, and applications. Mar-
cel Dekker Inc., 2000. 38
[65] G. Pistoria. Lithium Batteries, new materials, developments, and perspectives. Else-
vier, 1994. 4
[66] P. Ramadass, B. Haran, P. Gomadam, R. White, and B. Popove. Development of first
principles capacity fade model for li-ion cells. Journal of the Electorchemistry Society,
155:196–203, 2004.
[67] T.B. Reddy. Linden’s Handbook of Batteries. McGraw-Hill Inc., 2011. ix, x, 3, 4, 5,
6, 7, 8, 50
[68] Y.F. Reynier, R. Yazami, and Fultz. B. Thermodynamics of lithium intercalation into
graphites and disordered carbons. Journal of the Electrochemical Society, 151:A422–
A426, 2004. 14
[69] S. Santhanagopalan, Q. Zhang, K. Kumaresan, and R. White. Parameter estima-
tion adn life modeling of lithium ion cells. Journal of the Electrochemical Society,
155:A345–A353, 2008. 9
[70] C.M. Shepherd. Theoretical design of primary and secondary cells-part iii battery
discharge equation. Technical report, Electrochemisty Branch, U.S. Naval Research
Laboratory, 1963. 13
[71] SONY Co. SONY Battery Manual for SONYUS18650.
71
[72] V. Srinivasan and J. Newman. Discharge model for the lithium iron-phosphate elec-
trode. Journal of the Electrochemical Society, 151:A1517–A1529, 2004. 57
[73] H. Sun, X. Wang, B Tossan, and R. Dixon. Three-dimensional thermal modeling of a
lithium-ion battery pack. Journal of Power Sources, 206:349–356, 2012.
[74] J.M. Tarascon and M Armand. Issues and challenges facing rechargeable lithium
batteries. Nature, 414:359–367, 2001. x, 9, 10
[75] MIT Electric Vehicle Team. A guide to understanding battery specifications. Technical
report, MIT, 2008.
[76] K.E. Thomas and J. Newman. Heats of mixing and of entropy in porous insertion
electrodes. Journal of Power Sources, 119:844–849, 2003. 7, 14, 51
[77] O. Tremblay and L. Dessaint. Experimental validation of a battery dynamic model
for ev applications. World Electric Vehicle Journal, 3:1–10, 2009. 13, 14
[78] T. Trigg and P Telleen. Global ev outlook. Technical report. 1
[79] G. Unsworth, N. Zamel, and X. Li. Through-plane thermal conductivity of the mi-
croporous layer in a polymer electrolyte membrane fuel cell. Internaltional Journal of
Hydrogen Energy, 37:5161–5169, 2012. 37
[80] K. Vetter, P. Novak, M.R. Wagner, C. Veit, K Moller, Besenhard J.O., M. Winter,
M. Wohlfahrt-Mehrens, C. Vogler, and A. Hammouche. Ageing mechanisms in lithium-
ion batteries. Journal of Power Sources, 147:269=281, 2005. 9
[81] A. Vlahinnos and S. Burch. Thermal performance of ev and hev battery modules and
packs. Technical report, National Renewable Energy Laboratory, 2003.
[82] C.Y. Wang and V. Srinivasan. Computational battery dynamics (cbd)-
electrochemical/thermal coupled modeling and multi-scale modeling. Journal of
Power Sources, 110:364–376, 2002. 31
[83] J. White. To spark buyers for electric cars, drop the price to nearly $0. Wall Street
Journal, May 2013.
72

[84] M.S. Whittingham. Lithium batteries and cathode materials. Chemistry Review,
104:4271–4301, 2004. 4
[85] K.A. Woodbury and S.K. Thackur. Redundant data and future times in the inverse
heat conduction problem. Inverse problems in Engineering, 2:319–333, 1996. 43, 44,
45
[86] W. Wu, X. Xiao, and X Huang. The effect of battery design parameters on heat
generation and utlization in a li-ion cell. Electrochimica Acta, 83:227–240, 2012. 31
[87] A. Yamada, H. Koizumi, N. Sonoyama, and Janno R. Phase change in lixfepo4.
Electrochemical and Solid State Letters, 8:A409–A413, 2005. 57
[88] J. Zhang, S. Ci, and Alahmad. Shraif H. Modelling discharge behaviour of multicell
battery. IEEE Transactions on Energy Conversion, 25:1133–1141, 2010.
[89] S.S. Zhang, K. Xu, and T.R. Jow. The low temperature performance of li-ion batteries.
Journal of Power Sources, 115:137–140, 2003. 9, 14, 26
[90] X. Zhang. Thermal analysis of a cylindrical lithium-ion battery. Electrochimica Acta,
56:1246–1255, 2011.
73

Appendix A: Effect of Operating
Temperature on Battery Discharge
Curves
74

Figure 1: Effect of operating temperature on the discharge curve of the test battery at
0.25C constant current discharge
Figure 2: Effect of operating temperature on the discharge curve of the test battery at
0.5C constant current discharge
75

Figure 3: Effect of operating temperature on the discharge curve of the test battery at 1C
constant current discharge
Figure 4: Effect of operating temperature on the discharge curve of the test battery at 2C
constant current discharge
76
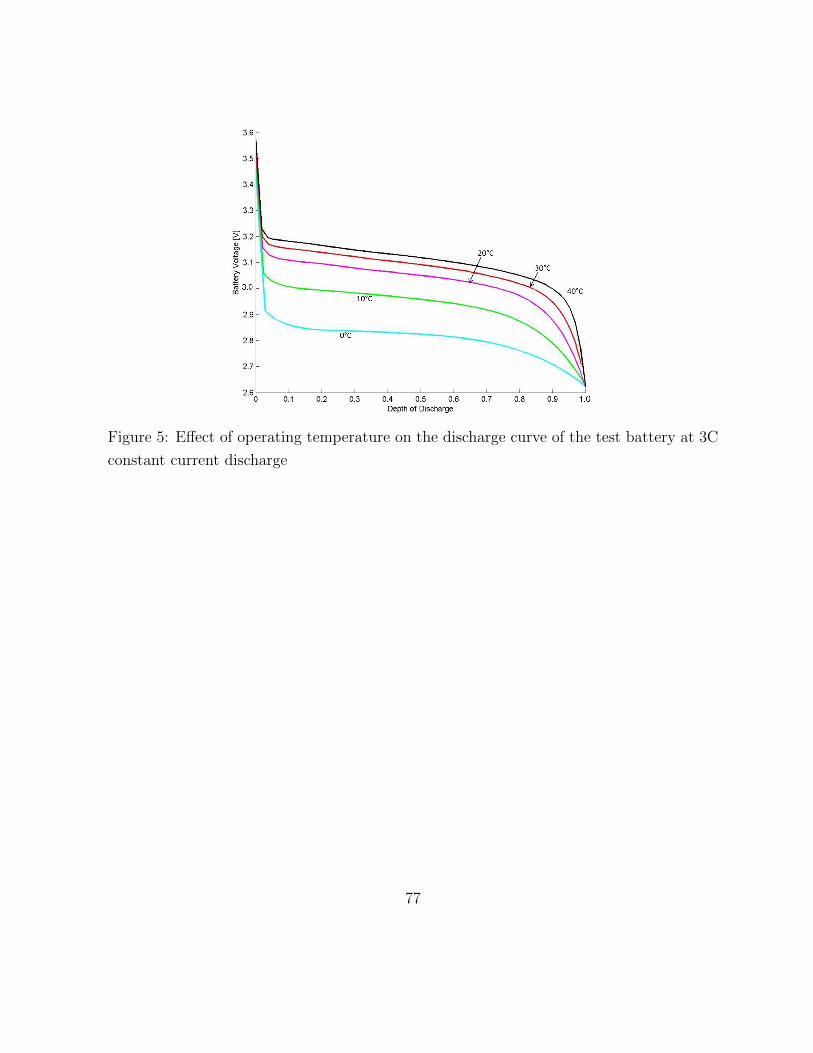
Figure 5: Effect of operating temperature on the discharge curve of the test battery at 3C
constant current discharge
77

Appendix B: Effect of Discharge
Rate on Battery Heat Generation
78
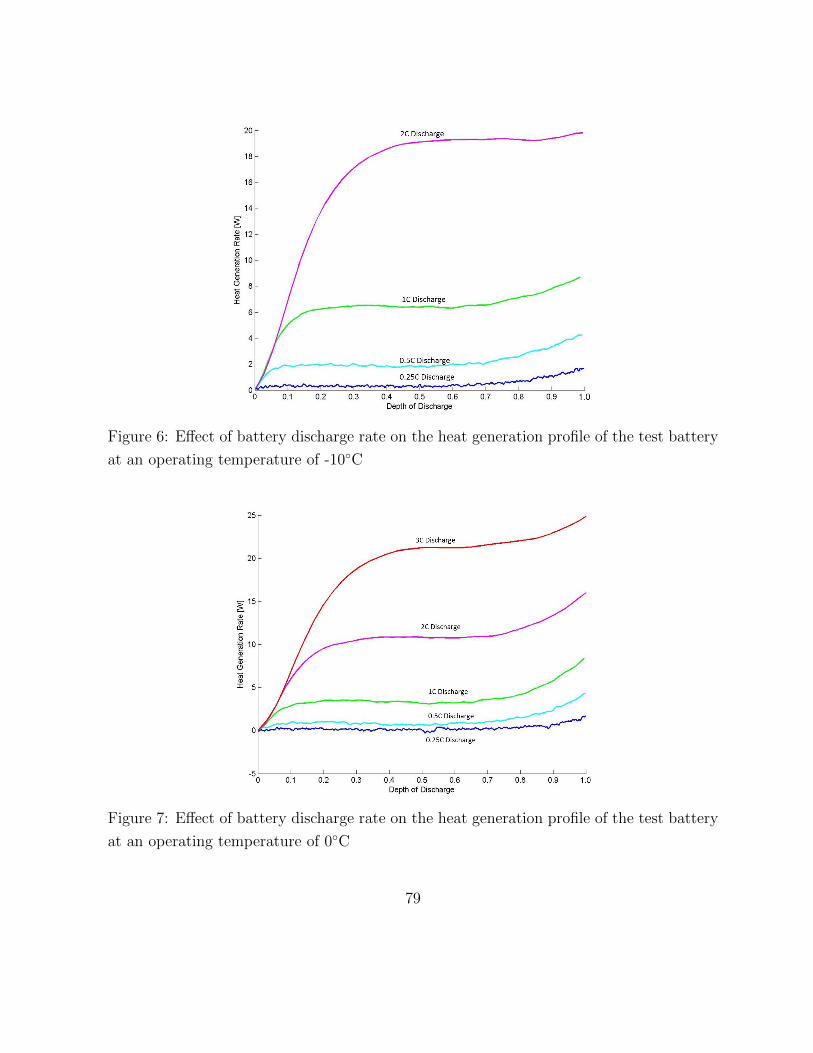
Figure 6: Effect of battery discharge rate on the heat generation profile of the test battery
at an operating temperature of -10C
Figure 7: Effect of battery discharge rate on the heat generation profile of the test battery
at an operating temperature of 0C
79

Figure 8: Effect of battery discharge rate on the heat generation profile of the test battery
at an operating temperature of 10C
Figure 9: Effect of battery discharge rate on the heat generation profile of the test battery
at an operating temperature of 20C
80

Figure 10: Effect of battery discharge rate on the heat generation profile of the test battery
at an operating temperature of 30C
Figure 11: Effect of battery discharge rate on the heat generation profile of the test battery
at an operating temperature of 40C
81

Appendix C: Effect of Operating
Temperature on Battery Heat
Generation
82
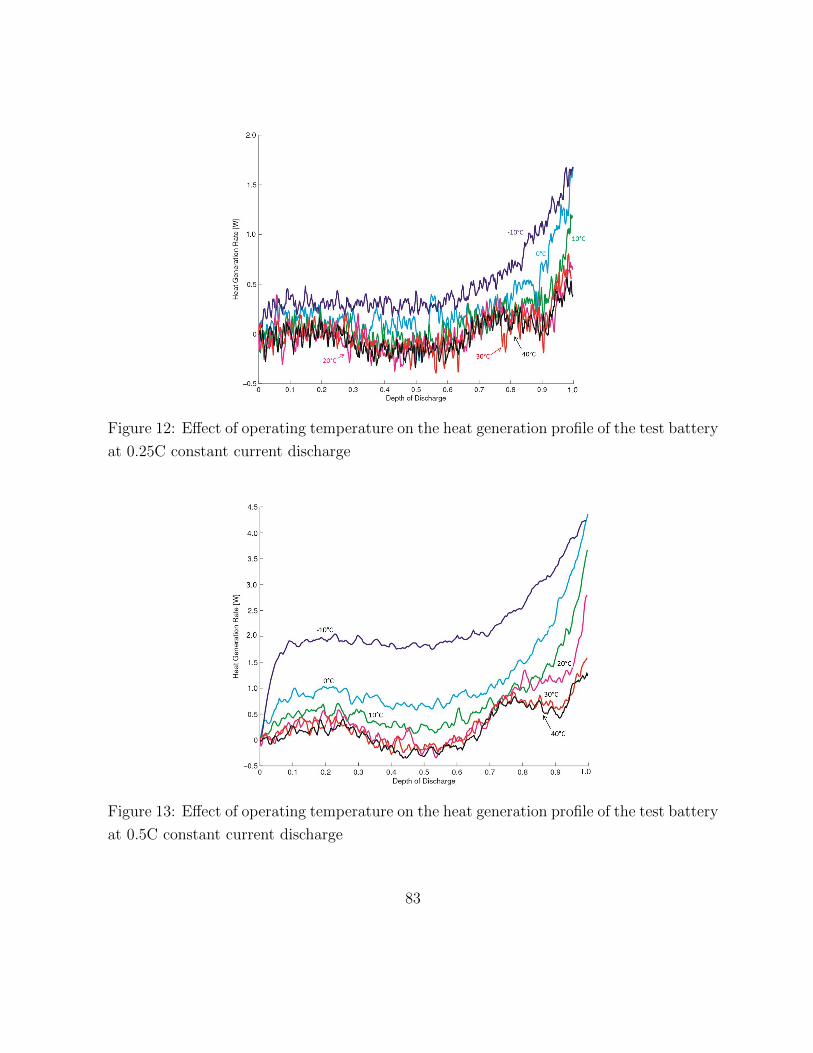
Figure 12: Effect of operating temperature on the heat generation profile of the test battery
at 0.25C constant current discharge
Figure 13: Effect of operating temperature on the heat generation profile of the test battery
at 0.5C constant current discharge
83

Figure 14: Effect of operating temperature on the heat generation profile of the test battery
at 1C constant current discharge
Figure 15: Effect of operating temperature on the heat generation profile of the test battery
at 2C constant current discharge
84

Figure 16: Effect of operating temperature on the heat generation profile of the test battery
at 3C constant current discharge
85