Heat capacity and thermophysical properties of n -heptanoic cid from 5...
8
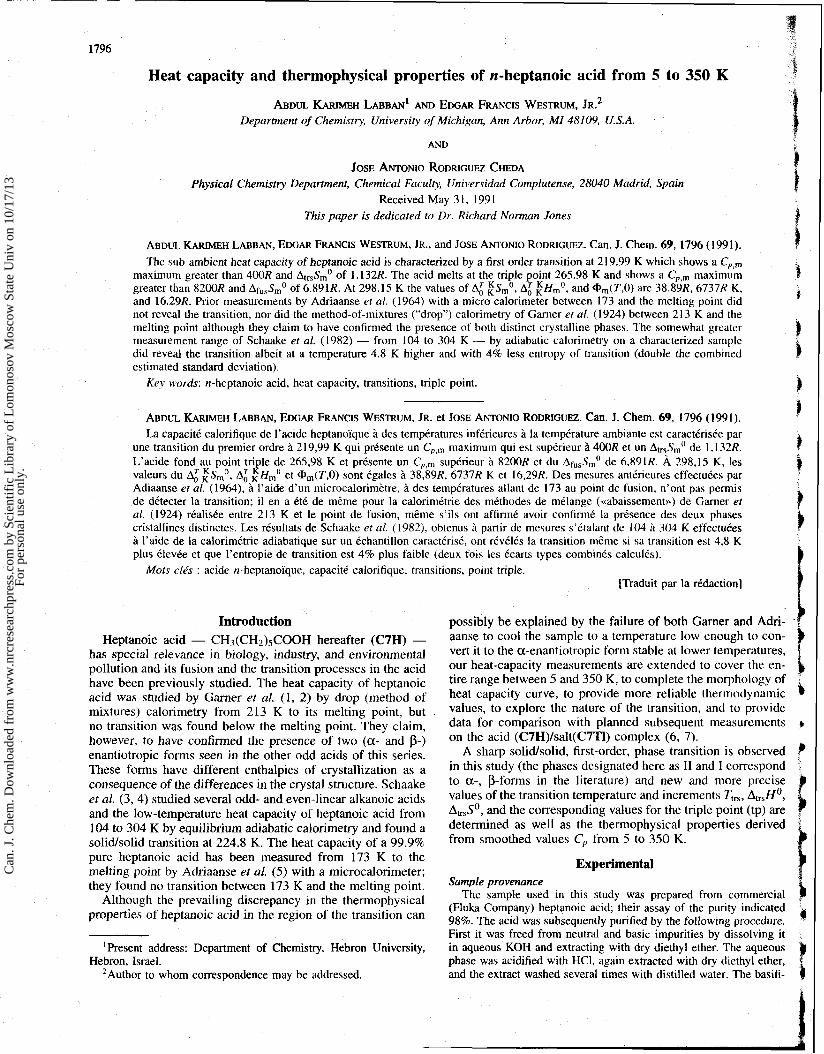
Heat capacity and thermophysical properties of n-heptanoic acid from 5 to 350 K ABDUL KARIMEH LABBAN' AND EDGAR FRANCIS WESTRUM, JR.~ Department of Chemistry, University of Michigan, Ann Arbor, MI 48109, U.S.A. AND JOSE ANTONIO RODRIGUEZ CHEDA Physical Chemistry Department, Chemical Faculty, Universidad Complutense, 28040 Madrid, Spain Received May 31, 1991 This paper is dedicated to Dr. Richard Norinan Jones ABDUC KARIMEH LABBAN, EDGAR FRANCIS WESTRUM, JR.,and JOSE ANTONIO RODRIGUEZ. Can. J. Chem. 69, 1796 (1991). The sub-ambient heat capacity of heptanoic acid is characterized by a first order transition at 21 9.99 K which shows a C,,, maximum greater than 400R and AtrS~,O of 1.132R. The acid melts at the triple point 265.98 K and shows a C,,, maximum greater than 8200R and A~,,s,O of 6.891R. At 298.15 K the values of A: ZsmO, A: ZH,', and @,(T,O) are 38.89R, 6737R K, and 16.29R. Prior measurements by Adriaanse et al. (1964) with a micro calorimeter between 173 and the melting point did not reveal the transition, nor did the method-of-mixtures ("drop") calorimetry of Gamer et al. (1924) between 213 K and the melting point although they claim to have confirmed the presence of both distinct crystalline phases. The somewhat greater measurement range of Schaake et al. (1982) - from 104 to 304 K - by adiabatic calorimetry on a characterized sample did reveal the transition albeit at a temperature 4.8 K higher and with 4% less entropy of transition (double the combined estimated standard deviation). Key words: n-heptanoic acid, heat capacity, transitions, triple point. ABDUL KARIMEH LABBAN, EDGAR FRANCIS WESTRUM, JR. et JOSE ANTONIO RODRIGUEZ. Can. J. Chem. 69, 1796 (1991). La capacitt calorifique de I'acide heptanoi'que a des tempkratures infkrieures a la temptratwe ambiante est caracttrisee par une transition du premier ordre 2 219,99 K qui pr6sente un C,,, maximum qui est supkrieur i 400R et un AtrssmO de 1,132R. L'acide fond au point tri le de 265,98 K et prCsente un C,,, supkrieur ii 8200R et du A~,,S," de 6,891R. A 298,15 K, les IF valeurs du ~SmO, A: H,' et @,(T,O) sont tgales B 38,89R, 6737R K et 16.29R. Des mesures anttrieures effectutcs par Adiaanse et al. (1964), B l'aide d'un microcalorimktre, a des ternpkratures allant de 173 au point de fusion, n'ont pas perrnis de dCtecter la transition; il en a Ctk de mEme pour la calorimktrie des mkthodes de melange (ccabaissement~) de Gamer et al. (1924) rCaliske entre 213 K et le point de fusion, m&me s'ils ont affirm6 avoir confirm6 la prtsence des deux phases cristallines distinctes. Les rksultats de Schaake et al. (1982), obtenus a partir de mesures s'etalant de 104 a 304 K effectuhs i l'aide de la calorimCtrie adiabatique sur un Cchantillon caractkrisk, ont rkvkl6s la transition m&me si sa transition est 4,8 K plus 6levCe et que I'entropie de transition est 4% plus faible (deux fois les Ccarts types combinks calculks). Mots clis : acide n-heptanoi'que, capaciti calorifique, transitions, point triple. [Traduit par la rkdaction] Introduction Heptanoic acid - CH~(CHZ)~COOH hereafter (C7H) - has special relevance in biology, industry, and environmental pollution and its fusion and the transition processes in the acid have been previously studied. The heat capacity of heptanoic acid was studied by Garner et al. (1, 2) by drop (method of mixtures) calorimetry from 213 K to its melting point, but no transition was found below the melting point. They claim, however, to have confirmed the presence of two (a- and $) enantiotropic forms seen in the other odd acids of this series. These forms have different enthalpies of crystallization as a consequence of the differences in the crystal structure. Schaake et al. (3,4) studied several odd- and even-linear alkanoic acids and the low-temperature heat capacity of heptanoic acid from 104 to 304 K by equilibrium adiabatic calorimetry and found a solid/solid transition at 224.8 K. The heat capacity of a 99.9% pure heptanoic acid has been measured from 173 K to the melting point by Adriaanse et al. (5) with a microcalorimeter; they found no transition between 173 K and the melting point. Although the prevailing discrepancy in the thermophysical properties of heptanoic acid in the region of the transition can 'Present address: Department of Chemistry, Hebron University, Hebron, Israel. 'Author to whom correspondence may be addressed. possibly be explained by the failure of both Garner and Adri- ' aanse to cool the sample to a temperature low enough to con- vert it to the a-enantiotropic form stable at lower temperatures, our heat-capacity measurements are extended to cover the en- tire range between 5 and 350 K, to complete the morphology of * heat capacity curve, to provide more reliable thern~odynamic values, to explore the nature of the transition, and to provide data for comparison with planned subsequent measurements on the acid (C7H)/salt(C7Tl) complex (6, 7). A sharp solidsolid, first-order, phase transition is observed in this study (the phases designated here as I1 and I correspond * to a-, p-forms in the literature) and new and more precise values of the transition temperature and increments T,,,, A,,HO, A,,,SO, and the corresponding values for the triple point (tp) are determined as well as the thermophysical properties derived from smoothed values C, from 5 to 350 K. i Experimental b Sample provenance The sample used in this study was prepared from commercial (Fluka Company) heptanoic acid; their assay of the purity indicated 98%. The acid was subsequently purified by the following procedure. First it was freed from neutral and basic impurities by dissolving it in aqueous KOH and extracting with dry diethyl ether. The aqueous phase was acidified with HCI, again extracted with dry diethyl ether, and the extract washed several times with distilled water. The basifi- 1 Can. J. Chem. Downloaded from www.nrcresearchpress.com by Scientific Library of Lomonosov Moscow State Univ on 10/17/13 For personal use only.
-
Upload
edgar-francis -
Category
Documents
-
view
215 -
download
2
Transcript of Heat capacity and thermophysical properties of n -heptanoic cid from 5...
Heat capacity and thermophysical properties of n-heptanoic acid from 5 to 350 K
ABDUL KARIMEH LABBAN' AND EDGAR FRANCIS WESTRUM, J R . ~ Department of Chemistry, University of Michigan, Ann Arbor, MI 48109, U.S.A.
AND
JOSE ANTONIO RODRIGUEZ CHEDA Physical Chemistry Department, Chemical Faculty, Universidad Complutense, 28040 Madrid, Spain
Received May 31, 1991 This paper is dedicated to Dr. Richard Norinan Jones
ABDUC KARIMEH LABBAN, EDGAR FRANCIS WESTRUM, JR., and JOSE ANTONIO RODRIGUEZ. Can. J. Chem. 69, 1796 (1991). The sub-ambient heat capacity of heptanoic acid is characterized by a first order transition at 21 9.99 K which shows a C,,,
maximum greater than 400R and AtrS~,O of 1.132R. The acid melts at the triple point 265.98 K and shows a C,,, maximum greater than 8200R and A~,,s,O of 6.891R. At 298.15 K the values of A: ZsmO, A: ZH,', and @,(T,O) are 38.89R, 6737R K, and 16.29R. Prior measurements by Adriaanse et al. (1964) with a micro calorimeter between 173 and the melting point did not reveal the transition, nor did the method-of-mixtures ("drop") calorimetry of Gamer et al. (1924) between 213 K and the melting point although they claim to have confirmed the presence of both distinct crystalline phases. The somewhat greater measurement range of Schaake et al. (1982) - from 104 to 304 K - by adiabatic calorimetry on a characterized sample did reveal the transition albeit at a temperature 4.8 K higher and with 4% less entropy of transition (double the combined estimated standard deviation).
Key words: n-heptanoic acid, heat capacity, transitions, triple point.
ABDUL KARIMEH LABBAN, EDGAR FRANCIS WESTRUM, JR. et JOSE ANTONIO RODRIGUEZ. Can. J. Chem. 69, 1796 (1991). La capacitt calorifique de I'acide heptanoi'que a des tempkratures infkrieures a la temptratwe ambiante est caracttrisee par
une transition du premier ordre 2 219,99 K qui pr6sente un C,,, maximum qui est supkrieur i 400R et un AtrssmO de 1,132R. L'acide fond au point tri le de 265,98 K et prCsente un C,,, supkrieur ii 8200R et du A~,,S," de 6,891R. A 298,15 K, les IF valeurs du ~ S m O , A: H,' et @,(T,O) sont tgales B 38,89R, 6737R K et 16.29R. Des mesures anttrieures effectutcs par Adiaanse et al. (1964), B l'aide d'un microcalorimktre, a des ternpkratures allant de 173 au point de fusion, n'ont pas perrnis de dCtecter la transition; il en a Ctk de mEme pour la calorimktrie des mkthodes de melange (ccabaissement~) de Gamer et al. (1924) rCaliske entre 213 K et le point de fusion, m&me s'ils ont affirm6 avoir confirm6 la prtsence des deux phases cristallines distinctes. Les rksultats de Schaake et al. (1982), obtenus a partir de mesures s'etalant de 104 a 304 K effectuhs i l'aide de la calorimCtrie adiabatique sur un Cchantillon caractkrisk, ont rkvkl6s la transition m&me si sa transition est 4,8 K plus 6levCe et que I'entropie de transition est 4% plus faible (deux fois les Ccarts types combinks calculks).
Mots clis : acide n-heptanoi'que, capaciti calorifique, transitions, point triple. [Traduit par la rkdaction]
Introduction
Heptanoic acid - C H ~ ( C H Z ) ~ C O O H hereafter (C7H) - has special relevance in biology, industry, and environmental pollution and its fusion and the transition processes in the acid have been previously studied. The heat capacity of heptanoic acid was studied by Garner et al. (1, 2) by drop (method of mixtures) calorimetry from 213 K to its melting point, but no transition was found below the melting point. They claim, however, to have confirmed the presence of two (a- and $) enantiotropic forms seen in the other odd acids of this series. These forms have different enthalpies of crystallization as a consequence of the differences in the crystal structure. Schaake et al. (3,4) studied several odd- and even-linear alkanoic acids and the low-temperature heat capacity of heptanoic acid from 104 to 304 K by equilibrium adiabatic calorimetry and found a solid/solid transition at 224.8 K. The heat capacity of a 99.9% pure heptanoic acid has been measured from 173 K to the melting point by Adriaanse et al. (5) with a microcalorimeter; they found no transition between 173 K and the melting point.
Although the prevailing discrepancy in the thermophysical properties of heptanoic acid in the region of the transition can
'Present address: Department of Chemistry, Hebron University, Hebron, Israel.
'Author to whom correspondence may be addressed.
possibly be explained by the failure of both Garner and Adri- '
aanse to cool the sample to a temperature low enough to con- vert it to the a-enantiotropic form stable at lower temperatures, our heat-capacity measurements are extended to cover the en- tire range between 5 and 350 K, to complete the morphology of *
heat capacity curve, to provide more reliable thern~odynamic values, to explore the nature of the transition, and to provide data for comparison with planned subsequent measurements on the acid (C7H)/salt(C7Tl) complex (6, 7).
A sharp solidsolid, first-order, phase transition is observed in this study (the phases designated here as I1 and I correspond
*
to a - , p-forms in the literature) and new and more precise values of the transition temperature and increments T,,,, A,,HO,
A,,,SO, and the corresponding values for the triple point (tp) are determined as well as the thermophysical properties derived from smoothed values C, from 5 to 350 K. i
Experimental b Sample provenance
The sample used in this study was prepared from commercial (Fluka Company) heptanoic acid; their assay of the purity indicated 98%. The acid was subsequently purified by the following procedure. First it was freed from neutral and basic impurities by dissolving it in aqueous KOH and extracting with dry diethyl ether. The aqueous phase was acidified with HCI, again extracted with dry diethyl ether, and the extract washed several times with distilled water. The basifi- 1
Can
. J. C
hem
. Dow
nloa
ded
from
ww
w.n
rcre
sear
chpr
ess.
com
by
Scie
ntif
ic L
ibra
ry o
f L
omon
osov
Mos
cow
Sta
te U
niv
on 1
0/17
/13
For
pers
onal
use
onl
y.
LABBAN ET AL.
cation and acidification processing was done on an equimolar basis. This extract was dried over magnesium sulphate for several days and the diethyl ether removed by distillation. Then the acid was fraction- ally distilled at 1.8 kPa; the boiling point at this pressure is 337 K.
The acid was stored under an argon atmosphere to prevent the absorption of water. The purity determined by gas-liquid chroma- tography with mass spectrometric sensor technique (University of M~chigan, Mass Spectrometry Laboratory) indicated a value of (99.72 f 0.02)% purity, and about (0.30 f 0.02)% of organic impurities, such as 0.1% in each of the following: acetate, diethyl ether, and hexanoic acid or isomeric heptanoic acids. In addition, the sample analyzed by d.s.c. indicated a value of 99.5% purity. The loading process was done in a dry He atmo5phere to avoid contamination and absorption of water.
Calorimetric technique The sample (mass = 49.637 g) was loaded into a gold-plated,
OFHC copper calorimeter, laboratory designation W-AB. This cor- responds to an amount-of-substance factor of 2.62287 mol-' with a molar mass of 130.1090 g mol l on the basis of the 1978 IUPAC relative atomic masses. The buoyancy corrections were calculated assuming a density of 0.916 g cm-'. Following evacuation, 5.1 kPa
of purified helium were added to the calorimeter to enhance thermal equilibration. The calorimeter was sealed within the vacuum chamber by a screw cap (activated by a remotely operating hexagonal wrench) which pressed a gold gasket against the circular knife edge on the stainless-steel neck of the calorimeter.
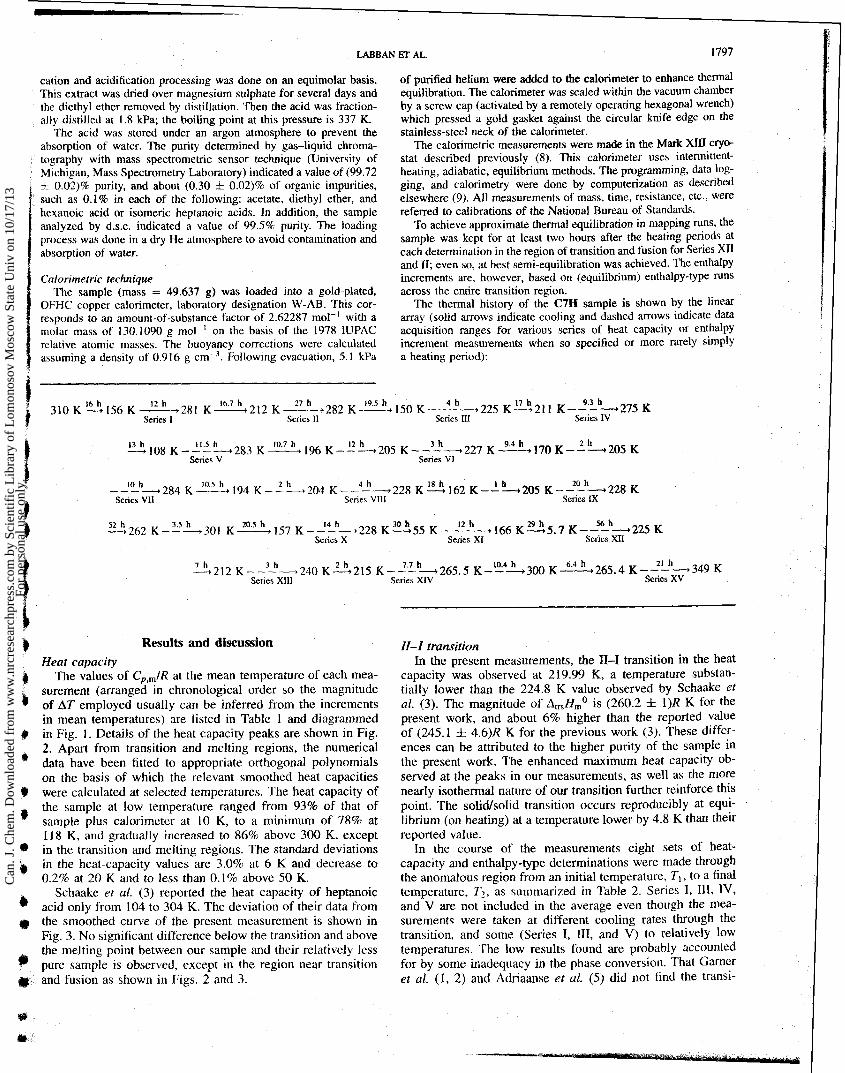
The calorimetric measurements were made in the Mark XI11 c rp - stat described previously (8). This calorimeter uses intermittent- heating, adiabatic, equilibrium methods. The programming, data log- ging, and calorimetry were done by computerization as described elsewhere (9). All measurements of mass, time, resistance, etc., were referred to calibrations of the National Bureau of Standards.
To achieve approximate thermal equilibration in mapping runs, the sample was kept for at least two hours after the heating periods at each determination in the region of transition and fusion for Series XI1 and 11; even so, at best semi-equilibration was achieved. The enthalpy increments are, however, based on (equilibrium) enthalpy-type runs across the entire transition region.
The thennal history of the C7H sample is shown by the linear array (solid arrows indicate cooling and dashed arrows indicate data acquisition ranges for various series of heat capacity or enthalpy increment measurements when so specified or more rarely simply a heating period).
i 16 h 12 h 167 h 27 h 195 h 4 h 17 h 9.3 h 310 K - - + 156 K-281 K-212 K------282 K-150 K------225 K-+211 K------275 K Senes I Senes I1 Senes I11 Senes IV
13 h 1 1 5 h 107 h 12 h 9 4 h 2 h -108 ~ - - - - 2 8 3 K-196 K---205 ~--~?-227 K-170 K-----+205 K Senea V Senes V1
10 h 1 0 5 h 2 h 4 h I8 h I h 20 h - - - 4 2 8 4 K-194 K--- -+204 K------228 K-+I62 K---+205 K-----+228 K Senes VII Senes VllI Senes IX
52 h 3.5 h 20.5 h 14 h 30 h I2 h 29 h 56 h -262 K----301 K-157 K-------+228 K--+55 K------+I66 K--45.7 K----225 K
Series X Series XI Series XI1
7 h 2 h 7.7 h 10.4 h 6.4 h 21 h -212 ~ - - ' - - h - + ~ ~ ~ K-215 K----265.5 K---300 K-265.4 ~ - - . - - + 3 4 9 K Senes XI11 Senes XIV Senes XV
b Results and discussion Heat capacity
$ The values of C,,,IR at the mean temperature of each mea- surement (arranged in chronological order so the magnitude
4 of AT employed usually can be inferred from the increments in mean temperatures) are listed in Table 1 and diagrammed
$ in Fig. I . Details of the heat capacity peaks are shown in Fig. 2. Apart from transition and melting regions, the numerical ' data have been fitted to appropriate orthogonal polynomials on the basis of which the relevant smoothed heat capacities
J were calculated at selected temperatures. The heat capacity of the sample at low temperature ranged from 93% of that of ' sample plus calorimeter at 10 K, to a minimum of 78% at 118 K, and gradually increased to 86% above 300 K, except in the transition and melting regions. The standard deviations
9 in the heat-capacity values are 3.0% at 6 K and decrease to 0.2% at 20 K and to less than 0.1% above 50 K.
Schaake et al. (3) reported the heat capacity of heptanoic acid onlv from 104 to 304 K. The deviation of their data from
a the smoothed curve of the present measurement is shown in Fig. 3. No significant difference below the transition and above the melting point between our sample and their relatively less * pure sample is observed, except in the region near transition
0: and fusion as shown in Figs. 2 and 3.
11-1 transition In the present measurements, the 11-1 transition in the heat
capacity was observed at 219.99 K, a temperature substan- tially lower than the 224.8 K value observed by Schaake et al. (3). The magnitude of A,H,O is (260.2 f l )R K for the present work, and about 6% higher than the reported value of (245.1 f 4.6)R K for the previous work (3). These differ- ences can be attributed to the higher purity of the sample in the present work. The enhanced maximum heat capacity ob- served at the peaks in our measurements, as well as the more nearly isothermal nature of our transition further reinforce this point. The solid/solid transition occurs reproducibly at equi- librium (on heating) at a temperature lower by 4.8 K than their reported value.
In the course of the measurements eight sets of heat- capacity and enthalpy-type determinations were made through the anomalous region from an initial temperature, TI, to a final temperature, TZ, as summarized in Table 2. Series I, 111, IV, and V are not included in the average even though the mea- surements were taken at different cooling rates through the transition, and some (Series I, 111, and V) to relatively low temperatures. The low results found are probably accounted for by some inadequacy in the phase conversion. That Garner et al. (1, 2) and Adriaanse et al. (5 ) did not find the transi-
Can
. J. C
hem
. Dow
nloa
ded
from
ww
w.n
rcre
sear
chpr
ess.
com
by
Scie
ntif
ic L
ibra
ry o
f L
omon
osov
Mos
cow
Sta
te U
niv
on 1
0/17
/13
For
pers
onal
use
onl
y.
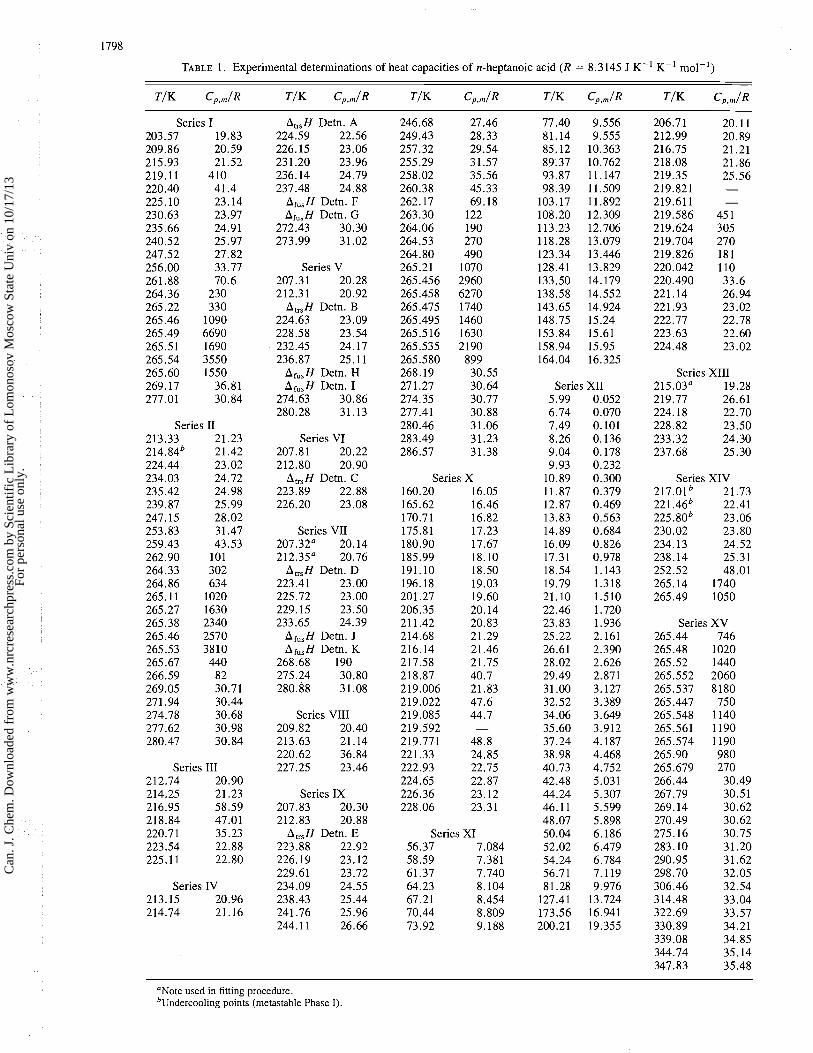
TABLE 1. Experimental determinations of heat capacities of n-heptanoic acid (R = 8.3145 J K-' K-' mol-I)
Series I 203.57 19.83 209.86 20.59 215.93 21.52 219.11 410 220.40 41.4 225.10 23.14 230.63 23.97 235.66 24.91 240.52 25.97 247.52 27.82 256.00 33.77 261.88 70.6 264.36 230 265.22 330 265.46 1090 265.49 6690 265.51 1690 265.54 3550 265.60 1550 269.17 36.81 277.01 30.84
Series I1 213.33 21.23 214.84~ 21.42 224.44 23.02 234.03 24.72 235.42 24.98 239.87 25.99 247.15 28.02 253.83 31.47 259.43 43.53 262.90 101 264.33 302 264.86 634 265.11 1020 265.27 1630 265.38 2340 265.46 2570 265.53 3810 265.67 440 266.59 82 269.05 30.71 271.94 30.44 274.78 30.68 277.62 30.98 280.47 30.84
Series I11 212.74 20.90 214.25 21.23 216.95 58.59 218.84 47.01 220.71 35.23 223.54 22.88 225.11 22.80
Series IV 213.15 20.96 214.74 21.16
A,H Detn. A 224.59 22.56 226.15 23.06 231.20 23.96 236.14 24.79 237.48 24.88
Afu,H Detn. F Ah,H Detn. G
272.43 30.30 273.99 31.02
Series V 207.31 20.28 212.31 20.92
A,H Detn. B 224.63 23.09 228.58 23.54 232.45 24.17 236.87 25.11
Afu,H Detn. H Ah,H Detn. I
274.63 30.86 280.28 31.13
Series VI 207.81 20.22 212.80 20.90
A,,H Detn. C 223.89 22.88 226.20 23.08
Series VII 207.32" 20.14 212.35" 20.76
A,H Detn. D 223.41 23.00 225.72 23.00 229.15 23.50 233.65 24.39
Afu,H Detn. J Ah,H Detn. K
268.68 190 275.24 30.80 280.88 31.08
Series VIII 209.82 20.40 213.63 21.14 220.62 36.84 227.25 23.46
Series IX 207.83 20.30 212.83 20.88
A,,,H Detn. E 223.88 22.92 226.19 23.12 229.61 23.72 234.09 24.55 238.43 25.44 241.76 25.96 244.11 26.66
Series X 160.20 16.05 165.62 16.46 170.71 16.82 175.81 17.23 180.90 17.67 185.99 18.10 191.10 18.50 196.18 19.03 201.27 19.60 206.35 20.14 21 1.42 20.83 214.68 21.29 216.14 21.46 217.58 21.75 218.87 40.7 219.006 21.83 219.022 47.6 219.085 44.7 219.592 -
219.771 48.8 221.33 24.85 222.93 22.75 224.65 22.87 226.36 23.12 228.06 23.31
Series XI 56.37 7.084 58.59 7.381 61.37 7.740 64.23 8.104 67.21 8.454 70.44 8.809 73.92 9.188
Series XI1 5.99 0.052 6.74 0.070 7.49 0.101 8.26 0.136 9.04 0.178 9.93 0.232
10.89 0.300 11.87 0.379 12.87 0.469 13.83 0.563 14.89 0.684 16.09 0.826 17.31 0.978 18.54 1.143 19.79 1.318 21.10 1.510 22.46 1.720 23.83 1.936 25.22 2.161 26.61 2.390 28.02 2.626 29.49 2.871 31.00 3.127 32.52 3.389 34.06 3.649 35.60 3.912 37.24 4.187 38.98 4.468 40.73 4.752 42.48 5.031 44.24 5.307 46.11 5.599 48.07 5.898 50.04 6.186 52.02 6.479 54.24 6.784 56.71 7.119 81.28 9.976
127.41 13.724 173.56 16.941 200.21 19.355
Series XI11 215.03" 19.28 219.77 26.61 224.18 22.70 228.82 23.50 233.32 24.30 237.68 25.30
Series XIV 217.01 21.73 221.46b 22.41 225.80b 23.06 230.02 23.80 234.13 24.52 238.14 25.31 252.52 48.01 265.14 1740 265.49 1050
Series XV 265.44 746 265.48 1020 265.52 1440 265.552 2060 265.537 8180 265.447 750 265.548 1140 265.561 1190 265.574 1190 265.90 980 265.679 270 266.44 30.49 267.79 30.51 269.14 30.62 270.49 30.62 275.16 30.75 283.10 31.20 290.95 31.62 298.70 32.05 306.46 32.54 314.48 33.04 322.69 33.57 330.89 34.21 339.08 34.85 344.74 35.14 347.83 35.48
"Note used in fitting procedure. bUndercooling points (metastable Phase I).
Can
. J. C
hem
. Dow
nloa
ded
from
ww
w.n
rcre
sear
chpr
ess.
com
by
Scie
ntif
ic L
ibra
ry o
f L
omon
osov
Mos
cow
Sta
te U
niv
on 1
0/17
/13
For
pers
onal
use
onl
y.
LABBAN ET AL. 1799
tion, is presumably occasioned by their failure to cool their sample low enough to convert between enantiotropic forms of the acid.
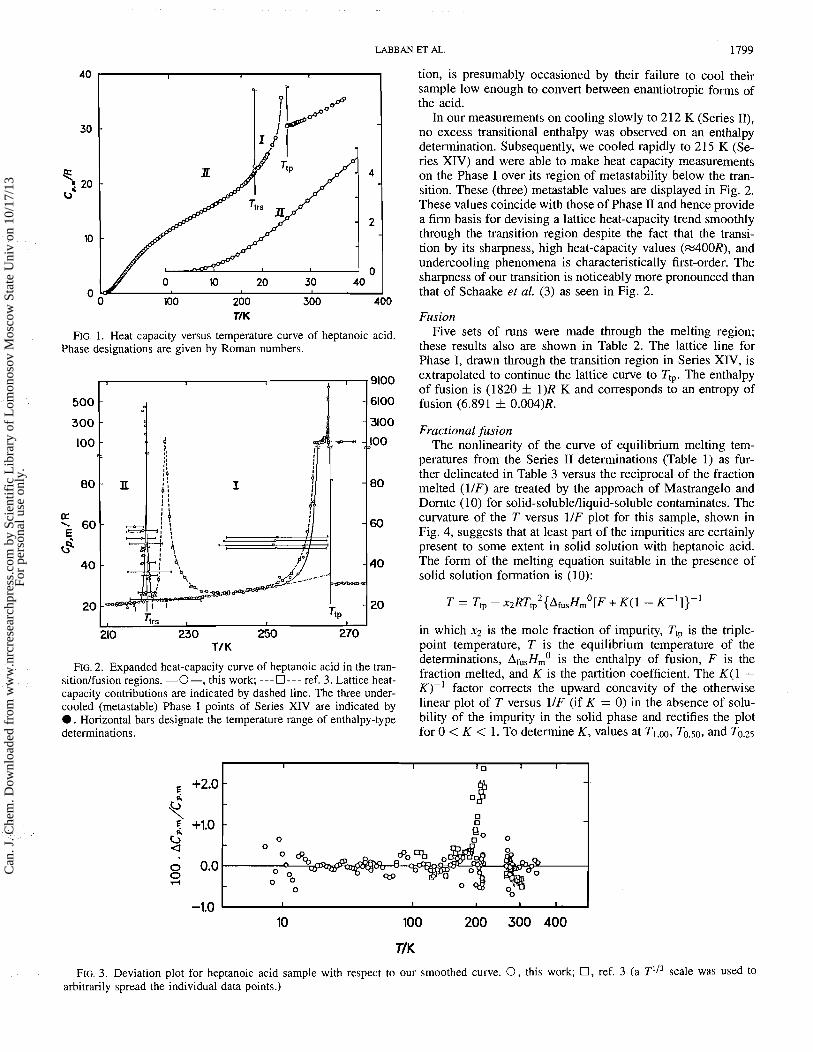
In our measurements on cooling slowly to 212 K (Series 11), no excess transitional enthalpy was observed on an enthalpy determination. Subsequently, we cooled rapidly to 215 K (Se- ries XIV) and were able to make heat capacity measurements on the Phase I over its region of metastability below the tran- sition. These (three) metastable values are displayed in Fig. 2. These values coincide with those of Phase I1 and hence provide a firm basis for devising a lattice heat-capacity trend smoothly through the transition region despite the fact that the transi- tion by its sharpness, high heat-capacity values (%400R), and undercooling phenomena is characteristically first-order. The sharpness of our transition is noticeably more pronounced than that of Schaake er al. (3) as seen in Fig. 2.
T/K
FIG. 1. Heat capacity versus temperature curve of heptanoic acid. Phase designations are given by Roman numbers.
FIG. 2. Expanded heat-capacity curve of heptanoic acid in the tran- sitionlfusion regions. -0-, this work; - - - 0--- ref. 3. Lattice heat- capacity contributions are indicated by dashed line. The three under- cooled (metastable) Phase I points of Series XIV are indicated by 0 . Horizontal bars designate the temperature range of enthalpy-type determinations.
Fusion Five sets of runs were made through the melting region;
these results also are shown in Table 2. The lattice line for Phase I, drawn through the transition region in Series XIV, is extrapolated to continue the lattice curve to T,,. The enthalpy of fusion is (1820 f l)R K and corresponds to an entropy of fusion (6.891 f 0.004)R.
Fractional fision The nonlinearity of the curve of equilibrium melting tem-
peratures from the Series I1 determinations (Table 1) as fur- ther delineated in Table 3 versus the reciprocal of the fraction melted (l/F) are treated by the approach of Mastrangelo and Dornte (lo) for solid-soluble/liquid-soluble contaminates. The curvature of the T versus 1/F plot for this sample, shown in Fig. 4, suggests that at least part of the impurities are certainly present to some extent in solid solution with heptanoic acid. The form of the melting equation suitable in the presence of solid solution formation is (10):
in which xz is the mole fraction of impurity, T,, is the triple- point temperature, T is the equilibrium temperature of the determinations, A ~ ~ , H , , , ~ is the enthalpy of fusion, F is the fraction melted, and K is the partition coefficient. The K(l - K)-' factor corrects the upward concavity of the otherwise linear plot of T versus 1/F (if K = 0) in the absence of solu- bility of the impurity in the solid phase and rectifies the plot for 0 < K < 1. To determine K, values at To.5o, and T0.25
FIG. 3 . Deviation plot for heptanoic acid sample with respect to our smoothed curve. 0, this work; 0, ref. 3 (a T I / ' scale was used to arbitrarily spread the individual data points.)
Can
. J. C
hem
. Dow
nloa
ded
from
ww
w.n
rcre
sear
chpr
ess.
com
by
Scie
ntif
ic L
ibra
ry o
f L
omon
osov
Mos
cow
Sta
te U
niv
on 1
0/17
/13
For
pers
onal
use
onl
y.
CAN. J. CHEM. VOL. 69, 1991
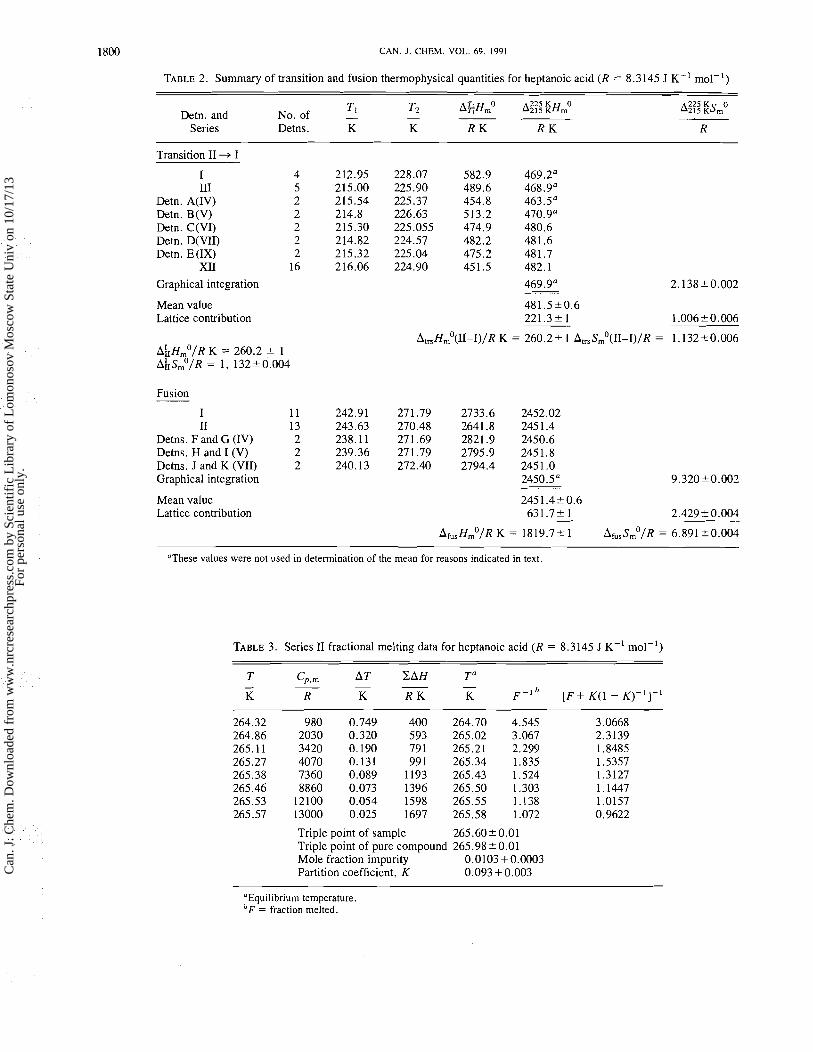
TABLE 2. Summary of transition and fusion thermophysical quantities for heptanoic acid (R = 8.3145 J K-' mol-I)
Tt T2 A ~ H , O A::: #H,O ~ 2 2 5 K 0
Detn. and No. of - 215 K S ~ -
Series Detns. K K R K R K R
Transition I1 -+ I
I 4 111 5
Detn. A(IV) 2 Detn. B(V) 2 Detn. C(V1) 2 Detn. D(VI1) 2 Detn. E (IX) 2
XI1 16 Graphical integration
Mean value Lattice contribution
Fusion
I 11 I1 13
Detns. F and G (IV) 2 Detns. H and I (V) 2 Detns. J and K (VII) 2 Graphical integration
Mean value Lattice contribution
"These values were not used in determination of the mean for reasons indicated in text
TABLE 3. Series I1 fractional melting data for heptanoic acid (R = 8.3145 J K-' mol-')
T C P . ~ AT CAH T a - - - - - K R K R K K F - ~ b [F + K(l - K)-'I-'
Triple point of sample Triple point of pure compound Mole fraction impurity Partition coefficient, K
"Equilibrium temperature. bF = fraction melted.
Can
. J. C
hem
. Dow
nloa
ded
from
ww
w.n
rcre
sear
chpr
ess.
com
by
Scie
ntif
ic L
ibra
ry o
f L
omon
osov
Mos
cow
Sta
te U
niv
on 1
0/17
/13
For
pers
onal
use
onl
y.
LABBAN ET AL. 1801
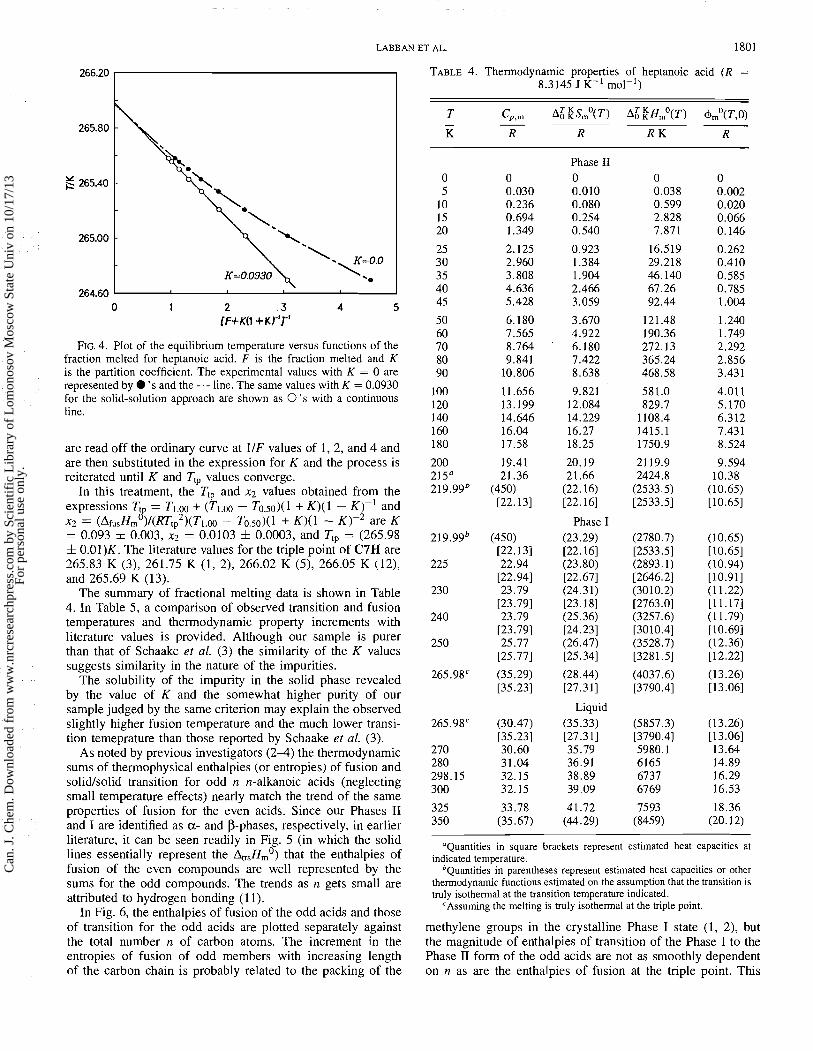
FIG. 4. Plot of the equilibrium temperature versus functions of the fraction melted for heptanoic acid. F is the fraction melted and K is the partition coefficient. The experimental values with K = 0 are represented by 0 ' s and the line. The same values with K = 0.0930 for the solid-solution approach are shown as 0 ' s with a continuous line.
are read off the ordinary curve at 1/F values of 1, 2, and 4 and are then substituted in the expression for K and the process is reiterated until K and Ttp values converge.
In this treatment, the TIP and x2 values obtained from the expressions Tt TI oo + (Tl,rn - To.50)(l + K)(1 - K)-' and 8= xz = (AfusHm )/(RTtp2)(Tl.oo - T0.50)(1 + K)(1 - are K = 0.093 5 0.003, x2 = 0.0103 * 0.0003, and TIP = (265.98 * 0.01)K. The literature values for the triple point of C7H are 265.83 K (3), 261.75 K (1, 2), 266.02 K (5), 266.05 K (12), and 265.69 K (13).
The summary of fractional melting data is shown in Table 4. In Table 5, a comparison of observed transition and fusion temperatures and thermodynamic property increments with literature values is provided. Although our sample is purer than that of Schaake et al. (3) the similarity of the K values suggests similarity in the nature of the impurities.
The solubility of the impurity in the solid phase revealed by the value of K and the somewhat higher purity of our sample judged by the same criterion may explain the observed slightly higher fusion temperature and the much lower transi- tion temeprature than those reported by Schaake et al. (3).
As noted by previous investigators (2-4) the thermodynamic sums of thermophysical enthalpies (or entropies) of fusion and solidJsolid transition for odd n n-alkanoic acids (neglecting small temperature effects) nearly match the trend of the same properties of fusion for the even acids. Since our Phases I1 and I are identified as a- and P-phases, respectively, in earlier literature, it can be seen readily in Fig. 5 (in which the solid lines essentially represent the A,H,') that the enthalpies of fusion of the even compounds are well represented by the sums for the odd compounds. The trends as n gets small are attributed to hydrogen bonding (1 1).
In Fig. 6, the enthalpies of fusion of the odd acids and those of transition for the odd acids are plotted separately against the total number n of carbon atoms. The increment in the entropies of fusion of odd members with increasing length of the carbon chain is probably related to the packing of the
TABLE 4. Thermodynamic properties of heptanoic acid (R = 8.3 145 J K-' mol-I)
Phase I1 0 0.010 0.080 0.254 0.540
0.923 1.384 1.904 2.466 3.059
3.670 4.922 6.180 7.422 8.638
9.821 12.084 14.229 16.27 18.25
20.19 21.66
(22.16) [22.16]
Phase I (23.29) [22.16] (23.80) [22.67] (24.31) [23.18] (25.36) [24.23] (26.47) [25.34]
(28.44) [27.31]
Liquid (35.33) [27.31] 35.79 36.91 38.89 39.09
41.72 (44.29)
"Quantities in square brackets represent estimated heat capacities at indicated temperature.
bQuantities in parentheses represent estimated heat capacities or other thermodynamic functions estimated on the assumption that the transition is truly isothermal at the transition temperature indicated.
'Assuming the melting is truly isothermal at the triple point.
methylene groups in the crystalline Phase I state (1, 2), but the magnitude of enthalpies of transition of the Phase I to the Phase 11 form of the odd acids are not as smoothly dependent on n as are the enthalpies of fusion at the triple point. This
Can
. J. C
hem
. Dow
nloa
ded
from
ww
w.n
rcre
sear
chpr
ess.
com
by
Scie
ntif
ic L
ibra
ry o
f L
omon
osov
Mos
cow
Sta
te U
niv
on 1
0/17
/13
For
pers
onal
use
onl
y.

CAN. 1. CHEM. VOL. 69, 1991
TABLE 5. Summary of transition and fusion thermophysics for heptanoic acid (R = 8.3145 J K-' mol-' )
Transition Fusion
Tws A t r s ~ m ~ AwsmO TIP - - AfusffrnO a Arus Lo K R K R K R K R 1 02x Reference
- -
219.99k0.2 260.22 1 1.132*0.004 265.98 20.01 1820.7k 1.5 6.8920.01 1.03k0.03 This work 224.8 * 1 245.1 "4.6 1.09 k0.02 265.83k0.01 1856.7k 6.6 6.98k0.03 1.54 3
- No transition found - 261.75 1802 6.88 1 2 - No transition found - 266.02k0.10 1744 k 7 0 6.55k0.26 0.1 5
266.05 9 265.69 10
" x is the mole fraction of impurity in the sample on the basis of fractional fusion (see text).
FIG. 5. Experimental AfusHmO/R (even acids), 0, or (AfusHmO + AtrSHm0)IR (odd acids n > 3), a. The 's (representing the transitions) are plotted relative to the fusion curve, thus the length of the solid lines indicate the magnitude of A~"H,O/R (transition values), rather than their position relative to the abscissa. References: for n = 7, this work; for n # 7, ref. 3.
FIG. 6. Experimental enthalpies of transition EB and fusion for odd normal alkanoic acids plotted against the total number n of carbon atoms. (0) A~,,,H'/R (see left abscissa) and (EB) Am,HO/R (a and P conversion) (see right abscissa) (references as in Fig. 5.)
Can
. J. C
hem
. Dow
nloa
ded
from
ww
w.n
rcre
sear
chpr
ess.
com
by
Scie
ntif
ic L
ibra
ry o
f L
omon
osov
Mos
cow
Sta
te U
niv
on 1
0/17
/13
For
pers
onal
use
onl
y.
LABBAN ET AL. 1803
may possibly be the consequence of the freedom of the alkane 7. F. FERNANDEZ-MARTIN, F. L. LOPEZ DE LA FUENTE, J. A. R. chain or the presence of a disturbing factor (1, 2). CHEDA, and E. F. WESTRUM, JR. XXI Bienal Real Sociedad
Exp. Quim. 1986.
1. W. E. GARNER, F. C. MADDEN, and J. E. RuSHBROOKE. J. Chem. 8' E' F. WESTRUM, JR'l G. T' and J. P' McCuLLoucH.
SOC. 127, 2491 (1926). In Experimental thermodynamics. Vol. I. Edited by J . P. McCul-
2. W. E. GARNER and F. C. RANDALL. J. Chem. Soc. 125, 881 lough and D. W. Scott. Butterworths, London. 1968. p. 133.
(1924). 9. E. F. WESTRUM, JR. Proceedings NATO Advanced Study Insti-
3. R. C. F. SCHAAKE, J. C. VAN MILTENBURG, and C. G. DE KRUIF. tute on Thermochemistry, Viana do Castello. 1983. Edited by
J. Chem. Thermodyn. 14, 763 (1982). M. A. V. Ribeiro da Silva. Reidel, New York. 1984. p. 745.
4. R. C. F. SCHAAKE, J. C. VAN MILTENBURG, and C. G. DE KRUIF. lo. S. V. R' and R' W' J' Am'
J. Chem. Thermodyn. 14, 771 (1982). 77, 6200 ( I 955).
5, N. H. DEKKER, and J. Reel. Trav. Chim. 11. J. L. DERISSEN. Ph.D. Thesis, Rijksuniversiteit, Utrecht. 1970.
Pays-Bas, 83, 557 (1964). 12. E. S. LUTTON. In Fatty acid. Part 4. 2nd ed. Edited by K. S.
6. A. K. LABBAN, F. L. LOPEZ DE LA FUENTE, J. A. R. CHEDA, Markley. Wiley, New York. 1967. p. 2585.
E. F. WESTRUM, JR., and F. FERNANDEZ-MARTIN. J. Chem. 13. R. BILTERYS and J. GISSELEIRE. Bull. Soc. Chim. Belg. 44, 567
Thermodyn. 21, 375 (1989). (1935).
Can
. J. C
hem
. Dow
nloa
ded
from
ww
w.n
rcre
sear
chpr
ess.
com
by
Scie
ntif
ic L
ibra
ry o
f L
omon
osov
Mos
cow
Sta
te U
niv
on 1
0/17
/13
For
pers
onal
use
onl
y.