Heat and Mass Transfer in Fixed-bed Tubular Reactor · Heat and mass transfer problem in a...
15
Heat and Mass Transfer in Fixed-bed Tubular Reactor May 1 st , 2008 Junichiro Kugai Abstract Heat and mass transfer problem in a fixed-bed tubular reactor is one of the major concerns in the chemical engineering. The two dimensional axial plug flow model was used for a water gas shift reactor to compare heat conduction or mass diffusion with convective effect. In the case of fast fluid flow in highly permeable catalyst-bed, convective heat transfer was dominant compared to heat conduction. Meanwhile both conductive mass transfer and mass diffusion were effective in mass transfer. Permeability had a large impact on homogeneity of fluid. A two dimensional particle-scale model was also investigated for detailed flow behavior. Mass distribution showed effective mixing of gas along radial direction due to high diffisivity of the gas, even when a low permeable and low porous catalyst particle was assumed.
Transcript of Heat and Mass Transfer in Fixed-bed Tubular Reactor · Heat and mass transfer problem in a...

Heat and Mass Transfer in Fixed-bed Tubular Reactor May 1st , 2008
Junichiro Kugai
Abstract
Heat and mass transfer problem in a fixed-bed tubular reactor is one of the major concerns in the
chemical engineering. The two dimensional axial plug flow model was used for a water gas shift
reactor to compare heat conduction or mass diffusion with convective effect. In the case of fast
fluid flow in highly permeable catalyst-bed, convective heat transfer was dominant compared to
heat conduction. Meanwhile both conductive mass transfer and mass diffusion were effective in
mass transfer. Permeability had a large impact on homogeneity of fluid. A two dimensional
particle-scale model was also investigated for detailed flow behavior. Mass distribution showed
effective mixing of gas along radial direction due to high diffisivity of the gas, even when a low
permeable and low porous catalyst particle was assumed.

1. Introduction
The design of catalyst particles for fixed-bed reactor is optimized by computational fluid
dynamics (CFD). The CFD is used to obtain detailed flow and temperature fields in the reactor. In
the field of reactor engineering, physical demands such as low pressure drop or high heat transfer
efficiency are often in conflict with chemical demands such as gas contact efficiency [1]. Low
tube-to-particle diameter ratio is needed for heat management, i.e. sufficient heat supply from the
reactor wall for highly endothermic reaction or sufficient heat removal to the reactor wall for
highly exothermic reaction [2]. Steam reforming of hydrocarbons is one of the examples, which is
an endothermic reaction [3], while another is CO combustion, which is an exothermic reaction.
The early stage of reactor modeling has been based on simplifying assumption such as
homogeneity, effective transport parameters, and pellet effectiveness factors [4, 5]. Homogeneity
stands for viewing the fixed-bed as a single phase continuum. The assumption of effective or
apparent transport parameters is based on the idea of unidirectional axial plug flow of the fluid
throughout the reactor. These effective transport parameters are determined empirically, i.e. the
parameters lump together all of the contributing physical phenomena. This assumption is still
employed frequently in reactor modeling [6-9]. However, this approach has always caused
inconsistency in the heat transfer coefficient or wall Nusselt number among a number of reported
results. The inconsistency is originated from the lack of the local-scale flow picture of the bed.
Recent magnetic resonance imaging (MRI) [10-13] have demonstrated that heat is transferred not
solely by axial flow but also by strong radial convective flows as fluid is displaced around the
packing elements.
Computational techniques for fluid flow have recently employed for reactor modeling as a
alternative method to the above mentioned semi-empirical method, in attempting to understand
detailed flow in the pore scale. The approach was validated by comparing apparent transport
parameters with those from model-matching theory based on experimental measurements [8, 14,
15]. One of the outcome of CFD is a complex picture of strong radial flow. Local heat transfer rates
was shown not to be correlated statistically with the local flow field [16]. The pressure and the wall
temperature were found to have little or no influence on the apparent heat transfer parameters [17].
Addition of heat sinks to represent the thermal effects of chemical reaction have shown much larger
effect on heat transfer performance than amount of internal voids in the particles [1].

One of the concerns in CFD is that all elements have a finite dimension in all edges, which
does not allow actual contact points between solid parts in the geometry [4]. This limitation causes
inconsistency of heat transfer coefficient with the one calculated by model-matching theory [17].
To avoid this, the diameter of the particles was slightly reduced in the model and finer mesh density
was applied to wall-particle and particle-particle contact regions [2, 18]. The simulation
implemented using a wall segment model with finer mesh in the contact regions gave good
agreement with full bed simulation. Another concern is how to include chemical reactions in
simulation. Inclusion of chemical reaction is so far limited to lattice Boltzmann simulation of
isothermal flow with surface reaction [19, 20]. Heat sink was used to mimic the thermal effect of
chemical reaction as mentioned above and the burden of calculation was reduced by using wall
segment model for finite elemental approach. The challenge has always been how to correlate
macro-scale behavior and particle-scale behavior.
In this study, a axial two dimensional tubular reactor model was built up using COMSOL
and water gas shift reactor in a lab-scale was reproduced. The effects of average linear velocity of
fluid, heat of reaction, permeability, porosity on distribution of velocity, temperature, and mass
inside the tubular reactor were investigated. Also, particle-scale model was employed for
investigating the balance between advection inside the particles and diffusion outside the particles.
2. Governing equations
An axial 2D model of a plug flow fixed-bed tubular reactor where the catalyst bed behaves
as a porous media was assumed. Three components, velocity, temperature, and mass (CO
concentration in the fluid) inside the tubular reactor were considered. The equations for each
components were based on the report by Delhaye and Achard [21]:
(Equation 1)
(Equation 2)
(Equation 4)
(Equation 5)
(Equation 3)
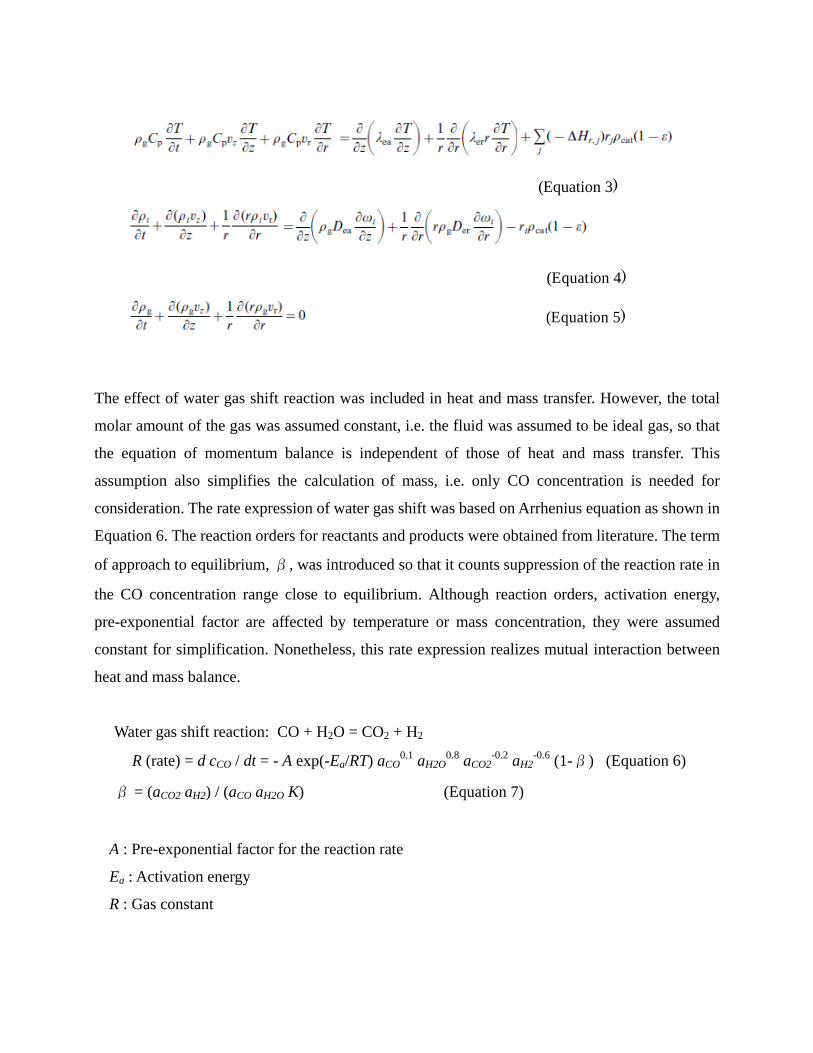
The effect of water gas shift reaction was included in heat and mass transfer. However, the total
molar amount of the gas was assumed constant, i.e. the fluid was assumed to be ideal gas, so that
the equation of momentum balance is independent of those of heat and mass transfer. This
assumption also simplifies the calculation of mass, i.e. only CO concentration is needed for
consideration. The rate expression of water gas shift was based on Arrhenius equation as shown in
Equation 6. The reaction orders for reactants and products were obtained from literature. The term
of approach to equilibrium, β, was introduced so that it counts suppression of the reaction rate in
the CO concentration range close to equilibrium. Although reaction orders, activation energy,
pre-exponential factor are affected by temperature or mass concentration, they were assumed
constant for simplification. Nonetheless, this rate expression realizes mutual interaction between
heat and mass balance.
Water gas shift reaction: CO + H2O = CO2 + H2
R (rate) = d cCO / dt = - A exp(-Ea/RT) aCO0.1 aH2O
0.8 aCO2-0.2 aH2
-0.6 (1-β) (Equation 6)
β = (aCO2 aH2) / (aCO aH2O K) (Equation 7)
A : Pre-exponential factor for the reaction rate
Ea : Activation energy
R : Gas constant

cCO : Concentration of CO
ai : Fraction of gas component I
β: Approach to equilibrium
3. Form
of porosity.
ermeability was roughly estimated regarding the catalyst-bed as well-sorted sand.
n 9)
Dporous = (ε/τ) Dgas (Equation 10)
ulation
A model of the fixed-bed tubular reactor was built in axial 2D code of COMSOL (Figure 1).
The parameters of fluid and porous media were summarized in Table 2. These are all from
databases and literature. The heat capacity (expressed as kJ/m3/K) is similar for four gas
components, suggesting convective heat flux is not so much affected by change of gas composition
during reaction. Thermal conductivity is more influenced since H2 has 5 to 10 times of thermal
conductivity than the other gases, but the difference becomes smaller in high temperature.
Therefore, these parameters were assumed independent of gas composition throughout the reactor.
Thermal conductivity, heat capacity and mass diffusivity were modified using Equation 8 - 10 so
that the properties represent the properties of gas-solid mixture. In the Equation 10, τis tortuosity,
which represents how much the distance between two points in the porous media compared to the
length of straight line between these two points. According to literature, porosity and tortuosity are
related. Table 1 represents calculated diffusivity in porous media as a function
P
kporous = kgasε+ ksolid (1-ε) (Equation 8)
Cpporpus = Cpgasε + Cpsolid (1-ε) (Equatio
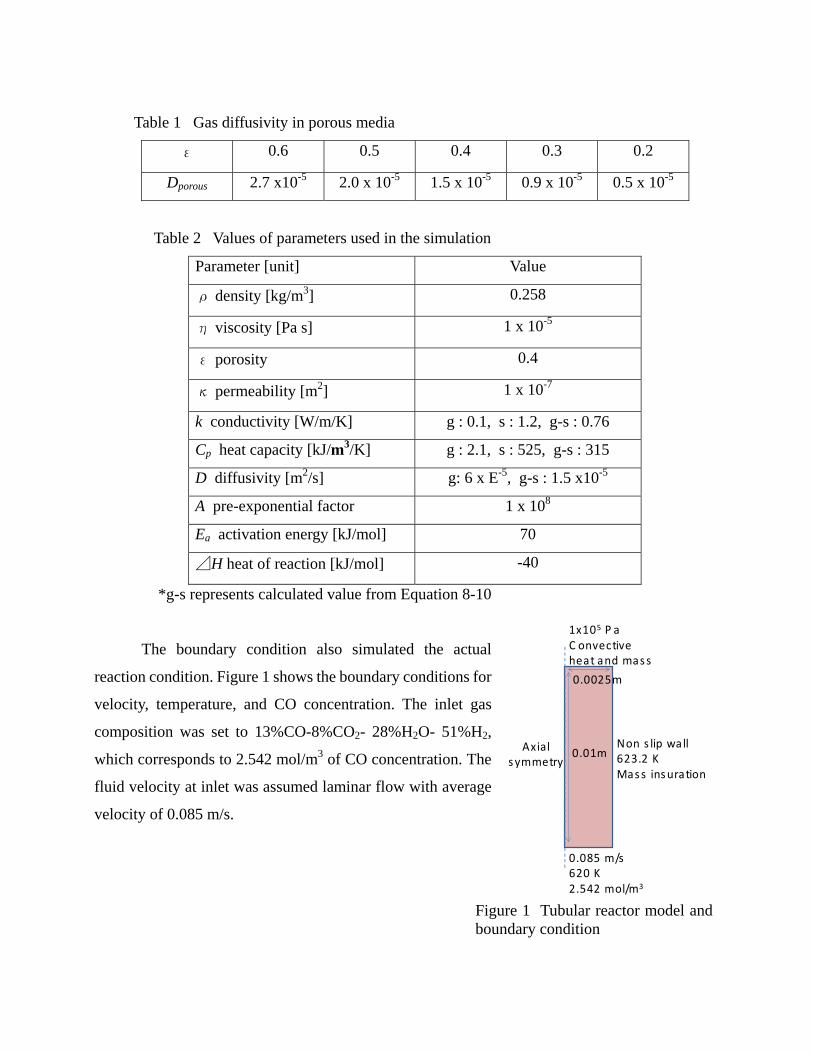
Table 1 Gas diffusivity in porous media
ε 0.6 0.5 0.4 0.3 0.2
Dporous 2.7 x10⁻⁵ 2.0 x 10⁻⁵ 1.5 x 10⁻⁵ 0.9 x 10⁻⁵ 0.5 x 10⁻⁵
Table 2 Values of parameters used in the simulation
Parameter [unit] Value
ρ density [kg/m3] 0.258
η viscosity [Pa s] 1 x 10⁻⁵
ε porosity 0.4
κ permeability [m2] 1 x 10⁻⁷
k conductivity [W/m/K] g : 0.1, s : 1.2, g-s : 0.76
Cp heat capacity [kJ/m3/K] g : 2.1, s : 525, g-s : 315
D diffusivity [m2/s] g: 6 x E-5, g-s : 1.5 x10⁻⁵
A pre-exponential factor 1 x 10⁸
Ea activation energy [kJ/mol] 70
⊿H heat of reaction [kJ/mol] -40
*g-s represents calculated value from Equation 8-10
Axials ymmetry
Non s lip wall623.2 KMass insuration
1x10⁵ P aC onvective heat and mass
0.085 m/s620 K2.542 mol/m3
0.0025m
0.01m
The boundary condition also simulated the actual
reaction condition. Figure 1 shows the boundary conditions for
velocity, temperature, and CO concentration. The inlet gas
composition was set to 13%CO-8%CO2- 28%H2O- 51%H2,
which corresponds to 2.542 mol/m3 of CO concentration. The
fluid velocity at inlet was assumed laminar flow with average
velocity of 0.085 m/s.
Figure 1 Tubular reactor model and boundary condition

4. Solution
Figure 2 is distribution of velocity, temperature, and CO concentration in the cross-section
through the axis. The region of fluid velocity lower than average velocity is limited to within 350
μm from the wall. This was narrower than the case of laminar flow without porous media in which
the region extends to 750μm from the wall. The pressure drop was negligible, so pressure applied
at outlet did not influence on the velocity field. The temperature distribution showed that
temperature variation along axial direction was small in the given average fluid velocity. Clearly,
the heat conduction from the wall was not as fast as heat convection in axial direction. The
catalyst-bed temperature was governed by the temperature at the inlet. The heat from the
exothermic reaction was also minor. The CO concentration distribution showed slightly higher
concentration towards the axis, due to high diffusion of mass and/or high reaction rate caused by
heat from the wall. By comparing temperature and mass distributions, one can tell that diffusion to
advection (mass) is relatively higher than conduction to convection (heat).
Velocity (0 - 0.129 m/s)
Temperature(620 - 623.34 K)
CO conc.(0.57 - 2.54mol/m3)
Figure 2 Distribution of velocity, temperature, mass in cross-section through the z-axis
5. Validation
Validity of the simulation was checked by simple calculations of pressure drop in the
reactor. From Darcy’s law, average flow rate is expressed as Equation 11, where κ is permeability,
ηis dynamic viscosity, and L is the length of the reactor. Since the average velocity at the inlet was
set to 0.085 m/s, pressure gradient, ⊿p/ L was calculated to be 8.5 Pa/m. This pressure gradient is
very small compared to the atmospheric pressure and consistent with the obtained pressure
difference between the inlet and the outlet, 1.00001x10⁵ Pa.
<v> = – (κ/η) (⊿p /L) (Equation 11)
Validity of the simulation was also checked by CO concentration at equilibrium. From Equation 7
and equilibrium constant of 21.34 for reaction temperature (623.15 K), CO concentration is
calculated to be 0.566 mol/m3, which is consistent with the simulated result.
The maximum Reynolds number (Re) inside the reactor ranged from 0.2 to 2.7, which
indicates the system is stable. Since characteristic mesh length L was around 2 x10⁻⁴ m, estimated
Re from Equation 12 is 0.4, which is within the range obtained from the simulation. Peclet number
(Pe) for mass transfer ranged from 0.1 to 1.5, which is also low enough for the simulation to
converge. The estimated Pe from Equation 13 is 0.3, which is also in good agreement with
simulation.
Re = ρvavg L / η (Equation 12)
Pe = vavg L / D (Equation 13)
6. Parametric study
The effects of parameters, average flow rate (U0), heat of reaction (⊿H), permeability (κ),
and porosity (ε), on fluid behavior were investigated.

6-1. Effect of average linear velocity
Figure 3 is velocity – radial
distance plot at the middle of
catalyst-bed length. As the average
flow rate (U0) increased, velocity
became more dependent on radial
distance. In laminar flow, the
maximum velocity at z-axis is twice
of U0. With the porous media, the
maximum velocity was always 1.5
times of U0. Note that the flow was
well developed at the middle of
catalyst-bed length. The dependence
of temperature and CO concentration on U0 were also plotted in Figure 4. The inlet temperature
was carried through the entire catalyst-bed when U0 > 0.05 m/s while heat conduction became
effective when U0 < 0.01 m/s. Likewise, CO concentration stayed higher level when U0 is high, it
quickly decreased when U0 is small. However, as pointed out in the section 4, temperature is more
affected by convection than CO concentration.
r [10-3 m]
0.005 m/s 0.01 m/s
0.1 m/s
0.2 m/s
0.4 m/s
0.05 m/s
Figure 3 Effect of average flow rate on z-velocity
z [m]
0.005 m/s0.01 m/s
0.1 m/s0.05 m/s
z [m]
0.005 m/s
0.01 m/s 0.1 m/s
0.2 m/s
0.4 m/s
0.05 m/s
CO conc.
0.2 m/s0.4 m/s
Temperature
Figure 4 Effect of average flow rate on temperature and CO concentration
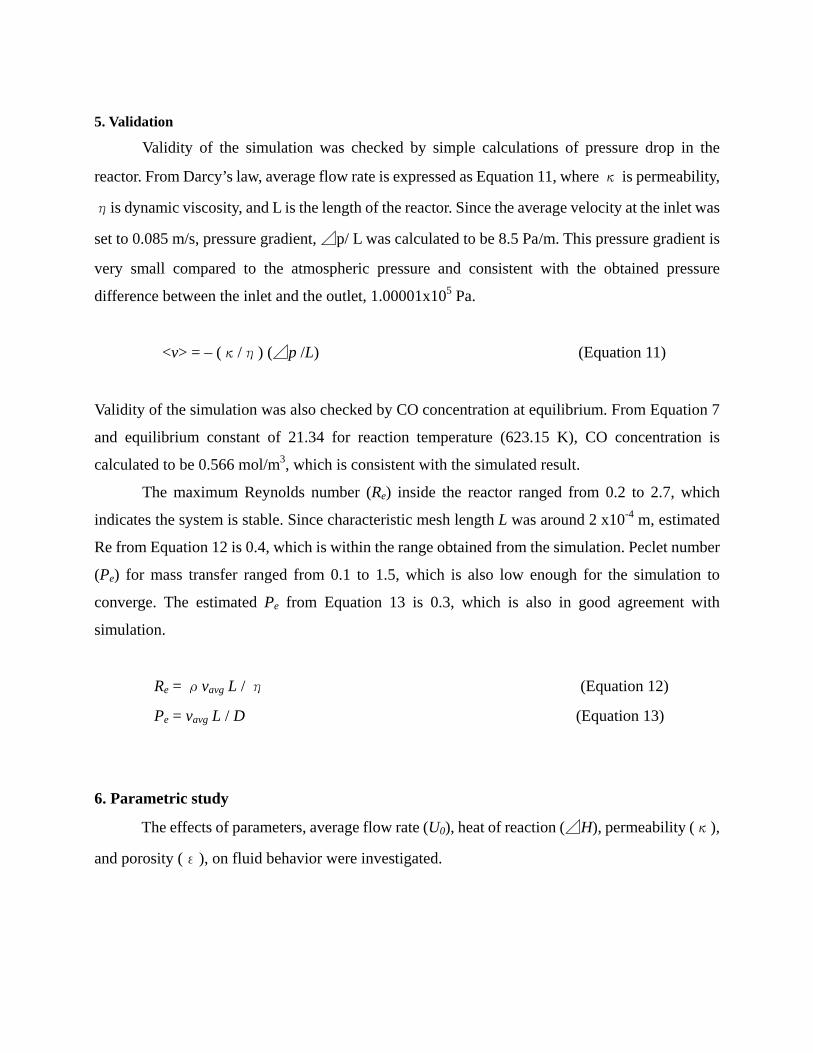
6-2. Effect of heat of reaction
Heat of reaction (⊿H) was varied from slightly endothermic (+20kJ/mol) to highly
exothermic (-400kJ/mol). Figure 5 shows that ⊿H does not have much effect on temperature. Even
the most exothermic reaction increased the bed temperature only by a few degrees. Accordingly,
water gas shift reaction was not affected by ⊿H.
+20 kJ/mol
-400 kJ/mol
Temperature CO conc.
-80 kJ/mol
Z [m]
Figure 5 Effect of heat of reaction on temperature and CO concentration
6-3. Effect of properties of porous media (permeability and porosity)
The effect of permeability (κ) was tested and the result was plotted as radial profile at the
middle of the bed length (Figure 6). When κ is 10-6 m2, the velocity profile was close to laminar
flow. Asκ decreases, the velocity along radial direction becomes flat. Temperature did not change
so much. This would be due to effect of convection is larger than heat conduction. The CO
concentration was also flattened since advective term was suppressed.
The effect of porosity (ε) was also tested (Figure 6). Thermal conductivity, heat capacity,
and diffusivity were changed according to Equation 8-10. The result showed the similar trend as
porosity, i.e. velocity and CO concentration distribution were flattened while temperature
distribution was not affected much, although its impact was smaller than that of permeability.
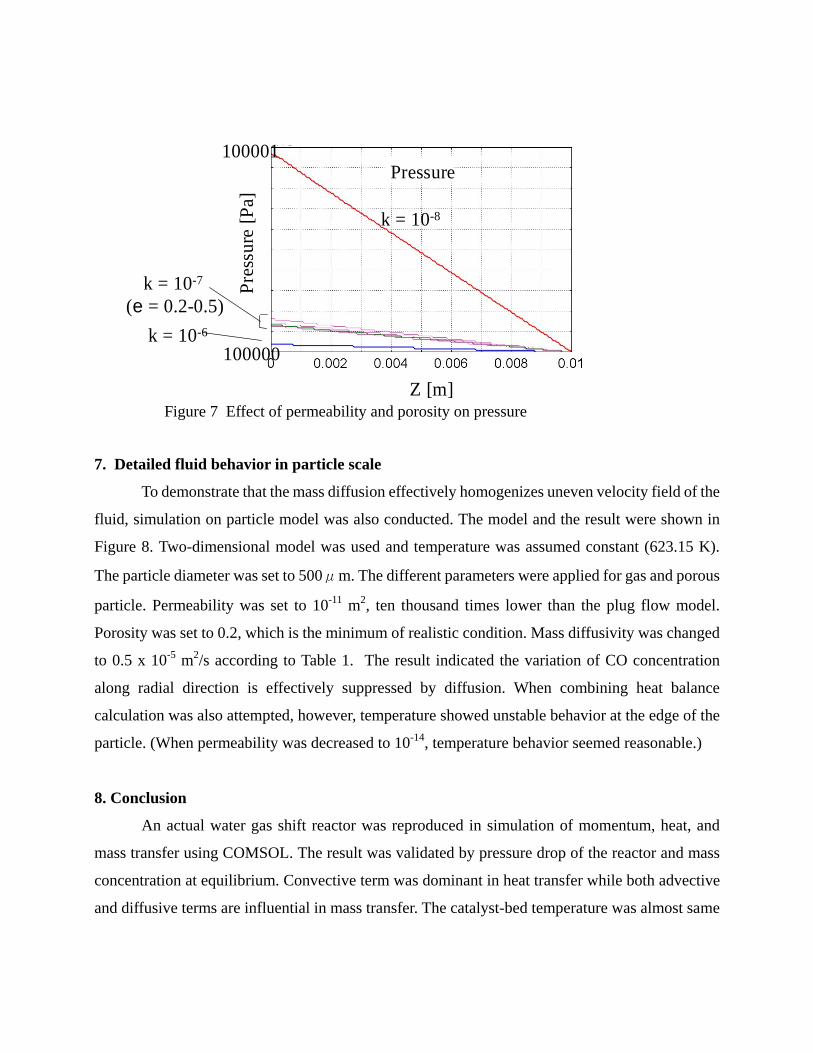
Figure 7 is the plot of pressure drop through the bed length. This figure clearly shows the large
impact of permeability.

r [10-3 m]
r [10-3 m]
0.2
0.5
Temperature
Verocity
r [10-3 m]
0.40.3
0.2
0.5 CO conc.
Figure 6 Effect of permeability (left) and porosity (right)
r [10-3 m]
r [10-3 m]
Verocity
10-8
10-710-6
Temperature
10-8
10-7
10-6
CO conc.
r [10-3 m]
Z [m]
Pressure
Pres
sure
[Pa]
100001
100000
k = 10-8
k = 10-7
(e = 0.2-0.5)k = 10-6
Figure 7 Effect of permeability and porosity on pressure
7. Detailed fluid behavior in particle scale
To demonstrate that the mass diffusion effectively homogenizes uneven velocity field of the
fluid, simulation on particle model was also conducted. The model and the result were shown in
Figure 8. Two-dimensional model was used and temperature was assumed constant (623.15 K).
The particle diameter was set to 500μm. The different parameters were applied for gas and porous
particle. Permeability was set to 10-11 m2, ten thousand times lower than the plug flow model.
Porosity was set to 0.2, which is the minimum of realistic condition. Mass diffusivity was changed
to 0.5 x 10⁻⁵ m2/s according to Table 1. The result indicated the variation of CO concentration
along radial direction is effectively suppressed by diffusion. When combining heat balance
calculation was also attempted, however, temperature showed unstable behavior at the edge of the
particle. (When permeability was decreased to 10-14, temperature behavior seemed reasonable.)
8. Conclusion
An actual water gas shift reactor was reproduced in simulation of momentum, heat, and
mass transfer using COMSOL. The result was validated by pressure drop of the reactor and mass
concentration at equilibrium. Convective term was dominant in heat transfer while both advective
and diffusive terms are influential in mass transfer. The catalyst-bed temperature was almost same

as the inlet temperature throughout the reactor length in the given condition. Permeability had a
large impact on homogeneity of fluid. Gas diffusion effectively flattened mass distribution from
uneven fluid flow in the particle model.
Velocity (0~0.22 m/s) CO conc. (2.54~1.67 mol/m3)
Velocity (0~1.66 m/s) CO conc. (2.54~1.14 mol/m3)
Figure 8 Velocity and CO concentration map in 2D particle model Upper: κ=10-9, ε=0.4 Lower:κ=10-11, ε=0.2

References
[1] M. Nijemeisland, A. G. Dixon, and E. H. Stitt, "Catalyst design by CFD for heat transfer
and reaction in steam reforming," Chem Eng Sci, vol. 59, pp. 5185-5191, 2004.
[2] A. G. Dixon, M. E. Taskin, E. H. Stitt, and M. Nijemeisland, "3D CFD simulations of steam
reforming with resolved intraparticle reaction and gradients," Chem Eng Sci, vol. 62, pp.
4963-4966, 2007.
[3] J. R. Rostrup-Nielsen, J. Sehested, and J. K. Norskov, "Hydrogen and synthesis gas by
steam- and CO2 reforming," Adv Catal, vol. 47, pp. 65-139, 2002.
[4] A. G. Dixon and M. Nijemeisland, "CFD as a design tool for fixed-bed reactors," Ind Eng
Chem Res, vol. 40, pp. 5246-5254, 2001.
[5] H. M. Kvamsdal, H. F. Svendsen, T. Hertzberg, and O. Olsvik, "Dynamic simulation and
optimization of a catalytic steam reformer," Chem Eng Sci, vol. 54, pp. 2697-2706, 1999.
[6] A. G. Dixon and D. L. Cresswell, "Theoretical Prediction of Effective Heat-Transfer
Parameters in Packed-Beds," Aiche J, vol. 25, pp. 663-676, 1979.
[7] D. G. Bunnell, H. B. Irvin, R. W. Olson, and J. M. Smith, "Effective Thermal Conductivities
in Gas-Solid Systems," Ind Eng Chem, vol. 41, pp. 1977-1981, 1949.
[8] M. Nijemeisland and A. G. Dixon, "Comparison of CFD simulations to experiment for
convective heat transfer in a gas-solid fixed bed," Chem Eng J, vol. 82, pp. 231-246, 2001.
[9] A. G. Dixon and D. L. Cresswell, "Estimation of Heat-Transfer Parameters in Packed-Beds
from Radial Temperature Profiles - Comment," Chem Eng J Bioch Eng, vol. 17, pp.
247-248, 1979.
[10] L. F. Gladden, "Recent advances in MRI studies of chemical reactors: ultrafast imaging of
multiphase flows," Top Catal, vol. 24, pp. 19-28, 2003.
[11] J. Park and S. J. Gibbs, "Mapping flow and dispersion in a packed column by MRI," Aiche
J, vol. 45, pp. 655-660, 1999.
[12] E. H. L. Yuen, A. J. Sederman, F. Sani, P. Alexander, and L. F. Gladden, "Correlations
between local conversion and hydrodynamics in a 3-D fixed-bed esterification process: An
MRI and lattice-Boltzmann study," Chem Eng Sci, vol. 58, pp. 613-619, 2003.
[13] L. F. Gladden, M. D. Mantle, A. J. Sederman, and E. H. L. Yuen, "Magnetic resonance
imaging of single- and two-phase flow in fixed-bed reactors," Appl Magn Reson, vol. 22, pp.
201-212, 2002.
[14] I. Ziolkowska and D. Ziolkowski, "Modelling of gas interstitial velocity radial distribution
over cross-section of a tube packed with granular catalyst bed; effects of granule shape and
of lateral gas mixing," Chem Eng Sci, vol. 62, pp. 2491-2502, 2007.
[15] H. P. A. Calis, J. Nijenhuis, B. C. Paikert, F. M. Dautzenberg, and C. M. van den Bleek,
"CFD modelling and experimental validation of pressure drop and flow profile in a novel
structured catalytic reactor packing," Chem Eng Sci, vol. 56, pp. 1713-1720, 2001.
[16] M. Nijemeisland and A. G. Dixon, "CFD study of fluid flow and wall heat transfer in a fixed
bed of spheres," Aiche J, vol. 50, pp. 906-921, 2004.
[17] S. A. Logtenberg and A. G. Dixon, "Computational fluid dynamics studies of fixed bed heat
transfer," Chem Eng Process, vol. 37, pp. 7-21, 1998.
[18] A. G. Dixon, M. Nijemeisland, and E. H. Stitt, "CFD study of heat transfer near and at the
wall of a fixed bed reactor tube: Effect of wall conduction," Ind Eng Chem Res, vol. 44, pp.
6342-6353, 2005.
[19] M. E. Taskin, A. G. Dixon, and E. H. Stitt, "CFD study of fluid flow and heat transfer in a
fixed bed of cylinders," Numer Heat Tra-Appl, vol. 52, pp. 203-218, 2007.
[20] T. Zeiser, M. Steven, H. Freund, P. Lammers, G. Brenner, F. Durst, and J. Bernsdorf,
"Analysis of the flow field and pressure drop in fixed-bed reactors with the help of lattice
Boltzmann simulations," Philos T Roy Soc A, vol. 360, pp. 507-520, 2002.
[21] Delhaye, J. M. and Achard, J. L. (Eds.: Banerjee, S. and Weaver, K. R.) Transient two-phase
flow Vol. 1 (1976) pp.5–84 AECL, Canada.