Hearings on Separation of Powers and Legislative Oversight Presentations: Professor Jack M....
34
Hearings on Separation of Powers and Legislative Oversight Presentations: Professor Jack M. Beermann, Boston University School of Law Gary Ciminero, Rhode Island House Policy Office Before the House Committee on Separation of Powers March 24, 2004
-
Upload
osborne-wood -
Category
Documents
-
view
214 -
download
0
Transcript of Hearings on Separation of Powers and Legislative Oversight Presentations: Professor Jack M....

Hearings on Separation of Powers and Legislative Oversight
Presentations:
Professor Jack M. Beermann, Boston University School of Law
Gary Ciminero, Rhode Island House Policy Office
Before the
House Committee on Separation of Powers
March 24, 2004

2
Today’s agendaSeparation of Powers and Legislative Oversight
• Chair Elaine Coderre—Introduction of Today’s Expert Testimony: Jack M. Beermann, Professor of Law
• Presentation of Professor Beermann: “SEPARATION OF POWERS AND LEGISLATIVE OVERSIGHT”
• Reply to Requests for Information Posed at the Last Committee Hearings on March 10th: Gary Ciminero

3
Separation of Powers and Legislative Oversight
SEPARATION OF POWERS
AND
LEGISLATIVE OVERSIGHT
SLIDES ACCOMPANYING TESTIMONY OF—
Jack M. Beermann
Professor of Law
Boston University School of Law
[SEE WRITEUP OF TESTIMONY ELSEWHERE ON THIS WEBSITE]
4
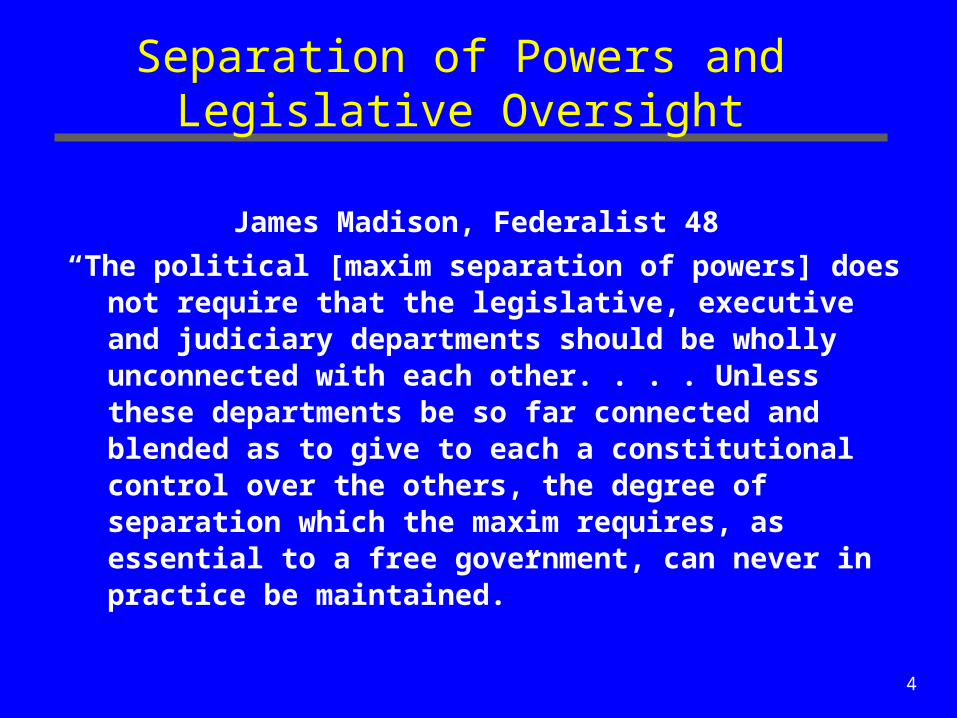
Separation of Powers and Legislative Oversight
James Madison, Federalist 48
“The political [maxim separation of powers] does not require that the legislative, executive and judiciary departments should be wholly unconnected with each other. . . . Unless these departments be so far connected and blended as to give to each a constitutional control over the others, the degree of separation which the maxim requires, as essential to a free government, can never in practice be maintained.”

5
Separation of Powers and Legislative Oversight
Legislative oversight of the executive branch is a central and vital element in separation of powers.
• Oversight preserves the value of separation of powers, by disallowing excessive accumulation of power in the hands of the executive and
• by ensuring that all legislation is carried out according to the intent of the legislature and will of the people.

6
Separation of Powers and Legislative Oversight
Four prongs to oversight:
• Budget
• Policymaking
• Rules
• Implementation—which includes performance review.

7
Separation of Powers and Legislative Oversight
Related staff resources:
Experience at the federal level and in other states shows that in order to conduct effective oversight the legislative branch needs adequate staff and expertise including professional staff capable of obtaining and processing information to make it useful to the legislature.

8
Separation of Powers and Legislative Oversight
Methods of Oversight—Formal and Informal
9
Separation of Powers and Legislative Oversight
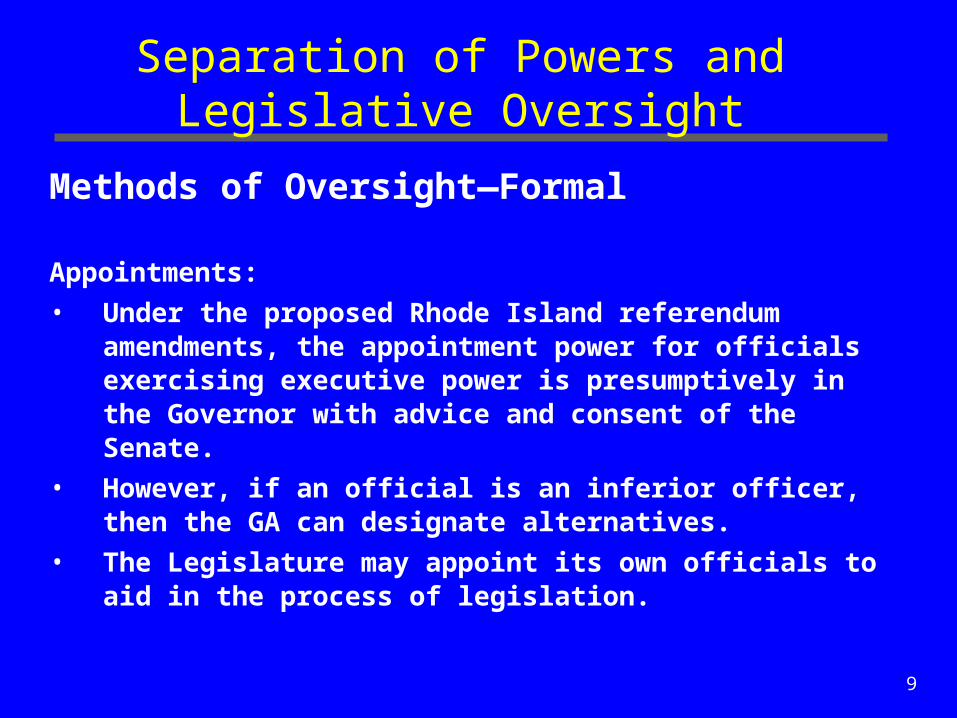
Methods of Oversight—Formal
Appointments:
• Under the proposed Rhode Island referendum amendments, the appointment power for officials exercising executive power is presumptively in the Governor with advice and consent of the Senate.
• However, if an official is an inferior officer, then the GA can designate alternatives.
• The Legislature may appoint its own officials to aid in the process of legislation.

10
Separation of Powers and Legislative Oversight
Methods of Oversight—Formal
Oversight of Rulemaking: Many states have Joint Committees that engage in year round review of administrative rules

11
Separation of Powers and Legislative Oversight
Methods of Oversight—Formal
The Legislative Veto

12
Separation of Powers and Legislative Oversight
Methods of Oversight—Formal
Report and Wait: Legislatively reject rules
13
Separation of Powers and Legislative Oversight
Methods of Oversight—Formal
The Power of the Purse and Appropriations Riders
14
Separation of Powers and Legislative Oversight
Methods of Oversight—Formal
Additional Reporting Requirements
15
Separation of Powers and Legislative Oversight
Methods of Oversight—Formal
Precise Statutory Language

16
Separation of Powers and Legislative Oversight
Methods of Oversight—Formal
Strict Judicial Review

17
Separation of Powers and Legislative Oversight
Methods of Oversight—Formal
Specification of Procedures
18
Separation of Powers and Legislative Oversight
Methods of Oversight—Formal
Sunset Provisions
19
Separation of Powers and Legislative Oversight
Methods of Oversight—Formal
Independent Agencies
20
Separation of Powers and Legislative Oversight
Methods of Oversight—Informal
Research and Investigations

21
Separation of Powers and Legislative Oversight
Methods of Oversight—Informal
Legislative Hearings

22
Separation of Powers and Legislative Oversight
Methods of Oversight—Informal
Tacit Agreement on the Use of Funds

23
Separation of Powers and Legislative Oversight
Methods of Oversight—Informal
Informal Influence over Appointments

24
Separation of Powers and Legislative Oversight
Methods of Oversight—Informal
Participation in Agency Processes
25
Separation of Powers and Legislative Oversight
SUMMARY & CONCLUSION
26
Legislative Oversight
Reply to Requests for Additional Information—
Posed at the 3/10/04 Hearing
Gary Ciminero
Rhode Island House Policy Office

27
Legislative Oversight—Reply to Requests for Additional Information—3/10/04 Hearing
REPRESENTATIVE PAUL W. CROWLEY’S REQUEST for INFORMATION on PROFESSIONAL STAFF COMPARISONS ACROSS STATES
• Recall that at the prior hearing of 3/10, rankings from NCSL were based on total full-time staff per legislator by state—see next slide
• Rhode Island Ranked 23rd at 2.63 total legislative staffers per legislator

28
Legislative Oversight Capacity—2003 Full-Time Staff per Legislator
2003 Staff Count Survey Number of Full-time RANK Number of Full-time RANK
Total Full- State Staff per Staff per Total Full- State Staff per Staff perSTATE Time Staff Legislators Legislator Legislator STATE Time Staff Legislators Legislator LegislatorCalifornia 2334 120 19.45 1 Hawaii 170 76 2.24 26New York 3077 212 14.51 2 Connecticut 393 187 2.10 27Pennsylvania 2947 253 11.65 3 Colorado 209 100 2.09 28Florida 1650 160 10.31 4 Oklahoma 302 149 2.03 29New J ersey 1206 120 10.05 5 Indiana 304 150 2.03 30Texas 1745 181 9.64 6 Oregon 181 90 2.01 31Michigan 1153 148 7.79 7 Tennessee 253 132 1.92 32Arizona 631 90 7.01 8 North Carolina 290 170 1.71 33Wisconsin 756 132 5.73 9 Missouri 321 197 1.63 34Alaska 307 60 5.12 10 West Virginia 195 134 1.46 35Illinois 905 177 5.11 11 South Carolina 247 170 1.45 36Louisiana 688 144 4.78 12 Delaware 84 62 1.35 37Massachusetts 935 200 4.68 13 New Mexico 145 112 1.29 38Maryland 850 188 4.52 14 Iowa 172 150 1.15 39Nebraska 217 49 4.43 15 Utah 108 104 1.04 40Ohio 505 132 3.83 16 Mississippi 150 174 0.86 41Washington 561 147 3.82 17 Maine 156 186 0.84 42Nevada 230 63 3.65 18 Montana 122 150 0.81 43Alabama 422 140 3.01 19 Idaho 75 105 0.71 44Minnesota 602 201 3.00 20 Kansas 100 165 0.61 45Virginia 410 140 2.93 21 South Dakota 56 105 0.53 46Kentucky 386 138 2.80 22 New Hampshire 165 424 0.39 47Rhode Island 297 113 2.63 23 Wyoming 29 90 0.32 48Georgia 603 236 2.56 24 Vermont 52 180 0.29 49Arkansas 339 135 2.51 25 North Dakota 32 141 0.23 50

29
Legislative Oversight—Reply to Requests for Additional Information—3/10/04 Hearing
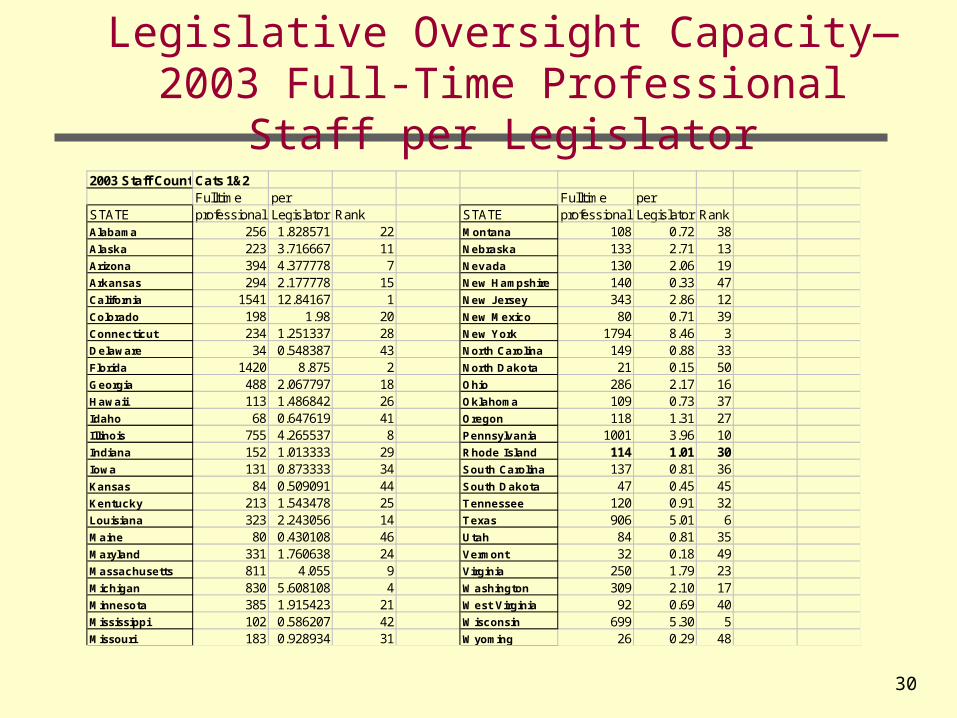
REPRESENTATIVE PAUL W. CROWLEY’S REQUEST for INFORMATION on PROFESSIONAL STAFF COMPARISONS ACROSS STATES, continued:
• NCSL also has data on Professional Legislative Staff by State—see next slide
• On this fairer basis, Rhode Island ranks even better—with just 114 professional staffers it has– Just 1.01 Professional Staffer per Legislator
– Ranking us 30th among the states in relative staffing
30
Legislative Oversight Capacity—2003 Full-Time Professional Staff per Legislator
2003 Staff Count Survey Data-FinalCats 1&2Fulltime per Fulltime per
STATE professional Legislator Rank STATE professional Legislator RankAla ba ma 256 1.828571 22 Mo nta na 108 0.72 38Ala s ka 223 3.716667 11 Ne bra s ka 133 2.71 13Arizo na 394 4.377778 7 Ne v a da 130 2.06 19Arka ns a s 294 2.177778 15 Ne w Ha mps hire 140 0.33 47Ca lifo rnia 1541 12.84167 1 Ne w Je rs e y 343 2.86 12Co lo ra do 198 1.98 20 Ne w Me xic o 80 0.71 39Co nne c tic ut 234 1.251337 28 Ne w Yo rk 1794 8.46 3De la wa re 34 0.548387 43 No rth Ca ro lina 149 0.88 33Flo rida 1420 8.875 2 No rth Da ko ta 21 0.15 50Ge o rg ia 488 2.067797 18 Ohio 286 2.17 16Ha wa ii 113 1.486842 26 Okla ho ma 109 0.73 37Ida ho 68 0.647619 41 Ore g o n 118 1.31 27Illino is 755 4.265537 8 Pe nns ylv a nia 1001 3.96 10India na 152 1.013333 29 Rho de Is la nd 114 1.01 30Io wa 131 0.873333 34 S o uth Ca ro lina 137 0.81 36Ka ns a s 84 0.509091 44 S o uth Da ko ta 47 0.45 45Ke ntuc ky 213 1.543478 25 Te nne s s e e 120 0.91 32Lo uis ia na 323 2.243056 14 Te xa s 906 5.01 6Ma ine 80 0.430108 46 Uta h 84 0.81 35Ma ryla nd 331 1.760638 24 Ve rmo nt 32 0.18 49Ma s s a c hus e tts 811 4.055 9 Virg inia 250 1.79 23Mic hig a n 830 5.608108 4 Wa s hing to n 309 2.10 17Minne s o ta 385 1.915423 21 We s t Virg inia 92 0.69 40Mis s is s ippi 102 0.586207 42 Wis c o ns in 699 5.30 5Mis s o uri 183 0.928934 31 Wyo ming 26 0.29 48

31
Legislative Oversight—Reply to Requests for Additional Information—3/10/04 Hearing
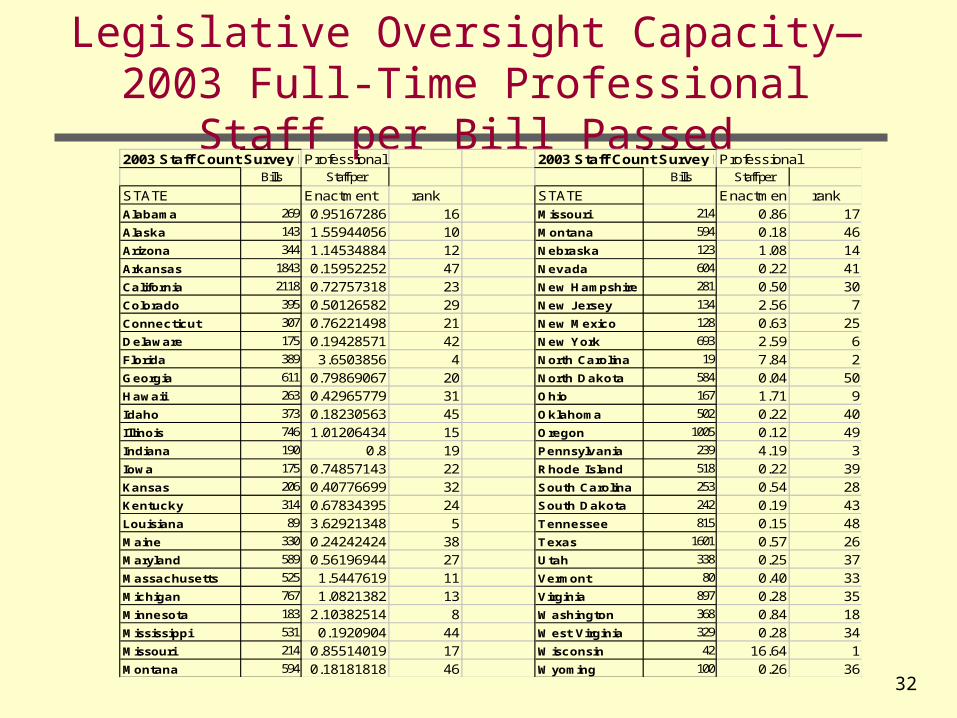
REPRESENTATIVE PAUL W. CROWLEY’S REQUEST for INFORMATION on PROFESSIONAL STAFF COMPARISONS--concluded
• Based on a better measure, Full-time professional staff per bill enacted—with 518 bills enacted in RI—see next slide:– We have has just 0.22 professional staffers per bill
– Ranking us 39th, one of the lowest relative staffing levels compared with other states.
32
Legislative Oversight Capacity—2003 Full-Time Professional Staff per Bill Passed
2003 Staff Count Survey Data-FinalProfessional 2003 Staff Count Survey Data-FinalProfessional
Bills Staff per Bills Staff per
STATE Enactment rank STATE Enactment rankAla ba ma 269 0.95167286 16 Mis s o uri 214 0.86 17Ala s ka 143 1.55944056 10 Mo nta na 594 0.18 46Arizo na 344 1.14534884 12 Ne bra s ka 123 1.08 14Arka ns a s 1843 0.15952252 47 Ne v a da 604 0.22 41Ca lifo rnia 2118 0.72757318 23 Ne w Ha mps hire 281 0.50 30Co lo ra do 395 0.50126582 29 Ne w Je rs e y 134 2.56 7Co nne c tic ut 307 0.76221498 21 Ne w Me xic o 128 0.63 25De la wa re 175 0.19428571 42 Ne w Yo rk 693 2.59 6Flo rida 389 3.6503856 4 No rth Ca ro lina 19 7.84 2Ge o rg ia 611 0.79869067 20 No rth Da ko ta 584 0.04 50Ha wa ii 263 0.42965779 31 Ohio 167 1.71 9Ida ho 373 0.18230563 45 Okla ho ma 502 0.22 40Illino is 746 1.01206434 15 Ore g o n 1005 0.12 49India na 190 0.8 19 Pe nns ylv a nia 239 4.19 3Io wa 175 0.74857143 22 Rho de Is la nd 518 0.22 39Ka ns a s 206 0.40776699 32 S o uth Ca ro lina 253 0.54 28Ke ntuc ky 314 0.67834395 24 S o uth Da ko ta 242 0.19 43Lo uis ia na 89 3.62921348 5 Te nne s s e e 815 0.15 48Ma ine 330 0.24242424 38 Te xa s 1601 0.57 26Ma ryla nd 589 0.56196944 27 Uta h 338 0.25 37Ma s s a c hus e tts 525 1.5447619 11 Ve rmo nt 80 0.40 33Mic hig a n 767 1.0821382 13 Virg inia 897 0.28 35Minne s o ta 183 2.10382514 8 Wa s hing to n 368 0.84 18Mis s is s ippi 531 0.1920904 44 We s t Virg inia 329 0.28 34Mis s o uri 214 0.85514019 17 Wis c o ns in 42 16.64 1Mo nta na 594 0.18181818 46 Wyo ming 100 0.26 36

33
Legislative Oversight—Reply to Requests for Additional Information—3/10/04 Hearing
REPRESENTATIVE NICHOLAS GORHAM’S REQUEST for INFORMATION on PROFESSIONAL STAFF COMPARISONS with State Populations
• BASED ON FULL-TIME PROFESSIONAL STAFF PER CAPITA, RI RANKS 7TH AMONG THE STATES—see next slide.
• HOWEVER, COMPARISONS WITH POPULATION SIZE DISTORT ANY CONCLUSION ABOUT STAFFING LEVELS– SINCE POPULATION IS A POOR MEASURE OF THE AMOUNT OF
LEGISLATIVE ANALYSIS AND OVERSIGHT REQUIRED OF THE PROFESSIONAL STAFF.
– BETTER MEASURES ARE THOUSE ALREADY DISCUSSED IN THE EARLIER SLIDES.

34
Legislative Oversight Capacity—2003 Full-Time Professional Staff per Capita
2003 Staff Count Survey Data-FinalCats 1&2
Fulltime per 100000 Fulltime per 100000STATE professional capita STATE professional capitaAla ba ma 256 5.75656 24 Mo nta na 108 11.97 4Ala s ka 223 35.57005 1 Ne bra s ka 133 7.77 14Arizo na 394 7.679366 15 Ne v a da 130 6.51 18Arka ns a s 294 10.99723 6 Ne w Ha mps hire 140 11.33 5Ca lifo rnia 1541 4.549528 32 Ne w Je rs e y 343 4.08 37Co lo ra do 198 4.603301 31 Ne w Me xic o 80 4.40 34Co nne c tic ut 234 6.871107 17 Ne w Yo rk 1794 9.45 8De la wa re 34 4.338948 36 No rth Ca ro lina 149 1.85 50Flo rida 1420 8.884785 10 No rth Da ko ta 21 3.27 44Ge o rg ia 488 5.961068 23 Ohio 286 2.52 47Ha wa ii 113 9.326995 9 Okla ho ma 109 3.16 45Ida ho 68 5.255214 28 Ore g o n 118 3.45 41Illino is 755 6.079251 22 Pe nns ylv a nia 1001 8.15 12India na 152 2.499801 48 Rho de Is la nd 114 10.87 7Io wa 131 4.476606 33 S o uth Ca ro lina 137 3.41 42Ka ns a s 84 3.124514 46 S o uth Da ko ta 47 6.23 21Ke ntuc ky 213 5.26997 25 Te nne s s e e 120 2.11 49Lo uis ia na 323 7.227607 16 Te xa s 906 4.34 35Ma ine 80 6.274889 19 Uta h 84 3.76 38Ma ryla nd 331 6.249427 20 Ve rmo nt 32 5.26 27Ma s s a c hus e tts 811 12.77347 3 Virg inia 250 3.53 40Mic hig a n 830 8.351408 11 Wa s hing to n 309 5.24 29Minne s o ta 385 7.826032 13 We s t Virg inia 92 5.09 30Mis s is s ippi 102 3.585668 39 Wis c o ns in 699 13.03 2Mis s o uri 183 3.270654 43 Wyo ming 26 5.27 26