Hearing thresholds of swimming Pacific bluefin tuna ... · Abstract Pacific bluefin tuna (Thunnus...
14
1 3 J Comp Physiol A (2015) 201:441–454 DOI 10.1007/s00359-015-0991-x ORIGINAL PAPER Hearing thresholds of swimming Pacific bluefin tuna Thunnus orientalis Jonathan J. Dale · Michael D. Gray · Arthur N. Popper · Peter H. Rogers · Barbara A. Block Received: 26 November 2014 / Revised: 17 February 2015 / Accepted: 18 February 2015 / Published online: 3 March 2015 © Springer-Verlag Berlin Heidelberg 2015 (83 dB re 1 μPa). Compared to yellowfin tuna (Thunnus albacares) and kawakawa (Euthynnus affinis), Pacific blue- fin tuna has a similar bandwidth of hearing and best fre- quency, but greater sensitivity overall. Careful calibration of the sound stimulus and experimental tank environment, as well as the adoption of behavioral methodology, dem- onstrates an experimental approach highly effective for the study of large fish species in the laboratory. Keywords Sound pressure · Particle motion · Acceleration · Behavioral Introduction The hearing abilities of teleosts (and sharks) have been investigated for well over a century (reviewed in Moulton 1963; Popper and Fay 1973; Tavolga 1976; Hawkins and Myrberg 1983; Fay 2014; Hawkins 2014). Although there is substantial interspecific variation in hearing range and sensitivity between species (e.g., Fay 1988; Popper et al. 2003; Ladich and Fay 2013), all species tested to date can hear. Major sources of interspecific variation in hear- ing range and sensitivity result from the different adap- tations for the use of sound pressure and particle motion information (Popper and Fay 2011). In all fishes, the inner ear is directly stimulated by particle motion associ- ated with an acoustic field through differential movement of the body and sensory epithelium relative to the otolith or otoconia mass (de Vries 1950; Pumphrey 1950; Popper and Fay 2011). Species that are able to use sound pressure in addition to particle motion, such as the direct connec- tions between the pressure-detecting swim bladder and the inner ear found in otophysan fishes (e.g., goldfish, cat- fishes, and relatives) or close proximity of the ear to a gas Abstract Pacific bluefin tuna (Thunnus orientalis) is a highly migratory, commercially valuable species poten- tially vulnerable to acoustic noise generated from human activities which could impact behavior and fitness. Although significant efforts have been made to understand hearing abilities of fishes, the large size and need to con- tinuously swim for respiration have hindered investigations with tuna and other large pelagic species. In this study, Pacific bluefin tuna were trained to respond to a pure tone sound stimulus ranging 325–800 Hz and their hearing abili- ties quantified using a staircase psychophysical technique. Hearing was most sensitive from 400 to 500 Hz in terms of particle motion (radial acceleration −88 dB re 1 m s −2 ; ver- tical acceleration −86 dB re 1 m s −2 ) and sound pressure The authors dedicate this paper to the memory of Dr. William Keith. Bill participated in some of the earlier calibrations of the sound field for this project and asked provocative questions that helped improve experimental design. All the authors valued the opportunity to get to know Bill as colleague and friend, and were deeply saddened at his passing. Electronic supplementary material The online version of this article (doi:10.1007/s00359-015-0991-x) contains supplementary material, which is available to authorized users. J. J. Dale (*) · B. A. Block Tuna Research and Conservation Center, Hopkins Marine Station, Stanford University, Pacific Grove, CA, USA e-mail: [email protected] M. D. Gray · P. H. Rogers G.W. Woodruff School of Mechanical Engineering, Georgia Institute of Technology, Atlanta, GA, USA A. N. Popper Department of Biology and Center for Comparative and Evolutionary Biology of Hearing, University of Maryland, College Park, MD, USA
Transcript of Hearing thresholds of swimming Pacific bluefin tuna ... · Abstract Pacific bluefin tuna (Thunnus...

1 3
J Comp Physiol A (2015) 201:441–454DOI 10.1007/s00359-015-0991-x
ORIGINAL PAPER
Hearing thresholds of swimming Pacific bluefin tuna Thunnus orientalis
Jonathan J. Dale · Michael D. Gray · Arthur N. Popper · Peter H. Rogers · Barbara A. Block
Received: 26 November 2014 / Revised: 17 February 2015 / Accepted: 18 February 2015 / Published online: 3 March 2015 © Springer-Verlag Berlin Heidelberg 2015
(83 dB re 1 μPa). Compared to yellowfin tuna (Thunnus albacares) and kawakawa (Euthynnus affinis), Pacific blue-fin tuna has a similar bandwidth of hearing and best fre-quency, but greater sensitivity overall. Careful calibration of the sound stimulus and experimental tank environment, as well as the adoption of behavioral methodology, dem-onstrates an experimental approach highly effective for the study of large fish species in the laboratory.
Keywords Sound pressure · Particle motion · Acceleration · Behavioral
Introduction
The hearing abilities of teleosts (and sharks) have been investigated for well over a century (reviewed in Moulton 1963; Popper and Fay 1973; Tavolga 1976; Hawkins and Myrberg 1983; Fay 2014; Hawkins 2014). Although there is substantial interspecific variation in hearing range and sensitivity between species (e.g., Fay 1988; Popper et al. 2003; Ladich and Fay 2013), all species tested to date can hear. Major sources of interspecific variation in hear-ing range and sensitivity result from the different adap-tations for the use of sound pressure and particle motion information (Popper and Fay 2011). In all fishes, the inner ear is directly stimulated by particle motion associ-ated with an acoustic field through differential movement of the body and sensory epithelium relative to the otolith or otoconia mass (de Vries 1950; Pumphrey 1950; Popper and Fay 2011). Species that are able to use sound pressure in addition to particle motion, such as the direct connec-tions between the pressure-detecting swim bladder and the inner ear found in otophysan fishes (e.g., goldfish, cat-fishes, and relatives) or close proximity of the ear to a gas
Abstract Pacific bluefin tuna (Thunnus orientalis) is a highly migratory, commercially valuable species poten-tially vulnerable to acoustic noise generated from human activities which could impact behavior and fitness. Although significant efforts have been made to understand hearing abilities of fishes, the large size and need to con-tinuously swim for respiration have hindered investigations with tuna and other large pelagic species. In this study, Pacific bluefin tuna were trained to respond to a pure tone sound stimulus ranging 325–800 Hz and their hearing abili-ties quantified using a staircase psychophysical technique. Hearing was most sensitive from 400 to 500 Hz in terms of particle motion (radial acceleration −88 dB re 1 m s−2; ver-tical acceleration −86 dB re 1 m s−2) and sound pressure
The authors dedicate this paper to the memory of Dr. William Keith. Bill participated in some of the earlier calibrations of the sound field for this project and asked provocative questions that helped improve experimental design. All the authors valued the opportunity to get to know Bill as colleague and friend, and were deeply saddened at his passing.
Electronic supplementary material The online version of this article (doi:10.1007/s00359-015-0991-x) contains supplementary material, which is available to authorized users.
J. J. Dale (*) · B. A. Block Tuna Research and Conservation Center, Hopkins Marine Station, Stanford University, Pacific Grove, CA, USAe-mail: [email protected]
M. D. Gray · P. H. Rogers G.W. Woodruff School of Mechanical Engineering, Georgia Institute of Technology, Atlanta, GA, USA
A. N. Popper Department of Biology and Center for Comparative and Evolutionary Biology of Hearing, University of Maryland, College Park, MD, USA
442 J Comp Physiol A (2015) 201:441–454
1 3
filled chamber such as the swim bladder, generally have wider hearing bandwidths and greater sensitivity compared to species which more heavily rely on particle motion for sound detection (Chapman and Hawkins 1973; Fay and Popper 1974, 1975). Species without specializations that connect a bubble chamber to the ear may be only “motion sensitive” or they may have limited pressure sensitivity, depending on the position of the air chamber relative to the ear (Chapman and Sand 1974; Fay and Popper 1974, 1975).
Two approaches have been used to test hearing capabili-ties of fishes. The current “preferred” approach has been to use auditory evoked potentials (AEP) to measure electrical responses from the inner ear and/or brainstem (reviewed in Ladich and Fay 2013). Though the AEP method has pro-vided data on far more species than earlier behavioral stud-ies, all these data suffer from the very valid criticism that the method only tests hearing up to the level of the ear and brainstem and does not reflect the function of the whole auditory system or the behavioral response to sound (Sis-neros et al. 2015). Thus, only behavioral approaches pro-vide appropriate data on the frequency range and sensitiv-ity of hearing that the animal can use to make behavioral decisions.
At the same time, most earlier behavioral studies have been done in small tanks (e.g., Tavolga and Wodinsky 1963) and in some cases, where fish were restricted in movement (e.g., Fay and Ream 1992). In such small tanks (those with all dimensions much smaller than an acoustic wavelength), the acoustic field is highly complex and dif-ficult to measure (Parvulescu 1964; Rogers et al. 2015). Thus, while these earlier studies hold great value in dem-onstrating hearing capability and range of sounds to which fish can respond, they are still restricted in not providing information on detection of pressure vs. particle motion, or on the sound field to which fishes were exposed (e.g., Pop-per et al. 2014).
Based on these limitations of previous studies, the criti-cal need for understanding fish hearing is for studies where fish are in larger tanks or open bodies of water, and where behavioral responses are measured. Behavioral condition-ing methods “ask” the fish what it hears. This approach allows the fish to use all of its hearing and sound process-ing capabilities to perceive signals and indicate the lowest levels it can detect. The ideal approach to measuring hear-ing in a pelagic fish would be to do so in a natural open water environment, as has been done for several species (e.g., Chapman and Hawkins 1973; Hawkins and Johnstone 1978; Schuijf et al. 1977). However, such studies require facilities that are not easily acquired or easily used (see also Popper et al. 2014). An added complication arises when testing species that must swim continuously for respira-tion, as is the case with tuna. Any laboratory study of hear-ing in such animals must employ a test pool that is large
enough to permit life-sustaining activity. Acoustically, the use of a tank with a high impedance bottom (where both sound speed and density are higher than those of water, as in concrete or metal with solid underlayment) with a water depth of at least a quarter wavelength may provide somewhat more relevant acoustic conditions relative to the “small” tanks described above, but the fields may still be complex and require careful characterization (Gray et al. 2015). Regardless of such procedures, the deep, open water acoustic condition in which pelagic fish live is not readily reproducible in a laboratory environment over any useful combination of bandwidth and spatial extent.
There have been very few hearing studies involving free-swimming fish, the most notable of which were by Iversen (1967, 1969) on two tuna species and several on sharks (Nelson 1967; Myrberg et al. 1969). However, determina-tion of hearing range and sensitivity (thresholds) has rarely been conducted on free-swimming animals due to the logis-tical difficulties inherent in behavioral methods. Moreover, in those previous studies, the fish were swimming at slow speeds. Thus, little is known about how well fishes can hear while swimming at their “normal” or at greater speeds.
Movement of fishes through water potentially has sig-nificant impacts on their ability to detect sound. As fish swim, water displacement caused by the fish produces a flow field around the body which can be either laminar or turbulent (Anderson et al. 2001). These boundary layer effects impart on the body spatially and temporally fluctu-ating pressure and particle motion fields referred to as flow noise, which may mask important environmental sound stimuli to the fish. Flow noise can be especially problem-atic for fast swimming species such as tunas, as it increases very rapidly with swimming speed (Urick 1983). Con-sequently, understanding hearing in the presence of flow noise may provide new insights into how fish hear in very noisy conditions.
The Pacific bluefin tuna (Thunnus orientalis) is an ideal species for investigating the ability of fish to cope with flow noise. This species is commercially important, with significant research conducted on its ecology, physiology, and behavior. Free-swimming Pacific bluefin tuna tracked with acoustic and satellite telemetry swim at an average speed of one body length s−1, with maximum swimming speeds greater than 20 m s−1 (Wardle et al. 1989; Marcinek et al. 2001). Pacific bluefin tuna, as all species of tuna, are ram ventilators and hence must constantly swim to respire. Thus, if they hear, they must be able to do so while swim-ming at speeds that average 1 m s−1 or more (Blank et al. 2007).
There are few data on hearing in any tuna species. Iversen (1967) measured behavioral hearing thresholds and found that yellowfin tuna (Thunnus albacares) could hear from 200 to 800 Hz and that swimming kawakawa

443J Comp Physiol A (2015) 201:441–454
1 3
(Euthynnus affinis) had a similar hearing range (Iversen 1969). However, thresholds reported by Iversen (1967, 1969) were in terms of sound pressure, while anatomi-cal studies of the inner ear of several tuna species (Popper 1981; Song et al. 2006), coupled with the lack of connec-tion between the swim bladder (when present) and inner ear, suggest that tuna are primarily sensitive to particle motion (Song et al. 2006). Yet, multiple fish species have demonstrated sensitivity to sound pressure despite a lack of any direct connections between the swim bladder and the ear (e.g., Chapman and Hawkins 1973; Hawkins and Johnstone 1978; Myrberg and Spires 1980; Jerkø et al. 1989). These results indicate that the hearing characteris-tics of individual species cannot yet be predicted by anat-omy alone. The goals of this study were to use behavioral techniques to determine the frequency range and sensitiv-ity with which Pacific bluefin tuna hear while swimming. We develop and demonstrate a methodology which can be effectively applied to large fish species in a laboratory setting.
Methods
Experimental fish
Pacific bluefin tuna were obtained from the wild off the coast of California and Mexico and brought into the Tuna Research and Conservation Center in Pacific Grove, Cali-fornia where they were held in a 109 m3 (9.14 m diameter, 1.65 m deep) cylindrical tank maintained at 20 ± 1 °C. Equipment used for water maintenance (i.e., heaters, chill-ers, filters) was located exterior to the holding facility, sep-arate from the holding and experimental tanks. Fish were fed a diet of squid, sardines, and enriched gelatin dropped from above the tank three times a week. As obligate ram respirators, Pacific bluefin tuna swim continuously in the tank and swimming speeds increase significantly dur-ing feeding when fish would leave the tank perimeter and move to the center of the tank where food is delivered. This behavioral response to feeding was used as the basis for auditory testing.
For hearing tests, two Pacific bluefin tuna were moved to an experimental tank, identical in dimension to the hold-ing tank. An archival depth tag (Lotek LTD 2910) was implanted into the dorsal musculature of each animal. Pairs of fish were trained and tested together rather than indi-vidually, because Pacific bluefin tuna are a schooling spe-cies and individual animals in captivity do not fare well (B. Block, unpublished).
The experimental tank consisted of a “stimulus presen-tation region” located at one side of the tank and a feed-ing station at the opposite side of the tank approximately
1.5 m from the wall (Fig. 1). The feeding station consisted of a remote-controlled food dispenser located near the ceil-ing approximately 3 m above the tank. Four video cameras positioned above the tank were used to observe the fish. The cameras were in a square configuration which pro-vided full coverage of the tank. All experimental equip-ments were operated by the experimenter from an isolated room to eliminate visual cues during training and testing.
Sound presentation
Testing was done at 325, 400, 500, 600, 700 and 800 Hz. It was not possible to test frequencies below 325 Hz because the cutoff frequency for the 1.7 m deep tank (see below) was about 300 Hz and because the output level of the sources decreased with frequency squared.
Sound presentations were made using an array of sources located at the bottom center of the tank (Fig. 1). The eight sources (model 6135-C, International Transducer Corporation, Santa Barbara, CA, USA) were arranged in a ring 5 cm above the tank floor and driven uniformly to pro-vide an acoustic field that was essentially independent of azimuth angle. Array drive signals were generated by play-ing “wav”-formatted digital audio files on a compact audio player (Zoom H2, Sampson, Hauppauge, NY, USA), rout-ing the analog output to a variable attenuator, followed by a bandpass filter (model 3988, Krohn-Hite, Brockton, MA, USA), leading to a power amplifier (model L6, Instruments Inc., San Diego, CA, USA). The attenuator was used to cre-ate precisely stepped excitation levels for the hearing tests. The bandpass filter was used to minimize broadband noise in the drive signal and suppress drive tone harmonics.
Fig. 1 Geometry of the experiment. The tank was 9.14 m in diam-eter and 1.65 m in depth. 1 source array, 2 feeding station, 3 stimulus region, 4 acoustic field mapping locations

444 J Comp Physiol A (2015) 201:441–454
1 3
Drive waveforms consisted of 300 ms duration, 25 % taper Tukey windowed (Harris, 1967) tone pulses fol-lowed by 100 ms at zero amplitude (Online Resource 1). These 400 ms segments were replicated into a 20 s duration sequence, and saved as 16-bit, 44.1 kHz “wav” files. One file was made for each of the presentation frequencies: 325, 400, 500, 600, 700 and 800 Hz. Each tone sequence played on the H2 ran from the beginning of the file, where the starting amplitude was zero, so that in combination with the pulse windowing, bandpass filtering, and a ramp func-tion internal to the H2, no measurable startup transients were generated in the in-water signal. Harmonics of the drive tones were similarly not detectible above the in-water background noise, with the exception of the harmonic of 325 Hz, whose amplitude at 650 Hz was approximately 50 dB below the primary level at maximum drive.
Training
Normal behavior of Pacific bluefin tuna is to swim around the perimeter of the tank, either clockwise or counterclock-wise (fish would change direction randomly) and only rarely go to other tank regions (e.g., center). The general procedure was to train the pairs of tuna to associate the sound stimulus with a food reward. Fish learned to swim to just below the feeder when they heard a sound (Online Resource 2). If the fish did not hear the sound, they would continue swimming around the tank perimeter (Online Resource 3).
For training purposes, a pure tone stimulus at full inten-sity representing one of the experimental stimuli was paired with turning on of an LED light stimulus which was positioned above the tank by the food dispenser. Since it is known that Pacific bluefin tuna will quickly learn to respond to a light stimulus (B. Block, unpublished), the pairing of sound with a light resulted in fish first learning to go to the feeder for food. Subsequently, the use of the light was decreased so that the fish transferred their response to the light source to the sound.
During training, light and sound were initiated as the fish entered the stimulus region (Fig. 1). The fish quickly learned to respond to the onset of the stimuli by swimming rapidly to just under the feeding station. Time from stim-ulus detection to arriving at the feeding station was ~1 s. Once the fish reached this location, the light and sound were turned off and the food reward (~100 g sardine or squid pieces) simultaneously dispensed.
Once the behavioral response to stimulus presentation was established, the light stimulus was phased out over 1–2 trials. Subsequently, a training session would consist of ten repetitions of a single pure tone and the stimulus frequency was varied randomly between training sessions. A fish pair was considered successfully trained when the fish correctly
responded to the sound stimulus 100 % of the time at all experimental frequencies. With the exception of the first pair of fish, a ‘trainer’ fish from the previous pair remained in the tank while training the next pair of fish. Retaining a ‘trainer’ fish decreased the number of training sessions required for the next pairs of fish compared to the original pair of fish. While not statistically testable due to the low n, it appears that the animals with a trainer fish learned the task in about half the time as the original pair. The ‘trainer’ fish was removed prior to experimental trials.
Behavioral testing
Hearing thresholds for fish pairs were measured utilizing a staircase psychophysical technique (Dixon and Massey 1951; Tavolga and Wodinsky 1963) at each of the six fre-quencies. If a fish pair responded correctly to the sound stimulus, they were rewarded with food and the sound level for the next trial was lowered by 5 dB. If the fish pair did not respond to the sound, no food reward was presented and the sound level for the next level was increased by 5 dB. A minimum of eight reversals between detection and no detection were recorded before a trial was terminated (Online Resource 4). Food rewards were presented in a random fashion so that only one in three correct responses resulted in fish being fed. This random interval schedule allowed for an increase in the number of responses before fish became satiated.
The threshold was determined as the midpoint between each reversal and the overall threshold for that trial was the mean of the midpoint values, representing the value at which the pair responds correctly to 50 % of the trials at that sound level (Tavolga and Wodinsky 1963). Three tri-als were conducted at each frequency, 2–3 trials were con-ducted per day, and fish were only fed during experimental trials (total quantity similar to normal maintenance rations) to maintain motivation for the response behavior. If the fish pair response deteriorated during a trial, the trial was aborted and repeated at a later day. To ensure that the fish were responding only to the sound stimulus, a blank trial was conducted in which the experiment was run without the sound being transmitted into the tank.
Acoustic field characterization
The acoustic field produced by the projector array was characterized inside the tank using a hydrophone (model 6166, International Transducer Corporation, Santa Bar-bara, CA, USA) and a pair of single axis neutrally buoyant accelerometers (model 51585-4, EDO Corp., NY) oriented to independently measure radial and vertical acoustic par-ticle motion within a cylindrical coordinate system whose vertical axis was aligned with gravity. The sensors were
445J Comp Physiol A (2015) 201:441–454
1 3
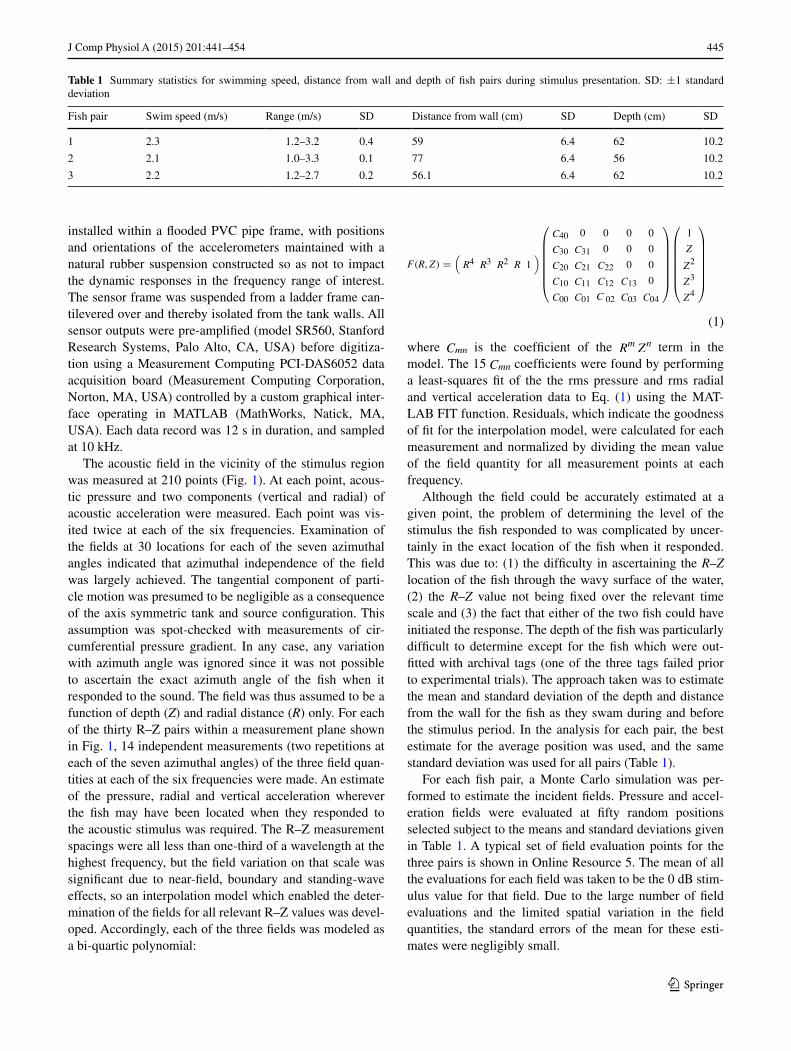
installed within a flooded PVC pipe frame, with positions and orientations of the accelerometers maintained with a natural rubber suspension constructed so as not to impact the dynamic responses in the frequency range of interest. The sensor frame was suspended from a ladder frame can-tilevered over and thereby isolated from the tank walls. All sensor outputs were pre-amplified (model SR560, Stanford Research Systems, Palo Alto, CA, USA) before digitiza-tion using a Measurement Computing PCI-DAS6052 data acquisition board (Measurement Computing Corporation, Norton, MA, USA) controlled by a custom graphical inter-face operating in MATLAB (MathWorks, Natick, MA, USA). Each data record was 12 s in duration, and sampled at 10 kHz.
The acoustic field in the vicinity of the stimulus region was measured at 210 points (Fig. 1). At each point, acous-tic pressure and two components (vertical and radial) of acoustic acceleration were measured. Each point was vis-ited twice at each of the six frequencies. Examination of the fields at 30 locations for each of the seven azimuthal angles indicated that azimuthal independence of the field was largely achieved. The tangential component of parti-cle motion was presumed to be negligible as a consequence of the axis symmetric tank and source configuration. This assumption was spot-checked with measurements of cir-cumferential pressure gradient. In any case, any variation with azimuth angle was ignored since it was not possible to ascertain the exact azimuth angle of the fish when it responded to the sound. The field was thus assumed to be a function of depth (Z) and radial distance (R) only. For each of the thirty R–Z pairs within a measurement plane shown in Fig. 1, 14 independent measurements (two repetitions at each of the seven azimuthal angles) of the three field quan-tities at each of the six frequencies were made. An estimate of the pressure, radial and vertical acceleration wherever the fish may have been located when they responded to the acoustic stimulus was required. The R–Z measurement spacings were all less than one-third of a wavelength at the highest frequency, but the field variation on that scale was significant due to near-field, boundary and standing-wave effects, so an interpolation model which enabled the deter-mination of the fields for all relevant R–Z values was devel-oped. Accordingly, each of the three fields was modeled as a bi-quartic polynomial:
where Cmn is the coefficient of the RmZn term in the
model. The 15 Cmn coefficients were found by performing a least-squares fit of the the rms pressure and rms radial and vertical acceleration data to Eq. (1) using the MAT-LAB FIT function. Residuals, which indicate the goodness of fit for the interpolation model, were calculated for each measurement and normalized by dividing the mean value of the field quantity for all measurement points at each frequency.
Although the field could be accurately estimated at a given point, the problem of determining the level of the stimulus the fish responded to was complicated by uncer-tainly in the exact location of the fish when it responded. This was due to: (1) the difficulty in ascertaining the R–Z location of the fish through the wavy surface of the water, (2) the R–Z value not being fixed over the relevant time scale and (3) the fact that either of the two fish could have initiated the response. The depth of the fish was particularly difficult to determine except for the fish which were out-fitted with archival tags (one of the three tags failed prior to experimental trials). The approach taken was to estimate the mean and standard deviation of the depth and distance from the wall for the fish as they swam during and before the stimulus period. In the analysis for each pair, the best estimate for the average position was used, and the same standard deviation was used for all pairs (Table 1).
For each fish pair, a Monte Carlo simulation was per-formed to estimate the incident fields. Pressure and accel-eration fields were evaluated at fifty random positions selected subject to the means and standard deviations given in Table 1. A typical set of field evaluation points for the three pairs is shown in Online Resource 5. The mean of all the evaluations for each field was taken to be the 0 dB stim-ulus value for that field. Due to the large number of field evaluations and the limited spatial variation in the field quantities, the standard errors of the mean for these esti-mates were negligibly small.
(1)
F(R, Z) =
�
R4R3R2R 1
�
C40 0 0 0 0
C30 C31 0 0 0
C20 C21 C22 0 0
C10 C11 C12 C13 0
C00 C01 C 02 C03 C04
1
Z
Z2
Z3
Z4
Table 1 Summary statistics for swimming speed, distance from wall and depth of fish pairs during stimulus presentation. SD: ±1 standard deviation
Fish pair Swim speed (m/s) Range (m/s) SD Distance from wall (cm) SD Depth (cm) SD
1 2.3 1.2–3.2 0.4 59 6.4 62 10.2
2 2.1 1.0–3.3 0.1 77 6.4 56 10.2
3 2.2 1.2–2.7 0.2 56.1 6.4 62 10.2

446 J Comp Physiol A (2015) 201:441–454
1 3
Noise field characterization
Pressure and acceleration noise were measured at each field point when the source fields were measured. Each measure-ment radial and depth point was sampled 14 times over a 40 h period with a minimum time separation of 2 h. Each of the seven angular runs (each measured twice) is treated as an independent sample of the noise at a given radial and depth location over a 40 h time span.
Data analysis
Repeated measures ANOVA was used to test for differences in threshold levels between frequencies, with frequency as the within-subjects factor and fish pair as a random factor. Sig-nificant differences indicated by repeated measures ANOVA were evaluated between frequencies with Tukey’s HSD post hoc tests conducted with a family alpha of 0.05. Swimming speed prior to each stimulus presentation was calculated as the number of frames required to cover the final 2 m prior to entering the stimulus region multiplied by the frame rate (seven frames per second) of the overhead camera.
Results
Acoustic field characterization
The acoustic field of the tank environment was charac-terized prior to introducing the Pacific bluefin tuna to the tanks. The measured sound fields had a rather limited dynamic range, were not uniform and had no strong peaks or deep nulls (Figs. 2, 3, 4). There was not an overall ten-dency for the fields to increase toward the center of the tank but, as would be expected, there was a decrease toward the surface for the radial acceleration and pressure and an increase toward the surface for the vertical acceleration. The spatially averaged ratios of pressure (P) and total par-ticle velocity (vrz) varied with frequency between a magni-tude of 0.45 < p/ρcvrz < 0.65, where ρc is the characteristic impedance of water. The pressure and velocity were 90° out of phase at all frequencies which are indicative of the standing-wave nature of the field.
Residuals from the interpolation model (see “Acous-tic Field Characterization” in “Methods”) as a function of depth and radial distance indicate that the model is quite
Fig. 2 The interpolation models for the 0 dB acoustic pressure field at the six test frequencies, 325, 400, 500, 600, 700 and 800 Hz. The black dots superimposed on the 800 Hz graph indicate the locations of the 30 R–Z field measurement points

447J Comp Physiol A (2015) 201:441–454
1 3
good for pressure at all frequencies, for radial acceleration at all frequencies except 325 Hz, and for vertical accelera-tion at all frequencies except 325 and 400 Hz (Fig. 5). The Gaussian nature of the residuals indicates their noise-like nature and that the interpolation models and the estimates of the fields based on them are as good as possible and provide strong evidence for the assumed azimuthal independence of the applied acoustic fields. Uncertainty in the estimated fields was less than 1 dB except for the acceleration fields at 325 Hz where it may have been considerably greater.
Background noise field characterization
The mean variation in power spectral density from point-to-point was much less than the variation from time-to-time (Fig. 6). The noise was not white and had many spectral lines. The measured noise data were ultimately determined to be dominated by electromagnetic rather than acoustic noise and hence was of little importance in assessing S/N for the threshold data. Thus, measured noise power spectral density can only be considered as an upper bound to the true background acoustic noise.
Hearing sensitivity
Three pairs of Pacific bluefin tuna (size range 81.6–102.0 cm curved fork length) were tested for hearing sensi-tivity. Mean swimming speeds measured just prior to stim-ulus presentation were consistent between fish pairs, with average speeds ranging from 2.1 to 2.3 m s−1 (Table 1).
There were significant differences in Pacific bluefin tuna hearing thresholds at the different frequencies tested (Fig. 7) (Repeated Measures ANOVA; pressure thresholds: F5,46 = 62.89, p < 0.001, radial acceleration thresholds: F5,46 = 104.85, p < 0.001, vertical acceleration thresholds: F5,46 = 84.02, p < 0.001). Greatest sensitivity was at 400 and 500 Hz, with decreasing sensitivity at higher and lower frequencies for pressure and both components of accelera-tion. Lowest sensitivity of the measured frequencies was at 325 and 800 Hz. The greatest difference between two frequencies was between 325 and 400 Hz for acceleration thresholds.
The overall shape of the audiograms for all three experi-mental pairs was consistent, as was the variability at each frequency (Table 2; Fig. 8). Thresholds for pairs 1 and 2
Fig. 3 The interpolation models for the 0 dB radial acceleration field at the four test frequencies, 325, 400, 500, 600, 700 and 800 Hz. The black dots superimposed on the 800 Hz graph indicate the locations of the 30 R–Z field measurement points

448 J Comp Physiol A (2015) 201:441–454
1 3
were very similar to one another, while thresholds for pair 3 were generally 5–10 dB lower than for the other pairs.
Discussion
This study is the first to measure hearing of a free-swim-ming fish under known acoustic conditions, thus enabling demonstration that this species can hear even when mov-ing at normal swimming speeds. Moreover, the study pro-vides a method that, while requiring the complexity of a large tank, is easily repeatable and applicable to other spe-cies. This study is also the first to demonstrate hearing in highly migratory, widely distributed species such as Pacific bluefin tuna that has a significant potential for coming into contact with acoustic noise generated from activities such as seismic air guns, naval and commercial sonar, shipping, and other man-made activities which could impact natural behavior and fitness (Sarà et al. 2007; Popper et al. 2014).
To develop appropriate mitigation and conservation techniques, it is important to determine the frequencies and
sound levels these species can detect. Moreover, an experi-mental environment in which hearing is studied must not only be acoustically determined, but it must also be one in which large animals are able to move around easily and at normal speeds. This study on Pacific bluefin tuna, there-fore, not only provides important information about hear-ing in this commercially important species, but also dem-onstrates a methodology that should be a “model” for how acoustic analysis of large tanks be conducted.
Studies of hearing capabilities in fast swimming Pacific bluefin tuna, as for all fishes, are influenced by the qual-ity of the sound field in which the fish are tested and the need to provide accurate and extensive measurement and calibration of these fields (Parvulescu 1964; Gray et al. 2015; Rogers et al. 2015). Indeed, there are substantial difficulties in interpretation of most early hearing stud-ies due to poorly understood and calibrated tank acoustics (Popper et al. 2014; Rogers et al. 2015). The only excep-tion is from work done in the open field (e.g., Chapman and Hawkins 1973; Hawkins and Johnstone 1978; Schuijf et al. 1977) where the investigators were able to measure
Fig. 4 The interpolation models for the 0 dB vertical acceleration field at the four test frequencies, 325, 400, 500, 600, 700 and 800 Hz. The black dots superimposed on the 800 Hz graph indicate the locations of the 30 R–Z field measurement points

449J Comp Physiol A (2015) 201:441–454
1 3
pressure and particle motion and where the sound field was very similar to that normally encountered by fish. However, field studies with animals that have to be free swimming, such as Pacific bluefin tuna, would be very difficult and expensive to do, and a “compromise” needs to be found that will allow for laboratory-based studies but with well-characterized sound fields so that the behav-ioral responses of the fish to sound can be determined (Popper et al. 2014).
One approach to take, particularly for large fast swim-ming fish such as Pacific Bluefin tuna, is to investigate hearing in large tanks in which the sound field is thor-oughly characterized. While there have been a few stud-ies in large tanks (Iversen 1967, 1969; Nelson 1967), the
only measures of hearing were for sound pressure and these measures were done in only very limited parts of the tank and did not take into consideration the acoustics of such an environment (Gray et al. 2015). In contrast, the cur-rent study involved extensive calibration of the sound field for both pressure and particle motion. While the acoustic environment is still not ideal, particularly for large pelagic fishes that swim in the deep ocean, it is substantially bet-ter than in small tanks used in other studies and serves as a model for future studies asking similar questions. At the same time, it should be noted that the calibration of a tank the size of the one used in this study is difficult and time-consuming, and needs to be done in collaboration with experts in acoustics.
−0.2 0 0.20
20
40
60
80 Pressure (325 Hz)
Normalized Residual
Occ
urre
nces
rms residual 0.092
−0.1 −0.05 0 0.05 0.1 0.150
20
40
60
80
100 Pressure (500 Hz)
Normalized Residual
Occ
urre
nces
rms residual 0.044
−0.2 −0.1 0 0.10
10
20
30
40
50 Pressure (700 Hz)
Normalized Residual
Occ
urre
nces
rms residual 0.086
−2 −1 0 10
20
40
60
80
100Radial Acceleration (325 Hz)
Normalized Residual
Occ
urre
nces
rms residual 0.38
−0.05 0 0.050
10
20
30
40
50Radial Acceleration (500 Hz)
Normalized Residual
Occ
urre
nces
rms residual 0.03
−0.6 −0.4 −0.2 0 0.20
10
20
30
40
50
60Radial Acceleration (700 Hz))
Normalized Residual
Occ
urre
nces
rms residual 0.13
−4 −3 −2 −1 0 10
20
40
60
80
100
120Vertical Acceleration (325 Hz)
Normalized Residual
Occ
urre
nces
rms residual 0.86
−0.15 −0.1 −0.05 0 0.05 0.10
10
20
30
40
50
60Vertical Acceleration (500 Hz)
Normalized Residual
Occ
urre
nces
rms residual 0.043
−0.4 −0.2 0 0.2 0.40
20
40
60
80Vertical Acceleration (700 Hz)
Normalized Residual
Occ
urre
nces
rms residual 0.12
Fig. 5 Residuals for the interpolation model evaluated at all measurement angles, R–Z values and repetitions. 420 points in all for all field types and three frequencies, 325, 500 and 700 Hz

450 J Comp Physiol A (2015) 201:441–454
1 3
Particle motion vs sound pressure
The otolith organs of the inner ear act as an accelerome-ter-like system, leading to the suggestion that the primary stimulus for fish hearing is particle motion (e.g., de Vries 1950; Pumphrey 1950; Hawkins and Myrberg 1983; Pop-per and Fay 2011). However, the majority of results for fish hearing experiments have been presented in terms of sound pressure, as most investigators have not had the equipment to measure particle motion. While reporting data in terms of sound pressure may be reasonably accurate for species which have a physical connection between the inner ear and swim bladder (i.e., Otophysans), for species which lack this connection, or at lower frequencies in species that do have some connection (Fay and Popper 1974, 1975), the sound stimulus should be measured in terms of both pres-sure and acceleration (also see Popper et al. 2014).
Recent investigations have begun to focus more on the acceleration component of acoustic stimuli as it relates to fish hearing (Casper and Mann 2006; Horodysky et al. 2008; Wysocki et al. 2009), in part due to technological
advancements which allow motion sensors such as acceler-ometers to be properly used in water. Through comparison of audiograms in terms of pressure and acceleration, these studies have indicated that pressure is an adequate proxy for describing a species best hearing range and general audiogram shape. Similar results were found in this study for Pacific bluefin tuna. For both pressure and accelera-tion, best hearing for Pacific bluefin tuna was in the range of 400–500 Hz with sharp decreases in sensitivity at higher and lower frequencies (Fig. 7).
Similarities in audiograms, however, do not provide information on which aspect of the acoustic stimulus (pres-sure vs particle motion) the fish is detecting, or whether the fish may be using both components of the sound field, even at the same frequencies (Chapman and Hawkins 1973; Fay and Popper 1974, 1975; Hawkins 2014). To determine the specific stimulus, a targeted experimental approach is required. For example, previous studies have conducted hearing experiments in unbounded, free-field environments where the ratio between pressure and particle motion varies with distance from the source (e.g., Chapman and Hawkins
200 300 400 500 600 700 800 900 100065
70
75
80
85
Frequency (Hz)
PS
D (
dB r
e 1
Pa/
Hz1/
2 )
Pressure Noise Spectrum
200 300 400 500 600 700 800 900 1000−90
−80
−70
−60
Frequency (Hz)
PS
D(d
B r
e 1
m/s
2 /Hz1/
2 )
Radial Acceleration Noise Spectrum
200 300 400 500 600 700 800 900 1000−100
−90
−80
−70
Frequency (Hz)
PS
D (
dB r
e 1
m/s
2 /Hz1/
2 )
Vertical Aceleration Noise Spectrum
Fig. 6 Power spectral density for the pressure noise (top), the radial acceleration noise (middle) and the vertical acceleration noise (bottom)

451J Comp Physiol A (2015) 201:441–454
1 3
1973). An alternative approach appropriate for a labora-tory setting employs an experimental setup where the ratio between pressure and particle motion can be altered and measured (Hawkins and MacLennan 1976; Rogers et al. 2015). For both approaches, thresholds are determined for differing pressure–particle motion ratios, and the shape
of the audiogram with respect to the pressure or particle motion variables provides the information needed to deter-mine the actual stimuli detected (see Popper and Fay 2011). Although both pressure and particle motion were measured in the current study, the ratio between pressure and parti-cle motion is determined by the tank and cannot be altered, hence this ratio-altering approach could not be employed to determine whether Pacific bluefin tuna were responding to pressure, particle motion, or both.
Designing an experiment to resolve the ambiguity as to the nature of the adequate stimulus for hearing in Pacific bluefin tuna is of paramount importance to enable assessing the ability of the animals to cope with masking that results from flow noise since the signal-to-noise ratio for particle motion detection is known to be much lower than for pres-sure detection (Keller 1977; Finger et al. 1979). Resolving the ambiguity in adequate stimulus would require perform-ing the experiment in a much larger and deeper venue, which is likely feasible only in open water.
Comparison with other tuna species
This study is the first to record an audiogram for Pacific bluefin tuna and only the third for any tuna species (Iversen 1967, 1969). The audiogram of Pacific bluefin tuna was similar in shape to that of yellowfin tuna (Iversen 1967) and kawakawa (Iversen 1969) (Fig. 7a). At the same time, it must be recognized that the results reported here may reflect masked thresholds at some or all frequencies. While it was not possible to measure actual acoustic noise lev-els in the tank due to the presence of electrical noise, it is likely that there was little or no masking at 325 Hz since the variability of thresholds between individual measures compared to other frequencies (Fig. 7; Table 2) was very small. Such small variability would not be found in an environment with fluctuating noise levels.
For all three tuna species, most sensitive hearing was from 400 to 500 Hz (Fig. 7a). However, there were a num-ber of differences in sensitivities between the tuna species. At 500 Hz, Pacific bluefin tuna were more sensitive by approximately 5 and 20 dB compared to yellowfin tuna and kawakawa, respectively. These differences were consistent across frequencies, with Pacific bluefin tuna most sensitive and kawakawa least sensitive. However, it is again neces-sary to point out that due to differences in tank acoustics and not knowing if tuna respond to pressure and/or particle motion, the actual differences in sensitivity between spe-cies may or may not be real.
Several hypotheses exist which might explain these dif-ferences in hearing sensitivity between species, if the dif-ferences are real. Variability in fish swimming speeds between studies would cause differences in the amount of flow noise experienced by experimental fish. Iversen
a
b
c
Fig. 7 Mean hearing thresholds by frequency for Pacific bluefin tuna (n = 3). Threshold levels correspond to a sound pressure; results are plotted along with mean threshold values for yellowfin tuna (long dashed line) from Iversen (1967) and kawakawa (short dashed line) from Iversen (1969), b radial acceleration, c vertical acceleration. Error bars are ±1 standard deviation. Lowercase letters associated with error bars represent results of Tukey’s HSD post hoc compari-sons of mean threshold values for Pacific bluefin tuna. Frequencies with dissimilar letters indicate significant differences in mean thresh-old values between those frequencies

452 J Comp Physiol A (2015) 201:441–454
1 3
(1969) reported that yellowfin tuna swam 50 % slower than kawakawa during hearing trials. The increased flow noise experienced by kawakawa would translate into decreased hearing sensitivities which were higher than yellowfin tuna if the noise-independent hearing ability of kawakawa was at least equivalent to yellowfin tuna. Unfortunately, actual swimming speeds were not reported for either study (Iversen 1967, 1969), preventing comparisons with Pacific bluefin tuna swimming speeds in the current study.
The decreased sensitivity of kawakawa could also be due to the lack of a swim bladder, whereas swim bladders are present in both Pacific bluefin and yellowfin tuna. Sound pressure can be transformed into particle motion through vibration of the swim bladder. These vibrations are then relayed to the inner ear, generally through a close associa-tion between the swim bladder and inner ear as found in otophysan fishes (Popper and Fay 2011). However, three species of non-otophysan fishes have been shown to detect both particle motion and sound pressure despite lack-ing this close association (Chapman and Hawkins 1973;
Myrberg and Spires 1980; Jerkø et al. 1989). If the pres-ence of a swim bladder in Pacific bluefin and yellowfin tuna was responsible for their increased sensitivity com-pared to kawakawa, it would be likely that these species are similarly able to detect pressure. In this case, differences in hearing sensitivity between Pacific bluefin and yellowfin tuna could be due to variability in the degree of involve-ment of the swim bladder in their hearing capabilities.
The increased sensitivity of Pacific bluefin compared to yellowfin tuna could additionally be due to differences in heat retention between these species. Tunas utilize a coun-ter-current heat exchange system to retain heat, and demon-strate elevated temperatures in the myotome muscle, eye, brain and viscera (Carey and Teal 1969; Linthicum and Carey 1972). Hearing sensitivity has been shown to be tem-perature dependent, at least in some species (Wysocki et al. 2009; Papes and Ladich 2011; Maiditsch and Ladich 2014). For example, walleye pollock (Theragra chalcogramma) were reported to have increased sensitivity at higher tem-peratures (Mann 2009), similar to results for goldfish (Car-assius auratus) (Fay and Ream 1992). Pacific bluefin tuna are more endothermic, and retain more heat compared to yellowfin and other tuna species, and this higher degree of heat retention may translate into increased hearing sen-sitivity if this trend is consistent within the cranial region. Warming of the auditory and cranial nervous tissues could also result in improved synaptic transmission speed.
Comparison with non-tuna species
The frequency range at which tuna hearing is most sensi-tive (400–500 Hz) falls within the upper end of the spec-trum for species which lack a connection between the swim bladder and inner ear. Several species tested by Tavolga and Wodinksy (Tavolga and Wodinsky 1963) had best frequen-cies reported in the 400–600 Hz range. In comparison, best frequency for Atlantic salmon (Salmo salar) and Atlantic cod (Gadus morhua) was 160 Hz (Chapman and Hawkins 1973; Hawkins and Johnstone 1978). At the lower end of
Table 2 Hearing thresholds for the three bluefin pairs used in experimental trials in terms of pressure (P, dB re 1 μPa), radial acceleration (RA, dB re 1 m s−1) and vertical acceleration (VA, dB re 1 m s−1)
Values in parentheses represent ±1 standard deviation
Fish pair frequency P 1 2 3
RA VA P RA VA P RA VA
325 98.6 (0.8) −67.3 (0.9) −69.4 (0.9) 97.4 (0.1) −68.9 (0.5) −70.1 (0.5) 97.3 (0.2) −68.7 (0.4) −71.1 (0.5)
400 88.2 (4.7) −86.4 (4.8) −84.7 (4.8) 87.5 (1.2) −87.5 (1.3) −84.5 (1.2) 83.9 (1.3) −90.4 (1.4) −88.7 (1.3)
500 84.8 (1.7) −83.7 (1.6) −84.4 (1.6) 86.1 (2.0) −83.5 (2.0) −82.7 (1.9) 79.4 (3.1) −88.9 (3.0) −90.1 (3.1)
600 92.1 (3.1) −78.0 (3.1) −77.4 (3.1) 91.1 (1.0) −80.4 (1.0) −77.5 (0.7) 83.8 (3.6) −86.3 (3.6) −85.6 (3.6)
700 93.3 (3.1) −77.3 (3.1) −75.9 (3.1) 96.9 (1.4) −77.2 (1.5) −71.9 (1.2) 89.2 (0.7) −81.2 (0.8) −80.2 (0.7)
800 101.0 (0.8) −71.4 (0.9) −68.3 (0.7) 98.7 (1.9) −74.0 (1.8) −69.9 (1.8) 96.7 (0.9) −75.5 (1.0) −72.5 (0.9)
Fig. 8 Mean pressure thresholds by frequency for the three pairs of Pacific bluefin tuna used in the study. Error bars are ±1 standard deviation

453J Comp Physiol A (2015) 201:441–454
1 3
the spectrum, the European eel (Anguilla anguilla) had a best frequency of 80 Hz with an upper frequency limit of 320 Hz (Jerkø et al. 1989). The shift in maximum sensitiv-ity toward higher frequencies for the Pacific bluefin could be an adaptation for coping with flow noise since, with increasing frequency, flow noise decreases (Haddle and Skudrzyk 1969) and is more readily reduced through spa-tial integration over the sensory epithelium and separation from flow (Ko and Schloemer 1992).
At the best frequency of 500 Hz, Pacific bluefin tuna had a sensitivity of 83 dB (re 1 μPa). This value suggests that Pacific bluefin tuna hear relatively well at 500 Hz and above compared to other non-otophysan fishes. Atlantic cod and Atlantic salmon, as well as the European eel, had best sensitivities of 84, 94 and 95 dB (re 1 μPa), respec-tively (Chapman and Hawkins 1973; Hawkins and John-stone 1978; Jerkø et al. 1989).
Tank acoustics
The test tank, despite its seemingly “large” size, did not support free-field propagation conditions at the frequencies tested. Instead, acoustic energy was largely trapped within the geometric boundaries of the tank, leading to field char-acteristics that were dominated by radial mode contribu-tions rather than geometric spreading. This was consistent with expectations, and reiterates the difficulties of conduct-ing hearing experiments in tank facilities (Parvulescu 1964; Gray et al. 2015; Rogers et al. 2015).
However, it is not clear how or to what extent the tank fields would have affected the outcomes of the hearing tri-als. In the test tank, the average ratio of pressure and total particle velocity was smaller and of different phase than would be expected in open water (i.e., the particle veloc-ity in the tank is larger). This could be important if the fish used both field variables in a hearing task, but if they use primarily one or the other, then field variable propor-tions are of no consequence. It was not possible to isolate responses to either pressure or particle velocity alone with the present experiment configuration. The lack of free-field propagation was likely a problem for Iversen (1967, 1969) as well, which could have impacted pressure thresholds reported for yellowfin tuna and kawakawa.
Spatial variations in the acoustic field may have compli-cated analysis of thresholds, increasing response variability as the fish swam through different paths from trial to trial. However, the staircase patterns for the highest frequen-cies (where field gradients were highest) do not appear to exhibit any higher degree of trial-wise variation than those at low frequencies, where field gradients were lower. This may be because the fish swam on the order of a body length during a stimulus pulse, and may therefore have integrated their hearing over a range of field values.
Conclusions
This study is the first to examine the hearing capabili-ties of Pacific bluefin tunas. Despite uncertainty in the appropriate acoustic stimulus for Pacific bluefin tuna, best hearing sensitivity occurs at 400–500 Hz whether in terms of pressure or particle motion. The ability to quickly and reliably train Pacific bluefin tuna makes this species an excellent model system to perform additional experiments aimed at understanding the potentially com-plimentary roles of pressure and particle motion in fish hearing abilities. Likewise, training Pacific bluefin tuna to swim at different speeds during hearing trials could fur-ther elucidate the influence of swimming induced ‘noise’ on hearing sensitivity. Swimming speeds of 2–3 m s−1 in this study are well below the maximum swimming speeds of this species (greater than 20 m s−1; Wardle et al. 1989; Marcinek et al. 2001). At these speeds, it is possible that the flow around the head is laminar and thus flow noise might not be the dominant noise. However, as swimming speeds increase, flow noise would become more domi-nant. Determining the adequate stimulus and allowing for higher and variable swim speeds would require repeat-ing the experiment in an at-sea venue. The experimental methodology developed here could be applied to such an experiment.
Acknowledgments The authors wish to thank E. Estess for assis-tance maintaining experimental equipment and help with general logistics, Dave Trivett for his participation in the initiation and early planning of this research and for providing expertise on flow noise issues, and Van Biesel for development of the data acquisition system used for tank acoustic field characterization. We also want to thank Drs. Richard R. Fay, Anthony D. Hawkins, Robert Iversen, William N. Tavolga, and two anonymous reviewers for providing insightful comments that improved the MS. This study was supported in part by an Office of Naval Research/Chief of Naval Research Challenge Grant: “Mitigation of flow noise effects by fish” #N00014-11-1-0620, and the Rae and Frank Neely Chair at Georgia Tech. All experimental procedures were conducted in accordance with Stanford University institutional animal use protocols.
References
Anderson EJ, McGillis WR, Grosenbaugh MA (2001) The boundary layer of swimming fish. J Exp Biol 204:81–92
Blank JM, Farwell CJ, Morrissette JM, Schallert RJ, Block BA (2007) Influence of swimming speed on metabolic rates of juvenile Pacific bluefin tuna and yellowfin tuna. Physiol Biochem Zool 80:167–177
Carey FG, Teal JM (1969) Regulation of body temperature by the bluefin tuna. Comp Biochem Physiol 28A:205–213
Casper BM, Mann DA (2006) Field hearing measurements of the Atlantic sharp nose shark Rhizoprionodon terraenovae. J Fish Biol 75:2768–2776
Chapman CJ, Hawkins AD (1973) A field study of hearing in the cod, Gadus morhua L. Comp Physiol 85:147–167

454 J Comp Physiol A (2015) 201:441–454
1 3
Chapman CJ, Sand O (1974) Field studies of hearing in two species of flatfish, Pleuronectes platessa L. and Limanda limanda L. (Family Pleuronectidae). Comp Biochem Physiol 47A:371–385
de Vries HL (1950) The mechanics of the labyrinth otoliths. Acta Oto-Laryngol 38:262–273
Dixon WJ, Massey FR Jr (1951) Introduction to statistical analysis. McGraw-Hill, New York
Fay RR (1988) Hearing in vertebrates, a psychophysics databook. Hill-Fay Assoc, Winnetka
Fay RR (2014) The sense of hearing in fishes. In: Popper AN, Fay RR (eds) Perspectives on auditory research. Springer, New York, pp 107–123
Fay RR, Popper AN (1974) Acoustic stimulation of the ear of the goldfish (Carassius auratus). J Exp Biol 61:243–260
Fay RR, Popper AN (1975) Modes of stimulation of the teleost ear. J Exp Biol 62:379–387
Fay RR, Ream TJ (1992) The effects of temperature change and tran-sient hypoxia on the auditory nerve fiber response in goldfish (Carassius auratus). Hear Res 58:9–18
Finger RA, Abbagnaro LA, Bauer BB (1979) Measurements of low-velocity flow noise on pressure gradient hydrophones. J Acoust Soc Am 65:1407–1412
Gray MD, Rogers PH, Popper AN, Hawkins AD, Fay RR (2015) Large tank acoustics: how big is big enough? In: Popper AN, Hawkins AD (eds) Effects of noise on aquatic life II. Springer, New York
Haddle GP, Skudrzyk EJ (1969) The physics of flow noise. J Acoust Soc Am 46:130–157
Hawkins AD (2014) Examining fish in the sea: a European perspec-tive on fish hearing experiments. In: Popper AN, Fay RR (eds) Perspectives on auditory research. Springer, New York, pp 247–268
Hawkins AD, Johnstone ADF (1978) The hearing of the Atlantic salmon, Salmo salar. J Fish Biol 13:655–673
Hawkins AD, MacLennan DN (1976) An acoustic tank for hearing studies on fish. In: Schuijf A, Hawkins AD (eds) Sound reception in fish. Elsevier, Amsterdam, pp 149–169
Hawkins AD, Myrberg AA Jr (1983) Hearing and sound communica-tion under water. In: Lewis B (ed) Bioacoustics, a comparative approach. Academic, Oxford, pp 347–405
Horodysky AZ, Brill RW, Fine ML, Musick JA, Latour RJ (2008) Acoustic pressure and particle motion thresholds in six sciaenid fishes. J Exp Biol 211:1504–1511
Iversen RTB (1967) Response of the yellowfin tuna (Thunnus albac-ares) to underwater sound. In: Tavolga WN (ed) Marine bio-acoustics II. Pergamon Press, Oxford, pp 105–121
Iversen RTB (1969) Auditory thresholds of the scombrid fish Euthyn-nus affinis, with comments on the use of sound in tuna fishing. FAO conference on fish behaviour in relation to fishing tech-niques and tactics. FAO Fish Rep 62(3):849–859
Jerkø H, Turunen-Rise I, Enger PS, Sand O (1989) Hearing in the eel (Anguilla anguilla). J Comp Physiol A 165:455–459
Keller BD (1977) Gradient hydrophone flow noise. J Acoust Soc Am 62:205–208
Ko SH, Schloemer HH (1992) Flow noise reduction techniques for a planar array of hydrophones. J Acoust Soc Am 92(6):3409–3424
Ladich F, Fay RR (2013) Auditory evoked potential audiometry in fish. Rev Fish Biol Fish 23:317–364
Linthicum DS, Carey FG (1972) Regulation of brain and eye temper-atures by the bluefin tuna. Comp Biochem Physiol 43A:425–433
Maiditsch IP, Ladich F (2014) Effects of temperature on auditory sensitivity in eurythermal fishes: common carp Cyprinus carpio (Family Cyprinidae) versus Wels Catfish Silurus glanis (family Siluridae). PLoS One 9:e108583
Mann DA (2009) Hearing sensitivity of the walleye Pollack. Trans Amer Fish Soc 138:1000–1008
Marcinek DJ, Blackwell SB, Dewar H, Freund EV, Farwell C, Dau D, Seitz AC, Block BA (2001) Depth and muscle temperature of Pacific bluefin tuna examined with acoustic and pop-up satellite tags. Mar Biol 138:869–885
Moulton JM (1963) Acoustic behaviour of fishes. In: Busnel G (ed) Acoustic behaviour of animals. Elsevier, Amsterdam, pp 655–693
Myrberg AA Jr, Spires JY (1980) Hearing in damselfishes: an analysis of signal detection among closely related species. J Comp Phys-iol 140:135–144
Myrberg AA Jr, Banner A, Richard J (1969) Shark attraction using a video-acoustic system. Mar Biol 2:264–276
Nelson DR (1967) Hearing thresholds, frequency discrimination, and acoustic orientation in the lemon shark, Negaprion brevirostris (Poey). Bull Mar Sci 17:741–768
Papes S, Ladich F (2011) Effects of temperature on sound production and auditory abilities in the Striped Raphael Catfish Platydoras armatulus (family Doradidae). PLoS One 6:e26479
Parvulescu A (1964) Problems of propagation and processing. In: Tavolga WN (ed) Marine bio-acoustics. Pergamon Press, Oxford, pp 87–100
Popper AN (1981) Comparative scanning electron microscopic inves-tigations of the sensory epithelia in the teleost sacculus and lagena. J Comp Neurol 200:357–374
Popper AN, Fay RR (1973) Sound detection and processing by fish: a critical review. J Acoust Soc Am 53:1515–1529
Popper AN, Fay RR (2011) Rethinking sound detection by fishes. Hearing Res 273:25–36
Popper AN, Fay RR, Platt C, Sand O (2003) Sound detection mecha-nisms and capabilities of teleost fishes. In: Collin SP, Marshall NJ (eds) Sensory processing in aquatic environments. Springer-Verlag, New York, pp 3–38
Popper AN, Hawkins AD, Fay RR, Mann D, Bartol S, Carlson T, Coombs S, Ellison WT, Gentry R, Halvorsen MB, Løkkeborg S, Rogers P, Southall BL, Zeddies D, Tavolga WN (2014) Sound exposure guidelines for fishes and sea turtles: a technical report prepared by ANSI-accredited standards committee S3/SC1 and registered with ANSI. ASA S3/SC1.4 TR-2014. Springer and ASA Press, Cham
Pumphrey RJ (1950) Hearing. Physiological mechanisms in animal behavior. Symp Soc Exp Biol 4:3–18
Rogers PH, Hawkins AD, Popper AN, Fay RR, Gray MD (2015) Par-vulescu revisited: small tank acoustics for bioacousticians. In: Popper AN, Hawkins AD (eds) Effects of noise on aquatic life II. Springer, New York
Schuijf A, Visser C, Willers AFM, Buwalda RJA (1977) Acoustic localization in an ostariophysian fish. Experientia 33:1062–1063
Sisneros JA, Popper AN, Hawkins AD, Fay RR (2015) Auditory evoked potential audiograms compared to behavioral audiograms in aquatic animals. In: Popper AN, Hawkins AD (eds) Effect of noise on aquatic life, II. Springer, New York
Song J, Mathieu A, Soper RF, Popper AN (2006) Structure of the inner ear of bluefin tuna Thunnus thynnus. J Fish Biol 68:1767–1781
Tavolga WN (1976) Sound reception in fishes—benchmark papers in animal behavior, vol 7. Stroudsburg, PA, Dowden, Hutchinson & Ross, p 317
Tavolga WN, Wodinsky J (1963) Auditory capacities in fishes: pure tone thresholds in nine species of marine teleosts. Bull Am Mus Nat Hist 126:177–240
Urick RJ (1983) Principles of underwater sound, 3rd edn. McGraw-Hill, New York, pp 360–362
Wardle CS, Videler JJ, Arimoto T, Francos JM, He P (1989) The mus-cle twitch and the maximum swimming speed of giant bluefin tuna, Thunnus thynnus L. J Fish Biol 35:129–137
Wysocki LE, Codarin A, Ladich F, Picciulin M (2009) Sound pressure and particle acceleration audiograms in three marine fish species from the Adriatic Sea. J Acoust Soc Am 126:2100–2107