Healthy Campus 2010 Midcourse Review Percent of Targeted Change Quotients Healthy Campus Overarching...
44
Healthy Campus 2010 Midcourse Review Percent of Targeted Change Quotients Healthy Campus Overarching Goals 1. Increase quality and years of healthy life 2. Eliminate health disparities Prepared by Jim Grizzell, MBA, MA, CHES, ACSM-HFS Past Chair & Co-Chair ACHA National Health Objectives Task Force
-
date post
21-Dec-2015 -
Category
Documents
-
view
219 -
download
0
Transcript of Healthy Campus 2010 Midcourse Review Percent of Targeted Change Quotients Healthy Campus Overarching...

Healthy Campus 2010Midcourse ReviewPercent of Targeted Change Quotients
Healthy CampusOverarching Goals
1. Increase quality and years of healthy life2. Eliminate health disparities
Prepared byJim Grizzell, MBA, MA, CHES, ACSM-HFS
Past Chair & Co-ChairACHA National Health Objectives Task Force

ACHA NCHA 2000-2007 Trends and Healthy Campus 2010 Midcourse Review 2
Contents
Overview of progress Focus Areas and Objectives Data sets used Limitations of the data & data needs Goals
Improve Quality and Quantity of Healthy Life Eliminate Health Disparities
Progress quotient calculation Top 10 Health impediments to academic
performance Top 10 physical and mental health problems Focus area 1-28 objectives Ideas for Recommendations
ACHA NCHA 2000-2007 Trends and Healthy Campus 2010 Midcourse Review 3
Overview of Progress
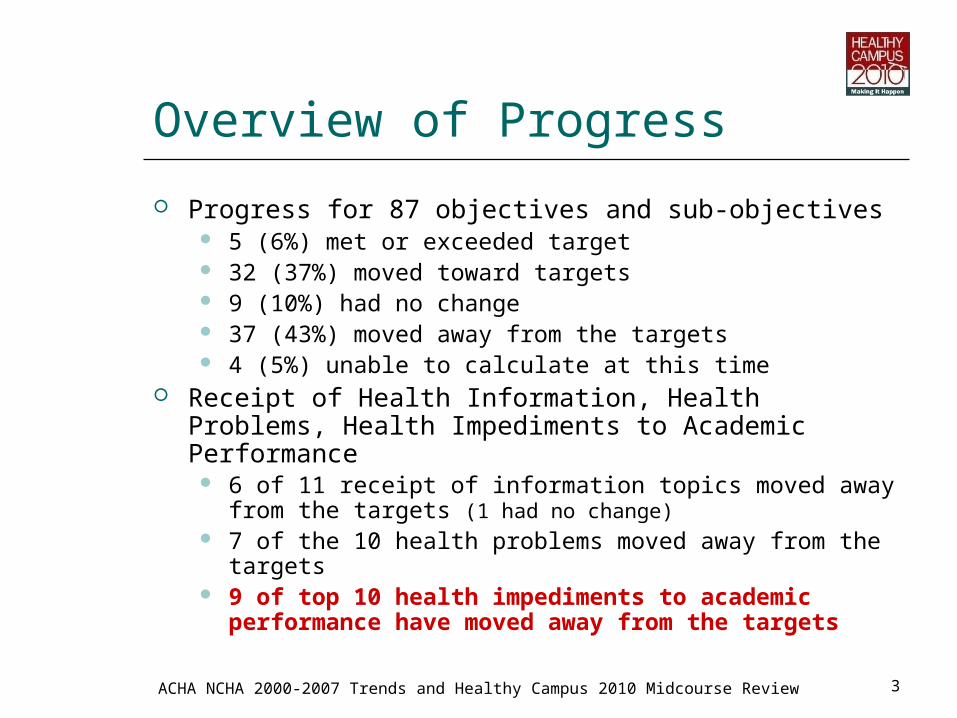
Progress for 87 objectives and sub-objectives 5 (6%) met or exceeded target 32 (37%) moved toward targets 9 (10%) had no change 37 (43%) moved away from the targets 4 (5%) unable to calculate at this time
Receipt of Health Information, Health Problems, Health Impediments to Academic Performance 6 of 11 receipt of information topics moved away from
the targets (1 had no change) 7 of the 10 health problems moved away from the
targets 9 of top 10 health impediments to academic
performance have moved away from the targets

ACHA NCHA 2000-2007 Trends and Healthy Campus 2010 Midcourse Review 4
Healthy People 2010 and Healthy Campus 2010
Focus Areas1. Access to Quality
Health Services (16/6/1)*
2. Arthritis, Osteoporosis & Chronic Back Conditions (11/0/0)
3. Cancer (15/3/2)
4. Chronic Kidney Disease (8/0/0)
5. Diabetes (17/4/3)
6. Disability & Secondary Conditions (13/2/1)
7. Educational & Community-Based Programs (12/5/1)
8. Environmental Health (30/8/0)
9. Family Planning (13/6/5)
10. Food Safety (7/3/0)
11. Health Communication (6/3/0)
12. Heart Disease & Stroke (16/6/2)
13. HIV (17/4/3)
* Healthy People objectives / Healthy Campus objectives / Healthy Campus objectives with baseline data

ACHA NCHA 2000-2007 Trends and Healthy Campus 2010 Midcourse Review 5
Healthy People 2010 and Healthy Campus 2010
Focus Areas14. Immunization &
Infectious Diseases (31/8/1)
15. Injury and Violence Prevention (39/20/13)
16. Maternal, Infant, & Child Health (23/3/0)
17. Medical Product Safety (6/6/0)
18. Mental Health & Mental Disorders (14/6/2)
19. Nutrition & Overweight (18/15/4)
20. Occupational Safety & Health (11/6/0)
21. Oral Health (17/3/1)
22. Physical Activity & Fitness (15/11/3)
23. Public Health Infrastructure (17/11/3)
24. Respiratory Diseases (17/4/1)
25. Sexually Transmitted Diseases (19/9/6)
26. Substance Abuse (25/17/5)
27. Tobacco Use (21/8/1)
28. Vision and Hearing (18/3/0)

ACHA NCHA 2000-2007 Trends and Healthy Campus 2010 Midcourse Review 6
ACHA-NCHA Data Sets
Frequency Percent
Spring 2000 16,024 4.6
Spring 2001 16,813 4.8
Spring 2002 28,258 8.1
Spring 2003 19,497 5.6
Spring 2004 47,202 13.5
Spring 2005 54,111 15.5
Spring 2006 94,806 27.2
Spring 2007 71,860 20.6
Total 348,571 100.0
Data sets by gender and ethnic groups are on the last slides.

Limitations
Cross-sectional data collection Self-selected IHEs
Random representative sampling of students
ACHA member institutions only Sampling method varied
Classroom and online Self-report data for the “past year”
ACHA NCHA 2000-2007 Trends and Healthy Campus 2010 Midcourse Review 7

Goal 1: Quality of Healthy Life
ACHA NCHA 2000-2007 Trends and Healthy Campus 2010 Midcourse Review 8

Goal 1: Quality of Healthy Life
ACHA NCHA 2000-2007 Trends and Healthy Campus 2010 Midcourse Review 9

Excellent, Very Good, Good
Goal 2: Eliminate Health Disparities
ACHA NCHA 2000-2007 Trends and Healthy Campus 2010 Midcourse Review 10

Excellent, Very Good, Good
Goal 2: Eliminate Health Disparities
ACHA NCHA 2000-2007 Trends and Healthy Campus 2010 Midcourse Review 11

ACHA NCHA 2000-2007 Trends and Healthy Campus 2010 Midcourse Review 12
Percent of Targeted Change Achieved
Calculation (most recent value – baseline )/(2010
target - baseline) Met or exceeded target
100% or greater (positive percent) Movement toward target
>0% to 99% of targeted change Moved away from target
Negative percent (i.e., -60%)

Example from Healthy People 2010
Percent of Target Achieved Chart
ACHA NCHA 2000-2007 Trends and Healthy Campus 2010 Midcourse Review 13

ACHA NCHA 2000-2006 Trends and Healthy Campus 2010 Midcourse Review 14
Percent of Targeted Change AchievedReceived Low Grade on exam/project, course, took incomplete/dropped
Top 10 Health Impediments to Academic Performance

ACHA NCHA 2000-2006 Trends and Healthy Campus 2010 Midcourse Review 15
Percent of Targeted Change AchievedTook Incomplete or Dropped Course
Top 10 Health Impediments to Academic Performance

ACHA-NCHA 2000-2007 Trends and Healthy Campus 2010 Midcourse Review 16
University Learning Mission ObjectivesHealth Impediments to Academic Performance
NCHA data: N = ~17,000 to 46,000/yr, HIAP = Health Impediment to Academic Performance
9 away from target: Ave: 19%, Range: 5% - 79% 1 toward target: 8%

ACHA NCHA 2000-2006 Trends and Healthy Campus 2010 Midcourse Review 17
Percent of Targeted Change AchievedTop 10 Physical and Mental Health Problems (q43)

ACHA NCHA 2000-2006 Trends and Healthy Campus 2010 Midcourse Review 18
Top 10 Medical / Mental Health Problems (Q43)
Health Problems in the Last Year 7 away from target 3 toward target
Low grade exam/project, course, took incomplete or dropped course. ACHA-NCHA data: N = ~16,000 to ~95,000/yr

ACHA NCHA 2000-2007 Trends and Healthy Campus 2010 Midcourse Review 19
00-07 Percent of Targeted Change Achieved
Objectives from Focus Areas 1-7

00-07 Percent of Targeted Change Achieved
Sub-Objectives 7-3: Received Information
ACHA NCHA 2000-2007 Trends and Healthy Campus 2010 Midcourse Review 20

00-07 Percent of Targeted Change Achieved
Objectives from Focus Area 9
ACHA NCHA 2000-2007 Trends and Healthy Campus 2010 Midcourse Review 21

00-07 Percent of Targeted Change Achieved
Objectives from Focus Area 12
ACHA NCHA 2000-2007 Trends and Healthy Campus 2010 Midcourse Review 22
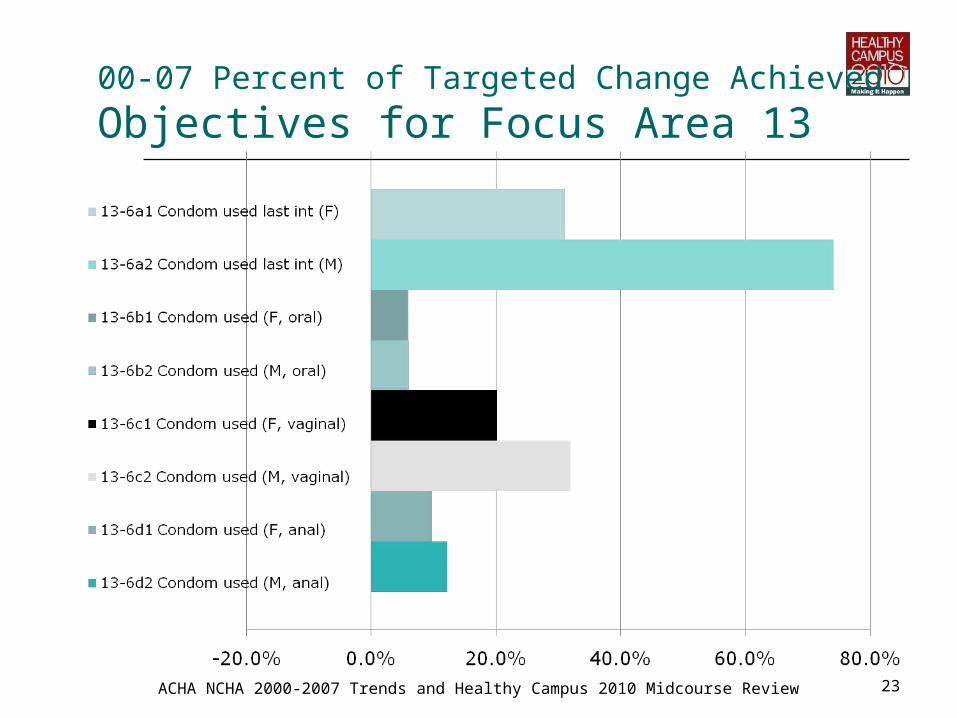
00-07 Percent of Targeted Change Achieved
Objectives for Focus Area 13
ACHA NCHA 2000-2007 Trends and Healthy Campus 2010 Midcourse Review 23

00-07 Percent of Targeted Change Achieved
Objective from Focus Area 14
ACHA NCHA 2000-2007 Trends and Healthy Campus 2010 Midcourse Review 24

ACHA NCHA 2000-2007 Trends and Healthy Campus 2010 Midcourse Review 25
00-07 Percent of Targeted Change Achieved
Objectives from Focus Area 15

ACHA NCHA 2000-2007 Trends and Healthy Campus 2010 Midcourse Review 26
00-07 Percent of Targeted Change Achieved
Objectives from Focus Areas 18

ACHA NCHA 2000-2007 Trends and Healthy Campus 2010 Midcourse Review 27
00-07 Percent of Targeted Change Achieved
Objective from Focus Areas 19

ACHA NCHA 2000-2007 Trends and Healthy Campus 2010 Midcourse Review 28
00-07 Percent of Targeted Change Achieved
Objectives from Focus Areas 21

ACHA NCHA 2000-2007 Trends and Healthy Campus 2010 Midcourse Review 29
00-07 Percent of Targeted Change Achieved
Objectives from Focus Area 22

ACHA NCHA 2000-2007 Trends and Healthy Campus 2010 Midcourse Review 30
00-07 Percent of Targeted Change Achieved
Objectives from Focus Areas 24
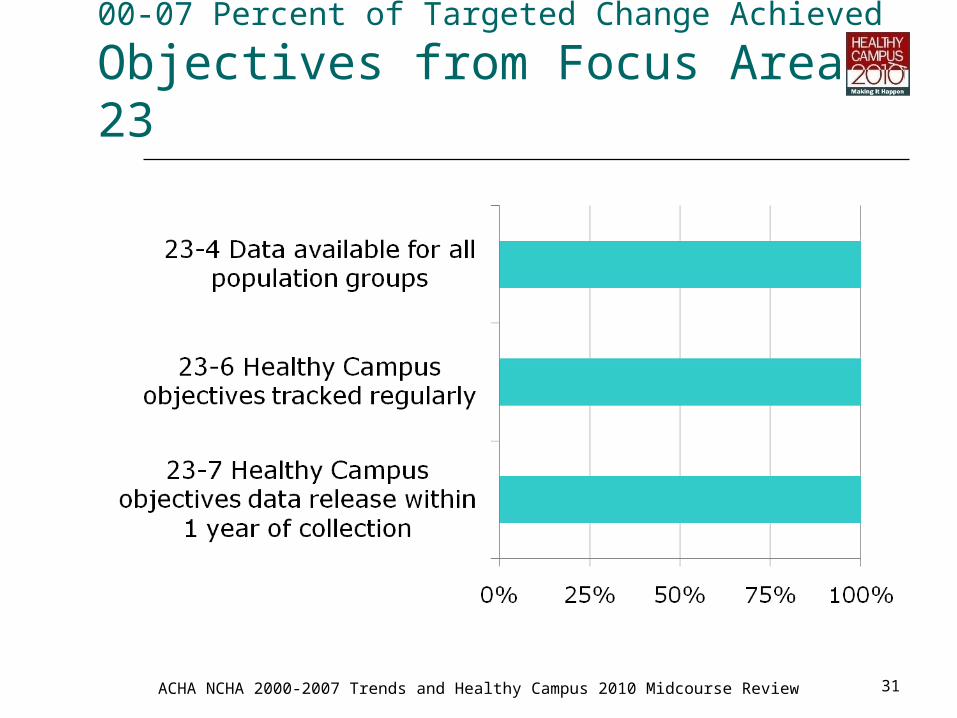
00-07 Percent of Targeted Change Achieved
Objectives from Focus Area 23
ACHA NCHA 2000-2007 Trends and Healthy Campus 2010 Midcourse Review 31
ACHA NCHA 2000-2007 Trends and Healthy Campus 2010 Midcourse Review 32
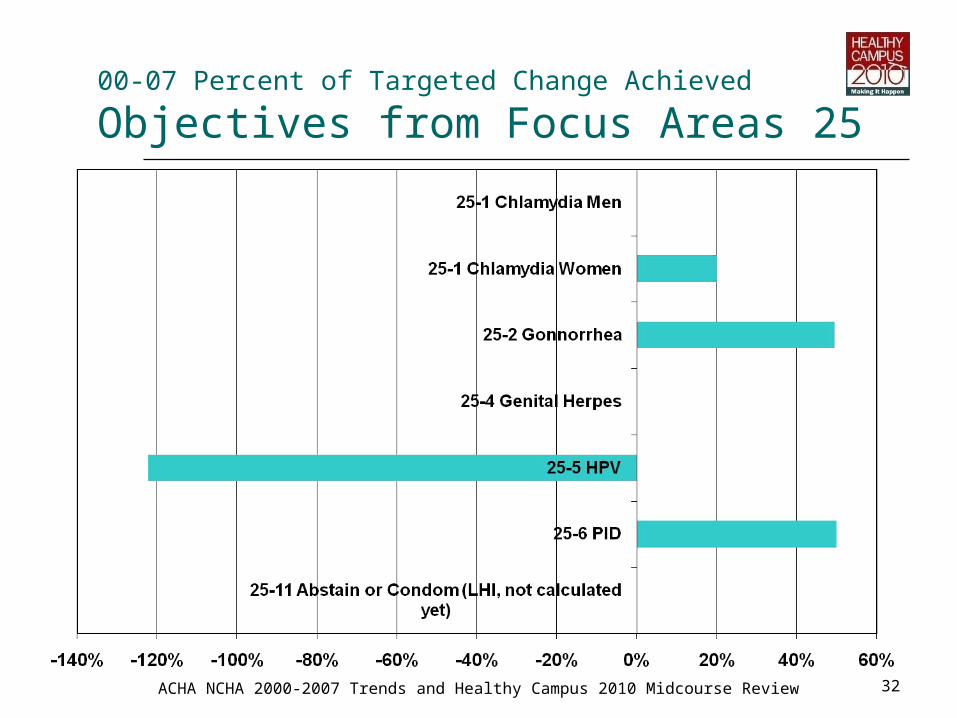
00-07 Percent of Targeted Change Achieved
Objectives from Focus Areas 25
ACHA NCHA 2000-2007 Trends and Healthy Campus 2010 Midcourse Review 33
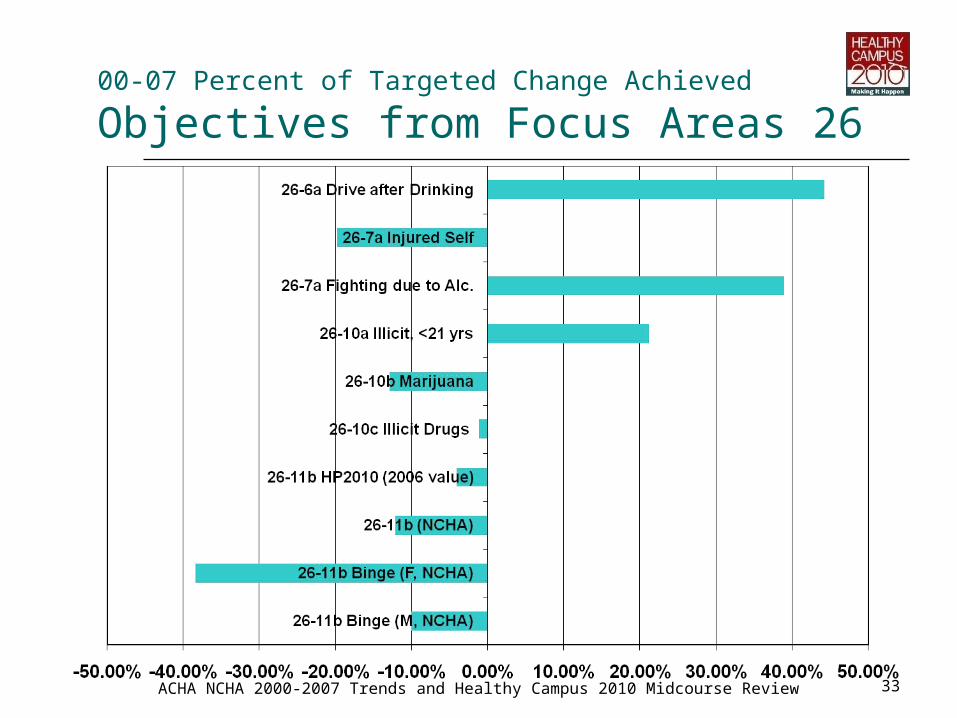
00-07 Percent of Targeted Change Achieved
Objectives from Focus Areas 26

ACHA NCHA 2000-2007 Trends and Healthy Campus 2010 Midcourse Review 34
Johnston, L. D., O’Malley, P. M., Bachman, J. G., & Schulenberg, J. E. (2008). Monitoring the Future national survey results on drug use, 1975–2007: Volume II, College students and adults ages 19–45 (NIH Publication No. 08-6418B). Bethesda, MD: National Institute on Drug Abuse. Accessed on Feb, 18, 2007 at http://www.monitoringthefuture.org/pubs.html, http://www.monitoringthefuture.org/pubs/monographs/vol2_2007.pdf

ACHA NCHA 2000-2007 Trends and Healthy Campus 2010 Midcourse Review 35
ACHA NCHA 2000-2007 Trends and Healthy Campus 2010 Midcourse Review 36
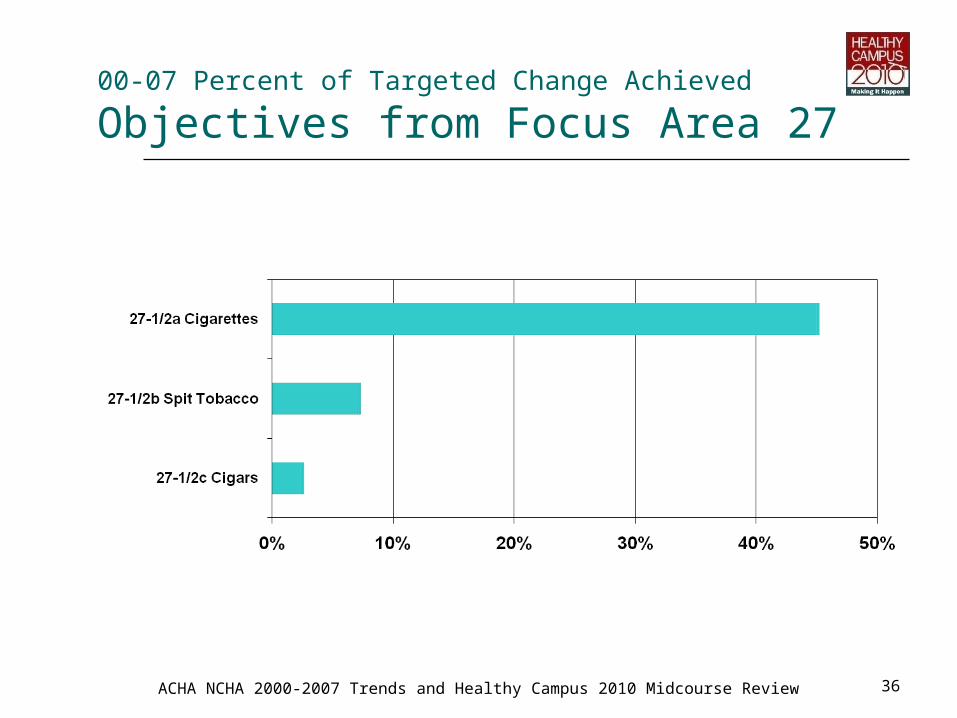
00-07 Percent of Targeted Change Achieved
Objectives from Focus Area 27
ACHA NCHA 2000-2007 Trends and Healthy Campus 2010 Midcourse Review 37
Ideas for Healthy Campus 2020 Recommendations
Delete or revise objectives that require Merging of variable responses Multiple crosstab layers Keep data simple and easy to use by anyone
Select priority health issues from: Top 10 health impediments to academic
performance (q44) Related to academic mission of universities
Top 10 medical/mental health problems (q43) Support mission of clinics while helping reorient
health services toward health promotion and disease prevention

ACHA NCHA 2000-2007 Trends and Healthy Campus 2010 Midcourse Review 38
Ideas for Healthy Campus 2020 Recommendations
Use NCHA data for binge drinking objective 26-11b Instead of Healthy People 2010 Monitoring the
Future data source Use: Women: 4+ drinks, Men: 5+ drinks
Edit HC2010 Appendix D to use terms used in SPSS Transform > recode into different variable Analyze > Descriptive Statistics
> Frequencies > Crosstab

ACHA NCHA 2000-2007 Trends and Healthy Campus 2010 Midcourse Review 39
Ideas for Healthy Campus 2020 Recommendations
Implement a campaign to influence behavior of campus decision makers to:
Focus on 1 to 3 of ~10 priority health objectives committee recommends
Use evidence-based, evidence-informed and theory-based interventions
Provide evidence- and theory-based intervention recommendations Include ACHA Tools
ACHA-NCHA, Healthy Campus 2020, Standards of Practice for Health Promotion in Higher Education, Vision Into Action, Hiring Guidelines for Health Promotion Professionals in Higher Education
CDC Guides to Clinical and Community Preventive Services
http://wonder.cdc.gov/wonder/prevguid/p0000109/p0000109.asp
www.thecommunityguide.org/

Contact Information
Jim Grizzell, MBA, MA, CHES, ACSM-HFS [email protected], [email protected] (909) 856-3350
ACHA NCHA 2000-2007 Trends and Healthy Campus 2010 Midcourse Review 40

Data by Gender
ACHA-NCHA 2000-2007 Trends and Healthy Campus 2010 Midcourse Review 41

Data by Ethnic Groups
ACHA NCHA 2000-2007 Trends and Healthy Campus 2010 Midcourse Review 42

Data by Ethnic Groups
ACHA NCHA 2000-2007 Trends and Healthy Campus 2010 Midcourse Review 43

Data by Ethnic Groups
ACHA NCHA 2000-2007 Trends and Healthy Campus 2010 Midcourse Review 44