
HealthCarePlanningAccountabilityAdvisoryCouncillReportToGeneralAssembly
214
1 HEALTH CARE PLANNING &ACCOUNTABILITY ADVISORY COUNCIL May 7, 2013 Honorable Gordon D. Fox Speaker, Rhode Island House of Representatives Honorable M. Teresa Paiva Weed President, Rhode Island State Senate 82 Smith Street Providence, RI 02903 Dear Mr. Speaker and Madame President: This will serve as a letter of transmittal and summary of analysis and recommendations for the reports requested of the Health Care Planning and Accountability Advisory Council in 2012 Senate Bill: S 2180 B and House Bill: H 7283 A. The Health Care Planning & Accountability Advisory Council is pleased to present the General Assembly with the attached progress report and appendices. This report responds to the Legislature’s charge for the Council’s work this year: an analysis of Rhode Island’s inpatient hospital service market and a review of the Certificate of Need (CON) and Hospital Conversion Act (HCA) programs. To construct its assessment of hospital inpatient services, the Council incorporated independent analyses from two consulting groups, The Lewin Group and The Graham Center. These reports focused on hospital inpatient care and primary care, respectively, and are attached in full as appendices. These gap analyses articulate the state’s current and future capacity and demand for the services. Since the effectiveness of a state’s primary care infrastructure influences its need for inpatient hospital services, the reports also quantify how inpatient bed need might fall as the state’s primary care system strengthens.
Transcript of HealthCarePlanningAccountabilityAdvisoryCouncillReportToGeneralAssembly

1
HEALTH CARE PLANNING & ACCOUNTABILITY ADVISORY COUNCIL
May 7, 2013 Honorable Gordon D. Fox Speaker, Rhode Island House of Representatives Honorable M. Teresa Paiva Weed President, Rhode Island State Senate 82 Smith Street Providence, RI 02903 Dear Mr. Speaker and Madame President:
This will serve as a letter of transmittal and summary of analysis and recommendations
for the reports requested of the Health Care Planning and Accountability Advisory Council in
2012 Senate Bill: S 2180 B and House Bill: H 7283 A.
The Health Care Planning & Accountability Advisory Council is pleased to present the
General Assembly with the attached progress report and appendices. This report responds to
the Legislature’s charge for the Council’s work this year: an analysis of Rhode Island’s
inpatient hospital service market and a review of the Certificate of Need (CON) and Hospital
Conversion Act (HCA) programs.
To construct its assessment of hospital inpatient services, the Council incorporated
independent analyses from two consulting groups, The Lewin Group and The Graham
Center. These reports focused on hospital inpatient care and primary care, respectively, and
are attached in full as appendices. These gap analyses articulate the state’s current and future
capacity and demand for the services. Since the effectiveness of a state’s primary care
infrastructure influences its need for inpatient hospital services, the reports also quantify how
inpatient bed need might fall as the state’s primary care system strengthens.

2
Finally, the Council thoroughly reviewed the CON and HCA programs and
recommends improvements for each. These recommendations improve the efficiency,
effectiveness and transparency of CON and HCA and tie the programs more closely to their
founding principles.
The Council formally approved the report in April and member voting records are
listed in an attachment to this letter. In the coming years, we look forward to using the
Council’s expertise to add further analysis, data, and recommendations on Rhode Island’s
health care system to its body of work.
Sincerely,
Christopher Koller, Health Insurance Commissioner, Rhode Island Office of the Health Insurance Commissioner

3
HEALTH CARE PLANNING & ACCOUNTABILITY ADVISORY COUNCIL
ATTACHMENT: MEMBERSHIP VOTING RECORD
Approve Peter Andruskiewicz, President and CEO, Blue Cross and Blue Shield of Rhode Island Kenneth H. Belcher, President and CEO, CharterCARE Health Partners Albert Charbonneau, consumer Steven Costantino, Secretary of Health and Human Services, State of Rhode Island Michael Fine, MD, Director of the Dept. of Health Marie Ganim, PhD, Director of Policy, Office of the President of the Senate Jane Hayward, President and CEO, Rhode Island Health Center Association Dennis D. Keefe, President and CEO, Care New England Eve Keenan, RN, Ed.D., Chair of the Board, South County Hospital Dale K. Klatzker, PhD, President and CEO, The Providence Center Christopher Koller, Health Insurance Commissioner, Rhode Island Office of the Health Insurance Commissioner Edward Quinlan, President, Hospital Association of Rhode Island Terrie Fox Wetle, PhD, Associate Dean of Medicine for Public Health and Public Policy, Brown University Abstain Alyn Adrain MD, President, Rhode Island Medical Society Timothy Babineau, MD, CEO Lifespan Hospital Corporation Jodi Bourque, Esq., Assistant Attorney General, State of Rhode Island

4
Rhode Island Executive Office of Health and Human Services
Department of Health
Office of the Health Insurance Commissioner
Health Care Planning &
Accountability Advisory Council
Report to the General Assembly
APRIL 2013
STEVEN COSTANTINO, SECRETARY, OFFICE OF HEALTH & HUMAN SERVICES
CHRISTOPHER KOLLER, HEALTH INSURANCE COMMISSIONER

5
HEALTH CARE PLANNING REPORT
Table of Contents
Introduction, Purpose, Legislative Charge, Work of the Council and Structure of Report ..................................... 1
Executive Summary ................................................................................................................................................................ 3
Inpatient Hospital Service Needs Assessment ................................................................................................................. 7
Research Question, Issue Background, Methodology ............................................................................................... 7
Findings ............................................................................................................................................................................... 8
Effect of Primary Care Workforce, Architecture and Organization on Inpatient Needs ......................................... 25
Findings ................................................................................................................................................................................ 26
Certificate of Need ................................................................................................................................................................. 30
Recommendations ............................................................................................................................................................. 33
Hospital Conversions Act .................................................................................................................................................... 34
Issue Background, Description Of Issue, Review Process ........................................................................................ 34
Findings ............................................................................................................................................................................... 35
Recommendations ............................................................................................................................................................. 36
Appendices:
A. Health Care Planning & Accountability Advisory Council Membership Roster ............................................... 39
B. Summarized Findings and Recommendations ........................................................................................................... 40
C. The Lewin Group Final Report .............................................................................................................................. ….43
D. The Graham Center Interim Report ......................................................................................................................... 137

1
Purpose o f this Report
On June 19, 2012 the Rhode Island General Assembly enacted Public Law 12-259 (House Bill 7283 Sub A)1 that amended the powers and duties of the Health Care Planning and Accountability Advisory Council (“the Council”). The relevant amendment reads:
This annual report shall….recommend to the governor and general assembly legislative or regulatory revisions necessary to achieve the long-term goals and values adopted by the council as part of its strategic recommendations, and assess the powers needed by the council or governmental entities of the state deemed necessary and appropriate to carry out the responsibilities of the council. The initial priority of the council shall be an assessment of the needs of the state with regard to hospital services and to present recommendations, if any, for modifications to the Hospital Conversions Act and the Certificate of Need Program to execute the strategic recommendations of the council. The council shall provide an initial report and recommendations to the governor and general assembly on or before March 1, 2013.2
The purpose of this report is to comply with the above-referenced provisions of the Rhode Island General Laws, as amended. The General Assembly appropriated $150,000 for the development of a state health plan to guide CON decision-making. This appropriation became part of the Executive Office of Health and Human Services’ (EOHHS’) base budget allocation in FY2013. Work of the Counci l
Under the co-chairmanship of Secretary Steven Costantino and Commissioner Christopher Koller and with the leadership and participation of Director Michael Fine, MD, the Council was appointed in the summer of 2012 and convened in the fall. To help the Council meet its obligations, the EOHHS and the Office of the Health Insurance Commissioner (OHIC) issued a request for proposals (RFP)3 in December 2011 for vendor(s) to complete analytical reports, one related to hospital inpatient capacity and the other related to the primary care landscape in Rhode Island. In the summer of 2012, two awards were made (for FY 2012 and 2013) as follows: The Robert Graham Center4 (for a primary care study) and The Lewin Group (for a hospital inpatient capacity/bed need analysis). This first section of this report draws heavily from the work of these two organizations. The Council has met regularly from July 2012 onward. Its work has consisted of reviewing and assessing the work of the two vendors and preparing this report. Ad hoc subgroups were convened to accomplish specific tasks. All meetings were convened as public meetings with public comment taken. For minutes, materials and more
1 See: Section 3 of Public Law 12-‐259 that amends section 23-‐81-‐4 (h)(4) of the Rhode Island General Laws, as amended. Available online at: http://webserver.rilin.state.ri.us/PublicLaws/law12/law12259.htm 2 Ibid at page 15. 3 RFP #7449315 was posted on December 13, 2011 by the RI Division of Purchases, Department of Administration. 4 The Robert Graham Center is the free-‐standing policy division of the American Academy of Family Physicians.

2
information on these and other Council activities, please see the Council’s website: http://www.health.ri.gov/partners/advisorycouncils/healthcareplanningandaccountability/index.php The recommendations, findings and report as a whole were each adopted by a majority vote of those Council members in attendance. The consultants’ reports are adopted as appendices, however the Council makes no findings or representations regarding analyses presented in the reports, other than those cited as findings by the Council. Attendance records, and individual votes on each finding and recommendation are available in the minutes of the Council.

3
Structure o f this Report
After an executive summary, this report is divided into three sections that correspond to the legislative charge: findings on the supply and demand for inpatient services in Rhode Island, background and recommendations on Certificate of Need Program, and findings and recommendations on the Hospital Conversions Act. Findings and recommendations are based on evidence presented to the Council. A brief discussion follows each finding or recommendation. Appendices to the report include the consultants’ reports used as the basis for the Council’s work. Execut ive Summary Hospitals occupy unique roles in local economies. They are highly valued and highly illiquid community assets – great sources of local pride and identity that are not easily disassembled. They are providers of socially valued services – medical care that can cure disease and save or extend lives. They are expensive, consuming about a third5 of our rapidly expanding costs of medical care. They are educators of future clinicians. Finally, they are economic engines for local and state economies. According to the Hospital Association of Rhode Island, Rhode Island’s hospitals add $6.7b to the state’s economy, including $3.8b in payroll and $2.6b in supply purchases.6
Allocating – determining what, how much and where – such a highly valued and complex asset as inpatient hospital care becomes challenging public policy. Should these decisions be left to market forces, which are traditionally seen as efficient but not always equitable, or public forces, which may favor public interest over efficiency?
Rhode Island’s public policies towards allocating hospital resources reflect this mixed approach. While all RI hospitals, with the exception of one public mental health institution, are private organizations that manage and negotiate their own finances, they are subject to extensive public oversight. For example, hospitals must obtain state approval for major capital projects, changes in ownership and changes in services, publicly report their financial and clinical performance, and are subject to requirements on providing and reporting care to the uninsured.
The Council’s Charge The Legislature has asked the Council to inform current and future public policies towards inpatient care by generating evidence-based, consensus driven findings on the future supply and demand for inpatient care, and to comment on two important tools for allocating these resources: Certificate of Need (CON) and the Hospital Conversions Act (HCA). Because the demand for inpatient services is heavily influenced by which assumptions are used, the Council’s consultants considered many different scenarios. Members of the Council also noted that the structure of the community-based care system – particularly the primary care system – greatly influences demand for inpatient services. To that end, the consultants analyzed the impacts of changes in primary care supply and organization on future inpatient hospital demand projections. Since their inception, CON and HCA have undergone regular review and revision, as recently as the last legislative session for HCA. In its review of these laws, the Council did not start with a blank slate, but considered revisions to the current version of each law.
The Council was directed to make findings regarding inpatient capacity and recommendations regarding HCA and CON. That distinction is significant and the report follows those instructions. The summary of those findings and
5 National Health Expenditures, Table 2, 2011 (http://www.cms.gov/Research-Statistics-Data-and-Systems/Statistics-Trends-and-Reports/NationalHealthExpendData/Downloads/tables.pdf) 6 Hospital Association of Rhode Island, “Hospitals Provide $6.7 Billion Boost to Local Economy”, February 12, 2013 http://www.hari.org/App_Themes/Members/Docs/Publications/press/13_economicimpact.pdf

4
recommendations follows. The reader is directed to the report itself for a discussion of these findings and recommendations, and to the appendices for the analyses that generated them.
Inpatient Hospital Gap Analysis: Findings
1. In Rhode Island, falling inpatient utilization combined with steady-to-rising bed supply has led to declining occupancy rates and potentially excess supply of beds.
2. When forecasting the demand for inpatient beds in the state, the Council’s consultant considered the following factors relevant: population changes, evolving patterns of inpatient utilization, primary care infrastructure, and target occupancy rate. In addition, Council members noted the impact of the economy and population health status on demand.
3. Using a model that takes the factors from Finding 2 into consideration, the projected number of inpatient staffed hospital beds needed in 2017 ranges from a shortage of 64 over current levels to a surplus of 338, depending on the combination of assumptions. The most likely set of assumptions models an excess of approximately 200 staffed beds.
4. The estimates of current hospital inpatient export (RI residents seeking care out of state) and import (non RI residents seeking care in state) patterns are as follows.
a. Exports: The number of Rhode Island residents discharged from Massachusetts and Connecticut hospitals represents 5.7% of all RI hospital discharges and grew by 248 discharges per year between 2010 and 2011. Since 1997, exports per year have increased by 26%.
b. Imports: The number of discharges from RI hospitals for out of state residents is about 8% of all RI hospital discharges. While these imports have grown by 756 discharges per year since 1997 (8.3% increase), they have fallen by 646 discharges per year from their relative peak in 2008, or 5% annually between 2008 and 2011.
c. Net Migration: Overall, more patients from other states come to Rhode Island for hospital care than Rhode Islanders go to other states for care. However, the gap is narrowing.
5. The savings associated with eliminating excess inpatient capacity in the most likely scenario range from about
$12m, when only incremental costs are considered, to more than $100m when all hospital costs are eliminated.
6. This report makes no formal findings on ways to identify and address the types of excess inpatient capacity but does discuss potential options.
7. For certain procedures, there are generally-accepted volume thresholds below which quality is likely to be compromised. For some procedures, some Rhode Island hospitals do not meet these thresholds.
8. Many Rhode Islanders are willing to travel for their hospital care. The extent to which they travel varies by community and by service.
9. Inpatient services are only half of a hospital’s operating revenue; the rest comes from outpatient services. Additional study is needed to understand the array of outpatient services that various hospitals provide, how hospital-based outpatient services relate to other outpatient services available in the communities they serve, and past and future trends in these areas.

5
10. Primary care physician (PCP) supply is higher in Rhode Island than in many other states, with 80 PCPs per 100,000 residents, which is the 8th highest ratio in the nation. However, the optimal rate is unknown.
11. Research indicates that the workforce, architecture, and organization of primary care physicians can greatly influence the demand for other medical services, including inpatient hospital services.
12. In Rhode Island, the potential reduction in hospitalizations (and thus on bed need) from a more integrated primary care delivery system alone may range from 6.2% to 43.9% for a very mature, integrated delivery system.
Certificate of Need (CON): Recommendations
1. CON thresholds for physician /podiatry ambulatory surgery centers shall be a facility in excess of two (2) operating rooms.
2. Conditions of approval shall be relevant to the specific CON.
3. “Affordability” for a CON shall consider the impact on the per person per year cost of health care in Rhode Island and shall include a comprehensive cost impact analysis as defined in R.I. G.L. 23-15-2(2).
4. Provide statutory authority for the Director of Health to fine applicants for non-compliance with CON conditions of approval.
5. Evaluative standards shall be developed by the Department of Health by regulation.
Hospital Conversions Act (HCA): Recommendations
1. Add to § 23-17.14-8(9), § 23-17.14-11(8): Whether the conversion is consistent with a state health plan or community health needs assessment officially adopted by the Department of Health.
2. Apply the Administrative Procedures Act Standard to both the Departments of Health and Attorney
General’s Office. The resulting language for this section would then read: Any transacting party aggrieved by a final order of the department of health or the attorney general under this chapter may seek judicial review in the superior court in accordance with section 42-35-15.
3. In § 23-17.14-3 of the Hospital Conversions Act, add: Assure the viability of a safe, accessible and
affordable healthcare system that is available to all of the citizens of the state with an emphasis on population health improvement as the overriding objective.
4. Expedited review should be limited to in-state non-profit hospitals as the acquiring transacting party.
5. Eliminate the requirement that in-state non-profit hospital or hospital systems be financially distressed to
qualify for expedited review. However, if the transacting parties do not qualify as financially distressed, the review timeframe contained in R.I. G.L. 23-17.14-12.1(e) shall be 120 days.

6
In summary, in five years the most likely estimates are that Rhode Island will have the equivalent of a full hospital in excess capacity – perhaps more if its primary care structure is reorganized. This excess capacity will impose costs on the state’s health care system. These opportunities for substantial savings may not be realized if excess capacity is either left untended or addressed in a piecemeal fashion. This report recommends adjustments to the public tools that were designed to address excess capacity and protect charitable assets (Certificate of Need and the Hospital Conversions Act). These recommendations are most powerful in the context of strong public and private sector leadership and a vision or plan for Rhode Island’s future health care system.

7
Inpatient Hospital Services
Statutory Charge and Research focus: “…an assessment of the needs of the state with regard to hospital services” in Rhode Island, per Rhode Island General Assembly enacted Public Law 12-259 (House Bill 7283 Sub A) Background: To support the Council’s commitment to data-driven health service planning, the State contracted with The Lewin Group to conduct a gap analysis on Rhode Island’s inpatient hospital capacity, utilization, and distribution of services. Lewin estimated future bed shortages or surplus by comparing current inpatient capacity at the state, community and service area levels to various scenarios of projected future demand. They supplemented these estimates with multiple stakeholder interviews. The authors then calculated costs associated with surplus inpatient supply, if surpluses existed. Although inpatient services represent only about half of a typical hospital’s business activity7, the Council chose to focus on them, and not consider hospital outpatient services, for several reasons: inpatient services are the core of a hospital’s identify and business; by their very nature they cannot be provided in other settings; and they are more easily measured and analyzed, given the limited resources assigned to the Council. The findings and discussion below reflect the Council’s study of inpatient hospital capacity and future demand, as informed by Lewin’s analysis, a primary care analysis completed by The Graham Center, previous staff presentations, and Council deliberations. The full Lewin Group analysis is attached as Appendix. C. This section will summarize that report. The following section will look at the effects of primary care supply and organization on the demand for inpatient services. Appendix D includes the full primary care report from The Graham Center.
7 American Hospital Association (AHA) Hospital Statistics, 2012
8
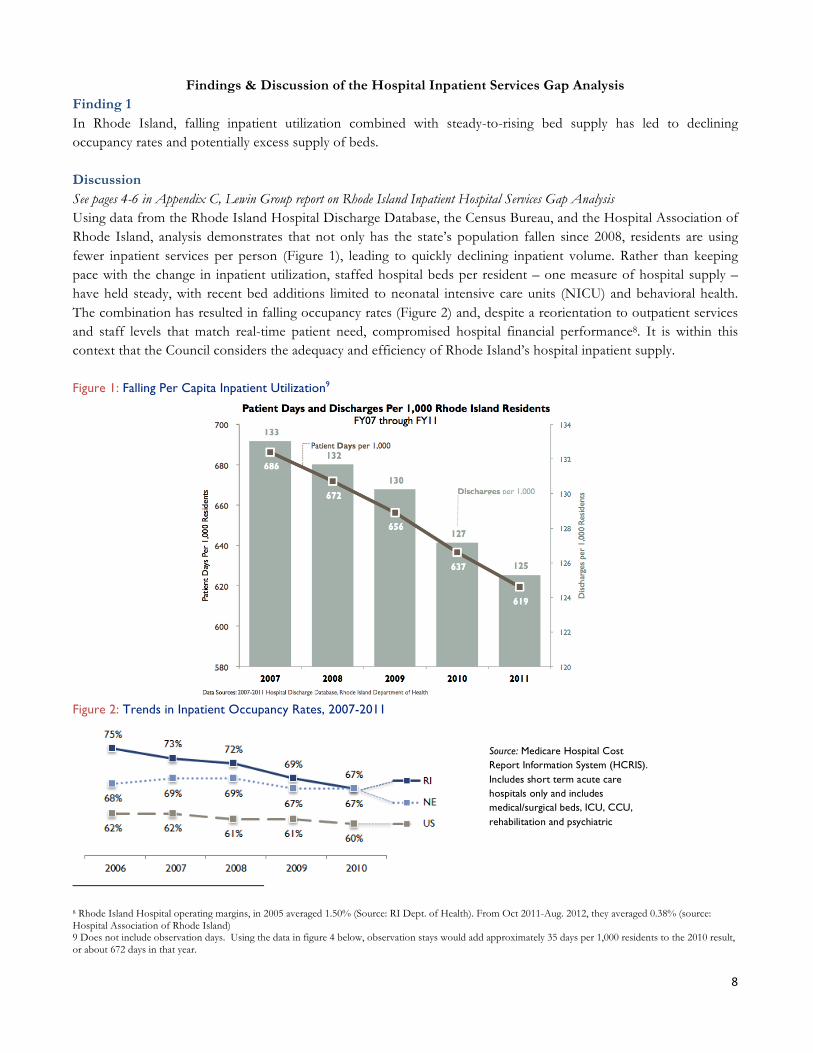
Findings & Discussion of the Hospital Inpatient Services Gap Analysis Finding 1 In Rhode Island, falling inpatient utilization combined with steady-to-rising bed supply has led to declining occupancy rates and potentially excess supply of beds.
Discussion See pages 4-6 in Appendix C, Lewin Group report on Rhode Island Inpatient Hospital Services Gap Analysis Using data from the Rhode Island Hospital Discharge Database, the Census Bureau, and the Hospital Association of Rhode Island, analysis demonstrates that not only has the state’s population fallen since 2008, residents are using fewer inpatient services per person (Figure 1), leading to quickly declining inpatient volume. Rather than keeping pace with the change in inpatient utilization, staffed hospital beds per resident – one measure of hospital supply – have held steady, with recent bed additions limited to neonatal intensive care units (NICU) and behavioral health. The combination has resulted in falling occupancy rates (Figure 2) and, despite a reorientation to outpatient services and staff levels that match real-time patient need, compromised hospital financial performance8. It is within this context that the Council considers the adequacy and efficiency of Rhode Island’s hospital inpatient supply. Figure 1: Falling Per Capita Inpatient Utilization9
Figure 2: Trends in Inpatient Occupancy Rates, 2007-2011
8 Rhode Island Hospital operating margins, in 2005 averaged 1.50% (Source: RI Dept. of Health). From Oct 2011-Aug. 2012, they averaged 0.38% (source: Hospital Association of Rhode Island) 9 Does not include observation days. Using the data in figure 4 below, observation stays would add approximately 35 days per 1,000 residents to the 2010 result, or about 672 days in that year.
Source: Medicare Hospital Cost Report Information System (HCRIS). Includes short term acute care hospitals only and includes medical/surgical beds, ICU, CCU, rehabilitation and psychiatric

9
Finding 2 When forecasting the demand for inpatient beds in the state, the Council’s consultant considered the following factors relevant: (A) population changes, (B) evolving patterns of inpatient utilization, (C) primary care infrastructure, and (D) target occupancy rate. In addition, Council members noted the impact of the economy and population health status on demand.
Discussion See pages 7-19 in Appendix C, Lewin Group report on Rhode Island Inpatient Hospital Services Gap Analysis
The Council’s consultants developed a dynamic hospital bed need model with assumptions that tailor it to Rhode Island’s market characteristics. In particular, the analysis shows that the four factors identified above capture the trends in the state that drive projected inpatient demand (see Figure 3 below). These factors affect demand for each type of bed differently. Figure 4 shows the cumulative effect of the major assumptions by bed type, which range from a 20.1% decrease (pediatric psych) to a 42% increase (observation).
Figure 3: Incremental Impact of Major Model Assumptions Scenario Set A10 from Finding 3 below, Low-Range Assumptions (202 Surplus Beds)
Estimated Patient Days
Incremental Change from Baseline (2010)
Baseline 2010 679,794
Projected Need in 2017 (A) Population Change (Decline Assumption) Net effect of declining and aging population is higher need
691,598 1.7%
(B) Impact of Reduced Readmits (25% reduction) 683,256 -4.8%
(B) High Inpatient to Outpatient Shift Rate 628,266 -8.0%
(C) Impact of Enhanced Primary Care Varies -6.2% to -43.9%
(D) Higher Target Occupancy Rate (78% vs 74%) N/A -38%
Impact of ACA 707,766 2.3%
Impact of Obesity (low prevalence rate increase) 717,822 1.4%
Current Observation & Import Patient Trend 630,380 0.3%
Current Export Patients Retained in RI 627,677 -0.4%
Cumulative Effect at 78% occupancy and existing primary care level
-7.7% Before Effect of Enhanced Primary Care
Figure 4: Net Change in Projected Inpatient Need (Days, 2017) by Type of Bed Scenario Set A from Finding 3 below, Low-Range Assumptions (202 Surplus Beds) Med/Surg Obstetrics Pediatrics
Pediatric Psych
Adult Psych
ICU Observation Total
Baseline 2010 388,925 38,624 16,239 25,546 93,070 82,281 35,109 679,794 Net Change 2017
-10.5% -12.2% -12.1% -20.1% -8.1% -8.0% 42.0% -7.7%
10 Different scenarios will be reviewed in the next section. The purpose of this table is to illustrate effects of key demand drivers.

10
Discussion of Major Model Assumptions (A) Population changes Future projections of population growth or decline form the foundation of estimated future hospital need. The model’s two population scenarios – one assumes growth and the other assumes decline – highlight the variability in Rhode Island’s size over the past decade. Using 2000 Census data, the US Census Bureau projected the state’s population to grow steadily through 2030. Actual data from the past decade show the opposite: Rhode Island’s population has fallen. Both scenarios project a rapidly aging population and the need of residents over 65 years old overwhelms the loss in demand due to a falling population. Thus, the net effect on projected hospital bed need in both the “population growth” and “population decline” scenarios is positive (5.1% and 1.7%). (B) Evolving patterns of inpatient utilization Though the state’s likely demographic changes alone imply higher demand for hospital services, technological advances and new payment incentives will shrink the role of inpatient services in our health care system by an even greater percentage. The impacts of payment reform would accelerate if coordinated across all payers. Hospitals in Rhode Island and across the nation are shifting lower-complexity procedures from inpatient to outpatient care, a change enabled by technological breakthroughs and the proliferation of specialized outpatient service locations. Data show that hospitals are seeing an increase in observation stays. Hospitals report that these stays require the same resources as inpatient stays. (Figure 4) Inpatient care will increasingly be reserved for fewer, sicker patients and the overall need for inpatient beds is expected to fall by 8.0% because of these changes. In addition, a renewed focus on value-based payment encourages fewer readmissions and other events that add only volume, and not quality, to our system of care. Specifically, Medicare penalizes hospitals that do not meet certain readmission standards and will not pay for a same-cause readmissions within thirty days of the original discharge, resulting in an estimated net reduction in projected inpatient hospital bed need of 4.8% in the “low” scenario presented above. (C) Primary care infrastructure The consultants’ analysis found that a state’s primary care infrastructure may have a meaningful effect on the demand for inpatient hospital services. Rhode Island, in particular, may benefit from enhanced primary care supply and an improved primary care delivery system because of its relatively high social deprivation index (see pages 9-18 in Appendix D), which is correlated with higher use of inpatient hospital services. Patient-centered, highly-coordinated entities keep patients healthier and prevent unnecessary admissions and readmissions. The three increasingly integrated models reviewed (see findings 10, 11 and 12, below) estimate a reduction in hospital demand between 6.2% and 43.9%. (D) Target occupancy rate On top of these systemic considerations, Rhode Island’s optimal future hospital bed need depends on the target occupancy rate, the portion of staffed beds hospitals should fill in order to both be financially stable and meet potential patient census surges. As opposed to the demand factors described above, target occupancy rates can be thought of as a supply constraint. In 2010, Rhode Island’s average occupancy rate across its hospitals was 67% for medical/surgery beds and 72% each for ICU, psychiatric and rehabilitation beds. Though falling, these rates were still 5 to 8 percentage points higher than national occupancy rates. An ideal occupancy rate is generally between 70 and 85% of total staffed beds, and the review of the health services literature, discussed in more detail in Appendix A, presents a more focused range. According to the consultant’s analysis, 74-78% of staffed beds should be filled at any given time for a 150-bed hospital – the median sized hospital in Rhode Island – to meet both financial demands and patient census surge needs. Larger hospitals can meet unexpected surge demand with a higher occupancy targets while smaller hospitals generally need more beds available.

11
Other Factors In addition to these factors, other factors can affect inpatient utilization. A sicker population will incur more hospital stays. Although population health status can vary by community and state, in general it does not change systematically in a short period of time. However, Lewin’s model does take into account the effect of a population health driver which is having a moderate impact in the period of time studied – obesity. The increasing proportion of the population identified as obese is predicted to increase demand for health services, including inpatient hospital care. The second additional factor noted by the Council is overall strength of the economy – there is a general consensus that a stronger economy will induce more demand for elective inpatient procedures. The size of this induced demand is very much a subject of debate. The Lewin model does not include economic conditions as a variable in estimating inpatient hospital demand. The model thus assumes that the prevailing conditions – both economic growth and contraction -- during the study period will continue.

12
Finding 3 Using a model that takes the factors from Finding 2 into consideration, the projected number of inpatient staffed hospital beds needed in 2017 ranges from a shortage of 64 over current levels to a surplus of 338, depending on the combination of assumptions. The most likely set of assumptions models an excess of approximately 200 staffed beds. Discussion See page 7 in Appendix C, Lewin Group report on Rhode Island Inpatient Hospital Services Gap Analysis As the table below demonstrates, the range of bed need projections is wide and sensitive to underlying assumptions. However, almost all combinations of assumptions project that Rhode Island will have surplus beds in 2017. Surpluses are particularly likely if the population continues to decline, as it has every year since 2008, and if inpatient use per resident continues to fall, as it has since 2007. Further detail on scenario assumptions is provided on the following page. Figure 5: (Shortage)/Surplus Staffed Beds for Select Scenarios
Target Occupancy Rate
Projected Bed Need (Demand)
Statewide (Shortage) / Surplus of Staffed Beds
Scenario Set A: Bed Demand Projection Based on Assumption Driven Trends 1/
Low-Range Assumptions 78% (70% Obstetrics) 2,218 202
High-Range Assumptions 78% (70% Obstetrics) 2,484 (64)
Scenario Set B: Bed Demand Projection Based on Recent Observed Trends in Usage and Length of Stay, High Occupancy Target
Low-Range Assumptions 78% (70% Obstetrics) 2,082 338
High-Range Assumptions 78% (70% Obstetrics) 2,227 193
Scenario Set C: Bed Demand Projection Based on Recent Observed Trends in Usage and Length of Stay, Low Occupancy Target
Low-Range Assumptions 74% (70% Obstetrics) 2,189 231
High-Range Assumptions 74% (70% Obstetrics) 2,341 79
13
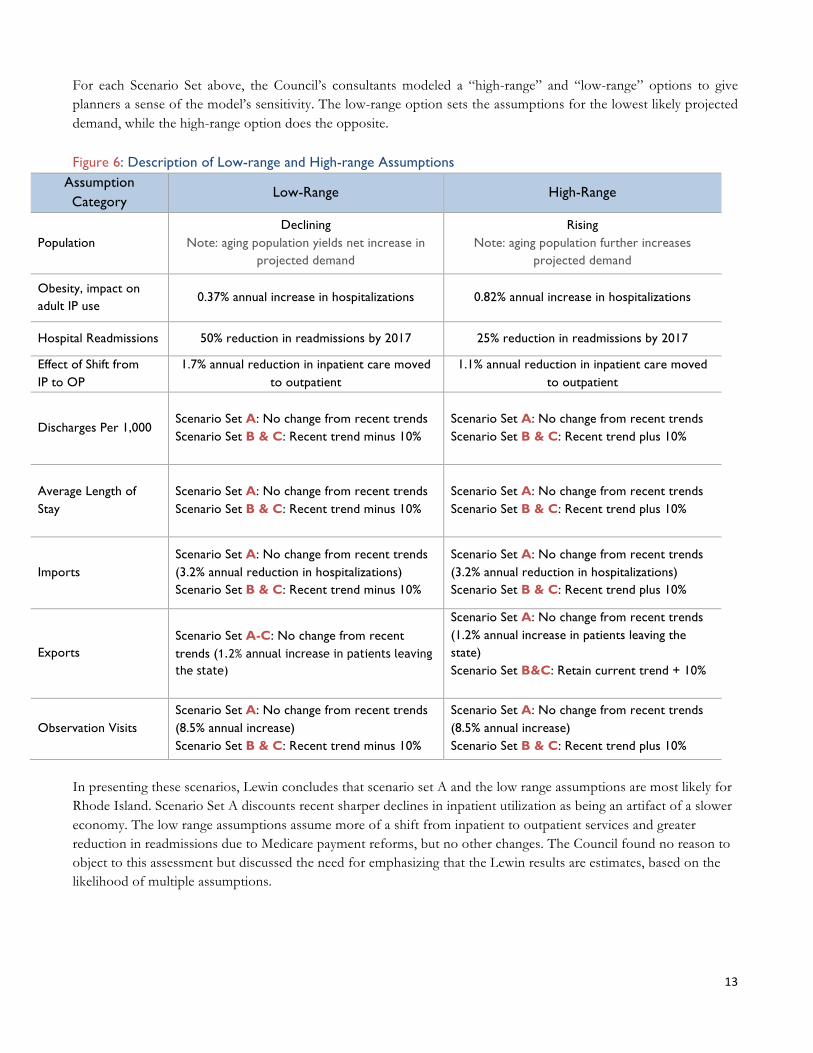
For each Scenario Set above, the Council’s consultants modeled a “high-range” and “low-range” options to give planners a sense of the model’s sensitivity. The low-range option sets the assumptions for the lowest likely projected demand, while the high-range option does the opposite. Figure 6: Description of Low-range and High-range Assumptions
Assumption Category
Low-Range High-Range
Population Declining
Note: aging population yields net increase in projected demand
Rising Note: aging population further increases
projected demand
Obesity, impact on adult IP use
0.37% annual increase in hospitalizations 0.82% annual increase in hospitalizations
Hospital Readmissions 50% reduction in readmissions by 2017 25% reduction in readmissions by 2017
Effect of Shift from IP to OP
1.7% annual reduction in inpatient care moved to outpatient
1.1% annual reduction in inpatient care moved to outpatient
Discharges Per 1,000 Scenario Set A: No change from recent trends Scenario Set B & C: Recent trend minus 10%
Scenario Set A: No change from recent trends Scenario Set B & C: Recent trend plus 10%
Average Length of Stay
Scenario Set A: No change from recent trends Scenario Set B & C: Recent trend minus 10%
Scenario Set A: No change from recent trends Scenario Set B & C: Recent trend plus 10%
Imports Scenario Set A: No change from recent trends (3.2% annual reduction in hospitalizations) Scenario Set B & C: Recent trend minus 10%
Scenario Set A: No change from recent trends (3.2% annual reduction in hospitalizations) Scenario Set B & C: Recent trend plus 10%
Exports Scenario Set A-C: No change from recent trends (1.2% annual increase in patients leaving the state)
Scenario Set A: No change from recent trends (1.2% annual increase in patients leaving the state) Scenario Set B&C: Retain current trend + 10%
Observation Visits Scenario Set A: No change from recent trends (8.5% annual increase) Scenario Set B & C: Recent trend minus 10%
Scenario Set A: No change from recent trends (8.5% annual increase) Scenario Set B & C: Recent trend plus 10%
In presenting these scenarios, Lewin concludes that scenario set A and the low range assumptions are most likely for Rhode Island. Scenario Set A discounts recent sharper declines in inpatient utilization as being an artifact of a slower economy. The low range assumptions assume more of a shift from inpatient to outpatient services and greater reduction in readmissions due to Medicare payment reforms, but no other changes. The Council found no reason to object to this assessment but discussed the need for emphasizing that the Lewin results are estimates, based on the likelihood of multiple assumptions.

14
Finding 4 The estimates of current hospital inpatient export (RI residents seeking care out of state) and import (non RI residents seeking care in state) patterns are as follows.
v Exports: The number of Rhode Island residents discharged from Massachusetts and Connecticut hospitals represents 5.7% of all RI hospital discharges and grew by 248 discharges per year between 2010 and 2011. Since 1997, exports per year have increased by 26%.
v Imports: The number of discharges from RI hospitals for out of state residents is about 8% of all RI hospital discharges. While these imports have grown by 756 discharges per year since 1997 (8.3% increase), they have fallen by 646 discharges per year from their relative peak in 2008, or 5% annually between 2008 and 2011.
v Net Migration: Overall, more patients from other states come to Rhode Island for hospital care than Rhode Islanders go to other states for care. However, the gap is narrowing.
Discussion See page 26 in Appendix C, Lewin Group report on Rhode Island Inpatient Hospital Services Gap Analysis Rhode Island is a net importer of inpatient hospital care: there are more out of state patients who come to Rhode Island for inpatient care than there are Rhode Islanders who seek care in our two neighboring states. This favorable gap, however, is narrowing. The past two years of data, and results from 1997-2003, show exports to Massachusetts and Connecticut rising and out of state imports falling. An analysis of historical Healthcare Cost and Utilization Project (HCUP) for the Rhode Island Department of Health shows that exports – Rhode Island residents who use out of state hospitals – have increased by 26% since 1997, far outpacing growth in total discharges during this period.11 Imports – out of state residents discharged from Rhode Island hospitals – have grown by 8% since 1997, but have fallen precipitously since 2008 at 5% annually. (Figures 7 and 8)
Figure 7: Recent Trends in Out of State Patient Imports and Exports 1997-2011 1/
Total Discharges
from RI Hospitals
Imports (% Change from 2010, 1997)
Exports (% Change from 2010, 1997)
Net (% Change from 2010, 1997)
1997 112,249 9,164 5,664 3,500 2003 126,784 9,728 6,764 2,964
2008 131,259 10,566 2009 130,528 10,510 2010 123,848 10,172 6,897 3,275
2011 125,184
(1.1%, -11.5%) 9,920
(-2.5%, 8.3%) 7,145
(3.6%, 26.2%) 2,775
(-15.3%, -20.7%) 1/ Include non-residents using Rhode Island hospitals, excludes normal newborns. Source: Healthcare Cost and Utilization Project (exports 1997, 2003), Internal Rhode Island hospital records (exports, 2010, 2011), Hospital Discharge Database (total discharges, imports)
11 Williams KA, Buechner JS. “Utilization of Connecticut and Massachusetts Hospitals by Rhode Island Residents, 1997-2003.” Health by Numbers Vol. 8, No. 3. Providence, RI: Rhode Island Department of Health, March 2006.

15
Figure 9: Geographic Patterns in Exports: Percent of Total Town Discharges to Out-of-State Hospitals | Source: Buechner, RI Dept. of Health8
Figure 8: Recent Trends in Inpatient Days for Non-Rhode Island Patients Treated in RI Hospitals (Imports)2/
Service 2008 (days)
2009 (days)
2010 (days)
2011 (days)
Annual Trend (CAGR)
Emma Bradley Hospital 6,105 6,545 2,945 3,898 -14%
Butler Hospital 2,522 2,818 2,714 2,636 1%
Kent Hospital 1,542 1,411 1,189 1,710 4%
Landmark Medical Center 2,379 2,739 2,516 2,395 0%
Memorial Hospital 2,700 2,352 2,088 2,119 -8%
The Miriam Hospital 5,062 4,606 4,498 3,414 -12%
Newport Hospital 1,082 895 900 593 -18%
Rehabilitation Hospital 1,166 1,132 936 908 -8%
Rhode Island Hospital 19,579 21,488 19,880 20,072 1%
Roger Williams Medical Center 1,400 1,090 1,291 898 -14%
South County Hospital 280 194 236 249 -4%
St. Joseph Health Services 1,482 1,275 1,144 724 -21%
Westerly Hospital 6,192 5,972 5,927 5,399 -4%
Women & Infants Hospital 6,984 6,651 6,057 5,546 -7%
Total 58,475 59,168 52,321 50,561 -5% 2/ Include non-residents using Rhode Island hospitals, excludes normal newborns. | Source: HDD, 2008-2011, Rhode Island Department of Health
There are several reasons why Rhode Island residents may travel to Massachusetts or Connecticut for their care: the proximity of border hospitals, specialty services unavailable or of perceived lower value in Rhode Island and perceived quality and reputation differences, etc. An analysis of export patterns reveals that Rhode Island border towns had the highest percentage of migration to Massachusetts and Connecticut hospitals. Almost three fourths of the hospitalized residents of Tiverton and Little Compton used out-of-state hospitals, primarily in Massachusetts. Cities near highly-concentrated hospital markets – West Warwick, Providence, Johnston – had less than 2% of residents seeking out of state care. Accordingly, the majority of discharges of Rhode Island residents between 1997 and 2003 were from Massachusetts hospitals located in Fall River, followed by those in Boston. Southcoast Health System in Fall River had the highest numbers of discharges with 14,904 over the seven-year period. Brigham and Women’s Hospital (3,731) and Massachusetts General Hospital (3,157), both in Boston, had the next largest numbers.12
While the most likely assumption presented in this report holds exports steady, retaining exports, particularly those driven by specialty tertiary services, perceived quality differences and border proximity, may represent an opportunity to staunch declining inpatient volume and buoy hospital financial performance. Payer-specific data exists regarding the kinds of inpatient services RI residents are seeking out of state but these have not yet been aggregated across payers to obtain a system-wide view.
12 Williams KA, Buechner JS. “Utilization of Connecticut and Massachusetts Hospitals by Rhode Island Residents, 1997-2003.” Health by Numbers Vol. 8, No. 3. Providence, RI: Rhode Island Department of Health, March 2006.

16
Finding 5 The savings associated with eliminating excess inpatient capacity in the most likely scenario range from about $12 m when only incremental costs are considered to more than $100 m when all hospital costs are eliminated.
Discussion See pages 7, 14-19 in Appendix C, Lewin Group report on Rhode Island Inpatient Hospital Services Gap Analysis Finding 3 would indicate that the combination of a shrinking population, reduced use of inpatient services per person, and an evolving delivery system that emphasizes patient-centeredness and prevention results in needs that are not best served by the current arrangement of inpatient hospital services. This mismatch of needs and capacity adds unnecessary costs to the system. To estimate the amount of money the health care system would save by eliminating these projected excess beds individually, the Council’s consultants used a method from established health services research. Since hospitals have finely-tuned staffing models that flex with the expected occupancy rate, the cost of an unfilled bed depends on whether the hospital expected it to be empty or not. If the bed is unexpectedly empty, the hospital is likely paying both variable (mainly staffing) and fixed (overhead) costs to hold the bed. On the other hand, if the bed is expectedly empty, the hospital has likely not assigned staff to it and is only paying the bed’s share of overhead expenses.
How much is one bed’s share of overhead expenses? Research estimates the per-bed expense to be about 18% of the hospital’s total costs13. The consultants then calculated the average cost per bed, by bed type, from the 2009 and 2010 Medicare Cost Report Data, inflated at 2% annually to reflect natural price growth. The authors reported 18% of this average cost per bed type, depending on the number of excess beds by scenario. Based on this analysis, it is likely that Rhode Island will have excess beds in 2017 at a marginal cost between $4.9m and $21.1m – 0.25% of Rhode Island’s $8.8b health care market14.
Figure 10: Savings Associated with Select Bed Need Projection Scenarios
Target Occupancy Rate Annual Cost of Excess Capacity
(millions) Scenario Set A: Bed Demand Projection Based on Assumption Driven Trends 1/
Low-Range Assumptions 78% (70% Obstetrics) $12.6
202 bed surplus
High-Range Assumptions 78% (70% Obstetrics) n/a
64 beds shortage
Scenario Set B: Bed Demand Projection Based on Recent Observed Trends in Usage and Length of Stay, High Occupancy Target 2/
13 Friedman, Bernard and Mark V. Pauly “Cost Functions for a Service Firm with Variable Quality and Stochastic Demand: The Case for Hospitals”, Review of Economics and Statistics, November 1981.
14 Centers for Medicare & Medicaid Services (2011). Health Expenditures by State of Residence. Retrieved (December 2011) at http://www.cms.gov/NationalHealthExpendData/downloads/resident-state-estimates.zip.

17
Low-Range Assumptions 78% (70% Obstetrics) $21.1
338 bed surplus
High-Range Assumptions 78% (70% Obstetrics) $12.1
193 bed surplus
Scenario Set C: Bed Demand Projection Based on Recent Observed Trends in Usage and Length of Stay, Low Occupancy Target 3/
Low-Range Assumptions 74% (70% Obstetrics) $14.5
231 bed surplus
High-Range Assumptions 74% (70% Obstetrics) $4.9
79 bed surplus
TABLE NOTES 1/ Low range estimates assume declining population growth; increase in inpatient utilization for adults of 0.37 percent per year due to obesity; 50 percent reduction in hospital readmissions; 1.7 percent per year reduction in days due to shifting services to outpatient setting; continued recent historical trends in out-of-state patient volumes (imports), observation visits and patients leaving the state for inpatient care (exports). High range estimates assumes increasing population growth; increase in inpatient utilization for adults of 0.82 percent per year due to obesity; 25 percent reduction in hospital readmissions; 1.1 percent per year reduction in days due to shifting services to outpatient setting; continued recent historical trends in out-of-state patient volumes (imports) and observation visits; 10 percent of patients leaving the state for inpatient care (exports) are retained in state. Under both scenarios the impact of enhanced primary care pending Graham Center results and assumes target occupancy rate of 78 percent (70 percent for Obstetrics). 2/ High-range estimate assumes increasing population growth; historical annual change in discharges per 1,000 and average length of stay for Rhode Island patients plus 10%; historical annual change in import cases and observation visits plus 10%. Low-range estimate assumes decreasing population growth; historical annual change in discharges per 1,000 and average length of stay for Rhode Island patients minus 10%; historical annual change in import cases and observation visits minus 10%. Under both scenarios the impact of enhanced primary care pending Graham Center results and assumes target occupancy rate of 78 percent (70 percent for Obstetrics). 3/ These scenarios use the same assumptions as described in note 2 but assumes target occupancy rate of 74 percent (70 percent for Obstetrics).
These savings are small because they reflect removing each excess bed from the system, in piecemeal fashion. This method is an inefficient way to “right-size” Rhode Island’s inpatient delivery system. If the surplus beds, which together represent an average-sized hospital, were removed along with the fixed costs of a hospital – in other words, if the same number of people are served with one less inpatient facility – the savings to the system would be much greater. According to the health services research described above – an expectedly empty bed consumes about 18% of average per-bed hospital costs -- total savings from closed facility could be more than $100m, with a range of about $27m-$116m, without compromising the delivery of patient care.15
15 This estimate is conservative. A review of actual Rhode Island hospital costs and staffed bed data shows that the potential savings – the cost of operating a hospital of comparable size – could be about twice as much.

18
Finding 6 This report makes no formal findings on ways to identify and address the types of excess inpatient capacity but does discuss potential options.
Discussion The analysis presented thus far has looked at bed supply and demand on an aggregate, state wide level. During Council discussion, members reiterated “a bed is not a bed”. At a most basic level, analysis must take into account the distribution of existing and needed beds by service type and geography. There is no consensus for the level of detail that is appropriate when analyzing bed need and supply by service type. In its work for the Council, Lewin broke down its statewide results into broad inpatient service categories (see Figure 11 below, for an example of one scenario). Figure 11: Sample Lewin Allocation of Excess Beds by Inpatient Bed Type for One Scenario Scenario Set A16 from Finding 3 below, Low-Range Assumptions (202 Surplus Beds)
Service Area Med/Surg Obstetrics Pediatrics Pediatrics
Psychiatrics Adult
Psychiatrics ICU Total
29 59 41 -1 38 35 202
But some argue further detail is necessary. Lewin’s service categories, for instance, do not take into account medical or surgical intensive care unit services, inpatient services used for support medical education, and tertiary or quaternary services. How should the demand for those services be itemized? There is no consensus in the research literature. Because of this, the Council was not comfortable making a finding about how any excess capacity that existed could be systematically allocated among inpatient services. Moreover, even if demand for certain services can be estimated, efforts to match supply must consider those procedures for which there is a clearly demonstrated relationship between volume performed and quality of the outcome (Finding 7). Once service categories are agreed to and demand and supply for them are estimated, how should these beds be allocated across the state? Finding 8 examines the distribution of beds by geography and the extent to which residents travel in state for services. This discussion, while pointing to additional complexities of analysis, should not obscure the theme of the previous findings: by the most likely estimates, Rhode Island will have too many inpatient beds in the near future, and that excess capacity imposes real costs on the system. Policy makers face fundamental policy options when considering a course of action for this issue. Chief among these is the role of the public sector in addressing any excess capacity. A variety of policy options along a spectrum of government involvement are available. Further work of the Council should take into account lessons learned in other successful examples of matching healthcare supply to demand, namely, a focus on collaboration, data, and planning. Regardless of the public policies adopted, such action should be informed by data and evidence. The workings of the Health Care Planning & Accountability Advisory Council and the resources provided to it have created opportunities to produce more evidence on the supply of and demand for inpatient services in Rhode Island – summarized in the previous and following findings. These efforts are a promising start – but a start only.
16 Different scenarios will be reviewed in the next section. The purpose of this table is to illustrate effects of key demand drivers.

19
Finding 7 For certain procedures, there are generally-accepted volume thresholds below which quality is likely to be compromised. For some procedures, some Rhode Island hospitals do not meet these thresholds. Figure 12: Actual Volume and Volume Thresholds for Select Volume-Sensitive Conditions
Discussion See page 20 in Appendix C, Lewin Group report on Rhode Island Inpatient Hospital Services Gap Analysis When matching supply to demand, planners must ensure sufficient volume to maintain quality outcomes: practice does indeed improve care in many instances of medical care. As a small state, Rhode Island’s individual hospitals may struggle to meet volume standards for procedures that demand scale. A falling population and declining per capita utilization leave the state vulnerable to compromised outcomes for these specific procedures. Any effort to match inpatient supply to demand should take these considerations into account. The bar chart above compares the actual volume in Rhode Island’s hospitals to the thresholds recommended by the Leapfrog Group for select volume-sensitive procedures. The Leapfrog Group is a business and purchasing coalition that strives to improve the quality of medical care by setting quality standards and encouraging purchasers to incorporate those standards into their contracts. Using a consensus process and health services research, 23 conditions were identified for which evidence showed a clear volume/quality relationship.17 For five of the six conditions, there is sufficient volume in the state as a whole – and even at a few hospitals – to meet minimum standards set by Leapfrog. However, for many conditions, this volume is dispersed among hospitals, diluting the educational and quality improvement potential that practice affords. Of particular interest are coronary artery bypass graft (CABG) procedures.
17 Leapfrog Group, Leapfrog Patient Safety Standards, 2000, (Evidence Based Hospital Referral) http://www.leapfroggroup.org/media/file/Leapfrog-Launch-Full_Report.pdf

20
Rhode Island’s Department of Health regulates five18 of the twenty-three volume sensitive procedures identified by the Leapfrog Group, including CABGs and Coronary Angioplasty. The governing statute gives the Director of Health the authority to set volume thresholds for certain procedures and take certain actions when those thresholds are not met. The Department’s thresholds for CABG’s and Coronary Angioplasty were set following an extensive analysis of quality and volume in the state, resulting in standards that are lower than the Leapfrog Group’s national thresholds and more appropriate to Rhode Island’s performance capacity and market needs. As constructed in statute, this authority is a mechanism for monitoring and improving the quality and safety of certain inpatient services – not for addressing excess inpatient capacity. However, any effort to address inpatient capacity could, in part, take this policy into account.
18 Please see Rules and Regulations for Licensing Hospitals, Sections 41.0-45.0 http://sos.ri.gov/documents/archives/regdocs/released/pdf/DOH/7022.pdf

21
Source: Rhode Island Hospital Discharge data 2008-2011
Finding 8 Many Rhode Islanders are willing to travel for their hospital care. The extent to which they travel varies by community and by service. Discussion See page 12-13 in Appendix C, Lewin Group report on Rhode Island Inpatient Hospital Services Gap Analysis Some stakeholders perceive Rhode Island’s hospital service markets as hyper-local: reflecting a belief that, except for the large Providence teaching hospitals, the majority of a hospital’s patients come from its community and most patients seek care from their local hospital. Stakeholders echoed variations of this theme during their interviews with the Council’s consultants and in Council meetings, noting that many Rhode Islander are either unable or unwilling to travel significant distances for inpatient care. A review of in-state patient migration patterns do show that more than half of the patients in five of the seven hospital service areas received inpatient services at a local hospital, perhaps supporting the thesis above (see Figure 13 below). However, a large number of patients do travel outside of their hospital service area for care. They travel mostly to Providence, which hosts hospitals that provide specialty and otherwise unique services. Figure 13: Distribution of Discharges (2008-2011) by Patient Service Area and Hospital Service Area
Hospital Service Area
Patient Service Area
Newport Pawtucket Providence Wakefield Warwick Westerly Woonsocket Total
Newport 69% 0% 27% 2% 1% 0% 0% 100%
Pawtucket 0% 37% 60% 0% 2% 0% 1% 100%
Providence 1% 3% 91% 0% 5% 0% 1% 100%
Wakefield 1% 0% 28% 58% 6% 6% 0% 100%
Warwick 1% 0% 43% 5% 50% 0% 0% 100%
Westerly 1% 0% 21% 8% 3% 67% 1% 100%
Woonsocket 0% 5% 46% 0% 2% 0% 47% 100%

22
Figure 14 below attempts to model the effect of these migration patterns on local-level bed need projections. If patients are assumed to receive care only in their local hospital service area – if, for instance, Westerly-area residents only used Westerly Hospital and Westerly Hospital only drew its patients from the Westerly area – the first table describes the resulting bed need by community. All hospital service areas show a shortage, except for Providence which shows an excess of 473 beds. Although interesting as an exercise, this is not a realistic assumption, since, as noted above, patients do travel. If patients are presumed to travel according to the current migrations patterns described in Figure 13, the bottom table reflects the resulting bed need by hospital service area. The statewide surplus is the same – 202 extra beds – but all hospital service areas have a slight surplus of beds. Providence’s surplus, at 33 beds, is less than one-tenth the size of its no-travel scenario. The true surplus or shortage of beds by local area is somewhere between these two extremes, and must be based on an assessment of how much travel is appropriate. Some of the migration to Providence, for instance, is for care that could otherwise be delivered in the local community and some volume-sensitive procedures are best when concentrated in specific hospitals. Because Rhode Island is a small state and patients appear more willing to travel than previously thought, the appropriate service area for certain services – trauma, tertiary, inpatient mental health – may be statewide, while the service area for others – primary, secondary, emergency – may be local. It is the role of planners and stakeholders to make a nuanced judgment of the role of physician and patient preference in travel choices, the relevant geographic level of review for a given service and, if that level is local, the optimal in-state migration patterns on which to base future health planning analyses. Figure 14: Effect of In-State Patient Migration on Community-Level Bed Need
Service Area Med/Surg Obstetrics Pediatrics Pediatrics
Psychiatrics Adult
Psychiatrics ICU Total
Occupancy 78% 70% 78% 78% 78% 78% Estimated (Shortage) / Surplus | Assumes patient receives care in local area
Newport -2 2 0 -5 -6 -3 -14 Pawtucket -13 -3 7 -4 -32 -3 -47 Providence 135 52 39 -29 206 70 473 Wakefield 4 -1 0 -3 -10 -13 -23 Warwick -78 2 -1 -9 -42 -3 -131 Westerly 1 6 -1 -1 -6 -2 -2 Woonsocket -18 0 -4 -8 -12 -11 -54 Rehab + Psych 0 0 0 0 0 0 0
Total 29 59 41 -1 38 35 202
Estimated (Shortage) / Surplus | Assumes patients travel for care based on current travel patterns Newport 11 4 2 0 0 4 19 Pawtucket 17 9 11 0 -1 6 42 Providence -35 21 24 -3 18 8 33 Wakefield 6 0 1 0 -1 -11 -6 Warwick -5 12 3 0 -27 24 7 Westerly 8 7 0 0 -1 1 15 Woonsocket 9 7 0 0 1 3 20 Rehab + Psych 18 0 0 -58 110 0 70
Total 29 59 41 -1 38 35 202

23
Finding 9 Inpatient services are only half of a hospital’s operating revenue; the rest comes from outpatient services. Additional study is needed to understand the array of outpatient services that various hospitals provide, how hospital-based outpatient services relate to other outpatient services available in the communities they serve, and past and future trends in these areas. Discussion See page 32 in Appendix C, Lewin Group report on Rhode Island Inpatient Hospital Services Gap Analysis This study is limited to a review of inpatient hospital services and does not consider the appropriate level of hospital-based or freestanding outpatient services. There is a nationwide shift from inpatient to outpatient levels of care as technology and recovery times improve, leaving the inpatient side with fewer and increasingly complex patients. Hospitals nationwide are reorienting their practice patterns and business models to meet these evolving patient needs and technological possibilities.
Figure 15: Trend in Hospital Inpatient and Outpatient Gross Revenue Percentage (2006-2010)
2006 2007 2008 2009 2010 Average Annual Change
Rhode Island Inpatient 52.7% 52.3% 52.4% 52.1% 50.4% -1.1%
Outpatient 47.3% 47.7% 47.6% 47.9% 49.6% National
Inpatient 62.2% 61.5% 60.5% 59.0% 58.0% -1.7%
Outpatient 37.8% 38.5% 39.5% 41.0% 42.0% Source: AHA Hospital Statistics 2012
Finding #6 presented several pathways to harness the shift from inpatient to outpatient or to less intense inpatient services while keeping hospitals a viable part of the community and labor market. Some services provided in hospital outpatient settings can be provided as effectively and more efficiently in free-standing settings – but not always with obligations for teaching, uncompensated care and 24 hour access that are placed in hospitals. To better understand the evolving provision of outpatient care, which increasingly takes place outside of the hospital, it is critical that planners and stakeholders engage in further study of these trends.

24
Effect of Primary Care Workforce, Architecture and Organization in Inpatient Needs Research Question: How do different ways of organizing our primary care infrastructure influence Rhode Island’s need for inpatient hospital services? Background: To support the Council’s assessment of the optimal arrangement of inpatient hospital services, consultants to the Council conducted an analysis of the state’s current primary care system and the potential dampening effect on hospitalizations of three differently integrated and patient-centered levels of primary care. The team reviewed the state’s current utilization patterns, population distribution, demographics, measures of social deprivation and workforce composition. The authors note in their report (see Appendix D), that one of the goals of any delivery system planning effort should be the improvement of population health. Rhode Island has several natural strengths for population health planning, including density and lower than average poverty and uninsurance rates. Social deprivation index scores also suggest that Rhode Island is at risk of excessive health care utilization. Study authors note that intensive and coordinated primary care arrangements have been shown to improve population health and address the effects of social deprivation (see Appendix D pages 9-18). In their analysis, the authors model the effects of three hypothetical primary care arrangements on inpatient utilization. It is critical to note that these models are presented as thought experiments rather than precise predictions. The models chosen are isolated examples of positive interventions in select areas for unique populations. Planners should not necessarily assume that the results of these programs could be achieved for Rhode Island’s general population without significant structural overhaul.

25
Finding 10 Primary care physician (PCP) supply is higher in Rhode Island than in many other states, with 80 PCPs per 100,000 residents, which is the 8th highest ratio in the nation. However, the optimal rate is unknown.
See page 23, 36 in Appendix D, Graham Center report on Rhode Island Primary Care Gap Analysis
Discussion Though Rhode Island’s supply of PCPs per resident is high relative to the nation, this level may not ensure accessible, culturally competent, and effective primary care. The analysis for the Council projects that Rhode Island will need to add an additional 218 PCPs by 2025. Note that the Graham Center assumes a population increase through 2025, which is also consistent with one of the two population scenarios The Lewin Group used in its inpatient hospital gap analysis model. The population growth assumption is based on the US Census Bureau’s 2005 projections, which use data from the 2000 Census. The population decline scenario that Lewin also used is based on the change from the Census Bureau’s 2010 to 2011 Rhode Island population counts, which showed a decrease in Rhode Island residents.
Figure 16: Regional Comparison of Primary Care Physicians and Specialists per 100,000 Residents
Primary Care Specialists
Rate State Rank Rate State Rank
Rhode Island 80.2 8 165.8 6
Connecticut 71.3 20 170.5 4
Maine 96.3 2 154.3 8
Massachusetts 87.9 4 198.0 2
New Hampshire 86.5 5 151.4 12
Vermont 92.8 3 146.3 13
New England 84.1 178.5 Nation 66.0 133.0
Source: AMA Physician Masterfile and National Plan and Provider Enumeration System Data; 2011 Population Estimates from Census Bureau
Figure 17: Projected Primary Care Physician Need for Rhode Island
“PC” represents “Primary Care Physician” 2010 2015 2020 2025
Current number of PC Physicians 896 896 896 896 Increase due to Aging 0 12 28 49 Increase due to Population Growth 0 22 58 110
Increase due to ACA Coverage 50 52 55 59 Required number of PC Physicians 946 982 1037 1115
‘Missing’ PC Physicians 50 86 141 218
Source: AMA Physician Masterfile and National Plan and Provider Enumeration System Data; Population Estimates from Census Bureau

26
Finding 11
Research indicates that the workforce, architecture, and organization of primary care physicians can greatly influence the demand for other medical services, including inpatient hospital services. See page 16-18 in Appendix D, Graham Center report on Rhode Island Primary Care Gap Analysis Discussion Patient-centered preventive care that is coordinated by primary care physicians and integrated across ancillary services can measurably reduce the number of hospitalizations and lengths of stay. Meeting these practice ideals can take many different forms, from more local culturally competent PCPs and ad hoc risk sharing arrangements with individual payers and providers to an all-payer patient centered medical home (PCMH) or a vertically-integrated payer-provider such as Kaiser Permanente in California. The efficacy of each model depends on myriad factors, including physician-hospital-payer relationships, the existing over or underuse of the healthcare delivery system, available transformation funds, and patient buy-in. As the charts below show, more primary care physicians – and particularly family physicians – in a given population is correlated with lower avoidable and overall hospitalization rates, ER visits, and medical costs.
Figure 18: Comparison of Primary Care Physicians Supply to Health Care Utilization and Costs

27
Figure 19: Comparison of Family Physician Supply to Health Care Utilization and Costs
Rhode Island has made systematic efforts to strengthen the primary care infrastructure in the state. The Office of the Health Insurance Commissioner’s affordability standards call for insurers operating in Rhode Island to double the portion of their medical spend going to primary care between 2008 and 2014, and to support and expand the Chronic Care Sustainability Initiative (CSI-RI), the state’s all payer patient centered medical home initiative. The state’s Rite Care program, its employee health insurance program and its Health Benefit Exchange all focus on strengthening the role of primary care in their benefit designs. The legislature has passed legislation establishing the CSI project and requiring all insurers to collect information on every enrollee’s primary care provider annually. These public efforts are supplemented by numerous private sector initiatives as well.

28
Finding 12 In Rhode Island, the potential reduction in hospitalizations (and thus on bed need) from a more integrated primary care delivery system alone may range from 6.2% to 43.9% for a very mature, integrated delivery system. See page 44-45 in Appendix D, Graham Center report on Rhode Island Primary Care Gap Analysis
Discussion The Council’s consultants reviewed three increasingly patient-centered and integrated models:
1. Statewide PCMH (-6.2% to -8.1% reduction in hospitalization rates): Apply the results of the Rhode Island Chronic Care Sustainability Initiative (CSI-RI) to the entire state. Statewide results may be conservative, as CSI-RI does not include two of the highest-utilizing payers (Medicare and Medicaid Fee–For-Service). Applying CSI-RI’s successes to the general population would likely yield even greater savings.
2. Optimized physician ratios (-8.3% reduction): Raise the per-resident supply of physicians and nurse practitioners to ratios seen in states with highly successful primary care outcomes
3. Statewide integrated ACO (-43.9% reduction): Apply results from an intensively patient-centered private sector Medicare Advantage Accountable Care Organization, like the Texas WellMed model, to Rhode Island.
These percentage reductions can be applied directly to the previous hospital inpatient capacity calculations. Thus, if these models were accurate, the most probable assumption would now yield the results under “Potential Excess Bed Range” in Figure 20 below:
Figure 20: Range of Potential Impacts on Hospitalizations and Bed Need in Rhode Island
As noted above, these data do not represent definitive projections of reduced hospitalizations and excess capacity. They instead give a general sense of how the results of specific interventions might manifest if applied to Rhode Island’s entire population and if planners reoriented the entire delivery system to benefit from highly integrated care. Since this section of the report focuses on estimating the future need for inpatient services the implications are twofold projections should model the effects of primary care supply and organization; and hospital inpatient capacity assessment should be done in the context of medical delivery system planning in general – a planning effort which should take into account the strong evidence of the importance of primary care supply and organization in promoting population health and system efficiency.
®®®®®®®

29
Certificate of Need Program: Background
The groundwork for Rhode Island’s Certificate of Need (CON) Program was laid in 1968 with the creation of the “Capital Expenditures Review Program.” In 1974, the federal “National Health Planning and Resources Development Act”, which provided funds for CON as well as a standardized health planning process, was enacted19. As a result of this law and the availability of federal funds, Rhode Island created its CON Program in that year. The enabling authority for CON is contained in Chapter 23-15 of the Rhode Island General Laws, as amended.20 The purpose of the Program is to “provide for the development, establishment, and enforcement of standards for the authorization and allocation of new institutional health services and new health care equipment.”21 DOH has a regulatory process in place to review the development of new health care services and equipment and large capital investments. Federal funds for health planning were available until 1986, the year the Rhode Island Department of Health (DOH) last prepared a comprehensive health plan. Then-Governor Edward D. DiPrete approved the plan on October 8, 1986.22 While there has been no comprehensive statewide health planning since 1986, Rhode Island’s CON Program is one of 37 nationwide that remain in place. Categorical studies on specialty health care services and equipment have been commissioned over the years related to specific CON applications.
In addition to CON, DOH’s health planning activities currently include one additional component:
Healthy Rhode Island 2010/2020 Planning Process: This process produces 10-year targeted objectives related to health promotion and disease prevention activities.23 The Healthy Rhode Island 2020 report will represent the fourth generation of this work.
19 See: U.S. Public Law 93-‐641 20 See: Chapter 23-‐15 of the Rhode Island General Laws, as amended. Available online at: http://webserver.rilin.state.ri.us/Statutes/TITLE23/23-‐15/INDEX.HTM 21 See: Section 23-‐15-‐3 of the Rhode Island General Laws, as amended, “Purpose.” Available online at: http://webserver.rilin.state.ri.us/Statutes/TITLE23/23-‐15/23-‐15-‐3.HTM 22 See: Rhode Island Health Plan 1987 – 1992, Rhode Island Department of Health, Statewide Health Coordinating Council, Joseph E. Caruolo, MD, Chairperson, October 1986. Copies available upon request. 23 See: A Healthier Rhode Island by 2010: Mid-‐course Review, Rhode Island Department of Health, May 2006. Available online: http://www.health.ri.gov/publications/progressreports/HealthyPeople2010MidCourseReview.pdf

30
In 2011, a bill was introduced in the Rhode Island General Assembly to repeal the CON Program in its entirety24. While the bill did not pass, it renewed the discussion about the efficacy of the CON Program. Since 2008, no CON applications have been denied25. While the CON Program exists to ensure that proposed new health care services: 1/ meet the needs of the population; and 2/ are affordable, accessible and of high quality, it does not identify service delivery gaps or develop health care services to fill such gaps.
Recent CON studies highlight the impact of CON on volume-sensitive services. For example, Lorch et. al. found that the lack of a CON program is associated with a greater number of hospitals with neonatal intensive care units (NICUs) and NICU beds. Further, these authors found that CON may be an effective tool for regionalization of NICUs, as the presence of a CON program may be related to a demonstrated decrease in infant mortality.26 In a 2011 study, Lucas et. al. found a rapid rise in cardiac surgery programs in states where CON programs have been repealed. They found that new specialty cardiac programs opened in inefficient patterns and that increasing the supply of such services when demand is decreasing results in a growing proportion of procedures performed in facilities where volumes are low.27 It has been estimated that CON programs limit the growth in supply of hospital beds which, in turn, leads to a slight reduction in total health care expenditures. CON has been shown to reduce the supply of hospital beds by ten percent (10%).28 In addition to regulating volume-sensitive procedures (“practice makes perfect”) and preventing the oversupply of services and equipment as noted above, CON regulates major capital expenditures and may promote access for underserved populations. However, CON programs do have drawbacks. As noted above, CON does not identify or fill gaps in health care service delivery. The process may become politically-charged and is expensive, time-consuming, and complicated. Some argue that limiting competition in the health care marketplace results in price increases.
24 See: Proposed Article 29 of the Budget Act, March 10, 2011. Available online: http://webserver.rilin.state.ri.us/billtext11/housetext11/article-‐029.htm 25 The last CON denied was in 2006, when three CON applications were denied. (See Figure #1 above). 26 SA Lorch, P Maheshwari and O Even-‐Shoshan. “The Impact of Certificate of Need Programs on Neonatal Intensive Care Units” Journal of Perinatology (2012) 32, 39—44. 27 Frances Leslie Lucas, Andrea Siewers, David C. Goodman, Dongmei Wang, and David E. Wennberg. Health Affairs June 2011 content.healthaffairs.org 28 Fred J. Hellinger, PhD. “The Effect of Certificate-‐of-‐Need Laws on Hospital Beds and Healthcare Expenditures: An Empirical Analysis”, The American Journal of Managed Care. 2009; 15(10): 737-‐744.
Disposition of CON Applications2006 - 2012
0
2
4
6
8
10
2006 2007 2008 2009 2010 2011 2012
Year
Nu
mb
er o
f A
pp
lica
tion
s
Denied
Withdrawn
Approved

31
Process for Developing Recommendations Related to the Certificate of Need Program
In response to the General Assembly’s directive contained in Public Law 12-259, the Health Care Planning and Accountability Advisory Council convened a sub-committee to discuss Rhode Island’s CON Program in order to make recommendations to the Assembly by March 1, 2013. The sub-committee convened three times (October 26, 2012; November 26, 2012; and December 17, 201229). After an initial review of CON criteria and review processes, the sub-committee identified common themes that included:
1. There is no clear consensus on definition of “community need.” (It has been the applicant’s burden to demonstrate “need” in the past);
2. There is definitional language in section 23-15-6 (f) of the Rhode Island General Laws, as amended,
related to “affordability”; 3. CON is a health planning tool that is best used within the context of a statewide health plan; 4. The CON Program should be evaluated within a re-configured health care delivery system (e.g.,
accountable care organization); 5. The list of CON-reviewable facility categories has been amended in statute from time to time and now
includes the following: hospital, nursing facility, inpatient rehabilitation center, freestanding ambulatory surgical center, multi-practice physician/podiatry ambulatory surgical center, home care provider, home nursing care provider and hospice provider;
6. The list of CON-reviewable tertiary/specialty care services includes: computed tomography (CT),
magnetic resonance imaging (MRI), Gamma Knife, positron emission tomography (PET-CT), linear accelerator, cardiac catheterization, open heart surgery, neonatal intensive care unit (NICU), and organ transplantation. Some of these tertiary services have a volume—quality relationship that is regulated in licensure requirements.
7. There are no standardized, evidence-based data upon which to guide and evaluate a CON (“We cannot
compare apples to apples”); 8. CON decisions often contain conditions of approval. There is lack of uniformity in conditions that may
place an undue burden upon applicants; and 9. There is no explicit statutory authority for the Director of Health to assess monetary fines for non-
compliance with CON requirements and related conditions of approval.
29 Sub-‐committee attendees (or their designees) included: Timothy Babineau, MD, (Lifespan); Jodi Bourque, Esq. (RI Department of Attorney General) ; Al Charbonneau (consumer) ; Gail Costa (Care New England) ; Beth Cotter (Rhode Island Speaker of the House); Marie Ganim, Ph.D. (Rhode Island President of the Senate); Jane Hayward (RI Health Center Association); Dennis Keefe (Care New England); Rebecca Kislak (RI Health Center Association); Dale Klaztker, Ph.D.(RI Community Mental Health Centers); Mark Montella (Lifespan); Edward Quinlan (Hospital Association of Rhode Island); Kathryn Ryan, Esq. (RI Department of Attorney General); and Rachel Schwartz (Lifespan).

32
CON-Related Recommendations
These themes above were re-fashioned into the following five (5) recommendations: Background Recommendation
1.
The establishment of a multi-practice physician /podiatry ambulatory surgery center requires a CON pursuant to RIGL 23-15. Multi-practice physician /podiatry ambulatory surgery centers are defined in RIGL 23-17. The definition as it relates to CON requirements is not clear.
CON thresholds for physician /podiatry ambulatory surgery centers (PASC) shall be a facility in excess of two (2) operating rooms.
2. The definition of “affordability” in RIGL 23-15 is very broad and does not specifically reference increases in per person per year cost of health care.
“Affordability” for a CON shall consider the impact on the per person per year cost of health care in Rhode Island and shall include a comprehensive cost impact analysis as defined in R.I. G.L. 23-15-2(2).
3.
There is no statutory authority in RIGL 23-15 to fine or penalize applicants for non-compliance with CON conditions of approval.
Provide statutory authority for the Director of Health to fine applicants for non-compliance with CON conditions of approval.
4.
Conditions of approval should relate directly to the CON application in addition to the Health Services Council’s review criteria {See RIGL 23-15-4 (e)}.
Conditions of approval shall be relevant to the specific CON.
5.
There are no evidence-based uniform standards and databases to guide the CON process.
Evaluative standards shall be developed by the Department by regulation.
Of these recommendations, numbers 1 and 3 require legislation. Recommendations 2, 4 and 5 could be accomplished through regulation. “Evaluative Standards” in Recommendation #5 refers to a uniform set of standards, data, and information that applicants may refer to when demonstrating their application meets a defined health services need.
Some Council members noted their objections to Recommendation 1 because the recommended change would apply to licensed PASCs facilities seeking to merge. They argued that this change reverses legislation previously negotiated, which limits the Certificate of Need process to practices that open a new PASC within two years of a merger. Recommendation 1, in contrast, would apply CON to the merger of practices with currently-licensed physician/podiatry ambulatory surgical centers.
Typical CON review thresholds involve designated dollar amounts, the establishment of new facilities and services, and increases in the levels of bed and operating room capacity. A licensed facility’s ownership structure is not a common determinant for a CON.

33
Hospital Conversions Act: Background Since 1997, certain transfers in ownership, assets, membership interest, authority or control of a hospital in Rhode Island require approval by both the Department of Health (HEALTH) and the Rhode Island Department of the Attorney General (RIAG) under the authority of the Hospital Conversions Act (HCA) (Chapter 23-17.14). The purposes of the HCA statute are to:
• Assure the viability of a safe, accessible and affordable healthcare system that is available to all of the citizens of the state;
• Establish a process to determine whether for-profit hospitals will maintain, enhance, or disrupt the delivery of healthcare in the state and to monitor hospital performance to assure that standards for community benefits continue to be met;
• Establish a review process and criteria for review of hospital conversions; • Clarify the jurisdiction and the authority of the department of health to protect public health and welfare and
the department of attorney general to preserve and protect public and charitable assets in reviewing both hospital conversions which involve for-profit corporations and hospital conversions which include only not-for-profit corporations; and
• Provide for independent foundations to hold and distribute proceeds of hospital conversions consistent with the acquiree's original purpose or for the support and promotion of health care and social needs in the affected community
In 2012, the state legislature overhauled the HCA. Resulting changes included:
• Expedited (90 days) application review, if a non-profit hospital acquires another financially-distressed non-profit hospital;
• Eliminated three-year waiting period between for-profit conversions by the same system; • Added mandatory conditions for approval in for-profit acquisition; • Judicial review of interlocutory actions; • Administrative review “look-back” reduced from 5 years to 3 years; • Decision timeline shortened from 180 days to 120 days for non-expedited applications.
The Council was asked to assess the HCA in general and these most recent changes in particular.
34
Process for Developing Recommendations Related to the Hospital Conversions Act As with the Certificate of Need Program, the Health Care Planning and Accountability Advisory Council convened a subcommittee to discuss Rhode Island’s HCA program in order to make recommendations to the General Assembly by March 1, 2013. The subcommittee convened three times (October 24, 2012; December 4, 2012; and December 19, 2012). At its first meeting, the sub-committee identified some initial issues for discussion:
• The sub-committee needed to gain an understanding of the recent changes made to the Act (listed above);
• The HCA is not currently tied to a unified state health plan or other official needs assessment; • There is concern that the judicial review provision is inconsistent with the Administrative Procedures
Act (APA) process for appealing agency decisions. After much discussion the sub-committee identified four key findings & recommendations:
Finding 1: The Hospital Conversions Act requires the Department of Health to consider whether the conversion demonstrates, among other things, a “balanced health care delivery to the residents of the state”. Finding 2: The judicial review provision is inconsistent with the Administrative Procedures Act (APA) process for appealing agency decisions. The current provision allows for review of preliminary decisions that would not automatically be reviewable by the Court if they were decisions by other agencies. It also contains a standard of review that is lower than those used for all other agency decisions. In addition, it contains a balancing test that inappropriately balances the rights of the transacting parties against the interests of the citizens of the state in a safe, accessible and affordable healthcare system. Finding 3: The Hospital Conversions Act’s criteria for the Department of Health should balance the need for both community health improvement and workforce development, with an emphasis on population health improvement. Finding 4: The legislature recently created an expedited review process in the Hospital Conversion Act related to a non-profit hospital acquiring a financially distressed non-profit hospital. The sub-committee posed for the Council whether the need for the acquired hospital to be financially distressed was necessary. In addition, some members questioned whether out-of-state non-profits should be extended an expedited process, because it takes longer for the RI state agencies to obtain relevant information about the acquiror from out of state agencies.
35
Hospital Conversions Act | Revised Findings and Suggested Recommendations
Recommendations
1. Add to § 23-17.14-8(9), § 23-17.14-11(8): Whether the conversion is consistent with a state health plan or community health needs assessment officially adopted by the Department of Health.30
2.
Apply the Administrative Procedures Act Standard to both the Departments of Health and Attorney General’s Office.
The resulting language for this section would then read: Any transacting party aggrieved by a final order of the department of health or the attorney general under this chapter may seek judicial review in the superior court in accordance with section 42-35-15.
3.
In § 23-17.14-3 of the Hospital Conversions Act, add: Assure the viability of a safe, accessible and affordable healthcare system that is available to all of the citizens of the state with an emphasis on population health improvement as the overriding objective
4.
Expedited review should be limited to in-state non-profit hospitals as the acquiring transacting party Eliminate the requirement that in-state non-profit hospital or hospital systems be financially distressed to qualify for expedited review. However, if the transacting parties do not qualify as financially distressed, the review timeframe contained in R.I. G.L. 23-17.14-12.1(e) shall be 120 days
Unlike the CON recommendations, all of these would require statutory changes. The recommendations attempt to respond to the findings of the Council regarding CON. Recommendation 1 addresses a perceived deficiency in the current HCA and re-‐‑articulates a public policy supporting system-‐‑wide, evidence-‐‑based health planning for the state. Recommendation 3 prioritizes the goal of improving population health among all goals of the state in health systems assessment and thus among all standards an applicant must meet. Finally, recommendation 4 reflects the practical reality that in-‐‑state information is more easily accessed than information from out of state. . While in-‐‑state acquisitions should benefit from a lower level of scrutiny-‐‑ implicit in the shorter application set forth in the expedited review section of the current HCA -‐‑ than a prospective out of state acquirer, an expedited time-‐‑frame should only be accorded in the cases of financial fragility.
30 This would add a new standard for consideration, and link evaluations of applications for CON and HCA to a health planning document

36
Conclusion Although estimates vary and are subject to probabilities, Rhode Island will probably need fewer inpatient beds in the future – most likely comprising the equivalent of an entire hospital. The amount could be even greater with a set of policies promoting more organized primary care. More precise detail on the nature of that excess capacity – for what services and in what communities – is not readily attainable. What is known is that people are willing to travel for their inpatient services and are going out of state with greater frequency – and declining volumes will compromise the ability of some hospitals to provide high quality inpatient care for services where a volume/quality trade-off has been demonstrated. Policy makers have tools to address this likely excess inpatient capacity including the Hospital Conversion Act and Certificate of Need. The tools can be revised and updated and they are best used in the context of public and private leadership and planning that places a priority on improving the health of Rhode Island’s entire population.

37
Acknowledgements
The Council acknowledges the input of numerous public attendees at its scheduled meetings, as well as the
analytical expertise of the consultants who contributed to this report. Michael Souza of the Hospital
Association of Rhode Island provided data critical for the Lewin analysis. Staff from a number of
organizations represented on the Council met frequently to review, assess and improve the analyses in the
consultant’s reports. Lifespan, Care New England and Blue Cross and Blue Shield of Rhode Island
consented to share internal analyses with the Council, some of which is included in the report.
The Council is particularly grateful for the extensive, expert and steadfast contributions of the agency staff to
this report and to the work of the Council – Michael Dexter (Health), Elizabeth Shelov and Melinda Thomas
(EOHHS) and Kim Paull (OHIC). This report would not exist without them.

38
Appendix A HEALTH CARE PLANNING AND ACCOUNTABILITY ADVISORY COUNCIL
MEMBERSHIP ROSTER31
Steven M. Costantino, Co Chairman Christopher Koller, Co-‐‑Chairman Secretary, Executive Office of Health & Human Services Health Insurance Commissioner
Council Member Name
Council Position Stipulated in
RIGL Chapter 23-8132
Council Member Name
Council Position Stipulated in RIGL Chapter 23-81
Alyn L. Adrain, MD
Position not stipulated in statute
Peter Andruskiewicz
Health insurers providing coverage to 10% or more of insured Rhode Islanders
Timothy Babineau, MD
Position not stipulated in statute Kenneth H. Belcher RI hospital chief executive officers
Douglas Bennett Represents RI House of Representatives Minority Leader
Jodi Bourque, Esq. RI Department of Attorney General, Health Care Advocate
Albert Charbonneau
RI consumers Nicki Cicogna RI practicing nursing home administrators
Beth Cotter Represents the RI Speaker of the House of Representatives
Stephen Farrell Health insurers providing coverage to 10% or more of insured Rhode Islanders
Michael Fine, MD Director, RI Department of Health
Patricia Flanagan, MD
RI American Academy of Pediatrics
Marie Ganim, PhD Represents President of the RI Senate
Herbert Gray Position not stipulated in statute
Robert Hartman RI consumers Jane Hayward RI community health centers
Gloria Hincapie RI consumers Eve Keenan, RN, Ed.D.
Position not stipulated in statute
Dennis D. Keefe Position not stipulated in statute
Dale K. Klatzker, PhD
RI community mental health center providers
George Nee RI consumers Donna Policastro, RNP
RI nurses and allied health professionals
Sandra Powell RI Department of Human Services
Edward Quinlan Representing RI Senate
Craig O’Connor (observer)
Health insurers providing coverage to 10% or more of insured Rhode Islanders
Louis Rice, MD RI specialty care physicians
Terrie Wetle, PhD RI health professional learning institution
31 List current as of May 7, 2013 32 See RIGL 23-81 for the Council membership: http://webserver.rilin.state.ri.us/Statutes/TITLE23/23-81/23-81-3.1.HTM
39
Appendix B Summary of the Findings & Recommendations
RI Inpatient Capacity: Findings 1. In Rhode Island, falling inpatient utilization combined with steady-to-rising bed supply has led to declining
occupancy rates and potentially excess supply of beds.
2. When forecasting the demand for inpatient beds in the state, the Council’s consultant considered the following factors relevant: population changes, evolving patterns of inpatient utilization, primary care infrastructure, and target occupancy rate. In addition, Council members noted the impact of the economy and population health status on demand.
3. Using a model that takes the factors from Finding 2 into consideration, the projected number of inpatient staffed hospital beds needed in 2017 ranges from a shortage of 64 over current levels to a surplus of 338, depending on the combination of assumptions. The most likely set of assumptions models an excess of approximately 200 staffed beds.
4. The estimates of current hospital inpatient export (RI residents seeking care out of state) and import (non RI residents seeking care in state) patterns are as follows.
a. Exports: The number of Rhode Island residents discharged from Massachusetts and Connecticut hospitals represents 5.7% of all RI hospital discharges and grew by 248 discharges per year between 2010 and 2011. Since 1997, exports per year have increased by 26%.
b. Imports: The number of discharges from RI hospitals for out of state residents is about 8% of all RI hospital discharges. While these imports have grown by 756 discharges per year since 1997 (8.3% increase), they have fallen by 646 discharges per year from their relative peak in 2008, or 5% annually between 2008 and 2011.
c. Net Migration: Overall, more patients from other states come to Rhode Island for hospital care than Rhode Islanders go to other states for care. However, the gap is narrowing.
5. The savings associated with eliminating excess inpatient capacity for the most likely scenario range from about $12m when only incremental costs are considered to more than $100m when all hospital costs are eliminated.
6. This report makes no formal findings on ways to identify and address the types of excess inpatient capacity but does discuss potential options
7. For certain procedures, there are generally-accepted volume thresholds below which quality is likely to be compromised. For some procedures, some Rhode Island hospitals do not meet these thresholds.
8. Many Rhode Islanders are willing to travel for their hospital care. The extent to which they travel varies by community and service.
9. Inpatient services are only half of a hospital’s operating revenue; the rest comes from outpatient services. Additional study is needed to understand the array of outpatient services that various hospitals provide, how hospital-based outpatient services relate to other outpatient services available in the communities they serve, and past and future trends in these areas.
10. Primary care physician (PCP) supply is higher in Rhode Island than in many other states, with 80 PCPs per 100,000 residents, which is the 8th highest ratio in the nation. However, the optimal rate is unknown.

40
11. Research indicates that the workforce, architecture, and organization of primary care physicians can greatly
influence the demand for other medical services, including inpatient hospital services.
12. In Rhode Island, the potential reduction in hospitalizations (and thus on bed need) from a more integrated primary care delivery system alone may range from 6.2% to 43.9% for a very mature, integrated delivery system
Certificate of Need (CON):
1. CON thresholds for physician /podiatry ambulatory surgery centers shall be a facility in excess of two (2) operating rooms.
2. “Affordability” for a CON shall consider the impact on the per person per year cost of health care in Rhode Island and shall include a comprehensive cost impact analysis as defined in R.I. G.L. 23-15-2(2).
3. Conditions of approval shall be relevant to the specific CON.
4. Provide statutory authority for the Director of Health to fine applicants for non-compliance with CON conditions of approval.
5. Evaluative standards shall be developed by the Department of Health by regulation.
Hospital Conversions Act (HCA):
1. Add to § 23-17.14-8(9), § 23-17.14-11(8): Whether the conversion is consistent with a state health plan or community health needs assessment officially adopted by the Department of Health.
2. Apply the Administrative Procedures Act Standard to both the Departments of Health and Attorney
General’s Office. The resulting language for this section would then read: Any transacting party aggrieved by a final order of the department of health or the attorney general under this chapter may seek judicial review in the superior court in accordance with section 42-35-15.
3. In § 23-17.14-3 of the Hospital Conversions Act, add: Assure the viability of a safe, accessible and
affordable healthcare system that is available to all of the citizens of the state with an emphasis on population health improvement as the overriding objective
4. Expedited review should be limited to in-state non-profit hospitals as the acquiring transacting party
5. Eliminate the requirement that in-state non-profit hospital or hospital systems be financially distressed to
qualify for expedited review. However, if the transacting parties do not qualify as financially distressed, the review timeframe contained in R.I. G.L. 23-17.14-12.1(e) shall be 120 days

41
Appendix C: Rhode Island Inpatient Hospital Service Gap Analysis
The Lewin Group

HEALTHCARE AND HUMAN SERVICES POLICY, RESEARCH, AND CONSULTING―WITH REAL-WORLD PERSPECTIVE.
Rhode Island Coordinated Health Planning Project
Final Report
Prepared for: Rhode Island Coordinated Health Planning Council
February 21, 2013

2
552407
Table of Contents
EXECUTIVE SUMMARY ........................................................................................................................ 1
INTRODUCTION ..................................................................................................................................... 4
Background Trends in Inpatient Utilization and Comparison to Benchmarks ......................... 4 Bed Need Model Results under Various Inpatient Demand Scenarios ..................................... 6 Review of Stakeholder Interviews ................................................................................................. 19 Description of Bed Need Model Methodology ............................................................................ 22 Coordination with the Graham Center ......................................................................................... 46 Analysis of Inpatient Psychiatric Utilization in Rhode Island ................................................... 46 Analysis of Inpatient Discharges Performed in Providence Hospitals .................................... 49
BIBLIOGRAPHY ..................................................................................................................................... 54
APPENDIX A - LIST OF INTERVIEWEES ...................................................................................... A-1
APPENDIX B – INTERVIEW TOOLS .............................................................................................. B-1
APPENDIX C – INTERVIEW RESULTS .......................................................................................... C-1

1
552407
Executive Summary
In September 2012, The Lewin Group was commissioned by the Rhode Island Executive Office of Health and Human Services and the Department of Health to conduct a gap analysis focused on assessing the current health care system’s inpatient capacity, utilization, distribution of services, and the resulting impact on costs. Lewin was also tasked with comparing the results to the population’s future needs accounting for the impact of coverage provisions within the Affordable Care Act (ACA). The project has involved building a Bed Need Model for the state that will be used to provide guidance on the ideal number, location, and type of hospital beds; the model will also aid in estimating the cost of excess capacity.
The purpose of the Bed Need Model is to estimate the potential surplus or deficit of hospital inpatient staffed beds in Rhode Island relative to the estimated future demand for hospital inpatient services, as defined by inpatient days, based on changes in population, demographics and health care trends. For this report, we develop six future demand scenarios based on a range of assumptions around trends in utilization for inpatient care in 2017 (5 year estimate).
From November 2012 to January 2013, interviews with stakeholders and experts in the field were conducted to help inform the assumptions used in projecting future inpatient demand in Rhode Island. The primary data sources used in the model include: Department of Health Hospital Discharge Data for 2008 through 2011, which include inpatient discharges for all Rhode Island hospitals within a fiscal year; population projections produced by The Lewin Group and the Graham Center for each city by demographic group using estimates from the U.S. Bureau of the Census for the state of Rhode Island; and data on available and staffed beds for each Rhode Island hospital provided by the Hospital Association of Rhode Island.
As shown in Figure ES-1, the actual number of inpatient days provided by Rhode Island hospitals in 2010 totaled 679,794, which excludes newborn cases. In September 2012, there were 2,420 staffed beds for all hospitals in the state. Under various inpatient utilization projections and target occupancy rates, we estimate that the number of inpatient beds needed in Rhode Island in 2017 would range from 2,082 to 2,482, depending on the assumptions used. Assuming the current number of staffed beds remains constant through 2017, our highest range projection scenario would result in a shortage of 64 beds. However, all other projection scenarios resulted in an estimated surplus of beds ranging from 79 to 338. The cost of this excess capacity would range from $4.9 million to $21.1 million in 2017, based on the marginal fixed cost of an unoccupied bed.
We provide our Bed Need Model to the state to use as a tool in projecting future inpatient demand and bed need under a range of various assumptions; these assumptions are described in the Methodology section of this report. Figure ES-2 provides a dashboard for the assumptions that we use in the six presented scenarios.

2
552407
Figure ES-1: Summary of Bed Need under Various Projection Assumptions in 2017
Target
Occupancy Rate
Projected Inpatient
Days
Projected Bed Need (Demand)
Current Staffed
Beds 2012
Statewide Shortage/ Surplus of
Beds
Cost of Excess
Capacity (millions)
Bed Demand Projection to 2017 Based on Assumption Driven Trends
Low-Range Estimate
78% (70% Obstetrics)
627,677 2,218 2,420 202 $12.6
High-Range Estimate
78% (70% Obstetrics)
703,332 2,484 2,420 (64) N/A
Bed Demand Projection to 2017 Based on Recent Observed Trends in Usage and Length of Stay
Low-Range Estimate
78% (70% Obstetrics)
589,394 2,082 2,420 338 $21.1
High-Range Estimate
78% (70% Obstetrics)
630,483 2,227 2,420 193 $12.1
Bed Demand Projection to 2017 Based on Recent Trends with Target Occupancy of 74%
Low-Range Estimate
74% (70% Obstetrics)
589,394 2,189 2,420 231 $14.5
High-Range Estimate
74% (70% Obstetrics)
630,483 2,341 2,420 79 $4.9
Figure ES-2: Assumption Dashboard for the Estimates Presented Above
Bed Demand Projection to 2017 Based on Assumption Driven
Trends
Bed Demand Projection to 2017 Based on Recent
Observed Trends in Usage and Length of Stay
Bed Demand Projection to 2017 Based on Recent
Trends with Target Occupancy of 74%
Assumption Low-Range Estimate
High-Range Estimate
Low-Range Estimate
High-Range Estimate
Low-Range Estimate
High-Range Estimate
Population and Demographic Trends
Lewin Projections
Graham Center Projections
Lewin Projections
Graham Center
Projections
Lewin Projections
Graham Center
Projections
Impact of ACA 2.3% Increase 2.3% Increase 2.3%
Increase 2.3%
Increase 2.3%
Increase 2.3%
Increase
Impact of Obesity Prevalence
0.37% annual increase in
hospitalizations
0.82% annual increase in
hospitalizations N/A N/A N/A N/A
Impact of Reduced Readmits
50% reduction in readmissions
by 2017
25% reduction in readmissions
by 2017 N/A N/A N/A N/A
Inpatient to Outpatient Shifts
1.7% annual reduction in
inpatient care moved to outpatient
1.1% annual reduction in
inpatient care moved to outpatient
N/A N/A N/A N/A

3
552407
Bed Demand Projection to 2017 Based on Assumption Driven
Trends
Bed Demand Projection to 2017 Based on Recent Observed Trends in Usage
and Length of Stay
Bed Demand Projection to 2017 Based on Recent
Trends with Target Occupancy of 74%
Assumption Low-Range Estimate
High-Range Estimate
Low-Range Estimate
High-Range Estimate
Low-Range Estimate
High-Range Estimate
Impact of Enhanced Primary Care
N/A N/A N/A N/A N/A N/A
Observation Stays Assumes current
trend of 8.5% annual increase
Assumes current trend of 8.5%
annual increase
Assumes current
trend – 10%
Assumes current
trend + 10%
Assumes current
trend – 10%
Assumes current
trend + 10%
Import Patient Days
Assumes current trend of 3.2%
annual reduction
Assumes current trend of 3.2%
annual reduction
Assumes current
trend – 10%
Assumes current
trend + 10%
Assumes current
trend – 10%
Assumes current
trend + 10%
Export Patient Days
Assumes current trend of 1.2%
annual increase in patients leaving the
state
Assumes current trend of 1.2%
annual increase in patients
leaving the state
Assumes current trend
Assumes 10% of current
patients are retained in
state
Assumes current trend
Assumes 10% of current
patients are retained in
state
Trends in Discharges per 1,000 patients
N/A N/A Current
trend – 10% Current
trend + 10% Current
trend – 10% Current
trend + 10%
Trends in average length of stay
N/A N/A Current
trend – 10% Current
trend + 10% Current
trend – 10% Current
trend + 10%
Target Occupancy Rates
78% (70% for obstetrics)
78% (70% for obstetrics)
78% (70% for obstetrics)
78% (70% for
obstetrics)
74% (70% for
obstetrics)
74% (70% for
obstetrics)

4
552407
Introduction
In September 2012, The Lewin Group was commissioned by the Rhode Island Executive Office of Health and Human Services and the Department of Health to conduct a gap analysis focused on assessing the current health care system’s inpatient capacity, utilization, distribution of services, and the resulting impact on costs. Lewin was also tasked with comparing the results to the population’s future needs accounting for the impact of coverage provisions within the Affordable Care Act (ACA). The project has involved building a Bed Need Model for the state that will be used to provide guidance on the ideal number, location, and type of hospital beds; the model will also aid in estimating the cost of excess capacity.
Preliminary findings were presented on November 5, 2012, in Providence, to provide a framework for future work. Stakeholder interviews were conducted from November 2012 to January 2013. Initial interview themes and their potential impact on the Bed Need Model were presented via video conference on December 19, 2012. A Bed Need Model was then developed based on the preliminary findings, and incorporated input from stakeholder interviews.
In the report to follow, we first provide a background on trends in inpatient utilization and compare these to national and regional benchmarks. We then discuss our Bed Need Model results under a variety of inpatient demand scenarios. Following, we present a review of our stakeholder interview discussions and findings, a description of our Bed Need Model methodology, a narrative of our coordination with the Graham Center, an analysis of inpatient psychiatric utilization in Rhode Island, and an analysis of inpatient discharges performed in Providence hospitals. A bibliography, list of interviewees, list of interview tools, and detailed interview results may be found in the appendices.
Background Trends in Inpatient Utilization and Comparison to Benchmarks
Preliminary findings from our initial analyses focus on comparing the current statewide inpatient bed supply and demand with New England and national benchmarks, and provide a summary of other state policies to manage inpatient bed supply consistent with population demand. The findings are intended to establish a baseline for the bed need model and estimates of future inpatient cost savings. The key finding from these analyses are as follows:
After adjusting for differences in age and sex, Rhode Island discharges were 126 per 1,000 population in 2010, which was lower than the national average of 131 per 1,000 population and the Massachusetts average of 130 per 1,000 population, but higher than the rates of other New England states. After adjusting for age, sex and patient migration status, Rhode Island’s inpatient days in 2010 were 585 per 1,000 population, compared to the US average of 617 per 1,000 population and the Massachusetts rate of 580 per 1,000 population. Inpatient days per 1,000 population in Rhode Island were lower than national benchmarks for most diagnostic categories in 2010 (Figure 1). 1
1 Source: US Census Bureau. State population estimates, Health Care Utilization Project (HCUP) Agency for Health Care Research and Quality (AHRQ) age/sex adjusted; includes only short term acute care hospitals for 2010.

5
552407
Figure 1: Age-Adjusted Days per Thousand by Major Diagnostic Category (2010)
MDC RI US MDC RI US
1 Nervous System 37.39 41.67 13 Female Reproductive System 6.55 6.03
2 Eye 0.47 0.63 14 Pregnancy, Childbirth, and the
Puerperium 37.67 37.60
3 Ear, Nose, Mouth, and Throat 3.85 4.75 16 Blood, Blood Forming Organs,
Immunology 6.78 8.13
4 Respiratory System 68.29 73.48 17 Myeloproliferative, Poorly
Differentiated Neoplasm 5.78 9.10
5 Circulatory 71.67 82.04 18 Infectious and Parasitic Diseases,
Systemic or Unspecified Sites 29.52 34.59
6 Digestive System 59.89 58.69 19 Mental 1/ 51.47 38.83
7 Hepatobiliary System and Pancreas 16.08 20.01 20 Alcohol/Drug Use and Alcohol/Drug
Induced Organic Mental 1/ 8.75 7.42
8 Musculoskeletal System and Connective Tissue
46.96 51.53 21 Injuries Poisonings and Toxic Effects of
Drugs 7.55 8.43
9 Skin, Subcutaneous Tissue, and Breast
15.18 15.44 22 Burns 0.49 1.20
10 Endocrine, Nutritional and Metabolic
13.47 16.75 23 Factors Influencing Health Stat and
Other Contracts with health Services 15.72 23.37
11 Kidney and Urinary Tract 27.17 28.11 24 Multiple Significant Trauma 2.85 2.28
12 Male Reproductive System 2.19 2.00 25 Human Immunodeficiency Virus
Infections 1.18 2.28
1/ Some states do not report discharge data for state psychiatric hospitals, which would under count the total number of psychiatric days provided to patients in the state. Therefore, these states may not be comparable to Rhode Island.
Source: HCUP - Health Care Utilization Project (AHRQ), includes only short term acute care hospitals, 2010, US Bureau of the Census – state population estimates. Rates adjusted for age but not for sex or migration. Normal Newborn and neonatal discharges (MDC 15) are excluded since they are not used in this study.
However, the study also finds that hospital inpatient days per 1,000 patients declined from 665 in 2007 to 592 in 2010—an 11 percent decline over the period. By comparison, a decline of 1.4 percent was observed in other New England states (MA, ME and VT) and a decline of 4.6 percent was observed nationally over the same period. 2 In addition, hospital inpatient staffed beds in Rhode Island increased from 2.24 per 1,000 residents in 2006 to 2.35 per 1,000 residents
Discharges per thousand were multiplied by corresponding RI age and sex groups and then summed across all ages.
2 Days per 1,000 patients were computed using data from the Hospital Cost and Utilization Project (HCUP), which includes only short term acute care hospitals and were adjusted for difference in age and sex across the areas using data from the U.S. Bureau of the Census.

6
552407
in 2010 (a 4.9 percent increase), compared to a slight decline in beds per 1,000 population nationally and in other New England states. 3
Taken together, between 2006 and 2010, these trends resulted in an overall decline in inpatient occupancy rates. During this period, inpatient occupancy rates decreased from 75 percent to 67 percent (Figure 2). This most recent rate is similar to the average occupancy rate in New England, which has stayed relatively stable over the five-year period, but is higher than the national rate of 60 percent, which only fell by 2 percent during the same time period (Centers for Medicare& Medicaid Services, 2006-2010). These differences hold true for two of the three bed types studied. Between 2006 and 2010, occupancy for Medical/Surgical beds declined from 74 percent to 66 percent in Rhode Island, but decreased slightly from 61 percent to 58 percent nationally. Occupancy for intensive care unit/critical care unit (ICU/CCU) and other special care beds decreased from 81 percent in 2006 to 72 percent in 2010 in Rhode Island, while national occupancy decreased from 68 percent in 2006 to 65 percent in 2010. However, occupancy for Psychiatric and Rehabilitation beds in Rhode Island experienced a smaller decline from 73 percent in 2006 to 72 percent in 2010, and actually increased from 66 percent to 67 percent in the US over the same time period.
Figure 2: Trends in Inpatient Occupancy Rates (2007-2011)
Source: Medicare Hospital Cost Report Information System (HCRIS). Includes short term acute care hospitals only and includes medical/surgical beds, ICU, CCU, rehabilitation and psychiatric beds.
Bed Need Model Results under Various Inpatient Demand Scenarios
The Bed Need Model, which is described in detail below, is used to develop inpatient demand estimates based on a range of assumptions about the future trend in hospital inpatient utilization by residents in the state and outside the state. For this report, we produce future bed need estimates for six scenarios in 2017 under various projection assumptions, which are described in detail below. Figure 3 shows projected days, the number of beds that would be needed to provide those days of care, the shortage/surplus compared to 2012 staffed beds, and the cost of excess capacity, if any.
3 American Hospital Association Hospital Statistics; New England states include CT, ME, MA, NH, and VT; Community hospitals based on AHA definition of community based hospitals and exclude hospital based nursing home beds.

7
552407
Figure 3: Summary of Bed Need under Various Projection Assumptions (2017)
Target
Occupancy Rate
Projected Inpatient
Days
Projected Bed Need (Demand)
Current Staffed
Beds 2012
Statewide Shortage/ Surplus of
Beds
Cost of Excess
Capacity (millions)
Bed Demand Projection to 2017 Based on Assumption Driven Trends
Low-Range Estimate
78% (70% Obstetrics)
627,677 2,218 2,420 202 $12.6
High-Range Estimate
78% (70% Obstetrics)
703,332 2,484 2,420 (64) N/A
Bed Demand Projection to 2017 Based on Recent Observed Trends in Usage and Length of Stay
Low-Range Estimate
78% (70% Obstetrics)
589,394 2,082 2,420 338 $21.1
High-Range Estimate
78% (70% Obstetrics)
630,483 2,227 2,420 193 $12.1
Bed Demand Projection to 2017 Based on Recent Trends with Target Occupancy of 74%
Low-Range Estimate
74% (70% Obstetrics)
589,394 2,189 2,420 231 $14.5
High-Range Estimate
74% (70% Obstetrics)
630,483 2,341 2,420 79 $4.9
1/ Low range estimates assume Lewin population and demographic trends; increase in inpatient utilization for adults of 0.37 percent per year due to obesity; 50 percent reduction in hospital readmissions; 1.7 percent per year reduction in days due to shifting services to outpatient setting; continued recent historical trends in out-of-state patient volumes (imports), observation visits and patients leaving the state for inpatient care (exports). Assumes target occupancy rate of 78 percent (70 percent for Obstetrics).
High range estimates assumes Graham population and demographic trends; increase in inpatient utilization for adults of 0.82 percent per year due to obesity; 25 percent reduction in hospital readmissions; 1.1 percent per year reduction in days due to shifting services to outpatient setting; continued recent historical trends in out-of-state patient volumes (imports) and observation visits; 10 percent of and patients leaving the state for inpatient care (exports) are retained in state. Assumes target occupancy rate of 78 percent (70 percent for Obstetrics).
2/ Low-range estimate assumes Graham population and demographic trends; historical annual change in discharges per 1,000 and average length of stay for Rhode Island patients minus 10 percent; historical annual change in import cases and observation visits minus 10 percent. Assumes continued recent historical trends in patients leaving the state for inpatient care (exports). Assumes target occupancy rate of 78 percent (70 percent for Obstetrics).
High-range estimate assumes Lewin population and demographic trends; historical annual change in discharges per 1,000 and average length of stay for Rhode Island patients plus 10 percent; historical annual change in import cases and observation visits plus 10 percent. Assumes 10 percent of and patients leaving the state for inpatient care (exports) are retained in state. Assumes target occupancy rate of 78 percent (70 percent for Obstetrics).
3/ These scenarios use the same assumptions as described in note 2 but assumes target occupancy rate of 74 percent (70 percent for Obstetrics).
4/ Seventy percent is used as a target occupancy rate for obstetrics in order to account for the random versus predictable nature of the utilization of this service.
The first future demand scenario illustrates the low-range assumption for each of the following trend options included in the Bed Need Model:
Lewin population and demographic trends, project a declining overall population but faster rate of growth for population over age 65 than the Graham Center population projections;
Increase in inpatient utilization for adults of 0.37 percent per year due to obesity;

8
552407
50 percent reduction in hospital readmissions;
1.7 percent per year reduction in days due to shifting services to outpatient setting;
Continued recent historical trends in out-of-state patient volumes (Imports);
Continued recent historical trends in observation visits;
Continued recent historical trend in patients leaving the state for inpatient care (exports); and
Impact of enhanced primary care based on a mature Accountable Care Organization (ACO) model, which is estimated by the Graham Center to reduce hospitalizations by 10.5 percent; we assume that some of this reduction is reduced readmissions to total impact is offset by reduced readmissions already accounted for above.
Figure 4 illustrates the impact of each of the various assumptions in the Bed Need Model on inpatient days by type of service in 2017 relative to 2010 actual days.4 The table shows that under a low-range estimate, the demand for inpatient days could decrease by 52,117 days by 2017—a 7.7 percent decrease. We estimate there would be a decline in inpatient utilization for all bed types. However, if the current trend in observation visits continues, then there would be a projected increase in observation days of 14,743.
4 We use 2010 as a base due to hospitals indicating that not all 2011 data had been included in DOH discharge file.

9
552407
Figure 4: Impact of Low-Range Model Assumptions on Inpatient Utilization (Days of Care) Assuming Projections to 20171/
Type of Service Change from
Baseline Med/Surg Obstetrics Pediatrics Pediatric
Psych Adult Psych
ICU Observation Total
Baseline 2010 388,925 38,624 16,239 25,546 93,070 82,281 35,109 679,794
Projection to 2017
Impact of Population (Lewin population growth) 398,869 37,404 15,746 24,693 92,904 84,962 37,021 691,598 1.7%
Impact of ACA 405,239 37,404 16,129 25,506 99,982 86,485 37,021 707,766 2.3%
Impact of Obesity (low prevalence rate increase) 413,680 37,404 16,129 25,506 99,982 88,101 37,021 717,822 1.4%
Impact of Reduced Readmits (50% reduction) 392,496 35,581 15,421 24,274 94,773 83,690 37,021 683,256 -4.8%
Inpatient to Outpatient Shift (high transition rate) 356,915 35,581 14,232 22,203 86,025 76,290 37,021 628,266 -8.0%
Current Observation & Import Patient Trend 350,613 33,913 14,281 20,422 85,574 75,726 49,852 630,380 0.3%
Current Export Patient Trend 347,910 33,913 14,281 20,422 85,574 75,726 49,852 627,677 -0.4%
Impact of Enhanced Primary Care N/A N/A N/A N/A N/A N/A N/A N/A N/A Cumulative Effect -10.5% -12.2% -12.1% -20.1% -8.1% -8.0% 42.0% -7.7%
1/ Low range estimates assume Lewin population and demographic trends; increase in inpatient utilization for adults of 0.37 percent per year due to obesity; 50 percent reduction in hospital readmissions; 1.7 percent per year reduction in days due to shifting services to outpatient setting; continued recent historical trends in out-of-state patient volumes (imports), observation visits and patients leaving the state for inpatient care (exports). Assumes impact of primary care based on mature ACO model (10.5 percent utilization reduction offset by reduced readmission). Assumes target occupancy rate of 78 percent (70 percent for Obstetrics). Seventy percent is used as a target occupancy rate for obstetrics in order to account for the random versus predictable nature of the utilization of this service.

10
552407
Figure 5: Bed Need Based on Patient Residence Compared to Capacity by Service Area Assuming Projections to 2017 (Low-Range Assumption) 1/
Service Area
Med/Surg Obstetrics Pediatrics Pediatric
Psych Adult Psych
ICU Observation Total
Estimated Utilization Based on Service Area of the Patient
Newport 17,825 1,999 469 1,521 4,431 3,792 1,520 31,557
Pawtucket 29,818 3,998 1,370 1,144 8,970 5,765 3,703 54,769
Providence 166,730 17,784 9,354 11,526 43,680 39,867 29,427 318,369
Wakefield 11,988 1,172 252 960 2,927 5,487 3,926 26,712
Warwick 66,058 5,034 1,484 2,628 15,378 11,580 9,157 111,320
Westerly 12,853 994 182 290 1,588 2,248 491 18,646
Woonsocket 42,637 2,931 1,169 2,352 8,599 6,987 1,629 66,304
Specialty n/a n/a n/a n/a n/a n/a n/a n/a
Total 347,910 33,913 14,281 20,422 85,574 75,726 49,852 627,677
Estimated Utilization by Hospital Service Area Based on Current Patient Travel Patterns
Newport 14,181 1,598 119 56 2,955 1,815 1,520 22,244
Pawtucket 21,311 1,046 176 16 400 3,032 3,703 29,684
Providence 215,060 25,924 13,661 726 35,966 57,393 29,427 378,157
Wakefield 11,436 952 62 14 361 4,948 3,926 21,699
Warwick 45,133 2,673 147 13 11,111 3,922 9,157 72,155
Westerly 10,936 756 67 13 175 1,430 491 13,868
Woonsocket 23,533 964 46 0 4,779 3,186 1,629 34,137
Specialty 6,320 0 3 19,583 29,827 0 0 55,732
Total 347,910 33,913 14,281 20,422 85,574 75,726 49,852 627,677
1/ Low range estimates assume Lewin population and demographic trends; increase in inpatient utilization for adults of 0.37 percent per year due to obesity; 50 percent reduction in hospital readmissions; 1.7 percent per year reduction in days due to shifting services to outpatient setting; continued recent historical trends in out-of-state patient volumes (imports), observation visits and patients leaving the state for inpatient care (exports).
Using a target occupancy rate of 78 percent (70 percent for Obstetrics)5, we estimate that hospitals in the state would need 2,099 beds in 2017 to meet the demand estimated in on our low-range assumption (Figure 6). This would include 1,318 medical-surgical beds, which includes observation beds, 126 obstetrics beds, 48 pediatric medical/surgical beds, 68 pediatric psych beds, 286 adult psychiatric beds and 253 ICU beds. Based on data from the hospitals, about 2,420 beds were setup and staffed in September 2012. Comparing the number of needed beds under these assumptions to current capacity shows that there would be a surplus of 321 total beds in 2017, assuming no change in staffed beds over that period.
The bed need estimates presented in Figure 6 illustrate the need based on the population within the hospital service area and do not take into account patient travel patterns or the availability
5 Earlier studies have estimated optimum bed capacity at 74 percent, which was the average hospital occupancy rate prior to the implementation of Medicare PPS. Others have incorporated queuing theory models, where “ideal” occupancy rates increase with lower desired probabilities of having to turn away emergency patients. These models show that a hospital of about 150 beds would have an ideal occupancy rate of 78 percent for the probability of turning away 1 in 1,000 emergency cases.

11
552407
of services that are provided within the service area. Because this analysis presents bed need based on population, the specialty hospitals are included in the Providence service area.
The data suggest that there would be a projected shortage of beds in almost every service area, except Providence, which would have an excess of beds relative to the population need in the service area. However, our observations of the data show that residents will typically travel across the state for inpatient services, primarily to Providence. The Dartmouth Atlas of Health Care designates the entire state of Rhode Island as a single Hospital Referral Region, which means that people will travel across the state for significant procedures and particularly to Providence. Additionally, historically, about 40 to 50 percent of psychiatric patient days within each service area are treated at the specialty hospitals, which are located in Providence.

12
552407
Figure 6: Bed Need Based on Patient Residence Compared to Capacity by Service Area Assuming Projections to 2017 (Low-Range Assumption) 1/
Service Area Med/Surg Obstetrics Pediatrics Pediatric
Psych Adult Psych
ICU Total
Target Occupancy
78% 70% 78% 78% 78% 78%
Estimated Beds Needed Based on Patient Residence
Newport 68 8 2 5 16 13 112
Pawtucket 118 16 5 4 32 20 194
Providence 689 70 33 40 153 140 1,125
Wakefield 56 5 1 3 10 19 94
Warwick 264 20 5 9 54 41 393
Westerly 47 4 1 1 6 8 66
Woonsocket 155 11 4 8 30 25 234
Specialty 0 0 0 0 0 0 0
Total 1,397 133 50 72 301 266 2,218
Current Capacity - Staffed Beds – Based on Hospitals in Service Area
Newport 66 10 2 0 10 10 98
Pawtucket 105 13 12 0 0 17 147
Providence 824 122 72 71 299 210 1,598
Wakefield 60 4 1 0 0 6 71
Warwick 186 22 4 0 12 38 262
Westerly 48 10 0 0 0 6 64
Woonsocket 1372/ 11 0 0 18 14 180
Specialty 0 0 0 0 0 0 0
Total 1,426 192 91 71 339 301 2,420
Estimated Shortage / Surplus Based on Population
Newport -2 2 0 -5 -6 -3 -14
Pawtucket -13 -3 7 -4 -32 -3 -47
Providence 135 52 39 31 146 70 473
Wakefield 4 -1 0 -3 -10 -13 -23
Warwick -78 2 -1 -9 -42 -3 -131
Westerly 1 6 -1 -1 -6 -2 -2
Woonsocket -18 0 -4 -8 -12 -11 -54
Specialty 0 0 0 0 0 0 0
Total 29 59 41 -1 38 35 202
1/ Low range estimates assume Lewin population and demographic trends; increase in inpatient utilization for adults of 0.37 percent per year due to obesity; 50 percent reduction in hospital readmissions; 1.7 percent per year reduction in days due to shifting services to outpatient setting; continued recent historical trends in out-of-state patient volumes (imports), observation visits and patients leaving the state for inpatient care (exports). Assumes target occupancy rate of 78 percent (70 percent for Obstetrics). Seventy percent is used as a target occupancy rate for obstetrics in order to account for the random versus predictable nature of the utilization of this service. 2/Note that 40 of the 137 Med/Surg beds in Woonsocket are acute rehabilitation beds in the Rehabilitation Hospital of Rhode Island
Assuming patients travel across service areas within the state similar to historical patterns of use, then the bed need for each of the service areas would be very different and the bed surplus would be more evenly distributed across service areas. Figure 7 shows the bed need by service

13
552407
area assuming historical travel patterns for each service type. For this analysis, the specialty hospitals (Bradley, Butler and Rehab Hospital of Rhode Island) are separated into their own category.
Figure 7: Bed Need Based on Where Patients are Treated Compared to Capacity by Service Area Assuming Projections to 2017 (Low-Range Assumption) 1/
Service Area Med/Surg Obstetrics Pediatrics Pediatric
Psych Adult Psych
ICU Total
Target Occupancy 2/
78% 70% 78% 78% 78% 78%
Estimated Beds Needed Based on Where Patients are Treated
Newport 55 6 0 0 10 6 79
Pawtucket 88 4 1 0 1 11 105
Providence 859 101 48 3 126 202 1,339
Wakefield 54 4 0 0 1 17 77
Warwick 191 10 1 0 39 14 255
Westerly 40 3 0 0 1 5 49
Woonsocket 88 4 0 0 17 11 120
Specialty 22 0 0 69 105 0 196
Total 1,397 133 50 72 301 266 2,218
Current Capacity - Staffed Beds – Based on Hospitals in Service Area
Newport 66 10 2 0 10 10 98
Pawtucket 105 13 12 0 0 17 147
Providence 824 122 72 0 144 210 1,372
Wakefield 60 4 1 0 0 6 71
Warwick 186 22 4 0 12 38 262
Westerly 48 10 0 0 0 6 64
Woonsocket 97 11 0 0 18 14 140
Specialty 40 0 0 71 155 0 266
Total 1,426 192 91 71 339 301 2,420
Estimated Shortage / Surplus Based on Where Patients are Treated
Newport 11 4 2 0 0 4 19
Pawtucket 17 9 11 0 -1 6 42
Providence -35 21 24 -3 18 8 33
Wakefield 6 0 1 0 -1 -11 -6
Warwick -5 12 3 0 -27 24 7
Westerly 8 7 0 0 -1 1 15
Woonsocket 9 7 0 0 1 3 20
Specialty 18 0 0 2 50 0 70
Total 29 59 41 -1 38 35 202
1/ Low range estimates assume Lewin population and demographic trends; increase in inpatient utilization for adults of 0.37 percent per year due to obesity; 50 percent reduction in hospital readmissions; 1.7 percent per year reduction in days due to shifting services to outpatient setting; continued recent historical trends in out-of-state patient volumes (imports), observation visits and patients leaving the state for inpatient care (exports). Assumes target occupancy rate of 78 percent (70 percent for Obstetrics). Seventy percent is used as a target occupancy rate for obstetrics in order to account for the random versus predictable nature of the utilization of this service.

14
552407
We estimate that the cost of an empty bed in Rhode Island hospitals would be about $62,558, on average, in 2017. Thus, the cost of the excess 321 beds would be about $20.1 million, based on these demand forecast assumptions in 2017 (Figure 8).
Figure 8: Estimated Cost of Excess Bed Capacity in Rhode Island in 2017
(Low-Range Assumption)
Med/Surg Obstetrics Pediatrics Pediatric
Psych Adult Psych
ICU Total
Bed Surplus 29 59 41 -1 38 35 202
Marginal Cost per Empty Bed $57,405 $57,405 $57,405 $64,730 $64,730 $90,998 $62,558
Cost of Excess Capacity $1,657,577 $3,402,367 $2,344,434 -$47,312 $2,487,232 $3,186,231 $12,617,413
Low range estimates assume Lewin population and demographic trends; increase in inpatient utilization for adults of 0.37 percent per year due to obesity; 50 percent reduction in hospital readmissions; 1.7 percent per year reduction in days due to shifting services to outpatient setting; continued recent historical trends in out-of-state patient volumes (imports), observation visits and patients leaving the state for inpatient care (exports). Assumes target occupancy rate of 78 percent (70 percent for Obstetrics). Seventy percent is used as a target occupancy rate for obstetrics in order to account for the random versus predictable nature of the utilization of this service.
Figure 9 illustrates a high-range demand scenario for each of the following trend options in the model and should be viewed as the maximum potential demand outcome:
Graham Center population and demographic trends, which shows increasing overall population and consistent growth rates within age cohort;
Increase in inpatient utilization for adults of 0.82 percent per year due to obesity;
25 percent reduction in hospital readmissions;
1.1 percent per year reduction in days due to shifting services to outpatient setting;
Continued recent historical trends in out-of-state patient volumes (imports);
Continued recent historical trends in observation visits;
Assumes 10 percent of current patients leaving the state for inpatient care (exports) are retained in the state; and
Impact of enhanced primary care based on an increased supply of primary care providers, which is estimated by the Graham Center to reduce hospitalizations by 3.75 percent; we assume that some of this reduction is due to reduced readmissions, so total impact of this assumption is offset by reduced readmissions already accounted for above.
The table shows that under a high-range estimate the demand for inpatient days could increase by 23,538 days by 2017 relative to 2010 utilization or 3.5 percent.

15
552407
Figure 9: Impact of High-Range Model Assumptions on Inpatient Utilization (Days of Care) Assuming Projections to 20171/
Type of Service Change from
Baseline Med/Surg Obstetrics Pediatrics Pediatric
Psych Adult Psych ICU Observation Total
Baseline 2010 388,925 38,624 16,239 25,546 93,070 82,281 35,109 679,794
Projection to 2017
Impact of Population (Graham Center population growth) 413,848 37,188 15,533 24,218 98,348 88,087 37,021 714,244 5.1%
Impact of ACA 421,142 37,188 15,910 25,014 105,844 89,817 37,021 731,934 2.5%
Impact of Obesity (high prevalence rate increase) 440,858 37,188 15,910 25,014 105,844 93,587 37,021 755,421 3.2%
Impact of Reduced Readmits (25% reduction) 429,519 36,282 15,562 24,411 103,078 91,231 37,021 737,104 -2.4%
Inpatient to Outpatient Shift (low transition rate) 403,771 36,282 14,772 23,042 96,799 85,886 37,021 697,573 -5.4%
Current Observation & Import Patient Trend 397,470 34,614 14,821 21,261 96,348 85,322 49,852 699,688 0.3%
10% of Current Export Patients Retained in RI 401,114 34,614 14,821 21,261 96,348 85,322 49,852 703,332 0.5%
Impact of Enhanced Primary Care (Increased PC Supply) N/A N/A N/A N/A N/A N/A N/A N/A N/A Cumulative Effect 3.1% -10.4% -8.7% -16.8% 3.5% 3.7% 42.0% 3.5%
1/ High range estimates assumes Graham population and demographic trends; increase in inpatient utilization for adults of 0.82 percent per year due to obesity; 25 percent reduction in hospital readmissions; 1.1 percent per year reduction in days due to shifting services to outpatient setting; continued recent historical trends in out-of-state patient volumes (imports) and observation visits; 10 percent of and patients leaving the state for inpatient care (exports) are retained in state. Assumes target occupancy rate of 78 percent (70 percent for Obstetrics). Seventy percent is used as a target occupancy rate for obstetrics in order to account for the random versus predictable nature of the utilization of this service.

16
552407
Using the same target occupancy rates as in the low-range scenario above, we estimate that hospitals in the state would need 2,484 beds in 2017 to meet the projected demand based on our high-range assumption (Figure 10). Comparing the number of needed beds to current capacity shows that there would be a shortage of 64 beds in total in 2017.
Figure 10: Impact of High-Range Assumption Model by Service Area Assuming Projections to 2017 1/
Service Area Med/Surg Obstetrics Pediatrics Pediatric
Psych Adult Psych
ICU Total
Target Occupancy 78% 70% 78% 78% 78% 78%
Estimated Shortage / Surplus Based on Population (High-Range Estimate)
Current Bed Supply 1,426 192 91 71 339 301 2,420
Beds Needed 1,584 135 52 75 338 300 2,484
Shortage / Surplus -158 57 39 -4 1 1 -64
1/ High range estimates assumes Graham population and demographic trends; increase in inpatient utilization for adults of 0.82 percent per year due to obesity; 25 percent reduction in hospital readmissions; 1.1 percent per year reduction in days due to shifting services to outpatient setting; continued recent historical trends in out-of-state patient volumes (imports) and observation visits; 10 percent of and patients leaving the state for inpatient care (exports) are retained in state. Assumes target occupancy rate of 78 percent (70 percent for Obstetrics). Seventy percent is used as a target occupancy rate for obstetrics in order to account for the random versus predictable nature of the utilization of this service.
Model Assumptions Based on Recent Usage Rate and Length of Stay Trends
To further test the sensitivity of our model, we forecast inpatient demand in Rhode Island assuming that trends in inpatient discharges per 1,000 population and average lengths of stay observed during the 2008 through 2011 period continue into the near future. Typically, the use of current trends is often a good predictor for short run forecasting. This analysis takes into account recent trends in utilization by service type and by age/sex category; changes in population and demographics; and the impact of expanded health insurance coverage under the ACA beginning in 2014.
Figure 11 illustrates high and low range demand scenarios that adjust the observed historical trends by +/- 10 percent. The historical trend data show declining use rates for most of the service categories, even after controlling for age and sex. Thus, the table shows that even under the high-range estimate that demand for inpatient days could decline by 49,311 days by 2017, relative to 2010 utilization; this equates to a decline of 7.3 percent. Under the low-range scenario, demand for inpatient days could decline by 90,400 days by 2017 relative to 2010 utilization, or 13.3 percent. Under both scenarios, demand for all types of beds, except observation beds, would decline.

17
552407
Figure 11: Impact of Low and High-Range Model Assumptions on Inpatient Utilization (Days of Care) Based on Recent Usage Rate and Length of Stay Trends - Projections to 20171/
Type of Service
Med/Surg Obstetrics Pediatrics Pediatric
Psych Adult Psych
ICU Observation Total
Baseline 2010 388,925 38,624 16,239 25,546 93,070 82,281 35,109 679,794
Projection to 2017
Low Estimate: Trend - 10% 317,641 30,230 14,345 22,986 91,445 64,177 48,569 589,394
High Estimate: Trend + 10% 346,304 31,312 14,032 22,912 95,168 69,620 51,135 630,483
Percent Change from 2010 Baseline
Low Estimate -18.3% -21.7% -11.7% -10.0% -1.7% -22.0% 38.3% -13.3%
High Estimate -11.0% -18.9% -13.6% -10.3% 2.3% -15.4% 45.6% -7.3%
1/ Low-range estimate assumes Graham population and demographic trends; historical annual change in discharges per 1,000 and average length of stay for Rhode Island patients minus 10 percent; historical annual change in import cases and observation visits minus 10 percent. Assumes continued recent historical trends in patients leaving the state for inpatient care (exports). Assumes target occupancy rate of 78 percent (70 percent for Obstetrics).
High-range estimate assumes Lewin population and demographic trends; historical annual change in discharges per 1,000 and average length of stay for Rhode Island patients plus 10 percent; historical annual change in import cases and observation visits plus 10 percent. Assumes 10 percent of and patients leaving the state for inpatient care (exports) are retained in state. Assumes target occupancy rate of 78 percent (70 percent for Obstetrics).
Seventy percent is used as a target occupancy rate for obstetrics in order to account for the random versus predictable nature of the utilization of this service.
Comparing the number of needed beds to current capacity shows that there would be an excess between 193 and 338 beds in total, in 2017 (Figure 12). Under these scenarios, the cost of excess capacity in the system would be between $12.1 and $21.1 million in 2017.

18
552407
Figure 12: Impact of High and Low-Range Bed Need Scenarios Based on Recent Usage Rate and Length of Stay Trends by Service Area Assuming Projections to 2017 1/
Service Area Med/Surg Obstetrics Pediatrics Pediatric
Psych Adult Psych ICU Total
Target Occupancy 2/ 78% 70% 78% 78% 78% 78%
Estimated Shortage/Surplus Based on Population (Low-Range Estimate)
Current Bed Supply 1,426 192 91 71 339 301 2,420
Beds Needed 1,286 118 50 81 321 225 2,082
Shortage/Surplus 140 74 41 -10 18 76 338
Cost of Excess Capacity $8,019,408 $4,229,831 $2,331,433 -$630,420 $1,152,290 $6,877,650 $21,121,861
Estimated Shortage/Surplus Based on Population (High-Range Estimate)
Current Bed Supply 1,426 192 91 71 339 301 2,420
Beds Needed 1,396 123 49 80 334 245 2,227
Shortage/Surplus 30 69 42 -9 5 56 193
Cost of Excess Capacity $1,722,585 $3,986,588 $2,394,629 -$613,476 $305,828 $5,137,906 $12,065,969
1/ Low-range estimate assumes Graham population and demographic trends; historical annual change in discharges per 1,000 and average length of stay for Rhode Island patients minus 10 percent; historical annual change in import cases and observation visits minus 10 percent. Assumes continued recent historical trends in patients leaving the state for inpatient care (exports). Assumes target occupancy rate of 78 percent (70 percent for Obstetrics).
High-range estimate assumes Lewin population and demographic trends; historical annual change in discharges per 1,000 and average length of stay for Rhode Island patients plus 10 percent; historical annual change in import cases and observation visits plus 10 percent. Assumes 10 percent of and patients leaving the state for inpatient care (exports) are retained in state. Assumes target occupancy rate of 78 percent (70 percent for Obstetrics).
2/ Seventy percent is used as a target occupancy rate for obstetrics in order to account for the random versus predictable nature of the utilization of this service.
Model Assumptions Based on Alternative Target Occupancy Rates
The shortage/surplus estimates are very sensitive to the target occupancy rate used. Our review of the literature found that there is no standard for determining what an optimal occupancy rate should be. Standard occupancy rates used by state certificate of need (CON) programs for medium sized hospitals range from 65 and 85 percent and earlier studies on this issue estimated optimum bed capacity at 74 percent, the average hospital occupancy rate prior to Medicare prospective payment systems (PPS).
Our analyses above base a target occupancy rate on a queuing theory model, where the “ideal” occupancy rates increase with lower desired probabilities of having to turn away emergency patients. Using this method yields an ideal occupancy rate of 78 percent for a 150 bed hospital, with a probability of turning away 1 in 1,000 emergency cases. As a benchmark, our preliminary analysis of occupancy rates for Rhode Island hospitals found occupancy rates for acute care hospitals in Rhode Island to be 66 percent for medical-surgical beds (excluding observation days), 72 percent for ICU beds, and 72 percent for psychiatric/rehabilitation beds in 2010.
For illustrative purposes, we calculate the bed shortage/surplus using the same demand forecast assumptions presented in Figures 11 and 12, but assume a target occupancy rate of 74 percent instead of 78 percent (70 percent was still used for obstetric cases). Figure 13 shows that

19
552407
reducing the target occupancy rate from 78 percent to 74 percent can dramatically change the bed shortage/surplus estimates. This table shows that this decision would make a significant difference in the estimate of excess bed capacity in the state.
Figure 13: Impact Changing Target Occupancy Rates under a High and Low-Range Bed Need Scenarios Based on Recent Usage Rate and Length of Stay Trends by Service Area Assuming
Projections to 2017 1/
Service Area Med/Surg Obstetrics Pediatrics Pediatric
Psych Adult Psych ICU Total
Target Occupancy 74% 70% 74% 74% 74% 74%
Estimated Shortage / Surplus Based on Population (Low-Range Estimate)
Current Bed Supply 1,426 192 91 71 339 301 2,420
Beds Needed 1,356 118 53 85 339 238 2,189
Shortage/Surplus 70 74 38 -14 0 63 231
Cost of Excess Capacity $4,028,019 $4,229,831 $2,175,084 -$912,921 $28,436 $5,768,856 $14,480,431
Estimated Shortage / Surplus Based on Population (High-Range Estimate)
Current Bed Supply 1,426 192 91 71 339 301 2,420
Beds Needed 1,471 123 52 85 352 258 2,341
Shortage/Surplus -45 69 39 -14 -13 43 79
Cost of Excess Capacity -$2,609,172 $3,986,588 $2,241,696 -$895,061 -$863,780 $3,935,071 $4,949,360
1/ Low-range estimate assumes Graham population and demographic trends; historical annual change in discharges per 1,000 and average length of stay for Rhode Island patients minus 10 percent; historical annual change in import cases and observation visits minus 10 percent. Assumes continued recent historical trends in patients leaving the state for inpatient care (exports). Assumes target occupancy rate of 74 percent (70 percent for Obstetrics).
High-range estimate assumes Lewin population and demographic trends; historical annual change in discharges per 1,000 and average length of stay for Rhode Island patients plus 10 percent; historical annual change in import cases and observation visits plus 10 percent. Assumes 10 percent of and patients leaving the state for inpatient care (exports) are retained in state. Assumes target occupancy rate of 74 percent (70 percent for Obstetrics).
Seventy percent is used as a target occupancy rate for obstetrics in order to account for the random versus predictable nature of the utilization of this service.
Review of Stakeholder Interviews
A group of Rhode Island stakeholders was identified by project sponsors to provide input on factors to be considered in developing the Bed Need Model. The group of 23 individuals was subdivided into three categories based on their relationship to the health care system; these groups included hospital executives or representatives, payers, and government officials and the public. Please refer to Appendix 1 for a List of Interviewees. Individual interview tools were developed with questions targeted to elicit responses unique to the stakeholder’s area of expertise. Please refer to Appendix 2 for these Interview Tools. Interviews were conducted during from November 2012 to January 2013 via conference calls. The interview tools were used to guide the discussions, which centered around current health care issues in Rhode Island and their potential impact on inpatient bed need in the future. Several common themes emerged from the interviews, identified as factors that influence bed need and future health planning.

20
552407
Initial themes and their potential impact on the Bed Need Model and future health planning was presented to the Health Planning Council on December 19, 2012 via video conference.
Factors that Influence Bed Need
Seven factors were identified during the interview process as having an influence on the Bed Need Model. The first factor was under-utilization of inpatient capacity. Interviewees noted that bed days had decreased significantly over time as inpatient services moved to outpatient settings. Occupancy is declining, while observation days are increasing, but are not counted as inpatient days, leading to differences in reported occupancy rates. Additionally, the patients that are still using inpatient services are much sicker than in the past. Thus, fewer beds are in use, but the case mix has become higher over time. There was general agreement that selective removal of beds in low occupancy settings would not necessarily reduce costs because of the associated overhead costs that cannot be easily eliminated.
The second factor identified as having an impact on inpatient bed need is excess capacity of inpatient beds. Most stakeholders agreed that there is an excess capacity of inpatient beds in Rhode Island hospitals. However, there was some dissension regarding the source of the excess capacity and the services impacted. Many felt that beds were simply maldistributed geographically, while others felt that there were too many beds in Providence and possibly Washington County, but not elsewhere. Opinions varied regarding the adequacy of behavioral health services and associated beds. Many stakeholders expressed a need for the availability of additional outpatient mental health and substance abuse services. Some wanted to see more outpatient services, while others believed that more inpatient psychiatric beds were necessary.
The third factor that stakeholders thought could affect bed need is the concept that the volume of services delivered can affect quality of care. Many people noted that there is a demonstrated link between the volume of certain services provided and the quality of the health care achieved. Stakeholders cited the current fragmentation in the system as prohibiting the scale or volume of services necessary to achieve the best quality and lowest costs for select services. Most interviews included a discussion of whether Centers of Excellence might be an option for the provision of specialized services. The majority of stakeholders agreed that this could be a good solution to reach the volume and scale of services necessary for quality outcomes, but there were differing opinions regarding the need for in-state versus out-of-state options.
The fourth factor that stakeholders suggested for consideration is the idea that “a bed is not a bed is not a bed,” or the need to differentiate between the different types of beds according to the services delivered and the accompanying resource needs of medical/surgical, obstetric, psychiatric, intensive care, and teaching or academic beds. Many people suggested that the Bed Need Model should account for the economic value of research, medical education, and should support a “stand-by” capacity and other medical services required by the state. In addition to type of bed, the level of case-mix or patient acuity ought to be part of the calculation to determine inpatient bed need. Finally, the issue of bed type, or licensed versus staffed beds, was raised by many interview participants. The consensus was that the Bed Need Model should use staffed beds since because it is a more accurate reflection of the actual beds in use in Rhode Island hospitals.

21
552407
The fifth factor that stakeholders anticipate will affect bed need is the evolution of reimbursement models that will be implemented in the future. Many interviewees pointed to the Patient Centered Medical Home pilot program currently ongoing in Rhode Island as an example of a reimbursement model which appears to have reduced inpatient utilization. Other provisions of health reform that may impact utilization are the Medicare readmission reduction program, and incentives for providers to form Accountable Care Organizations (ACOs). Participants felt that moving toward bundled payments, global budgets or capitation may have the effect of “right sizing” inpatient utilization. Certain initiatives that have recently begun, such as the Medicare Pioneer ACOs and moving Medicare-Medicaid enrollees into managed care arrangements will likely impact future inpatient utilization.
The sixth factor, population health and changing demographics, is an overarching theme which will impact all aspects of health service delivery and inpatient bed need in the future. About half of the stakeholders thought that health status in Rhode Island is considered average compared to neighboring states, while others cited specific diseases and conditions that they felt needed additional attention in the future. People noted the impact of an aging population, high rates of cancer, cardiac disease, mental health and substance abuse conditions, increasing incidence of infectious disease and certain illnesses with higher prevalence among populations of lower socioeconomic status, particularly obesity6. In addition, changing demographics in Rhode Island are expected to impact service needs, requiring different types of services delivered in a culturally competent manner. Many people noted transportation challenges as a barrier to accessing care. Public transportation is inadequate in some areas of the state, and Rhode Islanders are traditionally reluctant to travel for health care services. Finally, several interviewees noted that Rhode Island has been disproportionately impacted by the “Great Recession” and that it may be a factor in recent health care utilization trends.
The seventh and final factor to influence inpatient bed supply is the impact of the ACA provisions on utilization of services. Stakeholders were mostly in agreement that the ACA provisions would have a minimal impact on bed need because people who need care are receiving it now, even if they are not insured. Interviewees felt that the ACA will result in more people having health insurance in Rhode Island, which may encourage an initial increase in utilization as people access procedures they previously delayed, but most people thought that there would be a decrease in utilization in the long term as coordination of care initiatives are implemented care settings are shifted.
Factors That Influence Future State Planning
Four other factors that could influence future state health planning efforts also emerged from the interviews. The first factor is a general agreement that population health should be the focus moving forward. Individuals felt that health outcomes could be better in Rhode Island and that there was a need to better target services to new populations brought about by changing demographics. The second factor that most individuals voiced was the need to revise the Certificate of Need (CON) process. Many individuals noted that the process is rigorous and probably deters unwarranted applications, but it does not adequately assess need and almost
6 Ball, K., and D. Crawford. 2005. Socioeconomic Status and Weight Change in Adults: A Review. Social Science & Medicine
60(9): 1987-2010.

22
552407
never denies applications. The current process has likely been eclipsed by changes in the health care system and the pressure of market forces for efficiency. The third factor, raised by many interviewees, is that a comprehensive health plan is necessary to guide future resource allocation decisions. The current state plan has not been updated in 25 years and it is difficult to consider bed need in a vacuum without looking at other factors that have an impact. A statewide plan is necessary to address high costs and poor financial performance in Rhode Island hospitals. Finally, almost all interview participants expect future health planning to be affected by additional mergers of hospitals, clinics and provider groups. Mergers can bring consolidation of services, improved quality and reduced costs for better coordinated services at the best value.
The results of the interviews are summarized and compiled in three separate documents corresponding to stakeholder categories which highlight themes, agreement on the themes within the group, and selected quotes to illustrate the dimensions of the topic. All quotes are anonymous. See Appendix 3 for detailed Interview Results.
Description of Bed Need Model Methodology
The purpose of the Bed Need Model is to estimate the potential surplus or deficit of hospital inpatient staffed beds in Rhode Island. The basic methodology for the model is first to estimate future demand for hospital inpatient services as defined by inpatient days, based on changes in population, demographics and health care trends. Projected inpatient days are divided by 365 days per year to compute an average daily census, which is the average number of occupied beds per day. Average daily census is converted to the optimum number of beds that are required for all hospitals in an area to operate at maximum capacity. The optimum number of beds is then compared to the actual number of staffed beds in the area and the difference yields the bed surplus or deficit.
Population Projections
The population projections produced by the U.S. Bureau of the Census for the state of Rhode Island show that there were about 1.117 million residents in the state in 2010.7 The Census Bureau also estimates that the Rhode Island population will increase to 1.154 million by 2020. These estimates were prepared in 2005 and based on the 2000 Census of the population. The U.S. Bureau of the Census has not produced more recent state-level population projections and does not plan to in the future. The Rhode Island Statewide Planning Program estimates there were 1.074 million people in the state in 2010 which will increase to 1.111 million by 2020 and 1.140 million by 2030.
However, these trends contradict the U.S. Census Bureau’s recent state-level estimates for Rhode Island that shows the population in the state has been declining over the recent years from 1.064 million in 2005 to 1.050 million in 2012. For the Bed Need Model, we create two sets of population projections to examine the sensitivity of the model around population growth and demographic change. The first uses the Graham Center population projections for the state by age and sex that show an increase in the population similar to the Census Bureau and
7 Annual projections based on the 2000 Census of the Population by single year of age and sex, http://www.census.gov/population/projections/data/state/projectionsagesex.html

23
552407
Statewide Planning Program assumption. These data are used in order to be consistent with the Graham Center Primary Care report for the state. The second set of population projections are produced by Lewin using the Census Bureau’s current estimates for the state by age and sex that show a declining population from 2006 to 2012; we then project these trends through 2030. Figure 14 shows the statewide projections under both assumptions. However, neither set of projections include estimates by race or ethnicity.
The U.S. Bureau of the Census does not produce sub-state population projections at the county, city or town level. The Census Bureau does produce current estimates of the population at the county level by various demographic groups. However, only total population estimates are produced for cities and towns. We explored using data from the Rhode Island State Planning Project, which provided total population projection estimates by county, city and town. However, population projections by age, sex, and race are calculated using statewide age, sex, and race distributions. Therefore, the demographic mix for each community is exactly the same, which did not suit the purpose for the model.
Figure 14: Population Projection Scenarios for the State of Rhode Island (2010-2030)
Demographic Group
2010 2015 2020 2025 2030
Graham Center Population Projections (Increasing Population)
Under 18 223,955 214,669 206,587 199,612 190,764
18-44 Male 189,832 185,362 182,814 182,058 176,447
18-44 Female 193,959 187,796 183,653 181,407 174,608
45-64 292,940 333,719 383,174 443,579 500,918
65-74 73,880 75,730 78,922 83,675 86,513
75 & over 78,001 79,937 83,776 90,081 91,884
Total 1,052,567 1,077,213 1,118,926 1,180,413 1,221,134
Lewin Group Population Projections (Decreasing Population) 1/
Under 18 223,955 215,429 216,623 217,184 213,351
18-44 Male 189,832 185,846 182,199 175,905 171,770
18-44 Female 193,959 189,011 185,331 177,344 171,831
45-64 292,940 291,055 274,279 259,787 247,577
65-74 73,880 89,765 104,002 114,931 120,056
75 & over 78,001 75,426 78,929 91,041 106,435
Total 1,052,567 1,046,532 1,041,363 1,036,192 1,031,020
1/ Lewin Group projections using historical trends from U.S. Census Bureau current estimates of the Rhode Island population.
For the Lewin projections, we examine data from the American Community Survey (ACS); this is also conducted by the U.S. Bureau of the Census and is an ongoing statistical survey that samples a small percentage of the population every year and provides detailed information on population within small areas. We use these data to estimate the population by age and sex for

24
552407
each city and town in Rhode Island.8 We then adjust the population counts to match the state-level projections for 2010 by age and sex (Figure 15).
Future population projections are estimated using the annual state-level population change by age and sex, applied to the city and town level estimates for 2010. We then made a second adjustment so that total population equaled the Lewin projected state totals for 2008 through 2030 as shown in Figure 14.
Due to limited detailed demographic information in the population projections that are available, we are not able to include race, ethnicity or insurance coverage status in our population data for the Bed Need Model.
8 Data from the 2007-2011 American Community Survey 5-Year Estimates were used for the analysis.

25
552407
Figure 15: Estimates of 2010 Population by City, Town and Demographic Group in Rhode Island (Lewin Group Projections using Current Census Population Estimates)
Town Under 18 18-44 Female 18-44 Male 45-64 65-74 75 & over Total
Barrington 4,492 2,222 1,963 5,333 1,145 1,241 16,396
Bristol 3,697 4,561 4,174 6,504 1,843 2,303 23,082
Burrillville 3,329 2,574 2,613 5,531 904 999 15,950
Central Falls 5,486 4,102 4,629 3,737 931 1,012 19,897
Charlestown 1,405 1,306 1,148 2,535 989 488 7,871
Coventry 8,034 5,529 5,365 10,866 2,893 2,315 35,002
Cranston 16,432 13,371 15,097 23,410 5,551 6,510 80,371
Cumberland 7,173 5,277 5,836 9,652 2,306 3,048 33,292
East Greenwich 3,381 1,837 1,838 4,294 823 968 13,141
East Providence 9,364 8,204 7,498 13,198 3,958 4,950 47,172
Exeter 1,319 1,104 1,009 2,368 430 286 6,516
Foster 1,031 626 698 1,633 407 185 4,580
Glocester 2,029 1,645 1,497 3,484 653 497 9,805
Hopkinton 1,371 1,273 1,207 3,038 603 672 8,164
Jamestown 1,116 645 563 2,194 547 365 5,430
Johnston 5,756 4,586 4,811 7,939 2,448 3,196 28,736
Lincoln 4,489 3,281 3,388 6,506 1,756 1,663 21,083
Little Compton 686 351 447 1,218 483 323 3,508
Middletown 3,703 2,676 2,542 4,657 1,214 1,398 16,190
Narragansett 2,397 3,061 2,760 5,032 1,364 1,329 15,943
New Shoreham 153 94 126 364 126 92 955
Newport 3,841 5,320 5,551 6,304 2,065 1,547 24,628
North Kingstown 6,343 4,014 4,007 8,614 2,082 1,437 26,497
North Providence 6,025 5,615 5,283 8,978 2,750 3,468 32,119
North Smithfield 2,483 1,840 1,503 3,762 1,086 1,171 11,845
Pawtucket 16,271 13,668 13,304 18,642 4,371 4,890 71,146
Portsmouth 3,710 2,230 2,446 5,848 1,557 1,526 17,317
Providence 41,586 43,925 41,015 35,324 7,535 7,671 177,056
Richmond 1,947 1,286 1,403 2,353 521 164 7,674
Scituate 2,417 1,457 1,482 3,635 820 503 10,314
Smithfield 3,674 4,279 3,859 5,953 1,732 1,914 21,411
South Kingstown 5,773 6,160 5,958 8,256 1,937 2,291 30,375
Tiverton 3,140 2,379 2,279 4,954 1,511 1,445 15,708
Warren 2,037 1,536 1,938 3,384 911 915 10,721
Warwick 15,695 13,760 13,576 25,572 6,489 8,031 83,123
West Greenwich 1,479 1,076 864 2,043 374 185 6,021
West Warwick 5,780 5,251 5,829 8,426 2,005 1,937 29,228
Westerly 4,853 3,661 3,539 6,899 1,992 1,885 22,829
Woonsocket 10,058 8,177 6,787 10,500 2,768 3,181 41,471
State Total 223,955 193,959 189,832 292,940 73,880 78,001 1,052,567
Source: Lewin Group population projections based on the American Community Survey data for 2007-2011 (5-year estimates).
Inpatient Utilization Data
The primary data source for the Bed Need Model is the Rhode Island Department of Health Hospital Discharge Data for 2008 through 2011. These data include inpatient discharges for all Rhode Island hospitals within a fiscal year. The data include discharges for Rhode Island

26
552407
residents as well as patients from outside the state who are accessing Rhode Island hospitals. The inpatient hospital discharge data do not include stays for Rhode Island residents that use inpatient services outside the state. The data do not include discharges for outpatient/observation stays. The discharge data consist of 565,399 discharges over the four-year period and we include discharge data for all acute care hospitals in the state as well as Rehab Hospital of Rhode Island, Butler Hospital and Emma Bradley Hospital.
For the Bed Need Model, we exclude discharges for normal newborns with DRG 795 (34,532 discharges), children under 28 days old (15,987 discharges) and for patients whose age was unknown (17 discharges). We also exclude discharges for Rhode Island patients where the town or city is unknown (4,044 discharges). Thus, the total number of discharges used for the Bed Need Model is 469,651 Rhode Island residents and 41,168 non-residents. Figure 16 shows the total number of days and discharges included in the model.
Figure 16: Discharges, Days, and ALOS used for the Bed Need Model 1/
2008 2009 2010 2011
Sum of Discharges
RI patients 120,693 120,018 113,676 115,264
Out of state patients 10,566 10,510 10,172 9,920
Total 131,259 130,528 123,848 125,184
Sum of Days
RI patients 641,228 624,897 592,364 591,251
Out of state patients 58,475 59,168 52,321 50,561
Total 699,703 684,065 644,685 641,812
Average Length of Stay
RI patients 5.3 5.2 5.2 5.1
Out of state patients 5.5 5.6 5.1 5.1
Total 5.3 5.2 5.2 5.1
1/ Include Rhode Island patients using Rhode Island hospitals, excludes newborns less than 28 days.
We categorize each discharge into service groups based on patient age and DRG (Figure 17). Discharges, total days and ICU/CCU days for Rhode Island patients are summarized by year, service category, age/sex (to match population data) and city/town. We also include race/ethnicity (white, black, Asian, Hispanic and other) and insurance status (self-pay and other) that are not currently used by the model but could be included later if population data that includes these variables become available. Discharges for non-Rhode Island patients are also summarized by year, service group and hospital in order to examine the trend in patient imports for the model.

27
552407
Figure 17: Service Categories used for the Bed Need Model
Service Category Description
Pediatrics All services for patients under age 18, except psychiatrics
Obstetrics Pregnancy, Childbirth, Puerperium (MDC 14)
Cardiology Diseases of the Circulatory System (MDC 5)
Orthopedics Musculoskeletal System and Connective Tissue (MDC 8)
Psychiatrics Mental Disorders and Alcohol/Drug Abuse (MDC 19/20)
Other Medical All other medical DRGs
Other Surgical All other surgical DRGs
Information on outpatient/observation visits from 2009 through 2012 was provided by the Hospital Association of Rhode Island for each acute care hospital in the state. These data show that the number of observation visits increased from 23,540 in 2009 to 29,617 in 2012—a 26 percent increase. Data on the number of observation days were not available, so we assume that the average length of an observation stay is 1.25 days based on a study of Medicare observation visits from 2007 to 2009.9
Recent Trends in Inpatient Utilization
The summarized hospital inpatient discharge data for Rhode Island patients are combined with the Rhode Island population data in order to examine trends in use rates (discharges per 1,000 population) and average length of stay (ALOS). Figure 18 shows the recent trends in discharges per 1,000 population and ALOS from 2008 through 2011 by service group and age/sex.
9 Zhanlian Feng, Brad Wright and Vincent Mor, “Sharp Rise In Medicare Enrollees Being Held In Hospitals For Observation Raises Concerns About Causes And Consequences”, Health Affairs, June 2012.

28
552407
Figure 18: Recent Trends in Discharges per 1,000 Population and ALOS (2008-2011) 1/
Service Group
Demo Group
Discharges per 1000 population
Average Length of Stay
2008 2009 2010 2011 Annual Trend
2008 2009 2010 2011 Annual Trend
Cardiology
18-44 Female 2.1 1.9 1.7 1.7 -7% 3.5 3.9 3.9 3.7 2%
18-44 Male 3.3 3.1 2.8 2.6 -8% 2.8 3.1 3.3 3.1 4%
45-64 18.6 17.4 15.4 14.5 -8% 3.6 3.8 3.8 4.0 4%
65-74 49.6 46.2 41.2 37.9 -9% 4.2 4.2 4.5 4.5 2%
75+ 111.2 102.8 94.0 88.7 -7% 4.8 4.7 4.9 4.8 0%
Obstetrics 18-44 Female 62.1 59.8 58.2 58.5 -2% 3.0 3.1 3.0 3.0 0%
45-64 0.1 0.1 0.0 0.1 7% 5.4 3.2 4.1 3.5 -13%
Orthopedics
18-44 Female 3.3 3.2 3.0 2.7 -7% 3.5 3.7 3.2 3.2 -3%
18-44 Male 4.1 4.4 4.0 4.1 0% 3.8 3.8 3.9 3.9 1%
45-64 11.5 12.0 11.4 12.3 2% 4.1 4.0 4.0 3.8 -3%
65-74 27.0 26.3 25.1 26.8 0% 4.4 4.3 4.3 3.8 -5%
75+ 43.7 42.8 41.5 41.6 -2% 5.4 5.1 5.1 4.9 -3%
Other Medical
18-44 Female 20.3 20.2 18.5 18.4 -3% 3.8 4.0 3.8 3.8 0%
18-44 Male 17.2 18.2 18.2 18.8 3% 4.3 4.2 4.1 4.1 -2%
45-64 46.5 47.1 45.0 46.5 0% 5.1 5.0 5.1 5.0 -1%
65-74 103.2 100.9 97.6 101.6 -1% 5.9 5.5 5.7 5.5 -2%
75+ 226.7 220.7 217.0 226.3 0% 5.8 5.7 5.7 5.6 -1%
Other Surgical
18-44 Female 12.3 12.6 10.5 10.3 -6% 3.7 3.8 3.7 3.6 -1%
18-44 Male 6.3 5.8 5.4 5.1 -6% 7.4 6.7 7.2 7.7 1%
45-64 19.2 19.4 16.9 15.9 -6% 6.4 6.3 6.4 6.3 -1%
65-74 31.9 32.2 28.5 26.6 -6% 7.9 7.7 7.3 7.5 -2%
75+ 38.3 36.9 32.6 30.3 -8% 9.0 8.9 9.1 8.6 -1%
Pediatric Under18 23.4 25.8 21.8 22.4 -1% 3.3 3.1 3.1 3.3 -1%
Psychiatrics
Under18 7.4 7.9 9.5 9.6 9% 12.6 12.6 10.5 10.4 -6%
18-44 Female 15.1 15.2 15.0 15.1 0% 7.5 6.7 6.6 5.9 -8%
18-44 Male 15.7 17.3 17.5 19.6 8% 6.7 6.3 6.0 5.9 -4%
45-64 16.9 17.1 16.7 18.3 3% 8.2 7.7 7.2 7.0 -5%
65-74 8.7 9.2 9.1 9.8 4% 10.7 10.6 10.8 10.4 -1%
75+ 12.4 12.4 12.1 12.0 -1% 10.5 9.7 10.3 10.7 0%
1/ Include Rhode Island patients using Rhode Island hospitals, excludes newborns less than 28 days. Population based on Census Bureau population estimates for Rhode Island.

29
552407
Figure 19 shows the recent trend in inpatient days for non-Rhode Island patients being treated in Rhode Island hospitals. These data represent “imports” and show that the days of care for non-residents using Rhode Island hospitals is declining for most hospitals.
Figure 19: Recent Trends in Inpatient Days for Non-Rhode Island Patients Treated in Rhode Island Hospitals (Imports) 2008-2011 1/
Service 2008 2009 2010 2011 Annual Trend (CAGR)
Emma Bradley Hospital 6,105 6,545 2,945 3,898 -14%
Butler Hospital 2,522 2,818 2,714 2,636 1%
Kent Hospital 1,542 1,411 1,189 1,710 4%
Landmark Medical Center 2,379 2,739 2,516 2,395 0%
Memorial Hospital 2,700 2,352 2,088 2,119 -8%
The Miriam Hospital 5,062 4,606 4,498 3,414 -12%
Newport Hospital 1,082 895 900 593 -18%
Rehabilitation Hospital 1,166 1,132 936 908 -8%
Rhode Island Hospital 19,579 21,488 19,880 20,072 1%
Roger Williams Medical Center 1,400 1,090 1,291 898 -14%
South County Hospital 280 194 236 249 -4%
St. Joseph Health Services 1,482 1,275 1,144 724 -21%
Westerly Hospital 6,192 5,972 5,927 5,399 -4%
Women & Infants Hospital 6,984 6,651 6,057 5,546 -7%
Total 58,475 59,168 52,321 50,561 -5%
1/ Include non-residents using Rhode Island hospitals, excludes normal newborns.
Projecting Future Inpatient Utilization
The Bed Need Model provides a number of options for projecting inpatient utilization for Rhode Island hospitals. The following user options are available:
User Inputs
Projection year (2012-2030) 2017
Population Scenario 2
1. Graham Center Projections (increasing population)
2. Lewin Group Projections (decreasing population)
Projected use rates (discharges per 1,000) 1
1. Status Quo (same as current) 2. Current trend / dampening effect 1.0
Other Factors Influencing Utilization 1. Impact of Obesity 0.0%
2. Reduced Readmissions 0.0%
3. Shift from Inpatient to Outpatient 0.0%

30
552407
User Inputs
Projected Average Length of Stay 1
1. Status Quo (same as current)
2. Current trend / dampening effect 1.0
Projected Observation Visits 1
1. Use most recent utilization
2. Current trend / dampening effect 0.0
Projected Import Patients 1
1. Use most recent utilization 2. Current trend / dampening effect 0.0
Projected Exports 1
1. No change
2. Current trend
3. Assume percent retained in-state 0%
Impact of Enhanced Primary Care 1
1. PCMH (8.1% reduction in hospitalizations)
2. ACO (10.5% reduction based on Wellmed)
3. HRR increase in PC supply (3.75% reduction)
In State Patient Migration Assumption 1
1. Bed need based on patient residence (no travel)
2. Bed need assumes current travel patterns
Target Occupancy Rate
Medical/Surgical 78%
Obstetrics 70%
Pediatrics 78%
Pediatric Psych 78%
Adult Psych 78%
ICU 78%
Projection Year and Scenario: This option selects the year for the projection and is used to determine the future population and demographic distribution by city and town for that year. The population scenario allows for using the two different population trends described above.
Projected use rates: This option allows two selections that are used to adjust the discharges per 1,000 population rate, which is based on the last year of complete historical data (2010).
“Status Quo” option is used to simulate only the effect of changes in the population on inpatient demand. This option does not change the discharges per 1,000 population rates from the last historical year, which assumes there is no change in the inpatient usage rates of residents.
31
552407
“Current Trend” option calculates the trend in usage rates over the four year historical period for each service category and age/sex group using a compound annual growth rate method. The result of this calculation is used to project use rates for the “Projection Year”. This method assumes that the observed historical trend in utilization continues into the future. However, we provide an option for a dampening effect, which limits the impact of the trending function. We recommend this be set between 0.5 and 1.5. For example, if the trending function determines that use rates will decline by 50 percent over the projection period, then a dampening effect of 0.5 will limit that decline to only 25 percent.
Other Factors Influencing Inpatient Utilization: We also provide two additional adjustments to inpatient use rates that account for the impact of increases in the prevalence of obesity over time, the potential reduction in readmission rates and trend of services from inpatient to outpatient.
Obesity: A recent study estimated that the cost of obesity-related illnesses in adults will account for 10.3 percent of national health spending in 2018 as compared to 3.9 percent in 2008 if current trends in obesity prevalence rates continue.10 Based on this analysis, we assume that the increased prevalence of obesity and its impact on health spending will have a proportionate impact on inpatient utilization. Since the prevalence of overweight and obese adults in Rhode Island in 2011 is similar to the national average, (62.5 percent compared to 63.3 percent respectively) 11 it can be anticipated that the current trend in obesity prevalence will increase inpatient utilization for adults by an additional 0.37 percent to 0.82 percent per year. Values in this range can be used for this option in the Bed Need Model to assume an increase in inpatient demand due to obesity-related illnesses.
Readmission Rates: A national study found that all-cause readmissions within 30 days of discharge accounted for 15.4 percent of total inpatient admissions in 2008.12 Another study found that about 70 percent of Medicare readmissions that occur within 30 days of discharge are potentially avoidable. 13 Thus, about 11 percent (15.4 percent * 70 percent) of readmissions could be potentially avoidable. Although these studies did not provide state-specific information, we assume that readmission rates in Rhode Island hospitals are similar to national averages. This assumption is based on Medicare Hospital Compare data on readmission rates for Medicare heart attack, heart failure and pneumonia patients indicating that rates for most Rhode Island hospitals are not statistically different from national benchmarks. Based on these data, this option in the model can be set to measure the impact on future demand assuming that potentially avoidable readmissions are reduced over the projection period. This reduction rate is applied across all types of services since service specific data was not available. We
10 Kenneth Thorpe, “The Future Costs of Obesity: National and State Estimates of the Impact of Obesity on Direct Health care Expenses,” November 2009
11 Kaiser State Health Facts – Health Status Indicators 12 Weir, Barret, Stiener and Jiang, “All-Cause Readmissions by Payer and Age, 2008,” HCUP Statistical Brief #15,
June 2011 13 Jenny Minott, “Reducing Hospital Readmissions,” Academy Health, November 2008.

32
552407
would recommend using values between -5.5 percent and -2.75 percent, which would represent a 25 to 50 percent reduction in potentially avoidable readmissions.
Shift from Inpatient to Outpatient: Through technology advances there has been a steady trend of hospitals services that have been shifting from the inpatient setting to the outpatient setting and assume that this trend will continue. To estimate this trend we looked at hospital gross inpatient revenue as a percent of total from 2006 through 2010 for Community hospitals in Rhode Island and nationally (Figure 20). We used this trend as a proxy for how volume of services has shifted from inpatient to outpatient over this period. We assumed the Rhode Island annual trend (-1.1 percent) and the national trend (-1.7 percent) as a low and high range estimate respectively.
Figure 20: Trend in Hospital Inpatient and Outpatient Gross Revenue Percentage (2006-2010)
2006 2007 2008 2009 2010 Trend (CAGR)
Rhode Island
Inpatient 52.7% 52.3% 52.4% 52.1% 50.4% -1.1%
Outpatient 47.3% 47.7% 47.6% 47.9% 49.6% National
Inpatient 62.2% 61.5% 60.5% 59.0% 58.0% -1.7%
Outpatient 37.8% 38.5% 39.5% 41.0% 42.0%
Source: AHA Hospital Statistics 2012
Projected average length of stay: This option allows two selections that are used to adjust the average length of stay, which is based on the last year of historical data.
“Status Quo” option is used to simulate only the effect of changes in the population on inpatient demand. This option does not change the average length of stay from the last historical year, which assumes there is no change in the length of stay for patients in the state.
“Current Trend” option calculates the trend in length of stay over the four-year historical period for each service category and age/sex group using a compound annual growth rate method, and uses the result of this calculation to project length of stay to the “Projection Year”. This method assumes that the observed historical trend in utilization continues into the future. However, we provide an option for a dampening effect, which limits the impact of the trending function. We recommend this be set between 0.5 and 1.5. For example, if the trending function determines that length of stay will decline by 50 percent over the projection period then a dampening effect of 0.5 will limit that decline to only 25 percent.
Impact of the Affordable Care Act (ACA): The Bed Need Model accounts for the potential increase in hospital inpatient utilization due to the anticipated increase in health insurance coverage for Rhode Island residents beginning in 2014. For this adjustment, we estimate that the percent of Rhode Island residents that are uninsured will decline from 15.2 percent to 6.5 percent once all provisions of the ACA are fully implemented. Using the Rhode Island inpatient

33
552407
discharge data for 2008 to 2011, we calculate discharges per 1,000 population by age and service category for insured and uninsured patients (assuming the self-pay payer category for uninsured patients) as shown in Figure 21. We then recalculate the number of discharges using the estimated insured and uninsured population by demographic group under the ACA. This analysis assumes that newly insured individuals under the ACA will use the same level of inpatient services as currently insured people within the same demographic group. The last column of the table shows the utilization adjustment that will be used in the model, which will be phased in from 2014 to 2016, when full enrollment in the various programs under the ACA will have occurred.
Figure 21: Calculation of Inpatient Utilization Adjustment due to the ACA Beginning in 2014
Service Group Demographic
Group
Discharges/1,000 Population
Number Discharges Utilization Adjustment
Uninsured Insured Baseline ACA
Cardiology
18-44Female 1.0 2.0 359 383 1.0675
18-44Male 2.3 2.9 567 587 1.0345
45-64 11.9 16.4 4,784 4,895 1.0233
Orthopedics
18-44Female 1.1 3.4 598 656 1.0974
18-44Male 2.5 4.3 787 853 1.0837
45-64 3.0 12.6 3,428 3,663 1.0688
Other Medical
18-44Female 12.6 20.3 3,773 3,961 1.0499
18-44Male 15.8 16.8 3,455 3,495 1.0116
45-64 28.9 46.8 13,447 13,886 1.0327
Other Surgical
18-44Female 4.0 12.9 2,232 2,453 1.0994
18-44Male 4.2 5.6 1,083 1,136 1.0492
45-64 7.7 18.6 5,184 5,451 1.0515
Pediatric Under18 6.4 22.8 5,245 5,406 1.0307
Psychiatrics
Under18 1.1 8.5 1,933 2,006 1.0377
18-44Female 3.8 17.4 2,941 3,279 1.1148
18-44Male 5.7 20.3 3,342 3,891 1.1643
45-64 5.8 18.2 5,012 5,317 1.0610
Source: Lewin Group estimates using the Rhode Island Hospital Discharge data 2008-2011.
Projection Method for Rhode Island residents using Rhode Island hospitals: The Bed Need Model uses the population, inpatient utilization and observation visit utilization data described above to project future inpatient demand as measures in days of care based on the various assumptions specified in the “User Input” section of the model. Projecting future days is done as follows:
The model first projects population by city/town and age/sex group to the projection year specified and the population growth scenario selected (increasing or decreasing population);

34
552407
The model uses base 2010 discharges per 1,000 population for Rhode Island patients using Rhode Island hospitals as the base. These rates are calculated using the population growth scenario selected and computed for each city/town, service category and age/sex cell in the model. An adjustment factor is created for each service category and age/sex group beginning with base year 2010 data, which is trended to the projection year based on all the various projection options described above. The base year 2010 discharge per 1,000 population rates for each city/town, service group and age/sex cell is adjusted by the appropriate service group and age/sex adjuster. This provides the future use rates for each cell.
Similarly, the model uses base 2010 ALOS for Rhode Island patients using Rhode Island hospitals as the base. These ALOS values are calculated using inpatient days divided by discharges for each city/town, service category and age/sex cell in the model. An adjustment factor is created for each service category and age/sex group beginning with base year 2010 data, which is trended to the projection year based on the all the various projection options described above. The base year 2010 ALOS values for each city/town, service group and age/sex cell is adjusted by the appropriate service group and age/sex adjuster. This provides the future ALOS values for each cell.
Future demand for Rhode Island patients using Rhode Island hospitals is then calculated for each City/town, service group and age/sex category as:
Projected Population * Trended Discharges/1,000 * Trended ALOS
Projected Observation Visits: The Bed Need Model includes trend data on hospital observation visits provided by the Hospital Association of Rhode Island. However, these are summary data provided for each hospital and not associated with the residence of the patient. Thus, population data is not available to project the potential impact of demographic and population changes on these services. Therefore, the model provides an option that allows two selections that are used to project future observation visits:
“Use Most Recent Utilization” option maintains the same number of observation visits as was reported in the last year of historical data provided.
“Current Trend” option calculates the trend in observation visits over the four-year historical period for each hospital using a least squares method, and uses the result of this calculation to project observation visits to the “Projection Year”. This method assumes that the observed historical trend continues into the future. However, we provide an option for a dampening effect, which limits the impact of the trending function. This can be set between 0.0 and 1.0. For example, if the trending function determines that length of stay will decline by 50 percent over the projection period, then a dampening effect of 0.5 will limit that decline to only 25 percent.
Note that observation visits are provided and not days. Therefore the model converts visits to days using an average length of stay of 1.25 days, as described above.
Projected Import Patients: The Bed Need Model includes trend data on patient discharges, total days and ICU days for non-Rhode Island patients using Rhode Island hospitals by service type

35
552407
and hospital. Since these are not Rhode Island residents, population data is not available to project the potential impact of demographic and population changes on these services. Therefore, the model provides an option that allows two selections that are used to project future import patients:
“Use Most Recent Utilization” option maintains the same number of import patient days as reported in the last year of historical data provided.
“Current Trend” option calculates the trend in days for import patients over the four year historical period for each hospital using a compound annual growth rate method. The result of that calculation is then used to project number of days to the “Projection Year”. This method assumes that the observed historical trend continues into the future. However, we provide an option for a dampening effect, which limits the impact of the trending function. This can be set between 0.0 and 1.0. For example, if the trending function determines that length of stay will decline by 50 percent over the projection period, then a dampening effect of 0.5 will limit that decline to only 25 percent.
Projected Export Days: The Bed Need Model estimates the trend in inpatient days for Rhode Island patients receiving inpatient care in Massachusetts or Connecticut. Summary discharge information for these cases was provided by Lifespan and Care New England. These data show an increase in adult and pediatric cases leaving the state from 6,897 in 2010 to 7,145 in 2011 and represents about five percent of total discharges in the residents in the state.14 The summary data do not provide detail on number of days, type of service and town of the patient. In using these data in the model, we make the following assumptions: the average length of stay was 5.1 days, export discharges are distributed across service areas in proportion to in-state discharges, and all days were categorized as medical-surgical days.
We provide several options for projecting the impact of export patients on future hospital bed need in Rhode Island:
“No Change” option assumes there is no change in the volume of export patients in the future. The model will show zeros for export days indicating no impact on bed need.
“Current Trend” option assumes that the current trend in export patients continues into the future. Although we base this trend on only two years of data, we assume that export cases increase by 3.6 percent annually but assume that average length of stay will decrease by 2.4 percent annually (based on length of stay trends for import patients). Thus, we assume an increase in export patient days of 1.2 percent annually. The model will present the difference between the projected number of days and the total days in 2011 indicating the impact of patients leaving Rhode Island for inpatient care.
“Assume a Percent of Export Patients Retained In-State” option allows for a ‘what if’ scenario that will assume that a specified percent of current 2011 export days will be provided by Rhode Island hospitals. This option can be used to model the impact on bed
14 Discharge data on Rhode Island residents receiving inpatient care outside the state does not include newborns, mental health and substance abuse.

36
552407
need in the state if services by Rhode Island hospitals are expanded or enhanced to attract patients that are currently leaving the state for care.
Projecting ICU days: The Bed Need Model calculates future inpatient demand in days of care as described in the sections above. From the base year 2010 discharge data, we calculated ICU days as a percent of total days for each cell in the model (city/town, demographic group and service category). Projected ICU days were computed as projected total days multiplied by the ICU percentage observed in the 2010 data.
Impact of Enhanced Primary Care: The Graham Center provided us with estimates of the potential impact on inpatient utilization under three different scenarios of enhancing primary care in the state. The first scenario assumes a statewide primary care medical home model (PCMH), which could reduce inpatient hospitalizations by 8.1 percent. The second scenario assumes primary care providers in the state achieve results similar to a mature Accountable Care Organization, which could reduce inpatient utilization by 10.5 percent based on savings estimates from Wellmed ACO in Texas. The third scenario assumes that increasing primary care physician supply in Rhode Island would reduce hospitalizations by 3.5 percent based on Hospital Referral Region variation in hospitalizations using the Dartmouth Atlas of Healthcare data.
However, we assume that much of the reduction in hospitalizations due to enhanced primary care will focus on hospital readmissions. Therefore, this assumption is reduced if it is used in conjunction with the parameter for reduced hospital readmissions (above) in order to eliminating double counting this effect.
In-State Migration Option: The Bed Need Model provides an option for calculating inpatient demand based on the population within each service area or using historical travel patterns of patients.
Bed need based on patient residence (no travel): This option calculates bed need based on the population within the service area. This assumes that patients do not travel outside the service area for inpatient care. The results under this option represent bed need based on the population and historical use rates for people within the service area. Under this option, the three specialty hospitals (Butler, Bradley and Rehab Hospital of Rhode Island) are included in the Providence service area.
Bed need assuming current travel patterns: This option calculates bed need based on historical travel patterns of patients for inpatient care across service areas within the state. Figure 22 shows the percentage of inpatient days for patients residing in a service area versus the hospitals’ service area where the care is actually provided. For example, for all medical-surgical days of care for Newport residents, 65.6 percent of days are provided by the hospital in Newport, 30.9 percent of days are provided by hospitals in Providence and the remainder provided by other hospitals within the state. Under this option, specialty hospitals are categorized as a separate group.

37
552407
Figure 22: In-State Patient Migration from Patient Service Area to Hospital Service Area
Hospital Service Area
Patient Service Area
Newport Pawtucket Providence Wakefield Warwick Westerly Woonsocket Specialty Hospitals
Total
Medical-Surgical Days
Newport 69.4% 0.3% 27.5% 2.1% 0.5% 0.0% 0.1% 0.2% 100.0%
Pawtucket 0.0% 45.7% 52.4% 0.1% 0.4% 0.0% 0.4% 1.0% 100.0%
Providence 0.8% 3.1% 89.3% 0.2% 4.0% 0.0% 1.2% 1.5% 100.0%
Wakefield 1.7% 0.4% 26.5% 59.1% 6.2% 5.8% 0.1% 0.2% 100.0%
Warwick 0.5% 0.4% 36.7% 4.7% 56.8% 0.1% 0.1% 0.6% 100.0%
Westerly 0.7% 0.2% 19.8% 6.1% 2.5% 70.3% 0.1% 0.4% 100.0%
Woonsocket 0.0% 5.4% 38.2% 0.1% 0.7% 0.0% 48.9% 6.7% 100.0%
Obstetrics Days
Newport 70.9% 0.2% 25.9% 1.5% 1.3% 0.1% 0.0% 0.0% 100.0%
Pawtucket 0.1% 14.6% 83.8% 0.0% 1.1% 0.0% 0.4% 0.0% 100.0%
Providence 0.7% 2.1% 92.5% 0.1% 4.1% 0.0% 0.6% 0.0% 100.0%
Wakefield 2.1% 0.4% 34.6% 48.8% 8.5% 5.5% 0.1% 0.0% 100.0%
Warwick 0.9% 0.6% 60.0% 3.9% 34.3% 0.2% 0.1% 0.0% 100.0%
Westerly 0.3% 0.3% 19.5% 15.5% 3.6% 60.9% 0.0% 0.0% 100.0%
Woonsocket 0.0% 1.8% 67.5% 0.1% 2.1% 0.0% 28.5% 0.0% 100.0%
Pediatric Days
Newport 23.0% 0.1% 76.8% 0.1% 0.0% 0.0% 0.0% 0.0% 100.0%
Pawtucket 0.1% 9.0% 90.7% 0.0% 0.2% 0.0% 0.1% 0.0% 100.0%
Providence 0.1% 0.5% 99.0% 0.0% 0.3% 0.0% 0.1% 0.0% 100.0%
Wakefield 0.0% 0.0% 79.7% 17.1% 1.5% 1.7% 0.0% 0.0% 100.0%
Warwick 0.1% 0.2% 91.1% 0.8% 7.8% 0.0% 0.0% 0.0% 100.0%
Westerly 0.0% 0.0% 71.7% 2.8% 0.0% 25.5% 0.0% 0.0% 100.0%
Woonsocket 0.0% 1.4% 94.5% 0.0% 0.2% 0.0% 3.6% 0.2% 100.0%
Pediatric Psych Days
Newport 3.6% 0.0% 2.7% 0.0% 0.0% 0.0% 0.0% 93.7% 100.0%
Pawtucket 0.0% 1.2% 4.0% 0.0% 0.0% 0.0% 0.0% 94.8% 100.0%
Providence 0.0% 0.0% 3.4% 0.0% 0.0% 0.0% 0.0% 96.5% 100.0%
Wakefield 0.0% 0.0% 2.7% 1.0% 0.0% 0.1% 0.0% 96.2% 100.0%
Warwick 0.0% 0.0% 4.0% 0.1% 0.5% 0.0% 0.0% 95.4% 100.0%
Westerly 0.0% 0.0% 2.7% 0.1% 0.0% 4.2% 0.0% 93.1% 100.0%
Woonsocket 0.0% 0.0% 4.2% 0.0% 0.0% 0.0% 0.0% 95.7% 100.0%

38
552407
Hospital Service Area
Patient Service
Area Newport Pawtucket Providence Wakefield Warwick Westerly Woonsocket
Specialty Hospitals
Total
Adult Psychiatric Days
Newport 50.7% 0.0% 14.8% 0.1% 6.4% 0.0% 0.8% 27.2% 100.0%
Pawtucket 0.5% 3.1% 39.7% 0.0% 14.3% 0.0% 3.4% 39.1% 100.0%
Providence 1.0% 0.1% 55.9% 0.0% 10.7% 0.0% 2.0% 30.2% 100.0%
Wakefield 2.7% 0.3% 30.5% 8.0% 9.3% 1.0% 2.3% 45.8% 100.0%
Warwick 0.7% 0.0% 29.7% 0.6% 24.7% 0.0% 1.8% 42.4% 100.0%
Westerly 2.2% 0.0% 39.6% 0.8% 8.2% 6.9% 6.0% 36.2% 100.0%
Woonsocket 0.4% 0.3% 30.9% 0.0% 7.2% 0.0% 35.5% 25.8% 100.0%
ICU Days
Newport 44.3% 0.1% 52.9% 2.5% 0.1% 0.0% 0.2% 0.0% 100.0%
Pawtucket 0.0% 35.3% 63.9% 0.1% 0.3% 0.0% 0.4% 0.0% 100.0%
Providence 0.3% 1.8% 95.7% 0.1% 1.4% 0.0% 0.7% 0.0% 100.0%
Wakefield 0.0% 0.1% 31.3% 64.9% 1.6% 1.9% 0.1% 0.0% 100.0%
Warwick 0.1% 0.3% 61.7% 9.3% 28.1% 0.1% 0.3% 0.0% 100.0%
Westerly 0.1% 0.3% 41.4% 8.4% 1.1% 48.7% 0.0% 0.0% 100.0%
Woonsocket 0.0% 3.7% 57.3% 0.1% 0.4% 0.0% 38.5% 0.0% 100.0%
Source: Lewin Group estimates using the Rhode Island Hospital Discharge data 2008-2011.
Definition of Service Areas Used in the Bed Need Model
As described above, the Bed Need Model calculates inpatient demand (days) for Rhode Island residents using Rhode Island hospitals for each city and town in the state and produces two tables. The first shows the projected days of care for Rhode Island patients using Rhode Island hospitals. Days of care are summarized by city and town for each bed type (Medical-surgical, Obstetrics, Psychiatric and ICU). Total projected days are compared to historical 2010 days to analyze differences.
These data are then summarized by market area, which we have defined as hospital service area. The Dartmouth Atlas of Health Care defines hospital service areas as local health care markets for hospital care. This is a collection of ZIP codes in which residents receive most of their hospitalizations from the hospitals in that area. Rhode Island has six hospital service areas that include Newport, Providence, Woonsocket, Warwick, Wakefield and Westerly (Figure 23 and 24). We map each of the cities and towns in the state into the hospital services areas. Dartmouth also defines hospital referral regions that represent regional health care markets for tertiary medical care that generally requires the services of a major referral center. The entire state of Rhode Island is considered a single hospital referral region. The following lists the hospitals for each service area in the state:
Woonsocket: Rehab Hospital of Rhode Island, Landmark Medical Center
Pawtucket: Memorial Hospital of Rhode Island

39
552407
Providence: Miriam Hospital, Rhode Island Hospital, Roger Williams Medical Center, St. Joseph Health Services, Women and Infants Hospital of Rhode Island, Butler Hospital and Emma Bradley Hospital
Warwick: Kent County Memorial Hospital
Newport: Newport Hospital
Wakefield: South County Hospital
Westerly: Westerly Hospital
Figure 23: Rhode Island Towns by Hospital Service
Service Area Town Service Area Town
Newport Jamestown Pawtucket Central Falls
Little Compton Pawtucket
Middletown Wakefield Charlestown
Newport Exeter
Portsmouth Narragansett
Tiverton Richmond
Providence Barrington South Kingstown
Bristol Warwick Coventry
Cranston North Kingstown
East Greenwich Warwick
East Providence West Greenwich
Foster West Warwick
Glocester Westerly Hopkinton
Johnston New Shoreham
Lincoln Westerly
North Providence Woonsocket Burrillville
Providence Cumberland
Scituate North Smithfield
Smithfield Woonsocket
Warren

40
552407
Figure 24: Hospital Service Areas for Rhode Island (Dartmouth Atlas of Health Care)

41
552407
Determining Target Occupancy Rates
The Bed Need Model calculates future inpatient demand (days) for Rhode Island hospitals by geographic area. In order to determine the number of beds that are needed to meet the projected inpatient demand, the Bed Need Model divides the projected number of inpatient days by 365 days per year to compute an average daily census, which is the average number of occupied beds per day. Average daily census is converted to the optimum number of beds that are required for all hospitals in an area to operate at maximum capacity by dividing by a target occupancy rate that can be specified in the model. For purposes of calculating needed beds, observation days are added to general medical-surgical days prior to converting the number to beds needed.
Our review of the literature finds that there is no standard for determining what an optimal occupancy rate should be. However, commonly cited figures put optimal occupancy rate between 70 and 85 percent. Figure 25 lists standard occupancy rate targets for medical-surgical beds used for CON purposes across states with CON regulations.
Earlier studies have estimated optimum bed capacity at 74 percent, which was the average hospital occupancy rate prior to the implementation of Medicare PPS.15 Others have incorporated queuing theory models, where “ideal” occupancy rates increase with lower desired probabilities of having to turn away emergency patients. These models show that a hospital of about 150 beds would have an ideal occupancy rate of 78 percent for the probability of turning away 1 in 1,000 emergency cases.
15 Keeler, Ying, “Hospital Costs and Excess Bed Capacity: A Statistical Analysis”, The Review of Economics and Statistics, 1996.

42
552407
Figure 25: Standard Annual Occupancy Rate Targets for Medical/Surgical Beds
State Basis for Avg. Annual Occupancy
Rate Target
Avg. Annual Occupancy Rate Target Medical-Surgical Beds for Selected Average Dailey Census Levels 1/
0-49 50-99 100-299 300+
AK Number of Beds 50% 65% 75% 75%
WA Number of Beds 50% 65% 70-75% 80%
KY Number of Beds 60% 60-65% 65-75% 75%
MI Average Daily Census 60-65% 65-71% 71-79% 79-85%
IA No. of Beds & Avg. Daily Census 60-64% 64-73% 73-83% 83%
WV Number of Beds 60-75% 77% 80-82% 85%
SC Number of Beds 65% 65% 65-70% 70-75%
GA Location (non-Rural/Rural) 65-75% 65-75% 65-75% 65-75%
NC Number of Beds 67% 67% 71-75% 75%
OR Location (multi-facility area/isolated) & Avg. Daily Census
68% 68-75% 75-81% 81%
MS Bed Category 70% 70% 70% 70%
MD Average Daily Census 70% 75% 80% 83%
AL Bed Category/No. of Admissions 75-80% 75-80% 75-80% 75-80%
HI Location (Urban/Rural) & No. of Admissions & Number of Beds
75-90% 75-80% 75-80% 85%
NH Bed Category 75-90% 75-90% 75-90% 75-90%
MO Bed Category 80% 80% 80% 80%
NJ New Hospital Only 80% 80% 80% 80%
TN Bed Category 80% 80% 80% 80%
VA Bed Category 80% 80% 80% 80%
IL Number of Beds 80% 80% 85-90% 90%
NY Location (Urban/Rural) 80-85% 80-85% 80-85% 80-85%
DC Bed Category 85% 85% 85% 85%
ME Bed Category 85% 85% 85% 85%
DE Location (County) 85-88% 85-88% 85-88% 85-88%
1/ Occupancy rate targets have been rounded to the nearest whole digit. Source: Survey conducted by Maryland Health Care Commission staff via phone and e-mail.
The Bed Need Model provides an option for specifying target occupancy rates for the various bed types used in the model including medical-surgical beds, obstetrics, pediatric, pediatric psych, adult psychiatric and ICU. The Bed Need Model will use the specified target occupancy rates to determine the number of beds that are required for the projected inpatient demand calculated in the steps above.
As a benchmark, our preliminary analysis of occupancy rates for Rhode Island hospitals indicates an average occupancy rate of 66 percent for medical-surgical beds (excluding observation days), 72 percent for ICU beds and 72 percent for psychiatric/rehabilitation distinct part units in 2010 from the Medicare Hospital Cost Reports. For each bed category, we find

43
552407
Rhode Island hospitals to have higher occupancy rates than national benchmarks by 5 to 8 percentage points.
Current Inpatient Capacity in Rhode Island
Data on staffed beds for each Rhode Island hospital were provided by the Hospital Association of Rhode Island. Figure 26 shows the number of staffed beds for each hospital by type of service at point in time (September 30, 2012). These data are used to determine current inpatient bed supply in Rhode Island by type of bed.
Figure 26: Staffed Inpatient Beds by Type on September, 30 2012
Name Service
Area Staffed Beds
Staffed Beds by Type
Med/Surg Obstetrics Pediatrics Pediatric
Psych Adult Psych
ICU
Memorial Hospital Pawtucket 147 105 13 12 0 0 17
Roger Williams Medical Center
Providence 126 80 0 0 0 36 10
St. Joseph Health Services
Providence 147 86 0 0 0 53 8
Newport Hospital Newport 98 66 10 2 0 10 10
Rhode Island Hospital Providence 685 401 0 72 0 55 157
South County Hospital Wakefield 71 60 4 1 0 0 6
Kent Hospital Warwick 262 186 22 4 0 12 38
Women & Infants Hospital
Providence 167 45 122 0 0 0 0
Landmark Medical Center
Woonsocket 140 97 11 0 0 18 14
The Miriam Hospital Providence 247 212 0 0 0 0 35
Westerly Hospital Westerly 64 48 10 0 0 0 6
Rehabilitation Hospital Woonsocket 40 40 0 0 0 0 0
Butler Hospital Providence 137 0 0 0 11 126 0
Emma Bradley Hospital Providence 60 0 0 0 60 0 0
Kent Beds at Butler 1/ Providence 29 0 0 0 0 29 0
1/ 29 psychiatric beds under Kent Hospital license but physically located at Butler Hospital.
Source: Hospital Association of Rhode Island. Excludes bassinets and excludes NICU beds for Women and Infants Hospital.
Staffed beds are defined as available beds for patients given current staffing in the reporting period. Beds ordinarily occupied for less than 24 hours, such as those in the emergency department, clinic, labor (birthing) rooms (LDRP rooms (labor, delivery recovery, and post-partum) should be included), surgery and recovery rooms and outpatient holding beds, are not included. For the modeling, we use the following definitions for bed types:
Medical/Surgical: Beds on any medical/surgical unit, also thought of as “ward” beds and rehabilitation – beds in a dedicated rehab unit were included in this category;
Obstetrics: Beds in the maternity unit;

44
552407
Pediatrics: ward medical/surgical beds for patients 17 and younger;
Pediatric Psych: Ward beds on a closed/locked psychiatric unit for patients 17 and younger;
Adult Psychiatric: Ward beds on a closed/locked psychiatric unit for patients age 18 and older; and
ICU/CCU: Beds that can support critically ill/injured patients, including ventilator support, and pediatric ICU are combined in this category.
Comparing Projected Inpatient Demand to Current Inpatient Capacity in Rhode Island
As described above, the Bed Need Model calculates future inpatient demand (days) for Rhode Island hospitals by geographic area of the patient based on the projected inpatient days and the specified target occupancy rate. In addition to the estimated beds needed, the model compiles the current supply of staffed hospital beds for all hospitals in the geographic area for each type of bed. These will be presented as staffed beds from the most recent year of available data. The model then computes the difference between current capacity and estimated bed need. A negative number suggests a bed shortage while a positive number shows a surplus.
The analysis of bed need by geographic area is based on the hospital’s service area and does not account for patients traveling across service areas for hospital services. However, as defined by researchers at Dartmouth, hospital referral regions represent regional health care markets for tertiary medical care that generally requires the services of a major referral center. The entire state of Rhode Island is considered a single hospital referral region. Thus, for major procedures, residents have been found to travel across the state and particularly to Providence for these procedures. It may not be unreasonable to consider patients traveling beyond these service areas.
Cost of Excess Capacity
For this analysis, we were asked to estimate the cost of excess hospital inpatient bed capacity in Rhode Island, if an excess in hospitals beds in the state was determined from the analysis. The recent decline in inpatient utilization in Rhode Island hospitals has raised concerns that the costs associated with empty beds represent a potentially wasteful expense. Hospitals with low occupancy rates need to spread their fixed costs across a smaller number of patients which in turn generates higher costs on a per patient basis. However, the health economics literature contains contradictory empirical findings regarding the cost of an empty hospital bed. Empirical studies which account for the endogeneity of reserve capacity produce high estimates of these costs, while earlier studies and industry experts maintain that empty beds are inexpensive. Studies from the 1980’s show mixed results for the cost of an empty bed, which range from $4,250 to $98,630, depending on the cost methodology used.16
In our interviews, stakeholders indicated that patient staffing levels are determined based on patient volumes at a given time and not necessarily determined by the number of available or
16 Anderson, Gaynor, “Hospital Costs and the Cost of Empty Hospital Beds”, NBER working papers, 1991.

45
552407
staffed beds that are provided for various reports. They also indicated that census counts do not accurately capture the number of patients in the hospital during the course of a day due to patient turnover during the day and the census being performed at midnight. Thus, unoccupied beds are not being attended and the actual cost for these unoccupied beds is relatively small.
To test this hypothesis, we collected data from the Medicare Hospital Cost Reports for Rhode Island hospitals for 2010 on total salaries, overhead costs, available beds and number of inpatient days for adult and pediatric medical/surgical units. 17 Salaries per available bed were highly correlated with occupancy rate (0.92). Although differences in occupational mix of staff, patient acuity and other factors could also be drivers, the data suggest that Rhode Island hospitals do attempt to staff appropriately for the patient load that they have and not on the number of available beds reported. Average salary per occupied bed was negatively correlated with occupancy rate, but this association was not as significant.
The data also show that the average overhead cost per occupied bed was negatively correlated with occupancy rate. This suggests that hospitals with low occupancy rates do need to spread their fixed costs across a smaller number of patients, which in turn generates higher costs on a per patient basis and thus creates higher costs in the system. Average overhead cost per available bed was positively correlated with occupancy rate but not to a statistically significant degree which may indicate that overhead costs are set appropriately for the anticipated volume based on the number of available beds set up.
This analysis supports theory from Pauly and Friedman 18 stating in the case of hospitals, fixed capacity is represented by the number of hospital beds. If a bed is anticipated to be unoccupied, then the variable cost associated with the output is avoided. This may include variable nurse staffing costs. However, fixed costs, which vary with the number of available beds, cannot be avoided. In this context, the cost of an empty bed that was anticipated to be unoccupied will be less than that of an unexpectedly empty bed because the variable cost could be avoided in the former scenario. Thus, the cost of an expected empty bed is the fixed cost associated with that bed. Through econometric modeling, Anderson and Gaynor (1991) estimate that the marginal fixed cost associated with an empty bed was equal to about 18 percent of the average total cost per bed.
We estimate total cost per available bed using data from the 2009 and 2010 Medicare Cost Report Data and blend the two years of cost data for all Rhode Island hospitals for medical/surgical beds, ICU and other special care unit beds, and psychiatric beds. We assume a 2.0 percent cost increase from 2009 to 2010 based on Global Insight Market Basket estimates from Q4 2009 to Q3 2010. Using the marginal fixed cost estimate of 18 percent, we estimate that the cost of an empty bed would be 18 percent of the total costs, as shown in Figure 27.
17 Costs are not adjusted for differences in occupational mix of staff, patient acuity and other factors could drive differences in staffing costs across hospitals. Medicare Hospital Cost Reports for 2010. Beds from Worksheet S-3, Part I, Line 1, Column 1; salary costs from Worksheet A, Line 25, Column 1; other direct costs from Worksheet A, Line 25, Column 2, total costs with allocated overhead from Worksheet B, Part I, Line 25, Column 27. Overhead costs were computed as total costs – salary costs – other direct costs. Rhode Island Hospital was excluded because of the higher indirect costs due to supporting standby capacity.
18 Friedman, Bernard and Mark V. Pauly “Cost Functions for a Service Firm with Variable Quality and Stochastic Demand: The Case for Hospitals,” Review of Economics and Statistics, November 1981.

46
552407
Figure 27: Cost for an Empty Bed in 2010
Type of Bed Total Cost per
Staffed Bed
Marginal Fixed Cost per Empty
Bed
Medical/Surgical $261,203 $47,017
ICU and other special care units $414,054 $74,530
Psychiatric $294,533 $53,016
Average $284,648 $51,237
Source: Medicare Hospital Cost Reports for 2010. Source: Medicare Hospital Cost Reports for 2010. Beds from Worksheet S-3, Part I, Lines 1, 6-10, 14, 14.01, Column 1; total costs with allocated overhead from Worksheet B, Part I, Line 25, 26-30, 31, 31.01, Column 27. These data exclude costs for interns and residents in teaching hospitals.
The Bed Need Model will use these estimates to calculate the cost of excess capacity in Rhode Island hospitals based on the results of the Bed Need Model. The model will inflate this amount to the projection year using the Global Insight projected Market Basket Index. The total cost of excess capacity is provided in the last row of the table.
Coordination with the Graham Center
The Robert Graham Center (Graham Center) of the American Academy of Family Physicians is working concurrently with the Rhode Island Coordinated Health Planning Project to provide two gap analyses related to the future capacity of the health delivery system in Rhode Island. The first analysis provides an estimate of the need for primary care service and the current and future availability of primary care providers. The second analysis reviews health care workforce development and estimates future needs.
The Graham Center provided us with estimates of the potential impact on inpatient utilization under three different scenarios of enhancing primary care in the state. The first scenario assumes a statewide primary care medical home model (PCMH), which could reduce inpatient hospitalizations by 8.1 percent. The second scenario assumes primary care providers in the state achieve results similar to a mature Accountable Care Organization, which could reduce inpatient utilization by 10.5 percent based on savings estimates from Wellmed ACO in Texas. The third scenario assumes that increasing primary care physician supply in Rhode Island would reduce hospitalizations by 3.5 percent based on Hospital Referral Region variation in hospitalizations using the Dartmouth Atlas of Healthcare data.
The Graham center also supplied us with population estimates by city/town, age and sex that are used in our model in order to have consistent approaches across the Lewin and Graham Center reports.
Analysis of Inpatient Psychiatric Utilization in Rhode Island
Our preliminary analysis indicates that inpatient mental health and substance abuse utilization in Rhode Island was higher than the national average. However, some states do not report discharge data for their state psychiatric hospitals, so rates may not be comparable to Rhode Island. However, data on the prevalence of mental illness among adults show that Rhode Island

47
552407
had the highest rate of any state at 24.3 percent compared to a national average of 19.7 percent; it has also exhibited the highest rate of adults with serious mental illness (7.2 percent) compared to national average of 4.6 percent. 19
Inpatient discharges for behavioral health (mental health and substance abuse) performed in Rhode Island hospitals grew from 14,968 discharges in 2008 to 16,812 in 2011, or 3.9 percent annually. However, discharges for patients from outside the state grew from 5.6 percent of total cases in 2008 to 6.1 percent in 2011, thus accounting for a larger portion of inpatient behavioral health services (Figure 28).
Figure 28: Analysis of Inpatient Behavioral Health Discharges
in Rhode Island Hospitals (2008-2011)
2008 2009 2010 2011 Annual Trend
In-state Patient Discharges 14,123 14,644 14,888 15,782 3.8%
Out of State Patient Discharges 845 906 937 1,030 6.8%
Total Discharges 14,968 15,550 15,825 16,812 3.9%
Percent out of state 5.6% 5.8% 5.9% 6.1%
Source: Lewin Group analysis of Rhode Island Inpatient Discharge Data 2008-2011
Behavioral health discharges per 1,000 Rhode Island residents increased most quickly for pediatric patients over this period—by 9 percent annually and by 8 percent for adult males age 18 to 44. In 2011, the highest use rates were for males age 18 to 44, followed by adults 45 to 64 (Figure 29). However, the average length of stay for behavioral health inpatient cases dropped significantly for all age groups in the state.
19 State Estimates of Adults with Mental Illness. Rep. Substance Abuse and Mental Health Services Administration: National Survey on Drug Use and Health, 2011. http://oas.samhsa.gov/2k11/078/WEB_SR_078.htm

48
552407
Figure 29: Discharges per 1,000 Population and Average Lengths of Stay Hospitals for Rhode Island Residents Using Rhode Island Hospitals (2008-2011)
Demographic Group
2008 2009 2010 2011 Annual Trend
Discharges per 1,000 population
Under18 7.4 7.9 9.5 9.6 9%
18-44Female 15.1 15.2 15.0 15.1 0%
18-44Male 15.7 17.3 17.5 19.6 8%
45-64 16.9 17.1 16.7 18.3 3%
65-74 8.7 9.2 9.1 9.8 4%
75+ 12.4 12.4 12.1 12.0 -1%
Average Length of Stay
Under18 12.6 12.6 10.5 10.4 -6%
18-44Female 7.5 6.7 6.6 5.9 -8%
18-44Male 6.7 6.3 6.0 5.9 -4%
45-64 8.2 7.7 7.2 7.0 -5%
65-74 10.7 10.6 10.8 10.4 -1%
75+ 10.5 9.7 10.3 10.7 0%
Source: Lewin Group analysis of Rhode Island Inpatient Discharge Data 2008-2011
About 75 percent of all inpatient behavioral health services for Rhode Island patients were primarily provided by Providence hospitals and nearly half of those were provided at the two specialty hospitals (Figure 30). Within each service area, most patients were treated in Providence hospitals with the exception of Newport. Thus, the vast majority of inpatient behavioral health services are performed in Providence hospitals.
Figure 30: Percent of Inpatient Behavioral Health Discharges
by Patient Service Area that were Treated in Providence Hospitals 2008-2011
Patient Service Area
Percent Treated in Providence Hospitals
Percent Treated in Providence
Specialty Hospitals
Newport 41% 29%
Pawtucket 78% 44%
Providence 86% 36%
Wakefield 69% 43%
Warwick 69% 43%
Westerly 64% 35%
Woonsocket 56% 32%
Total 75% 37%
Source: Lewin Group analysis of Rhode Island Inpatient Discharge Data 2008-2011

49
552407
The trend in out-of-state patients using Rhode Island hospitals for behavioral health services grew dramatically over the 2008 to 2011 period, from 835 discharges in 2008 to 1,030 in 2011 (Figure 31). Kent County, Landmark and Rhode Island hospitals experienced double digit annual growth in out of state cases over this period. Similar to the in-state utilization, about 75 percent of all out of state behavioral health cases are treated in Providence hospitals.
Figure 31: Inpatient Behavioral Health Discharges for Out-of-State Patients Treated in Rhode Island Hospitals (2008-2011)
Out of State Discharges
Hospital 2008 2009 2010 2011 CAGR
Bradley 94 112 80 105 4%
Butler 341 367 364 371 3%
Kent County 65 89 98 134 27%
Landmark 29 30 41 65 31%
Memorial 3 5 5 7 33%
Miriam 6 5 14 3 -21%
Newport 45 40 46 32 -11%
Rhode Island 131 112 128 173 10%
Roger Williams 63 59 58 69 3%
South County 1 5 5 3 44%
St Joseph 49 60 78 56 5%
Westerly 18 22 20 12 -13%
Total 845 906 937 1,030 7%
Source: Lewin Group analysis of Rhode Island Inpatient Discharge Data 2008-2011
Rhode Island residents have the highest prevalence rate of mental illness for adults in the country. Analysis of inpatient discharge data show discharges per 1,000 for adult males age 18 to 44 increasing at a rate of 8 percent per year and 3 percent per year for adults age 45 to 64. However, the fastest growing utilization is for children, which grew at 9 percent per year from 2008 to 2011. Although inpatient discharges for behavioral health grew rapidly, average lengths of stay declined.
Rhode Island hospitals also appear to be importing more and more psychiatric patients from out of state. Cases for out of state patients grew from 5.6 percent of total behavioral health cases in 2008 to 6.1 percent by 2011.
Analysis of Inpatient Discharges Performed in Providence Hospitals
In this section, we examine the type and volume of services that are performed in Providence hospitals for Rhode Island residents from outside the Providence service area. This analysis presents the total number of hospital inpatient discharges for Rhode Island residents in each of the 6 service areas in the state excluding Providence. Figures 32 and 34 show the number of discharges in 2010 for Medical DRGs within Major Diagnostics Category (MDC) and for surgical DRGs. Figures 33 and 35 shows the percent of those discharges that were performed in Providence acute care hospitals. The specialty hospitals (Bradley, Butler and Rehab Hospital of Rhode Island) are excluded from this analysis.

50
552407
The data for 2010 show that less than one-third of medical DRGs cases are performed in Providence hospitals with the exception of obstetrics (MDC 14), where 56 percent of cases are performed in Providence hospitals. However, about 55 percent of surgical DRG cases are performed in Providence hospitals. Thus, the primary reason for Rhode Island residents receiving care in Providence is for obstetrics care and surgical procedures, particularly neurology and cardiology.
Figure 32: Number of Inpatient Discharges by Service Area of Patient for Medical DRGs within MDC (2010)
MDC
Total Number of Discharges from Patients Residing in Service Area
Newport Pawtucket Wakefield Warwick Westerly Woonsocket Total Non-Providence
Medical DRGs within MDC
0 Pre-MDC 0 1 0 9 0 1 11
1 Nervous System 275 577 256 1,054 131 580 2,873
2 Eye 9 18 7 17 3 11 65
3 Ear, Nose, Mouth And Throat 28 113 27 154 25 72 419
4 Respiratory System 625 1,124 529 2,396 382 1,367 6,423
5 Circulatory System 567 1,134 566 2,404 389 1,368 6,428
6 Digestive System 425 750 354 1,598 299 895 4,321
7 Hepatobiliary System And Pancreas
129 170 76 353 61 196 985
8 Musculoskeletal System And Connective Tissue
123 212 141 465 87 217 1,245
9 Skin, Subcutaneous Tissue And Breast
94 290 78 497 76 329 1,364
10 Endocrine, Nutritional And Metabolic System
116 318 119 491 72 288 1,404
11 Kidney And Urinary Tract 189 398 204 1,037 172 484 2,484
12 Male Reproductive System 12 15 14 36 1 15 93
13 Female Reproductive System 3 30 9 55 12 18 127
14 Pregnancy, Childbirth And Puerperium
462 1,028 301 1,271 217 799 4,078
15 Newborn And Other Neonates (Perinatal Period)
0 4 1 1 0 1 7
16 Blood and Blood Forming Organs and Immunological Disorders
81 146 59 249 40 169 744
17 Myeloproliferative DDs (Poorly Differentiated Neoplasms)
20 58 10 118 10 58 274
18 Infectious and Parasitic DDs 291 225 212 812 88 328 1,956
19 Mental Diseases and Disorders 880 1,176 422 2,084 248 1,294 6,104
20 Alcohol/Drug Use or Induced Mental Disorders
180 272 123 500 61 243 1,379
21 Injuries, Poison And Toxic Effect of Drugs
73 144 83 260 46 138 744
22 Burns 0 8 5 8 1 7 29
23 Factors Influencing Health Status
111 153 76 468 39 335 1,182
24 Multiple Significant Trauma 8 6 2 16 8 11 51
25 Human Immunodeficiency Virus Infection
7 22 0 4 0 16 49

51
552407
Figure 33: Percent of Inpatient Discharges Performed in Providence Acute Care Hospitals by Service Area of Patient for Medical DRGs within MDC (2010)
MDC
Percent of Discharges for Patients Residing in Service Area that were Treated in Providence Acute Care Hospitals
Newport Pawtucket Wakefield Warwick Westerly Woonsocket Total Non-Providence
Medical DRGs within MDC
0 Pre-MDC 0% 0% 0% 0% 0% 0% 0%
1 Nervous System 35% 51% 38% 42% 44% 60% 47%
2 Eye 67% 67% 71% 65% 0% 45% 60%
3 Ear, Nose, Mouth And Throat
32% 50% 37% 43% 12% 56% 44%
4 Respiratory System 11% 46% 14% 29% 8% 32% 28%
5 Circulatory System 19% 37% 14% 31% 8% 25% 27%
6 Digestive System 21% 49% 11% 39% 7% 38% 34%
7 Hepatobiliary System And Pancreas
15% 48% 21% 35% 11% 26% 30%
8 Musculoskeletal System And Connective Tissue
24% 40% 16% 39% 16% 42% 34%
9 Skin, Subcutaneous Tissue And Breast
14% 54% 13% 38% 17% 40% 38%
10 Endocrine, Nutritional And Metabolic System
23% 39% 20% 41% 11% 39% 35%
11 Kidney And Urinary Tract 17% 53% 12% 34% 9% 35% 32%
12 Male Reproductive System 8% 73% 7% 36% 0% 60% 38%
13 Female Reproductive System
67% 73% 33% 36% 0% 61% 46%
14 Pregnancy, Childbirth And Puerperium
22% 82% 29% 57% 18% 63% 56%
15 Newborn And Other Neonates (Perinatal Period)
0% 75% 100% 0% 0% 100% 71%
16 Blood and Blood Forming Organs and Immunological Disorders
15% 48% 22% 51% 8% 48% 41%
17 Myeloproliferative DDs (Poorly Differentiated Neoplasms)
70% 67% 40% 69% 10% 67% 65%
18 Infectious and Parasitic DDs
13% 65% 13% 29% 9% 36% 29%
19 Mental Diseases and Disorders
9% 37% 25% 25% 28% 23% 25%
20 Alcohol/Drug Use or Induced Mental Disorders
21% 38% 21% 37% 30% 42% 34%
21 Injuries, Poison And Toxic Effect of Drugs
22% 39% 17% 36% 13% 33% 31%
22 Burns 0% 100% 80% 75% 100% 100% 90%
23 Factors Influencing Health Status
9% 24% 11% 13% 10% 13% 14%
24 Multiple Significant Trauma
75% 100% 100% 88% 38% 82% 78%
25 Human Immunodeficiency Virus Infection
71% 68% 0% 50% 0% 31% 55%

52
552407
Figure 34: Number of Inpatient Discharges by Service Area of Patient for Surgical DRGs within MDC (2010)
MDC
Total Number of Discharges from Patients Residing in Service Area
Newport Pawtucket Wakefield Warwick Westerly Woonsocket Total Non-Providence
Surgical DRGs within MDC
0 Pre-MDC 40 93 30 143 31 86 423
1 Nervous System 60 92 77 219 32 116 596
2 Eye 2 2 2 5 0 6 17
3 Ear, Nose, Mouth And Throat 14 25 8 48 6 27 128
4 Respiratory System 36 55 22 109 14 76 312
5 Circulatory System 220 383 224 864 100 620 2,411
6 Digestive System 249 283 214 743 125 307 1,921
7 Hepatobiliary System And Pancreas
75 117 93 201 48 140 674
8 Musculoskeletal System And Connective Tissue
562 594 562 1,907 242 701 4,568
9 Skin, Subcutaneous Tissue And Breast
40 64 45 140 25 61 375
10 Endocrine, Nutritional And Metabolic System
38 81 40 173 21 83 436
11 Kidney And Urinary Tract 52 67 57 255 34 104 569
12 Male Reproductive System 27 31 23 139 19 31 270
13 Female Reproductive System 111 203 132 383 75 212 1,116
14 Pregnancy, Childbirth And Puerperium
257 449 170 660 108 342 1,986
16 Blood and Blood Forming Organs and Immunological Disorders
2 5 3 5 1 4 20
17 Myeloproliferative DDs (Poorly Differentiated Neoplasms)
5 11 5 23 6 12 62
18 Infectious and Parasitic DDs 44 29 24 105 11 47 260
19 Mental Diseases and Disorders 0 6 2 7 0 3 18
21 Injuries, Poison And Toxic Effect of Drugs
15 20 18 58 4 22 137
22 Burns 0 4 0 0 0 0 4
23 Factors Influencing Health Status 6 3 3 14 4 6 36
24 Multiple Significant Trauma 9 8 2 22 3 14 58

53
552407
Figure 35: Percent of Inpatient Discharges Performed in Providence Acute Care Hospitals by Service Area of Patient for Surgical DRGs within MDC (2010)
MDC
Percent of Discharges for Patients Residing in Service Area that were Treated in Providence Acute Care Hospitals
Newport Pawtucket Wakefield Warwick Westerly Woonsocket Total Non-Providence
Surgical DRGs within MDC
0 Pre-MDC 53% 57% 63% 40% 29% 45% 47%
1 Nervous System 87% 89% 74% 68% 78% 79% 77%
2 Eye 50% 100% 0% 100% 0% 83% 76%
3 Ear, Nose, Mouth And Throat 57% 68% 63% 79% 67% 56% 68%
4 Respiratory System 53% 51% 64% 55% 86% 57% 56%
5 Circulatory System 92% 83% 75% 78% 74% 53% 73%
6 Digestive System 26% 64% 18% 52% 17% 60% 45%
7 Hepatobiliary System And Pancreas
23% 52% 12% 41% 10% 40% 35%
8 Musculoskeletal System And Connective Tissue
39% 71% 32% 48% 30% 69% 50%
9 Skin, Subcutaneous Tissue And Breast
58% 61% 31% 61% 32% 69% 56%
10 Endocrine, Nutritional And Metabolic System
84% 75% 73% 77% 29% 84% 76%
11 Kidney And Urinary Tract 42% 81% 33% 43% 24% 68% 50%
12 Male Reproductive System 37% 84% 43% 29% 5% 71% 41%
13 Female Reproductive System 48% 76% 36% 69% 33% 56% 59%
14 Pregnancy, Childbirth And Puerperium
21% 78% 26% 50% 19% 63% 51%
16 Blood and Blood Forming Organs and Immunological Disorders
100% 60% 33% 60% 100% 25% 55%
17 Myeloproliferative DDs (Poorly Differentiated Neoplasms)
80% 91% 60% 61% 50% 83% 71%
18 Infectious and Parasitic DDs 30% 83% 25% 32% 18% 49% 39%
19 Mental Diseases and Disorders 0% 83% 50% 57% 0% 67% 67%
21 Injuries, Poison And Toxic Effect of Drugs
47% 70% 50% 60% 50% 82% 62%
22 Burns 0% 100% 0% 0% 0% 0% 100%
23 Factors Influencing Health Status
50% 67% 67% 29% 25% 33% 39%
24 Multiple Significant Trauma 67% 100% 100% 77% 100% 79% 81%

54
552407
Bibliography
Agency for Healthcare Research and Quality (2007-2010). Health Care Utilization Report.
American Hospital Association (2010). Expense Adjusted Per Discharge.
Centers for Medicare and Medicaid Services (2006-2010). Hospital Cost Report Information System.
CMS (2006-2011). Hospital Compare.
Optum (2006-2010). Almanac of Hospital Financial Indicators.
United States Census Bureau (2007-2011). State Population Estimates.

A-1
552407
Appendix A - List of Interviewees
Peter Andruszkiewicz, President and Chief Executive Officer, Blue Cross Blue Shield of Rhode Island
Tim Babineau, President and CEO, Lifespan (Rhode Island Hospital)
Steve Costantino, Secretary, Rhode Island Executive Office of Health and Human Services
Al Charbonneau, Independent Insurance Professional
Rick Charest, President, Landmark Medical Center, Woonsocket
Mike Dexter, Chief, Office of Health Systems Development, Rhode Island Department of Health
Dr. Michael Fine, Director of Health, Rhode Island Department of Health
Dr. Neil Galinko, Senior Medical Director, United Health Care
Louis R. Giancola, President and CEO, South County Hospital Healthcare System
Herb Gray, Vice President, Rhode Island Business Group on Health
Dennis Keefe, President and CEO, Care New England
Eve Keenan, Chairperson, South County Hospital Healthcare System Board of Trustees
Kate Kennedy, Executive Director, Rhode Island Business Group on Health
Dale Klatzker, PhD, President and Chief Executive Officer, The Providence Center
Dr. Gus Manocchia, Senior Vice President and Chief Medical Officer, Blue Cross Blue Shield of Rhode Island
Mark Montella, Senior Vice President, External Affairs, Lifespan
Elena Nicollela, Medicaid Director, Rhode Island Department of Human Services
Ed Quinlan, President, Hospital Association of Rhode Island
Mike Souza, Senior Vice President, Hospital Association of Rhode Island
Rachel Schwartz, Vice President Strategic Planning and Analysis, Lifespan
Mark Waggoner, Senior Vice President, Network Management, Blue Cross Blue Shield of Rhode Island
Dr. Terrie “Fox” Wetle, Professor, Brown University
Don Williams, Health Care Consultant

B-1
552407
Appendix B – Interview Tools
Rhode Island Coordinated Health Planning Project Interview Protocol
Hospital/Health System CEOs and/or Senior Staff Date:____________________________________
Interviewee Name:____________________________________________________________
Title/Organization:____________________________________________________________
1. How would you characterize the overall health status
of Rhode Island residents?
Relative to surrounding states?
2. What would you consider to be the most important
health problems treated at your facility?
Are any population groups or local communities particularly affected by these problems?
How do these populations or treatments/procedures/diagnoses differ in Rhode Island versus other states you may have experience with?
3. From your experience, how would you describe how well the RI (Certificate of Need) CON program has contributed to “right sizing” the number and mix of inpatient hospital services?
4. Area hospitals have been forming affiliations with each other or seeking to merge with out-of-state hospitals. What is your reaction to these plans?
5. How have mergers and consolidations influenced, if at all, the way inpatient services have been delivered (e.g., reductions in bed capacity)?
If they have, to what extent do you think these changes have influenced access and cost?

B-2
552407
6. What additional hospital organizational changes do you believe are anticipated for the future (e.g., changes in how care is delivered, additional consolidations, and need for individual centers of excellence)?
What are their likely impacts on inpatient bed capacity?
7. How are provisions of ACA likely to influence future demand for inpatient beds (e.g., coverage expansions, payments related to quality, contracting with health plans on the Exchange)?
How are RI hospitals likely to respond to these changes?
8. In your opinion, how would you describe the distribution, including oversupply and undersupply of specific inpatient services, in Rhode Island?
9. In your opinion, is there excess capacity or duplication
of acute care hospital beds in Rhode Island?
If so, which geographic areas and services are most affected?
10. In your view, could meaningful cost savings be achieved through selective inpatient bed reductions in hospitals with low inpatient occupancy rates?
If so, what is the best approach?
11. What other policy/market forces unique to RI should we take into consideration when estimating future statewide inpatient bed need (e.g. state CON requirements)?
12. Do you possess any relevant studies, such as statewide and local bed need analyses, that you can share with us?

B-3
552407
Rhode Island Coordinated Health Planning Project Interview Protocol
Payers Date:_______________________________
Interviewee Name:____________________________________________________________
Title/Organization:____________________________________________________________
1. How would you characterize the overall health
status of Rhode Island residents?
Relative to surrounding states?
2. From a payer perspective, could inpatient service delivery be better/more efficiently organized in Rhode Island?
If so, what is the best approach?
3. Do you anticipate that future hospital mergers and consolidations will result in changes in hospital inpatient service capacity (e.g., reductions in bed capacity, increase in payment rates by changing competition)?
If so, how will these mergers change the dynamics between hospitals and payers in local markets?
4. Is current statewide inpatient hospital capacity adequate or are there gaps in care?
Are there local areas of the state that are over or under bedded?
Are there specific services that are over or under bedded?
Are there related issues that deserve particular attention in this project?
5. In your view, could meaningful cost savings be achieved through selective inpatient bed reductions in hospitals with low inpatient occupancy rates?
If so, what is the best approach?

B-4
552407
6. From a payer perspective how is the implementation of ACA likely to influence future demand for inpatient services?
How are Rhode Island hospitals likely to respond?
7. How do you expect your organization’s contracting to change if you become a participant in the Health Insurance Exchange?
8. What are other current or anticipated policy/market forces unique to Rhode Island that we should take into consideration when developing our inpatient bed need analysis (e.g. state CON requirements, additional merger activity, etc.)?

B-5
552407
Rhode Island Coordinated Health Planning Project Interview Protocol
Public Health/Government Date:____________________________________
Interviewee Name:____________________________________________________________
Title/Organization:____________________________________________________________
1. How would you characterize the overall health status of Rhode Island residents?
Relative to surrounding states?
2. What would you consider to be Rhode Island’s most
important health problems?
Are any population groups or Rhode Island communities particularly affected by these problems?
3. Has a community health needs assessment been completed recently in Rhode Island?
If so, what were the assessment's key findings?
4. In your view, have hospitals and other health care providers in the community taken an active role in addressing community health needs?
If so, how?
If not, what actions should providers consider taking?
5. From your perspective, how could inpatient service delivery be better or more efficiently organized in Rhode Island?
6. In your view, is there excess capacity or duplication of acute care hospital beds in Rhode Island?
If so, which geographic areas and services are most affected?

B-6
552407
7. In your view, could meaningful cost savings be achieved through inpatient bed reductions?
If so, what is the best approach?
8. Are there specific inpatient services that are not
adequately provided in Rhode Island?
Are there geographic areas within RI with an under or over supply of beds?
9. Area hospitals have been forming affiliations with each other hospitals or seeking to merge with out-of-state hospitals. What is your reaction to these plans?
10. Have mergers and consolidations resulted in changes in how inpatient services have been delivered (e.g., reductions in bed capacity)?
If so, to what extent have these changes influenced access and cost?
11. What additional hospital organizational changes are anticipated for the future (e.g., pending mergers, closures)?
What are their likely impacts on inpatient bed capacity?
12. How are provisions of ACA likely to influence future demand for inpatient beds (e.g., coverage expansions)?
How are RI hospitals likely to respond?
13. Are there any other policy/market forces unique to RI that we should take into consideration when estimating future statewide inpatient bed need (e.g. state CON requirements)?

C-1
552407
Appendix C – Interview results
Hospital Stakeholders – Detailed Responses
1. How would you characterize the overall health status of Rhode Island residents?
Relative to surrounding states?
High
Cancer
High Cardiac Disease
High Mental Health
High Infectious
Disease
High Age related co-morbidities
High poverty related
illnesses
High Substance
Abuse
Obesity/Type II
diabetes
Indicators typical
Interviewee 1 x x x x x
Interviewee 2 x
Interviewee 3 x x x
Interviewee 4 x x x x x
Interviewee 5 x
Interviewee 6
Interviewee 7 x
Comments:
Rural and urban areas have different problems. Large elderly population, lots of cancer. High incidence of cancer and other diseases from from previous exposure to textile mills and metals. Access is a key issue, many transportation barriers. Inventory of health measures shows a lot of cancer but lower mortality due to good screening programs. High mental health services use rates due to decreased stigma in accessing services. Mental health beds always full, need more especially geriatric psychiatric beds. Many poor, undocumented people accessing care, doesn’t show up on radar, have complex conditions. Anecdotally, 50% of ambulance runs are for behavioral health issues. Premature births an issue related to poverty. DOH needs assessment will look at health status.

C-2
552407
Need to look at health disparities by ethnicity. Infant mortality for Latinos much higher. Need to focus on cultural competency and tailoring programs for specific cultures. Rhode Island has one of the highest ambulatory sensitive rates in the region, services that could be outpatient wind up being inpatient. Value for investment of dollars is poor. Should be getting better care for all the money in the system. Lots of redundancy, silos, uncoordinated care. Other states do better because they do a better job of focusing resources.

C-3
552407
2. What would you consider to be the most important health problems treated at your facility?
Are any population groups or local communities particularly affected by these problems?
How do these populations or treatments/procedures/diagnoses differ in Rhode Island versus other states you may have experience with?
Infectious
Disease/Pneumonia Mental health
Alcohol Abuse
Cancer Congestive Heart Failure/Cardiac
disease Poverty related
Interviewee 1 x x x
Interviewee 2 x
Interviewee 3 x
Interviewee 4 x x x
Interviewee 5 x x
Interviewee 6
Interviewee 7 x x
Comments: 5th highest population over 65 years of age, 1st highest population over 85 years of age. Hispanic population doubled in 10 years. Disparities across state, between urban and rural areas. Size of Rhode Island makes it a regional marketplace. Alcohol abuse especially prevalent in elderly. Congestive heart failure expensive and difficult to manage. Fairly typical diseases of aged population. No correlation between age and disease status. Population has aged but discharges have dropped. Many new treatments such as statins for cardiology drive inpatient discharges down. Behavioral health issues (mental health and substance abuse) are instrumental in health care delivery system. Lack of treatment with other conditions causes overutilization of beds. Need more integrated whole person approach. If we treated behavioral health issues, we wouldn’t need more inpatient beds.

C-4
552407
3. From your experience, how would you describe how well the RI (Certificate of Need) CON program has contributed to “right sizing” the number and mix of inpatient hospital services?
Doesn’t deny
anything
Contributes to duplication/proliferation
of outpatient facilities
Is rigorous, thorough review.
Requirements of process deter applications,
decreasing denials.
Decisions are political
Interviewee 1 x x
Interviewee 2 x x
Interviewee 3 x x x
Interviewee 4 x x x x
Interviewee 5 x x
Interviewee 6 x
Interviewee 7 x
Comments: No planning process to determine need. Nothing gets denied, not useful process, not effective. Has allowed large growth in outpatient centers, hospitals lose profitable patients. Outpatient settings not required to take all payers like hospitals, are big revenue generators. Process does do thorough review. Based on community need but no definition of “community.” RI population is not mobile, not well educated (to choose healthcare options.) Process had done a good job of control tertiary services. Rigor of process is a deterrent to unworthy proposals, there are a lot of withdrawals when it becomes apparent application won’t be successful. Rules are different for inpatient and outpatient services. Constrained growth of beds and deters bad proposals. CON process wasn’t designed to “right size” Is a blunt instrument. Hasn’t addressed changing capacity, models of care or access to capital. Assessment of need is driven by applicant not master plan, data or patterns of behavior and norms.

C-5
552407
4. Area hospitals have been forming affiliations with each other or seeking to merge with out-of-state hospitals. What is your reaction to these plans?
For-profits come for market
share, increases leverage Independents can’t survive
payment disparities
New payment models and incentives will force
consolidation
Interviewee 1 x
Interviewee 2 x
Interviewee 3 x x
Interviewee 4 x
Interviewee 5 x
Interviewee 6 x
Interviewee 7 x
Comments: Payment disparities are from private payers. Mergers okay if they improve efficiency and quality of care. Hard to close a hospital, have huge community support. Many hospitals not profitable, 6 of 11 have lost money in the past 4 years. No re-investment without partners. EHRs are huge cost, can’t finance beginnings of new systems in order to seek EHR implementation incentives. Market will change the way hospitals think about delivering care. Hospitals will be incented to join systems, expect more mergers. Don’t need out of state access to services that are available in Rhode Island. If you believe that health care can be better delivered in a system, than it makes sense. Don’t like for profit model because it takes money out of the system that should be put back in for improvements. If mergers result in better quality, outcomes and lower price, that’s good. If they result in monopoly and price increases, that’s bad and that’s what has happened in Rhode Island.

C-6
552407
5. How have mergers and consolidations influenced, if at all, the way inpatient services have been delivered (e.g., reductions in bed capacity)?
If they have, to what extent do you think these changes have influenced access and cost?
No influence Increased costs Duplication of services Consolidation of services
Interviewee 1 x
Interviewee 2 x x(beginning)
Interviewee 3 x
Interviewee 4 x x x(beginning)
Interviewee 5 x
Interviewee 6 x x ( beginning)
Interviewee 7 x (beginning)
Comments: Slow to make consolidation of services. Quality should be measured on same metrics. Not improved quality or efficiency of delivery system. Not used capabilities to increase community based care. No incentive to manage teamwork, no systemization. Some consolidation beginning now. Community hospitals don’t have to provide all services, shouldn’t duplicate. Rhode Island should look at more free-standing facilities to meet needs such as emergency departments, endoscopy, other ambulatory care. Larger hospitals will provide more care integration and coordination of service lines. Keep affiliations in state for cooperation, coordination. Rhode Island is a declining market, as people make choices about where to go, there are impacts on capacity, costs go up and are untenable at 40-50% There is a relationship between volume and fixed costs. Now systems are trying to be more coordinated. Lack of willingness to travel drives standalone operations. Mergers haven’t done anything but enhance the ability of organizations to leverage higher rates.

C-7
552407
6. What additional hospital organizational changes do you believe are anticipated for the future (e.g., changes in how care is delivered, additional consolidations, and need for individual centers of excellence)?
What are their likely impacts on inpatient bed capacity?
Smaller hospitals
unable to compete More mergers
pending More observation
days
Less inpatient more outpatient services
(reduced beds)
Consolidation into natural Centers of
Excellence
Interviewee 1 x
Interviewee 2 x
Interviewee 3 x x
Interviewee 4 x x x
Interviewee 5 x x x
Interviewee 6
Interviewee 7 x
Comments: If large organizations are allowed to get larger, community hospitals won’t be able to compete. Lack of competition breeds complacency. Beneficial to publicize quality data. Centers of Excellence good idea unless everybody has one. Rapid change in ownership of hospitals. Will transition away from inpatient care until it drops dramatically. More care moved to observation days. More care in outpatient facilities now. Will have excess beds. New payment mechanisms will incentivize patient focus and quality. Natural centers of excellence seem to be Women and Infants for OB/GYN, Lifespan for open heart, Mariam/Rhode Island for interventional cardiology, Land Mark for emergency cardiology intervention. Possible consolidation of OB beds, currently 5 hospitals offer services. Two hospitals in financial distress currently, notion of bed need hasn’t come up, no political will to raise issue. Statewide study indicates that PCMH reduces bed days and keeps people out of ED. Payment incentives engage everyone to be efficient. What is role of community hospital in the future? If financial incentives change to incent wellness we will see closure of some beds and redistribution of resources to community health, primary care and medical homes.
C-8
552407
7. How are provisions of ACA likely to influence future demand for inpatient beds (e.g., coverage expansions, payments related to quality, contracting with health plans on the Exchange)?
How are RI hospitals likely to respond to these changes?
Minimal, most people
getting care now
Utilization may increase slightly
initially
Greater emphasis on quality
Payment models will reduce utilization
New payment mechanisms will add risk. Hospitals will be
cautious
Interviewee 1 x x
Interviewee 2 x x
Interviewee 3 x x
Interviewee 4 x x x x
Interviewee 5 x x x
Interviewee 6 x
Interviewee 7 x
Comments: Most people getting care now, maybe additional elective services. Shouldn’t need to increase beds, need to manage surges. Need to manage risk to adopt PCMH and ACOs. Long way to go to adopt new payment systems and collaboration. Don’t really know how ACA will impact beds. All hospitals currently receive DSH payments, those are eliminated under ACA. Aging population will impact need, but maybe not more beds. Need to get control of chronic diseases. How will health insurance exchange offerings impact payment? Movement to risk based payment will cause more careful use of resources. Medicare ACOs, bundled payments will reduce utilization; private insurers will follow with new payment mechanisms. Assault on readmission rates will reduce utilization. Unknown how ACA will impact Rhode Island. ED use increased in Massachusetts. Have to offset with forces to keep patients out of hospitals. Will increase demand for services, especially from currently underserved populations. Need to transform system to treat more people in least settings.

C-9
552407
8. In your opinion, how would you describe the distribution, including oversupply and undersupply of specific inpatient services, in Rhode Island?
Mal-distribution
of beds Oversupply of
everything Undersupply of psychiatric beds
Consider open or staffed beds, not
licensed
Don’t know, need data
Interviewee 1 x x x
Interviewee 2 x
Interviewee 3 x
Interviewee 4 x x
Interviewee 5 x x
Interviewee 6 x
Interviewee 7 x
Comments: Beds concentrated in Providence and inner cities, compete with community hospitals. Lack of transportation limits access. People unwilling or unable to travel. No proliferation of tertiary beds. More than necessary in Providence. No incentive to distribute beds in efficient manner. Hospitals will continue to operate as they always have. Doing little bits of everything everywhere doesn’t work. Need volume and higher occupancy. Services need to be aggregated. Rhode Island has an oversupply of everything, including psychiatric beds. Need investment to keep people from inpatient bed, put resources elsewhere.

C-10
552407
9. In your opinion, is there excess capacity or duplication of acute care hospital beds in Rhode Island?
If so, which geographic areas and services are most affected?
Yes, excess capacity Not distributed properly Average compared to nation
Interviewee 1 x x
Interviewee 2 x
Interviewee 3 x
Interviewee 4 x
Interviewee 5 x x
Interviewee 6 x
Interviewee 7 x
Comments: What is definition of excess? Rhode Island hospital occupancy is around 60%, same as nation. Too many beds in some areas, not enough in others. Currently have several initiatives to reduce utilization. Should manage to demand of care, redistribute beds. Consider staffed beds, not just licensed. Need to deploy resources to support people in community, PCMH can result in decreasing demand, then we will have excess capacity. Must look at actual staffed beds. If staffed beds not high enough, it’s not economical to run a unit. Providence has excess capacity. Have to make services economically viable. Rhode Island has porous borders, can’t put up a wall to keep people from going elsewhere. Too many services, two hospitals in receivership. Is expensive to operate full service hospitals with low volume. Hospitals farther from Providence are hard to sustain. People are not forced to move beyond their community to get what they need.

C-11
552407
10. In your view, could meaningful cost savings be achieved through selective inpatient bed reductions in hospitals with low inpatient occupancy rates?
If so, what is the best approach?
Yes, put patients in cost
effective beds
No, removing beds doesn’t save much. Look at cost
structure.
No, occupancy doesn’t matter, look at census.
Interviewee 1 x
Interviewee 2 x
Interviewee 3 x
Interviewee 4 x
Interviewee 5 x
Interviewee 6 x
Interviewee 7 x
Comments: Think about how to allocate beds to maintain access and quality. Fixed costs stay even when beds are removed. Not economic to run facilities with low occupancies. Low occupancy mainly outside of Providence. Need enough beds to be financially viable. Can’t selectively reduce because costs remain. Teaching hospitals/beds have very different cost structure, serve different need and provide different benefits. Shouldn’t be treated like other beds in analysis. Need to measure public utility of beds. Market forces and payment incentives will lead to right sizing and manage bed need. Drop in inpatient days attributable to PCMH shift in location of services, observation days that don’t count, migration of care to other states. Need bed reductions based on normed needs and assessment of population health needs. Occupancy doesn’t correlate to need.

C-12
552407
11. What other policy/market forces unique to RI should we take into consideration when estimating future statewide inpatient bed need (e.g. state CON requirements)?
Only two
payers
Very little true
managed care
Proliferation of free
standing centers
Bed cost not related to
quality
Drop in Medicare
reimb.
Aging population
Aversion to travel by residents
Out migration
Employment
Interviewee 1 x x
Interviewee 2 x x
Interviewee 3 x
Interviewee 4 x x
Interviewee 5 x x
Interviewee 6 x x
Interviewee 7 x
Comments: Recognize different bed types, a bed is not a bed. Physicians are not aligned with hospitals financially, have different incentives. Aging physical plant. State should add resources to health planning. Duplicate infrastructure for outpatient services. 80% of patients seeking care out of state are private pay. Free standing centers contribute to duplication, not helped reduce costs or increase quality. Reimbursement changes may de-incent these centers. Lack of public acute care hospitals in Rhode Island adds another financial challenge. Models should be based on primary care so that inpatient utilization is a last resort. Is a failure to have person in emergency department or admitted to hospital. Managed care not part of Rhode Island mindset. Health care is a driver of employment in Rhode Island. Can move inpatient employees to outpatient setting. Rhode Island is a high cost state. Premiums are high and costs are high but everyone feels they are underpaid. Employment is a huge issue. Lack of courage to make tough choices. Only add things, don’t subtract. See acceleration in mergers, will soon have 2-3 systems in state, maybe only 1.

C-13
552407
12. Do you possess any relevant studies, such as statewide and local bed need analyses, that you can share with us?
Yes No
Interviewee 1 x
Interviewee 2 x
Interviewee 3 x (maybe)
Interviewee 4 x
Interviewee 5 x
Interviewee 6 x
Interviewee 7 x

C-14
552407
Payer Stakeholders – Detailed Responses
1. How would you characterize the overall health status of Rhode Island residents?
Relative to surrounding states?
Good Fair
High incidence of mental health,
substance abuse issues
Interviewee 11 x
Interviewee 12 x x
Comments:
Surprised at high rankings in survey because he sees a lot of patient noncompliance.
Referenced UHG America’s Health Rankings (RI is 10th in nation)
Good immunization rates.
Poor end of life care issues, low utilization of hospice care.

C-15
552407
2. From a payer perspective, could inpatient service delivery be better/more efficiently organized in Rhode Island?
If so, what is the best approach?
More cardiovascular
service availability
More mental health
service availability
Consolidate
maternity care
Focus on
readmissions
Decrease
fragmentation of
service delivery.
Consolidate and
coordinate.
Interviewee 11 x x x
Interviewee 12 x x
Comments:
Angioplasty not available in all regions.
Mental health services not adequate.
Efforts to improve readmissions by hospitals and QIOs could be better.
System is high highly fragmented, majority of hospitals are own systems.
Care is costly, unorganized and unsafe because there is not enough volume.
Could get efficiencies from having all maternity care in one system.
Fragmentation is expensive, uncoordinated.
Need new alignment of incentives to restructure systems. Will come in new payment models.
A lot of care leaves for Boston due to perception of quality.
A center of excellence concept is dated phenomenon. Future gives opportunity to think about consolidation.

C-16
552407
3. Do you anticipate that future hospital mergers and consolidations will result in changes in hospital inpatient service capacity (e.g., reductions in
bed capacity, increase in payment rates by changing competition)?
If so, how will these mergers change the dynamics between hospitals and payers in local markets?
Hospitals have more
leverage with payers Care quality not improved yet
Consolidation will increase
volume and quality
Interviewee 11 x x
Interviewee 12 x
Comments:
Mergers are about bottom line.
Change from mergers is slow in coming.
Hope so but don’t know how mergers will change dynamics.
Recent mergers have not resulted in much consolidation.
Rhode Island is a good laboratory for adopting a coordinated system.
Can meet quality issues with scale of consolidation.
Rhode Island is one of few states that don’t report to LeapFrog quality initiative.
Volume is key to quality.
Best scenario would be two systems to consolidate and coordinate care.

C-17
552407
4. Is current statewide inpatient hospital capacity adequate or are there gaps in care?
Are there local areas of the state that are over or under bedded?
Are there specific services that are over or under bedded?
Are there related issues that deserve particular attention in this project?
Adequate Areas Services Issues
Interviewee 11 x
x (Providence
overbedded)
x(cardiology
inadequate) x (travel time)
Interviewee 12 x (South County)
x (imaging over
utilized)
x (behavior health
services inadequate)
x (migration, potential
return of patients)
Comments:
Providence has a lot of hospital beds and is probably overbedded.
South part of state may be overbedded.
Cardiology not available everywhere.
Capacity is adequate but people need to adjust mindset/expectations about travel time.
Some hospitals are protected by location – Newport.
Many hospitals located close to one another are providing similar services.
Costs of care in state are much higher than neighbors, pharmacy is 5 points higher.
All projections based on historical data but they are irrelevant for future of managed risk and global budgets.

C-18
552407
5. In your view, could meaningful cost savings be achieved through selective inpatient bed reductions in hospitals with low inpatient occupancy
rates?
If so, what is the best approach?
Yes, available beds will get filled. No, consolidation will reduce beds
Interviewee 11 x
Interviewee 12 x
Comments:
Hospitals will fill available beds, not most cost effective way to improve population health.
Need fewer beds, more focus on patient.
As primary care infrastructure strengthens, will see reduced need for inpatient occupancy and rates will drop.
How can hospitals survive? Staff can be re-purposed to outpatient settings.
6. From a payer perspective how is the implementation of ACA likely to influence future demand for inpatient services?
How are Rhode Island hospitals likely to respond?
Initially more insured, more
utilization
In future, better care coordination,
fewer beds (PCMH) More complex conditions
Interviewee 11 x x x
Interviewee 12 x x
Comments:
More proliferation of PCMH should lower need for beds, but not as dramatically as we have seen with first 100,000.
Most physician practices not ready to make changes for care coordination, information sharing.
Not good data.
Newly covered people are already getting services, maybe 2-3% increase.
People who haven’t had care may access it, will see short term bump.
Maybe 10% decrease in bed days, plus readmissions will decline. Bed days will drop.

C-19
552407
7. How do you expect your organization’s contracting to change if you become a participant in the Health Insurance Exchange?
Contracting will change. No change expected
Interviewee 11 x
Interviewee 12 x
Comments:
Payers and HIE are about 90% aligned in what they want to do.
8. What are other current or anticipated policy/market forces unique to Rhode Island that we should take into consideration when developing our
inpatient bed need analysis (e.g. state CON requirements, additional merger activity, etc.)?
Centers of Excellence Need to engage patients,
public
Lack of good CON process to
limit proliferation of new
services.
Interviewee 11 x x
Interviewee 12 x
Comments:
It’s okay to have Centers of Excellence in NY, Boston or CT. But people won’t travel for routine care.
Have to separate inpatient from outpatient perspective. Outpatient centers impact hospitals adversely.

C-20
552407
Public Health/Government – Detailed Responses
1. How would you characterize the overall health status of Rhode Island residents?
Relative to surrounding states?
Average compared to nation,
surrounding states Better in some areas Worse in some areas
Interviewee 21 x x
Interviewee 22
Interviewee 23 x
Interviewee 24 x x
Interviewee 25 x
Interviewee 26 x
Comments:
Depends on metric used to measure.
Population is elderly but there is good access.
Concerned about quality of care to geriatric patients.
Geographic disparities in care due to environmental and economic issues. Poor people in Providence have exposure to lead paint and metal and
there are food deserts.
Decisions made over the years have not impacted health status.
Need integration of services in both medical and behavioral health area.
More immigrants in Rhode Island as a percent than surrounding states.
Demographics important, will be increase in utilization among non-English speaking population as primary care Language Access Standards are
implemented.
No geographic roadblocks to hospital and imaging services, easy access to many services leads to overutilization.

C-21
552407
2. What would you consider to be Rhode Island’s most important health problems?
Are any population groups or Rhode Island communities particularly affected by these problems?
Obesity and related
diseases (diabetes)
Infectious
diseases
Coronary heart
disease
Behavioral
health
Disparities by
population
Interviewee 21 x x
Interviewee 22
Interviewee 23 x
Interviewee 24 x x x
Interviewee 25 x
Interviewee 26 x x x
Comments:
Obesity a growing problem, especially among children.
Obesity is becoming the number one problem.
Low incidence of stroke, injuries, suicide, obesity, smoking.
High level of preventive care.
Disparity of cholesterol screening in Hispanic population.
Most important health problem is paying for care.
Behavioral health has extra morbidity perhaps due to high unemployment, economic stress, income inequalities and intense substance abuse
morbidity. Mental health services are available and there is a lot of distress.
Not enough inpatient substance abuse treatment, better treatment of substance abuse might prevent other health conditions.
Most important health problems are unintentional injury (overdose from opiods), cancer malignancies, heart disease and perinatal complications.

C-22
552407
3. Has a community health needs assessment been completed recently in Rhode Island?
If so, what were the assessment's key findings?
DOH study getting started
Yes, RIPHI findings-Community unsafe to
play, no grocery stores
Interviewee 21 x x
Interviewee 22 x
Interviewee 23
Interviewee 24 x
Interviewee 25
Interviewee 26 x
Comments:
Rhode Island Public Health Institute did targeted community study, neighborhood level assessments.
Healthy People 2010 Advisory council.
Community structure is an important component of where the beds should go.
DOH community needs assessment is just beginning.
What is role of community hospital, who do they serve?
Lack of willingness to travel for services is a problem.
Not aware of any recent studies, the last state health plan was 1987.

C-23
552407
4. In your view, have hospitals and other health care providers in the community taken an active role in addressing community health needs?
If so, how? If not, what actions should providers consider taking?
No
Yes, outreach for disease
awareness Need to share data Need to coordinate care
Interviewee 21 x x x
Interviewee 22
Interviewee 23 x
Interviewee 24
Interviewee 25 x
Interviewee 26
Comments:
Hospitals have not been involved in service systems previously. Are going to be asked to be different in future, must coordinate with ACOs, be
part of a network, and need to focus on primary care and outcomes.
Need good information technology to share patient data.
Health care providers have been engaged in outreach to improve the health of the community because it makes economic sense to keep people
healthy.

C-24
552407
5. From your perspective, how could inpatient service delivery be better or more efficiently organized in Rhode Island?
Improve
geriatric services
Better
coordination of
services
Effective transitions of
care to avoid readmission
and improve quality
Move inpatient
services to other
settings
Consolidate
OB beds
Focus on primary
care
Interviewee 21 x x x x
Interviewee 22
Interviewee 23 x
Interviewee 24 x x
Interviewee 25 x
Interviewee 26 x x x x
Comments:
Acute care providers must re-think their role, need to partner in ACOs.
Financial models for hospitals will need to change.
Complex cases should be at high level hospitals, other services at community hospitals.
OB bed distribution is an issue.
Should consolidate into fewer providers (3-4) and coordinate services.
Aggregation helps small hospitals who would be subsumed by the system.
ACOs will drive people/hospitals into a system using payment incentives.
Need scale and volume for information technology, quality and cost effectiveness
Services should be connected to a primary care infrastructure to deflect 30- 50% of utilization.
Should organize around maternity care. Could also move low risk maternity care to community based centers.
Need fewer hospitals and their services should be focused on things that only a hospital can do.
Need to coordinate services with primary care.

C-25
552407
6. In your view, is there excess capacity or duplication of acute care hospital beds in Rhode Island?
If so, which geographic areas and services are most affected?
Yes, excess capacity Duplication of services Geographic mal-distribution
Interviewee 21 x x
Interviewee 22 x x
Interviewee 23 x x
Interviewee 24 x x x
Interviewee 25 x x
Interviewee 26 x
Comments:
Real issue is coordination of care across hospitals.
Need to redistribute services to centers of excellence to get volume/quality.
Need smart placement of services, geographic dispersion.
Have duplication of services such as MRI by guy on the corner.
Occupancy low, suggests overcapacity.
People from one part of state don’t want to travel to another part of state to receive care.
Excess capacity in outer community hospitals. More efficient to provide high end care in specialized facilities.
Hospitals are in a race to the bottom, should be a race to the top.
Need CON process that can refer to a health plan to made decisions on beds.
Inpatient services need to be better organized.
The number of services provided is dropping significantly while the number of beds has stayed the same.
The issue isn’t the number of beds but the unnecessary utilization of inpatient services.
Geography plays a role because Rhode Islanders don’t want to travel even 15 minutes for health care.
There is some duplication of services at smaller hospitals.
There is a lack of evidence on hospital beds and health outcomes. We need evidence to prove outcomes and make changes.

C-26
552407
7. In your view, could meaningful cost savings be achieved through inpatient bed reductions?
If so, what is the best approach?
Reduce costs, not
beds
Need integrated care system
for quality and cost savings.
No political will to reduce
beds/services/employment
Interviewee 21 x
Interviewee 22 x
Interviewee 23 x
Interviewee 24 x
Interviewee 25 x x
Interviewee 26 x
Comments:
Need to think about cost reductions in hospitals, what are contributors to overhead?
What is volume of services in community hospitals? What is needed?
Can remove beds but not supporting costs and it won’t matter.
May end up shifting capacity from efficient to inefficient hospitals.
Skeptical about big savings.
Disrupts employment.
Political forces strong.
Shift from inpatient to outpatient and aging of population will require different services.
Cost savings would be a side benefit, need integrated health care system that provides good care.
Hospitals need to prepare for the future, starting to use primary care as a centerpiece.
Is waste of time to try to reduce beds, is really a utilization issue.
CON process is outdated and not necessary anymore. Hospitals will not build beds they can’t support financially. Number of beds will respond
to market forces.
Not by bed reductions alone, need to build up community based infrastructure and shrink hospital spending. Savings will come from reducing
unnecessary services.

C-27
552407
8. Are there specific inpatient services that are not adequately provided in Rhode Island?
Are there geographic areas within Rhode Island with an under or over supply of beds?
Capacity good if willing to
travel
Access to primary care
services limited by
reimbursement
Lacking adequate
behavioral health care for
children
Lacking adequate dental
care
Interviewee 21 x x x x
Interviewee 22 x
Interviewee 23 x
Interviewee 24 x x
Interviewee 25 x
Interviewee 26 x
Comments:
Services are there if reimbursed, harder for uninsured folks to access.
Primary care physicians are underpaid, no incentive to provide access.
Centers of excellence don’t have to be in Rhode Island if specialized, not routine care.
Services exist in Boston and New Haven. Should be regionalized so Rhode Island doesn’t have to use resources to compete.
Makes sense to have centers of excellence outside of Rhode Island, some people will travel but some won’t.
All services are available, except pediatric bone marrow transplants.
Not enough volume to support some services.
Ethnicity of state is changing, may require different services.
No lack of services given size of state. Do have a lack of outpatient services, need chronic pain treatment center to address prescription drug
abuse.

C-28
552407
9. Area hospitals have been forming affiliations with other hospitals or seeking to merge with out-of-state hospitals. What is your reaction to
these plans?
Positive Negative Depends
Interviewee 21 x
Interviewee 22 x
Interviewee 23 x
Interviewee 24 x
Interviewee 25 x
Interviewee 26 x
Comments:
Reaction depends on the system. Don’t see them as positive or wanting to provide high quality care.
What is the incentive? Don’t want mergers just to have companies come in and take the profits.
Mergers don’t usually save money but can consolidate services and improve quality.
Merged organizations have market share leverage with insurers.
Makes sense given market forces and trend of moving from fee for service to global payments and consolidation of services.
Mergers can facilitate use of electronic health records to avoid duplication.
Danger of monopoly and higher prices, can be addressed by payment policies.
Charter Care is the only change of ownership.
All services are adequately supplied. If there is money in it, a provider will offer it.
Expect more mergers because they can achieve a scale of economy in providing services.
ACO payment incentives will encourage mergers.
Best to keep jobs in Rhode Island, but clinically want to achieve economies of scale and critical mass of services.
Need to centralize services and have community based organizations to share services across the state.

C-29
552407
10. Have mergers and consolidations resulted in changes in how inpatient services have been delivered (e.g., reductions in bed capacity)?
If so, to what extent have these changes influenced access and cost?
No change Consolidations Increased access Decreased costs
Interviewee 21
Interviewee 22
Interviewee 23
Interviewee 24 x x (recent)
Interviewee 25 x
Interviewee 26
Comments:
Marian and RH Hospital merged in 1994, took 17 years to for open heart surgery to be moved to one specialized unit at RIH.
No reduction in licensed beds.
No impact on cost or access so far.
Some aggregation, no reduction in beds.
Some consolidation has occurred in open heart surgery.
There are opportunities to do more low risk OB in community hospitals.

C-30
552407
11. What additional hospital organizational changes are anticipated for the future (e.g., pending mergers, closures)?
What are their likely impacts on inpatient bed capacity?
Impacts bed capacity Won’t impact bed capacity
Interviewee 21
Interviewee 22
Interviewee 23
Interviewee 24 x
Interviewee 25 x
Interviewee 26
Comments:
Merging two hospitals did not reduce costs but could improve quality. Improves market share and increases costs.
Rhode Island physicians are not in hospitals and can be expensive. Productivity depends on incentives.
Key is collaboration, need to have everyone on board and working together.
Two hospitals in receivership, a few other looking for partners.
Haven’t seen any drop in service.
Two services were consolidated at Charter Care.
Inpatient bed capacity not really an issue.
Chafee asking Lifespan and Care NE to coordinate.
Need more than one health care entity.
Hospital bed need is not the question. Let hospitals do what they want so long as they meet standards of care.
No comment.

C-31
552407
12. How are provisions of ACA likely to influence future demand for inpatient beds (e.g., coverage expansions)?
How are RI hospitals likely to respond?
Short term increase in
utilization
Long term decrease
in utilization
Focus on wellness
and primary care
Increased use of
physician
extenders
Will see vertical
integration of
services.
Interviewee 21 x x x
Interviewee 22
Interviewee 23 x x x
Interviewee 24 x
Interviewee 25 x x
Interviewee 26 x
Comments:
Depends on timeframe. Access to high quality care reduces utilization.
More people will have insurance but they are currently receiving care for the most part.
ACA will affect the way hospitals operate.
New payment incentives will change delivery system.
Hospitals that are ahead of the curve should be okay.
Enough beds in mothballs, won’t result in new beds.
ACOs will encourage movement from inpatient to outpatient.
Not sure. Probably impact on demand for primary care.
May impact hospital financing because of less uncompensated care.
May actually increase number of uninsured if cost of insurance is unaffordable.

C-32
552407
13. Are there any other policy/market forces unique to Rhode Island that we should take into consideration when estimating future statewide
inpatient bed need (e.g. state CON requirements)?
Unemployment
rate
Lack of political
will/community
support to make
changes
Number of
undocumented/uninsured
people seeking care
Dense population makes
good laboratory for
change
“Pride of Rhode Island”
attitude which limits
consideration of outside
options. Wealth balance
different than surrounding
states.
Interviewee 21 x x
Interviewee 22
Interviewee 23 x x
Interviewee 24 x x
Interviewee 25 x x
Interviewee 26
Comments:
Political community is one party, makes it hard to bring up new ideas.
Wary of deliberate part-timing of staff to avoid offering health insurance.
Many small businesses with underinsured employees.
Wealth balance is different from Massachusetts, can’t use it as a model.
Should look at affordability and sustainability.
Recent legislative bill permits hospitals to provide services in clinics and other places without bringing clinics up to hospital standards.
Need to take the numbers out of the plan to have it be acceptable to state and community.
Fewer payers raises risk of consolidation and monopoly pricing, not clear how it impacts bed need.
Number of hospitals and marketing drives demand.

42
Appendix D: Primary Care Gap Analysis Report
The Graham Center

Coordinated Health Planning Project:
Final Report of Findings
March 4, 2013
The Robert Graham Center: Policy Studies in Family Medicine and Primary Care
1133 Connecticut Avenue N.W., Suite 1100, Washington, DC 20036
Phone: (202) 331-3360 ▪ Fax: (202) 331-3374
Email: [email protected] ▪ www.graham-center.org

Coordinated Health Planning Project: Final Report of Findings: Draft v2 Page i
Table of Contents Introduction .................................................................................................................................................. 1
1. Background: Current State of Rhode Island .......................................................................................... 3
1.1 Demographics, Income, Poverty, and Employment ..................................................................... 3
1.2 Health Insurance Coverage ........................................................................................................... 4
1.3 Health Care Systems ..................................................................................................................... 5
1.4 Health Care Reform Changes ........................................................................................................ 8
2. Task 1: Gap Analysis for Primary Care Services .................................................................................... 9
2.1 Subtask 1: Geo-Spatial Analysis of Deprivation and Health Needs .............................................. 9
2.2 Subtask 2: Availability of Primary Care Providers Across Rhode Island ..................................... 18
2.2.1 Background and Literature ................................................................................................. 19
2.2.2 Available Workforce Data ................................................................................................... 19
2.2.3 Techniques for Estimating the Available Workforce .......................................................... 20
2.2.4 Estimates of Rhode Island’s Primary Care Workforce ........................................................ 21
2.2.5 Demographic Profile of Rhode Island Primary Care Physicians .......................................... 24
2.2.6 Estimate and Map Small Area Counts of the Supply of Primary Care Providers ................ 25
2.3 Subtask 3: Gaps in Rhode Island’s Primary Care Service System ................................................ 29
3. Task 2: Gap Analysis for Workforce Development ............................................................................ 33
3.1 Rhode Island’s Production of Health Care Professionals ............................................................ 33
3.2 Projections of Future Needs for Health Care Professionals ........................................................ 34
4. Additional Analysis: Priority Question “How Does Changes in the Primary Care Delivery System
Affect Health Care Outcomes?” .................................................................................................................. 37
4.1 Hospitalizations and Primary Care .............................................................................................. 37
4.2 Methods for Financing Health System Payment ........................................................................ 51
Patient Centered Medical Home Model ............................................................................................. 51
Integrated Systems (Accountable Care Organizations) ...................................................................... 53
Primary Care Trusts and Population Health Models ........................................................................... 55
Conclusion ................................................................................................................................................... 57
Data Appendix ............................................................................................................................................... 1
Wellmed Analysis ...................................................................................................................................... 1
Social Deprivation Index Construction ...................................................................................................... 6

Coordinated Health Planning Project: Final Report of Findings: Draft v2 Page 1
Introduction
In the Fall 0f 20012, the Rhode Island Executive Office of Health and Human Services (EOHHS), in
collaboration with the Office of the Insurance Commissioner and the Department of Health (DOH),
sought technical assistance and health planning expertise to begin a more comprehensive statewide
health planning process. Rhode Island’s Director of Health created a Health Care Planning and
Accountability Advisory Council under the “Rhode island Coordinated Health Planning Act of 2006” to
make recommendations related to statewide health planning. The Robert Graham Center for Policy
Studies in Family Medicine and Primary Care (“Graham Center”) was selected to produce “gap analysis”
regarding Rhode Island’s primary care services to provide support for Rhode Island’s EOHHS and DOH to
utilize in creating a statewide health plan.
Created in 1999 as an editorially independent functional division of the American Academy of Family
Physicians, the Graham Center has more than ten years of state health policy and health care industry
experience. The Graham Center exists to improve individual and population health by enhancing the
delivery of primary care. The Graham Center aims to achieve this mission through the generation or
synthesis of evidence that brings a family medicine and primary care perspective to health policy
deliberations from the local to international levels. The Graham Center employees social scientists of
diverse background who have expertise in the analysis and development of indices and measures of
underservice, social determinants of health, health workforce, and geospatial analysis that relates these
factors with population health and health care cost outcomes. This expertise is borne of and reinforced
by recent contracts with the U.S. Agency for Healthcare Research and Quality (AHRQ), Health Resources
and Services Administration ([HRSA] Office of Rural Health Policy and Bureau of Primary Health Care),
the Commonwealth Fund, and participation on the Federal Negotiated Rule Making Committee for
health care workforce shortage and underservice designation.
The Graham Center has summarized Rhode Island’s primary care services and health care workforce
development to enhance Rhode Island’s understanding of the overall health needs of its population.
The Graham Center has produced this final report consisting of two gap analyses. The first analysis
provides a comprehensive examination of the delivery of primary care services in Rhode Island and
outlines the extent to which Rhode Island’s population has access to primary care services.
The primary care services gap analysis merges data from a variety of sources on the U.S. physician
workforce, Census and health data in order to permit analysis of both the need for primary care service
and the current and future availability of primary care providers (including Nurse Practitioners (NPs) and
Physician Assistants (PAs)) at small area levels for Rhode Island. Rhode Island’s small size, population
density, and lower than average poverty and uninsurance rates provide natural strengths for facilitating
population health planning relative to other states. In contrast, the Graham Center developed social
deprivation index scores suggest that Rhode Island remains at risk of excessive health care utilization
and Rhode Island’s community hospital infrastructure struggles financially.

Coordinated Health Planning Project: Final Report of Findings: Draft v2 Page 2
The Graham Center’s second gap analysis focuses on health care workforce development in Rhode
Island. Using U.S. physician workforce data, the Graham Center examines the current production of
health care providers in Rhode Island, including NPs and PAs. Many state policymakers are interested in
the extent to which physicians trained in-state actually remain in-state to practice. The Graham Center
addresses physician retention through an examination of the extent to which Rhode Island relies on
migration of physicians from other states. The workforce gap analysis complements the primary care
service analysis by providing a better understanding of how well the current health workforce pipeline
addresses the future needs of the population to access primary care services in their communities.

Coordinated Health Planning Project: Final Report of Findings: Draft v2 Page 3
1. Background: Current State of Rhode Island
Rhode Island is a unique state in the United States in many ways. To give context to the gap analysis
presented below, brief background information on Rhode Island is presented. Statistics on the
demographics, income, poverty and employment of Rhode Island are presented first. To lay the
foundation of the later health care system work, an overview of the health insurance coverage of Rhode
Islanders; the Rhode Island health care system; the impact the Patient Protection and Affordable Care
Act (P.L. 111-148) (ACA) has had, and will continue to have, to the health care system in Rhode Island;
the health status of Rhode Islanders; the access to health care specialties; and the current state of
Rhode Island’s heath information technology systems are outlined.
1.1 Demographics, Income, Poverty, and Employment
The 2011 U.S. Census Bureau’s American Community Survey (ACS) estimates Rhode Island’s population
to be approximately 1,051,000, 43rd in the nation.1 The 2000 Census shows that Rhode Island has the
smallest land area of the U.S. at 1045 square miles. Rhode Island also has an average of approximately
1000 individuals and 420 housing units per square mile. Thus Rhode Island has the third highest
population density in the U.S.. Additionally, Rhode Island ranks 45th in the nation in terms of population
change from 1990 to 2000, and 29th in terms of urban population. 2
Almost 21 percent of Rhode Island’s population are under 18 years old, 64 percent are between 18 and
64, and almost 15 percent are 65 and older. There are slightly more women (almost 52 percent) than
men (about 48 percent) in Rhode Island. The majority of the population in Rhode Island is white, at 86
percent, with 2 percent reporting two or more races. Slightly more than seven percent of the
population is African American, and almost 13 percent identify as being of Hispanic or Latino origin.
Approximately three percent of the population is Asian, and less than two percent falls into the category
of American Indian, Alaskan Native, Native Hawaiian or Other Pacific Islander.3
Rhode Island’s household size is 2.47 persons per household4 and the median household income at
almost $54,000 (the mean is slightly more than $72,000).5 In Rhode Island, more than 10 percent of the
1 See e.g., U.S. Census Bureau, State and County QuickFacts: Rhode Island, available at
http://quickfacts.census.gov/qfd/states/44000.html. 2 See e.g., U.S. Census Bureau, United States Summary: 2000: Populaiton and Housing Unit Counts, Table 17, page
29 (April 2004), available at http://www.census.gov/prod/cen2000/phc3-us-pt1.pdf. 3 U.S. Census Bureau, American FactFinder, data extracted October 30, 2012, available at
http://factfinder2.census.gov/faces/nav/jsf/pages/index.xhtml. 4 See e.g., U.S. Census Bureau, State and County QuickFacts: Rhode Island, available at
http://quickfacts.census.gov/qfd/states/44000.html. 5 U.S. Census Bureau, American FactFinder, data extracted October 30, 2012, available at
http://factfinder2.census.gov/faces/nav/jsf/pages/index.xhtml.

Coordinated Health Planning Project: Final Report of Findings: Draft v2 Page 4
workforce is unemployed.6 Approximately 11 percent of Rhode Island’s families, and almost 15 percent
of all people, are below the poverty line, compared with almost 12 percent of families, and almost 16
percent of all people (respectively), for the U.S. The “educational services, and health care and social
assistance” industry employs approximately 27 percent of Rhode Island’s civilian employed population.
A little more than 12 percent of Rhode Island’s population is employed in the retail trade industry, with
the manufacturing and “arts, entertainment, and recreation, and accommodations and food services”
industries each employing almost 11 percent of Rhode Island’s population.7 Large private companies
headquartered in Rhode Island include CVS Pharmacy, Hasbro and Amica Insurance. Fidelity
Investments, Metropolitan Insurance and General Dynamics also base large divisions of their companies
in Rhode Island. The top ten employers in Rhode Island and their number of Rhode Island employees
are (1) the Rhode Island State Government (14,904), (2) Lifespan (11,869), (3) the U.S. Government
(11,581), (4) the Roman Catholic Diocese of Providence (6,200), (5) Care New England (5,953), (6) CVS
Corp (5,800), (7) Citizens Financial Group, Inc. (5,800), (8) Brown University (4,800), (9) Stop and Shop
Supermarket Co., Inc. (Royal Ahold) (3,632), and (10) Bank of America (3,500).8
1.2 Health Insurance Coverage
Blue Cross Blue Shield of Rhode Island (BCBSRI) was founded in 1939 and today has over 600,000
members (almost 65 percent of Rhode Island’s insured population), over 9,000 participating Rhode
Island providers, and employees over 1,000 individuals.
According to Kaiser Family Foundation, the largest insurer for Rhode Island’s individual (non-group)
insurance market holds 52 percent of the market, with only two insurers holding more than five percent
of the individual insurance market share. In comparison, the largest insurer in Massachusetts and
Connecticut holds 57 and 52 percent (respectively) of the market and four insurers hold more than five
percent of each market.9
Approximately 88 percent of Rhode Island’s civilian noninstitutionalized population have health
insurance coverage and approximately 12 percent are uninsured, compared to almost 84 percent and
about 16 percent for the United States. About 75 percent of Rhode Islanders has employer sponsored
6 See e.g., U.S. Bureau of Labor Statistics, Economy at a Glance: Rhode Island, (September 2012), available at
http://www.bls.gov/eag/eag.ri.htm. 7 See e.g., U.S. Census Bureau, American FactFinder, data extracted October 30, 2012, available at
http://factfinder2.census.gov/faces/nav/jsf/pages/index.xhtml. 8 Rhode Island Economic Development Corporation, Top Employers in Rhode Island (March 2011), available at
http://www.riedc.com/files/Top%20Employers%20ranking%202011.pdf. 9 See e.g., The Henry J. Kaiser Family Foundation, How Competitive are State Insurance Markets? (October 2011),
available at http://www.kff.org/healthreform/upload/8242.pdf.

Coordinated Health Planning Project: Final Report of Findings: Draft v2 Page 5
health insurance, four percent have individual coverage, 17 percent are enrolled in Medicaid, 15 percent
are enrolled in Medicare and one percent are enrolled in other public coverage.10
Figure 1. The Kaiser Family Foundation statehealthfacts.org
1.3 Health Care Systems
Rhode Island’s current health care system consists largely of affiliated entities working together.
Lifespan, the first such system, was founded as a non-profit organization in 1994 by the Rhode Island
Hospital and the Miriam Hospital. The Warren Alpert Medical School of Brown University, Hasbro
Children’s Hospital, Bradley Hospital, and Newport Hospital are all currently affiliated with Lifespan’s
“integrated, academic health system.”11
Located in Providence, Rhode Island Hospital was founded in 1863, currently employees 7,297
individuals, and has 719 licensed beds. The hospital brings in almost $1 billion in net patient service
revenue and over $50 million in research funding revenue. Rhode Island Hospital is involved with
several research programs, including the Family Research Program, the Vascular Disease Research
Center, and The Center of Biomedical Research Excellence for Skeletal Health and Repair, among
others.12
10
See e.g., The Kaiser Family Foundation, statehealthfacts.org. Data Source: Urban Institute and Kaiser Commission on Medicaid and the Uninsured estimates based on the Census Bureau's March 2011 and 2012 Current Population Survey (CPS: Annual Social and Economic Supplements). 11
See e.g., About Lifespan (assessed October 30, 2012), available at http://www.lifespan.org/about-lifespan-hospitals. 12
See e.g., Rhode Island Hospital: A Lifespan Partner (assessed October 30, 2012), available at http://www.rhodeislandhospital.org.

Coordinated Health Planning Project: Final Report of Findings: Draft v2 Page 6
A private, not-for-profit hospital, The Miriam Hospital was founded in 1907 in Providence. Currently the
hospital is staffed by more than 775 affiliated physicians, approximately 50 full-time house staff (medical
school graduates), a nursing staff of 500 and more than 1,100 health care employees. The Miriam
Hospital is affiliated with Brown Medical School and is one of Rhode Island’s major teaching hospitals.
The Warren Alpert Medical School of Brown University is a national leader in medical education and
biomedical research. Approximately 100 Doctor of Medicine (MD) degrees are awarded each year by the
Medical School. Hasbro Children’s Hospital opened on Valentine’s Day in 1994 in Providence on the
Rhode Island Hospital campus. In 1931, the first neuropsychiatric hospital devoted exclusively to
children and adolescents, The Emma Pendleton Bradley Hospital, opened in East Providence. The
Bradley Hospital operates the Bradley School, a fully accredited special education school, employees 932
individuals, has 39 affiliated physicians and 60 licensed beds. Newport Hospital began as a 12-bed
cottage hospital in 1873 founded and funded by Newporters. Today Newport Hospital employees 899
individuals, has 299 affiliated physicians and 129 licensed beds.
A second health care system operating in Rhode Island is the Care New England System. In February
1996, Butler Hospital, Kent Hospital and Women & Infants Hospital of Rhode Island founded the Care
New England System in Providence to serve the southeastern New England community. Rhode Island’s
only private, nonprofit psychiatric and substance abuse hospital for adults, adolescences, children and
seniors, Butler Hospital was founded in 1844 and is located in Providence. Butler Hospital serves as the
principal teaching affiliate for psychiatry and human behavior for Brown Medical School. Kent Hospital,
an acute care nonprofit hospital, opened in 1951 with 90 beds and today serves approximately 300,000
residents of Warwick, West Warwick, East Greenwich, West Greenwich, Coventry and parts of North
Kingstown, Exeter and Cranston with 359-beds. Kent Hospital is affiliated with the University of New
England College of Osteopathic Medicine. Women & Infants Hospital of Rhode Island opened in 1884 as
the Providence Lying-In Hospital. Women & Infants Hospital of Rhode Island is currently the eighth
largest stand-alone obstetrical facility in the U.S. with almost 8,400 deliveries in 2011.13
The three state hospitals operated by the Rhode Island Department of Mental Health Retardation and
Hospitals integrated into the Eleanor Slater Unified Hospital System in March of 1994. The John O.
Pastore Center in Cranston and the Eleanor Slater Hospital/Zambarano Unit in Burrillville together house
495 public beds.14
South County Hospital Healthcare System in Wakefield is made up of South County Hospital, VNS Home
Health Services, South County Quality Care, and South County Surgical Supply. South County Hospital is
an independent, non-profit, acute-care hospital.15
13
Women & Infants Hospital of Rhode Island, Women & Infants Profile 2012: About Women & Infants (2012), available at http://www.womenandinfants.org/upload/WI2012profile.pdf. 14
See e.g., the Eleanor Slater Hospital webpage (assessed October 30, 2012) at http://www.bhddh.ri.gov/esh/. 15
See e.g., the South County Hospital Healthcare System webpage (assessed October 30, 2012) at http://www.schospital.com/.

Coordinated Health Planning Project: Final Report of Findings: Draft v2 Page 7
Landmark Medical Center, located in Woonsocket, is a 214-bed, acute care non-profit, full-service
hospital. In 1988 the former Woonsocket Hospital and John E. Fogarty Memorial Hospital merged to
create the Landmark Medical Center. The Landmark Medical Center has allied with Harvard Medical
Facility Physicians to bring “world renowned emergency care close to home for families in our
community.”16
The Roger Williams Medical Center affiliated with St. Joseph Health Services of Rhode Island in October
2009 creating the CharterCare Health Partners. CharterCare has 579 licensed beds, 3,405 employees,
527 physicians, net patient revenue of $329,518,453 and research funding revenue of $6,403,821.17 On
April 6, 1892 St. Joseph Hospital opened under the Roman Catholic Diocese of Providence. The Diocese
of Providence opened Our Lady of Fatima Hospital in North Providence in 1954 as a hospital for the
chronically ill to replace St. Joseph Hospital’s Hillsgrove chronic care facility in Warwick.18 At the end of
the 1960s St. Joseph and Our Lady of Fatima Hospitals were merged under one administration. The
Roger Williams Medical Center was founded in 1878 in the Smith Hill neighborhood of Providence.19
The U.S. Department of Veterans Affairs runs Providence VA Medical Center which has approximately
150 board certified physicians, a total of 1,038 full-time equivalent employees, and approximately 73
operating beds.20 The Memorial Hospital of Rhode Island, founded in 1894, is a 294 bed community
hospital serving the Blackstone Valley with its main campus in Pawtucket. The hospital is a teaching
affiliate of The Warren Alpert Medical School of Brown University.21 Providing Washington and New
London (Connecticut) county residents a community hospital setting, Westerly Hospital is a 125 bed
hospital with 130 primary and specialty physicians.22 Duncan Lodge in Providence is a private pay
mental health treatment center. Rehabilitation Hospital of Rhode Island in North Smithfield is devoted
exclusively to inpatient and outpatient rehabilitation.23 Gateway Healthcare, Inc. was established in
1995 as a community mental health center for the residents of northern and central Rhode Island.24
16
See e.g., Landmark Medical Center’s webpage (assessed October 30, 2012) at http://www.landmarkmedical.org/. 17
See e.g., CharterCare Health Partners webpage (assessed October 30, 2012) at http://www.chartercare.org/. 18
See e.g., St. Joseph Health Services of Rhode Island webpage (assessed October 30, 2012), available at http://www.saintjosephri.com/. 19
See e.g., Robert Williams Medical Center webpage (assessed October 30, 2012), available at http://www.rwmc.org. 20
See e.g., Providence VA Medical Center webpage (assessed October 30, 2012), available at http://www.providence.va.gov/. 21
See e.g., Memorial Hospital of Rhode Island webpage (assessed October 30, 2012), available at http://www.mhri.org/news.php. 22
See e.g., The Westerly Hospital webpage (assessed October 30, 2012), available at http://www.westerlyhospital.org/. 23
See e.g., Rehabilitation Hospital of Rhode Island webpage (assessed October 30, 2012), available at http://www.rhri.net/home.aspx and The Agape Center, Rhode Island Hospitals (assessed October 30, 2012), available at http://www.theagapecenter.com/Hospitals/Rhode-Island.htm#R. 24
See e.g., Gateway Healthcare Inc, webpage (assessed October 30, 2012), available at http://www.gatewayhealth.org/.

Coordinated Health Planning Project: Final Report of Findings: Draft v2 Page 8
1.4 Health Care Reform Changes
Rhode Island is on track to meet the health benefits exchange requirements of the ACA. Rhode Island’s
Governor Lincoln Chafee issued an Executive Order to establish the Rhode Island Health Benefit
Exchange and appointed the public member of the Exchange Board on September 19, 2011. According
to the State of Rhode Island Healthcare Reform Commission website, “The Exchange will function as a
marketplace for health insurance for individuals, families, and small business. The Exchange Board will
recommend design and policy decisions for the Exchange as it is developed, which is scheduled to start
enrolling Rhode Islanders in health insurance by late 2013. The construction of the Exchange is fully
paid through federal funds.”25 Thus Rhode Island’s Exchange will be established and operated by Rhode
Island’s Executive Department’s newly established Rhode Island Health Benefits Exchange Division. The
Exchange is operated by the State with the State the active purchaser, instead of a clearinghouse. The
Exchange received a planning grant of $1 million and an establishment grant of approximately $58.5
million.26
Rhode Island has also established a Pre-Existing Condition Insurance Plan run by Blue Cross Blue Shield
of Rhode Island, under a contract with the U.S. Office of Health & Human Services. Individuals are
eligible for coverage if they are a citizen or natural of the U.S. or residing in the U.S. legally, have been
uninsured for a least six months before application, and have a pre-existing condition or been denied
coverage because of their health condition.27
Rhode Island has also pledged to expand Medicaid under the ACA. Rhode Island did not adopt the early
expansion to cover adults and did not receive the grant award for disease prevention; however, Rhode
Island submitted a plan for a Medicaid eligibility system upgrade. Rhode Island submitted a State Plan
Amendment (SPA) for Health Homes but did not receive a planning grant. Additionally Rhode Island
posted a Proposal for a Financial Alignment Model under the dual eligible beneficiaries’ option but did
not design a contract award to integrate care for dual eligible beneficiaries.
The Kaiser Family Foundation has estimated that Rhode Island’s Medicaid expansion to 133 percent of
the Federal Poverty Level (FPL) will result in a 20 percent increase in enrollment by 2019, a 0.7 percent
increase in State spending from 2014 to 2019, a 14.6 percent increase in Federal spending and an 8.1
percent increase in total spending. In comparison, the Medicaid expansion will result in a 27.4 percent
increase in enrollment in the U.S. average by 2019, a 1.4 percent increases in State spending from 2014
to 2019, a 22.1 percent increase in Federal spending and an 13.2 percent increase in total spending.
25
See e.g., State of Rhode Island Healthcare Reform Commission website (assessed October 30, 2012), available at http://www.healthcare.ri.gov/exchange/about/. 26
See e.g., The Kaiser Family Foundation, Facts At-a-Glance: Rhode Island (assessed October 30, 2012), available at http://www.statehealthfacts.org/healthreformsource.jsp?rgn=41. 27
See e.g., HealthCare.gov, Pre-Existing Condition Insurance Plan: Rhode Island (assessed October 30, 2012), available at http://www.healthcare.gov/law/features/choices/pre-existing-condition-insurance-plan/ri.html.

Coordinated Health Planning Project: Final Report of Findings: Draft v2 Page 9
2. Task 1: Gap Analysis for Primary Care Services
Rhode Island’s DOH requested a gap analysis of Rhode Island’s primary care services enabling Rhode
Island to clearly understand the extent to which the existing system adequately addresses the varying
needs of a diverse population. To present such a picture, the Graham Center engaged in three technical
subtasks: 1) a geo-spatial examination of health needs across Rhode Island, paying particular attention
to trends in health disparities across socio-economic and racial/ethnic divides; 2) an analysis of Rhode
Island’s primary care workforce “drilled down to the census tract level,” including a comparison of
Rhode Island’s health workforce composition to that of other states and trends across time; and 3)
based on the first two analyses, the Graham Center identifies areas potentially in need of greater
resources, as well as areas with adequate or excess capacity.
2.1 Subtask 1: Geo-Spatial Analysis of Deprivation and Health Needs
The first subtask focuses on combining data from a variety of sources to characterize the varying health
needs of different geographical areas of Rhode Island. One policy relevant issue is identifying areas
where the population is healthier, or less healthy, than models taking into account the underlying level
of deprivation of the area would predict. Developing parallel social deprivation and health measures
allows the advantage of investigating this issue more fully.
Examining the population at a geographic level, enables a comparison of an area’s indicators of social
deprivation measures to measures of health. Through this analysis, locations that have populations with
health outcomes outside of predicted values become apparent. The results provide valuable
information to help policymakers identify ways to improve population health across the state. Prior28
efforts to construct a Social Deprivation Index (SDI)29 used ACS data to identify communities with higher
levels of social deprivation. The results show that individually or combined into an index, the social
deprivation measures are strong predictors of increased need for health care than poverty measures.
One advantage of this SDI measure is that it is available at the census tract level and provides a more
nuanced geography of need.
The available health indicators include infant mortality, avoidable hospitalization, obesity rates and
diabetes rates.30 Medicare claims data underlie the Dartmouth Atlas data; thus the Dartmouth Atlas
data represent the highest quality indicators of health care utilization. Currently the data are
28
See e.g., D. C. Butler, S. Petterson, R. L. Phillips, and A. W. Bazemore, Measures of Social Deprivation That Predict Health Care Access and Need within a Rational Area of Primary Care Service Delivery, Health Services Research, (2012), doi: 10.1111/j.1475-6773.2012.01449.x. 29
See the Appendix for details on the construction of the SDI. 30
The indicators from the ACS are relatively standard; thus to obtain precise estimates for small areas, the Census Bureau releases data pooled across five years. Although most of these measures are measured at the county level, we develop imputed values based on regression models similar to those developed by the Centers for Disease Control and Prevention (CDC) researchers for from BRFSS data. See e.g., http://www.cdc.gov/features/dsObesityDiabetes/.

Coordinated Health Planning Project: Final Report of Findings: Draft v2 Page 10
aggregated to the ZIP Code Tabulation Areas (ZCTAs)31 or primary care service areas (PCSAs).32 The
Health Care Utilization Project (HCUP) data helps identify zip codes with greater than usual acute care
sensitive hospitalizations and emergency visits. These data are closely associated with poor access to
primary care and further identify areas of need.
Small-area estimates of the risk of uninsurance/underinsurance in relation to workforce are also
presented. Such an analysis allows identificantion of areas at risk of poor access to primary care services
when the full provisions of the ACA go into effect 2014. Based on Massachusetts’s experience,
individuals who do not have health insurance prior to taking up health insurance under the ACA have
‘pent-up’ demand for health care. When these individuals newly receive health insurance, this ‘pent-up’
demand could lead to increased use of health care services that will prove costly if not anticipated in
current workforce planning.
Table 1. Health and Health Utilization Measures Underlying the Social Deprivation Index (SDI)
31
See e.g., http://www.census.gov/geo/reference/zctas.html. 32
See e.g., http://pcsa.dartmouth.edu/pcsa.html.
Source Geographic Level
Unemployment ACS, 2005-2009 Census Tract
Poverty ACS, 2005-2009 Census Tract
< 12 Years School ing ACS, 2005-2009 Census Tract
Single Parent Fami l ies ACS, 2005-2009 Census Tract
Crowding ACS, 2005-2009 Census Tract
No Car ACS, 2005-2009 Census Tract
Renter Occupied ACS, 2005-2009 Census Tract
Uninsured/Insurance Type ACS, 2009 County
Infant Mortal i ty CDC data from the ARF, 2009 County
Low Birth Weight CDC data from the ARF, 2009 County
Mortal i ty (age, sex adjusted) CDC, Vi ta l Statis tics , 2009 County
Diabetes Prevalence BRFSS, 2008-2010 County
Medicare Spending Dartmouth Atlas Data, 2008 ZCTA/PCSA
Avoidable Hospita l i zations Dartmouth Atlas Data, 2008 ZCTA/PCSA
Hospita l i zations HCUP, 2009 Zip Code
Notes: ACS: American Community Survey (Census Bureau); CDC: Center for Disease Control, ARF: Area Resource File,
ZCTA: Zip Code Tabulation Areas; PCSA: Primary Care Service Areas; HCUP: Health Care Utilization Project.
A. Social Deprivation Measures
B. Health Measures
C. Health Utilization Measures

Coordinated Health Planning Project: Final Report of Findings: Draft v2 Page 11
Table 2. Select Social Deprivation Measures, percentage of the population
Table 2 shows that, with respect to select health outcomes, Rhode Island generally fares relatively well
compared to the nation as a whole; however, Rhode Island does not compare well to other states in the
New England region. For instance, while the mortality rate in Rhode Island is below the National rate,
among New England states only Maine has a higher level. Additionally, among New England states,
Rhode Island has the highest proportion of the population with high blood pressure level and the
highest infant mortality rate.
Table 3. Select Demographic Measures (percentage of the population)
The relatively poorer health in Rhode Island compared to other New England states is partly attributable
to higher levels of deprivation in Rhode Island (Table 3). The poverty rate in Rhode Island averaged 11.9
percent from 2006 to 2010, below the national average of 13.8 percent. However, Rhode Island’s rate is
well above the New England average of 10.2 percent. Among the components of the SDI, Rhode Island
Mortality
(per 100K)Diabetes High BP
Infant
MortalityLBW
Rhode Island 763.7 7.4 28.4 6.2 7.8
Connecticut 713.9 6.9 26.1 5.9 7.9
Maine 792.3 8 28.6 5.6 6.7
Massachusetts 723 7.3 26.4 4.9 7.8
New Hampshire 737.3 7.4 26.3 5.2 6.8
Vermont 735.5 6.5 24.8 5.2 6.5
New England 732 7.2 26.6 5.3 7.6
Nation 784.8 8.7 27.6 6.8 8.1
Source: 5-year Infant Mortality (2002-2006) and 3-year Low Birth Weight [LBW]
(2004-2006) are from 2009 Area Resource File, and Age Adjusted Mortality Rates
(2007) are from CDC Wonder.
Poverty UnempSingle
Parent
<12 Years
SchoolNo Car
Renter
OccupiedCrowding SDI
Rhode Island 11.9 7.3 19.4 17.1 8.7 36.3 1.6 49.5
Connecticut 9.2 7 17.7 12.2 8.4 30.2 1.8 38.7
Maine 12.7 6.3 16.8 10.6 6.3 26.5 1.1 40.2
Massachusetts 10.2 6.9 17.5 11.9 11.2 34 1.5 41.7
New Hampshire 8.1 5.4 14.8 9.5 4.8 26.4 1.2 30.6
Vermont 11.5 5.8 17.4 9.8 6 28.4 1.2 38.8
New England 10.2 6.7 17.4 11.9 9.1 31.6 1.5 40.3
Nation 13.8 7.6 18.6 16 8.6 32.9 3.5 50.9
Source: All measures, except for the Social Deprivation Index (SDI), are from 2005-2009 American Community Survey (ACS).

Coordinated Health Planning Project: Final Report of Findings: Draft v2 Page 12
stands out as having a particularly high level of individuals with less than 12 years of schooling (17.1
percent compared to the national average of 16.0 percent).
The last column of Table 3 displays SDI scores converted to percentiles; a score of zero represents the
lowest and 100 represents the highest level of deprivation. With a score of 49.5, Rhode Island is almost
exactly in the middle, well above the average of the other New England states (40.3). Figure 2 below
displays ZCTA level estimates of separate components of the SDI as well as the overall SDI score.

Coordinated Health Planning Project: Final Report of Findings: Draft v2 Page 13
Figure 2. Demographic Measures in Rhode Island

Coordinated Health Planning Project: Final Report of Findings: Draft v2 Page 14
Figure 3. Four Health Outcomes for Rhode Island

Coordinated Health Planning Project: Final Report of Findings: Draft v2 Page 15
Table 4. Correlation between SDI Score/Poverty and Race/Ethnicity, ZCTA Level
Table 4 shows that for Rhode Island, but not for the nation as a whole, there is a strong association
between the SDI and three measures of race/ethnicity: percent Hispanic, percent foreign born and
percent African American.33 Stated differently, areas with higher concentrations of Hispanic, Foreign-
born and African American populations in Rhode Island are more likely to overlap areas of social
deprivation and poverty than is true of the nation as a whole.
Table 5 shows, with the exception of mortality, large and significant positive associations between the
SDI Score and four health outcomes. Given the strong correlation between poverty and SDI (r=.907),
there is a similar pattern with poverty. To examine the relationship between SDI (as well as poverty) on
utilization measures two data sets were used. The first is ZCTA-level data from the Dartmouth Atlas and
the second is Rhode Island hospital discharge data. Across small areas, there is the expected strong
association between hospitalization rates, in both data sets and measures of deprivation. Likewise, in
the Dartmouth data, there is a sizeable association between SDI and Emergency Department (ED) visit
rates (r=.624) as well as with avoidable hospitalization (r=.512). In the Rhode Island hospital data, there
is moderate association with readmission rates. There is not an association between SDI and the mean
length of stay in the hospital. An important finding is that there is uniformly a stronger association
between the SDI measure than with poverty alone.
Table 5. Correlation between SDI Score/Poverty and Health Outcomes in Rhode Island,
33
By design, the SDI does not include geographical measures of race and ethnicity, mainly because there is a weak relationship between these measures and health outcomes.
SDI Score Poverty SDI Score Poverty
Hispanic 0.9090* 0.8401* 0.3797* 0.1640*
Foreign Born 0.8694* 0.7860* 0.2364* 0.0221*
African American 0.8524* 0.8064* 0.4614* 0.4309*
Rhode Island
(n=70)
All States
(n=31,170)
Source: American Community Survey, 2005-2009, Social Deprivation Index (SDI) is a Graham
Center created composite measure of the social deprivation of a geographical area.
* Significant at the 10 percent level.
Health Outcome SDI Score Poverty
Mortality -0.4344* -0.5334*
Diabetes 0.8140* 0.7867*
Infant Mortality 0.7212* 0.6758*
Low Birth Weight 0.6719* 0.5965*
Source: American Community Survey, 2005-2009, Social Deprivation Index (SDI) is a Graham
Center created composite measure of the social deprivation of a geographical area.
* Significant at the 10 percent level.

Coordinated Health Planning Project: Final Report of Findings: Draft v2 Page 16
Table 6. Correlation between SDI Score/Poverty and Health Utilization Outcomes in Rhode Island, ZCTA level
Figure 4 shows state level variation in four indicators of Medicare health care utilization available from
the Dartmouth Atlas: emergency department rates, hospitalization, avoidable hospitalizations and total
Part A Medicare spending per beneficiary. These measures were obtained by aggregating 2006 PCSA
level data to the state level. Overall the findings are mixed. On one hand there is a strong association
between the supply of primary care and the two hospitalization measures. States with the fewest PC
providers per capita have the highest hospitalization rates. On the other hand, there is a weaker
association with emergency department visit rates and total costs. Compared to the predicted values at
different values of primary care supply, as defined by the line of best fit, Rhode Island appears to have
slightly higher rates of emergency department visits and avoidable hospitalizations.
Figure 5 presents findings using rates of family physicians per 100,000 residents. The findings are similar
to those reported by Baicker and Chandra, who restrict their measure of primary care supply to family
physicians and general practitioners. The results show that states with more family physicians per
capita have lower hospitalization and emergency department visits as well as lower costs. Rhode Island
has relatively fewer family physicians, similar to such New England states as Massachusetts and
Connecticut, and higher hospitalization rates and Medicare costs than states such as Vermont or Maine
who have relatively more family physicians.
SDI Score Poverty
Dartmouth Measures
Hospitalization 0.6274* 0.4920*
Emergency Department Visit 0.6242* 0.5763*
Avoidable Hospitalization 0.5125* 0.3438*
RI Hospital Discharge Data (2010)
Hospitalization 0.5688* 0.3975*
Readmission (30 Days) 0.4050* 0.2796
Mean Length of Stay 0.2669 0.1825

Coordinated Health Planning Project: Final Report of Findings: Draft v2 Page 17
Figure 4. Rate of Primary Care Physicians by Health Care Utilization and Costs

Coordinated Health Planning Project: Final Report of Findings: Draft v2 Page 18
Figure 5. Rate of Family Physicians by Health Care Utilization and Costs
2.2 Subtask 2: Availability of Primary Care Providers Across Rhode Island
Subtask 2 provides a detailed examination of the primary care provider distribution across Rhode Island.
The distributions of NPs and PAs are also assessed due to their increasing importance as members of
primary care teams. Based on address information of physicians, counts and rates at the smallest levels
of geography levels, including census tract as well as zip codes, are created. The Graham Center has
several sources of workforce data that often complement each other. To match data from the
Dartmouth Atlas and HCUP, in addition to census tract level estimates, both ZCTA and PCSA level counts
are constructed.
Section 2.2.1 provides background and literature on primary care workforce. The available data on
primary care workforce are described in Section 2.2.2. Section 2.2.3 summarizes the techniques for
providing estimates of Rhode Island’s available workforce, including NPS and PAs. Estimates of the
primary care workforce in Rhode Island are presented in Section 2.2.4. A demographic profile of the
Rhode Island primary care physicians is outlined in Section 2.2.5. Finally, Section 2.2.6 presents

Coordinated Health Planning Project: Final Report of Findings: Draft v2 Page 19
estimates and maps small area counts of the supply of primary care providers. Throughout, where
available, Rhode Island will be compared to other states and the Nation as a whole.
2.2.1 Background and Literature
Healthcare researchers at Dartmouth Atlas have investigated the relationship between the supply of a
health care resource, such as the number of hospital beds, and the utilization of the resource.
Dartmouth has found that there are several medical resources which they would classify as resulting in
‘supply-sensitive care.’ Dartmouth Atlas resources have also concluded that the supply of resources
needed for medical services influences the utilization rate of the resource. Dartmouth research has
shown that these supply-sensitive care differences are largely due to the fact that the United States’
current health care payment system structure promotes fully deploying the existing medical care
capacity. Although Dartmouth researchers found that patients in areas with fewer medical resources
received less medical care, they also found no evidence that these patients experienced worse health
outcomes. Dartmouth has shown that over half of all Medicare spending can be attributed to supply-
sensitive care.34 Additionally, studies have shown that access to primary care services is linked to
improved population health outcomes. Knowing the distribution of primary care providers in a state is a
necessary component for determining which areas of the state exhibit the greatest need for additional
providers.
2.2.2 Available Workforce Data
Using the data sets described below the Graham Center analyzed the physician workforce for Rhode
Island.
The American Medical Association’s (AMA) Physician Masterfile is a nearly complete listing of all physicians in the United States. The AMA Physician Masterfile includes detailed information about each physician, including their age, gender, self-reported specialty, current activity status, address, type of medical degree (MD or Doctor of Osteopathic Medicine, DO) and current address.35
The Centers for Medicare & Medicaid Services’ (CMS) National Plan and Provider Enumeration System (NPPES) Downloadable File contains the National Provider Identifier (NPI) for each health care provider. The Health Insurance Portability and Accountability Act of 1996 (HIPAA) mandated that the required identifier for Medicare services, the unique provider identification number (UPIN), be replaced by the NPI. Other payers, including commercial healthcare insurers, also use the NPI. In October 2006 CMS began issuing NPIs. By May 23, 2007, all HIPAA covered entities, such as providers completing electronic transactions, healthcare clearinghouses, and
34
See e.g., The Dartmouth Atlas of Health Care, Supply-Sensitive Care webpage at http://www.dartmouthatlas.org/keyissues/issue.aspx?con=2937. 35
Proprietary data purchased by, and located on-site of, the Graham Center. To analyze the physician workforce in Rhode Island, we use AMA Physician Masterfile data from January 2012.

Coordinated Health Planning Project: Final Report of Findings: Draft v2 Page 20
large health plans are required to use only the NPI to identify covered healthcare providers. One of the advantages of the NPPES data is that the data are not restricted to physicians, permitting an analysis of NPs and PAs. The NPPES data also contain more precise physician address information than the AMA Physician Masterfile data. A drawback of the NPPES data is the lack of an indicator for currently active providers.36
Rhode Island’s health provider licensure data includes detailed information on active or inactive Rhode Island licensed starting from 1920. Physician characteristic include age, gender, medical school, self-reported specialty, license status, address, type of medical degree (MD or Doctor of Osteopathic Medicine, DO) and current address.37
The Community Health Center (CHC) Data is available to the Graham Center through an on-going contract with the Health Resources and Services Administration (HRSA). The CHC Data has detailed information about the service areas of all community health centers across the nation. In addition to addresses of each site, the data also includes zip code-level data on the service areas of each CHC for 2009 and earlier years.
The UDSMapper38 includes additional information such as National Health Services Corps (NHSC) sites, rural health clinics, and low income population served by grantee.
Using common identifying information, the Graham Center creates a crosswalk between the AMA
Physician Masterfile and the NPPES data. Drawing on the strengths of each data set, the AMA Physician
Masterfile is used to identify physicians who are engaged in direct patient care. If available, address
information from the NPPES data is given priority. The NPPES data is also used to provide estimates of
the number of primary care NPs and PAs.
2.2.3 Techniques for Estimating the Available Workforce
Identification of Active Primary Care Physicians
Primary care physicians are identified in the 2012 AMA Physician Masterfile by selecting physicians who
indicate they provide direct patient care with a primary, self-designated primary specialty of family
medicine, general practice, general internal medicine, general pediatrics, or geriatrics. To address the
fact that the AMA Physician Masterfile undercounts the number of retirees,39 counts of physicians are
adjusted based on a comparison of the age distribution of physicians in the AMA Physician Masterfile
with the age distribution of physicians in the NPPES database. The AMA Physician Masterfile physician
counts for general internists are also adjusted downward by 20 percent to account for physicians who
function as hospitalists or practice in other non-primary care settings40 and for family physicians,
36
Data freely available from http://www.cms.gov/Regulations-and-Guidance/HIPAA-Administrative-Simplification/NationalProvIdentStand/DataDissemination.html, updated quarterly (downloaded June 2012). 37
Proprietary data provided to the Graham Center by the State of Rhode Island. 38
See e.g., www.UDSMapper.org. 39
Staiger DO, Auerbach DI, Buerhaus PI. Comparison of physician workforce estimates and supply projections. JAMA. 2009; 302(15): 1674-80, available at http://www.nejm.org/doi/pdf/10.1056/NEJMsa0802381. 40
Kuo Y, Sharma G, Freeman JL, Goodwin JS. Growth in the care of older patients by hospitalists in the United States. N Engl J Med. 2009; 360(11): 1102-12.

Coordinated Health Planning Project: Final Report of Findings: Draft v2 Page 21
pediatricians. Additionally, geriatrician counts are adjusted downward by five percent to account for
physicians who work primarily in urgent or emergency care settings.41
The 2012 estimates may undercount physicians as those physicians with unspecified specialties and
physicians with unknown patient care status were not included. On the other hand, some researchers
have voiced concern that the AMA Physician Masterfile does not adequately capture physicians that
have left direct patient care. Without more reliable data, these issues are assumed to be offsetting.
Identification of Primary Care Nurse Practitioners and Physician Assistants Physicians
The NPPES data identifies NPs and PAs; however, the data do not include a clear identifier of NPs and
PAs who provide primary care. Address information was used to create an identifier for nurse
practitioner and physician assistant who are located with other primary care provider. Those providers
who were identified as colocated with physicians are inferred to be providing primary care services.
Specifically, if a NP or PA shares an address with only primary care providers, they are assumed to be
engaged in primary care. If a NP or PA share an address only with specialists they are inferred not to be
engaged in primary care. A probability of providing primary care is assigned based on the relative mix of
primary care and non-primary care physicians with which each health care provider co-locates. Finally,
in cases where the NP or PA is not collocated with physicians, they are assumed to be engaged in
primary care. To minimize the issue of over counting inactive NPs and PAs, early 2010 data is used
instead of 2012 data.
Geocoding Addresses
The addresses of all health care providers are geocoded using ArcGIS 10.0 software. Nationwide,
approximately 98 percent of the addresses are geocoded. The addresses of physicians make it possible
to create counts and rates at the smallest levels of geography, including census tract as well as ZIP code
level and township/city level.
2.2.4 Estimates of Rhode Island’s Primary Care Workforce
Table 7 below presents data from the AMA Physician Masterfile and the NPPES data. Rhode Island’s
health care workforce consists of 1,008 physicians with a primary care specialty who are practicing in
direct patient care and 1,844 specialists. As noted above, to account for the likelihood that the AMA
Physician Masterfile over counts retirees and that those physicians with a primary care specialty may be
working in a non-primary care setting, such as a hospital, an emergency department or an urgent care
center, these figures are adjusted. The adjusted number of primary care physicians in Rhode Island is
41
This figure is based on an analysis of American Board of Family Medicine (ABFM) data showing that roughly 5-6 percent of family physicians report spending more than 50 percent of their time in urgent or emergency care (Petterson S, Johnson N, Bazemore A. Scope of Practice of Family Physicians, manuscript, 2011)

Coordinated Health Planning Project: Final Report of Findings: Draft v2 Page 22
841 and the adjusted figure for specialists is 1,726. Compared to the Nation as a whole, Rhode Island
has more primary care physicians who are general internist/internal medicine (IM), nearly half (46.5
percent) versus a little more than a third (34.2 percent). The percentage of primary care physicians who
are pediatricians is similar in Rhode Island (25.7 percent) and the Nation (21.5 percent). Rhode Island
has a smaller percentage of primary care physicians who are family physicians (24.0 percent versus 38.9
percent) and general practitioners (2.1 percent versus 3.9 percent). For both Rhode Island and the
Nation only a small number of primary care physicians are geriatricians (1.8 percent and 1.5 percent
respectively).
Table 7. Estimates of Direct Patient Care Physician Workforce in Rhode Island and the Nation
Table 8 presents data from the NPPES on NPs and PAs. In Rhode Island, as of 2010 there were 422 NPs
and 227 PAs listed in the NPPES data. Using information about their colocation with primary care and
specialist physicians, we estimate that 227 of the NPs work in primary care and 100 of the PAs work in
primary care. The estimates are comparable to the Nation as a whole and to New England.
Table 9 below presents the physician-to-population ratio for Rhode Island, other New England states,
the New England Region, and the Nation. With 80.2 primary care physicians per 100,000 residents,
Rhode Island has a higher physician to population ration than the Nation (at 66 primary care physicians
per 100,000 residents), but a slightly lower rate than the New England region (at 84.1 per 100,000
residents).
Adj. Total
Providers
(unadj.
count)
% of All
PC
Providers
% of All
Providers
Adj. Total
Providers
(unadj. count)
% of All
PC
Providers
% of All
Providers
PC 841 (1,008) 100.0% 32.8% 209,220 (246638) 100.0% 33.3%
FM 202 (220) 24.0% 7.9% 81,484 (89,734) 38.9% 13.0%
GER 15 (17) 1.8% 6.0% 3,196 (3,474) 1.5% 0.5%
GP 18 (21) 2.1% 7.0% 8,093 (9,747) 3.9% 1.3%
IM 391 (511) 46.5% 15.2% 71,546 (94,001) 34.2% 11.4%
PD 216 (239) 25.7% 8.4% 44,901 (49,682) 21.5% 7.1%
Specialists 1,726 (1,844) 67.2% 419,405 (445,755) 66.7%
TOTAL 2,567 (2,852) 100.0% 628,624 (692,393) 100.0%
Rhode Island Nation

Coordinated Health Planning Project: Final Report of Findings: Draft v2 Page 23
Table 8. Counts of Physician Assistants and Nurse Practitioners in Rhode Island, Region and Nation
Table 9. Physician-to-Population Ratio (per 100,000) for Rhode Island
Total Primary
Care
Percentage
Primary CareTotal
Primary
Care
Percentage
Primary Care
Rhode Island 422 200 47.5 227 100 43.9
New England 8,517 4,468 52.5 4,442 1,721 38.7
Nation 106,073 55,625 52.4 70,383 30,402 43.2
Data: National Plan and Provider Enumeration System (2010).
Notes: New England Region includes RI, MA, CT, NH, VT and ME. Assignment of
PAs and NPs as primary care are based on their colocation with physicians of
different specialties (see text) .
Nurse Practitioners Physician Assistants
Rate State Rank Rate State Rank
Rhode Island 80.2 8 165.8 6
Connecticut 71.3 20 170.5 4
Maine 96.3 2 154.3 8
Massachusetts 87.9 4 198.0 2
New Hampshire 86.5 5 151.4 12
Vermont 92.8 3 146.3 13
New England 84.1 178.5
Nation 66.0 133.0
Source: AMA Physician Masterfile and National Plan and Provider Enumeration
System Data; 2011 Population Estimates from Census Bureau.
Primary Care Specialists

Coordinated Health Planning Project: Final Report of Findings: Draft v2 Page 24
Table 10. Select Physician Characteristics for Rhode Island
To examine practice sizes, the geocoded address of physicians and colocation were used to proxy for a
practice (see Table 10). Median primary care practice size in Rhode Island is slightly smaller than other
states (11 physicians compared to 12 nationwide and 14 in New England states). About 13.9 percent of
primary care physicians are in solo practices and another 12.8 percent are in practices with only two or
three physicians. At the other end of the spectrum, 31.1 percent of primary care physicians are in
practices with more than 25 physicians.
2.2.5 Demographic Profile of Rhode Island Primary Care Physicians
Table 11 below outlines selected demographic properties of Rhode Island physicians. The percent of
Rhode Island primary care physicians over the age of 54 (42.8 percent) is nearly equal to the national
average (42.7 percent) and slightly lower than the percent for New England as a whole (43.6 percent).
For this measure, Maine and Vermont stand out as having an older physician workforce. Approximately
6.1 percent of Rhode Island’s primary care workforce is osteopaths (DOs) which is lower than the
national average, but higher than the rate for New England states. Maine has the most osteopaths in
the nation as a whole. Finally, Rhode Island (along with other New England states) has more women in
primary care.
1 2-3 4-5 6-10 11-25 26+
Rhode Island 11 30 13.9 12.8 8.2 13.1 21 31.1
Connecticut 10 26 14.4 13.2 9 15 18 30.3
Maine 9 15 15 14.6 8.1 15.6 22.9 23.8
Massachusetts 19 48 12.6 9.6 6.4 10.2 17.5 43.6
New Hampshire 14 40 12.4 9.5 8.7 11.9 21.6 35.9
Vermont 8 5 16.5 17.4 9.6 11.2 14.3 31
New England 14 13.5 11.5 7.7 12.3 18.6 36.4
Nation 12 15.9 13 8.2 12.3 17.1 33.6
Source: AMA Physician Masterfile and National Plan and Provider Enumberation System
Data; Population Estimates from U.S. Census Bureau
Practice Size Distribution (percent)Median
Size
State
Rank

Coordinated Health Planning Project: Final Report of Findings: Draft v2 Page 25
Table 11. Select Demographic Physician Characteristics for Rhode Island
2.2.6 Estimate and Map Small Area Counts of the Supply of Primary Care Providers
Within Rhode Island there is considerable variability in the supply of primary care providers when we
examine the data at the town/city level. There is also considerable variation in the location of different
specialties (see Table 12 and Figure 6). Among major cities (population greater than 16,000), Pawtucket,
Warwick and Newport have the highest rates of family physicians. In some of these cities, such as
Woonsocket, Coventry and Cumberland there are few family physicians. Providence, East Providence,
South Kingston, Westerly and Lincoln have high rates of general internists; Coventry, West Warwick and
Bristol have low rates of general internists. The rates for pediatricians are also quite varied. Again the
rates are highest in Providence, East Providence and Lincoln, but very low in Coventry, Bristol and
Central Falls.
Table 12 and Figure 6 display the rate of primary care physicians to the population, i.e. the number of
primary care physicians to 100,000 Rhode Island residents. These rates can be a bit misleading due to
the small size of some of the towns leading to the potential for a few physicians to inflate the rates. As
expected, among the major cities (those with a population great than 16,000 residents) the rate of
primary care physicians is highest in the city of Providence and East Providence. In contrast, there are a
number of smaller towns with few, if any, physicians and are some communities with relatively low
rates.
Percent State Rank Percent State Rank Percent State Rank
Rhode Island 42.8 29 6.1 25 32.5 40
Connecticut 44.6 40 3.5 6 31.8 36
Maine 46 44 15.5 48 31.1 33
Massachusetts 42.8 27 2.5 3 37 50
New Hampshire 41.9 24 7.4 34 30.8 32
Vermont 46.9 47 3.4 5 35.9 49
New England 43.6 4.7 34.2
Nation 42.7 7.2 29.5
Source: 2012 AMA Physician Masterfile and National Plan and Provider Enumeration
System Data
Age> 54 Oesteopaths Female

Coordinated Health Planning Project: Final Report of Findings: Draft v2 Page 26
Table 12. Health Care Provider-to-Population Rates, Town/City Level
Specialists Primary Care PC NP/PA Population
BARRINGTON 80.9 97.2 21.5 16,310
BRISTOL 39.2 45.2 0 22,905
BURRILLVILLE 11.8 29.5 31.3 15,955
CENTRAL FALLS 9.3 42.4 0 19,323
CHARLESTOWN 44.9 34.3 12.8 7,791
COVENTRY 13.3 15.9 16.1 34,965
CRANSTON 85.2 63.4 24.7 80,438
CUMBERLAND 56.8 64 5.7 33,506
EAST GREENWICH 310.8 240.8 0 13,092
EAST PROVIDENCE 254.1 113.8 22.1 46,748
EXETER 0 0 0 6,426
FOSTER 0 18.8 0 4,606
GLOCESTER 0 8.2 10.3 9,751
HOPKINTON 21.2 52.1 36.6 8,188
JAMESTOWN 19.2 34.3 19.2 5,211
JOHNSTON 94.7 61.5 16.1 28,784
LINCOLN 69.2 155.3 47.2 21,018
LITTLE COMPTON 0 18.3 0 3,492
MIDDLETOWN 63.8 50.9 33 16,148
NARRAGANSETT 40.1 52.6 20.7 15,680
NEW SHOREHAM 0 175 0 1,022
NEWPORT 212.9 94.2 33.8 24,645
NORTH KINGSTOWN 41.8 38.8 27.9 26,521
NORTH PROVIDENCE 163.7 77.3 5.3 32,257
NORTH SMITHFIELD 76.1 87.6 14.9 11,967
PAWTUCKET 179.7 107.3 26.7 71,193
PORTSMOUTH 48.6 37.8 11.7 17,053
PROVIDENCE 449.6 132.1 59.6 177,946
RICHMOND 0 12.3 13 7,708
SCITUATE 0 8.9 0 10,329
SMITHFIELD 40 64.4 44.5 21,425
SOUTH KINGSTOWN 144.8 115.7 38.8 30,639
TIVERTON 13.4 27.2 31.8 15,739
WARREN 44.1 32.7 29.8 10,617
WARWICK 184.8 86.8 25.4 82,080
WEST GREENWICH 0 0 0 6,133
WEST WARWICK 26.3 23.8 11.4 29,260
WESTERLY 251 75.8 18.7 22,672
WOONSOCKET 136.9 45.8 37.1 41,186
Source: 2012 AMA Masterfile, 2010/2012 NPPES Data.

Coordinated Health Planning Project: Final Report of Findings: Draft v2 Page 27
Table 13. Distribution of Primary Care Physicians, by Specialty
Town/CityGeneral
InternistsPediatricians
Family
PhysiciansPopulation
BARRINGTON 19.2 56 16.1 16,310
BRISTOL 33.6 7.5 4.1 22,905
BURRILLVILLE 29.5 0 0 15,955
CENTRAL FALLS 18.3 9.4 14.7 19,323
CHARLESTOWN 10.3 0 24 7,791
COVENTRY 8.3 0 5.4 34,965
CRANSTON 34.6 9.2 15.3 80,438
CUMBERLAND 22.5 30.5 8.4 33,506
EAST GREENWICH 97 69.4 71.1 13,092
EAST PROVIDENCE 48.8 35.7 25.5 46,748
EXETER 0 0 0 6,426
FOSTER 0 18.8 0 4,606
GLOCESTER 0 0 0 9,751
HOPKINTON 17.3 0 34.8 8,188
JAMESTOWN 0 0 34.3 5,211
JOHNSTON 20.7 17.6 19.7 28,784
LINCOLN 50.9 91 13.4 21,018
LITTLE COMPTON 18.3 0 0 3,492
MIDDLETOWN 27.5 0 23.4 16,148
NARRAGANSETT 13.7 0 36 15,680
NEW SHOREHAM 0 0 175 1,022
NEWPORT 38.1 15.2 40.9 24,645
NORTH KINGSTOWN 16.4 6.4 12.5 26,521
NORTH PROVIDENCE 46.3 17.7 8.6 32,257
NORTH SMITHFIELD 26.7 0 44.8 11,967
PAWTUCKET 36.6 8.7 50 71,193
PORTSMOUTH 4.7 11.1 21.9 17,053
PROVIDENCE 78.6 41.1 10.2 177,946
RICHMOND 0 0 12.3 7,708
SCITUATE 0 0 8.9 10,329
SMITHFIELD 24.4 8.9 17.4 21,425
SOUTH KINGSTOWN 45 38.3 29.2 30,639
TIVERTON 4.1 0 23.1 15,739
WARREN 15.1 0 17.6 10,617
WARWICK 39.5 20.3 24.9 82,080
WEST GREENWICH 0 0 0 6,133
WEST WARWICK 4.9 3.2 15.7 29,260
WESTERLY 40.1 19.5 16.3 22,672
WOONSOCKET 36.8 6.9 2.1 41,186
Source: 2012 AMA Masterfile, 2010/2012 NPPES Data.

Coordinated Health Planning Project: Final Report of Findings: Draft v2 Page 28
Figure 6. Primary Care Physician-to-Population Rates

Coordinated Health Planning Project: Final Report of Findings: Draft v2 Page 29
Table 14. PCSA-Level Estimates of Physicians in Rhode Island
IM FP PD PC SPEC PC SPEC
BLOCK ISLAND 0 1 0 1 0 960 96 0
BRISTOL 10 3 2 15 22 33,567 43.4 64.5
GREENVILLE 5 6 2 17 13 38,415 43.3 34.3
HOPE VALLEY 1 5 0 6 2 9,187 67.1 18.9
NEWPORT 16 24 9 50 75 62,198 80.2 120.7
PASCOAG 5 0 0 5 2 15,745 34.8 12.5
PAWTUCKET 55 44 25 127 172 162,706 78.3 105.7
WAKEFIELD 22 15 15 54 87 81,915 65.8 106.5
WARWICK 42 37 29 111 227 178,258 62.5 127.4
WESTERLY 14 10 7 33 63 49,153 66.5 127.4
PROVIDENCE 181 40 97 330 922 313,290 105.2 294.4
EAST PROVIDENCE 31 14 27 75 86 78,830 94.8 108.9
Estimate of PhysiciansRates (per
100,000)Population
The primary care physician-to-population rates across Rhode Island PCSAs, ranging from a low of 34.8 in
the Pascoag PCSA to a high of 105.2 in Providence (Table 14). The rates for specialists are more
dispersed, ranging from zero in Block Island and 12.5 in Pascoag to 294.4 in Providence. Because these
service areas are generally larger and more uniform in size than towns/cities, there is less overall
variability in these measures. There are also interesting differences in the specialty of primary care
physicians across PCSAs. For instance, there are relative more family physicians in Newport, Pawtucket
and Warwick than statewide. There are relatively more pediatricians in Providence, East Providence and
Warwick.
2.3 Subtask 3: Gaps in Rhode Island’s Primary Care Service System
The third subtask uses the results developed for the first two subtasks to identify areas with relatively
fewer primary care providers after taking into account varying levels of need. A central question for this
task, not easily resolved, is what constitutes “optimal” levels of service. In previous work at a national
level, the Graham Center developed a variety of approaches applicable to Rhode Island. The simplest
approach is to develop national- or state-level benchmark using average (means or medians) rates of
primary care providers for different levels of need. Areas with lower than average rates would be
classified as “underserved.” A more sophisticated approach, at the heart of the work associated with
the Dartmouth Atlas, attempts to specify the relationship between provider supply and health, health
care utilization, and outcomes to identify points at which additional primary care providers do not
substantially improve area-level outcomes. An area is defined as having a shortage if the primary care
physician to population ratio in the area is less than 80 per 100,000, Rhode Island’s overall rate.
The results of this analysis at the town/city level show that most areas have primary care physician-to-
population rates below 80/100,000; however, eleven towns or cities have rates above that level. To
eliminate these differences would require shifting 217 physicians. PCSAs with an “excess” have less

Coordinated Health Planning Project: Final Report of Findings: Draft v2 Page 30
variability in primary care to population rates; thus eliminating the difference in rates would require
shifting physicians away from these areas.
For clarity, it is noted that this is a heuristic exercise. The next step in this analysis is to better
understand differences in rates across communities. In the PCSA analysis, the higher primary care rates
in Providence and East Providence reflect to a certain extent the greater likelihood that primary care
physicians in this area are working as hospitalists. Likewise, as noted above, these areas also have a
generally less healthy population and may require more physicians. In the towns or cities, in particular,
the proximity of more providers in nearby areas may suggest that for policy purposes, it may make
sense to combine certain areas into more rational service areas.

Coordinated Health Planning Project: Final Report of Findings: Draft v2 Page 31
Table 15. Maldistribution of Primary Care Physicians, Town/City-level
Town/City PC Rate Population Current PC Needed PC Excess Shortage
BARRINGTON 97.2 16,310 16 13 -3 0
BRISTOL 45.2 22,905 10 18 0 8
BURRILLVILLE 29.5 15,955 5 13 0 8
CENTRAL FALLS 42.4 19,323 8 15 0 7
CHARLESTOWN 34.3 7,791 3 6 0 3
COVENTRY 15.9 34,965 6 28 0 22
CRANSTON 63.4 80,438 51 64 0 13
CUMBERLAND 64 33,506 21 27 0 6
EAST GREENWICH 240.8 13,092 32 10 -22 0
EAST PROVIDENCE 113.8 46,748 53 37 -16 0
EXETER 0 6,426 0 5 0 5
FOSTER 18.8 4,606 1 4 0 3
GLOCESTER 8.2 9,751 1 8 0 7
HOPKINTON 52.1 8,188 4 7 0 3
JAMESTOWN 34.3 5,211 2 4 0 2
JOHNSTON 61.5 28,784 18 23 0 5
LINCOLN 155.3 21,018 33 17 -16 0
LITTLE COMPTON 18.3 3,492 1 3 0 2
MIDDLETOWN 50.9 16,148 8 13 0 5
NARRAGANSETT 52.6 15,680 8 13 0 5
NEW SHOREHAM 175 1,022 2 1 -1 0
NEWPORT 94.2 24,645 23 20 -3 0
NORTH KINGSTOWN 38.8 26,521 10 21 0 11
NORTH PROVIDENCE 77.3 32,257 25 26 0 1
NORTH SMITHFIELD 87.6 11,967 10 10 0 0
PAWTUCKET 107.3 71,193 76 57 -19 0
PORTSMOUTH 37.8 17,053 6 14 0 8
PROVIDENCE 132.1 177,946 235 142 -93 0
RICHMOND 12.3 7,708 1 6 0 5
SCITUATE 8.9 10,329 1 8 0 7
SMITHFIELD 64.4 21,425 14 17 0 3
SOUTH KINGSTOWN 115.7 30,639 35 25 -10 0
TIVERTON 27.2 15,739 4 13 0 9
WARREN 32.7 10,617 3 8 0 5
WARWICK 86.8 82,080 71 66 -5 0
WEST GREENWICH 0 6,133 0 5 0 5
WEST WARWICK 23.8 29,260 7 23 0 16
WESTERLY 75.8 22,672 17 18 0 1
WOONSOCKET 45.8 41,186 19 33 0 14
Total 1,050,729 841 841 -188 188

Coordinated Health Planning Project: Final Report of Findings: Draft v2 Page 32
Table 16. Maldistribution of Primary Care Physicians, PCSA-level
PopulationPC
Rate
Current
PC
Need
PCShortage Excess
BLOCKISLAND 960 96 1 1 0 0
BRISTOL 33,567 43.4 15 27 12 0
GREENVILLE 38,415 43.3 17 31 14 0
HOPEVALLEY 9,187 67.1 6 7 1 0
NEWPORT 62,198 80.2 50 50 0 0
PASCOAG 15,745 34.8 5 13 7 0
PAWTUCKET 162,706 78.3 127 131 4 0
WAKEFIELD 81,915 65.8 54 66 12 0
WARWICK 178,258 62.5 111 143 32 0
WESTERLY 49,153 66.5 33 40 7 0
PROVIDENCE 313,290 105.2 330 252 0 -77
EASTPROVIDENCE 78,830 94.8 75 63 0 -11
Total 1,024,224 824 824 89 -88

Coordinated Health Planning Project: Final Report of Findings: Draft v2 Page 33
3. Task 2: Gap Analysis for Workforce Development
The second gap analysis looks at the physician workforce development in Rhode Island. The production
of health care providers in Rhode Island is examined and whether current state-level efforts are
adequate given Rhode Island’s changing needs is determined. By design, this gap analysis is a
complement to the analysis related to primary care services.
3.1 Rhode Island’s Production of Health Care Professionals
The 2011 American Medical Association (AMA) Masterfile and its GME historical supplement were used
to identify physicians completing residency between 2006 and 2008 (117,504 physicians nationwide). A
historical cohort was selected to allow physicians time to locate after training and the AMA Masterfile to
update. Given the focus on characterizing institutional and training site outcomes, 8,977 physicians
completed more than one residency during this period and were represented more than once in our
data set. Using the same data, these physicians were characterized 5-7 years after they had completed
residency in order to estimate primary care and other indicators. In cases where there was a conflict
between the physicians' primary specialty and the specialty associated with their final residency
training, the residency information was used. Primary care was defined as family medicine, general
internal medicine, general pediatrics, internal medicine-pediatrics, internal medicine geriatrics, family
medicine geriatrics.
Practice addresses were used to determine physician location. The National Provider and Plan
Enumeration System Downloadable File (NPPES)35 was used to improve the quality of practice
addresses in the AMA Masterfile. Using unique combinations of name and address, 97% of the
physicians in the 2011 NPPeS were matched with physicians in the Masterfile. The NPPES physician
address was given preferential treatment if the NPPES update year was later than the last year of
residency for an individual physician. As the cohort (2006-2008 graduates) was a relatively recent
cohort, the NPPES correction increased the likelihood of capturing current work addresses.
For Rhode Island, six sponsoring institutions were identified (see Table 17). These vary substantially in
terms of the number of residents who graduated from 2006 to 2008, with Rhode Island Hospital-
LifeSpan accounting for most of the state’s residents (n=556), followed by Roger Williams hospital
(n=82) and Memorial Hospital (n=78). There is substantial variation in the production of primary care,
with Memorial Hospital having exactly 50% of their graduates practicing as primary care physicians
compared to just 20% of Rhode Island Hospital’s residents. The gender composition is roughly
comparable across the six sponsoring institutions. Restricting the analysis to the residents practicing in
direct patient care as of 2012, the in-state retention rate of residents is generally low, with the larger
institutions retaining 20-23% of their residents in-state. Butler Hospital is an exception with 54% of its
residents staying in-state.
At the same time that Rhode Island loses many of its residents to other states, it also benefits from
residents from other states moving to Rhode Island (see Table 18). Massachusetts is by far the largest

Coordinated Health Planning Project: Final Report of Findings: Draft v2 Page 34
exporter to Rhode Island with 70 residents who graduated in 2006-2008. The other top states—
California, New York, New Jersey and Florida are generally larger populations.
Table 17. Characteristics of Rhode Island’s Residents who Graduated in 2006-2008, by Sponsoring Institution
Table 18. Top States Sending Residents to Rhode Island
3.2 Projections of Future Needs for Health Care Professionals
Current health care utilization data (available nationally and at a state-level) was used to project future
health care needs due to such factors as (a) population growth, (b) aging of the population, and (c) the
rise in the number of insured patients. Specifically the 2007-2009 data from the Medical Expenditure
Panel Survey (MEPS) is used to calculate primary care utilization rates. The MEPS is administered by the
Agency for Healthcare Research and Quality (AHRQ) and collects data from a nationally representative
sample of individuals and families regarding health conditions, health status, use of medical services,
insurance coverage, and access to care. MEPS queries a sample of the civilian, noninstitutionalized
population regardless of their health care use, thereby allowing estimates of mean office visits by age,
sex, and insurance status.
To understand how demographic changes and the PPACA will affect future need, utilization rates by age
groups and sex categories are calculated for both insured and uninsured respondents. Next the U.S.
Census Bureau projections of the age-sex distribution of Rhode Island’s population through 2025 are
used to calculate future utilization, assuming current utilization patterns. Similarly, the best available
estimates of the proportion of the uninsured that will be able to obtain coverage under the PPACA were
Sponsoring Institution Residents % PC %FP % IM % IMG % Female
Roger Williams Hospital 82.0 25.6 1.2 24.4 0.0 46.3 23.0 (=9/39)
Memorial Hospital of Rhode Island 78.0 84.6 50.0 30.8 2.8 57.7 20.0 (=9/45)
Rhode Island Hospital - Lifespan 556.0 14.7 0.2 8.3 1.4 44.2 20.0 (=59/290)
Butler Hospital 37.0 5.4 2.7 2.7 0.0 59.5 54.0 (=7/13)
Brown University Affiliate Hospitals 4.0 0.0 0.0 0.0 0.0 50.0 0.0 (=0/3)
Women & Infants Hospital 35.0 5.7 2.9 2.9 0.0 82.9 41.0 (=7/17)
Practice in State *
State Number of Residents
Massachuetts 70
California 31
New York 19
Florida 15
New Jersey 15
Source: AMA Masterfile, 2006-2008
Top States Sending Residents to Rhode Island

Coordinated Health Planning Project: Final Report of Findings: Draft v2 Page 35
summarized. To provide an understanding of how these estimates are sensitive to the underlying
assumptions, different scenarios can be modeled.
To begin calculating future primary care physician workforce needs, an estimate of the current primary
care utilization rates and the size of the current U.S. primary care physician workforce are needed.
These figures were used to estimate the average number of annual visits a physician conducts. Next,
using U.S. Census data and current primary care utilization, the number of annual primary care visits
Americans will make are projected based on population growth and aging. Finally, using the differences
in current primary care utilization rates between those with and without insurance, increases in primary
care utilization as a result of the ACA’s insurance expansion are estimated. On the basis of the expected
number of annual primary care office visits and the estimate of the number of visits a primary care
physician conducts in a year, the future primary care physician workforce needs are calculated.
Ideally rates specific to Rhode Island or New England could have been calculated; however, small cell
sizes (for age/sex/insurance combinations) yielded imprecise estimates. Instead, data from the North
East region was used as the benchmark. The mean number of primary care physician office visits per
person was calculated; a primary care physician office visit was defined as a visit to a general
practitioner, family physician, pediatrician, geriatrician, or general internist. On the basis of the analysis
(described subsequently), we estimate that 46.4 percent of all physician office visits are to primary care
physicians. Although this figure is slightly lower than data from the 2007 National Ambulatory Medical
Care Survey (NAMCS), which shows that 50 percent of all physician office visits are to primary care
physicians, it is comparable.
The total estimated annual number of physician office visits is divided by the estimated number of
practicing physicians to determine the current annual visits per primary care physician in the United
States. The mean number of office-based visits to primary care physician is also calculated for each age
category and sex, using MEPS from 2008 for the insured and uninsured populations. To determine the
impact of population expansion and aging, these rates were applied to the U.S. Census Bureau projected
populations for 2010- 2025 for population groups by age category and sex to calculate the total office-
based visits for the entire projected population.
The total number of projected visits were divided by the current number of annual visits per physician to
estimate the number of primary care physicians needed to accommodate the projected number of
office visits given population expansion and aging. To estimate increased primary care physician use
after the ACA goes into effect, first the number of physicians needed with universal coverage is
calculated. To calculate the total office-based visits for a universally insured population, the mean
number of office-based visits (using MEPS data for insured patients only) is multiplied by the entire
projected U.S. population (for each age and sex category). Next this figure is substituted into the
aforementioned equations to calculate the number of physicians needed under universal coverage.
The marginal primary care physician need was estimated by removing the physicians needed as a result
of population aging and growth. This marginal need was then multiplied by the proportion of the
currently uninsured who are likely to receive coverage under ACA to account for those who will remain

Coordinated Health Planning Project: Final Report of Findings: Draft v2 Page 36
uninsured despite the ACA, calculated as the ratio of the Centers for Medicare and Medicaid Services
(CMS) yearly estimate of the increased percentage of insured under the ACA and the percentage of
uninsured in the absence of ACA. These projections do not account for the likely geographic
maldistribution of additional primary care physicians; they are also conservative in that certain
segments of the uninsured (such as older individuals) may be sicker than the insured and could use
more services if insured.
Based on the analysis of the MEPS data, there were 1.7 million total office visits to Rhode Island primary
care physicians and 896 such physicians. Yearly each primary care physician was estimated to have 1911
visits. According to the U.S. Census projections, Rhode Island’s population will increase by about 36,000
from 2010 to 2025. Although all segments are expected to increase, the population aged older than 65
years will grow faster. The population thus will both increase overall and age. Using these projections
and the mean office visits for each age and sex category calculated for our base year of 2008, the total
number of office visits to primary care physicians for Rhode Island are projected to increase from a base
of 1.71 million in 2011 to 1.87 million in 2025. Due to the aging of the population, the average number
of visits to primary care physicians increases from 1.61 in 2008 to 1.69 in 2025.
Assuming the average Rhode Island primary care physician sees 1,911 visits yearly, to meet the
increased need for primary care office visits, additional physicians will be required. By 2025 Rhode
Island would require an estimated 1,025 practicing primary care physicians, an increase of 218 from the
current workforce (Table 19). Most of this increased need is attributable to gradual population growth
and aging. In contrast, the increase from insurance expansion, requiring approximately 50 additional
physicians, will occur more abruptly, with the bulk of the increase expected in 2014 and 2015.
Table 19. Projected Primary Care Physicians Need for Rhode Island by Year
“PC” represents “Primary Care Physician” 2010 2015 2020 2025
Estimated RI Population 1,052,251 1,076,772 1,118,276 1,179,469
Total number of PC visits 1,659,053 1,722,125 1,818,316 1,954,239
Average number of PC visits per resident 1.58 1.60 1.63 1.66
RI Residents per PC Physician 1,174 1,158 1,139 1,117
Current number of PC Physicians 896 896 896 896
Increase due to Aging 0 12 28 49
Increase due to Population Growth 0 22 58 110
Increase due to ACA Coverage 50 52 55 59
Required number of PC Physicians 946 982 1,037 1,115
Excess/Surplus PC Physicians 50 86 141 218

Coordinated Health Planning Project: Final Report of Findings: Draft v2 Page 37
4. Additional Analysis: Priority Question “How Does Changes in the
Primary Care Delivery System Affect Health Care Outcomes?”
4.1 Hospitalizations and Primary Care
An early adopter of many provisions of the Patient Protection and Affordable Care Act (ACA), Rhode Island has opportunities in the next several years to seize ACA momentum and transform its local health care system. Executive decisions to engage early in ACA opportunities for Medicaid expansion and development of insurance exchanges will allow Rhode Island to expand Medicaid substantially with less than half the average state’s investment. In many ways a ‘city-state’ Rhode Island’s clustered population is mirrored by the affiliations of numerous health care providers. Rhode Island has a high penetration of federally qualified health centers serving its vulnerable population, which bodes well for access post-ACA when paired with the limited uninsured population. That said, Massachusetts, Rhode Island’s neighbor and one of few states with lower uninsurance rates prior to implementation of a mandate, still struggled to build coalitions of care, create primary care adequacy, and reduce ER utilization after its own insurance mandate. As neighboring Massachusetts quickly learned and noted after their 2006 implementation of an insurance mandate, universal coverage does not equal universal access.
Rhode Island Population Projections
The U.S. Census Bureau uses the 2000 Census population numbers to project the population of Rhode
Island from 2004 to 2030 by sex and age. To obtain insurance status for population projection figures,
population estimates by sex, age and insurance status from the 2011 ACS42 are acquired. Next the
percentage of the total population is calculated for each cell, giving a “status quo – no ACA” version of
Rhode Island’s population for each year 2011 through 2030 by sex, age and insurance status. The
“status quo – no ACA” projections take into account ACA insurance status changes which have already
taken place through 2011. Table 20 below presents Rhode Island’s population projections by age, sex
and health insurance status.
Once the “status quo – no ACA” population projections are calculated, the percentage of Rhode Island's
non-elderly population that are currently uninsured are estimated to decrease from approximately 14
percent in 2011 to approximately six percent in 2014. Additionally the percentage of Rhode Island’s
elderly population that are uninsured will decrease from approximately 0.88 percent in 2011 to 0.44
42
See e.g., U.S. Census Bureau, 2009 American Community Survey, Rhode Island, “Health Insurance Coverage Status by Sex by Age: Universe: Civilian noninstitutionalized population, 2009 American Community Survey 1-Year Estimates,” available at http://factfinder2.census.gov/faces/tableservices/jsf/pages/productview.xhtml?pid=ACS_09_1YR_B27001&prodType=table.

Coordinated Health Planning Project: Final Report of Findings: Draft v2 Page 38
percent in 2014.43 Table 21 below presents Rhode Island’s population projections by age, sex and health
insurance status after applying the ACA insurance status adjustments.
43
Based on Congressional Budget Office, Estimates for the Insurance Coverage Provisions of the Affordable Care Act Updated for the Recent Supreme Court Decision (July 2012), available at http://www.cbo.gov/sites/default/files/cbofiles/attachments/43472-07-24-2012-CoverageEstimates.pdf, and Mathew Buettgens, Bowen Garrett, and John Holahan, America Under the Affordable Care Act, Urban Institute and the Robert Wood Johnson Foundation (Dec 2010), available at http://www.urban.org/UploadedPDF/412267-america-under-aca.pdf.

Coordinated Health Planning Project: Final Report of Findings: Draft v2 Page 39
Table 20. Baseline Rhode Island Population Projections by Sex, Age and Health Insurance Status, no ACA adjustments
Total Male Female Total Male Female Total Male Female Total Male Female Total Male Female
ALL 1,121,758 539,518 582,240 1,139,543 548,136 591,407 1,154,230 555,169 599,061 1,157,855 556,683 601,172 1,152,941 554,029 598,912
0-6 79,959 40,930 39,029 83,455 42,860 40,595 85,038 43,824 41,214 83,074 42,998 40,076 78,831 40,985 37,846
ins 78,009 40,358 37,651 81,423 42,261 39,162 82,971 43,212 39,759 81,058 42,397 38,661 76,922 40,412 36,510
no ins 1,950 572 1,378 2,032 599 1,433 2,067 612 1,455 2,016 601 1,415 1,909 573 1,336
6-17 168,134 85,498 82,636 164,884 83,984 80,900 168,973 86,463 82,510 173,744 89,404 84,340 173,900 89,999 83,901
ins 160,321 81,381 78,941 157,222 79,939 77,282 161,119 82,299 78,820 165,667 85,098 80,568 165,814 85,665 80,149
no ins 7,813 4,117 3,695 7,662 4,045 3,618 7,854 4,164 3,690 8,077 4,306 3,772 8,086 4,334 3,752
18-24 121,428 61,572 59,856 117,460 59,211 58,249 103,975 52,427 51,548 99,528 50,348 49,180 101,192 51,541 49,651
ins 96,658 48,149 48,509 93,510 46,303 47,207 82,774 40,998 41,776 79,229 39,372 39,857 80,544 40,305 40,239
no ins 24,770 13,423 11,347 23,950 12,908 11,042 21,201 11,429 9,772 20,299 10,976 9,323 20,648 11,236 9,412
25-34 149,693 72,931 76,762 153,200 75,600 77,600 159,750 78,932 80,818 148,801 73,203 75,598 132,260 65,158 67,102
ins 119,652 53,349 66,303 122,328 55,301 67,027 127,545 57,739 69,806 118,845 53,548 65,297 105,622 47,663 57,959
no ins 30,041 19,582 10,459 30,872 20,299 10,573 32,205 21,193 11,012 29,956 19,655 10,301 26,638 17,495 9,143
35-44 139,985 67,935 72,050 140,872 68,026 72,846 146,700 70,918 75,782 149,467 73,385 76,082 154,153 75,946 78,207
ins 119,764 55,214 64,551 120,551 55,288 65,264 125,532 57,638 67,894 127,806 59,643 68,163 131,791 61,725 70,067
no ins 20,221 12,721 7,499 20,321 12,738 7,582 21,168 13,280 7,888 21,661 13,742 7,919 22,362 14,221 8,140
45-54 166,746 80,725 86,021 157,679 76,058 81,621 138,990 66,778 72,212 135,888 64,859 71,029 140,496 67,133 73,363
ins 145,578 70,133 75,445 137,664 66,078 71,586 121,350 58,016 63,334 118,645 56,349 62,296 122,668 58,324 64,343
no ins 21,168 10,592 10,576 20,015 9,980 10,035 17,640 8,762 8,878 17,243 8,510 8,733 17,828 8,809 9,020
55-64 136,396 65,447 70,949 146,751 69,874 76,877 152,832 72,725 80,107 142,845 67,573 75,272 125,602 59,082 66,520
ins 122,355 58,303 64,052 131,650 62,247 69,404 137,106 64,786 72,320 128,151 60,197 67,955 112,686 52,633 60,053
no ins 14,041 7,144 6,897 15,101 7,627 7,473 15,726 7,939 7,787 14,694 7,376 7,317 12,916 6,449 6,467
65-74 78,000 35,557 42,443 94,123 43,388 50,735 110,819 50,928 59,891 122,201 55,720 66,481 126,749 57,829 68,920
ins 77,559 35,514 42,044 93,594 43,336 50,259 110,195 50,867 59,329 121,510 55,653 65,857 126,032 57,759 68,273
no ins 441 43 399 529 52 476 624 61 562 691 67 624 717 70 647
75+ 81,417 28,923 52,494 81,119 29,135 51,984 87,153 32,174 54,979 102,307 39,193 63,114 119,758 46,356 73,402
ins 81,356 28,923 52,433 81,059 29,135 51,924 87,089 32,174 54,915 102,234 39,193 63,041 119,673 46,356 73,317
no ins 61 0 61 60 0 60 64 0 64 73 0 73 85 0 85
2030
Age
2011 2015 2020 2025

Coordinated Health Planning Project: Final Report of Findings: Draft v2 Page 40
Table 21. ACA Rhode Island Population Projections by Sex, Age and Health Insurance Status, including ACA adjustments
Total Male Female Total Male Female Total Male Female Total Male Female Total Male Female
ALL 1,121,758 539,518 582,240 1,139,543 548,136 591,407 1,154,230 555,169 599,061 1,157,855 556,683 601,172 1,152,941 554,029 598,912
0-6 79,959 40,930 39,029 83,455 42,860 40,595 85,038 43,824 41,214 83,074 42,998 40,076 78,831 40,985 37,846
ins 78,009 40,358 37,651 82,475 42,571 39,904 84,032 43,526 40,506 82,083 42,703 39,381 77,891 40,703 37,188
no ins 1,950 572 1,378 980 289 691 1,006 298 708 991 295 695 940 282 658
6-17 168,134 85,498 82,636 164,884 83,984 80,900 168,973 86,463 82,510 173,744 89,404 84,340 173,900 89,999 83,901
ins 160,321 81,381 78,941 161,188 82,033 79,155 165,150 84,436 80,714 169,774 87,288 82,486 169,916 87,864 82,053
no ins 7,813 4,117 3,695 3,696 1,951 1,745 3,823 2,027 1,796 3,970 2,116 1,854 3,984 2,135 1,849
18-24 121,428 61,572 59,856 117,460 59,211 58,249 103,975 52,427 51,548 99,528 50,348 49,180 101,192 51,541 49,651
ins 96,658 48,149 48,509 105,908 52,985 52,923 93,654 46,863 46,791 89,552 44,954 44,598 91,019 46,005 45,014
no ins 24,770 13,423 11,347 11,552 6,226 5,326 10,321 5,564 4,757 9,976 5,394 4,582 10,173 5,536 4,637
25-34 149,693 72,931 76,762 153,200 75,600 77,600 159,750 78,932 80,818 148,801 73,203 75,598 132,260 65,158 67,102
ins 119,652 53,349 66,303 138,309 65,809 72,500 144,072 68,615 75,457 134,079 63,543 70,536 119,136 56,538 62,597
no ins 30,041 19,582 10,459 14,891 9,791 5,100 15,678 10,317 5,361 14,722 9,660 5,062 13,124 8,620 4,505
35-44 139,985 67,935 72,050 140,872 68,026 72,846 146,700 70,918 75,782 149,467 73,385 76,082 154,153 75,946 78,207
ins 119,764 55,214 64,551 131,071 61,882 69,189 136,395 64,453 71,942 138,821 66,631 72,190 143,136 68,939 74,196
no ins 20,221 12,721 7,499 9,801 6,144 3,657 10,305 6,465 3,840 10,646 6,754 3,892 11,017 7,007 4,011
45-54 166,746 80,725 86,021 157,679 76,058 81,621 138,990 66,778 72,212 135,888 64,859 71,029 140,496 67,133 73,363
ins 145,578 70,133 75,445 148,025 71,244 76,781 130,403 62,513 67,890 127,414 60,676 66,737 131,712 62,793 68,919
no ins 21,168 10,592 10,576 9,654 4,814 4,840 8,587 4,265 4,322 8,474 4,183 4,292 8,784 4,340 4,444
55-64 136,396 65,447 70,949 146,751 69,874 76,877 152,832 72,725 80,107 142,845 67,573 75,272 125,602 59,082 66,520
ins 122,355 58,303 64,052 139,467 66,195 73,272 145,176 68,860 76,316 135,623 63,948 71,676 119,238 55,904 63,334
no ins 14,041 7,144 6,897 7,284 3,679 3,605 7,656 3,865 3,791 7,222 3,625 3,596 6,364 3,178 3,186
65-74 78,000 35,557 42,443 94,123 43,388 50,735 110,819 50,928 59,891 122,201 55,720 66,481 126,749 57,829 68,920
ins 77,559 35,514 42,044 93,950 43,371 50,579 110,621 50,909 59,713 121,978 55,698 66,279 126,507 57,805 68,701
no ins 441 43 399 173 17 156 198 19 178 223 22 202 242 24 219
75+ 81,417 28,923 52,494 81,119 29,135 51,984 87,153 32,174 54,979 102,307 39,193 63,114 119,758 46,356 73,402
ins 81,356 28,923 52,433 81,099 29,135 51,964 87,133 32,174 54,959 102,283 39,193 63,090 119,729 46,356 73,373
no ins 61 0 61 20 0 20 20 0 20 24 0 24 29 0 29
Age
2011 2015 2020 2025 2030

Coordinated Health Planning Project: Final Report of Findings: Draft v2 Page 41
Rhode Island Hospitalization Rate Projections
Rhode Island has seen a decline in both the number of hospitalizations and the average days spent in
the hospital over the past several years. Other areas have also experienced similar trends. Kalra et al.
found that while the number of internal medicine hospital admissions increased from 117 per month in
1991 to 455 per month in 2004 while the mean length of stay decreased from 8.76 to 4.9 days at Temple
University Hospital (the hospital with the highest percentage of Medicaid and uninsured patients in the
state of Pennsylvania).44 The CDC shows that the rate of hospitalization for stroke increased from 32.4
in 1989 to 34.9 in 1999 and has since decreased to 31.8 in 2009.45
According to the Kaiser Health News Blog, UnitedHealth Group’s chief financial officer Dan Schumaher
reported in April 2012 that its treatment volume is “tracking right in line with our expectations, which is
the say we saw a modest increase in utilization.” Additionally, “Outpatient is the place where we see
the most increases, and on the inpatient side we actually continue to see that very restrained. Our
hospital bed days are actually flat to down in each of our businesses.” According to the Healthcare Cost
and Utilization Project (HCUP) and the Agency for Heathcare Research and Quality (AHRQ), from 2003 to
2007 the rate of potentially preventable hospitalizations declined faster for older adults, those
individuals aged 65 and older, than for younger adults, individuals aged 18 to 64.46
To project baseline hospitalization rates from 2011 through 2030, first the hospitalization rate for each age, sex and insurance status cell is determined using MEPS data. Then the percentage of the insured (uninsured) population who experience a hospitalization in a given year are multiplied by the baseline population projections. Total hospitalization numbers are found by summing the number of hospitalizations experienced by the uninsured and insured population for each age, sex category. Table 22 presents the baseline hospitalizations projections through 2030. These baseline projections do not take into account the change in the rate of uninsurance expected as a result of implementing the ACA provisions.47 Table 23 presents Rhode Island’s hospitalization projections through 2030 that take into account the ACA insurance status adjustments discussed above.
44
See e.g., Amit D. Kalra, Robert S. Fisher, and Peter Axelrod, Decreased Length of Stay and Cumulative Hospitalized Days Despita Increased patient Admissions and Readmissions in an Area of Urban Poverty, Journal of General Internal Medicine, Volume 25, Number 9 (September 2010). 45
See e.g., Margaret Jean Hall, Shaleah Levant, and Carol DeFrances, Hospitalization for Stroke in U.S. Hospitals, 1989-2009, Centers for Disease Control and Prevention, National Center for Health Statistics Data Brief, Number 95 (May 2012), available at http://www.cdc.gov/nchs/data/databriefs/db95.pdf. 46
See e.g., Elizabeth Strangers and Bernard Friedman, Potentially Preventable Hospitalization Rates Decline for Older Adults, 2003-2007, Healthcare Cost and Utilization Project and Agency for Healthcare Research and Quality, Statistical Brief #83 (December 2009), available at http://www.hcup-us.ahrq.gov/reports/statbriefs/sb83.pdf. 47
ACA adjusted population and hospitalization rates will be presented in the final full report.

Coordinated Health Planning Project: Final Report of Findings: Draft v2 Page 42
Table 22. Baseline Rhode Island Hospital Discharge Projections by Sex, Age and Health Insurance Status, no ACA adjustments
Total Male Female Total Male Female Total Male Female Total Male Female Total Male Female
ALL 113,154 42,077 71,078 116,995 44,067 72,928 121,596 46,516 75,081 126,204 49,209 76,994 129,714 51,243 78,471
0-6 3,803 1,953 1,850 3,969 2,045 1,924 4,045 2,091 1,953 3,951 2,052 1,899 3,749 1,956 1,793
ins 3,719 1,932 1,787 3,882 2,023 1,859 3,956 2,068 1,887 3,865 2,029 1,835 3,668 1,934 1,733
no ins 84 22 62 87 23 65 89 23 66 87 23 64 82 22 60
6-17 3,544 1,423 2,121 3,474 1,398 2,077 3,557 1,439 2,118 3,653 1,488 2,165 3,651 1,498 2,154
ins 3,490 1,407 2,083 3,421 1,382 2,039 3,503 1,423 2,080 3,597 1,471 2,126 3,596 1,481 2,115
no ins 54 16 38 53 15 38 54 16 38 55 16 39 55 16 39
18-24 7,646 1,381 6,266 7,425 1,328 6,098 6,572 1,176 5,396 6,277 1,129 5,148 6,353 1,156 5,198
ins 6,881 1,268 5,613 6,681 1,219 5,462 5,913 1,079 4,834 5,649 1,037 4,612 5,717 1,061 4,656
no ins 766 113 653 744 109 635 658 96 562 629 92 536 636 95 541
25-34 12,317 1,532 10,784 12,491 1,588 10,902 13,013 1,658 11,354 12,159 1,538 10,621 10,796 1,369 9,427
ins 11,406 1,136 10,270 11,560 1,177 10,383 12,042 1,229 10,813 11,254 1,140 10,115 9,992 1,015 8,978
no ins 911 397 514 931 411 520 971 429 541 904 398 506 804 354 449
35-44 9,909 3,650 6,259 9,984 3,655 6,328 10,394 3,811 6,583 10,553 3,943 6,609 10,875 4,081 6,794
ins 9,265 3,374 5,891 9,335 3,379 5,956 9,718 3,522 6,196 9,865 3,645 6,220 10,166 3,772 6,394
no ins 645 276 369 649 276 373 676 288 388 687 298 389 709 309 400
45-54 15,974 6,434 9,539 15,114 6,062 9,052 13,331 5,323 8,008 13,047 5,170 7,877 13,487 5,351 8,136
ins 15,069 5,957 9,112 14,259 5,613 8,646 12,577 4,928 7,649 12,310 4,786 7,524 12,725 4,954 7,771
no ins 905 477 428 855 449 406 754 395 359 736 383 353 761 397 365
55-64 18,246 7,917 10,329 19,644 8,453 11,191 20,459 8,798 11,662 19,132 8,175 10,958 16,831 7,147 9,684
ins 16,817 7,052 9,765 18,110 7,529 10,581 18,862 7,836 11,026 17,641 7,281 10,360 15,522 6,366 9,155
no ins 1,429 865 563 1,534 924 611 1,598 961 636 1,491 893 598 1,309 781 528
65-74 15,707 7,614 8,093 18,965 9,290 9,674 22,325 10,905 11,420 24,608 11,931 12,677 25,525 12,383 13,142
ins 15,684 7,614 8,070 18,937 9,290 9,647 22,293 10,905 11,388 24,572 11,931 12,641 25,487 12,383 13,104
no ins 23 0 23 28 0 28 33 0 33 36 0 36 38 0 38
75+ 26,008 10,172 15,836 25,929 10,247 15,682 27,901 11,316 16,586 32,824 13,784 19,040 38,447 16,303 22,143
ins 26,002 10,172 15,830 25,923 10,247 15,676 27,895 11,316 16,579 32,816 13,784 19,032 38,438 16,303 22,134
no ins 6 0 6 6 0 6 7 0 7 8 0 8 9 0 9
2030Age
2011 2015 2020 2025

Coordinated Health Planning Project: Final Report of Findings: Draft v2 Page 43
Table 23. ACA Rhode Island Hospital Discharge Projections by Sex, Age and Health Insurance Status, including ACA adjustments
Total Male Female Total Male Female Total Male Female Total Male Female Total Male Female
ALL 113,154 42,077 71,078 119,480 44,701 74,779 124,002 47,120 76,882 128,522 49,809 78,713 131,973 51,859 80,114
0-6 3,803 1,953 1,850 3,974 2,049 1,926 4,049 2,095 1,955 3,956 2,055 1,901 3,754 1,959 1,795
ins 3,719 1,932 1,787 3,932 2,038 1,894 4,006 2,083 1,923 3,913 2,044 1,870 3,714 1,948 1,765
no ins 84 22 62 42 11 31 43 11 32 43 11 31 40 11 30
6-17 3,544 1,423 2,121 3,533 1,426 2,107 3,616 1,468 2,148 3,713 1,517 2,196 3,712 1,527 2,184
ins 3,490 1,407 2,083 3,507 1,418 2,089 3,590 1,460 2,130 3,686 1,509 2,177 3,684 1,519 2,165
no ins 54 16 38 25 7 18 26 8 19 27 8 19 27 8 19
18-24 7,646 1,381 6,266 7,878 1,447 6,430 6,969 1,281 5,688 6,653 1,229 5,424 6,733 1,258 5,475
ins 6,881 1,268 5,613 7,519 1,395 6,124 6,648 1,234 5,414 6,344 1,183 5,161 6,420 1,211 5,209
no ins 766 113 653 359 52 306 320 47 274 309 45 264 313 47 267
25-34 12,317 1,532 10,784 13,080 1,599 11,481 13,621 1,670 11,952 12,723 1,548 11,175 11,296 1,378 9,918
ins 11,406 1,136 10,270 12,631 1,401 11,230 13,149 1,460 11,688 12,279 1,353 10,926 10,900 1,203 9,696
no ins 911 397 514 449 198 251 473 209 263 445 196 249 396 175 221
35-44 9,909 3,650 6,259 10,409 3,915 6,494 10,833 4,079 6,754 10,998 4,219 6,779 11,333 4,365 6,968
ins 9,265 3,374 5,891 10,096 3,782 6,314 10,504 3,939 6,565 10,660 4,072 6,588 10,984 4,213 6,771
no ins 645 276 369 313 133 180 329 140 189 338 147 191 349 152 197
45-54 15,974 6,434 9,539 15,737 6,268 9,469 13,876 5,502 8,374 13,576 5,342 8,234 14,033 5,529 8,503
ins 15,069 5,957 9,112 15,325 6,052 9,273 13,509 5,310 8,199 13,214 5,154 8,060 13,657 5,334 8,324
no ins 905 477 428 412 217 196 367 192 175 362 188 174 375 195 180
55-64 18,246 7,917 10,329 19,918 8,452 11,465 20,742 8,797 11,945 19,395 8,174 11,221 17,063 7,147 9,916
ins 16,817 7,052 9,765 19,177 8,007 11,171 19,964 8,329 11,635 18,662 7,735 10,927 16,418 6,762 9,656
no ins 1,429 865 563 740 446 294 778 468 310 733 439 294 645 385 260
65-74 15,707 7,614 8,093 19,015 9,298 9,717 22,386 10,914 11,472 24,674 11,941 12,734 25,592 12,393 13,199
ins 15,684 7,614 8,070 19,006 9,298 9,708 22,375 10,914 11,461 24,663 11,941 12,722 25,579 12,393 13,187
no ins 23 0 23 9 0 9 10 0 10 12 0 12 13 0 13
75+ 26,008 10,172 15,836 25,937 10,247 15,690 27,910 11,316 16,594 32,834 13,784 19,049 38,458 16,303 22,154
ins 26,002 10,172 15,830 25,935 10,247 15,688 27,908 11,316 16,592 32,831 13,784 19,047 38,455 16,303 22,151
no ins 6 0 6 2 0 2 2 0 2 2 0 2 3 0 3
Age2011 2015 2020 2025 2030

Coordinated Health Planning Project: Final Report of Findings: Draft v2 Page 44
Table 24 presents three scenarios for the projected total number of hospitalizations in Rhode Island.
The first set of columns gives the “Status Quo Rhode Island Rate” scenario that simply repeats the total
row from above. The “Maine Rate” scenario presents the total hospitalizations Rhode Island could
experience if their rate of hospitalizations was to drop to a rate closer to Maine’s rate, a reduction of 3
percent. If Rhode Island’s number of hospitalizations dropped 8.5 percent, to the “Vermont Rate,”
Rhode Island could see slightly more than 11,000 fewer hospitalizations in 2030.
Table 24. Rhode Island's Hospitalizations Under Other State Hospitalization Rate
Scenarios
Total Male Female Total Male Female Total Male Female
2011 113,154 42,077 71,078 109,760 40,814 68,945 103,536 38,500 65,036
2015 120,177 45,079 75,098 116,571 43,727 72,845 109,962 41,247 68,714
2020 124,463 47,452 77,011 120,729 46,028 74,701 113,884 43,419 70,465
2025 128,704 50,121 78,583 124,843 48,617 76,226 117,764 45,861 71,904
2030 131,907 52,167 79,740 127,950 50,602 77,348 120,695 47,732 72,962
Rhode Island Rate
Status Quo
Maine Rate
(3% fewer)
Vermont Rate
(8.5% fewer)

Coordinated Health Planning Project: Final Report of Findings: Draft v2 Page 45
Table 25 below presents three scenarios for the projected total number of hospitalizations in Rhode
Island. The first column gives the population to which the numbers pertain. The second column gives
the Program used as a template for calculating numbers. The next two columns present the results of
each initiative that was investigated for impacts on hospitalizations. The final columns presents the
potential percentage change/difference in hospitalizations rate Rhode Island could achieve if the state
were to adopt the initiative studied. In summary, Rhode Island could reduce the rate of hospitalizations
for their elderly population by approximately 43.9 percent per 1,000 member months and the rate of
hospitalizations for their non-elderly population by approximately 6 percent per 1,000 member months.

Coordinated Health Planning Project: Final Report of Findings: Draft v2 Page 46
Table 25. Potential Reductions in Rhode Island's Hospitalization Rates
Hospitalizations and Hospital Referral Regions
For the Rhode Island study we use Dartmouth Atlas hospital referral region (HRR)48 hospitalization data
from 2008-2010 and workforce data from 2006 to examine the relationship between workforce
size/composition and hospitalization rates.
According to Dartmouth Atlas,
Hospital referral regions (HRRs) represent regional health care markets for
tertiary medical care that generally requires the services of a major referral
center. The regions were defined by determining where patients were referred
for major cardiovascular surgical procedures and for neurosurgery. Each
hospital service area (HSA) was examined to determine where most of its
residents went for these services. The result was the aggregation of the 3,436
hospital service areas into 306 HRRs. Each HRR has at least one city where both
major cardiovascular surgical procedures and neurosurgery are performed.
In this data, the state of Rhode Island is entirely contained in a single HRR, centered in Providence.
A substantial literature has examined the determinants of variation in health utilization at an HRR level
and other levels of geography.49 These studies show that an increase in the supply of primary care
48
See e.g., http://www.dartmouthatlas.org.
49 See e.g., http://www.dartmouthatlas.org/downloads/reports/Primary_care_report_090910.pdf); Chiang-
Hua Chang, et al., Primary Care Physician Workforce and Medicare Beneficiaries’ Health Outcomes, Journal of American Medical Association, volume 305, number 20 (May 2011), Phillips, RL ; Petterson, SM; Bazemore, AW.
Population Type ProgramComparison
Group
Initiative
GroupDifference
Percentage
Change
Percentage
Difference
Limited RI population PCMH (CSI-RI) 8.45 7.93 -0.52 -6.15%
*(-8.1%)
PC to POP
Optimal Ratio
Medicare: Texas and 7-
state regionACO (WellMed) 239 134 105 -43.90%
* 8.1% decrease includes the 6.15% decrease in the CSI group, plus 1.95%, which is the avoided increase in hospitalization in the
Rhode Island general population (9.22 to 9.40 hospitalizations per 1,000 member months)
Hospitalization Rate per 1,000 Member Months or Beneficiary Years
Nationwide Medicare322 298 24 -7.45%

Coordinated Health Planning Project: Final Report of Findings: Draft v2 Page 47
physicians, especially family physicians, tends to lead to a decrease in hospitalizations, health care costs
and related measures. These results hold up in individual-level analyses which include controls for such
factors as age, race and health conditions. 50
The analysis uses three different measures of primary care workforce: 1) all primary care physicians
(family physicians, general practitioners, general internists and pediatricians), 2) only family physicians
(FP) and general practitioners (GP), and 3) family physicians/ general practitioners together with primary
care nurse practitioners (NP) and physician (PA). For consistency in data sources, we used Dartmouth’s
estimates of the HRR level physician workforce as of 2006. Primary care NP and PA data were obtained
from the NPPES as described above. Rates per 100,000 HRR residents were calculated using 2006 HRR
population estimates available from Dartmouth Atlas.
Table 26. Cutoff Values for Provider per 100,000
For ease of presentation, the distribution of each of the three measures in deciles were divided such
that each decile contains the same number of HRRs (30 or 31 per decile). The cutoffs for each set of
deciles are shown in Table 26. With each decile estimates of overall hospitalization rates, which
combine medical and surgical discharge rates available in the Dartmouth data, were calculated. The first
set of estimates is unadjusted and the second set controls for a) acute hospital beds per 1000 and b) the
number of specialists per 100,000. To help interpret the regression results, predicted adjusted and
unadjusted rates setting the covariates at their margins were calculated. Also the percent difference in
hospitalization rates by comparing the rates in the 8th and 10th deciles were computed. Primary Care Physician Workforce and Outcomes JAMA. 2011;306(11):1201-1202., and K. Baicker and A. Chandra, Medicare Spending, the Physician Workforce, and Beneficiaries’ Quality of Care, Health Affairs (Millwood) (2004). 50
Fisher E. and J. Skinner, “Regional Disparities in Medicare Expenditures: Opportunity for Reform”, National Tax
Journal 1997; 50: 413-25. Fisher, ES, Wennberg, DE, Stukel, TA, et al., “The Implications of Regional Variations in
Medicare Spending.” Parts 1 & 2 Ann Intern Med. 18 February 2003;138(4). Zuckerman S., Waidmann, T.,
Berenson, R., Hadley, J., “Clarifying Sources of Geographic Differences in Gelman, A., Park, D., Shor, B. Bafumi, J.;
Cortina, J. Red State, Blue State, Rich State, Poor State. Princeton University Press, 2008. The example actually
comes from the Wikipedia entry on ecological fallacy and thus should be verified.
Cutoffs Min Max Min Max Min Max
1 43.9 55.8 9.7 20.4 24.7 42.3
2 56.3 60.3 20.4 23.6 42.4 46.6
3 60.5 63.7 23.7 26.4 46.9 52.2
4 63.8 67.1 26.5 29.1 52.5 56.5
5 67.2 69.0 29.1 31.5 56.7 60.1
6 69.1 71.6 31.6 34.2 60.1 65.0
7 71.9 76.0 34.2 37.2 65.0 70.0
8 76.3 79.5 37.3 41.1 70.0 77.4
9 79.6 87.0 41.1 45.7 77.4 84.6
10 87.1 117.0 45.8 61.9 84.8 140.8
PC FP FP/NP/PA

Coordinated Health Planning Project: Final Report of Findings: Draft v2 Page 48
The results in Table 27 report the hospitalization regression results using the three different provider
supply measures. The corresponding adjusted estimates are reported in Table 28 and displayed in
Figure 7. In general, there appears to be a non-linear relationship between supply and hospitalization
rates, with the largest decline from the 8th to the 10th decile. This holds across the three different
measures and in both the adjusted and unadjusted results. For the primary care measure, for instance,
the difference between these two deciles is 8.2% (322.6-259.9/322.6).

Coordinated Health Planning Project: Final Report of Findings: Draft v2 Page 49
Table 27. Unadjusted and Adjusted Regression Coefficients for Effect of Provider Supply Hospitalization Rates
Coef SE Coef SE Coef SE Coef SE
2 24.2 12.5 2 0.3 9.9 2 13.5 9.1 2 8.4 7.5
3 9.7 12.6 3 -7.9 10.1 3 11.0 9.2 3 -1.4 7.4
4 -3.4 11.7 4 -6.0 9.4 4 0.5 6.7 4 -4.7 5.7
5 17.0 12.2 5 0.9 9.8 5 -4.8 10.4 5 -17.5 8.4
6 13.7 12.6 6 -0.5 10.0 6 -5.1 9.7 6 -8.0 8.0
7 2.8 9.8 7 -7.0 8.3 7 8.2 11.1 7 -10.4 9.2
8 1.0 11.9 8 -8.7 10.3 8 8.8 11.5 8 -8.2 9.5
9 -16.6 12.4 9 -19.9 10.6 9 -30.6 11.2 9 -38.9 9.2
10 -16.0 11.8 10 -35.4 11.9 10 -40.6 11.7 10 -36.5 9.5
52.5 3.9 52.7 3.6
0.4 0.1 0.0 0.1
Coef SE Coef SE
2 -4.6 9.6 2 -16.5 7.3
3 2.2 10.4 3 -11.9 8.0
4 -1.8 10.2 4 -8.4 7.8
5 -5.6 10.5 5 -17.4 7.9
6 -2.8 10.4 6 -16.7 8.1
7 -3.6 10.8 7 -12.5 8.2
8 14.6 11.9 8 -4.9 9.2
9 -34.0 11.5 9 -43.4 8.9
10 -40.5 12.1 10 -46.6 9.2
53.7 3.6
0.0 0.1
Primary Care Family Physicians
FP/NP/PA
AcuteCareHospitalBedsper10
TotalSpecialistsper100000Re
No correctionNo correction With Correction
AcuteCareHospitalBedsper10
TotalSpecialistsper100000Re
With Correction
No correction With Correction
AcuteCareHospitalBedsper10
TotalSpecialistsper100000Re

Coordinated Health Planning Project: Final Report of Findings: Draft v2 Page 50
Table 28. Adjusted Discharge Rates by Deciles for Three Measures of Provider Supply
Margin SD 95% CI Margin SD 95% CI
1 320.4498 9.518979 [301.8 339.1] 1 323.3502 6.30433 [311 335.7]
2 344.684 8.120805 [328.8 360.6] 2 336.8147 6.561686 [324 349.7]
3 330.1128 8.302301 [313.8 346.4] 3 334.3925 6.759767 [321.1 347.6]
4 317.0168 6.875819 [303.5 330.5] 4 323.8621 2.3051 [319.3 328.4]
5 337.4429 7.6937 [322.4 352.5] 5 318.507 8.218289 [302.4 334.6]
6 334.1276 8.181181 [318.1 350.2] 6 318.2506 7.367345 [303.8 332.7]
7 323.296 2.37891 [318.6 328] 7 331.5237 9.101301 [313.7 349.4]
8 321.4528 7.131021 [307.5 335.4] 8 332.1068 9.56672 [313.4 350.9]
9 303.8034 7.950722 [288.2 319.4] 9 292.7121 9.242102 [274.6 310.8]
10 304.4114 6.982572 [290.7 318.1] 10 282.7163 9.915214 [263.3 302.1]
Margin SD 95% CI
1 328.803 7.145144 [314.8 342.8]
2 324.1988 6.389423 [311.7 336.7]
3 330.9696 7.491976 [316.3 345.7]
4 326.9957 7.264413 [312.8 341.2]
5 323.2144 7.696029 [308.1 338.3]
6 325.9903 7.6086 [311.1 340.9]
7 325.2459 8.141598 [309.3 341.2]
8 343.3756 9.501396 [324.8 362]
9 294.8427 9.070273 [277.1 312.6]
10 288.2616 9.763192 [269.1 307.4]
Primary Care 10 Family Physician 10
FP/NP/PA

Coordinated Health Planning Project: Final Report of Findings: Draft v2 Page 51
Figure 7. Relationship between Hospital Discharge Rates and Measure of Provider Supply

Coordinated Health Planning Project: Initial Report of Findings: Draft Page 52
4.2 Methods for Financing Health System Payment
Patient Centered Medical Home Model
An opinion which has been widely published is that a focus on primary care is needed to make the U.S.
healthcare delivery system more efficient. The patient-centered medical home (PCMH) has become the
rallying cry of primary care specialists (i.e. the family medicine branch of health care providers) over the
course of the last few years. There is a plethora of studies detailing how PCMH models have decreased
specialty visits and improved patient’s access to primary care.51 Patient and provider satisfaction has
been shown to increase after a PCMH model is implemented. With new payment structures many hope
that increased provider satisfaction and pay will lead to an increase in the number of graduate medical
students interested in the specialty of family medicine.52 The long-term benefits of the current
physician payment system refinement initiatives including disease registries, electronic medical records
(EMRs), and care management are expected to not only improve the patient experience but also
decrease outpatient costs which generally see an initial rise at PCMH implementation.53
A major focus of research into the outcomes of PCMH models has been measuring health care costs. In
particular, Nielson et al. (2012) show outcome measures of 34 PCMH projects that have shown fewer
ED/urgent care visits, reductions in hospital admission and length of stay, less specialist utilization and
better health outcomes among patients with diabetes, heart disease, high cholesterol, women’s health,
immunizations and asthma care.54 The majority of the studies on PCMH models point to possible ways
in which the PCMH model can cut costs in our health care system.
Keckley et al. (2010) take a more pragmatic look at the PCMH model and note that there is large
variability in model structure, scope of patient enrollment, disease mix and operating models.55 The
authors note that the need for dedicated care managers, expanded access to practitioners, and
expanded health IT infrastructure all lead to difficult transitions for the average practitioner. The
authors also express concern that the U.S. is facing a physician shortage, as by 2025 the U.S. is projected
to have a 27 percent shortage in generalist physician.56 While the Federal government and many state
and private sector organizations are enthusiastic about the PCMH model of primary care delivery,
significant investment needs to be made up front to ensure the projected outcomes are realized.
51
Fontaine, Patricia et al. “Is Consistent Primary Care Within a Patient-Centered Medical Home Related to Utilization Patterns and Costs?” J Ambulatory Care Manage. 34:1. 2011. 52
Flottemesch, Thomas J, et al. Relationship of Clinic Medical Home Scores to Health Care Costs. J Ambulatory Care Manage 34:1. 2011. 53
Rosser, Walter et al. Patient-Centered Medical Home in Ontario. NEJM 10.1056 2010 54
Nielsen, Marci et al. Benefits of Implementing the Primary Care Patient-Centered Medical Home: A review of cost & quality
results, 2012. Patient-Centered Primary Care Collaborative. 2012 55
Keckley, Paul et al. “Medical Home 2.0: The Present, the Future” Deloitte Issue Brief. 2010. 56
Ibid.

Coordinated Health Planning Project: Initial Report of Findings: Draft Page 53
The increase in focus on transforming the way health care is delivered in the U.S. can be seen by the
creation of many advocacy groups, think tanks, and researchers dedicating valuable resources to the
topic. One group, the Patient-Centered Primary Care Collaborative (PCPCC) was founded in 2006 to
advance an “effective and efficient health system build on a strong foundation of primary care and the
patient-centered medical home (PCMH).”57 The PCPCC uses five Stakeholder Centers that focus on
issues of U.S. health care transformation including delivery reform, payment reform, patient
engagement, and employee benefit redesign. Each center relies on primary care, particularly the
medical home, experts and though leaders to advance policy efforts to build support for primary care in
the U.S. and to disseminate findings from research into primary care transformation.
57
See e.g., http://www.pcpcc.net/who-we-are.

Coordinated Health Planning Project: Initial Report of Findings: Draft Page 54
Table 29. The Practice - State PCMH Initiatives & Impact on ER Visits/Hospitalizations
Integrated Systems (Accountable Care Organizations)
Fragmentation within the U.S. health care system has been cited as one of the major reasons the U.S.
has little control over the rising cost of health care and patient/provider dissatisfaction.58 In the 1990s
the U.S. sought to address the health care system problems with the use of health management
organizations (HMOs). However, the HMO model quickly lost favor among patients. Currently, the
Federal government is advocating the Accountable Care Organization (ACO) model of health care
payment. An ACO is “a set of physicians and hospitals that accept joint responsibility for the quality of
care and the cost of care received by the ACO’s panel of patients.”59 An ACO is made up of a group of
providers who are responsible for the health care of a group of people. Generally the ACO looks to align
incentives and accountability of providers across their continuum of care. Additionally the Medicare
Payment Advisory Committee (MedPAC) regards medical homes as building blocks of effective ACOs.
58
Shih, Anthony et al. “Organizing the U.S. Health Care Delivery System for High Performance” The Commonwealth Fund. August 2008. 59
See e.g., Medicare Payment Advisory Committee (MedPAC), Chapter 2: Accountable Care Organizations, (in Report to the Congress: Improving Incentives in the Medicare Program), available at http://medpac.gov/chapters/Jun09_Ch02.pdf.
State PCMH Trial
% Reduction
ER visits
% Reduction in
Hospitali-zations Yrs Studied
Alaska Alaska Native Medical Ctr
50.0% 53%
10 yr span,
unspecified
California BCBS of California ACO Pilot(2012) 15% 2012
Florida Capital Health Plan, 2012 37.0% 2003-2011
Michigan BCBS of Michigan 10.0% Unspecified
Minnesota Health Partners 39.0% 24% 2004-2009
Nebraska BCBS of Nebraska 27.0% 10% 2011
New Jersey BCBS of New Jersey 26.0% 21% 2011
New York Capital District Physicians' Health Plan 24% 2008-2010
North Carolina Blue Quality Physician's Prgram 70.0% 2011
North Carolina Community Care of north Carolina 23.0% 2003-2010
North Dakota BCBS of North Dakota- MediQHome
Quality Program 2012 24.0% 6% 2005-2006
Ohio Humana Queen City Physicians 34.0% 2008-2010
Pennsylvania Geisinger Health System ProvenHealth
Navigator PCMH model 25% 2005-2010
Pennsylvania UPMC 13% 2009
South Carolina BCBS of South Carolina 25.9% 2008-2011
Vermont Vermont Medicaid 31.0% 2008-2010
Washington Group Health of Washington
29.0% 11%
2006-2007,
2008

Coordinated Health Planning Project: Initial Report of Findings: Draft Page 55
The group of PCMHs are considered the “community care team” with the hospital serving as the center
for advanced care.
The ACO model differs from the HMO model in many ways; however, both attempt to coordinate care in
a similar manner.60 Models such as Kaiser Permanente, Geisinger of PA, Group Health of WA and
Advocate medical of Illinois have shown that different levels of integration and accountability can lead
to improved health outcomes, patient satisfaction and savings.61 Integration and coordination take
place at many levels, each of which needs addressing to see changes in the delivery of health care.62
Care coordination and integration are relatively new to the U.S. health care system. Investments in
health information technology (IT) and recruitment or training of strong organizational leadership will be
needed for the U.S. to begin to see improved patient health outcomes that have been associated with
accountable care.63 Thus continually evaluating integrated systems, demand innovation and
improvements in health care will be necessary.64 One group, Kaiser has been leading the charge in care
coordination and integration. Kaiser’s successes highlight the fact that if the U.S. were to bring other
ACOs to the Kaiser level, total U.S. health care costs would decrease and outcomes with increase
dramatically. However, one challenge is how to ensure that these ACOs continue to provide innovative
solutions.65
60
Bodenheimer, Thomas “Coordinating Care – A Perilous Journey through the Health Care System” N Engl J Med 358:10. 2008.
Berenson, Robert & Burton, Rachel. “Accountable Care Organizations in Medicare and the Private Sector: A Status Update. Urban Institute. November 2011 61
Shields, Mark et al. “A Model for Integrating Independent Physicians Into Accountable Care Organizations” Health Affairs 30:1. 2011.
Larson, Eric. “Group Health Cooperative – One Coverage-and-Delivery Model for Accountable Care” N Engl J Med 361:17. 2009.
McCarthy, Douglas et al. “Kaiser Permanente: Bridging the Quality Divide with Integrated Practice, Group Accountability, and Health Information Technology” The Commonwealth Fund Case Study. June 2009.
Lee, Thomas; Bothe, Albert; & Steele, Glenn “How Geisinger Structures its Physicians’ Compensation to Support Improvements in Quality, Efficiency, and Volume” Health Affairs 31:9. 2012.
Weeks, William et al. “Higher Health Care Quality and Bigger Savings Found at Large Multispecialty Medical Groups” Health Affairs 29:5 2010. 62
Curry, Natasha & Ham, Chris “Clinical and Service Integration: The route to improved outcomes” The King’s Fund. 2010. 63
Shields, Mark et al. “A Model for Integrating Independent Physicians Into Accountable Care Organizations” Health Affairs 30:1. 2011. 64
Fisher, Elliot & Shortell, Stephen “Accountable Care Organizations: accountable for What, to Whom, and How” JAMA 304:15. 2010. 65
Feachem, Richard; Neelam Sekhri; & White, Karen “Getting more for their dollar: a comparison of the NHS with California’s Kaiser Permanente” BMJ 324. 2002; and Rittenhouse, Diane et al. “Physician Organization and Care Management in California: From Cottage to Kaiser” Health Affairs 23:6. 2004.

Coordinated Health Planning Project: Initial Report of Findings: Draft Page 56
Integrated care can decrease costs and increase quality, especially for patients with chronic diseases.
However, the mechanisms driving these outcomes are not clearly defined.66 With the ACA’s focus on
ACOs and shared savings, the U.S. will benefit from a focus on following the results of the on-going pilot
projects. These projects have delivered mixed results as far as savings and benefit to the organizations
participating.67 Although an increase in the quality of care is expected, the question of magnitude of
decreases in the overall spending with decreases in hospitalizations, ED visits and re-hospitalizations
remains?68
The ideal setting is one seeking patient-centered coordinated care for primary and secondary care
across all setting – i.e. looking at systems of care and going beyond the PCMH model.69 ACOs have been
shown to not function properly without a strong foundation of primary care.70 Both PCMHs and ACOs
have their individual issues; however, the PCMH is often viewed as a building block necessary for ACO
systems to realize the best outcomes in patient care.71
Primary Care Trusts and Population Health Models
In the early 2000s the United Kingdom (U.K.) decided to re-focus its health care efforts on primary care
and to create a new structure in the National Health Service (NHS). Primary Care Trusts (PCTs) were
created and have been held responsible to their local community to contract health services based on
the needs of their specific community.72 Over the course of the past decade, the U.K. discovered that
the wide range of services offered by the PCTs led to equally wide variability in outcomes across the
country, including the rate of emergency department (ED) admissions.73 Some of this variability can be
66
Miller, RH “Health System Integration: A means to an end” Health Affairs 15:2. 1996; and Tollen, Laura “Physician Organization in Relation to Quality and Efficiency of Care: A Synthesis of Recent Literature” The Commonwealth Fund. April 2008. 67
Iglehart, John “Assessing an ACO Prototype – Medicare’s Physician Group Practice Demonstration. N Engl J Med 364:3. 2011. 68
Meyer, Harris. “Accountable Care Organization Prototypes: Winners and Losers?” Health Affairs 30:7. 2011; and Brown, Randall et al. “Six Features of Medicare Coordinated Care Demonstration Programs that Cut Hospital Admissions of High-risk Patients” Health Affairs 31:6. 2012. 69
Higgins, Aparna et al. “Early Lessons From Accountable Care Models in the Private Sector: Partnerships between Health Plans and Providers” Health Affairs 30:9. 2011; and Cortese, Denis & Smoldt, Robert “Taking Steps Toward Integration” Health Affairs 26:1. 2007. 70
Rittenhouse, Diane; Shortell, Stephen & Fisher, Elliott “Primary Care and Accountable Care – Two Essential Elements of Delivery-System Reform” N Engl J Med 361:24. 2009. 71
Shields, Mark et al. “A Model for Integrating Independent Physicians Into Accountable Care Organizations” Health Affairs 30:1. 2011.
Phillips, Robert et al. “Case Study of a Primary Care-Based Accountable Care System Approach to Medical Home Transformation” J Ambulatory Care Manage 34:1. 2011 72
Stevens, Simon “Reform Strategies for the English NHS” Health Affairs 23:3 2004. 73
Purddy, Sarah “Avoiding Hospital Admissions: What does the research evidence say?” The Kings Fund. December 2010; and Badrinath, Padmanabhan et al. “Characteristics of Primary Care Trusts in Financial Deficit and Surplus – a

Coordinated Health Planning Project: Initial Report of Findings: Draft Page 57
attributed to PCT specific enhancements; however, overall assigning specific outcomes to only one
specific PCT initiative has been difficult.
PCTs were an attempt to integrate the delivery structure, quality improvement and finance systems so
primary care could focus on the special needs of the local population with a strong sense of community
accountability.74 However, turnover has plagued the NHS over the last 20 years; particularly in terms of
structure. Thus many authors have commented on the strains placed on delivering care in an ever-
changing organizational system.75 PCTs are responsible for 75 percent of NHS budget. Issues have
arisen with management, health IT and central priorities that have not allowed PCTs to provide
community-centered care.76
PCTs were created to allow local managers the ability to specifically care for their unique populations.
Unfortunately, the central governing body has continued to ask PCTs to meet specific central measures
that have led to managerial problems and an often disengaged environment for PCTs.77 Furthermore,
many of the local managers were not properly trained in health care commissioning and community
engagement was often lost.78 The organizational problems have been identified as one of the major
barriers to effective PCT implementation.79 Additionally few incentives were provided to PCTs to care
for the local community needs. Ultimately and many believe PCTs have not lived up to their original
vision.80
Spain adapted a system called Autonomous Communities (ACs) that is similar to the PCTs of the U.K..
The U.K. ACs have a strong base of primary care that is integrated into their secondary health care
system and held responsible for the health of the local population. Although the ACs were an
comparative study in the English NHS” BMC Health Services Research. 6:64. 2006; and Primary Care Trust Network “The Legacy of Primary Care Trusts” NHS Confederation Report. 2011; and Freemantle, Nick et al. “What factors predict differences in infant and perinatal mortality in primary care trusts in England? A prognostic model” BMJ 339. 2009; and Blunt, Ian; Bardsley, Martin; & Dixon, Jennifer “Trends in emergency admissions in England 2004-2009: is greater efficiency breeding inefficiency” The Nuffield Trust Briefing. July 2010; and Martin, Stephen & Smith Peter “Commissioning health. A comparison of English primary care trusts. Preliminary statistical analysis” The Health Foundation. 2010. 74
Bindman, Andrew, Weiner, Jonathan & Majeed, Azeem. “Primary Care Groups in the United Kingdom: Quality and Accountability” Health Affairs 20:3 2001. 75
Walshe, Kieran “Reorganisation of the NHS in England: There is little evidence to support the case for yet more structural change” BMJ 341 2010. 76
Lewis, Richard; Dixon, Jennifer; & Gillam, Stephen. “Future Directions for Primary Care Trusts” King’s Fund discussion paper. May 2003. 77
Primary Care Trust Network “The Legacy of Primary Care Trusts” NHS Confederation Report. 2011; and Wilkin, David; Dowswell, Therese & Leese, Brenda “Modernising primary and community health services” BMJ 322. 2001. 78
Ham, Chris “Competition and Integration in the English National Health Service” BMJ 336 April 2008. 79
Bojke, Chris; Gravelle, Hugh; & Wilkin, David. “Is Bigger better for primary care groups and trusts?” BMJ 322. 2001. 80
Lewis, Richard & Dixon, Jennifer “The Future of Primary Care” King’s Fund. 2005; and Brereton, Laura & Vasoodaven, Vilashiny “The impact of the NHS market: an overview of the literature” CIVITAS: Institute for the Study of Civil Society. 2010.

Coordinated Health Planning Project: Initial Report of Findings: Draft Page 58
investment in primary care, with an associated increase in primary care spending; the ACs have
demonstrated a decrease in overall health spending.81 The investment in a primary care infrastructure,
care integration and local accountability has been able to provide health outcomes sought by U.S.
stakeholders.
In Australia the Australian Medicare Local Alliance (AML Alliance) was recently created, with funding
from the national government, to “spearhead an organised system for primary health care across the
country through a network of 61 primary health care organisations called Medicare Locals (MLs).”82 The
AML Alliance and MLs were established under the National Health Reform and their pairing with Local
Hospital Networks forms a critical part of new locally governing health arrangements. The AML
Alliance’s mission is “To promote the importance of primary health care nationally and to support a
unified primary health care system that can link seamlessly to the social care sectors.”
New Zealand district health boards have funded Primary Health Organisations (PHOs) to “support the
provision of essential primary health care services through general practices to those people who are
enrolled with the PHO.”83 New Zealand aims to better link general practitioner (i.e. primary care)
services with other primary health service. Their goal is to ensure a “seamless continuum of care, in
particular to better manage long term conditions.” Both Australia and New Zealand have created
geographic accountability, detailing and integrating primary care physician and teams with community
resources.
Conclusion
Rhode Island has a lower than average percentage of NPs engaged in primary care, but an average
percentage of PAs engaged in primary care. While Rhode Island’s average primary care physician to
population and specialist to population ratios are higher than the U.S. average, they are lower than most
of the state’s New England neighbors. Small geography analysis reveals many physician distribution
gaps across the state. Rhode Island’s health care providers are more likely to be female and to practice
in larger practices than the U.S. average. On the other hand, Rhode Island has fewer very large (great
than 25 provider) practices on average than the rest of the U.S. and most or their Northeast regional
counterparts.
The Graham Center next looked at the extent to which physicians trained in-state, remain in-state. To
inform this analysis the Graham Center investigated the extent to which Rhode Island relies on
migration of physicians from other states. Overall these gap analysis help to inform policymakers on
how well the current health workforce pipeline addresses the future needs of the population to access
primary care services in their communities.
81
Borkan, Jeffrey et al. “Renewing Primary Care: Lessons Learned from the Spanish Health Care System” Health Affairs. 29:8. 2010. 82
See e.g., http://amlalliance.com.au/about-us. 83
See e.g., http://www.health.govt.nz/our-work/primary-health-care/about-primary-health-organisations.

Coordinated Health Planning Project: Initial Report of Findings: Draft Page 59
Primary care physician supply per resident is higher in Rhode Island than in many other states; Rhode
Island has a smaller proportion of family medicine physicians than other states. Additionally, research
indicates that the supply and organization of primary care physicians can greatly influence the demand
for other medical services, including inpatient hospital services. Finally, in Rhode Island, the reduction in
hospitalizations (and thus on bed need) from a more integrated primary care delivery system ranges
from 3.8% and 10.5%.
In Rhode Island, health outcomes are driven more because of social deprivation than care delivery gaps.
Potential solutions to Rhode Island’s health care delivery gaps include organizing policy, payment and
care delivery around smaller geographies; integrating social accountability measures and strategies that
impact social determinants; and mitigating hospital utilization through the implementation of new
models of primary care payment and delivery transformation.
The next few years are expected to bring many challenges with the increase in newly insured individuals
stressing to primary care physician supply. Fortunately, analysis of Rhode Island’s future primary care
physician needs indicate that Rhode Island will face less of an issue with shortages of primary care
physicians than their neighboring New England states. However, Rhode Island still faces increases in
demand due to the aging of the population and other provisions of the ACA. Primary care supply will
also be challenging for Rhode Island, particularly when viewed at the sub-state level (township and PCSA
areas).

Data Appendix: WellMed Analysis Page 1
Data Appendix
Wellmed Analysis
The “Wellmed Scenario” for the Rhode Island project is based on a study conducted by the Robert
Graham Center. A full description of this study is in the Final Report to AHRQ, entitled “Assessing the
Impact of the Patient-Centered Medical Home (PCMH),” PBRN Master Contract # HHSA290200710008,
Task Order No. 6 (September, 2011).
The WellMed Medical Group is a core group of 21 clinics in the San Antonio area that are the primary
clinical network affiliated with the more diversified corporate structure of WellMed Medical
Management. Neither WellMed Medical Group nor WellMed Medical Management own or operate a
hospital, and they predominantly employ primary care physicians. WellMed operated under full risk
capitation for most of 20 years and now almost exclusively cares for patients covered by a Medicare
Advantage plan. This arrangement gives WellMed control of both funds and of data in committing to
manage their patient panel. The flexibility afforded to WellMed by their current business model
facilitated the evolution of the current system of care and benefit structure based upon identification of
patient needs, and patient outcomes. WellMed employed continuous quality improvement and the
Chronic Care Model long before consensus developed around the PCMH.
WellMed Medical Management serves more than 87,000 patients and plan members, mostly Medicare-
eligible seniors in Texas, Arkansas, Florida and New Mexico. We focus this case study of the core 21
WellMed Medical Group practices in San Antonio and exclusively on its Medicare Advantage patients for
whom its care model is most fully developed. WellMed ACO functions routinely monitor costs and
outcomes and develop patient and system interventions in response to poor outcomes and cost
variations. They regularly provide patient and panel quality measures to clinics and individual clinicians
in the network, and select referral specialists and hospitals based on their outcomes. The duration and
evolution of their model and robust monitoring of dollars and data made them good candidates for
external evaluation of ACO and PCMH functions and outcomes.
Cohort Analysis:
We used WellMed administrative billing data and electronic health record data to create cross-sectional
cohorts for the years 2000, 2003, and 2006. Comparative cohorts for the same years were extracted
from Medicare Provider Analysis and Review (MEDPAR) data and a 1% sample of carrier claims data
(Part B, Fee-For-Service), drawing from Texas or immediately adjacent states (the MEDPAR file contains
data from inpatient claims for hospitals and skilled nursing facilities). The Medicare cohort data were
drawn from random samples of 500,000 beneficiaries selected from the Medicare denominators files
and using part B Carrier claims Data and MEDPAR files for 2000, 2003, 2006. We also analyzed 2008
data for WellMed without matching Medicare data. Patient matching between cohorts was based on
age, gender, and absence or presence of one or more chronic conditions (diabetes, congestive heart
failure, ischemic heart disease, and chronic obstructive pulmonary disease or asthma). We had originally

Data Appendix: WellMed Analysis Page 2
planned to use broader case-mix adjustment for matching but our initial study revealed that a change in
payment incentives for Medicare Advantage plans in 2005 resulted in a significant increase in
coding/capturing diagnoses in the WellMed patient population. For this same reason, this study focused
statistical comparisons to later comparison years, after WellMed disease coding patterns stabilized. For
comparing preventive screening, utilization, and health outcomes we created a matched analysis
between Medicare patients in 2006 and WellMed patients in 2008. We did this to improve accuracy of
WellMed disease coding capture, and because 2006 was the latest year for which we had Medicare
data.
We assessed prevalence of chronic conditions between the comparison patient populations and the
quality of patient care using prevention measures. In our pre-post study of WellMed we could report on
success with achieving prevention goals such as hemoglobin A1C and LDL-cholesterol levels, for
example, but Medicare claims data limit this analysis to prevalence of testing. The prevention measures
include annual rates of cancer screening, hemoglobin A1C testing for patients with diabetes, and
cholesterol screening generally and for patients with diabetes or ischemic heart disease, specifically.
Health outcome and utilization measures include annual hospitalization rate, rate of live discharge, re-
hospitalization rate, bed-days per 1000, and emergency department visits. The analysis is a quasi-
experimental cohort comparison of cross-sectional point-in-time WellMed claims data to MedPAR and
Part B claims data.
Medicare Fee for Service beneficiaries served as the control or comparison group in assessing the impact
of WellMed care systems. The analysis is a quasi-experimental-control group comparisons of cross-
sectional point-in-time WellMed claims data to MedPar and Part B claims data. The same health
outcome measures were estimated from both the WellMed and Medicare claims data. We report first a
simple comparison of the WellMed data to the Medicare data from Texas and 9 neighboring states
(Arkansas, Louisiana, Oklahoma, Florida, Alabama, Mississippi, Arizona, Colorado and Nevada). We used
2:1 matching for Medicare:WellMed comparisons for all year except 2008 for which we used a 1: 1
match of 2006 Medicare data to those of WellMed (See tables). Matching was not always exact due to
difficulty matching some WellMed patients. WellMed cohorts ranged from 14,411 – 17,643 and those
for Medicare 28,822 – 35,284. All significance testing was done with Student’s t-test statistic. All data
management tasks were undertaken using SAS 9.2 and STATA 11.0 statistical software packages.
Findings
There were several important differences in preventive service delivery, utilization, and health outcomes
in the age, gender, and disease matched cohorts (Table 1). Annual WellMed mammography rates were
comparable for age-appropriate patients (45.2% WellMed vs. 41.0% Medicare) but colon cancer
screening (by all modalities) for WellMed patients in a single year was significantly higher (27.7% vs.
17.6%) compared to Medicare. Annual hemoglobin A1C testing rates for patients with diabetes were
similar and slightly higher for age-appropriate Texas Medicare patients (78.2% vs. 80.9%). WellMed had
significantly higher cholesterol screening rates for the general population (69.7% vs. 48.9% Texas
Medicare) but the difference was smaller for patients with diabetes (80.5% vs. 71.9% Texas Medicare)
and for patients with ischemic heart disease (79.6% vs. 62.4% Texas Medicare) (Table 1).

Data Appendix: WellMed Analysis Page 3
WellMed patients in 2008 had substantially lower utilization rates in the following categories:
emergency visits (17.8% vs. 32.9%), hospitalizations (14.4% vs. 26.7%), and re-hospitalizations (14.0% vs.
21.6%) (Table 2). Hospital bed-days for WellMed patients were substantially lower than for FFS
Medicare patients (1002 vs. 3288 per thousand beneficiaries).
For the Rhode Island “Wellmed Scenario,” we used the estimates from Table 2—namely differences in
hospitalization rates for Wellmed patients to Texas Medicare beneficiaries. Our estimates are based on
the assumption that the observed difference in a Medicare population in Texas would carry over to the
entire population in Rhode Island. Taking the mean hospitalization rates across the four years for Texas
(23.9%) and for Wellmed (14.2%), yields a decrease of 41% ((23.9-14.2)/23.9))

Data Appendix: WellMed Analysis Page 4
Table A1: Prevention Screening Rates and Chronic Disease Monitoring Rates
2000* 2003* 2006* 2006** 2000 2003 2006 2008
Mammography test rates (%) 31.50% 31.70% 33.30% 32.00% 19.40% 26.20% 33.00% 37.70%
Mammography test rates (%) ages 65-
69
38.70% 38.50% 42.00% 41.00% 24.40% 26.00% 40.50% 45.20%
Colon cancer screening test rates (%) 18.60% 18.30% 16.30% 16.30% ± 30.40% 31.20% 25.60%
Colon cancer screening test rates (%)
ages 65-80
19.60% 19.30% 17.70% 17.60% ± 31.30% 31.40% 27.70%
Hemoglobin A1c testing rates (%) for
patients with Diabetes
65.60% 73.30% 78.30% 79.10% 56.70% 76.20% 79.90% 78.10%
Hemoglobin A1c testing rates (%) for
patients with Diabetes ages 65-75
67.50% 75.10% 79.80% 80.90% 61.30% 78.70% 82.90% 78.20%
Cholesterol Screening rates (%) 34.00% 40.50% 46.40% 48.90% 46.50% 50.00% 69.00% 69.70%
Cholesterol Screening rates (%) for
patients with Diabetes
54.00% 64.00% 71.00% 71.90% 54.80% 72.50% 84.20% 80.50%
Cholesterol Screening rates (%) for
patients with ischemic heart disease
50.70% 55.90% 62.00% 62.40% 54.80% 67.20% 80.70% 79.60%
Number of Observations 28,822 32,606 35,284 18,400 14,411 16,303 17,643 17,643
Texas Region Medicare WellMed
*2:1 match for 2000, 2003, 2006 but 1:1 match for 2008 WellMed patients using 2006 Medicare data; matched on age, gender,
and conditions
** No CPT data available

Data Appendix: WellMed Analysis Page 5
Table A2: Rates of Health Care Utilization and Outcomes Texas Region Medicare vs. WellMed
2000 2003 2006 2006 2000 2003 2006 2008
ER visit rates (%) 27.80% 29.00% 29.00% 32.90% 15.90% 14.40% 17.60% 17.80%
Hospitalization
rates (%)
22.80% 23.30% 22.80% 26.70% 13.60% 11.80% 13.90% 14.40%
Re-hospitalization
rates (30 days) (%)
18.50% 18.90% 19.20% 21.60% 14.50% 12.80% 13.50% 14.00%
Hospital Bed-
Days/1000
2614 2734 2511 3288.8 699 763 1014 1002
Number of
Observations*
28,822 32,606 35,284 18,400 14,411 16,303 17,643 17,643
*2:1 match for 2000, 2003, 2006 but 1:1 match for 2008 WellMed patients using 2006 Medicare data;
matched on age, gender, and conditions with 2008 WellMed patients
WellMedTexas Region Medicare

Data Appendix: Social Deprivation Index Construction Page 6
Social Deprivation Index Construction Understanding how socioeconomic status (SES) influences the use and access of health services, and
how the use of measures of SES to guide the distribution of resources can reduce health disparities is
bedded in a large body of literature and theory.84 The relationship between health care need, demand,
supply and access is complex. Health need can be understood to mean the requirement for health
services, deemed reasonable or expected within society, taking into account factors such as the
socioeconomic, age and health profile of a community. Demand reflects how services are used by the
population, and not necessarily the underlying need. An imbalance between need, demand and supply
can result in health care access inequity85 and consequent poor health outcomes.86 Poor health care
access may be measured by self-report, inferred through rates of avoidable hospitalization (as an
indirect measure of primary health care access) or by poor health outcomes such as morbidity, and
mortality rates.
Variables of social deprivation were selected on the basis of literature review and international
examples. Particularly important to this analysis is the work by Fields (2000) and Wang and Luo (2005).
Fields identified predictors of access to health service based on a survey of doctors and patients in the
UK. The model developed by Wang and Luo calculated physician supply rates for a novel geography
based travel time to health service providers, then adjusted these rates for measures of health need, as
defined by socioeconomic and demographic variables (selected also on the basis of Fields’ works and
Ricketts’ HPSA designation methodology).87 Our analysis includes the key socioeconomic and
demographic variables identified by Fields (2000) and Wang and Luo (2005).
One of our intentions in constructing an SDI was to use readily available and easily updated national
area-level data. With this approach, what is lost in specificity is gained in reproducibility. The main
source of sociodemographic measures is from the Census Bureau, mainly the 2006-2010 American
Community Survey (ACS) 5-year estimates.88 These include percent living in poverty, black, less than 12
years of schooling, single parent households, and single occupant households. Following Wang and Luo
(2005), we constructed a high needs measure, based on ACS data, consisting of the percent of the
population (1) under the age of five and (2) female between the ages of 15 and 44. We considered
models that also included persons over 65 but found this measure is negatively associated with other
indicators of deprivation. We also considered measures from the Townsend index: percent living in
overcrowded conditions (more persons in a dwelling unit than number of rooms), percent of households
without a car, and percent of 18-64 year-olds that are unemployed, all of which are available from the
ACS. Percent non-employed was also examined. The factor loading of percent non-employed was
substantially higher, so the percent unemployed was dropped.
84
See e.g., Andersen 1995; Field 2000; Hendryx et al. 2002; McGrail and Humphreys 2009; Penchasky and Thomas
1981; Wang and Luo 2005. 85
See e.g., Field 2000. 86
See e.g., Andersen 1995; Hendryx et al. 2002. 87
See e.g., Ricketts et al. 2007. 88
See e.g., http://www.census.gov/acs/www/.

Data Appendix: Social Deprivation Index Construction Page 7
We used four health outcome measures: mortality, infant mortality, low birth weight rates and
prevalence of diabetes. County-level mortality rates were obtained from the Center for Disease Control
and Prevention (CDC) Wonder system.89 We selected age-adjusted death rates for Hispanics and for
non-Hispanic blacks, whites and other races based on data pooled across three years (2005-2007). For
counties where race/ethnicity-specific rates are unavailable, the overall county mortality rate was used
instead. Low birth weight and infant mortality rates are collected by the National Center for Health
Statistics and available on an annual basis in the Area Resource File (ARF). From the 2008 ARF, we used
2003-2005 low birth weight rates reported separately for whites and non-whites and 2001-2005 infant
mortality rates reported separately for whites, blacks and other race groups. As above, for counties
where race/ethnicity-specific rates are unavailable due to no births for a particular group, the overall
county rates were used. We first obtained block level rates by combining race/ethnicity specific rates at
the county level with ACS population counts by race/ethnicity available at the block group level by
assuming that these rates were similar at the block level. We then obtained ZCTA-level rates by
aggregating block level information. The use of racial and ethnic specific rates is a possible limitation,
but the choice is dictated by the available national data—mortality, infant mortality and low birth
weight rates are not available by other parameters, such as income level or other demographic
characteristics. County diabetes rates were used to define block rates, which were then aggregated to
the ZCTA-level. The final step was to convert the four health measures to centile rankings.
Next, we performed a factor analysis on the nine social deprivation measures identified. Factor analysis
assumes a common dimension (unobserved) underlying all variables and creates a summary measure to
capture this commonality. This requires variables to be correlated, and it is this degree of correlation
which factor analysis is trying to capture. Due to the substantial variation in population size across
ZCTAs, all analyses were weighted by ZCTA population. Based on the above analysis, we constructed a
parsimonious index retaining items that had a partial correlation above 0.60. Our final step was to use
the factor loadings to construct weighted factor scores for each index. Pairwise correlations indicate
that this SDI is, as expected, positively and significantly (p<.01) associated with mortality, low birth
weight, infant mortality, diabetes prevalence, and ambulatory care sensitive hospitalizations. The
relationship between social deprivation and poor health outcomes and access is reliable and strong at
this level of geography. Given efforts to improve shortage and underservice designations in the U.S.,
and the rational service area definitions to which these are tied, this composite SDI measure offers
potential use as a geographic planning and resource-allocation tool that reflects how services are
currently delivered and accessed.
89
See e.g., http://wonder.cdc.gov/wonder.

Data Appendix: Social Deprivation Index Construction Page 8

Data Appendix: Social Deprivation Index Construction Page 9

Data Appendix: Social Deprivation Index Construction Page 10

Data Appendix: Social Deprivation Index Construction Page 11


