
Healthcare Systems and Services - McKinsey & Company
100
India Healthcare: Inspiring possibilities, challenging journey December 2012 Prepared for Confederation of Indian Industry (CII) Healthcare Systems and Services
Transcript of Healthcare Systems and Services - McKinsey & Company
India Healthcare: Inspiring possibilities, challenging journey
December 2012
Prepared for Confederation of Indian Industry (CII)
Healthcare Systems and Services

This report is furnished to the recipient for information purposes only. Each recipient should conduct their own investigation and analysis of any such information contained in this report. No recipient is entitled to rely on the work of McKinsey & Company, Inc. contained in this report for any purpose. McKinsey & Company, Inc. makes no representations or warranties regarding the accuracy or completeness of such information and expressly disclaims any and all liabilities based on such information or on omissions therefrom. The recipient must not reproduce, disclose or distribute the information contained herein without the express prior written consent of McKinsey & Company, Inc.

India Healthcare: Inspiring possibilities, challenging journey
Ayushi GudwaniPalash MitraAnkur PuriMandar Vaidya
December 2012
Prepared for Confederation of Indian Industry (CII)
Healthcare Systems and Services

2
3India HealthcareInspiring possibilities, challenging journey
Foreword
In 2002, McKinsey & Company authored a joint report with CII that became the beacon for many in the hospital industry and a cornerstone for decision making. While the report was a landmark in of itself, it was narrowly focused on the provider industry and was limited by availability of reliable data and nascency of several parts of the healthcare value chain. Since then, healthcare has moved in rapid strides in India. The government has made several landmark moves including the NRHM, the RSBY, and the Clinical Establishments Act. The private sector has grown across the value chain. Hospital chains have emerged as standalone corporate entities, as have diagnostics providers. Health insurance, devices and equipment manufacturers have come into their own. Pharmaceuticals players too have continued to grow. Collaboration between the government and private sector has emerged stronger, with some successes.
At the same time, we continue to face challenges as a system. The nation’s health outcomes continue to lag. Collaboration between government and private sector continues to struggle to find scale. The private sector is struggling to keep margins at reasonable levels for their shareholders.
Given this inflection point, we felt the time was right for another landmark report. This time, a report much wider in scope, and much better informed with data and opinions from across all parts of the healthcare value chain.
We thank McKinsey & Company for taking up this challenge and doing a commendable job in authoring this report. We hope it will have a meaningful impact in moving India’s health system forward, and convert possibilities into reality.
Dr Naresh Trehan Chairman, CII National Committee on Healthcare

4

5India HealthcareInspiring possibilities, challenging journey
Contents
Preface ..............................................................................................................................7
Acknowledgements ...........................................................................................................9
Steering Committee .........................................................................................................11
Executive Summary .........................................................................................................13
2002–12: A decade of lessons learnt but opportunities lost .............................................35
Lessons from healthcare reform in other countries ...........................................................51
The decade till 2022: A crucial phase in India’s health reform journey...............................61
Roles and imperatives for the government .......................................................................73
Opportunities and imperatives for the private sector ........................................................81
Appendix .........................................................................................................................93

6

7India HealthcareInspiring possibilities, challenging journey
Preface
India has embarked upon a journey of healthcare system transformation. The government introduced important structural reforms in the last decade and has re-emphasised its vision of creating access to a minimum set of healthcare services for all. The private sector experienced unprecedented growth during this period.
Growth in the next decade will be closely linked to the nature and extent of reform. India’s health challenges, though unique and complex, also offer remarkable opportunity. Thus, the next decade holds inspiring possibilities, while likely being a challenging journey.
McKinsey & Company conducted a research effort in 2002 and published a report entitled Healthcare in India: The Road Ahead, written jointly with Confederation of Indian Industry (CII). The challenges identified in 2002 are still relevant, although the sector has made significant progress since then. Today, some extent of government reform combined with private sector enterprise, put us in a better position to meet our health goals.
A decade since the publication of the earlier report, we have now undertaken a similar effort for the CII. This time with a broader aspiration. We have extended the scope beyond just healthcare delivery infrastructure, and discussed the matter of the country’s health system. We attempt to learn not just from India’s experience, but also from the health reform journey of peer nations. We delve into the role and imperatives of the government in this journey. Within the private sector, we study different verticals, including providers, insurers, pharmaceuticals and medical devices and equipment manufacturers.
We fully expect Indian healthcare to evolve substantially over the next decade, and the country to make great progress towards achieving its long-term healthcare vision. Our goal in this effort has been to provide industry leaders and policy makers with an integrated and realistic view of the opportunities and challenges. This work is independent and has not been commissioned or sponsored in any way by any business, government or other institution.
Palash Mitra Mandar Vaidya Director, Partner, McKinsey & Company McKinsey & Company

8

9India HealthcareInspiring possibilities, challenging journey
Acknowledgements
Ankur Puri, an Engagement Manager based in our New Delhi office, managed the overall research effort. Ayushi Gudwani, an Engagement Manager based in our New Delhi office, provided valuable guidance and worked closely with the team in writing this report.
The core team comprised Surabhi Bhandari, Puja Jain and Prakash Deep Maheshwari, consultants based in our New Delhi office, and Shubham Rao, analyst from our Knowledge Centre in Gurgaon.
This report would not have been possible without the thought partnership and expertise of industry veterans who constituted our steering committee. To them, we extend our sincere thanks. In particular, we would like to acknowledge the leadership and guidance of Dr Naresh Trehan, Chairman of the CII National Committee on Healthcare.
We have been fortunate to have benefited from the guidance of several leading thinkers, stakeholders and decision makers in the Indian healthcare system. Their valuable inputs have shaped our thinking. In particular, we would like to acknowledge the inputs and counsel of Amit Bhandari, Maulik Chokshi, Keshav Desiraju, Sanjay Dutta, Shakuntala D. Gamlin, M. B. Jain, Maliekkal Jeeson, Anup Karan, Anand Lal, Sanjay Mohanti, Somil Nagpal, Ajay Pitre, Krishna D. Rao, Sarit Rout, K. Srinath Reddy, Anil Swarup and Alok Agrawal.
We would like to acknowledge the contributions of our colleagues from the India office, Chirag Adatia, Ramnath Balasubramanian, Kaustubh Chakraborty and Sathya Prathipati in guiding us in their areas of expertise.
Our colleagues Claudia Süssmuth Dyckerhoff, Minyoung Kim, Alexander Ng and Ali Ustun shared their perspectives on the health systems of other countries. Paula Afonso, Luiza Semeghini, Radhika Sriram, Pornnipa Srivipapattana, Nitin Mukesh Chaturvedi and Ravi Yadav from the McKinsey Knowledge Centre provided valuable research support to the effort.
We would like to thank Nipun Gosain, Vineet Kumar and J. Sathya Kumar, for their assistance in visual graphics; Jeanne Subramaniam for her editorial efforts; and Fatema Nulwala and Kulsum Merchant for their support in external relations.

10

11India HealthcareInspiring possibilities, challenging journey
Steering Committee
Dr Naresh Trehan Dr Prathap C Reddy Chairman & Managing Director, Chairman, Medanta – The Medicity Apollo Hospitals Group
Dr Ajay Bakshi Dr Devi Prasad Shetty CEO, Chairman, Max Healthcare Narayana Hrudayalaya
Bhargav Dasgupta Shivinder Mohan Singh MD & CEO, Executive Vice-Chairman, ICICI Lombard General Fortis Healthcare (India) Ltd.
Sushobhan Dasgupta Daljit Singh Managing Director, President, Johnson & Johnson Medical India Fortis Healthcare (India) Ltd.
Sudarshan Jain Dr Shubnum Singh MD, Dean, Abbott Healthcare Solutions Max Healthcare Institute Ltd.
Aijaz Tobaccowalla MD, Pfizer India

12

13India HealthcareInspiring possibilities, challenging journey
Executive Summary
At the turn of this century, health outcomes in India and the quality of the underlying health system significantly lagged those of peer nations. From such a weak starting position, the progress made in the last decade has been mixed. The government1 has recognised the need for reform and introduced several in the Eleventh and Twelfth Five-Year Plan2. The private sector has played an important role in improving access and quality during this timeframe.
Yet today, India finds itself lagging behind peers on healthcare outcomes. The situation is further complicated by inequity in healthcare access across states and demographic segments within the population. It is abundantly clear that a ‘status quo’ approach will be inadequate to tackle this challenging situation. India’s reform journey will need to gain momentum and drive implementation at scale.
Spend on healthcare by the government will need to increase. Infrastructure gaps will need to be closed. Workforce utilisation and scarcity will need to be addressed. And in order to achieve all this, the government and private sector will need to collaborate closely, beginning with an inclusive and transparent dialogue to envision India’s longer term health system.
The government has now articulated in its Twelfth Five-Year Plan its long-term vision to achieve ‘universal health coverage’. To achieve this vision, the government will need to lead the journey over the next four decades to transform the country’s healthcare situation. It will need to define its role and choose from either a ‘primary payor’ or a ‘primary provider’ role, and undertake several imperatives. At the same time, changing demographics, psychographics and epidemiology will present the private sector with opportunities. To capture these, the private sector will need to build specific capabilities, develop new business models and actively collaborate with the government.
This report attempts to provide a possible vision for the country’s healthcare, and the contours of a possible roadmap. While acknowledging the reality that this journey will take place over decades, we have adopted the year 2022 as the timeframe for this exercise. We believe that such a timeframe is quite appropriate to drive the envisioning and implementation of developmental activities for a matter as substantial, serious and complex as that of healthcare in India.
We begin with an assessment of the progress made in the last decade and the learnings for the path ahead. We then study the health reforms journeys undertaken by other countries, and discuss their relevance in the development of India’s healthcare vision and roadmap. Subsequently, we develop a deeper understanding of the challenge of inequity in healthcare access, outline a possible vision for the year 2022, and establish the inadequacy of a ‘status quo’ approach. Then we discuss the governments’ ‘stewardship’ role and the choices it will need to make at the outset. Finally, we outline the opportunities and imperatives for the private sector.
1 Throughout the report, “government” refers to the Centre and State governments. “Centre” or “State” will be specified where necessary.
2 Draft of the Twelfth Five-Year Plan has been released by the Planning Commission.

14
FROM 2002 TILL 2012: A DECADE OF LESSONS LEARNT BUT OPPORTUNITIES LOST
Poor outcomes and insufficient resourcing at the turn of the century
At the turn of the century3, India’s Infant Mortality Rate (IMR)4 and Maternal Mortality Ratio (MMR)5 lagged behind the average for the low and middle income countries (LMIC)6, as did its life expectancy. Moreover, health outcomes varied dramatically across states.
The Indian healthcare sector faced shortages of workforce and infrastructure. India had 1.7 trained allopathic doctors and nurses per 1,000 population in the year 2000 compared to the WHO recommended guideline of 2.5 per 1,000 population7. Bed density in the country was 0.67 per 1,000 population in the year 2002, well below the global average of 2.6 and WHO benchmark of 3.5 [Exhibit 1].
Exhibit 1
Health infrastructure is well below WHO guidelines
0.34 0.490.36
0.41
0.47
Global average1
WHOguideline
2010 (E)
1.30
0.82
2005
0.90
2002
0.70
9%
13%
5%
PrivatePublic
Bed density CAGR, 2002–10
Per 1,000 population
1 For 2002
3.5
2.6
SOURCE: Central Bureau of Health Intelligence, Health infrastructure, 2005 and 2010; World Bank database, World Development Indicators (WDI); World Health Organisation, Global Health Expenditure Database; ASSOCHAM; McKinsey analysis
3 We have considered 2002 as the starting point for our analysis because we believe that 2002–12 is the relevant timeframe for our analysis. The Draft Twelfth Five-Year Plan of the Planning Commission of India states that reform will require 2–3 Plan periods.
4 Infant Mortality Rate (IMR) is the number of deaths of children less than one year of age, per 1,000 live births.
5 Maternal Mortality Ratio (MMR) is the number of women who die during pregnancy and childbirth, per 100,000 live births.
6 Low and middle-income countries (LMIC). This is part of the income based classification of countries by the World Bank. Income is accepted as an important determinant of health outcomes. India falls within the LMIC category. Therefore, LMIC average was chosen as the reference.
7 WHO has provided a guideline on minimum density of healthcare practioners required for better health outcomes.

15India HealthcareInspiring possibilities, challenging journey
Total healthcare expenditure was 4.3 per cent of GDP in 2000, below the LMIC average of 5.3 per cent8. More importantly, of this, out-of-pocket spend was 67 per cent, much higher than the LMIC average of 44 per cent [Exhibit 2]. Health insurance covered only 5 per cent of Indians in 2004.
Some successes in the past decade: the fruits of reform and private enterprise
In the last decade, India’s health system developed well in a few areas. Public sector efforts gained momentum with the adoption of the Millennium Development Goals (MDGs), as the government set targets to reduce the MMR by three quarters between 1990 and 2015; to halt the spread of HIV/AIDS, malaria and other major diseases; and to reverse their spread by 2015.
The Eleventh Five-Year Plan brought about long-awaited healthcare reforms. These led to greater intensity and some changes in the direction of public sector initiatives9. Within the private sector, healthcare facilities grew rapidly and insurance coverage increased [Exhibit 3]. The past decade also witnessed several pilots of public-private partnerships, particularly in hospitals and diagnostic services.
8 Draft of the Twelfth Five-Year Plan defines core and broader health spend; the latter also includes expenditure on sanitation, Integrated Child Development Services (ICDS) and mid-day meals. Throughout this report, Total Health Expenditure (THE) refers to the core health spend, as per the draft Twelfth Five-Year Plan.
9 Throughout the report, “Government” refers to the Centre and the State. “Centre” or “State” will be specified where required.
Exhibit 2
India’s healthcare spend lags behind LMIC with a high percentage of out-of-pocket spend
SOURCE: World Bank database, World Development Indicators (WDI) covering 214 countries from 1960 to 2011 with 331 indicators; World Health Organisation, Global Health Expenditure Database
Total Healthcare Expenditure (THE)
Per cent of GDP
Share of out-of-pocket spend
Per cent of THE
4.04.4
5.75.3
20102000
LMIC averageIndia
6167
37
44
20102000

16
Major challenges persist
Despite the progress made in the last decade, major challenges persist:
� Health indicators continue to lag. Outcome indicators, such as IMR and life expectancy, continue to fall behind LMIC averages. It is likely that India will fall short of the 2015 targets for IMR and MMR set in the Millennium Development Goals. The non-communicable disease burden has grown to 53 per cent of the total disease burden by 2008, according to the WHO.
� Healthcare spend is not growing at the same pace as GDP. As per WHO National Health Accounts, India’s healthcare spending as a percentage of GDP has reduced from 4.4 per cent in 2000 to 4.0 per cent in 2010. This implies that, in nominal terms, India’s healthcare expenditure has grown at a slower rate than the country’s GDP [Exhibit 4].
� Out-of-pocket spending continues to be high. This is despite the fact that the public spend has increased, and implying that thus public spending has struggled to keep pace with the rise in healthcare demand.
� Infrastructure gaps remain substantial, and are exacerbated by underutilisation of existing resources. Total bed density had increased to 1.3 per 1,000 by 2010, but remains significantly lower than the WHO guideline of 3.5 beds per 1,000. Underutilisation of existing resources further compounds the problem of meagre infrastructure. Private sector hospitals routinely face utilisation issues. Utilisation of public sector facilities remains low10.
� Health workforce remains inadequate and underutilised. The total number of allopathic doctors and nurses in the country lags the WHO benchmark of 2.5 doctors per 1,000 population, at 2.2 per 1,000 people. Despite the scarcity of medical personnel, the
10 Based on Rural Health Statistics, NRHM.
Exhibit 3
Private sector created over 70% of the new beds, increasing its share of beds between 2002 and 2010
Total beds
'000
2010 (E)
1,555
577
978
605
188
2002
762
389
373
Public
Private
SOURCE: Central Bureau of Health Intelligence, Health infrastructure, 2005 and 2010; World Bank database, World Development Indicators (WDI); World Health Organisation, Global Health Expenditure Database; ASSOCHAM; McKinsey analysis
ESTIMATES
49%
63%
XX Percentage share of total

17India HealthcareInspiring possibilities, challenging journey
problem of underutilisation exists. With a high proportion of nurses inactive, and registered medical practitioners, AYUSH doctors and rural medical practitioners not actively involved in the formal sector, the density of practising workforce falls to 1.9 per 1,000 [Exhibit 5].
Exhibit 4
Indian healthcare expenditure has grown slower than economy, unlike most peers
SOURCE: World Health Organisation, Global Health Expenditure Database
1 Nominal value2 Numbers are arrived by subtracting (1) CAGR for THE from, (2) CAGR for GDP between 2001–10 (for e.g., in India; 12.4% - 14.2% = -1.7%)
0.7
3.5
2.8
2.6
2.3
2.1
2.0
2.0
1.3
-1.5
-1.7
Bangladesh
Thailand
China
Russia
India
LMIC average
Turkey
Brazil
Malaysia
Philippines
Indonesia
Total Health Expenditure in India1
INR ’000s crore
Difference between CAGR of Total Health Expenditure and CAGR of GDP2
Percent, 2001–2010
GDP in India1
INR ’000s crore
304
106
12.4%
20102001
7,492
2,270
14.2%
20102001
Exhibit 5
About 50% of existing medical workforce does not practice in the formal health system
0.9 1.9
0.5
0.5
1.10.6
WHOguideline:
Total
3.0
RMP
0.2
AYUSH
0.60.2
Nurses
1.5
Allopathic Doctors(MBBS & above)
0.70.2
Practicing density per ’000 people
Non-practicing/informal density per ’000 people
Category
Issues leading to low % of formal practice
Non-practicing/informal
XX%
2.5
25% 40% 25% 100% ~50%
▪ Insufficient incentives
▪ Lack of career growth options
▪ Migration
▪ Low salaries▪ Lack of
career trajectory
▪ Increasing social stigma
▪ Security issues
▪ Policy logjam
▪ Insufficient allopathic training
▪ Patient perception of unreliability
▪ Policy logjam
SOURCE: Central Bureau of Health Intelligence, HR in health sector, 2005 and 2010; World Bank database, World Development Indicators (WDI); World Health Organisation, Global Health Expenditure Database;Twelfth Five-Year Plan; McKinsey analysis

18
� While regulatory systems have been partially defined, a holistic regulatory framework is required. A well-functioning and effective system is required to manage the large and diverse set of service providers in India. New legislations (e.g., the Clinical Establishments Registration Act) have been passed but implementation has lagged.
� Public-private collaboration has not yet achieved scale. Several pilots of public-private partnerships have been successful. However, none of them has been scaled up to meet India’s health challenges. While government sponsored social insurance programs have grown rapidly, nearly 75% of the population remains uncovered.
Five learnings for the future
The unresolved challenges of India’s healthcare sector during the past decade hold at least five lessons for its future development. First, an all-encompassing vision of future demand for health services should guide this vision and roadmap for Indian health system. Second, prevention and early stage management should be a core focus area. This is particularly relevant given the rising burden of NCDs. Such investments can significantly mitigate disease and cost burden. Third, a constructive and transparent dialogue will be needed between the public and private sectors at this early stage of the journey. Fourth, the focus needs to be on efficiency, especially through better utilisation. Finally, large-scale implementation needs strengthening.
Direction provided by the draft of the Twelfth Five-Year Plan
To envision India’s future health system and provide fresh impetus to its health reform journey, the Planning Commission has released a draft of India’s Twelfth Five-Year Plan. This draft defines the government’s health strategy based on the vision of ‘Universal Health Coverage’, as defined by a High Level Expert Group that was constituted by the Planning Commission. It envisions “assured access to a defined essential range of medicines and treatment at an affordable price, which should be entirely free for a large percentage of the population.” This vision is expected to be rolled out in the next 10 to 15 years.
This Five-Year Plan, based on a vision of universal access, appears to mark an important point of transition in India’s national health strategy. This draft and the HLEG’s recommendations serve as the reference point for our report, and we have used these as the basis for our perspectives and observations.
LESSONS FROM THE HEALTHCARE REFORM JOURNEYS OF PEER NATIONSIn considering how to transform India’s health system, there is much to learn from similar journeys by other countries. In their attempts to reform healthcare, countries tend to undergo the transformation in two phases: first, when the political leadership makes a strong commitment to providing access to all citizens; second, when having achieved access to a level greater than 80 per cent, governments attempt to strike a balance between the cost-effectiveness and quality of healthcare. India can learn from the transformation journeys of several countries.
Our approach: study the journeys, not the static picture
We chose to understand the healthcare reform journeys, often spanning several decades, and not rely on a static picture at a point in time. We selected 15 countries for the initial phase of study, and narrowed down during the latter phase of the exercise, to Brazil, Thailand and South Korea for an in-depth assessment of their health journeys, given their similarities to India at their starting point in the 1960’s [Exhibit 6].

19India HealthcareInspiring possibilities, challenging journey
Brazil: government driving financial coverage while leveraging private sector for provision
The health reform journey for Brazil has taken four decades and is continuing. The government initially chose to play a dual ‘payor’ and ‘provider’ role, and only after a decade of reforms, chose to retain its ‘payor’ role and leverage the private sector for provision.
Brazil’s health reforms have led to a significant improvement in access. Insurance coverage has reached nearly 100 per cent. Doctor density had risen to above 1.7 per 1,000 by 2008, from less than 0.4 in the 1960s. Public expenditure as a share of GDP almost doubled, from 2.8 per cent in 1995 to 4.2 per cent in 2010. Health outcomes in Brazil have improved dramatically during the reform journey of the last four decades. The infant mortality rate (IMR) in 2010 was at 15 per 1,000 live births in 2010, compared to the world average of 38. The maternal mortality ratio (MMR) in 2010 was at 56 per 100, compared to the world average of 210 per 100,000 live births in 2010.
The Brazilian healthcare system is not without its share of challenges. Infrastructure for SUS (social insurance scheme) patients in private hospitals needs to be revamped. The federal system of government with varying levels of performance of local governments has created disparities in health outcomes11.
Thailand: government driving the social insurance model
At the outset of its health reform journey, in the 1960s, Thailand had an IMR of 81 per 1,000 live births and a doctor density of only 0.1 per 1,000 people. Insurance covered about 10 per cent of the population. Overall spending on healthcare was less than 4 per cent of GDP.
11 Life expectancy ranged from 63 years in Alagoas to 71 years in Santa Catarina in 2003.
Exhibit 6
In the 1960s, the chosen countries had health statistics similar or worse to those of India in 2010
SOURCE: World Bank database, World Development Indicators (WDI) covering 214 countries from 1960 to 2011 with 331 indicators; McKinsey analysis
9
10
25
Thailand,1965
South Korea, 1965
Brazil, 1965 251
India,2010
0.4
0.1
0.7
0.5 70
65
50
63
Doctor density Share of private bedsInsurance coverage
Per cent Per 1,000 population Per cent
Chosen countries
1 Based on interviews, data is directionally correct however, may not be precise

20
Over the last four decades, the government has created financial access through a successful social insurance model, leading to a low out-of-pocket spend and a significant reduction in catastrophic expenses.
Thailand’s health challenges now lie in the low quality of its public health system despite strong measures to fund and monitor the quality of the ‘30 Baht Scheme’. To lessen the government’s financial burden, policymakers are now looking to reduce benefits packages or increase co-payments.
Thailand’s health reforms have been successful. Health outcomes are significantly better than world averages. The IMR in 2010 was at about 11 per 1,000 live births, compared to the world average of 38. The MMR in 2010 was at about 48 per 100,000 compared to the world average of 210 per 100,000 live births in 2010.
South Korea: government the single payor, while encouraging private investments and regulation of provision
At the beginning of its health reform journey, in the 1970s, South Korea’s health outcomes were already favourable in comparison to other nations and world averages. However, the system was characterised by low and inequitable access, and the absence of a regulatory framework. In the 1970s, doctor density was at less than 0.5 per 1,000 and insurance coverage at just 9 per cent. Out-of-pocket spending was high, leading to high inequity across income groups. Similar to today’s India, the absence of a regulatory framework coincided with a rapidly growing private sector.
The government decided to focus on the ‘payor’ role, integrated its bargaining power by consolidating all payors into a single entity, encouraged and incentivised the private sector to invest in provision, and drove down provision costs through a rigorous regulatory environment!
South Korea’s current problems in healthcare appear to be a high out-of-pocket spend and inefficiency. Despite 98 per cent coverage, out-of-pocket expenditure remains at a high 30 per cent. Driven by the low and regulated fees of general practitioners, more than 70 per cent of physicians are specialists. This bias, coupled with a high rate of physician consultations (i.e., 12 per year per capita, compared to 7 for OECD countries), indicates overuse and inefficiency within the health system.
Notwithstanding these challenges, South Korea’s health reforms have been successful and have led to health outcomes among the best in the world. The IMR in 2010 was at about 5 per 1,000 live births, compared to the world average of 38. The MMR in 2010 was at about 16 per 100,000 compared to the world average of 210 per 100,000 live births in 2010.
Six relevant learnings for India
The experiences of Brazil, Thailand and South Korea in reforming their healthcare systems, and the experiences of other nations, provide useful lessons for India [Exhibit 7]. These experiences substantiate the emphasis, laid out in the draft Twelfth Five Year Plan of the Planning Commission on removing barriers to health access, on removing the barriers to healthcare access.
First, transforming the health system is a long-term journey, championed and driven by political leadership over a sustained period. Second, creating universal access has to be a primary focus, with a secondary focus on efficiency or quality. Third, in an economic environment of low per capita income, it is not possible to create access with a high out-of-pocket spend. Fourth, government should ideally choose between the payor or provider role. Fifth, to collaborate with the private sector, government would need an inclusive vision, dialogue and an effective

21India HealthcareInspiring possibilities, challenging journey
regulatory framework. Finally, a decentralised federal system functions effectively when supported by a common policy framework.
THE DECADE TILL 2022: A CRUCIAL PHASE IN INDIA’S HEALTH REFORMS JOURNEYIt is unrealistic to assume that India’s health reforms journey can be achieved within a decade. Given the weak starting position and the complex realities of healthcare in India, the journey towards equitable, efficient, quality and universal access is likely to continue over a much longer timeframe. However, the next decade will need to count for much and enable the country to traverse a significant portion of its longer term journey.
Significant inequity in healthcare access
India’s inequity in healthcare access is a matter well known. The differences in health outcomes across states are strong indicators of this inequity. What is perhaps less understood is the magnitude of this inequity, its manifestation across the rural-urban divide and income segments, and its alarming upward trajectory.
In order to better understand this inequity, we analysed six segments of the population along the dimensions of urbanisation and income: urban poor, urban middle class, urban rich, rural poor, rural middle class and rural rich. While we recognise the importance of other factors such as gender and education, we excluded these from the analysis given the paucity and unreliability of available data.
We studied these six clusters to understand their growth rates over time, their healthcare situation such as disease prevalence and incidence, and healthcare choices such as spend profiles and site of treatment. The analyses bring to light six realities of healthcare access,
Exhibit 7
The three countries have managed to achieve good health outcomes by 2010
SOURCE: World Bank database, World Development Indicators (WDI) covering 214 countries from 1960 to 2011 with 331 indicators; McKinsey analysis
Infant mortality rate, 1965–2010
Per 1,000 population
Life expectancy, 1965–2010
Global average, 2010
India average, 20102010
1965
81
59
11
117
7
15Brazil
Thailand
4938
SouthKorea
73
74
57
57
57
81
65 69

22
remarkably different from each other. The differences in these realities need to be factored in as the government envisions its long term health reforms journey.
The analyses highlight several dimensions of inequity in healthcare access. First and foremost, the demographics of these population clusters are undergoing steady change that will add up over the coming decade [Exhibit 8]. Interestingly, rural India accounts for not only 70 per cent of communicable disease cases, but also 50 to 70 per cent of NCDs12 [Exhibit 9].
On the other hand, the urban rich access health services at a rate that is double that of the rural poor and 50 per cent more than national average. Moreover, major differences exist in the costs of hospitalisation between private and public facilities. Consequent to the two above mentioned factors, spend on hospitalisation for urban rich is significantly above that of other demographic groups.
Finally, urban and rural poor access private facilities the least, though the difference with the rich segment is not that significant.
12 NSSO records self-reported ailments in the last 15 days and during hospitalisation in the last one year. This analysis is based on this self reported data.
Exhibit 8
Population cluster sizes are changing steadily
SOURCE: NSSO Consumer Expenditure survey – 2005–06 and 2009–10; UN, Department of Economic and social affairs, World population prospects, 2010 revisions; McKinsey analysis
1 Population projection from UN, World population prospects, 2010 revisions
13.7 17.821.9
23.624.9
25.2
54.244.7
36.1
2010
1.2 billion
7.32.4
2001
1.1 billion
5.5
1.5
2.6
100%
Urban richUrban middle-classUrban poorRural richRural middle-class
Rural poor
2022(P)
1.41 billion
2.9 5.2
2.69.0
Share of population of 6 clusters
Per cent
CAGR, 2010–22 (P)Per cent
0.8
6.5
3.1
3.1
1.5
1.4
-0.5

23India HealthcareInspiring possibilities, challenging journey
Envisioning India’s health system in 2022
In the Planning Commission’s draft Twelfth Five-Year Plan, the vision laid out for India’s healthcare sector is to “establish a system of Universal Health Coverage”. This is undoubtedly a lofty aspiration, and in the right direction. Affordable healthcare underpins this vision, and is aligned to the learnings and experiences of nations that have moved a long distance in their health reforms journey.
Notwithstanding the need for pace and momentum, it will be important to avoid the trap of aiming for a goal that targets the maximum along all dimensions. Hence, while describing the 2022 vision, we have attempted to articulate 2022 goals that are aspirational and stretched, yet attainable.
� Much improved financial access. This would be achieved primarily through more extensive insurance cover, which could move up to 75 per cent13 from the current 25 per cent. Those who cannot pay for healthcare would receive it free through public provision (e.g., government hospitals) or government payments (e.g., RSBY).
� Healthcare resource gaps filled. Infrastructure would have scaled up with increased utilisation, reaching an overall bed density of around 2.1 per 1,000 people, including 1.0 to 1.2 beds per 1,000 people in rural areas and 3.8 to 4.2 beds per 1,000 people in urban areas [Exhibit 10].
13 Assuming 100 per cent coverage for poor population and up to 60 per cent coverage for the middle class.
Exhibit 9
Rural India accounts for 50–70% of non-communicable diseases
SOURCE: NSSO Morbidity and Health survey, 2004; McKinsey analysis
3231
31
20
2525
24
24
18 13 18
37
650%
100%Rural poor
Rural middle-class
Hyper-tension
16
38
Diabetes
22 16
Heartdisease
93
8
Cancer/ Tumours
3
Urban rich
Urban middle-class
Urban poorRural rich 1
7
Clusters Disease prevalence1
Per cent
1 Defined as cases per 1,000 population

24
� Workforce shortages have to be overcome. For this to happen, up to 90 per cent of registered practitioners will need to practise. Moreover, AYUSH and Rural Medical Practitioners will need to be incorporated into mainstream healthcare at a national level, thereby also bridging the urban-rural inequity in healthcare resourcing. By 2022, the country could aim for doctor and nurse density of 0.7 and 1.7 per 1,000.
� Much greater spending needed on healthcare vis-à-vis current levels of spending, and a much lower level of OOP. In order to achieve the desired financial access and build the desired level of infrastructure, total spending will need to be at 5.5 per cent of the country’s GDP by 2022, up from the current 4 per cent14 [Exhibit 11]. India’s out-of-pocket spend will need to come down from the current 61 per cent of total healthcare spend to 23 per cent.
� A much higher level of healthcare demand catered to. India’s health system will need to cater to a much higher level of demand for healthcare services. Hospitalisations will rise from the current 4.8 per 100 people to 6.5 per 100 people. For poor segments of the population, this will go up from 2.6 per cent to an impressive 6.1 per cent. For the rich segments, this will go up from the current 7.5 to 8.5 per cent15.
� Patient interests at the core of the agenda. Quality of care needs to be in focus, enabled by an effective regulatory system. This regulatory framework will need to include legislation for the standardisation of treatment practices, clinical establishments and malpractice mitigation.
14 Assuming a nominal GDP growth rate of 14 per cent based on Global insights, WIS. Growth rate for total health expenditure required to reach destination 2022 will be 16 per cent. Total healthcare spend will be INR 1,900,000 crore.
15 Access for the lower income groups increases towards the level of the middle-income groups, enabled by publicly funded services. For the higher income groups, access increases with awareness of NCDs, which require higher frequency of visits.
Exhibit 10
Bed density expected to increase to 2.1 per 1,000 population
SOURCE: Central Bureau of Health Intelligence, Health infrastructure, 2005 and 2010; World Bank database, World Development Indicators (WDI); World Health Organisation, Global Health Expenditure Database; ASSOCHAM; McKinsey analysis
Total beds
Number in lakhs
Bed density
Per 1,000 population
2010 (E)
UrbanRural
2022 (P)status quo
2022 (P)vision
3.83.4
1.20.3
3.9
0.8
2.11.3 1.8
1318 19
2
711
2022 (P)vision
30
2022 (P)status quo
25
2010 (E)
15
ESTIMATES

25India HealthcareInspiring possibilities, challenging journey
� Better integration of health facilities. Referrals from one link in the chain (e.g., primary health clinic or private physician) to another (e.g., tertiary hospital) needs to be orchestrated and patient treatments tracked.
� Consequently, a substantial and across-the-board improvement achieved in health outcomes. In effect, the Millennium Development Goals would have been met. In addition to the MDG goals, there will need to be emphasis on areas that have been hitherto in less focus, such as non-communicable diseases and services such as diagnostics, trauma and emergency care. The diagnosis of chronic diseases will have to be more in line with that of peer countries and even some developed countries.
Current momentum insufficient
The current trajectory of development in the healthcare sector will not be sufficient to achieve the 2022 vision. A ‘status quo’ approach will be rendered ineffective due to epidemiological pressures, burgeoning healthcare demand, existing and growing inequities in access and delivery, and unregulated growth of the sector.
� Gap in healthcare spending vis-à-vis the 2022 vision. If the current trajectory of spending growth were to continue, total health expenditure will in fact drop from the current 4 per cent of GDP to 3.65 per cent by 2022.
� Gap in healthcare infrastructure. At current growth rates, infrastructure will be unable to keep pace with demand. India will end up with a total bed density of around 1.7 to 1.9 per 1,000 people against the global average of 2.9, even in 2005, and the WHO guideline of 3.5. Public sector beds have been increasing at a CAGR of 3 to 4 per cent and private sector beds at a CAGR of around 7 to 10 per cent. However, this private sector growth cannot be sustained on a high level of out-of-pocket spend.
Exhibit 11
What could be India’s total healthcare expenditure and out-of-pocket share in 2022?
SOURCE: World Bank database , World Development Indicators (WDI) covering 214 countries from 1960 to 2011 with 331 indicators; McKinsey analysis
Total Healthcare Expenditure (THE)
Per cent of GDP
Share of out-of-pocket expenditure
Per cent of THE
5.5
3.74.0
2022 (P)status quo
2010 2022 (P)vision
23
54
61
2022 (P)status quo
2010 2022 (P)vision

26
� Gap in healthcare workforce. As per the Twelfth Five-Year Plan, the physician and nurse density is expected to reach around 0.7 and 1.7 per 1,000 respectively by 2022. Of these, if the current utilisation numbers were to be maintained, the active workforce would only be 0.5 and 0.8 per 1,000 respectively. It is evident that the government will need to play the lead role in accelerating from ‘status quo’ and providing much needed momentum to India’s health reforms journey.
ROLES AND IMPERATIVES FOR THE GOVERNMENTThe government will need to play the lead role to drive India’s healthcare transformation journey. It will need to make an important choice with regards to its primary role. We have also indicated a few areas that merit joint action by the government and the private sector.
Government’s ‘stewardship’ role
Health reforms journeys of peer nations underscore the stewardship of the government and the political leadership of the country. This stewardship is underpinned by at least eight imperatives:
� Creating the vision for the country’s health system. This vision will need to be long-term, sustainable and rooted in the core objective of the achievement of ‘universal healthcare coverage’. The government has taken an important step by stating its longer term goal of universal health coverage. Going forward, it will be important to detail this vision, describe the health system that the country should aspire for (i.e., beyond spelling out the targeted health outcomes and the quantum of funding and resourcing needed), and lay out a high level roadmap for the journey.
� Making a choice of its secondary emphasis beyond ‘universal access’, at the outset of the health reforms journey, between efficiency and quality. Experiences of peer nations indicate that governments have chosen between efficiency and quality at the outset, to complement its core objective of universal healthcare coverage. This choice informs government policy, regulatory framework and the usage of government funds. The Twelfth Five-Year Plan spells out affordability as an important consideration.
� Orchestrating the envisioning process such that it is inclusive. The integrity of the health system is important for it to succeed in achieving the country’s goals of universal healthcare coverage. This integrity can be achieved only through complementary goals and consistent and collaborative behaviour across the stakeholder groups including the public and private sectors.
� Ensuring that funding for healthcare is secured and appropriately deployed. The government will need to assume responsibility through a combination of its own budgetary outlays, private investments, funding from multilateral institutions, and reasonable levels of out-of-pocket spending. The total spending on healthcare needs to move up from the current 4 per cent of GDP to 6 to 7 per cent of GDP by 2022. Within this, government spending needs to move up to at least 3 per cent of GDP. In the main text of this report, we outline several initiatives the government could take to achieve this level of funding.
� Making a responsible and explicit choice between playing a ‘primary payor’ role and a ‘primary provider’ role. Rarely have governments been able to play the dual roles of ‘primary payor’ and ‘primary provider’, and do justice to the requirements of resourcing and leadership. Most governments chose the role of the primary payor, while a few chose the role of the primary provider. This choice will have important implications on how the government deploys its resources and leadership bandwidth, and where it encourages the private sector to invest. It will also have an impact on the nature of the country’s regulatory framework.
� Better utilising and integrating the existing workforce to address shortfalls. Adding to the existing workforce is an important priority. Setting up six medical institutes modelled after the AIIMS and upgrading thirteen regional medical colleges will go a long way towards

27India HealthcareInspiring possibilities, challenging journey
this goal. However, the new institutes will have an appreciable impact on the workforce only, and at least, after a decade of their setting up. Hence, improving the utilisation of the existing workforce becomes an important prerogative for the government. To achieve this goal, the government can undertake several initiatives, of which we outline a few in the main text of the report.
� Architecting the regulatory framework for the healthcare sector. This regulatory framework needs to be underpinned by the considerations of patient centricity, system performance, and the transparency of cost and outcomes data. Moreover, it should be in line with the primary roles to be played by the government and private sector. The main aspects that will need to be included in the regulatory framework will be the performance expectations from the healthcare delivery system, government support to promote private investments in healthcare, and the important aspects of reimbursement and copayment that will help extend financial coverage while encouraging system efficiencies and reducing the OOP spend.
� Orchestrating and facilitating, at a system level, the implementation of developmental initiatives. This role needs to be an important emphasis for the government during at least the initial phase of the health reforms journey. In addition, the government will need to harness information technology. The proposal to establish a Health Management Information System in the Eleventh Five-Year Plan was a critical step in playing this role. Building on this, the Twelfth Five-Year Plan approaches information technology in a more holistic way, incorporating this in registration, health records, electronic patient records, healthcare payments and telemedicine. The second is to build technical and managerial capability that will help drive large scale programs owned by the government.
Government’s choice of its primary role
The government will do well to explicitly choose between playing a ‘primary payor’ role and a ‘primary provider’ role. The two roles and their differences need to be defined, and their implications understood.
� Choosing the role of the ‘primary provider’. Making this choice implies that the government will focus its efforts primarily on the setting up and operations of hospitals, diagnostics, clinics and sub-centres across the country. Growth of social insurance will slow down as the government deploys its resources mostly in provision and subsidising the costs of treatment in its hospitals. Private provision will likely slow down with the government unlikely to incentivise private investments in setting up healthcare delivery centres. If the government were to play the role of the ‘primary provider’, it would have to strengthen several capabilities that we enumerate in the main text of the report.
� Choosing the role of the ‘primary payor’. Making this choice implies that the government will become the principal payor for healthcare in the country, with services provided through the private sector insurers as well as providers. Growth of public beds will slow down as government starts deploying an increasing share of funds in scaling up RSBY or similar schemes. Alternatively, the government could opt for a capitation, PPP or O&M contracting model, wherein the beds will be set up by the government, but the facilities managed and run by private players. Private provision will show strong growth. In addition, insurers are likely to experience strong growth if the social insurance schemes are rolled out at scale. If the government were to play the role of the ‘primary payor’, it should have to strengthen several capabilities that we enumerate in the main text of the report.
Working with the private sector
The 12th Five Year Plan envisages two predominant routes to enable this collaboration, first through government sponsored social health insurance schemes such as the Rashtriya Swasthya Bima Yojana (RSBY) and other state funded social health insurance schemes, and second through public-private-partnerships (PPP).

28
Our analysis of successful PPP schemes around the world indicates that the following five-stage approach increases success: first, create a legal framework; second, build competence in the public sector; third, carefully choose and test PPP models by understanding the key value drivers and risks; fourth, actively build a market and supplier base for public-private contracts; and finally, implement strict controlling and performance monitoring.
We consider action areas for collaboration that are aligned to the achievement of the country’s goals of universal healthcare access and do not need to necessarily wait for the development of a full-fledged long term healthcare vision. Progress in these areas could help enhance overall momentum and signal intent.
These action areas include the authorisation and accreditation of nursing associations (e.g., INA, NCI); creating and working with a body of private providers to address challenges in RSBY pricing and collections; potentially identifying a set of hospitals across the country where the private provider and government actively collaborate to ensure utilisation of beds, payments and reasonable profitability; rolling out and scaling up of existing standards such as the clinical standards and begin their implementation in a few geographies; launching a programme for tackling NDDS in collaboration with the private sector; considering the contracting out of operations and maintenance of select district hospitals to address utilisation and supply issues; and integrating patient records and other health care information with the UID or NPR, as a starting point to begin developing a patient data base.
This list is indicative, and by no means a comprehensive agenda for public-private collaboration.
OPPORTUNITIES AND IMPERATIVES FOR THE PRIVATE SECTORIn this section, we discuss about the driving forces that are likely to shape the industry in the next decade. We then identify opportunity areas these forces create for the sector, and the imperatives necessary for players to capture these opportunities. We discuss about four industry segments – providers (including diagnostics providers), insurers, pharmaceutical manufacturers and devices and equipment manufacturers.
Drivers for growth
The private industry stands at an interesting juncture, facing several headwinds and tailwinds. We have identified the drivers that will shape the private sector opportunities.
� The rising burden of NCDs: As the prevalence of non-communicable diseases balloons in the next decade, policy makers as well as insurers should increasingly push for long-term care models as opposed to event based models that are currently the norm. This approach will be a more holistic one, and will also drive the need for increased diagnostics and sophisticated devices.
� Increasing affordability: With rising income levels across the population, as well as increasing insurance coverage, the number of patients accessing health services will rise. This fact is reflected more strongly in the rural and urban middle class clusters. These ‘consuming’ classes will see the addition of nearly 150 million people over the next decade. Social insurance coverage under RSBY and state schemes will likely increase over the next plan period. Similarly, private insurance penetration has increased from 4 per cent to 7 per cent over the past decade and trend is expected to continue.
� Increasing awareness of disease, prevention and treatment: Rising awareness of health and related outcomes, and the rising perceived need for health insurance will lead to more patients exhibiting care seeking behaviour, especially if covered by insurance.

29India HealthcareInspiring possibilities, challenging journey
� Evolution of the six Indias, leading to newer and varying business models: Different population clusters vary significantly in terms of access, epidemiology and expenditure and are growing at highly different growth rates. These differences will drive the industry to evolve different business models for each. For example, the urban poor, which is currently the most neglected segment from a healthcare access perspective, will grow to nearly 10 per cent of the country’s population by 2022. The provider industry will need to explore ways to serve this large population group at right price points. A low cost model will be needed.
� Addition to and improved utilisation of the existing medical workforce: This will be applicable to the country’s strength of general practitioners, specialists, paramedics, technicians and nurses, whose numbers have been a key constraint to the expansion of the provider and equipments industry.
� Scaling up of public infrastructure: This will drive the growth of all associated healthcare industries. Depending on the government’s choice of a payor or provider role, the relative distribution of public versus private infrastructure will differ.
� Margin pressures will increase: As costs of manpower and utilities continue to rise, while prices come under competitive and regulatory pressure, the private sector will witness a steady pressure on margins.
� Saturation of the metro and urban centres: OOur analysis reveals that currently urban India enjoys 3.4 beds per 1,000 population, higher than global average of 2.6. This of course does not take into consideration the well known ‘drainage routes’16. within India towards the urban centres. Nonetheless, it does reveal the dramatic crowding of the sector in the metros. Discussions with leaders in the sector highlight the resultant pressures on utilisation and pricing17.
� Governmental push to ensure equitable access to affordable health services: This stated position, as per the Twelfth Five-Year Plan, could likely lead to a regulatory environment that aims at reducing the cost of care and OOP spend. The government should ideally take a holistic system-wide view to this cost containment.
� Stronger regulatory framework can shape efficiency and performance levels of the private sector. It is likely that the government will strengthen the regulatory framework through the standardisation of treatment guidelines, enforcement of the Clinical Establishment Act, and stronger redressal mechanism against malpractices is likely.
We fully expect India’s healthcare sector to grow at a steady pace during the next decade. The share of value added between the private and public sectors will depend in large measure on the pathway government adopts and the choices it makes. Notwithstanding these choices, we expect the sector to grow at a CAGR of 15 to 17 per cent, reaching up to 5 to 6 per cent of GDP. This will imply that total spending in healthcare could well be in the range of INR 17,00,000 crore to 21,00,000 crore by 2022. Needless to say, such growth will take place provided the government and other stakeholders choose to undertake the challenging journey of health reforms.
Opportunities and imperatives for the provider industry
As we discuss ‘providers’, we refer to the entire industry, including diagnostic services. We will make explicit references to diagnostic providers or unique business models only in cases when the implications for these segments are different.
Traditional opportunities for the provider industry are well known. Beyond these, the opportunities that stand out are:
16 Drainage routes refer to flow of patients from areas with poor healthcare access, to urban centers or other places with good healthcare facilities.
17 See Appendix

30
� Non-communicable diseases. NCDs represent an important high-volume and high-value opportunity. These accounted for nearly 53 per cent of mortality in 2009-10. Average bill size for NCD hospitalisation was nearly 50 per cent higher than the remaining in 2004-05. For the hospital, the ‘lifetime value’ of the patient will go up at no incremental capex.
� Non Metro urban market. This geographic segment will provide a large opportunity even for secondary and tertiary multispecialty hospitals. The business model for these hospitals will need to be adapted to lower costs, and staffed with a different doctor pool.
� The urban poor. This is the segment in which the private sector has the lowest penetration. Less than 50 per cent of hospitalisations take place in the private sector. This cluster will represent 10 per cent of India’s population by 2022, and could represent an interesting source of growth in metros.
� Government sponsored social health insurance programs. This opportunity, combined with the one above, will open doors to a hitherto underserved population. These schemes had provided hospitalisation cover to 183 million people by 2009-10. Early examples indicate that it is possible to develop low cost facilities to focus on such program.
To capture these opportunities, providers will need to undertake three imperatives. First, invest in business model innovation. Corporate chains will require different modules within their network - with different levels of capex, equipment usage, doctor models, non-healthcare services and utilities, and modes of payment. Second, maintaining profitability and ROIC18 in the existing facilities through greater operation efficiency and optimisation of capital [Exhibit 12]. Third, collaborate with other stakeholders in ‘private-private partnerships’ to plug leaks in patient funnel. This requires solutions that increase awareness, improve access to diagnostics, improves follow-up on referrals and strengthens trust amongst patients.
Exhibit 12
There are 15 key levers to improve return on capital employed
Returns on capital employed
Returns
Capital employed
Revenues
Costs
Patient experience
Business model
Capex
Conversation
Case mix
Footfalls
Pricing
Consumption per patient
Cost of material
Labour productivity
Patient satisfaction
Utilisation and throughput
Clinical quality
Strategic sourcing
Design to cost
Lean execution
Hospital format
Timing of investments
SOURCE: McKinsey analysis
18 Return on Invested Capital (ROIC) is a financial measure of how well a company generates cash flow relative to the capital it has invested in its business. When the return on capital is greater than the cost of capital, the company is creating value; when it is less than the cost of capital, value is destroyed.

31India HealthcareInspiring possibilities, challenging journey
Opportunities and imperatives for the health insurance industry
The last decade has been a landmark decade for health insurance. Total number of insured people increased from 55 million in 2003–04 to 300 million in 2009–10. Four opportunities have the potential to make the next decade one of unprecedented growth. These opportunities are aligned to the priorities for healthcare identified by the government.
� Government sponsored social health insurance programs. These schemes have already formed an important component of growth over the last decade. These present substantial opportunities for the private sector. For example, Kerala covered 2.7 million families under the RSBY scheme within 4 years of launch.
� Cover for out-patient spend. This is nearly twice in-patient spend—and will imply a doubling of spend, and potentially premium, with the same population covered. Needless to say, methods need to be evolved to control fraud and overuse.
� Non-communicable diseases. Given the chronic nature and slow onset of NCDs, these are strong reasons for consumers to seek health insurance. However, insurance products for them are still in early stages. Developing such products would be an important opportunity for private retail as well as government sponsored social insurance programs.
� The urban middle-class. This segment continues to offer a large opportunity. Private insurance coverage data indicates significant untapped opportunity.
To capture these opportunities, health insurers will need to undertake the following 4 imperatives. First, strengthen focus on improving quality of service delivered by hospitals. Currently, quality issues have been reported19 in private and public facilities. Insurance companies have the negotiating power to assure minimum standards of quality amongst providers. Second, continue efforts towards increasing awareness of health insurance. Third, innovate to create appropriate products targeted at non-communicable diseases. Finally, the sector has to identify systems and methods to extend coverage beyond in patients and into the outpatient segment as well.
Opportunities and imperatives for the pharmaceutical industry
The Pharmaceutical industry has seen robust growth of 13 to14 per cent during last five years. India’s domestic drug market was estimated at nearly INR 63,000 crore20 in 2010. Going forward, four opportunities stand out.
� Metro and tier-I markets. These geographies will continue to make significant contributions to growth, driven by rapid urbanisation and greater economic development. However, even here, medical treatment and compliance levels need significant investments and enhancement.
� The urban poor. This cluster is one of the fastest growing and much neglected segments. Geographical proximity makes it easier to tap than the rural segments.
� Infectious diseases and vaccines. If government adopts a provider role and continue with its thrust on immunisation, there will be new opportunities in these therapeutic areas.
� The rural population. This is currently the most underserved of all population clusters21. A profitable model to penetrate these markets at scale will need to be worked out.
19 Das et al., ‘In Urban And Rural India: A Standardised Patient Study Showed Low Levels Of Provider Training And Huge Quality Gaps’, Health Affairs, No. 12, Issue 31 (2021: 2774–84).
20 Data for 2004–11; IMS, SSA, MAT, December 2011, Annual report OPPI.21 Rural poor have the lowest hospitalisation frequency (admissions per 100 population, per annum).

32
To capture six opportunities, the pharma industry will need to undertake the following imperatives. First, protect margins and drive costs and efficiencies to cope with price pressures and changing demand landscape. Low cost manufacturing and improving operational efficiency will be critical. Second, segment the market at a granular level and develop different business models for different opportunities .Third, strengthen two sets of commercial capabilities: marketing excellence and sales force excellence. Fourth, leverage partnerships across the value chain (e.g., with providers, diagnostics) to plug leakages in the patient funnel. Fifth, engage with government extensively, particularly if it adopts the provider model. Sixth, design its commercial model to cater to the rural population.
Opportunities and implications for medical devices and equipment industry
The medical devices and equipments sector is seriously under-penetrated in India. Poor diagnosis and treatment rates combined with an absence of affordable products have led to this situation. If Indian healthcare were to fulfil its promise in the next decade, the following opportunities would arise for medical devices and equipments players:
� High income population segments in metros and tier I markets. Unlike in pharmaceuticals and providers, this population segment continues to remain underpenetrated for medical devices. In order to capture the full potential, players would need to drive awareness and acceptance. Orthopaedic reconstructive joints and pacemakers are cases in point.
� Mid-income segment in urban areas. The potential in this segment is underpinned by a large and growing population, rising incidence of non-communicable disease, old age and greater access to diagnosis and treatment. To capture this opportunity players will need to introduce products with mid-tier pricing and coordinate with the other players in the value chain to provide a low ‘cost of treatment’ offering.
� Home-based self-monitoring devices. This opportunity is supported by the growth of chronic diseases, greater awareness and compliance. In addition, we witness a growing tendency amongst patients to become self-reliant with regards to non-invasive and periodic monitoring for chronic disorders.
� Provider based equipment. This opportunity will grow, driven by an increase in healthcare delivery facilities. To accelerate this growth innovative financing and public-private partnerships (PPP) will be crucial.
To capture these opportunities, the private sector will have to undertake the following imperatives. First, strengthen commercial capability to cater to the traditional urban rich segment. Second, introduce globally relevant products with state-of-the-art features targeting specialists and super-specialists in metros. Third, enhance product development capabilities to offer product with reduced features at mid-tier pricing. Fourth, drive collaboration across players in the business system in order to provide end-to-end treatment solutions. Fifth, for provider based equipment, drive innovation in financing and PPP models to develop solutions that can be scaled up.
* * *
India initiated its health reform journey in the last decade. This journey now needs to gain momentum. An ever growing disease burden for a large scale and evolving population demands fast –paced health reforms. What peer nations have achieved across three to four decades needs to be achieved here in much lesser time. Therein lies the importance of the next decade.
The government will need to lead this healthcare reform journey. It needs to reach out to, and in turn be supported by, other stakeholders such as the private sector. The stated goal of universal

33India HealthcareInspiring possibilities, challenging journey
health coverage in the draft of the Twelfth Five-Year Plan, and the HLEG’s recommendations, provide a solid start to this journey. While the journey will be challenging, the outcomes and opportunities will be inspiring. We feel confident that purposeful and visionary leadership by the government, along with concerted action by all stakeholders, will help India achieve its healthcare vision and provide its populace with best-in-class health outcomes.

34

35India HealthcareInspiring possibilities, challenging journey
2002–12: A decade of lessons learnt but opportunities lostAt the turn of the century, health outcomes in India and the underlying health system were significantly lagging behind those of peer nations. The progress made in the last decade has been mixed. On the one hand, reforms introduced in the Eleventh Five-Year Plan and the government’s focus on the Millennium Development Goals (MDGs) have led to successes such as improvements in maternal and child health and in the control of infectious diseases. Private sector growth contributed extensively to access. On the other hand, despite successes in some areas, major challenges persist. India continues to lag behind peers in health outcomes. Its healthcare system is under-resourced, notwithstanding the efforts that have begun to strengthen it. Despite strong efforts, public-private collaboration has not achieved scale. A review of the outcomes over the past decade provides important lessons for shaping the next decade of healthcare reform in India.
LOW OUTCOMES AND INSUFFICIENT RESOURCING AT THE TURN OF THE CENTURYAt the start of this century, India’s health outcomes lagged behind those of its LMIC1 peers; access to healthcare remained inequitable, and the health system was under strain, with resources below benchmarks. Collaboration between the public and private sectors was insignificant.
India’s infant mortality rate (IMR)2 and maternal mortality ratio (MMR)3 lagged behind the average for LMIC [Exhibit 1.1]. Life expectancy in India, at 62 years4, was three years below the LMIC average in 20004. Moreover, health outcomes varied dramatically across states: while Kerala had very good outcomes (e.g., IMR5 of 14 in 2000), Orissa’s outcomes (e.g., IMR5 of 98 in 2000) were much worse than the national and LMIC averages. Several other states remained on either end of the spectrum.
The Indian healthcare sector faced shortages of workforce and infrastructure. There were 1.67 trained allopathic doctors and nurses per 1,000 population5 in 2000 compared to the World Health Organisation (WHO) recommended guideline of 2.5 per 1,0006 [Exhibit 1.2]. Total bed density in the country (0.69 per 1,000 population) was well below the global average (2.6) and WHO guideline (3.5)7.
1 Low and middle-income countries. This is an income based classification of countries by the World Bank. Income is accepted as an important determinant of health outcomes. India falls within the LMIC category. Therefore, LMIC average was chosen as the reference.
2 Infant Mortality Rate (IMR) is the number of deaths of children less than one year of age, per 1,000 live births.
3 Maternal Mortality Ratio (MMR) is the number of women who die during pregnancy and childbirth, per 100,000 live births.
4 World Bank database, World Development Indicators (WDI) covering 214 countries from 1960 to 2011 with 331 indicators.
5 Based on figures from Central Bureau of Health Intelligence (CBHI).6 WHO has provided a guideline on minimum density of healthcare practioners required for better health
outcomes.7 Based on estimate of bed density/numbers from CBHI and WHO.

36
Exhibit 1.1
India’s health outcomes lagged LMIC
SOURCE: World Bank database, World Development Indicators (WDI) covering 214 countries from 1960 to 2011 with 331 indicators
Maternal mortality ratio
Per 100,000 live births, 2000
Infant mortality rate
Per 1,000 live births, 2000
1 Low and Middle Income Countries
350
390
LMIC1 averageIndia
57
64
LMIC1 averageIndia
Exhibit 1.2
India has a shortage of trained medical workforce
SOURCE: WHO – The world health report, 2006; WHO – Human resources for health (JLI), 2004; CBHI
1.13 1.251.50
0.540.60
0.71
2000
1.67
2010
2.21
2005
1.85
2.5
0.83
1.671
1 Assuming nurse to doctor ratio of 2:1
WHO guidelineRegistered workforce density
Per 1,000 population
NursesDoctors (MBBS and above)

37India HealthcareInspiring possibilities, challenging journey
Total healthcare expenditure4 in India was 4.4 per cent of GDP in 2000, below the LMIC average of 5.3 per cent8 [Exhibit 1.3]. Of this, out-of-pocket spend4 was 67 per cent, much higher than the LMIC average of 44 per cent. Health insurance covered only 5 per cent of Indians in 2003–04, of which 3.5 per cent was sponsored by government for its employees9. While the private sector10 accounted for 49 per cent of total bed capacity in 2002, there was no legislation mandating the registration of private health facilities [Exhibit 1.4]. It was well acknowledged that the regulatory system needed to be strengthened.
8 Draft of the Twelfth Five-Year Plan defines core and broader health expenditure; latter also includes expenditure on sanitation, Integrated Child Development Services (ICDS) and mid-day meals. Throughout this report, Total Health Expenditure (THE) refers to the core health spend, as per the draft of Twelfth Five-Year Plan.
9 La Forgia, Gerard and Somil Nagpal, ‘Government-Sponsored Health Insurance in India: Are You Covered? Directions in Development’, Table 3.1 (Washington, DC: World Bank, 2012). DOI:10.1596/978-0-8213-9618-6. License: Creative Commons Attribution CC BY 3.0.
10 Private sector refers to all non-governmental institutions.
Exhibit 1.3
India’s healthcare spend lags behind LMIC with a high percentage of out pocket spend
SOURCE: World Bank database, World Development Indicators (WDI) covering 214 countries from 1960 to 2011 with 331 indicators; World Health Organisation, Global Health Expenditure Database
Total Healthcare Expenditure (THE)
Per cent of GDP
Share of out-of-pocket spend
Per cent of THE
4.04.4
5.75.3
20102000
LMIC averageIndia
6167
37
44
20102000

38
SOME SUCCESSES IN THE PAST DECADE: THE FRUITS OF REFORM AND PRIVATE ENTREPRISEIn the last decade, India’s health system developed well in some areas. Public sector efforts gained momentum with the adoption of the MDGs, as the government set targets to reduce the MMR by three quarters between 1990 and 2015; to halt the spread of HIV/AIDS, malaria and other major diseases; and to reverse their spread by 2015.
The Eleventh Five-Year Plan brought about the long-awaited healthcare reforms. These led to a greater intensity and some changes in the direction of government initiatives11. In the private sector, healthcare facilities grew rapidly and insurance coverage increased.
Between 2000 and 2010, the IMR4 and MMR4 fell to 49 per 1,000 live births and 200 per 100,000 live births, respectively, a faster reduction than in the previous decade [Exhibit 1.5]. Polio has been successfully curtailed and the epidemic of HIV/AIDS stemmed. Life expectancy4 improved by 7 per cent to 65 years in 2009, as against 5.6 per cent in the previous decade.
The government made a clear shift from disease-focused programmes to an integrated health systems approach. The National Rural Health Mission (NRHM) was introduced in April 2005 to strengthen delivery in rural areas. In the same year , the government reorganised independent disease control programmes under one umbrella programme, the National Vector Borne Disease Control Programme, and included within it diseases such as AIDS, tuberculosis and malaria. This move increased efficiency in delivery.
11 Throughout the report, “government” refers to the Centre and State governments. “Centre” or “State” will be specified where necessary.
Exhibit 1.4
Health infrastructure is well below WHO guidelines
0.34 0.490.36
0.41
0.47
Global average1
WHOguideline
2010 (E)
1.30
0.82
2005
0.90
2002
0.70
9%
13%
5%
PrivatePublic
Bed density CAGR, 2002–10
Per 1,000 population
1 For 2002
3.5
2.6
SOURCE: Central Bureau of Health Intelligence, Health infrastructure, 2005 and 2010; World Bank database, World Development Indicators (WDI); World Health Organisation, Global Health Expenditure Database; ASSOCHAM; McKinsey analysis

39India HealthcareInspiring possibilities, challenging journey
The government also unveiled the Department of AYUSH (Ayurveda, Yoga & Naturopathy, Unani, Siddha and Homoeopathy) within the Ministry of Health. According to the Eleventh Five-Year Plan, this department was to be an important platform for “producing skilled human resources, with the objective of optimum utilisation of AYUSH for meeting the unmet needs of the population”.
To reduce out-of-pocket spend for low-income families, the Central government and several State governments introduced government-sponsored health insurance schemes. Since 2003, 184 million Indians have been covered by these schemes, raising India’s covered population from 5 per cent to 25 per cent within a decade9. The Rashtriya Swasthya Bima Yojana (RSBY), an insurance scheme sponsored by the Central government, covers in-patient treatment. These social insurance schemes have emerged as the most successful mechanism for making private sector facilities accessible to the poor.
During this period, the private sector grew to become the major provider of healthcare services. Its share of beds increased from 49 per cent of total beds in 2002 to 63 per cent in 201012 [Exhibit 1.6]. As per the NSSO Morbidity and Healthcare survey 2004, the private sector accounted for 59 per cent of all in-patient admissions and 72 per cent of out-patient consultations [Exhibit 1.7]. Private diagnostic service providers grew at 20 per cent during 2004–0913, while the pharmaceuticals market grew at around 15 per cent14 per annum.
12 Based on estimates of bed density/numbers from WHO, CBHI, NSSO, ASSOCHAM and McKinsey analysis.13 Cygnus Research.14 Data for 2004–11; IMS, SSA, MAT, December 2011, Annual report OPPI.
Exhibit 1.5
India’s health outcomes improved more rapidly between 2000 and 2010 than in the decade before that
SOURCE: World Bank database, World Development Indicators (WDI) covering 214 countries from 1960 to 2011 with 331 indicators
Maternal Mortality Ratio
Per 100,000 live births
Infant Mortality Rate
Per 1,000 live births
200
390
600
-8% p.a.
-4% p.a.
201020001990
49
64
81-3% p.a.
-2% p.a.
201020001990

40
Exhibit 1.6
Private sector created over 70% of the new beds, increasing its share of beds between 2002 and 2010
Total beds
'000
2010 (E)
1,555
577
978
605
188
2002
762
389
373
Public
Private
SOURCE: Central Bureau of Health Intelligence, Health infrastructure, 2005 and 2010; World Bank database, World Development Indicators (WDI); World Health Organisation, Global Health Expenditure Database; ASSOCHAM; McKinsey analysis
ESTIMATES
49%
63%
XX Percentage share of total
Exhibit 1.7
Private sector delivered 60–70% of the health services in India
SOURCE: NSSO, Morbidity and Healthcare Survey, 2004; McKinsey analysis
In-patient admission rate, 2004
Admissions per 100 population per year
Out-patient consultation rate, 2004
Consultations per 100 population per 15 days
100% =
Public
Private
2.8
59%
41%
100% =
Public
Private
143.2
28%
72%

41India HealthcareInspiring possibilities, challenging journey
The past decade also witnessed several pilots of public-private partnerships, particularly in hospitals and diagnostic services. Several business models were deployed including the contracting in of services, joint ventures and management contracts. Some of these are now considered success stories and have been mentioned in the draft of the Twelfth Five-Year Plan as models that need to be replicated.
MAJOR CHALLENGES PERSISTDespite the progress made in the last decade, major challenges persist. Health outcomes remain unsatisfactory, healthcare spending insufficient and the share of out-of-pocket spending high. Health infrastructure and workforce remain inadequate and, despite this shortage, at times underutilised. Implementation of health systems needs to be significantly strengthened. Finally, collaboration between government and the private sector has not achieved scale despite few success.
Health indicators continue to lag
Maternal and child health indicators (i.e., IMR and MMR) improved faster in the past decade than in the one before, but continue to fall behind LMIC averages. India’s IMR4 in 2010 was at 48 vis-à-vis an average of 42 for the LMIC. It is likely that India will fall short of the 2015 targets for IMR and MMR set in the MDGs [Exhibit 1.8].
Exhibit 1.8
86
115
38
63
0
20
40
60
80
100
120
50–60
201020001990
India is unlikely to achieve the health-care related MDG targets by 2015
SOURCE: WHO World Health Statistics 2012; India Health Statistics; NFHS–3; McKinsey analysis
Expected performance (using same CAGR as previous years)Performance needed tomeet MDGs
Historical performanceHistorical CAGR
MMR in India over timeU5MR in India over time
Deaths per 1,000 live births Deaths per 1,000 live births Deaths per 100,000 live births
63
81
27
48
0
10
20
30
40
50
60
70
80
90
1990
~40–45
20102000
-3%
390
600
80
200
0
100
200
300
400
500
600
700
150–155
201020001990
-3%
-5%
IMR in India over time

42
The Non-Communicable Disease (NCD) burden has grown to 57 per cent of the total disease burden by 200815, with no scaled-up programmes to tackle these diseases. On the other hand, infectious diseases still constitute 37 per cent of the disease burden. Malnutrition in children and anaemia in women stand out as public health challenges. India has 20 per cent of global under-five children but accounts for 54 per cent of underweight children in the world16.
Healthcare spend is not growing at the same pace as GDP
As per WHO National Health Accounts, India’s healthcare spending as a percentage of GDP has reduced from close to 5 per cent in 2001 to 4 per cent in 2010. This implies that, in nominal terms, India’s healthcare expenditure has grown at a slower rate than the country’s GDP17 [Exhibit 1.9].
15 Based on Patel, Vikram et al., ‘India: Towards Universal Health Coverage 3: Chronic diseases and injuries in India’, Lancet, Vol. 377, 29 January 2011.
16 Calculated as weight for age < -2 standard deviations from WHO growth reference median; UNICEF: ‘The State of the World’s Children’, 2012.
17 We also analysed value added contributions of health-related sectors to GDP. Over the past 10 years, health and social services have grown at 14.3 per cent CAGR in nominal terms (7.4 per cent CAGR in real terms), slower than the GDP growth rate of 14.5 per cent in nominal terms (7.9 per cent CAGR in real terms). On the other hand, the market for pharmaceuticals has grown faster than GDP growth at 16.3 per cent in nominal terms (14.6 per cent in real terms). For the devices and equipment market, the nominal growth rate at 14.1 CAGR is lower than the corresponding nominal GDP growth rate of 14.5 per cent. However, adjusting for inflation shows that the devices sector has grown at a faster rate than GDP (10 per cent and 7.9 per cent, respectively, in real terms).
Exhibit 1.9
Indian healthcare expenditure has grown slower than GDP, unlike most peers
SOURCE: World Health Organisation, Global Health Expenditure Database
1 Nominal value2 Numbers are arrived by subtracting (1) CAGR for THE from, (2) CAGR for GDP between 2001–10 (for e.g., in India; 12.4% - 14.2% = -1.7%)
0.7
3.5
2.8
2.6
2.3
2.1
2.0
2.0
1.3
-1.5
-1.7
Bangladesh
Thailand
China
Russia
India
LMIC average
Turkey
Brazil
Malaysia
Philippines
Indonesia
Total Health Expenditure in India1
INR ’000s crore
Difference between CAGR of Total Health Expenditure and CAGR of GDP2
Percent, 2001–2010
GDP in India1
INR ’000s crore
304
106
12.4%
20102001
7,492
2,270
14.2%
20102001

43India HealthcareInspiring possibilities, challenging journey
Out-of-pocket spend continues to be high despite rise in public spending
Although the government’s share of healthcare spend increased from 26 per cent in 2000 to 29 per cent by 2010, it remains well below the LMIC average of 52 per cent. While government social insurance schemes have been introduced and now cover 15 per cent of the population, they currently include only in-patient services that made up only a quarter of the total out-of-pocket spend in the past decade.
Infrastructure gaps remain substantial, and coexist with underutilisation
As stated earlier in the chapter, India faces a persistent shortage of infrastructure, including equipment. Total bed density12 had increased to 1.29 per 1,000 by 2010, but remains significantly lower than the WHO guideline18 of 3.5 beds per 1,000. Much of this shortfall is owing to the lag in rural areas. While urban areas have a bed density12 of about 3.4 per 1,000, rural areas have only 0.3 per 1,000 population19 [Exhibit 1.10].
Underutilisation of existing resources further compounds the problem of meagre infrastructure. Private sector hospitals routinely face utilisation issues and a material proportion of private sector hospital start-ups do not succeed. A leaky patient funnel19, a phenomenon in several disease areas and in non-communicable diseases in particular, is an important element of such underutilisation [Exhibit 1.11].
18 Referred to in High Level Expert Group’ Report on Universal Health Coverage in India.19 Patient funnel refers to patient journey through diagnosis to compliance. If patients do not seek treatment
for several reasons, including lack of awareness about the illness, suboptimal training levels of providers, imperfect referrals, misaligned provider incentives, etc. it is referred to as a leaky patient funnel
Exhibit 1.10
Total beds
Thousands
National averages mask inequities in urban and rural infrastructure distribution
SOURCE: Central Bureau of Health Intelligence, Health infrastructure, 2005 and 2010; World Bank database, World Development Indicators (WDI); World Health Organisation, Global Health Expenditure Database; ASSOCHAM; McKinsey analysis
Bed density
Per 1,000 population2005 2010 (E)
3.42.6
0.30.2
1.290.9
UrbanRural
2010 (E)
232
1,026
1,576
2005
1,344
144
882

44
Utilisation of public sector facilities remains low despite the government’s efforts to maintain and upgrade them. Moreover, the quality of existing rural health infrastructure needs improvement, with more than 80 per cent facilities not following Indian Public Health Standards20 [Exhibit 1.12].
Health workforce remains inadequate and underutilised
A substantial number of qualified medical doctors are available in the country. In fact, if the substantial population of AYUSH practitioners and Rural Medical Practitioners is included, the total density of registered medical workforce5 is at 2.8 per 1,000 compared to the WHO guideline of 3.0 per 1,000 [Exhibit 1.13]. This however hides the reality that several specialties have a scarcity of specialist physicians, specialised nurses, paramedics and technicians.
Despite the scarcity of medical personnel, the problem of underutilisation exists in places. With only about 60 per cent of registered nurses and 75 per cent of allopathic and AYUSH practitioners being active21, the density of practising workforce falls to 1.9 per 1,000, significantly lower than the WHO guideline [Exhibit 1.14]. Our interactions with professional associations and health experts reveal the causes of the low rates of practising. For nurses, these include low salaries, a lack of career opportunities, the lack of secure working conditions and a rising social stigma against the profession. Doctors are faced with salaries that are lower than competing professions and insufficient opportunities for specialisation.
20 Based on Rural Health Statistics, NRHM.21 Based on High Level Expert Group Report on Universal Health Coverage in India.
Exhibit 1.11
Patient funnel
Multiple gaps lead to leakages in the patient funnel
SOURCE: McKinsey analysis
Diagnosis Treatment Compliance
Prevention Incidence
Drivers of leakage
▪ Low awareness of the population
▪ Limited incentives among providers
▪ Limited awareness among population
▪ Different training levels of providers
▪ Suboptimal training levels
▪ Imperfect referrals
▪ Misaligned provider incentives
▪ Low awareness▪ Limited touch
points with other stakeholders
▪ Treatment economics

45India HealthcareInspiring possibilities, challenging journey
Exhibit 1.12
Adequately functional facilities
Inadequate existing facilities (do not meet IPHS1 norms)
Non-existent infrastructure
80% of existing rural health infrastructure does not meet IPHS norms
SOURCE: Rural Health Statistics in India, 2011, NRHM1 Indian Public Health Services
Type offacility Shortage percentage Key issues leading to inadequate quality
11
12
10
64
49
70
39
PHCs 25
Total requirement = 100%
SCs 20
CHCs
▪ Lack of referral transport in 60% PHCs
▪ Absence of labour room in 35% PHCs
▪ Absence of mandatory 4 beds in 40% PHCs
▪ Lack of specialist quarters in 45% CHCs, hence only 13% facilities have the mandatory 4 specialist doctors
▪ Lack of ANM residing quarters in 45% SCs
▪ Lack of regular water/electricity supply in 25% SCs
Totalshortage
Per cent
Exhibit 1.13
Integration of informal practitioners could bridge the gap to meet WHO guideline on medical workforce
3.00.20.6
1.5
0.7
WHOguideline:
TotalRMP2AYUSH1
practitionersNursesAllopathic
doctors(MBBS & above)
1 Ayurvedic, Yoga, Unani, Siddha and Homeopathy2 Rural Medical Practitioners (insufficiently qualified medical practitioners)
Density of health workforce
Per 1,000 population, 2010
2.5
SOURCE: Central Bureau of Health Intelligence, HR in health sector, 2005 and 2010; World Bank database, World Development Indicators (WDI); World Health Organisation, Global Health Expenditure Database; McKinsey analysis

46
Rural Medical Practitioners (RMPs) can be of great help in this situation. If even a subset of 2–3 lakh out of the 5 lakh strong RMP cadre22 can be effectively integrated and utilised in the formal sector, it would go a long way to mitigating the shortage of trained workforce.
Quality remains an issue, even among trained practitioners23. Incorrect diagnosis and treatment have been reported in studies.
While systems have been partially defined, their implementation needs strengthening
A well-functioning and effective system is required to manage the large and diverse set of service providers in India. New legislation (e.g., the Clinical Establishments Registration Act) has been passed but implementation has lagged. Several standards and processes such as the quality of services, pricing of services and clinical standards of delivery are yet to be defined.
The Integrated Disease Surveillance Programme for infectious diseases has been announced and its implementation is underway. However, there is no corresponding surveillance programme for non-communicable diseases. On similar lines, India does not yet have a formal patient and population health information management system.
Public-private collaboration has not yet achieved scale
Several pilots of public-private partnerships have been successful. However, none of them has been scaled up to meet India’s health challenges. Similarly, while social insurance schemes have been effective in leveraging available public and private services, these cover in-patient care only.
22 Based on ‘India’s health workforce size, composition and distribution (PHFI) and McKinsey analysis.23 Das et al., ‘In Urban And Rural India: A Standardised Patient Study Showed Low Levels Of Provider Training
And Huge Quality Gaps’, Health Affairs, No. 12, Issue 31 (2021: 2774–84).
Exhibit 1.14
About 50% of existing medical workforce does not practice in the formal health system
0.9 1.9
0.5
0.5
1.10.6
WHOguideline:
Total
3.0
RMP
0.2
AYUSH
0.60.2
Nurses
1.5
Allopathic Doctors(MBBS & above)
0.70.2
Practicing density per ’000 people
Non-practicing/informal density per ’000 people
Category
Issues leading to low % of formal practice
Non-practicing/informal
XX%
2.5
25% 40% 25% 100% ~50%
▪ Insufficient incentives
▪ Lack of career growth options
▪ Migration
▪ Low salaries▪ Lack of
career trajectory
▪ Increasing social stigma
▪ Security issues
▪ Policy logjam
▪ Insufficient allopathic training
▪ Patient perception of unreliability
▪ Policy logjam
SOURCE: Central Bureau of Health Intelligence, HR in health sector, 2005 and 2010; World Bank database, World Development Indicators (WDI); World Health Organisation, Global Health Expenditure Database;Twelfth Five-Year Plan; McKinsey analysis

47India HealthcareInspiring possibilities, challenging journey
FIVE LESSONS FOR THE FUTUREThe progress and unresolved challenges of India’s healthcare sector over the past decade hold at least five lessons for its future development.
First, an all-encompassing vision of future demand for health services should guide India’s vision and roadmap for health system development. The past decade has seen insufficient focus on neglected population blocks such as the urban poor and investments in pockets such as the screening and management of NCDs. As a result, NCDs now account for over 50 per cent of the disease burden, and the urban poor depend heavily on the private sector that they cannot really afford. As India lays out its vision, strategy and roadmap for its health reform journey, it cannot fail to anticipate or afford to neglect the health needs of important demographic and epidemiological segments.
Second, prevention and early stage management should be a core focus area. This is particularly relevant given the rising burden of NCDs. Conscious investments in such areas can significantly mitigate disease and cost burden.
Third, a constructive and transparent dialogue will be needed between the public and private sectors at this early stage of the journey. The private sector—providers, pharmaceuticals players, device and equipment manufacturers and insurers—will need to play an integral and indispensable role in India’s future health system. Given this integral and important role, a full-fledged and transparent dialogue between the government and the private sector is an absolute necessity. This dialogue should include a jointly held vision of the country’s health outcomes and health systems, the complementary roles of the government and the private sector, performance expectations from the private sector and the support needed from the government. All this would ideally translate into an integrated regulatory framework.
Fourth, the focus needs to be on efficiency, especially through better utilisation. Given the paucity of resources, the need for efficiency is undeniable. While additional resources are required in the system, plans for the future must address root causes of underutilisation, most importantly the leaky patient funnel. Not only will the focus on efficiency bring more resources into play, it will also improve the impact of the government’s future investments in resource building.
On the demand side, several factors hamper utilisation of available health services: lack of awareness, problems with quality leading to lack of trust and poor follow-up when one provider refers a patient to another. These issues will need to be addressed to improve the utilisation of health services.
Finally, large-scale implementation needs strengthening. Several programmes such as the National Health Mission (NHM), social insurance schemes and the Clinical Establishments Act, need to be implemented on a large scale. A comprehensive assessment of the gaps in current implementation is required. These gaps need to be addressed as a priority, as other programmes are rolled out at scale. Improvements needed include greater accountability, improved absorption of funds and enhanced institutional support.
To envision India’s future health system and provide fresh impetus to its health reform journey, the Planning Commission has released the draft of Twelfth Five-Year Plan. This document defines the government’s strategy based on the vision of ‘Universal Healthcare Coverage’, as defined by a High Level Expert Group constituted by the Planning Commission. It envisions “assured access to a defined essential range of medicines and treatment at an affordable price, which should be entirely free for a large percentage of the population”. This vision is expected to be rolled out in the next 10–15 years.
48
This draft, based on a vision of universal health coverage, appears to mark an important point of transition in India’s national health strategy. It should provide new momentum to the transformation journey that was initiated during the Eleventh Five-Year Plan period.
This draft and the HLEG’s recommendations serve as the reference point for our report. We have used the vision and roadmap laid down as the basis for our perspectives and observations.
* * *
Having laid out the starting position in this chapter, we study the health reform journeys undertaken by other countries in Chapter 2. The objective is to draw lessons that can be relevant for India. In Chapter 3, we develop a deeper understanding of the challenges facing India, the health system required in the context of these challenges and a possible roadmap to achieving this health system vision. In Chapters 4 and 5, we discuss opportunities and imperatives for the government and the private sector.

49India HealthcareInspiring possibilities, challenging journey

50

51India HealthcareInspiring possibilities, challenging journey
Lessons from healthcare reform in other countriesIn considering how to transform India’s health system, there is much to learn from similar journeys by other countries. In their attempts to reform healthcare, countries tend to undergo the transformation in two phases: first, when the political leadership makes a strong commitment to providing access to all citizens; and, second, when having achieved access to a level greater than 80 per cent, governments attempt to strike a balance between the cost-effectiveness and quality of healthcare. India can learn from the transformation journeys of several countries.
OUR APPROACH: STUDY JOURNEYS, NOT A STATIC PICTUREWe wish to highlight four aspects of the approach adopted in this exercise. First, the team chose to understand the healthcare reform journeys, often spanning several decades, and not rely on a static picture at a point in time. Second, the focus of the study has been to understand choices made by the government (e.g., role allocation between the government and the private sector) and their implications for outcomes. Third, the team selected 15 diverse countries for the initial phase of study. This list included developed and relatively smaller economies such as South Korea and Australia, large developed economies such as the United Kingdom (UK) and the United States of America (US), emerging economies such as Brazil and Thailand, and city states such as Singapore and Hong Kong. Finally, during the latter phase of the exercise, we chose the health journeys of Brazil, Thailand and South Korea for an in-depth assessment.
The starting points in the health reform journeys of Brazil, Thailand and South Korea have been similar to those in India in the important aspects of access, per capita incomes and private sector presence and role [Exhibit 2.1]. These journeys provide key lessons in infrastructure development, workforce density, financial coverage, healthcare spending and collaboration with the private sector.
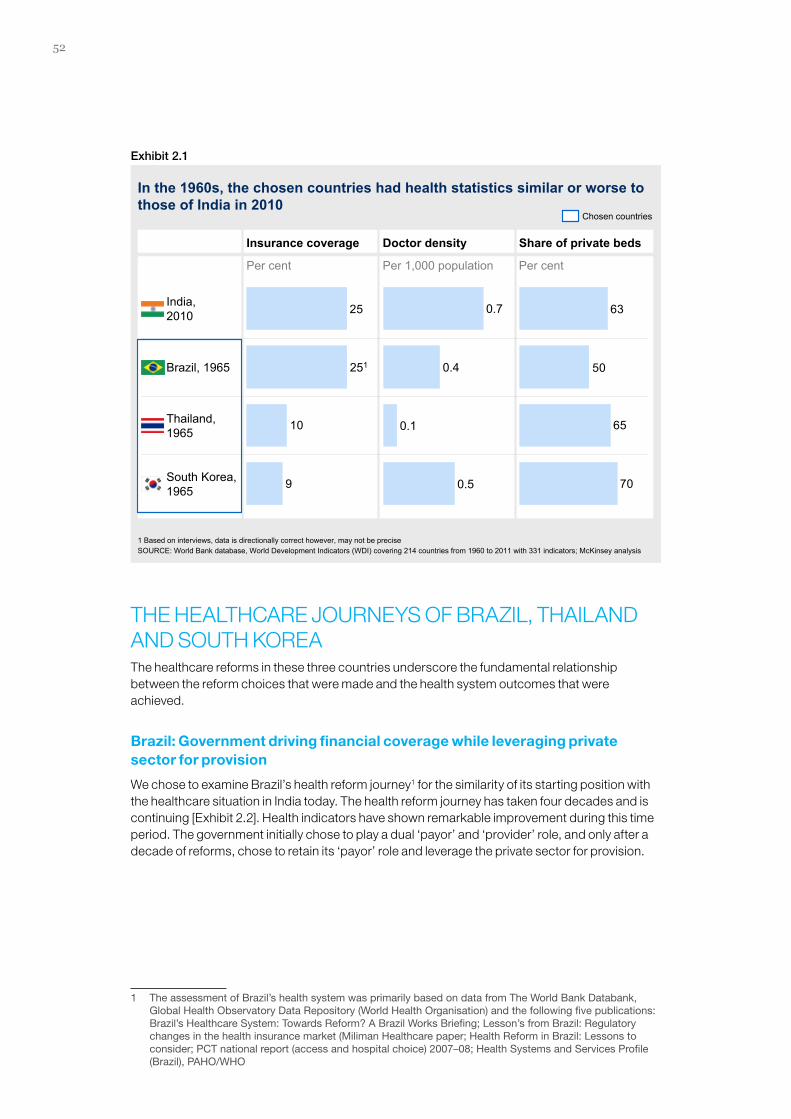
52
THE HEALTHCARE JOURNEYS OF BRAZIL, THAILAND AND SOUTH KOREAThe healthcare reforms in these three countries underscore the fundamental relationship between the reform choices that were made and the health system outcomes that were achieved.
Brazil: Government driving financial coverage while leveraging private sector for provision
We chose to examine Brazil’s health reform journey1 for the similarity of its starting position with the healthcare situation in India today. The health reform journey has taken four decades and is continuing [Exhibit 2.2]. Health indicators have shown remarkable improvement during this time period. The government initially chose to play a dual ‘payor’ and ‘provider’ role, and only after a decade of reforms, chose to retain its ‘payor’ role and leverage the private sector for provision.
1 The assessment of Brazil’s health system was primarily based on data from The World Bank Databank, Global Health Observatory Data Repository (World Health Organisation) and the following five publications: Brazil’s Healthcare System: Towards Reform? A Brazil Works Briefing; Lesson’s from Brazil: Regulatory changes in the health insurance market (Miliman Healthcare paper; Health Reform in Brazil: Lessons to consider; PCT national report (access and hospital choice) 2007–08; Health Systems and Services Profile (Brazil), PAHO/WHO
Exhibit 2.1
In the 1960s, the chosen countries had health statistics similar or worse to those of India in 2010
SOURCE: World Bank database, World Development Indicators (WDI) covering 214 countries from 1960 to 2011 with 331 indicators; McKinsey analysis
9
10
25
Thailand,1965
South Korea, 1965
Brazil, 1965 251
India,2010
0.4
0.1
0.7
0.5 70
65
50
63
Doctor density Share of private bedsInsurance coverage
Per cent Per 1,000 population Per cent
Chosen countries
1 Based on interviews, data is directionally correct however, may not be precise

53India HealthcareInspiring possibilities, challenging journey
In the 1960s, Brazil had a health system similar to that of India today. Health outcomes were poor, with an infant mortality rate of 117 per 1,000 live births and a life expectancy of 57 years. This was the result of low doctor density, at 0.4 per 1,000 people, and poor insurance coverage. Coverage was extended only to high-ranking public sector workers and employees of large corporations located in big cities. The rural and unemployed had limited coverage, leading to serious inequity in health access. Also, as in India today, the private sector played a major role in healthcare provision, accounting for almost 50 per cent of all hospitals in the country.
Early social reform in Brazil was driven by political impulse. The Brazilian health reform journey started along with the country’s wider struggle for democratisation in 1975, based on the vision of universal access to healthcare. Initiatives by the health ministry drove implementation of reform proposals that had been under discussion for years. Under the Unified Health System or SUS (SistemaÚnico de Saúde), defined by the new constitution, health was assumed to be the responsibility of the government, both as the primary provider and payor of healthcare. This was despite the fact that the private sector then accounted for nearly 70 per cent of all hospital beds. The government providers in essence, started competing with private sector providers.
In 1988, the SUS was decentralised through devolution of financing and decision making to the state and local authorities. Health provision was made the joint responsibility of the local and state authorities, but was coordinated at the national level. This decentralisation made the health system more attuned to the health needs of the local population and enabled greater public control over health policies. The private sector was assigned the role of a supplementary health network complementing government healthcare services.
The government modified its role around this time. It acknowledged the private sector as an integral part of and the lead player in health provision, and focused its efforts and resources on financial coverage. This coverage was provided through a series of steps: first to the rural and self-employed, then for emergency care to the whole population and, finally, for basic care coverage to all. As a result of this role allocation between the government and the private sector,
Exhibit 2.2
2003 1.8
1989 1.2
1977 0.8 20
100
100
2000s onwards:▪ Focus on reducing inequity and improving
quality of care▪ Physical access (beds and physicians) not a
challenge
2
Brazil created access through joint involvement of private and public sector WHO guideline
SOURCE: WHO, http://beforeitsnews.com/healthcare/2012/10/booming-health-insurance-industry-in-Brazil-2442468.html; Health Reform in Brazil: Lessons to Consider Paulo Eduardo M. Elias and Amelia Cohn
Phases in reform Physician density
Per 1,000 people
Bed density
Per 1,000 people
Coverage
Per cent
Private
3.5
NA
3.22.2 1.0
NA
1920s – 1970s▪ Low physician density▪ Coverage restricted to private sector workers,
while rural and unemployed population ignored
0
1980s – 1990s:▪ Improved financial access by increasing
coverage through the targeted SUS (Universal Health System)
▪ Federal system enforced with management and funding decentralised to state and local authorities
▪ Family health programme (PSF) for primary care
1

54
70 per cent of all beds are currently paid for publicly through the SUS. Coverage of the Family Health Programme for primary care grew remarkably from 9 per cent in 1998 to 61 per cent in 2006. The private sector continues to own 70 per cent of all hospital beds.
Brazil’s health reforms have led to a significant improvement in access. Insurance coverage has reached nearly 100 per cent. Doctor density had risen to above 1.7 per 1,000 by 2008 from less than 0.4 in the 1960s. Public expenditure as a share of GDP almost doubled, from 2.8 per cent in 1995 to 4.2 per cent in 2010. To address this rising expenditure, the financing model has been changed from retrospective reimbursement2 to per capita compensation for services.
Health outcomes in Brazil have improved dramatically during the reform journey of the last four decades. The infant mortality rate (IMR3) in 2010 was at 15 per 1,000 live births in 2010, compared to the world average of 38. The maternal mortality rate (MMR4) in 2010 was at 56 per 100,000 live births compared to the world average of 210 per 100,000 live births in 2010.
It is not as if the Brazilian healthcare system is without its share of challenges. Infrastructure for SUS patients in private hospitals needs to be revamped.The federal system of government with varying levels of performance of local governments has created disparities in health outcomes5. Nevertheless, the Brazilian health reform journey remains a noteworthy success and provides important lessons for India.
Thailand: Government driving the social insurance model
As in the case of Brazil, we chose to study Thailand’s health reform journey6 for the similarity of its starting position with the healthcare situation in India today. Over the last four decades, the government has created financial access through a successful social insurance model, leading to a low out-of-pocket spend and a significant reduction in catastrophic expenses [Exhibit 2.3].
At the outset of its health reform journey in the 1960s, Thailand had an IMR of 81 per 1,000 live births and a doctor density of only 0.1 per 1,000 people. Insurance covered about 10 per cent of the population. Overall spending on healthcare was less than 4 per cent of GDP.
While Thailand developed a health policy in 1932 after the country became a constitutional monarchy, it was only in 1977 that a new health policy mandated access to health as the entitlement of all Thai citizens. Around this time, the central government decentralised the management and funding of healthcare facilities to local governments and municipalities.
The government decided to play the ‘payor’ role and encourage the private sector to invest in healthcare facilities. In order to attract private investments in provision, the government provided tax incentives and introduced capitation payment. The public sector’s share in health services fell from 83 per cent in 1991 to 41 per cent in 2001. To increase the availability of doctors, the government launched measures such as compulsory government service as early as 1968. With
2 From government to private providers.3 Infant Mortality Rate (IMR) is the number of deaths of children less than one year of age per 1,000 live
births.4 Maternal Mortality Ratio (MMR) is the ratio of the number of maternal deaths per 100,000 live births from
any cause related to or aggravated by pregnancy or its management, excluding accidental or incidental causes.
5 Life expectancy ranged from 63 years in Alagoas to 71 years in Santa Catarina in 2003.6 The assessment of Thailand’s health system was primarily based on data from The World Bank Databank,
Global Health Observatory Data Repository (World Health Organisation) and the following five publications: ‘Thailand Health Financing Review 2010’ (Thai Working Group on Observatory of Health Systems, 2010); ‘Health Sector Regulation in Thailand: Recent progress and the future agenda’ (Elsevier); ‘Early Results from Thailand’s 30 Baht Health Reform: Something to smile about’; ‘Thailand: Universal health coverage through pluralistic approaches’ (International Labour Organisation); ‘Learnings from Thailand’s Health Reform’; ‘Catalysing Change: The system reform costs of universal health coverage’ (The Rockefeller Foundation).

55India HealthcareInspiring possibilities, challenging journey
these efforts, bed density doubled and physician density trebled by the 2000s as compared to the situation in the 1960s.
The government increased financial coverage from 9 per cent in the 1960s to 75 per cent in the 1990s through a series of reforms. Coverage was expanded in phases, first through the Civil Services Medical Benefits Scheme for government employees in the 1960s, then through the Low Income Card Scheme for poor families in the 1970s, and finally through the Social Security Scheme for the aged and disabled in the 1990s.
More notably, when universal health coverage was made the central political agenda in the late 1990s, the political leadership pushed through the successful ‘30 Baht Scheme’ for universal access to subsidised health care. This scheme took coverage up to 96 per cent in the 2000s. Impoverishment due to catastrophic health expenses reduced from 18 per cent before 2001 to 8 per cent in 2004. Out-of-pocket spend declined from 43 per cent of total health expenditure in the 1990s to 14 per cent in the 2000s.
Thailand’s health challenges now lie in the low quality of its public health system despite strong measures to fund and monitor the quality of the ‘30 Baht Scheme’. To lessen the government’s financial burden, policymakers are now looking to reduce benefit packages or increase co-payments.
Notwithstanding its current challenges, Thailand’s health reforms have been successful. Health outcomes are significantly better than world averages. The IMR in 2010 was at about 11 per 1,000 live births, compared to the world average of 38 per 1,000. The MMR in 2010 was at about 48 per 100,000 live births compared to the world average of 210 per 100,000 live births in the same year.
Exhibit 2.3
9
29
75
96
1960:▪ Poor access, both physical and financial
0
1960s – 70s:▪ Major focus on creating physical access
Increased public investment in health infrastructure, especially in rural areas
1
1980s – 90s:▪ Focus on creating financial access through
planned social insurance schemes1
▪ Boost to private providers through tax incentives and introduction of capitation payment
2
2000s:▪ Focus on universal health coverage, with
stronger regulatory system▪ New institutions established to regulate the
quality and financial elements of the scheme
3
Thailand improved financial access through an effective social insurance model
SOURCE: From Policy to Implementation: Historical Events During 2001–2004 of Universal Coverage in Thailand; Thailand: WHO country profile; Thailand: Universal Health Care Coverage Through Pluralistic Approaches
Phases in reform Physician density
Per 1,000 people
Bed density
Per 1,000 people
Coverage
Per cent
2009 0.3
2001 0.3
1975 0.1
1960 0.1
2.1
3.5
0.7
1.1
2.2
WHO guideline
1 Including the ‘30 Baht’ scheme

56
South Korea: Government the single payor, while encouraging private investments and regulation of provision
At the beginning of its health reform journey7, in the 1970s, South Korea’s health outcomes were already favourable in comparison to other nations and world averages. However, the system was characterised by low and inequitable access, and the absence of a regulatory framework. The government decided to focus on the ‘payor’ role, integrated its bargaining power by consolidating all payors into a single entity, encouraged and incentivised the private sector to invest in provision and drove down provision costs through a rigorous regulatory environment [Exhibit 2.4].
In the 1970s, doctor density was less than 0.5 per 1,000 and insurance coverage just 9 per cent. Out-of-pocket spend was high (87 per cent in 1977), leading to high inequity across income groups. The absence of a regulatory framework and a public fee schedule for healthcare services allowed providers in different locations to charge different levels of fees for the same treatment. Similar to today’s India, a weak regulatory framework coincided with a rapidly growing private sector.
A change in the political leadership led to a commitment to strengthening the social protection system that had lagged behind economic development. In 1977, The Health Insurance Law (1963) mandating universal health coverage was implemented. The legislature introduced the first social insurance programme (Employee Scheme), beginning with enterprises that had more
7 The assessment of South Korea’s health system was based on data from The World Bank Databank, Global Health Observatory Data Repository (World Health Organisation) and the following five publications: ‘Catalysing Change: The system reform costs of universal health coverage’ (The Rockefeller Foundation); ‘Korea’s National Health Insurance: Lessons from the past three decades’; ‘National Health Insurance System in Korea’ (National Health Insurance Corporation); ‘Health Care Reform in South Korea: Success or failure?’; ‘Republic of Korea: Health system review’, Health Systems in Transition, Vol. 11, No. 7, 2009).
Exhibit 2.4
9
94
99
99
1960s – 70s:▪ Limited focus on healthcare. ▪ Private sector grew to meet demand
0
1980s:▪ Focus on increasing insurance coverage
driven by payroll deductions.▪ Growth of private sector with investment support
from Government
1
2
2000s:▪ Focus on strengthening payments and extend
benefits package
3
South Korea created access in close engagement with the private sector
SOURCE: Catalysing change – The system reform costs of universal health coverage (Rockefeller Foundation), Korea’s national health insurance –lessons from the past three decades, Health care reforms in Korea
Phases in reform
2009 2.0
2003 1.6
1989 0.8
1977 0.5
3.5
10.3
7.0
3.0
1.7
Physician density
Per 1,000 people
Bed density
Per 1,000 people
Coverage
Per cent
WHO guidelines
1990s:▪ Focus has been on quality and efficiency,
and stronger control▪ Consolidation of 350+ payors to a single public
body with payments changes▪ Special government schemes and deeper
benefits package for the insured

57India HealthcareInspiring possibilities, challenging journey
than 500 employees, and subsequently extended coverage for smaller firms. The Employee Scheme was the starting point for the Social Health Insurance (SHI) scheme for civil servants and school employees introduced in 1981.The government encouraged adoption of its insurance programme through measures such as payroll deductions and the introduction of low premiums with limited benefits. As a result of these reforms, insurance coverage went up to 90 per cent by 1989.
In the 1990s, the government achieved 97 per cent coverage and solidified its position as payor. It consolidated over 350 payors, most of them private, into a single public body, the National Health Insurance Corporation. This is a government-run insurance programme that every citizen pays into. In its role as the single payor, the government has considerable market power to negotiate lower prices. The Ministry of Health and Welfare sets the health sector budget, including the reimbursement ceiling for the system. Out-of-pocket spending in South Korea reduced to 38 per cent in 2007.
The government allowed the private sector to assume the role of provider. Currently, the private sector accounts for nearly 90 per cent of hospitals and clinics in South Korea. The government enabled low-cost healthcare through a rigorous regulatory framework. The Health Insurance Review Agency, established in 2000, reviews fees and economics and evaluates the service performance of private providers. It specifies national health insurance benefits and the medical fee schedule. Driven by private investments, bed density has gone up to 5.6 per 1000 in 2000.
South Korea’s current problems in healthcare appear to be a high out-of-pocket spend and inefficiency. Despite 98 per cent coverage, out-of-pocket expenditure remains at a high 30 per cent. Driven by the low and regulated fees of general practitioners, more than 70 per cent of physicians are specialists. This bias, coupled with a high rate of physician consultations (i.e., 12 per year per capita, compared to 7 for OECD countries), indicates overuse and inefficiency within the health system.
Notwithstanding these challenges, South Korea’s health reforms have been successful and have led to health outcomes that are among the best in the world. The IMR in 2010 was at about 5 per 1,000 live births, compared to the world average of 38 per 1,000. The MMR in 2010 was at about 16 per 100,000 live births compared to the world average of 210 per 100,000 live births.
LESSONS FOR INDIA’S HEALTH REFORMS JOURNEYThe experiences of Brazil, Thailand and South Korea in reforming their healthcare systems, and the experiences of other nations, provide useful lessons for India. These experiences substantiate the emphasis laid out in the draft Twelfth Five-Year Plan of the Planning Commission on removing barriers to health access [Exhibit 2.5].
� Transforming the health system is a long-term journey, championed and driven by political leadership over a sustained period. This has three implications for India. First, achieving near 100 per cent access is likely to take a decade or more. Hence, the vision and game plan need to be long-term in scope. Second, successive Five-Year Plans need to maintain a consistent vision and roadmap for the country’s health system. Third, the government will need to lead the reform journey. It is only when political parties have adopted health reforms as the primary agenda that the journey moved forward. The Thai government’s introduction of the ’30 Baht Scheme’ and the South Korean government’s implementation of the National Health Insurance Law are cases in point.
� Creating universal access has to be a primary focus, with a secondary focus on efficiency or quality. Universal access to healthcare needs to be the foremost target for India’s health system, and the government’s stated goal. In other situations, by the time access was created, all countries began to face problems of inefficiency (e.g., South Korea)

58
or quality (e.g., Brazil, Thailand). One could argue that, given its late start, India does not have the luxury of a phased development. While aiming for universal access, policymakers would need to choose either efficiency or quality as the secondary target.
� In an economic environment of low per capita income, it is not possible to create access with a high out-of-pocket spend. Government will have to increase spending to provide greater financial coverage and reduce the out-of-pocket spend. Thailand and South Korea are cases in point. Out-of-pocket spend in Thailand reduced from 43 per cent in the 1990s to 14 per cent in the 2000s. The share of government spending in total healthcare expenditure rose from 46 per cent to 75 per cent during this period. Similarly, in South Korea, out-of-pocket spend fell from 55 per cent in the 1990s to 30 per cent in the 2000s. Government’s share in total healthcare spending increased from 36 per cent to 60 per cent during this period.
� Government should ideally choose between the payor or provider role. The government needs to take a stance on its role in the country’s health system—either the primary provider or the primary payor. Most governments made an explicit choice while envisioning their country’s future health system and developing their healthcare policy framework. South Korea provides an example of a situation where the government is the primary payor while the private sector invests in provision. The Brazilian government attempted to play a dual role, could not make progress, and ultimately decided to focus on the payor role.
� To collaborate with the private sector, government would need an inclusive vision, dialogue and an effective regulatory framework. For the private sector to play an impactful role in driving access, the government will need to engage in a purposeful and constructive dialogue about the vision for the country’s health system and the private sector’s role in it. In addition, a regulatory framework will be needed to ensure equity, quality and cost effectiveness. This becomes even more important for India, given the private sector’s central role in creating physical access and investing in and managing healthcare facilities.
Exhibit 2.5
The three countries have managed to achieve good health outcomes by 2010
SOURCE: World Bank database, World Development Indicators (WDI) covering 214 countries from 1960 to 2011 with 331 indicators; McKinsey analysis
Infant mortality rate, 1965–2010
Per 1,000 population
Life expectancy, 1965–2010
India average, 2010
Global average, 20102010
1965
81
59
11
117
7
15Brazil
Thailand
4938
SouthKorea
73
74
57
57
57
81
65 69

59India HealthcareInspiring possibilities, challenging journey
� A decentralised federal system functions effectively when supported by a common policy framework. A federal system is critical in a country like India with its complex and diverse health needs. Decentralisation of planning, management and funding would allow the health system to better cater to the local population’s health requirements. However, for such a system to function effectively, two aspects are critical. First, the government needs to formulate a unified policy framework outlining a set of strategic choices that federal governments will adhere to. An example is the government’s relative emphasis between the primary payor and primary provider roles. While some flexibility may be desired, it is difficult to conceive a well-functioning health system if the states make their own choice of payor and provider roles. Second, in order to rationalise planning and management, a clear set of guidelines and templates will be required.
* * *
In the next chapter, we first develop a deeper understanding of India’s healthcare situation and its goal of ‘universal health coverage’ by 2022, and then explore pathways and imperatives to achieve this goal.

60

61India HealthcareInspiring possibilities, challenging journey
The decade till 2022: A crucial phase in India’s health reform journeyIt is unrealistic to assume that India’s health reforms journey can be achieved within a decade. Given the weak starting position and the complex realities of healthcare in India, the journey towards equitable, efficient, quality and universal access is likely to continue over a much longer timeframe.
Nevertheless, the next decade will need to count for much and enable the country to traverse a significant portion of its longer term journey. This time period needs to yield for India what other countries have achieved over a much longer timeframe. Therein lies the importance of envisioning India’s health system in 2022.
In this chapter, we first recognise the enormous challenge of inequity in the health access situation across the country. No vision for India’s health system can be relevant and complete unless it explicitly acknowledges and includes this inequity. Next, we outline a possible vision for India’s health system in 2022. This possible vision draws on the aspirations outlined in the High Level Expert Group recommendations and on elements of the government’s draft Twelfth Five-Year Plan. Finally, we emphasise the need to accelerate the momentum and close the gaps that a ‘status quo’ approach would undoubtedly lead to.
SIGNIFICANT INEQUITY IN HEALTHCARE ACCESSIndia’s inequity in healthcare access is well known. The differences in health outcomes across states are strong indicators of this inequity. While some health indicators in states such as Kerala and Tamil Nadu are at par with those of developed economies, those in states such as Uttar Pradesh remain significantly below world averages. What is perhaps less understood is the magnitude of this inequity, its manifestation across the rural-urban divide and income segments, and its alarming upward trajectory.
In order to better understand this inequity, we analysed six clusters of the population along the dimensions of urbanisation and income: urban poor, urban middle-class, urban rich, rural poor, rural middle-class and rural rich [Exhibit 3.1]. While we recognise the importance of other factors such as gender and education, we excluded these from the analysis, given the paucity and unreliability of available data.
We studied these six clusters to understand their growth rates over time, their healthcare situations, such as disease prevalence and incidence, and healthcare choices such as spend profiles and site of treatment. The appendix captures the description of this clustering methodology and analyses.

62
Exhibit 3.1
Urbanisation and income influence access and outcomes
1
Insurance coverage1
Per cent
Physical access2
Per cent
Health outcomes3
Per 1,000 population
9
3
+200%
Rural
Urban 21
18
+17%
3
6
-41%
12
4
Top 20%
+632%
Bottom20% 2
Next 20%
24
16
+18%
21
2
4
-76%
9
Inco
me
Urb
anis
atio
n
1 Financial insurance – Any form of state/central/private insurance available2 Sufficiency of physical infrastructure – Answer to all these questions is ‘no’: health personnel often absent, poor quality of care, drug not available,
inadequate infrastructure3 Under 5 Mortality Rate = (Total deaths of children under 5 years in 2005-2007)/(cluster size) ×1,000SOURCE: District Level Health Survey (DLHS) -2 and 3; McKinsey analysis
Six Indias
To analyse healthcare needs by income and urbanisation rates, we examined several databases that capture healthcare data such as the District Level Health Survey (DLHS), the National Family Health Survey (NFHS), the report published by McKinsey & Company on the Indian economy, ‘The Bird of Gold – The Rise of India’s Consumer Market’ and, most importantly, the data published by the National Sample Survey Organization (NSSO) from its ‘consumer expenditure’ and ‘morbidity and health’ surveys.
Six clusters emerged on the basis of expenditure data that was used as a surrogate for income and urbanization status:
2.0More than 2.3Urban rich6
15.40.6 to 2.3Urban middle-class5
6.2Less than 0.6Urban poor4
2.5More than 1.5Rural rich3
24.10.6 to 1.5Rural middle-class2
49.8Less than 0.6Rural poor1
Size of cluster, 2005Per cent of population
Annual household expenditure range, 2005INR lakhCluster

63India HealthcareInspiring possibilities, challenging journey
The analysis brings to light six realities of healthcare access, which are remarkably different from each other. The differences in these realities need to be considered as the government envisions its long-term health reforms journey. While these differences are intuitively recognised, their magnitude is worth noting.
� These population clusters are undergoing steady change that will add up materially over the coming decade [Exhibit 3.2]. The proportion of the rural poor in the population declined from 54 per cent in 2001 to 45 per cent in 2010. In turn, the urban poor grew from 5 per cent to 7 per cent during this timeframe. The urban rich, the fastest growing segment, doubled to 3 per cent of the total population over the past decade.
� Rural India accounts for 70 per cent of communicable disease cases, but also 50 per cent to 70 per cent of non-communicable disease (NCD)1 cases [Exhibit 3.3]. Non-communicable diseases are often considered problems of the urban rich. The reality is vastly different. Rural India accounts for nearly half of the prevalence of heart diseases and diabetes, and nearly 70 per cent of cancer cases. As a result, rural India suffers from a dual burden of disease.
� The urban rich access health services at a rate double that of the rural poor and 50 per cent more than the national average [Exhibit 3.4]. Hospitalisation frequency2 of the urban rich, rural poor and national average are 4.0, 2.2 and 2.8, respectively. Consultation frequency3 is estimated at 303, 162 and 188, respectively.
� Major differences exist in the costs of hospitalisation between private and public facilities to the patient [Exhibit 3.5, 3.6]. Average spend upon hospitalisation in private
1 Based on NSSO 2008, which captures self-reported ailments in the last 15 days.2 Hospitalisation frequency is the number of in-patient admissions per 100 population per year.3 Consultation frequency is the number of out-patient consultations per 100 population per year.
Exhibit 3.2
Population cluster sizes are changing steadily
SOURCE: NSSO Consumer Expenditure survey – 2005–06 and 2009–10; UN, Department of Economic and social affairs, World population prospects, 2010 revisions; McKinsey analysis
1 Population projection from UN, World population prospects, 2010 revisions
13.7 17.821.9
23.624.9
25.2
54.244.7
36.1
2010
1.2 billion
7.32.4
2001
1.1 billion
5.5
1.5
2.6
100%
Urban richUrban middle-classUrban poorRural richRural middle-class
Rural poor
2022(P)
1.41 billion
2.9 5.2
2.69.0
Share of population of 6 clusters
Per cent
CAGR, 2010–22 (P)Per cent
0.8
6.5
3.1
3.1
1.5
1.4
-0.5
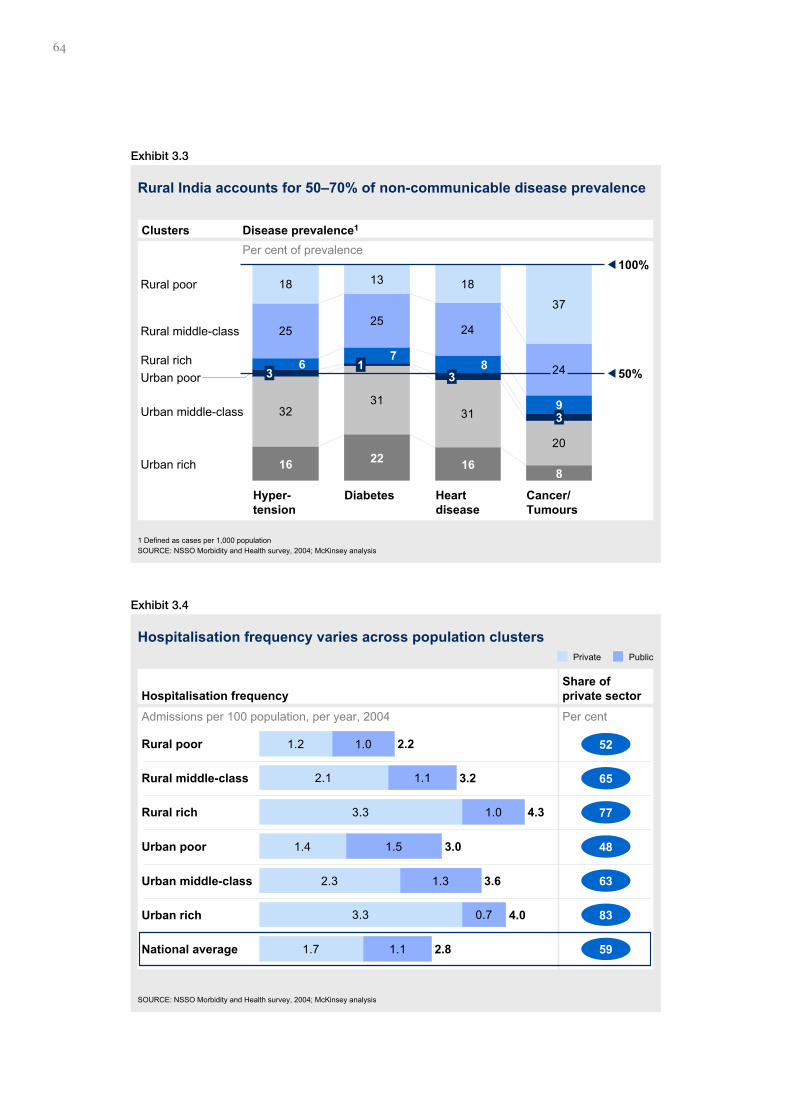
64
Exhibit 3.4
Hospitalisation frequency varies across population clusters
SOURCE: NSSO Morbidity and Health survey, 2004; McKinsey analysis
Hospitalisation frequencyAdmissions per 100 population, per year, 2004
Share ofprivate sectorPer cent
1.2
2.1
3.3
1.4
2.3
3.3
1.7
1.0
1.1
1.0
1.5
1.3
0.7
1.1National average
4.3
Urban rich
3.0
Urban middle-class 3.6
Urban poor
Rural rich
Rural middle-class
Rural poor 2.2
3.2
4.0
2.8
52
83
77
63
65
48
59
Private Public
Exhibit 3.3
Rural India accounts for 50–70% of non-communicable disease prevalence
SOURCE: NSSO Morbidity and Health survey, 2004; McKinsey analysis
3231
31
20
2525
24
24
18 13 18
37
650%
100%Rural poor
Rural middle-class
Hyper-tension
16
38
Diabetes
22 16
Heartdisease
93
8
Cancer/ Tumours
3
Urban rich
Urban middle-class
Urban poorRural rich 1
7
Clusters Disease prevalence1
Per cent of prevalence
1 Defined as cases per 1,000 population

65India HealthcareInspiring possibilities, challenging journey
Exhibit 3.5
Public hospitalisation is ~60% cheaper than private for the patient
SOURCE: NSSO Morbidity and Health survey, 2004, McKinsey Analysis
Public bill size as per centof private bill size
Per cent
Public in-patient average bill size
INR ’000s, 2004
Private in-patient average bill size
INR ’000s, 2004
9.4
7.0
9.0
6.0
Rural rich 13.0
Ruralmiddle-class
Rural poor
Nationalaverage
Urban rich 23.0
Urbanmiddle-class 12.0
Urban poor
3.9
8.0
4.0
2.0
9.0
5.0
3.0 45
36
39
35
71
59
40
Exhibit 3.6
Public out-patient consultations are ~30% cheaper than private for the patient
SOURCE: NSSO Morbidity and Health survey, 2004; McKinsey analysis
Public bill size as per centof private bill size
Per cent
Public out-patient average bill size
INR, 2004
Private out-patient average bill size
INR, 2004
482
699
546
354
629
485
431
Nationalaverage
Urban poor
Rural rich
Ruralmiddle-class
Rural poor
Urban rich
Urbanmiddle-class
424
333
384
378
245
560
274 64
55
69
69
89
87
69

66
facilities was INR 9,400 in 2004, vis-à-vis an average spend of INR 3,900 in public hospitals. This difference is the least for the rural rich segment, for whom the spend on public admission is 70 per cent of the spend on private admission.
� Due to the two factors above, spend on hospitalisation for the urban rich is significantly higher than that of other demographic groups. While this is to be expected, the magnitude of inequity is noteworthy. Per capita spending on hospitalisation for the urban rich is four times the national average and eight times that of the rural poor.
� The urban and rural poor access private facilities the least, though the difference with the rich segment is not significant [Exhibit 3.4]. Private providers account for a major share of total treatments. Even as early as 2004, private providers accounted for 59 per cent of all hospitalisations and 78 per cent of out-patient consultations. In comparison, for the urban and rural poor, private providers accounted for 50 per cent of hospitalisations and 75 per cent of consultations.
ENVISIONING INDIA’S HEALTH SYSTEM IN 2022In the Planning Commission’s draft of Twelfth Five-Year Plan, the vision laid out for India’s healthcare sector is to “establish a system of universal health coverage where each individual would have assured access to a defined essential range of medicines and treatment at an affordable price, which should be entirely free for a large percentage of the population”.
This is undoubtedly a lofty aspiration, and in the right direction. Affordable healthcare underpins this vision, and is aligned to the learning and experiences of nations that have moved a long distance in their health reforms journey. Implicit in this vision is the government’s choice of a primary focus on universal access, supplemented with a secondary focus on efficiency.
What would this vision mean for India’s health system? How will the goal of universal health coverage translate into specific goals for specific elements of the country’s health system? What would be the implications on funding, infrastructure and the medical workforce? Crucially, what are the explicit choices that the government will need to make at the outset? What is the nature and extent of gaps vis-à-vis the 2022 vision that a ‘status quo’ approach would bring about? We discuss these issues in this section.
As mentioned earlier in this chapter, India will need to make the next decade count in order to progress materially towards its goal of universal healthcare access. Substantial progress will need to be made in enhancing financial coverage, filling up resource gaps and focusing on patient interests. Notwithstanding this need for pace and momentum, it will be important to avoid the trap of aiming for a goal that targets the maximum along all dimensions. Hence, while describing the 2022 vision, we have attempted to articulate 2022 goals that are aspirational and stretched, yet attainable.
� Much improved financial access. This would be achieved primarily through more extensive insurance cover, which could move up to 75 per cent4 from the current 25 per cent. Those who cannot pay for healthcare would receive it free through public provision (e.g., at government hospitals) or government payments (e.g., the Rashtriya Swasthya Bima Yojana, a social insurance scheme). Despite a rise in income levels across population clusters, out-of-pocket spending levels could go down from the 61 per cent of total healthcare spending in 2010 to 23 per cent [Exhibit 3.7]. At this level of financial access, India would be at a level that is comparable to a few of the leading developing nations that have made major strides in their health reforms over the past decades (i.e., Thailand with out-of-pocket spend of 14 per cent and coverage ~100 per cent in 2010).
4 Assuming 100 per cent coverage for poor population and up to 60 per cent coverage for the middle class, to match draft Twelfth Five-Year Plan vision.

67India HealthcareInspiring possibilities, challenging journey
� Healthcare resource gaps filled. Infrastructure would have scaled up with increased demand, reaching an overall bed density of around 2.1 per 1,000 people, including 1.2 beds per 1,000 people in rural areas and 3.8 beds per 1,000 people in urban areas [Exhibit 3.8]. This demand driven calculation assumes hospitalisation density and Average Length of Stay (ALOS) continue to improve within and across clusters. At this level of healthcare infrastructure, India will be at the level of leading developing nations (Sweden and Turkey have bed density of 2.8 and 2.5, respectively in 2010).
� Workforce shortages overcome. For this to happen, up to 90 per cent of registered practitioners will need to practise. Moreover, AYUSH and Rural Medical Practitioners will need to be incorporated into mainstream healthcare at a national level, thereby also bridging the urban-rural inequity in healthcare resourcing. By 2022, the country could aim for a doctor and nurse density of 0.7 and 1.7 per 1,000 respectively.
� Much greater spending in healthcare, and much lower out-of-pocket spend. In order to achieve the desired financial access and build the requisite level of infrastructure, total spending will need to be at 5.5 per cent of the country’s GDP by 2022, up from the current ~4 per cent5 [Exhibit 3.7]. India’s out-of-pocket spend will need to come down from the current 61 per cent of total healthcare spend to 23 per cent. The model used for Total Health Expenditure calculations is described in Chapter 4.
� A much higher level of healthcare demand catered to. India’s health system will need to cater to a much higher level of demand for healthcare services. Hospitalisations will rise from the current 4.8 per 100 people to 6.5 per 100 people [Exhibit 3.9]. For poor segments
5 Assuming a nominal GDP growth rate of 14 per cent based on Global insights, WIS. Growth rate for total health expenditure required to reach destination 2022 will be 16 per cent. Total healthcare spend will be INR 1,900,000 crore.
Exhibit 3.7
Likely total healthcare expenditure and out-of-pocket share in 2022
SOURCE: World Bank database, World Development Indicators (WDI) covering 214 countries from 1960 to 2011 with 331 indicators; McKinsey analysis
Total Healthcare Expenditure (THE)
Per cent of GDP
Share of out-of-pocket expenditure
Per cent of THE
5.5
3.74.0
2022 (P)status quo
2010 2022 (P)vision
23
54
61
2022 (P)status quo
2010 2022 (P)vision

68
of the population, this will go up from 2.6 per cent to an impressive 6.1 per cent. For the rich segments, this will go up from the current 7.5 to 8.5 per cent6.
� Patient interests at the core of the agenda. Quality of care needs to be in focus, enabled by an effective regulatory system. This regulatory framework will need to include legislation on the standardisation of treatment practices, clinical establishments and malpractice mitigation.
� Better integration of health facilities. Referrals from one link in the chain (e.g., primary health clinic or private physician) to another (e.g., tertiary hospital) needs to be orchestrated and patient treatments tracked. Formulating an approach for referrals will go a long way in strengthening India’s leaky patient funnel.
� Consequently, a substantial and across-the-board improvement in health outcomes. Major improvements will have been achieved in maternal mortality, infant mortality and under-five mortality rates, malnutrition indicators and in the prevalence of infectious and NCDs7. In effect, the Millennium Development Goals (MDGs) would have been met. In addition to meeting the MDG goals, there will need to be emphasis on areas that have previously been in less focus, such as NCDs and services such as diagnostics, trauma and emergency care. The diagnosis of chronic diseases will be more in line with that of peer countries and even some developed countries.
CURRENT MOMENTUM INSUFFICIENTThe current trajectory of development in the healthcare sector will not be sufficient to achieve the 2022 vision. A ‘status quo’ approach will be rendered ineffective due to epidemiological pressures, burgeoning healthcare demand, existing and growing inequities in access and delivery and unregulated growth of the sector.
� Gap in healthcare spending vis-à-vis the 2022 vision. If the current trajectory of spending growth were to continue, total health expenditure would drop from the current 4.0 per cent of GDP to 3.65 per cent by 2022. This is a serious climb down from the 2022 target of 5.5 per cent of GDP mentioned in the previous section. Importantly, out-of-pocket spend will continue to be around 54 per cent [Exhibit 3.8].
� Gap in healthcare infrastructure. At current growth rates, supply will not keep pace with demand. India will end up with a total bed density of around 1.84 per 1,000 people against the global average of 2.9 (2005), and the World Health Organisation guideline of 3.5 [Exhibit 3.9]. Public sector beds have been increasing at a compound annual growth rate (CAGR) of 3–4 per cent and private sector beds at a CAGR of around 7–10 per cent. However, this private sector growth cannot be sustained on a high level of out-of-pocket spend.
� Gap in healthcare workforce. As per the draft of Twelfth Five-Year Plan, physician and nurse density is expected to reach around 0.7 and 1.7 per 1,000, respectively by 2022. Of these, if the current utilisation numbers were to remain, the active workforce would only be 0.5 and 0.8 per 1,000, respectively.
It is evident that the government will need to play the lead role in accelerating from the ‘status quo’ and providing the much needed momentum to India’s health reforms journey. First, the
6 Access for the lower income groups increases towards the level of the middle-income groups, enabled by publicly funded services. For the higher income groups, access increases with awareness of NCDs, which require higher frequency of visits.
7 Goals for outcomes in 2022: IMR (14), MMR (47) and Anaemia (14); estimated from goals for 2017 stated in the (draft) Twelfth Five-Year Plan of the Planning Commission of India.

69India HealthcareInspiring possibilities, challenging journey
Exhibit 3.8
Bed density expected to increase to 2.1 per 1,000 population
SOURCE: Central Bureau of Health Intelligence, Health infrastructure, 2005 and 2010; World Bank database, World Development Indicators (WDI); World Health Organisation, Global Health Expenditure Database; ASSOCHAM; McKinsey analysis
Total beds
Number in lakhs
Bed density
Per 1,000 population
2010 (E)
UrbanRural
2022 (P)status quo
2022 (P)vision
3.83.4
1.20.3
3.9
0.8
2.11.3 1.8
1318 19
2
711
2022 (P)vision
30
2022 (P)status quo
25
2010 (E)
15
ESTIMATES
Exhibit 3.9
Treatment rates will likely increase in 2022
SOURCE: NSSO Morbidity and Health survey 2004; McKinsey analysis
Urban rich 8.0
Urban middle-class 4.9
Urban poor 3.3
Rural rich 7.0
Rural middle-class 4.3
Rural poor 2.5
2010 (E)2022 (P)status quo
2022 (P)vision
National averages 4.8 5.1 6.5
9.0
6.6
4.1
8.0
5.7
3.1
9.0
7.0
6.5
8.0
7.0
6.0
In-patient consultation rate
Admission per 100 population per year

70
government will need to adopt a longer term vision for health reforms that spans multiple Plan periods. Second, the government will need to make an explicit choice between playing the ‘primary payor’ and ‘primary provider’ roles. This choice will have serious implications for the government’s resource allocation, the role played by the private sector, and the nature of the healthcare regulatory framework. Third, the government will need to spur greater spending in healthcare through a larger budgetary outlay and by incentivising private sector investments in healthcare. Fourth, the government will need to either directly drive or play the lead orchestrator role in implementing different elements of India’s health system. In Chapter 4, we discuss in detail these and other government imperatives.
* * *

71India HealthcareInspiring possibilities, challenging journey

72

73India HealthcareInspiring possibilities, challenging journey
Roles and imperatives for the GovernmentIn the previous chapter we outlined a possible vision for India’s health systems by 2022. In addition, we emphasised the need for accelerated momentum and the gaps that a ‘status quo’ approach might lead to. In this chapter, we highlight the lead role that the government will need to play to drive India’s healthcare transformation journey. In addition, we emphasise upon an important choice that the government will need to make with regards to its primary role. Finally, we outline a few indicative areas that merit joint action by the government and the private sector.
GOVERNMENT’S ‘STEWARDSHIP’ ROLEHealth reforms journeys of peer nations underscore the stewardship of the government and the political leadership of the country. This stewardship is underpinned by eight imperatives:
� Creating the vision for the country’s health system. This vision will need to be long-term, sustainable and rooted in the core objective of the achievement of ‘universal health coverage’. The government has taken an important step by stating its longer term goal of universal health coverage. Going forward, it will be important to detail this vision, describe the health system that the country should aspire for (i.e., beyond spelling out the targeted health outcomes and the quantum of funding and resourcing needed), and lay out a high level blueprint of this long term journey. India’s Five-Year Plans are a suitable vehicle for developing the country’s healthcare vision. However, the envisioning and roadmap development at the outset is better done in the context of a longer timeframe of 10 to 15 years. Hence, on the topic of healthcare vision, the government will do well to envision and plan across two to three plan cycles. Needless to say, this approach does not preclude the in-depth planning for the five-year plan period.
� Making a choice, at the outset, of its secondary emphasis beyond ‘universal access’, between efficiency and quality. Experiences of peer nations indicate that governments have chosen between efficiency and quality at some point in thier healthcare journey, to complement its core objective of universal healthcare coverage. This choice informs government policy, regulatory framework and the usage of government funds. Executed well, this choice between the efficiency and quality will shape the nature of universal health coverage. The draft of Twenfth Five-Year Plan spells out affordability as an important consideration. One could construe this as an implicit choice of efficiency and costs. If true, this choice probably reflects the country’s realities of low average incomes and high OOP spends.
� Orchestrating an envisioning process such that it is inclusive. Healthcare is an emotive topic, and one that involves a large and diverse set of stakeholders. Moreover, the integrity of the health system is important for it to succeed in achieving the country’s goals of universal healthcare coverage. This integrity can be achieved only through complementary goals and consistent and collaborative behaviour across the stakeholder groups. Hence, to make the envisioning process inclusive, the government will need to anchor the process in constructive and transparent dialogue with all stakeholders.
� Ensuring that funding for healthcare is secured and appropriately deployed. The government will need to assume responsibility through a combination of its own budgetary outlays, private investments, funding from multilateral institutions, and reasonable levels of out-of-pocket spending. The total spending on healthcare needs to move up from the current

74
4 per cent of GDP to 5.5 per cent of GDP by 2022. Within this, government spending needs to move up to 3.7 per cent of GDP [Exhibit 4.1].
To bring about this significant change, the government can consider multiple initiatives, of which we outline a few. First, build on the aspirations in the draft of Twelfth Five-Year Plan of increasing government spending to 1.87 per cent of GDP, and achieve a spending of 3.7 per cent by 2022. Fund this increase through general taxation and specific taxes1. Second, modify the incentive design for state funding, allowing states with high fiscal deficits to benefit from central funding based on conditional requirements2. Third, earmark specific budgetary allocation for important line items of expenditure such as infrastructure, maintenance, workforce and NCD programmes. Fourth, ensure budgetary allocation for areas that will assume higher criticality going forward, such as the healthcare needs of the urban poor3. To ensure that funding is indeed deployed to important areas, the central government may need to lay down ‘ring fenced’ budgets for the state governments, instead of the current approach of a ‘common pool’.
1 For example, the draft of the Twelfth Five-Year Plan mentions the possibility of sin tax.2 As this spend increase pans out, states are likely to be required to continue the 1:2 spending ratio between
the centre and states, as the Twelfth Five-Year Plan states. It is important that central funding schemes consider the health needs and fiscal situation of the states as the 1:2 ratio is implemented. State-level fiscal deficits should not become barriers to investments in health. Instead, for such states (with a deficit beyond a percentage to be stipulated), Central funding could continue with other conditionalities (e.g. # of public beds meeting IPHS norms, % nurses in active practice, NHM roll-out, RSBY roll-out).
3 To achieve the desired outcomes, budget allocations need to be made against each line item when plan-ning, which has not been done historically. Equally important, allocations should be clearly earmarked for specific high-priority areas such as insurance for the urban poor, and maintenance and repair of facilities.
Exhibit 4.1
India’s total healthcare spend and share of public spend in 2022
SOURCE: World Health Organisation, Global Health Expenditure Database; McKinsey analysis
Total Healthcare Expenditure (THE)
Per cent of GDP
Share of public spend
Per cent of THE
5.5
4.0
2022 (P)destination
2010
67
29
2010 2022 (P)destination
1.0 3.7
x Percentage of GDP

75India HealthcareInspiring possibilities, challenging journey
� Making a responsible and explicit choice between playing a ‘primary payor’ role and a ‘primary provider’ role. Rarely have governments been able to play the dual roles of ‘primary payor’ and ‘primary provider’, and do justice to the requirements of resourcing and leadership particularly when a thriving private sector already exists. As we highlighted in chapter 2, most governments chose the role of the primary payor, while a few chose the role of the primary provider. In the case of Brazil, the government undertook a dual role initially, and then withdrew from the ‘primary provider’ role within the first decade of its health reforms journey. The government will do well to make this choice at the outset. This choice will have important implications on how the government deploys its resources and leadership bandwidth, and where it encourages the private sector to invest. It will also have an impact on the nature of the country’s regulatory framework. We expand on these implications in the next section.
� Better utilising and integrating the existing workforce to address shortfalls. Adding to the existing workforce is an important priority. Setting up six medical institutes modelled
Total health expenditure model
To estimate Total Healthcare Expenditure (THE) for the country in 2022, we analysedoperating expenses (in-patient and out-patient curative care, preventive and other miscellaneous expenses such as administrative cost, spend on R&D) and capital expenditure on new facilities. Distribution for expenses in 2004–05 was based on data from National Sample Survey Organisation (60th round, health and morbidity survey, 2004) and National Health Accounts (2004–05). Since spend on curative care has accounted for the largest share, projecting it was the primary focus of this modeling exercise. The appendix provides key assumptions for projection of other expenses.
Analysis of curative spendTotal in-patient and out-patient spend was analysed by cluster. For each cluster, the total curative spend was modeled as a product of cluster population, hospitalisationand consultation frequencies and average “bill size” per hospitalisation or consultation. These variables were mapped across these six clusters.
Estimating and verifying THE for 2010Cluster analysis on NSSO data provided these variables for 2004–05 and a fact-based starting point for building the model up.
Cluster population in 2010 was estimated as part of the cluster analysis. Average bill sizes were increased by inflation for health services, computed on from Global Insights data. Increase in treatment rates across clusters, due to improvements in in access (both physical and financial) and awareness, were finalised through expert interviews. After modeling the non-curative spends, the total health expenditure matched the actual estimate from 2010 from WHO, within 5% accuracy.
Estimating THE for 2022 The same process was repeated for estimation of status quo and for envisioned 2022. Changes in status quo were guided by changes in 2004–05 to 2010. The envisioned state of 2022 incorporates equity in care (both quality and access as reflected in bill size and treatment frequency). Healthcare access for poor is assumed to improve to the levels of the middle-class.

76
after the AIIMS and upgrading thirteen regional medical colleges will go a long way towards this goal. However, the new institutes will have an appreciable impact on the workforce only and at least after a decade of their setting up. Hence, improving the utilisation of the existing workforce becomes an important prerogative for the government. To achieve this goal, the government can undertake several initiatives, of which we outline a few. First, align nursing qualifications4 with the medical specialty they support and help strengthen career trajectories. To tackle this issue, the government could consider setting up a taskforce comprising representatives from the provider community, the nursing profession and patients, and even consider learning from successful approaches adopted elsewhere such as by the NHS in the UK. Second, attempt to integrate AYUSH practitioners into the formal workforce to provide curative care. Evaluate existing initiatives in this regard, such as initiatives undertaken in Maharashtra5. Third, address physician shortfall in rural areas by creating training and accreditation opportunities for the 3 lakh strong group of Rural Medical Practitioners6. Fourth, leverage existing platform of 8 lakh strong ASHA7 community health workers who can provide preventive and primary care at the community level through training and accreditation.
� Architecting the regulatory framework for the healthcare sector. This regulatory framework needs to be underpinned by the considerations of patient centricity, system performance, and the transparency of cost and outcomes data. Moreover, it should be in line with the primary roles to be played by the government and private sector. The main aspects that will need to be included in the regulatory framework will be the performance expectations from the healthcare delivery system, government support to promote private investments in healthcare, and the important aspects of reimbursement and copayment that will help extend financial coverage while encouraging system efficiencies and reducing the OOP spend. Developing a holistic and integrated regulatory framework may require the setting up of task forces with appropriate capabilities within the appropriate government departments (e.g., taskforce within the NHM for policy setting on the topic of urban health).
� Orchestrating and facilitating, at a system level, the implementation of developmental initiatives. This role needs to be an important emphasis for the government during at least the initial phase of the health reforms journey. The responsibility for the integrated roadmap for the health reforms journey has to be owned by the government, and hence the importance of its role as facilitator and orchestrator. Beyond this, the government will need to play two other roles in driving implementation. The first is that of harnessing information technology. The proposal to establish a Health Management Information System in the Eleventh Five-Year Plan was a critical step in playing this role. Building on this, the Twelfth Five-year Plan approaches information technology in a more holistic way, incorporating this in registration, health records, electronic patient records, healthcare payments and telemedicine. The second is to build technical and managerial capability that will help drive large scale programs owned by the government, such as the National Health Mission, RSBY etc.6
4 This would also begin to address current issues of social stigma, low motivation and low salaries.5 For example, the Maharashtra Medical Practitioners Act 1961 has been amended to allow AYUSH doctors
to practice selective allopathic medicine after a one-year course in pharmacology. As the government plans to roll out the plan, it could modify and improve bridge training programme based on its experiences in these states.
6 Recent research in Chhattisgarh suggests that clinicians with three years of training have the competence to deliver primary health care. The Central Health Ministry proposed to expand this clinician cadre nationally through the Bachelors of Rural Health Care (BRHC) course. Establishing a systematic approach to engage this cadre would resolve the issue of inequitable access to practitioners across rural and urban India.
7 For example a new category of mid-level health-workers, Community Health Officers, has been suggested for primary health care in the draft Twelfth Five-Year Plan.

77India HealthcareInspiring possibilities, challenging journey
GOVERNMENT’S CHOICE OF ITS PRIMARY ROLEAs highlighted in the previous section, the government should consider an explicit choice between playing a ‘primary payor’ role and a ‘primary provide role. The two roles and their differences need to be defined, and their implications understood.
Choosing the role of the ‘primary provider’Making this choice implies that the government will focus its efforts primarily on the setting up and operations of hospitals, diagnostics, clinics and sub-centres across the country. Government will then be expected to be the primary provider and could account for upto 54 per cent of the total beds in the country by 2022. Growth of social insurance will slow down as the government deploys its resources mostly in provision and subsidising the costs of treatment in its hospitals. Private provision will likely slow down with the government unlikely to incentivise private investments in setting up healthcare delivery centres. In all likelihood, the addressable market for private providers will be limited to that of the urban rich and upper middle class segments.
If the government were to play the role of the ‘primary provider’, it would have to strengthen several capabilities. First is the capability to rapidly build greenfield and brownfield healthcare infrastructure. The government will need to add 8 to 9 lakh new beds over the next decade. Second is the capability to refurbish, sustain and gradually grow rural healthcare infrastructure. Third is the capability to build a strong diagnostic capacity, particularly given the high importance of preventive care. Fourth is the capability to integrate and interlink the entire healthcare delivery network using population and patient information management systems. Finally, the capability to conceive and implement effective healthcare workforce reform. Competition with the private sector will be a major challenge for the recruitment and retaining of talent in the urban areas.
Consequently, the total government spending in setting up healthcare facilities over the next decade could be in the range of INR 272 to 394 thousand crore. This assumes an approximate spend of INR 30 to INR 40 lakhs per bed at a weighted average of urban and rural beds and primary, secondary and tertiary beds.
Choosing the role of the ‘primary payor’Making this choice implies that the government will become the principal payor for healthcare in the country, with services provided through the private sector insurers as well as providers. Growth of public beds will slow down as government starts deploying an increasing share of funds in scaling up RSBY or similar schemes. Alternatively, the government could opt for a capitation, PPP or O&M contracting model, wherein the beds will be set up by the government, but the facilities managed and run by private players. Private provision will show strong growth. In addition, insurers are likely to experience strong growth if the social insurance schemes are rolled out at scale.
If the government were to play the role of the ‘primary payor’, it would have to strengthen several capabilities. First is the capability to scale up insurance coverage along two dimensions. One is to extend coverage of basic healthcare needs for the poor and lower middle class. The other is to extend coverage to outpatient care given that this comprises 65 per cent of the OOP spend. Second is the capability to conceive and implement a set of guidelines and set up a central organisation that will help work with private providers and insurers. Priorities would include creating standardised guidelines and developing efficient accreditation, monitoring and payment systems. There are many examples of such central organisations such as the Regional Health Information Organisation (RHIO) in the US. Third is the capability to design pricing structures and conduct risk assessment. Fourth is the capability to design incentives to encourage private sector investments in provision.

78
WORKING WITH THE PRIVATE SECTORThe draft of Twelfth Five-Year Plan envisages two predominant routes to enable this collaboration, first through government sponsored social health insurance schemes such as the Rashtrya Swasthya Bima Yojana (RSBY), and second through public-private-partnerships (PPP).
Our analysis of successful PPP schemes around the world indicates that the following five-stage approach increases success: first, create a legal framework; second, build competence in the public sector; third, carefully choose and test PPP models by understanding the key value drivers and risks; fourth, actively build a market and supplier base for public-private contracts; and finally, implement strict controlling and performance monitoring [Exhibit 4.2].
In light of the role and the imperatives laid out for the government throughout this chapter, the government and private sector should consider initiating or furthering dialogue on a set of high priority topics. Proposed below are potential action areas aligned to the achieve country’s goals of universal healthcare access and do not need to necessarily wait for the development of a full-fledged long term healthcare vision. This list is indicative, and by no means a comprehensive agenda for public-private collaboration.
� Authorisation, accreditation and improving capabilities of nursing associations (e.g., INA, NCI) to enable them to define qualifications, standards, career path and training needs
� Creating and working with a body of private providers to address challenges in RSBY pricing and collections. Potentially identify a set of pilot hospitals across the country where the private provider and government actively collaborate to ensure utilisation of beds, payments and reasonable profitability
� Rolling out and scaling up of existing standards such as the clinical standards. Begin implementation in a few institutions, seek participation at the district or block or ward level, start a feedback loop to learn and modify
Exhibit 4.2
Key success factors for PPP from public perspective
SOURCE: McKinsey analysis
▪ Identify key performance ratios for planning, construction and operating phase ▪ Set-up powerful and continuous controlling and monitoring processes ▪ Implement controlling procedures and put in place sufficient resources▪ Define stringent escalation mechanism
▪ Define and implement legislative framework providing stability for private investors▪ Identify and remove potential bottlenecks for efficient tendering and execution of
PPP
▪ Learn from success and failures in other countries▪ Build-up competent of group of experts, internal and external
▪ Understand revenue forecast, sensibility and risks▪ Understand cost levers for different life cycle phases
▪ Understand risk exposure/drivers and potential cost/functionality implications▪ Identify best owners of risks ▪ Put risk management tools in place for retained risks
▪ Screen national and international markets▪ Test/pilot different PPP-models and contracting structures▪ Build-up network of national/international suppliers
Implement strict controlling/monitoring of contract performance
Create legal/ legislative framework
Build competence in public sector
Understand key value drivers
Allocate risk “sensitively”
Actively build-up market/supplier base for PPP-contracts
Carefully choose and ‘test’ PPP-models
4
1
2
3
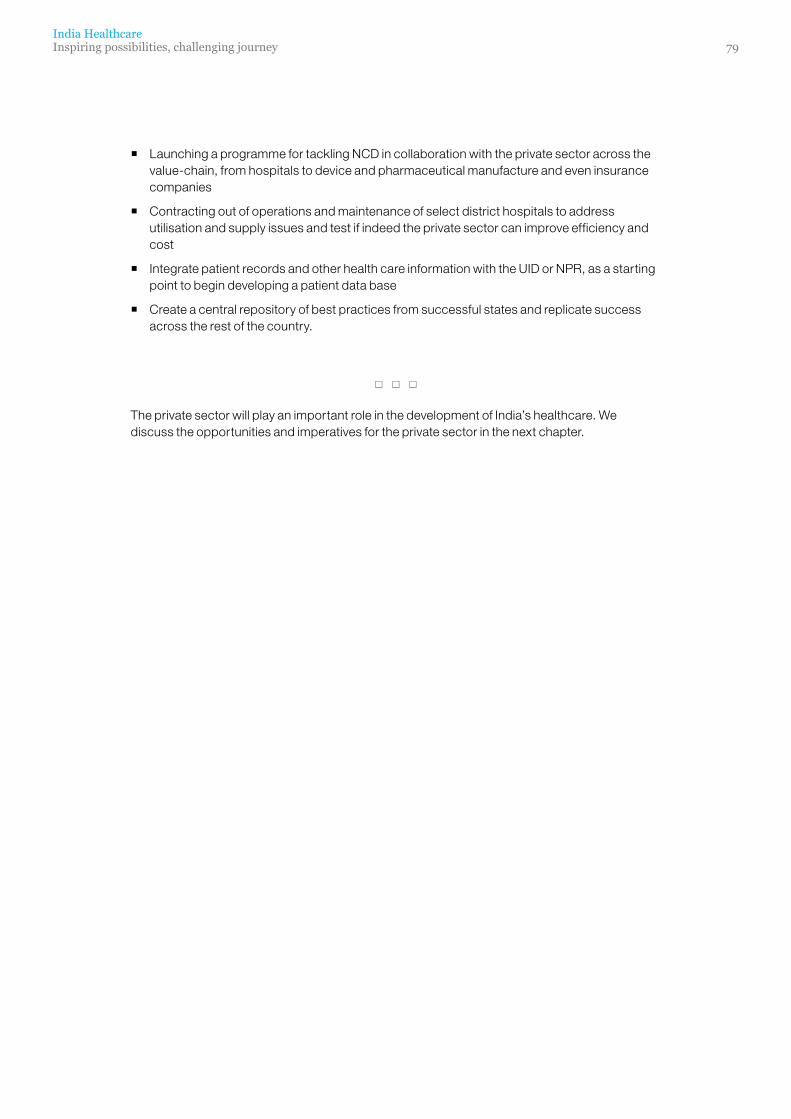
79India HealthcareInspiring possibilities, challenging journey
� Launching a programme for tackling NCD in collaboration with the private sector across the value-chain, from hospitals to device and pharmaceutical manufacture and even insurance companies
� Contracting out of operations and maintenance of select district hospitals to address utilisation and supply issues and test if indeed the private sector can improve efficiency and cost
� Integrate patient records and other health care information with the UID or NPR, as a starting point to begin developing a patient data base
� Create a central repository of best practices from successful states and replicate success across the rest of the country.
* * *
The private sector will play an important role in the development of India’s healthcare. We discuss the opportunities and imperatives for the private sector in the next chapter.

80

81India HealthcareInspiring possibilities, challenging journey
Opportunities and imperatives for the private sectorIn the previous chapters, we studied India’s healthcare journey over the last decade and the crucial juncture at which it stands right now. We gleaned lessons from healthcare systems across the world and described a possible vision for India’s healthcare system for 2022, building on what has been set out in the draft of the Twelfth Five-Year Plan. We also highlighted the choices to reach this destination and the implications for the government.
In this chapter, we turn to implications for the private sector. We discuss the driving forces that are likely to shape the sector in the next decade. We then identify opportunity areas that these forces will create, and the imperatives necessary for players to capture these opportunities. We discuss four industry segments: providers—including diagnostics providers, insurers, pharmaceutical manufacturers, and devices and equipment manufacturers.
This report purports to define a possible vision for the country’s health system and outline the contours of the journey. This objective remains well above the specific interests and discussions of individual verticals within the sector. Hence, while describing the opportunities for the private sector, our attempt has been to profile these at a reasonably high level and highlight specific features that are worth taking a note of. We have stayed away from sizing these opportunities. We do not consider the specifics of their size and growth to be a core objective of this exercise.
DRIVERS FOR GROWTHThe private sector stands at an interesting juncture, facing several headwinds and tailwinds. We have identified the drivers that will shape private sector opportunities.
Increasing disease burden, and rising awareness and affordability will drive the demand for healthcare products and services. On the supply side, increase in the number and utilisation of medical workforce and infrastructure will be a major determinant. At the same time, saturation of metro and urban centres over the next decade will create margin pressures. Finally, a well-defined regulatory system will shape the evolution of the sector.
We fully expect India’s healthcare sector to grow at a steady pace during the next decade. The share of value added between the private and public sectors will depend in large measure on the path the government adopts and the choices it makes. Notwithstanding these choices, we expect the sector to grow at a CAGR of 15 to 17 per cent, reaching up to 5.5 per cent of GDP. This implies that total spending in healthcare could well be in the range of INR 19,00,000 crore by 2022. Needless to say, such growth will only take place provided the government and other stakeholders choose to undertake the challenging journey described in the previous chapters.
The drivers during the next decade that are worthy of note are as follows:
� The rising burden of NCDs: As the prevalence of non-communicable diseases balloons in the next decade, policy makers as well as insurers could increasingly push for long-term care models as opposed to event based models that are currently the norm. The lifetime value of a patient for the private provider will become the metric of assessment rather than the one time spend during the health event. This approach will be a more holistic one, and will also drive the need for increased diagnostics and sophisticated devices. The rise in burden will impact all the ‘six Indias’ that we highlighted in Chapter 3.

82
� Increasing affordability: With rising income levels across the population, as well as increasing insurance coverage, the number of patients accessing health services will rise. This fact is reflected more strongly in the rural and urban middle class clusters. These ‘consuming’ classes will see the addition of nearly 150 million people over the next decade. Social insurance coverage under RSBY and state schemes will likely increase over the next plan period to cover most of the below-poverty-line (BPL) population and potentially out-patient spend. Similarly, private insurance1 penetration has increased from 1.3 per cent in 2003–04 to 4.5 per cent in 2009–10 and the trend is expected to continue.
� Increasing awareness of disease, prevention and treatment: Rising awareness of health and related outcomes, and the rising perceived need for health insurance will lead to more patients exhibiting care seeking behaviour, especially if covered by insurance.
� Evolution of the six Indias, leading to newer and varying business models: As highlighted in Chapter 3, different population clusters vary significantly in terms of access, epidemiology and expenditure and are growing at highly different rates. These differences will drive the sector to evolve different business models for each. For example, the urban poor, which is currently the most neglected segment from a healthcare access perspective, will grow to nearly 10 per cent of the country’s population by 2022. The provider industry will need to explore ways to serve this large population group at the right price points. A low cost model will be needed.
� Addition to, and improved utilisation of the existing medical workforce: This will be applicable to the country’s strength of general practitioners, specialists, paramedics, technicians and nurses, most of who have been a constraint to the expansion of the provider and equipment industries.
� Scaling up of public infrastructure: This will drive the growth of all associated healthcare industries. Depending on the government’s choice of a payor or provider role, the relative distribution of public versus private infrastructure will differ. Also, as per the draft Twelfth Five-Year Plan, the government proposes to focus on prevention and primary care. This will lead to disproportionate increase in the market for products such as vaccines.
� Increasing margin pressures: As costs of manpower and utilities continue to rise, while prices come under competitive and regulatory pressure, the private sector will witness a steady pressure on margins.
� Saturation of the metro and urban centres: Our analysis reveals that currently India’s metros enjoy ‘beds per population’ figures that are comparable to global averages2. This of course does not take into consideration the well-known ‘drainage routes’3 within India towards the urban centres. Nonetheless, it does reveal the dramatic crowding of the sector in the metros. Discussions with the leaders in the sector highlight the resultant pressures on utilisation and pricing4.
� Governmental push to ensure equitable access to affordable health services: This stated position, as per the draft of Twelfth Five-Year Plan, could likely lead to a regulatory environment that aims at reducing the cost of care and out-of-pocket spend. A holistic system-wide view is important to balance this focus on cost containment, through measures such as price control, with the cultivation of an environment that provides appropriate incentives for stakeholders to participate.
1 La Forgia, Gerard, and Somil Nagpal. 2012. Government-Sponsored Health Insurance in India: Are You Covered? Directions in Development. Washington, DC: World Bank. doi:10.1596/978-0-8213-9618-6. License: Creative Commons Attribution CC BY 3.0.
2 See Exhibit 1.10.3 Drainage routes refer to flow of patients from areas with poor healthcare access, to urban centers or other
places with good healthcare facilities.4 See Appendix.

83India HealthcareInspiring possibilities, challenging journey
� A stronger regulatory framework that can shape efficiency and performance levels of the private sector. It is likely that the government will strengthen the regulatory framework through the standardisation of treatment guidelines, enforcement of the Clinical Establishment Regulation Act, and establishment of stronger mechanisms against malpractices. This will improve the quality of service delivered, increase costs in the short term, before settling down to more efficient ways of delivering higher levels of clinical quality.
IMPLICATIONS FOR THE PROVIDER INDUSTRYWe saw in Chapter 1 that the private provider industry has contributed disproportionately to bed growth in the last decade. During this time, two important business model innovations have emerged.
First, stand-alone diagnostic providers have demonstrated the ability to build sustainable businesses that service large volumes, particularly in metros. Second, entrepreneurs are exploring single specialty, curative care models.
The diagnostic industry will grow faster than the total provider industry in every scenario. Three factors will lead to this advantage. First, use of diagnostics in medical decision making will increase. Second, financial and physical barriers to access are lower: price points are low and several low-cost, compact, point-of-care diagnostic kits are being developed. Third, the management of NCDs needing periodic tests is expected to grow rapidly.
For the remainder of this chapter, ‘providers’ refers to the entire industry, including diagnostic services. We will make explicit references to diagnostic providers or unique business models only where the implications for these segments are different from those for the industry. In Chapters 1 and 3, we saw that India will add between nearly 13,00,000 to 15,00,000 beds in the next decade. It is likely that up to 60 per cent of these beds will come from the private sector, but this depends heavily on whether the government adopts a payor or provider role [Exhibit 5.1].
Exhibit 5.1
Share of additional beds contributed by public sector could vary from 10%–60%, depending on government’s choice of role
Government as provider, 2022 Government as payor, 2022
Total beds, numbers in lakhs Total beds, number in lakhs
x% Share of beds addedbetween 2010 and 2022
5.8
8.8
5.4
14.6
15.4
10.0
2022 (P)
30.0
15.8
2010
PublicPrivate
13.4
5.8
23.3
10.0
30.0
2010
15.8
6.7
2022 (P)
0.9
62% 38% 62% 38%
SOURCE: Central Bureau of Health Intelligence, Health infrastructure, 2005 and 2010; World Bank database, World Development Indicators (WDI); World Health Organisation, Global Health Expenditure Database; ASSOCHAM; McKinsey analysis
84
Market Opportunities
Management of NCDs, the needs of under-penetrated urban poor cluster, the non-metro urban market, and government sponsored social insurance programmes represent the most important opportunities for the next decade. Business model innovation is necessary in each case.
� Non-communicable diseases. Nearly all facilities in India are organised for event based care5. However, NCDs management requires a different, long-term care model6. NCDs represent an important high-volume and high-value opportunity: they accounted for around 53 per cent of mortality (2009–10) in India and the average bill size for NCD hospitalisation was around 46 per cent higher than the rest (2004–05, urban rich cluster). There are already early examples in oncology, and nephrology in particular, of models servicing patients by creating a hub-and-spoke model and offering innovative installment based payment schemes. This can increase the ‘lifetime value’ of a patient for a hospital, at little to no additional capital expenditure. Further, identifying patients early will require opportunistic screening drives that may be best driven by organised diagnostic or health services providers.
� Non-metro urban market. This will be a substantial opportunity even for secondary-tertiary multispecialty hospitals. However, the business models for these hospitals will need to be adapted to lower costs, and a different doctor and patient pool. As penetration of insurance (including government insurance) in non-metros steadily rises, this could trigger the next wave of growth for hospital beds.
� The urban poor. This is the lowest penetrated segment by the private sector. Only 48 per cent of the urban poor are hospitalised in private hospitals versus public, as compared to a national average of 59 per cent7 in 2004; the same is true for out-patient consultations as well. This cluster will represent 10 per cent of India’s population by 2022 and is physically close to private facilities. They could represent one of the only sources of growth for the overall market in metros, else players will have to depend on taking share from each other for growth. As government insurance schemes penetrate further in this cluster, this may open up a hitherto untapped but large segment which might be easier to tap given doctor and facility proximity. There are early examples of providers entering this cluster in select specialties (e.g., maternity and child, ophthalmology, nephrology).
� Government sponsored social health insurance programmes. These programmes are removing financial barriers for the hitherto underserved population. These schemes had provided hospitalisation cover to 183 million people by 2009–10. RSBY alone has covered over 70 million people and provided them access to over 12,500 public and private hospitals8 across the country. The draft of the Twelfth Five-Year Plan proposes to cover all BPL families under this scheme. Early examples show it is possible to develop low cost facilities to focus on this newly opened market. If the government goes the payor route, about 75 per cent9 of the population could be covered by a government insurance scheme in 2022.
Imperatives
� Invest in business model innovation. Corporate chains will require different modules within their umbrella—and this means modules with different levels of capex, equipment usage, doctor models, non-healthcare services and utilities, modes of payment and ancillary areas of healthcare including patient education, counseling and alternative forms of therapy. This will be true at both ends of the income and expenditure spectrum—not just
5 Event-based care models are geared to treat patients when they need curative interventions; patients visit these facilities only when required.
6 Long-term care models are geared to service patients over long periods, with focus on management of existing health needs and prevention; patients interact with health personnel on a periodic basis.
7 NSSO Morbidity & Health, 60th Round; see Appendix.8 Empanelment of Health Care Providers, http://www.rsby.gov.in/Overview.aspx (visited 12 December 2012).9 Assumes 100 per cent coverage for poor and around 60 per cent among middle-class people.

85India HealthcareInspiring possibilities, challenging journey
the bottom of the pyramid, but also the very top; and it will be true at different ends of the case mix spectrum as well. If so, the managerial challenges for these models will be different and not easy to manage. Business planning would need to precede and inform decisions on investments and project planning, and deployment of capital will need to be managed efficiently.
� Maintaining profitability and ROIC10 in existing facilities, through operation spend and optimisation of capital, will become critical. Exhibit 5.2 illustrates the various revenue and cost levers that affect the ROIC for hospitals. It will become increasingly difficult for hospitals to maintain profitability unless all these levers are tweaked adequately.
� Private-private partnerships. Providers have to collaborate with other stakeholders to ‘plug leakages in patient funnel’11 that prevent patients with genuine need from accessing care. This requires innovative solutions that increase awareness, improve access to diagnostics, follow-up on referrals and strengthen trust amongst patients. Strengthening the referral funnel into the hospital to ensure steady and predictable utilisation will be a critical lever, particularly in newly tapped non-metro cities.
10 Return on Invested Capital (ROIC) is a financial measure of how well a company generates cash flow relative to the capital it has invested in its business. When the return on capital is greater than the cost of capital, the company is creating value; when it is less than the cost of capital, value is destroyed.
11 Patient funnel refers to patient journey through diagnosis to compliance. If patients do not seek treatment for several reasons, including lack of awareness about the illness, suboptimal training levels of providers, imperfect referrals, misaligned provider incentives, etc. it is referred to as a leaky patient funnel.
Exhibit 5.2
There are 15 key levers to improve return on capital employed
Returns on capital employed
Returns
Capital employed
Revenues
Costs
Patient experience
Business model
Capex
Conversation
Case mix
Footfalls
Pricing
Consumption per patient
Cost of material
Labour productivity
Patient satisfaction
Utilisation and throughput
Clinical quality
Strategic sourcing
Design to cost
Lean execution
Hospital format
Timing of investments
SOURCE: McKinsey analysis

86
We conducted a round table attended by senior management of nine hospitals (The appendix talks about the key discussion themes and attendees of the round table meeting) to explore the top of mind issues they face today and could face over the next 10 years, and their preparedness in tackling them12. The results were insightful and have informed our view on how this industry will evolve.
Exhibit 5.3 is an outcome of an exercise we conducted as part of this round table. We asked the participants to rank the aforementioned issues along two dimensions – priority and current performance, business model customisation, and containing costs (especially capital expenditure) emerged as the highest priority issues where providers feel ill-equipped to deliver superlative performance. They believed that their productivity is not an issue and that they adhere to ethics and values. Ironically, a single voice for the industry, though considered an imperative by most players, did not appear as a high priority agenda for most players.
This will be an interesting decade for the private provider industry; one which will see the industry move beyond metros, tackle margin and ROIC pressures, and find several successful models of healthcare delivery. There are large opportunities to tap into and there will be many winners. The ability to adapt quickly and develop new models and capabilities will prove to be a crucial factor for success for this decade.
12 Provider industry in India is highly fragmented. Ten largest hospitals together constitute less than 5% of all beds in the country. Therefore, any small group can only represent a subset of issues faced by the industry. However, the workshop invitees were selected from different sub-segments of the industry such that a wide range of experiences and perspectives were represented.
Exhibit 5.3
Private providers are concerned about four key areas
1 Priority levels assigned on the basis of relative scores from the 8 respondents
SOURCE: Workshop conducted by McKinsey with Provider Advisory Group, October 25, 2012
Prio
rity1
Highpriority
Mediumpriority
Lowpriority
1. Capital efficiency
2. Medical talent
1. Business model customisation
2. Costs
1. Revenue ramp-up
1. Improved productivity/ Operational efficiency
2. Ethics and values
1. Single voice in the industry
High performance Medium performance Low performance
Performance1
6
8
2
3
1
4
7
5
Exercise output: priority vs. performance for key areas

87India HealthcareInspiring possibilities, challenging journey
IMPLICATIONS FOR THE HEALTH INSURANCE INDUSTRYThe last decade has been a landmark decade for health insurance. Total number of insured people increased from 55 million in 2003-04 to 300 million in 2009-10. Growth has been driven by both government sponsored social health insurance programmes and private retail. With around 75 per cent of India’s population still without any insurance cover, evolving population clusters, attention to NCDs and the government’s commitment to universal healthcare access, the next decade will be extremely important for the industry.
Market Opportunities
Opportunities for private insurance are aligned to the priorities for healthcare identified by the government.
� Government sponsored social health insurance programmes. These programmes have formed an important component of growth over the last decade. There is an increasing interest from state governments to launch RSBY (or similar schemes). For example, Chattisgarh has extended RSBY to its entire BPL population working in the unorganised sector. Similar initiatives by other states can remove financial barriers to access and extend insurance coverage in India. This presents a substantial opportunity for the industry – for example, Kerala covered 2.7 million families under the RSBY scheme within 4 years of launch, all of whom are covered by a small number of insurers.
� Coverage for spend on out-patient consultations. Currently government sponsored schemes cover only in-patient services. However, out-of-pocket spend on out-patient services is around 2x of in-patient spend – that literally represents a doubling the spend (and potentially premium) with the same population covered, if methods can be evolved to control fraud. Developing scalable solutions for out-patient services through government sponsored schemes can be a big opportunity. Pilots are underway in Puri (Odisha, formerly Orissa) and Mehsana (Gujarat).
� Non-communicable diseases. Awareness of NCDs is rising. However, insurance products for them are still under evolution. Developing such products would be an important opportunity for the private retail as well as government sponsored social insurance programmes. Given the size of the NCD burden across clusters (see Chapter 3), this could be a substantial driver of growth, as described in the opportunities for providers.
� The urban middle-class. This growth continues to offer a large opportunity. Private insurance coverage data (excluding government social insurance schemes) indicate that some penetration may have been achieved. However, developing this market can be an important opportunity. 95 million people will enter the urban middle class over the next decade. Partnering with existing channels, such as retail banks, would be an important way of reaching out to these clusters.
Imperatives
In order to develop these new opportunities, industry leaders have to consider the following imperatives.

88
� Strengthen focus on improving quality of service delivered by hospitals. Currently, quality issues have been reported13 in private and public facilities. Insurance companies have the negotiating power to assure minimum standards of quality amongst providers. This will instil greater confidence amongst patients and strengthen the value proposition of the insurers and providers. Along with these efforts, control and monitoring systems should also be strengthened.
� Continue efforts towards increasing awareness of health insurance. Efforts should be targeted especially towards the young to reduce the risk profile of the insured population, reduce premiums and, hence, lower the financial barriers. Ensuring that populations with heightened awareness avails insurance can be another specific effort to this opportunity.
� Innovate to provide appropriate products targeted at non-communicable diseases. Currently, these efforts are constrained by one year limit on duration of policies. This should be part of the agenda for the discussions between the government and the private sector.
� Find systems and methods to extend coverage into the outpatient segment. This could ideally capture both doctor fees and drugs, the two biggest components. This will require innovative product definitions and substantial empanelment machinery that can account for the quality and veracity of service provided by smaller providers including individual doctors.
IMPLICATIONS FOR THE PHARMACEUTICAL INDUSTRYThe pharma industry in India has seen a step change in growth momentum over the last 5 years. Various industry reports suggest that the industry has been growing at 13 to 14 per cent over the last 5 years —a sharp rise from the 9 per cent compounded annual growth rate between 2000 and 2005. India’s domestic drug market is valued at nearly INR 63,000 crore14 in 2010.
Market Opportunities
The industry stands at a cusp today with several opportunities and challenges ahead. There are barriers around affordability, accessibility and acceptability that the industry needs to overcome. It is a highly segmented market requiring a granular approach by stakeholders to understand, influence and drive growth. Public policy has a role to play and the discussions on issues like price control, public health expenditure on drugs, intellectual property, marketing norms, new drug introductions and quality standards are getting a fresh impetus.
The big opportunities that the next decade presents for the industry are:
� Metros and tier-I markets: This will make significant contributions to growth, driven by rapid urbanisation and greater economic development. However, even here, medical treatment and compliance levels need significant investments and enhancement. Players can play a role in shaping this and this segment will continue to be the largest consumers of the pharma industry on a per capita basis.
� The urban poor: Geographical proximity of this segment to the pharma sales forces makes it a relatively easier segment to tap than the rural segments that have challenged the pharma market. This cluster’s proportion of drug consumption in 2004 was at 4.7 per cent even when the population cluster represented 6.1 per cent of total population. The needs here range across all therapies. For instance, certain acute diseases where the total cost of therapy is low (e.g. anaemia, hyperacidity) are underpenetrated from bottlenecks around access,
13 Das et al., ‘In Urban And Rural India: A Standardised Patient Study Showed Low Levels Of Provider Training And Huge Quality Gaps’, Health Affairs, No. 12, Issue 31 (2021: 2774–84).
14 Data for 2004–11; IMS, SSA, MAT, December 2011, Annual report OPPI.

89India HealthcareInspiring possibilities, challenging journey
awareness, diagnosis and treatment. On the other hand, chronic diseases like dyslipidemia or life-threatening diseases like cancers have severe access as well as affordability bottlenecks.
� Infectious diseases and vaccines: This opportunity will be especially large if the government adopts the provider role. In certain priority segments, this is a near to medium-term opportunity. For instance, the government will try and increase its focus on primary and preventive care as recommended in HLEG and also reflected in the draft of Twelfth Five-Year Plan. Our immunisation rates are currently low (DPT3 coverage rate of 72 per cent compared to LMIC average of 84 per cent) but with universal healthcare access, this coverage will get closer to around 100 per cent creating opportunity for the segment.
� The rural population. This is currently the most underserved of all population clusters15. Their share will grow the fastest driven by step-up from current poor levels of penetration. This market can be served much more intensively, if the government adopts a payor role, especially for the rural poor, and, more importantly, if pilots to cover outpatient treatment under government sponsored health insurance schemes16 are successful.
Imperatives
There are several imperatives for the pharma industry in light of the driving forces and opportunities that emerge:
� Protect margins by driving costs and efficiencies. In order to cope with price pressures and changing demand landscape, to protect margins, the pharma industry will need to ensure ruthless focus on costs and efficiencies in order to maintain reasonable margins by further reducing costs in manufacturing, sourcing and operations. Low cost manufacturing and improving operational efficiency will be critical. Further, technology should be leveraged to improve capital and workforce productivity. If the government adopts a provider role, building manufacturing capabilities for certain type of drugs to leverage economies of scale will provide benefits.
� Segment the market at a granular level and develop different business models for different opportunities. For example, the rural poor might require a low cost-to-serve operating model with partnerships with government and players to increase awareness and diagnosis of conditions. This may require players to challenge fundamental assumptions on tiered pricing possibilities, sales coverage model and investment and risk horizons.
� Strengthen two sets of commercial capabilities: marketing excellence and sales force excellence. In addition, players will need to put in place two enablers: strengthen the organisation to be able to sustain performance and manage rising complexity; and collaborate with stakeholders within and outside the industry to drive access and shape the market.
� Leverage partnerships across the value chain. With growing chronic diseases, companies can try leveraging partnerships across the value chain (e.g., with providers, diagnostics etc.) to plug leakages in the diagnosis and treatment funnel. As a case in point, companies have experimented in collaborating with diagnostic labs to screen people for NCDs and sales representatives received leads on where to market their drugs.
� Engage with government extensively, particularly if it assumes the primary provider role. In this case, the government could become the single largest customer for the private sector. This is very different from the current fragmented sales model where doctors are the primary customers. Companies will need to develop many capabilities, for instance, tendering, key account management and liaison.
15 See Exhibit 3.4; rural poor have the lowest hospitalisation frequency (admissions per 100 population, per annum).
16 RSBY is conducting pilots in Puri (Odisha) and Mehesana (Gujarat) to include out-patient services in the benefits plan.

90
� Design commercial model to cater to the rural population. This is particularly true if the government adopts a primarily payor model. For instance, it may need to enhance their engagement with the empanelled hospitals for in-patient drug requirements to target population covered under social insurance and upgrade their sales and distribution infrastructure in rural areas.
IMPLICATIONS FOR THE MEDICAL DEVICES AND EQUIPMENT INDUSTRYThe medical devices and equipments sector is seriously under-penetrated in India. This is both based on per population ratios, and amounts of money spent across clusters on devices. Exhibit
5.4 illustrates this point—e.g., density of CT and MRI scanners per million population was 3 and 0.6 respectively in India, compared to OECD average of 21 and 11 respectively. Poor diagnosis and treatment rates combined with an absence of affordable products have led to this situation.
The current market is relatively consolidated with large MNCs contributing to more than 50 per cent of the total market.
Market Opportunities
If Indian healthcare were to fulfill its promise in the next decade, the following opportunities would arise for medical devices and equipments players:
� High income population segments in metros and tier I markets. Unlike in pharmaceuticals and providers, this population segment continues to remain underpenetrated for medical devices. In order to capture the full potential, players
Exhibit 5.4
32.2
3.0
18.4
0.9
India is clearly lagging behind in terms of device penetration compared to other countries
SOURCE: OECD database; http://www.ncbi.nlm.nih.gov/pmc/articles/PMC2747440/
India average OECD1 average
MRI units, 2010Per 1000 population
CT scanners, 2010Per million population
1 Organisation for Economic Co-operation and Development (OECD) is an international economic organisation of 34 countries founded in 1961 to stimulate economic progress and world trade

91India HealthcareInspiring possibilities, challenging journey
would need to drive awareness and acceptance. Orthopaedic reconstructive joints and pacemakers are cases in point.
� Mid-income segment in urban areas. The potential in this segment is underpinned by a large and growing population, rising incidence of non-communicable disease, old age and greater access to diagnosis and treatment. To capture this opportunity players will need to introduce products with mid-tier pricing and coordinate with the other players in the value chain to provide a low ‘cost of treatment’ offering.
� Home-based self-monitoring devices. This opportunity is supported by the growth of chronic diseases, greater awareness and compliance, particularly in the urban rich and middle class clusters. In addition, we witness a growing tendency amongst patients to become self-reliant with regards to non-invasive and periodic monitoring for chronic disorders.
� Provider based equipment. This opportunity will grow, driven by an increase in healthcare delivery facilities. To accelerate this growth innovative financing and public-private partnerships (PPP) will be crucial.
Imperatives
To capture these opportunities, the industry will have to undertake the following imperatives:
� Strengthen commercial capability to cater to the urban rich segment. Given the relatively nascent and underpenetrated nature of this industry, the commercial muscle will need to be strengthened further in the coming years. Growth will come both from tapping into the growth in the provider industry, but also from penetrating existing providers deeper. Capabilities in financing, negotiations, contracting and product package design will be crucial.
� Introduce globally relevant products. In order to maintain share and profitability within the traditional high income population segments, players will need to constantly introduce products with state-of-the-art features targeting specialists and super-specialists in metros.
� Enhance product development capabilities. Most multinationals that operate in this industry do not traditionally have local RnD capabilities. However, as the market evolves into newer opportunities in the middle class and insured segments, being able to offer product with reduced features at mid-tier pricing will become crucial.
� Drive collaboration across players in the business system. This industry will benefit richly from private-private partnerships across the value chain in order to provide end-to-end diagnosis and treatment solutions. As described in previous chapters, a leaky patient funnel is a key reason for underutilisation and reduced demand for this industry.
� For provider based equipment, drive innovation in financing and PPP models. This is an imperative that needs to be driven at scale. With entry into tier 1 and 2 cities, the industry business model will also evolve particularly for expensive equipments with respect to financing to cater to customer needs. For example, the older financing models of bank loans have given way to leasing and risk sharing model of revenue sharing and profit sharing or even equity investment. This needs a very different set of capabilities of risk assessment at the local level, which are not common.
The implications for the industry and the actions for players will remain the same irrespective for the pathways taken by the government (as a provider or a payor). The magnitude of relative importance for each action will vary depending on the pathway.
* * *

92

93India HealthcareInspiring possibilities, challenging journey
Appendix
CLUSTER ANALYSISOur research methodology was based on four elements –(a) cluster analyses on large datasets, primary among them being the NSSO Morbidity and Health Survey, 2004 (60th round) and the NSSO Consumer Expenditure Survey (CE), 2005 and 2009, (b) structured deliberations with the CII steering committee on health, (c) secondary research across multiple publicly available sources such as CBHI, World Bank, WHO, UN, Planning Commission etc. and (d) interviews with several industry experts on multiple topics.
Our analyses was aimed at understanding the disparate journeys and experiences of different population ‘clusters’ in India that differ in terms of their socio-economic status and hence, along multiple ‘healthcare’ dimensions such as disease epidemiology, expenditure profile and patient behaviour.
Determinants of clustering
The first step in this process was to determine the determinants along which population should be divided to form meaningful ‘clusters’ that are homogeneous among themselves and exhibit significantly different characteristics from other clusters. We used data from the District Level Health Survey (DLHS-2 and DLHS-3) for this analysis. Income and urbanisation are accepted as important determinants of health access and outcomes. Exhibit 3.1 demonstrates this relationship.
Population clusters
The next step was to create population clusters using these determinants and appropriate ‘cut-off’ levels for them. We adopted a statistical approach for creating these clusters in a way that maximised intra-cluster homogeneity as well as inter-cluster heterogeneity of healthcare behaviours. This approach, called ‘hierarchical clustering’, was implemented using the statistical tool SPSS, and applied on the NSSO CE survey, 2005 data. This exercise generated 6 clusters with the expenditure cut-offs defined as follows:
2.0%More than 2.3 Urban rich6
15.4%0.6 to 2.3 Urban middle-class5
6.2%Less than 0.6 Urban poor4
2.5%More than 1.5 Rural rich3
24.1%0.6 to 1.5 Rural middle-class2
49.8%Less than 0.6 Rural poor1
Size of cluster(% of population)
Annual expenditure range, 2005INR lakhsCluster

94
These cluster sizes were tested against the results from another research exercise conducted by McKinsey & Company in 2007 (The ‘bird of gold’ – The rise of India’s consumer market) and refreshed in 2010 (McKinsey Global Institute’s report on India’s urban awakening). Cluster sizes were found to be in line with population clusters defined by income in other studies.
Cluster growth rates
While clustering on the NSSO CE survey, 2005 data helped create ‘static’ population clusters, the evolution of these clusters could only be seen over time. Therefore we looked at the NSSO CE survey, 2009 to get data at another point in time. The ‘cut-off’ expenditure ranges were adjusted for inflation1 to maintain consistency in cluster definitions across different years. Cluster sizes in 2009 with adjusted “cut off” expenditure are as follows:
The actual population size of each cluster for 2005 and 2009 was determined using cluster sizes and the total population of the country in corresponding years. Subsequently, the growth rate of each cluster was calculated as shown in Exhibit 3.2.
Analyses along key metrics
As the NSSO M&H survey was done in 2004, we calculate population size by cluster for the year 2004 using the cluster growth rates obtained above. The clusters for 2004 were as follows:
1 Consumer price index (CPI) based inflation (~9% for the period 2005-09), and not wholesale price index (WPI) based inflation, was used for this translation since CPI more closely mirrors healthcare expenditure, as opposed to WPI.
2.7%More than 3.17 Urban rich6
17.3%0.88 to 3.17 Urban middle-class5
7.0%Less than 0.88 Urban poor4
2.5%More than 2.09 Rural rich3
24.7%0.88 to 2.09 Rural middle-class2
45.7%Less than 0.88 Rural poor1
Size of cluster(% of population)
Annual expenditure range, 2009INR lakhsCluster
1.8%Urban rich6
14.9%Urban middle-class5
6.1%Urban poor4
2.4%Rural rich3
24.0%Rural middle-class2
50.8%Rural poor1
Size of cluster(% of population)Cluster

95India HealthcareInspiring possibilities, challenging journey
This exercise enabled us to explore NSSO M&S data in light of 6 clusters rather than national averages. Subsequently, multiple analyses were conducted to explore the differences in healthcare behaviours across these clusters. The key elements of these analyses are outlined below:
� Disease burden was measured by prevalence over the last 15 days, as recorded by NSSO M&H survey, for various infectious and non-communicable diseases. The burden was measured as cases per 1,000 population while share of burden was the share of cluster in the total cases in the country for the corresponding disease
� Hospitalisation and consultation frequency was measured as the number of in-patient admissions and out-patient consultations per 1000 population over a 1 year period and 15 day period respectively for each cluster
� Average in-patient and out-patient bill sizes were measured as the total in-patient/ out-patient expenditure for the cluster, divided by the total number of hospitalisations/ consultations respectively
� OOP healthcare spend for a cluster was measured as the per capita OOP healthcare spend within each cluster multiplied by the population of the cluster
� Split of in-patient and out-patient expenditure across categories such as drugs, doctor fees, hospital charges etc. was done on the basis of categorising the line items available under these heads in the survey questionnaire along these broad categories
This analysis links to all numbers used in the report related to disease burden, hospitalisation density, bill size, out-of-pocket spend, and split of in-patient and out-patient expenditure by cluster.
PROVIDER WORKSHOP
Workshop with Provider Advisory Group
▪ Workshop held at McKinsey & Co. office in Gurgaon office on Oct 25, 2012 attended by:– Rajiv Sharma (CEO, Sterling Hospitals)– G. Udayan Dravid (CEO, Fortis General)– Shravan Talwar (CEO, Moolchand Healthcare)– Bhargava Swamy (Hospital Administrator, Vaastsalya)– A. Raghuvanshi (MD & Group CEO, Narayana Hrudyalaya)– Rajen Ghadiok (Exec. Director, Nova Specialty Surgery)– Mudit Saxena (COO, Health Care Global)– Pankaj Sahni (COO, Medanta Medicity)– McKinsey team (Claudia Suessmuth-Dyckerhoff, Mandar Vaidya, Chirag Adatia, Ankur
Puri, Prakash Deep Maheshwari)
▪ Discussion on the key themes for healthcare in India over the last decade▪ Detailed brainstorming discussion on key themes for the private provider industry that
will have implications on the way forward – 8 clear areas emerged from this discussion
▪ Exercise on determining the future priority and current performance levels for each of these 8 areas for the industry
▪ Detailed brainstorming discussion on 5 key ‘internal’ performance areas for hospitals, followed by a self-assessment of where the organisation stands on each of these areas
▪ Discussion on next steps and option to jointly undertake dipstick diagnostic for the performance areas to provide deeper perspective into provider industry
Attendees
Topics covered
SOURCE: Workshop conducted by McKinsey with Provider Advisory Group, October 25, 2012

96
TOTAL HEALTH EXPENDITURE ESTIMATESThere are multiple data sources available for India’s total healthcare expenditure. There are slight differences in reported data from these sources. We have used WHO National Health Accounts as a standard across this report for all references to total health expenditures, GDP, and share of government spend, unless specified otherwise.
Eight areas that matter to private providers
SOURCE: Workshop conducted by McKinsey with Provider Advisory Group, October 25, 2012
Areas Emerging themes
▪ While access to capital is easy, efficient deployment of capital has become a big challenge▪ Managing capital costs such as land, construction etc. will require strong project execution skills and
leveraging learnings (such as pre-fab, standardisation) from industries such as hotels
▪ Integrating traditional system practitioners can help solve workforce shortage, with appropriate training▪ With rapid urbanisation, rising patient awareness and standardisation of practices, provider model
will likely shift from ‘doctor pull’ to ‘provider brand pull’
▪ Rising costs of utilities as well as other operating costs are leading to severe margin pressures; hospitals should be provided infrastructure status to ease cost pressures
▪ Potential for consolidation in the industry (formal or informal) and streamlining of the value chain
▪ Increasing revenue will require pulling multiple levers such as clear doctor model and incentive structure, scientific pricing and developing the provider brand
▪ Creating patient trust is critical to fix patient funnel; it may require transparency, awareness programs▪ Potential to lose international patients to other countries that are improving their health systems
▪ Setting up protocols of care and standardising practices can help improve productivity▪ Innovative use of technology, right siting and right skilling of care will improve capital and
workforce productivity
▪ Stronger self-regulation and inter-provider collaboration can help the industry liaise better with government, as well as other parts of the value chain
▪ An industry association should take up issues which are unsuitable for individual organisations
▪ Increased transparency on relevant metrics that are easy to understand for patients ▪ Aligning doctor incentives and patient interests to create trust-based doctor-patient relationships
Capital efficiency
Medical talent
Costs
Revenue ramp-up
Improved productivity/ operational efficiency
Single voice in the industry
Ethics and values
▪ Business models have to be customised by location, by specialty and by type of care (primary, secondary or tertiary); one-size-fit-all solutions are not working
▪ Business planning must precede and inform decisions on investments and project planning▪ Center of care can shift out of hospitals towards homes
Business model customisation1
2
3
4
5
6
7
8
Total Healthcare Expenditure (THE) for India from various sources
Twelfth Five-Year Plan1.09NA
World Bank1.181.27
WHO1.181.15Per centPublic spend as a percentage of GDP
World Bank29.227.5
WHO29.226.0Per centPublic spend as a percentage of THE
World Bank4.04.6
WHO4.04.4Per centTHE as percentage of GDP
Source20102000Units
SOURCE: World Bank database, World Development Indicators (WDI) covering 214 countries from 1960 to 2011 with 331 indicators; World Health Organisation, Global Health Expenditure Database


Healthcare Systems and ServicesDecember 2012 Design by Visual Aids IndiaCopyright © McKinsey & Company www.mckinsey.com