Healthcare M&A Report - Hyde Park CapitalP 500 Nasdaq S&P Global Healthcare Index ... Capital...
16
Healthcare M&A Report Q4 2012 HYDE PARK CAPITAL Member FINRA/SIPC Investment Banking | Mergers & Acquisitions | Capital Raising Hyde Park Capital Advisors, LLC 701 N. Franklin Street Tampa, FL 33602 Tel: 813-383-0202 www.hydeparkcapital.com John Hill Senior Managing Director [email protected] (813) 383-0205 John McDonald Senior Managing Director [email protected] (813) 383-0206 Keith Hodgdon Senior Vice President [email protected] (813) 383-0208 Jeffrey Bridge Vice President [email protected] (813) 383-0204 Michael Mariani Associate [email protected] (813) 597-2649 Jennifer Paul Associate [email protected] (813) 383-0203
Transcript of Healthcare M&A Report - Hyde Park CapitalP 500 Nasdaq S&P Global Healthcare Index ... Capital...

Healthcare M&A Report
Q4 2012
HYDE PARK CAPITAL
Member FINRA/SIPC
Investment Banking | Mergers & Acquisitions | Capital Raising
Hyde Park Capital Advisors, LLC 701 N. Franklin Street
Tampa, FL 33602 Tel: 813-383-0202
www.hydeparkcapital.com
John Hill Senior Managing Director [email protected] (813) 383-0205 John McDonald Senior Managing Director [email protected] (813) 383-0206 Keith Hodgdon Senior Vice President [email protected] (813) 383-0208 Jeffrey Bridge Vice President [email protected] (813) 383-0204 Michael Mariani Associate [email protected] (813) 597-2649 Jennifer Paul Associate [email protected] (813) 383-0203

HYDE PARK CAPITAL Investment Banking | Mergers & Acquisitions | Capital Raising
80%
90%
100%
110%
120%
130%
140%
Dec-11 Mar-12 Jun-12 Sep-12 Dec-12
S&P 500 Nasdaq S&P Global Healthcare Index
Public Market Performance (LTM)
Select Public Offerings – Healthcare (Q4 2012)
Public Company Market Performance by Sector
Source: S&P Capital IQ
2
Capital Markets Overview – Healthcare
($ in millions)
Major market indices including the S&P 500, S&P Global Healthcare Index and Nasdaq increased approximately 12%, 13% and 14%, respectively, over the 12-month period ending December 31, 2012.
As detailed in the table on the right, the equity markets displayed overall strength and investor demand, primarily in the Biotechnology sector, as several public equity offerings were successfully completed during Q4 2012.
From a valuation perspective, the high-growth Healthcare Technology sector continued to trade at relatively strong multiples of revenue (3.0x) and EBITDA (12.5x), followed by the Healthcare Equipment & Supplies sector at multiples of revenue (2.6x) and EBITDA (9.5x).
Commentary
14.0%
11.7%
12.9%
Offer Date Issuer Industry Sector IPO / Secondary Offering Size
12/10/12 HCA Holdings, Inc. Healthcare Facilities Secondary $1,056
12/19/12 Team Health Holdings, Inc. Healthcare Services Secondary $232
12/13/12 Infinity Pharmaceuticals, Inc. Biotechnology Secondary $150
10/03/12 Rigel Pharmaceuticals, Inc. Biotechnology Secondary $130
12/13/12 Sarepta Therapeutics, Inc. Biotechnology Secondary $125
10/18/12 Puma Biotechnology, Inc. Biotechnology Secondary $120
10/10/12 Intercept Pharmaceuticals, Inc. Biotechnology IPO $75
10/10/12 Kythera Biopharmaceuticals, Inc. Biotechnology IPO $70
10/04/12 Regulus Therapeutics, Inc. Biotechnology IPO $45
11/14/12 MAKO Surgical Corp. Healthcare Equipment Secondary $40
Industry Sector 3 Months 12 months Revenue EBITDA
Healthcare Facilities (3.3%) 34.9% 0.9x 6.7x
Healthcare Services (1.7%) 13.9% 1.7x 8.4x
Managed Healthcare 1.7% 2.2% 0.3x 5.3x
Healthcare Technology (6.7%) (0.3%) 3.0x 12.5x
Healthcare Equipment & Supplies (1.8%) 12.8% 2.6x 9.5x
Healthcare Distribution 7.5% 12.5% 0.3x 8.0x
Median
Change in Stock Price Enterprise Value / LTM
HYDE PARK CAPITAL Investment Banking | Mergers & Acquisitions | Capital Raising
$0
$10
$20
$30
$40
$50
$60
2003 2004 2005 2006 2007 2008 2009 2010 2011 2012
$20.2$22.2
$33.8$32.4
$46.0
$33.8
$22.2
$43.7
$48.3
$39.3
0
50
100
150
200
250
300
350
400
2003 2004 2005 2006 2007 2008 2009 2010 2011 2012
147
182
264 268
320
280
188
303
349
285
Middle Market Purchase Multiples – Enterprise Value / EBITDA
U.S. Middle Market M&A Activity – Annual Trends: VOLUME U.S. Middle Market M&A Activity – Annual Trends: VALUE
To
tal T
ran
sact
ion
Vo
lum
e
To
tal T
ran
sact
ion
Val
ue
($ i
n b
illi
ons)
Annual Middle Market M&A Activity – Healthcare
3
Commentary
Source: S&P Capital IQ (middle market includes all closed deals with disclosed deal value between $10 million and $1 billion). Middle market purchase multiples exclude healthcare technology transactions.
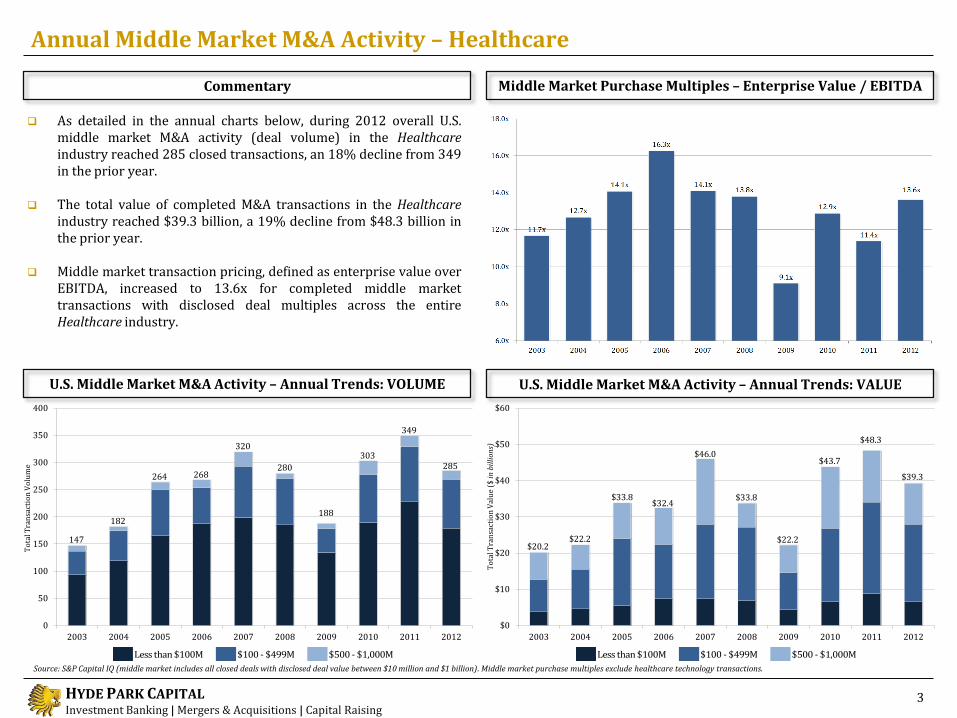
As detailed in the annual charts below, during 2012 overall U.S. middle market M&A activity (deal volume) in the Healthcare industry reached 285 closed transactions, an 18% decline from 349 in the prior year.
The total value of completed M&A transactions in the Healthcare industry reached $39.3 billion, a 19% decline from $48.3 billion in the prior year.
Middle market transaction pricing, defined as enterprise value over
EBITDA, increased to 13.6x for completed middle market transactions with disclosed deal multiples across the entire Healthcare industry.
Less than $100M $100 - $499M $500 - $1,000M Less than $100M $100 - $499M $500 - $1,000M
HYDE PARK CAPITAL Investment Banking | Mergers & Acquisitions | Capital Raising
Quarterly Middle Market M&A Activity – Healthcare
U.S. Middle Market M&A Activity – Quarterly Trends: VALUE U.S. Middle Market M&A Activity – Quarterly Trends: VOLUME
Middle Market M&A Transactions by Deal Size – Healthcare
($ in billions)
To
tal T
ran
sact
ion
Val
ue
($ i
n b
illi
ons)
4
Commentary
Source: S&P Capital IQ (middle market includes all closed deals with disclosed deal value between $10 million and $1 billion)
Less than $100M $100 - $499M $500 - $1,000MLess than $100M $100 - $499M $500 - $1,000M
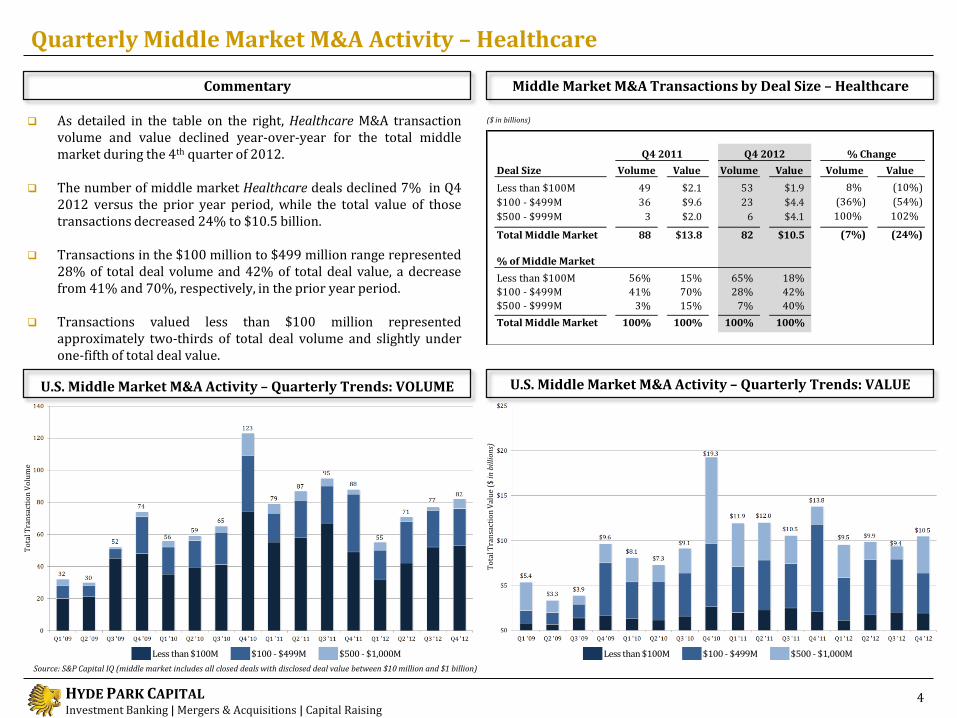
As detailed in the table on the right, Healthcare M&A transaction volume and value declined year-over-year for the total middle market during the 4th quarter of 2012.
The number of middle market Healthcare deals declined 7% in Q4 2012 versus the prior year period, while the total value of those transactions decreased 24% to $10.5 billion.
Transactions in the $100 million to $499 million range represented 28% of total deal volume and 42% of total deal value, a decrease from 41% and 70%, respectively, in the prior year period.
Transactions valued less than $100 million represented approximately two-thirds of total deal volume and slightly under one-fifth of total deal value.
To
tal T
ran
sact
ion
Vo
lum
e
Deal Size Volume Value Volume Value Volume Value
Less than $100M 49 $2.1 53 $1.9 8% (10%)
$100 - $499M 36 $9.6 23 $4.4 (36%) (54%)
$500 - $999M 3 $2.0 6 $4.1 100% 102%
Total Middle Market 88 $13.8 82 $10.5 (7%) (24%)
% of Middle Market
Less than $100M 56% 15% 65% 18%
$100 - $499M 41% 70% 28% 42%
$500 - $999M 3% 15% 7% 40%
Total Middle Market 100% 100% 100% 100%
Q4 2011 Q4 2012 % Change

HYDE PARK CAPITAL Investment Banking | Mergers & Acquisitions | Capital Raising
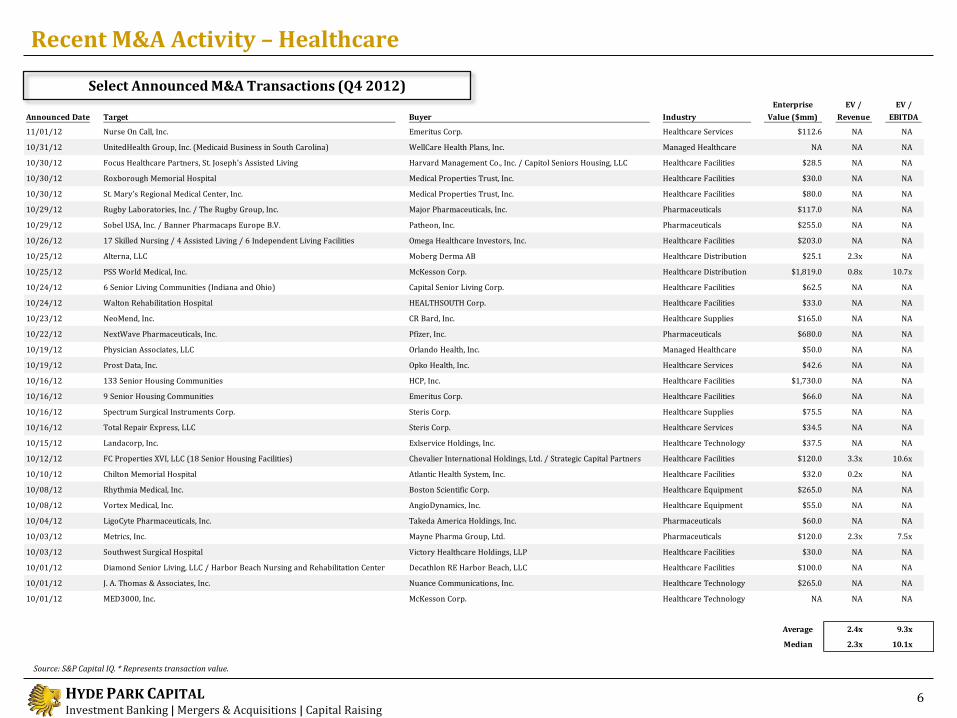
Recent M&A Activity – Healthcare
Select Announced M&A Transactions (Q4 2012)
5
Source: S&P Capital IQ. * Excluded from median and average calculations.
Announced Date Target Buyer Industry
Enterprise
Value ($mm)
EV /
Revenue
EV /
EBITDA
12/27/12 Liquent, Inc. PAREXEL International Corp. Healthcare Technology $72.0 NA NA
12/21/12 Invacare Supply Group, Inc. AssuraMed Holding, Inc. Healthcare Equipment $150.0 0.5x NA
12/20/12 King Systems Corp. Ambu A/S Healthcare Equipment $170.0 1.2x NA
12/19/12 MicroSurgical Technology, Inc. Halma plc Healthcare Equipment $100.0 4.9x NA
12/18/12 Mobile Emergency Group, P.C. Team Health Holdings, Inc. Healthcare Services NA NA NA
12/17/12 Diagnostic Clinic Medical Group, P.A. Blue Cross and Blue Shield of Florida, Inc. Healthcare Facilities NA NA NA
12/13/12 HomeChoice Partners, Inc. BioScrip, Inc. Healthcare Services $90.0 1.3x NA
12/12/12 Incline Therapeutics, Inc. The Medicines Co. Pharmaceuticals $390.0 NA NA
12/10/12 The Medical Center of Newark, LLC Licking Memorial Hospital Healthcare Facilities $26.0 NA NA
12/04/12 Alta Oakridge Property (North Raleigh) / Alta Walk Property (Durham) Capitol Seniors Housing, LLC Healthcare Facilities $47.5 NA NA
12/04/12 Young Innovations, Inc. Linden, LLC Healthcare Equipment $305.4 2.8x 10.4x
12/03/12 Crux Biomedical, Inc. Volcano Corp. Healthcare Equipment $39.0 NA NA
12/03/12 Solamor Hospice, Inc. National Hospice Holdings, LLC Healthcare Services $85.0 NA NA
11/29/12 St. Mary Health Corp. Prime Healthcare Services, Inc. Healthcare Facilities $85.0 NA NA
11/28/12 Healthpoint, Ltd. Smith & Nephew plc Pharmaceuticals $782.0 5.2x NA
11/27/12 Amicare Behavioral Centers, LLC Acadia Vista, LLC Healthcare Facilities $113.0 1.8x NA
11/27/12 Behavioral Centers of America, LLC Acadia Healthcare Co., Inc. Healthcare Facilities $145.0 2.7x 20.2x*
11/26/12 Thomas Medical Products, Inc. Merit Medical Systems, Inc. Healthcare Equipment $167.0 4.5x 10.1x
11/19/12 BioMimetic Therapeutics, Inc. Wright Medical Group, Inc. Biotechnology $332.7 NM NM
11/16/12 GLT Medical Services, Ltd. IPC The Hospitalist Co., Inc. Healthcare Services NA NA NA
11/16/12 SkinMedica, Inc. Allergan, Inc. Pharmaceuticals $375.0 NA NA
11/14/12 Arkansas Surgical Hospital, LLC Medical Facilities Corp. Healthcare Facilities $71.0 NA NA
11/14/12 Cypress Pharmaceutical, Inc. Pernix Therapeutics Holdings, Inc. Pharmaceuticals $152.0 NA NA
11/13/12 Park Royal Hospital Acadia Healthcare Co., Inc. Healthcare Facilities $33.4 NA NA
11/12/12 Shaser Bioscience, Inc. Spectrum Brands Holdings, Inc. Healthcare Equipment $89.3 NA NA
11/11/12 Reach Medical Holdings, Inc. Air Medical Group Holdings, Inc. Healthcare Services $240.0 NA NA
11/08/12 DUSA Pharmaceuticals, Inc. Caraco Pharmaceutical Laboratories, Ltd. Biotechnology $191.0 3.8x 26.5x*
11/08/12 Fortitech, Inc. Royal DSM N.V. Pharmaceuticals $634.0 NA NA
11/08/12 Vessix Vascular, Inc. Boston Scientific Corp. Healthcare Equipment $425.0 NA NA
11/06/12 Envoy Therapeutics, Inc. Takeda America Holdings, Inc. Pharmaceuticals $140.0 NA NA
11/05/12 Certify Data Systems, Inc. Humana, Inc. Healthcare Technology NA NA NA
11/05/12 Metropolitan Health Networks, Inc. Humana, Inc. Healthcare Services $740.8 1.0x 7.7x
11/02/12 SPSmedical Supply Corp. Crosstex International, Inc. Healthcare Services $36.0 2.1x 8.4x
HYDE PARK CAPITAL Investment Banking | Mergers & Acquisitions | Capital Raising
Recent M&A Activity – Healthcare
Select Announced M&A Transactions (Q4 2012)
6
Source: S&P Capital IQ. * Represents transaction value.
Announced Date Target Buyer Industry
Enterprise
Value ($mm)
EV /
Revenue
EV /
EBITDA
11/01/12 Nurse On Call, Inc. Emeritus Corp. Healthcare Services $112.6 NA NA
10/31/12 UnitedHealth Group, Inc. (Medicaid Business in South Carolina) WellCare Health Plans, Inc. Managed Healthcare NA NA NA
10/30/12 Focus Healthcare Partners, St. Joseph's Assisted Living Harvard Management Co., Inc. / Capitol Seniors Housing, LLC Healthcare Facilities $28.5 NA NA
10/30/12 Roxborough Memorial Hospital Medical Properties Trust, Inc. Healthcare Facilities $30.0 NA NA
10/30/12 St. Mary's Regional Medical Center, Inc. Medical Properties Trust, Inc. Healthcare Facilities $80.0 NA NA
10/29/12 Rugby Laboratories, Inc. / The Rugby Group, Inc. Major Pharmaceuticals, Inc. Pharmaceuticals $117.0 NA NA
10/29/12 Sobel USA, Inc. / Banner Pharmacaps Europe B.V. Patheon, Inc. Pharmaceuticals $255.0 NA NA
10/26/12 17 Skilled Nursing / 4 Assisted Living / 6 Independent Living Facilities Omega Healthcare Investors, Inc. Healthcare Facilities $203.0 NA NA
10/25/12 Alterna, LLC Moberg Derma AB Healthcare Distribution $25.1 2.3x NA
10/25/12 PSS World Medical, Inc. McKesson Corp. Healthcare Distribution $1,819.0 0.8x 10.7x
10/24/12 6 Senior Living Communities (Indiana and Ohio) Capital Senior Living Corp. Healthcare Facilities $62.5 NA NA
10/24/12 Walton Rehabilitation Hospital HEALTHSOUTH Corp. Healthcare Facilities $33.0 NA NA
10/23/12 NeoMend, Inc. CR Bard, Inc. Healthcare Supplies $165.0 NA NA
10/22/12 NextWave Pharmaceuticals, Inc. Pfizer, Inc. Pharmaceuticals $680.0 NA NA
10/19/12 Physician Associates, LLC Orlando Health, Inc. Managed Healthcare $50.0 NA NA
10/19/12 Prost Data, Inc. Opko Health, Inc. Healthcare Services $42.6 NA NA
10/16/12 133 Senior Housing Communities HCP, Inc. Healthcare Facilities $1,730.0 NA NA
10/16/12 9 Senior Housing Communities Emeritus Corp. Healthcare Facilities $66.0 NA NA
10/16/12 Spectrum Surgical Instruments Corp. Steris Corp. Healthcare Supplies $75.5 NA NA
10/16/12 Total Repair Express, LLC Steris Corp. Healthcare Services $34.5 NA NA
10/15/12 Landacorp, Inc. Exlservice Holdings, Inc. Healthcare Technology $37.5 NA NA
10/12/12 FC Properties XVI, LLC (18 Senior Housing Facilities) Chevalier International Holdings, Ltd. / Strategic Capital Partners Healthcare Facilities $120.0 3.3x 10.6x
10/10/12 Chilton Memorial Hospital Atlantic Health System, Inc. Healthcare Facilities $32.0 0.2x NA
10/08/12 Rhythmia Medical, Inc. Boston Scientific Corp. Healthcare Equipment $265.0 NA NA
10/08/12 Vortex Medical, Inc. AngioDynamics, Inc. Healthcare Equipment $55.0 NA NA
10/04/12 LigoCyte Pharmaceuticals, Inc. Takeda America Holdings, Inc. Pharmaceuticals $60.0 NA NA
10/03/12 Metrics, Inc. Mayne Pharma Group, Ltd. Pharmaceuticals $120.0 2.3x 7.5x
10/03/12 Southwest Surgical Hospital Victory Healthcare Holdings, LLP Healthcare Facilities $30.0 NA NA
10/01/12 Diamond Senior Living, LLC / Harbor Beach Nursing and Rehabilitation Center Decathlon RE Harbor Beach, LLC Healthcare Facilities $100.0 NA NA
10/01/12 J. A. Thomas & Associates, Inc. Nuance Communications, Inc. Healthcare Technology $265.0 NA NA
10/01/12 MED3000, Inc. McKesson Corp. Healthcare Technology NA NA NA
Average 2.4x 9.3x
Median 2.3x 10.1x

HYDE PARK CAPITAL Investment Banking | Mergers & Acquisitions | Capital Raising
Metropolitan Health Networks, Inc. (NYSE:MDF) is a Medical Services Organization that provides and coordinates medical care for approximately 87,500 Medicare Advantage, Medicaid, and other beneficiaries, primarily in Florida.
On December 21, 2012 Humana, Inc. (NYSE:HUM) completed the acquisition of Metropolitan Health Networks, Inc. in a transaction valued at over $740 million.
Under the terms of the agreement, Metropolitan shareholders received $11.25 per share in cash from Humana for each Metropolitan share held. Humana also repaid all of Metropolitan’s outstanding debt. Humana financed the transaction primarily through the recent issuance of senior notes.
Recent M&A Transactions Profiled – Healthcare
Transaction Details PSS World Medical, Inc. (NasdaqGS:PSSI)
Transaction Details
7
Metropolitan Health Networks, Inc. (NYSE:MDF)
PSS World Medical, Inc. (NasdaqGS:PSSI) markets and distributes medical products and services to frontline caregivers throughout the United States.
On October 25, 2012 McKesson Corporation (NYSE:MCK) announced that it had entered into a definitive agreement to acquire PSS World Medical in a transaction valued at over $1.8 billion.
Under the terms of the agreement, McKesson will assume PSS World Medical’s outstanding debt and will acquire all outstanding shares of PSS World Medical for $29.00 per share in cash. The price of $29.00 per share represents a premium of 34% over PSS World Medical’s share price of $21.60 on October 24, 2012.
($ in millions)
LTM
Income Statement 9/30/12 Equity Value $498.1
Revenue $755.0 Net Assumed Liabilities $242.1
EBITDA $96.1 Total Rights/Warrants/Options $0.6
Net Income $22.4 Implied Enterprise Value $740.8
As of
Balance Sheet 9/30/12 Implied Purchase Multiples
Cash $54.8 Revenue 1.0x
Debt $296.9 EBITDA 7.7x
Net Debt $242.1 Net Income 22.2x
Financial Profile Transaction Analysis
($ in millions)
LTM
Income Statement 9/30/12 Implied Equity Value $1,477.0
Revenue $2,160.0 Net Assumed Liabilities $341.1
EBITDA $169.4 Total Rights/Warrants/Options $1.0
Net Income $69.6 Implied Enterprise Value $1,819.0
As of
Balance Sheet 9/30/12 Implied Purchase Multiples
Cash $122.4 Revenue 0.8x
Debt $459.8 EBITDA 10.7x
Net Debt $337.5 Net Income 21.2x
Financial Profile Transaction Analysis

HYDE PARK CAPITAL Investment Banking | Mergers & Acquisitions | Capital Raising
$13.5
$0.8
$9.4
$2.2
$5.6
$7.7
$17.3
$0.9
$8.1
$3.4
$7.5
$11.1
$0.0 $2.0 $4.0 $6.0 $8.0 $10.0 $12.0 $14.0 $16.0 $18.0 $20.0
Pharmaceuticals, Biotechnology & Life Sciences
Healthcare Distribution
Healthcare Equipment & Supplies
Healthcare Technology
Healthcare Services
Healthcare Facilities
56
10
51
15
38
115
87
9
47
32
44
130
0 20 40 60 80 100 120 140
Pharmaceuticals, Biotechnology & Life Sciences
Healthcare Distribution
Healthcare Equipment & Supplies
Healthcare Technology
Healthcare Services
Healthcare Facilities
M&A Activity by Healthcare Sector
% Change
% Change
U.S. Middle Market M&A Activity by Healthcare Sector: VOLUME
8
Source: S&P Capital IQ (includes all closed deals with disclosed deal value between $10 million and $1 billion). *Managed Healthcare transactions are included in the Healthcare Services sector.
U.S. Middle Market M&A Activity by Healthcare Sector: VALUE
12%
14%
53%
36%
11%
9%
31%
25%
35%
22%
11%
16%
($ in millions)
2011 2012
2011 2012
*
*

HYDE PARK CAPITAL Investment Banking | Mergers & Acquisitions | Capital Raising
0
50
100
150
200
250
300
350
400
2011 2012
349
285
19%
81%
24%
76%
$0
$10
$20
$30
$40
$50
$60
2011 2012
$48
$39
83%
15% 17%
85%
Select Private Equity M&A Transactions (Q4 2012)
Financial Sponsors vs. Strategic Buyers
Private Equity Activity – Healthcare
Financial Sponsor Strategic Buyer Financial Sponsor Strategic Buyer
To
tal T
ran
sact
ion
Vo
lum
e
To
tal T
ran
sact
ion
Val
ue
($ in
bil
lio
ns)
9
($ in millions)
Commentary
Source: S&P Capital IQ (includes all closed deals with disclosed deal value between $10 million and $1 billion).
Financial sponsors remained active across all sectors of the Healthcare industry in the 4th quarter of 2012, as shown in the table on the right.
Several notable transactions were announced during the 4th quarter including Warburg Pincus’s acquisition of JHP Pharmaceuticals, LLC for $195 million, American Capital’s buyout of Cambridge Major Laboratories, Inc. for $212 million and Salt Creek Capital’s acquisition of Boyd Industries, Inc. for an undisclosed amount where Hyde Park Capital served as Boyd’s exclusive investment banker.
During 2012, financial sponsors participated in 24% of deals and accounted for 17% of total transaction value.
Announced Date Target Buyer Industry Transaction Value
12/31/12 JHP Pharmaceuticals, LLC Warburg Pincus Pharmaceuticals $195
12/27/12 Cambridge Major Laboratories, Inc. American Capital Pharmaceuticals $212
12/21/12 ATI Holdings, LLC KRG Capital Partners Healthcare Services NA
12/17/12 Eye Health Vision Centers, LLCPlexus Capital /
Koch Eye Associates, Inc.Healthcare Facilities NA
12/17/12 Vital Decisions, LLC MTS Health Investors Healthcare Services NA
12/07/12 Boyd Industries, Inc. Salt Creek Capital Healthcare Equipment NA
11/23/12 HomeCare I.V. of Bend, Inc. Shore Capital Partners Healthcare Services NA
11/14/12 Arcadia Solutions, LLC Ferrer Freeman & Co. Healthcare Technology NA
11/08/12 Best Practice Disease Management, Inc. LLM Capital Partners /
Hickory Ridge CapitalHealthcare Services NA
11/07/12 Access Scientific, Inc. Endeavour Capital Healthcare Supplies NA
11/06/12 Sage Products, Inc. Madison Dearborn Partners Healthcare Supplies NA
10/25/12 ProNerve, LLC Waud Capital Partners Healthcare Services NA
10/22/12 CHG Healthcare Services, Inc.Ares Management /
Leonard Green & PartnersHealthcare Services NA
10/17/12 Willow Street Medical Laboratory, LLC Ampersand Capital Partners Healthcare Services NA
10/15/12 SH Franchising, LLC Levine Leichtman Capital Partners Healthcare Services NA
10/12/12 ABB CONCISE Optical Group, LLC New Mountain Capital Healthcare Distribution NA
10/11/12 Home Solutions, Inc. KRG Capital Partners Healthcare Services NA

HYDE PARK CAPITAL Investment Banking | Mergers & Acquisitions | Capital Raising
80%
90%
100%
110%
120%
130%
140%
Dec-11 Mar-12 Jun-12 Sep-12 Dec-12
S&P 500 Managed Healthcare
80%
90%
100%
110%
120%
130%
140%
Dec-11 Mar-12 Jun-12 Sep-12 Dec-12
S&P 500 Healthcare Services
80%
90%
100%
110%
120%
130%
140%
Dec-11 Mar-12 Jun-12 Sep-12 Dec-12
S&P 500 Healthcare Facilities
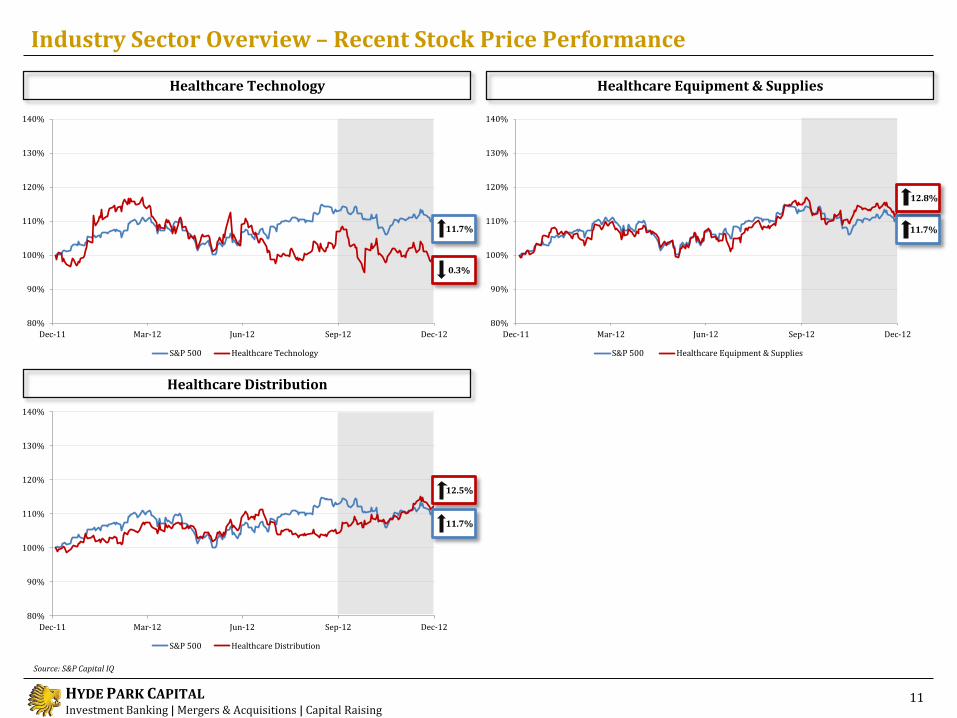
Industry Sector Overview – Recent Stock Price Performance
Healthcare Services
Commentary
10
Healthcare Facilities
Managed Healthcare
Source: S&P Capital IQ
The charts included on the following pages detail the recent stock price performance by sector for the leading public companies within the Healthcare industry for the 12-month period ended December 31, 2012. The shaded section is the most recent 3-month period (Q4).
For the 12-month period, besides the Healthcare Technology sector, all sector indices in the Healthcare industry experienced positive performance led by the Healthcare Facilities and Healthcare Services sectors (up 34.9% and 13.9%, respectively). During the 3-month period ended December 31, 2012 (Q4), the Managed Healthcare and Healthcare Distribution sectors increased, while the Healthcare Facilities, Healthcare Services, Healthcare Technology and Healthcare Equipment & Supplies sectors decreased.
11.7%
34.9%
13.9%
11.7%
2.2%
11.7%
HYDE PARK CAPITAL Investment Banking | Mergers & Acquisitions | Capital Raising
80%
90%
100%
110%
120%
130%
140%
Dec-11 Mar-12 Jun-12 Sep-12 Dec-12
S&P 500 Healthcare Distribution
80%
90%
100%
110%
120%
130%
140%
Dec-11 Mar-12 Jun-12 Sep-12 Dec-12
S&P 500 Healthcare Equipment & Supplies
80%
90%
100%
110%
120%
130%
140%
Dec-11 Mar-12 Jun-12 Sep-12 Dec-12
S&P 500 Healthcare Technology
Industry Sector Overview – Recent Stock Price Performance
Healthcare Distribution
Healthcare Technology
11
Healthcare Equipment & Supplies
Source: S&P Capital IQ
11.7%
12.8%
12.5%
11.7%
11.7%
0.3%
HYDE PARK CAPITAL Investment Banking | Mergers & Acquisitions | Capital Raising
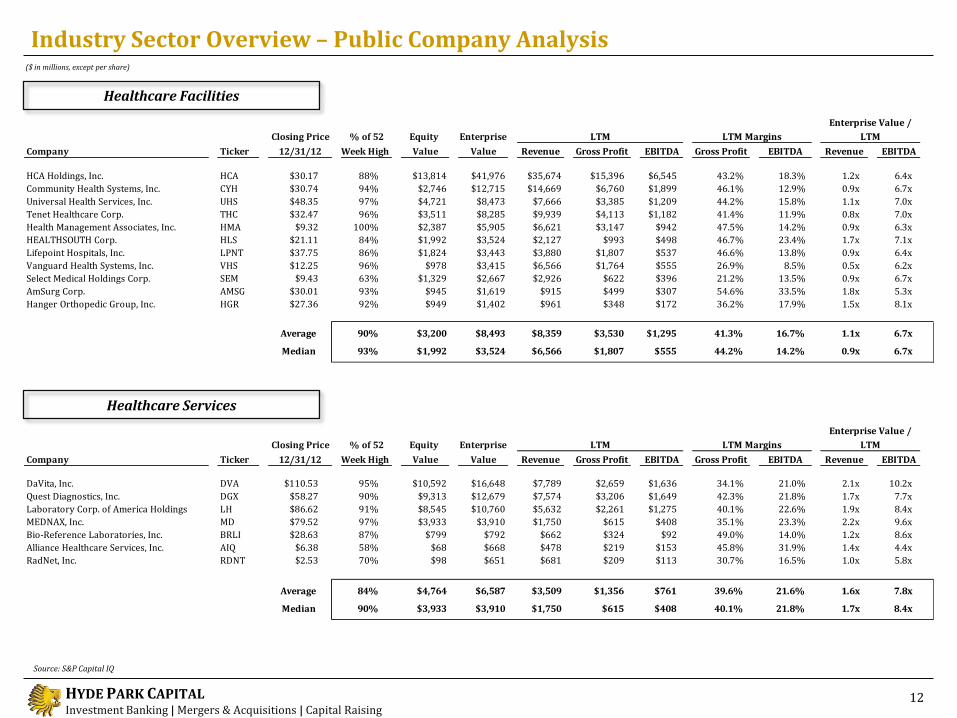
Industry Sector Overview – Public Company Analysis
Healthcare Facilities
($ in millions, except per share)
12
Source: S&P Capital IQ
Healthcare Services
Closing Price % of 52 Equity Enterprise
Company Ticker 12/31/12 Week High Value Value Revenue Gross Profit EBITDA Gross Profit EBITDA Revenue EBITDA
DaVita, Inc. DVA $110.53 95% $10,592 $16,648 $7,789 $2,659 $1,636 34.1% 21.0% 2.1x 10.2x
Quest Diagnostics, Inc. DGX $58.27 90% $9,313 $12,679 $7,574 $3,206 $1,649 42.3% 21.8% 1.7x 7.7x
Laboratory Corp. of America Holdings LH $86.62 91% $8,545 $10,760 $5,632 $2,261 $1,275 40.1% 22.6% 1.9x 8.4x
MEDNAX, Inc. MD $79.52 97% $3,933 $3,910 $1,750 $615 $408 35.1% 23.3% 2.2x 9.6x
Bio-Reference Laboratories, Inc. BRLI $28.63 87% $799 $792 $662 $324 $92 49.0% 14.0% 1.2x 8.6x
Alliance Healthcare Services, Inc. AIQ $6.38 58% $68 $668 $478 $219 $153 45.8% 31.9% 1.4x 4.4x
RadNet, Inc. RDNT $2.53 70% $98 $651 $681 $209 $113 30.7% 16.5% 1.0x 5.8x
Average 84% $4,764 $6,587 $3,509 $1,356 $761 39.6% 21.6% 1.6x 7.8x
Median 90% $3,933 $3,910 $1,750 $615 $408 40.1% 21.8% 1.7x 8.4x
Enterprise Value /
LTM LTM Margins LTM
Closing Price % of 52 Equity Enterprise
Company Ticker 12/31/12 Week High Value Value Revenue Gross Profit EBITDA Gross Profit EBITDA Revenue EBITDA
HCA Holdings, Inc. HCA $30.17 88% $13,814 $41,976 $35,674 $15,396 $6,545 43.2% 18.3% 1.2x 6.4x
Community Health Systems, Inc. CYH $30.74 94% $2,746 $12,715 $14,669 $6,760 $1,899 46.1% 12.9% 0.9x 6.7x
Universal Health Services, Inc. UHS $48.35 97% $4,721 $8,473 $7,666 $3,385 $1,209 44.2% 15.8% 1.1x 7.0x
Tenet Healthcare Corp. THC $32.47 96% $3,511 $8,285 $9,939 $4,113 $1,182 41.4% 11.9% 0.8x 7.0x
Health Management Associates, Inc. HMA $9.32 100% $2,387 $5,905 $6,621 $3,147 $942 47.5% 14.2% 0.9x 6.3x
HEALTHSOUTH Corp. HLS $21.11 84% $1,992 $3,524 $2,127 $993 $498 46.7% 23.4% 1.7x 7.1x
Lifepoint Hospitals, Inc. LPNT $37.75 86% $1,824 $3,443 $3,880 $1,807 $537 46.6% 13.8% 0.9x 6.4x
Vanguard Health Systems, Inc. VHS $12.25 96% $978 $3,415 $6,566 $1,764 $555 26.9% 8.5% 0.5x 6.2x
Select Medical Holdings Corp. SEM $9.43 63% $1,329 $2,667 $2,926 $622 $396 21.2% 13.5% 0.9x 6.7x
AmSurg Corp. AMSG $30.01 93% $945 $1,619 $915 $499 $307 54.6% 33.5% 1.8x 5.3x
Hanger Orthopedic Group, Inc. HGR $27.36 92% $949 $1,402 $961 $348 $172 36.2% 17.9% 1.5x 8.1x
Average 90% $3,200 $8,493 $8,359 $3,530 $1,295 41.3% 16.7% 1.1x 6.7x
Median 93% $1,992 $3,524 $6,566 $1,807 $555 44.2% 14.2% 0.9x 6.7x
Enterprise Value /
LTM LTM Margins LTM
HYDE PARK CAPITAL Investment Banking | Mergers & Acquisitions | Capital Raising
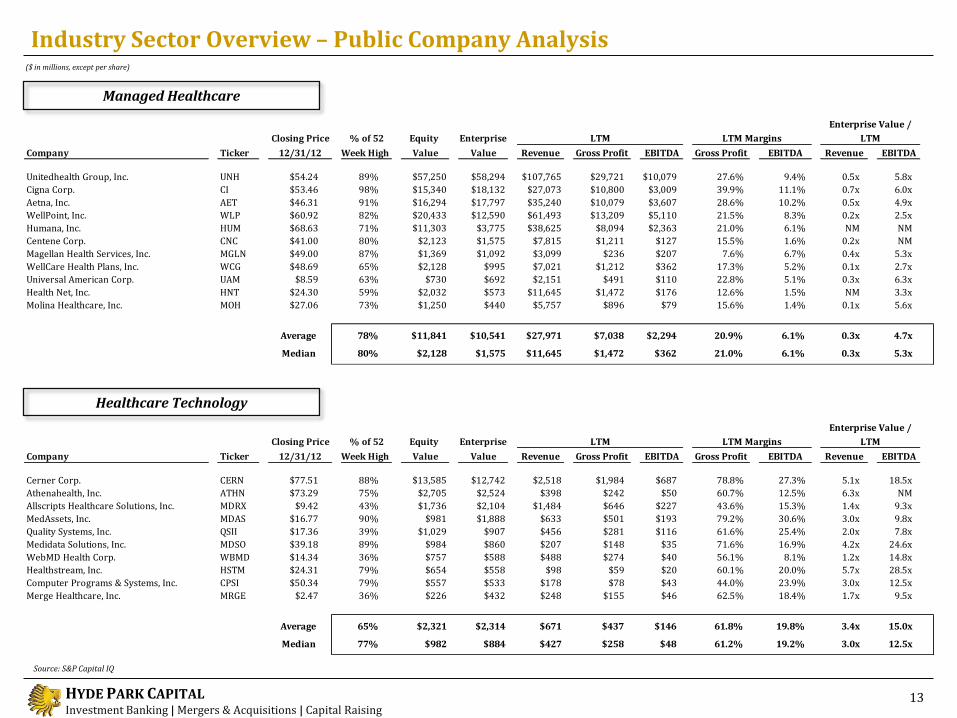
Industry Sector Overview – Public Company Analysis
Managed Healthcare
($ in millions, except per share)
13
Source: S&P Capital IQ
Healthcare Technology
Closing Price % of 52 Equity Enterprise
Company Ticker 12/31/12 Week High Value Value Revenue Gross Profit EBITDA Gross Profit EBITDA Revenue EBITDA
Cerner Corp. CERN $77.51 88% $13,585 $12,742 $2,518 $1,984 $687 78.8% 27.3% 5.1x 18.5x
Athenahealth, Inc. ATHN $73.29 75% $2,705 $2,524 $398 $242 $50 60.7% 12.5% 6.3x NM
Allscripts Healthcare Solutions, Inc. MDRX $9.42 43% $1,736 $2,104 $1,484 $646 $227 43.6% 15.3% 1.4x 9.3x
MedAssets, Inc. MDAS $16.77 90% $981 $1,888 $633 $501 $193 79.2% 30.6% 3.0x 9.8x
Quality Systems, Inc. QSII $17.36 39% $1,029 $907 $456 $281 $116 61.6% 25.4% 2.0x 7.8x
Medidata Solutions, Inc. MDSO $39.18 89% $984 $860 $207 $148 $35 71.6% 16.9% 4.2x 24.6x
WebMD Health Corp. WBMD $14.34 36% $757 $588 $488 $274 $40 56.1% 8.1% 1.2x 14.8x
Healthstream, Inc. HSTM $24.31 79% $654 $558 $98 $59 $20 60.1% 20.0% 5.7x 28.5x
Computer Programs & Systems, Inc. CPSI $50.34 79% $557 $533 $178 $78 $43 44.0% 23.9% 3.0x 12.5x
Merge Healthcare, Inc. MRGE $2.47 36% $226 $432 $248 $155 $46 62.5% 18.4% 1.7x 9.5x
Average 65% $2,321 $2,314 $671 $437 $146 61.8% 19.8% 3.4x 15.0x
Median 77% $982 $884 $427 $258 $48 61.2% 19.2% 3.0x 12.5x
Enterprise Value /
LTM LTM Margins LTM
Closing Price % of 52 Equity Enterprise
Company Ticker 12/31/12 Week High Value Value Revenue Gross Profit EBITDA Gross Profit EBITDA Revenue EBITDA
Unitedhealth Group, Inc. UNH $54.24 89% $57,250 $58,294 $107,765 $29,721 $10,079 27.6% 9.4% 0.5x 5.8x
Cigna Corp. CI $53.46 98% $15,340 $18,132 $27,073 $10,800 $3,009 39.9% 11.1% 0.7x 6.0x
Aetna, Inc. AET $46.31 91% $16,294 $17,797 $35,240 $10,079 $3,607 28.6% 10.2% 0.5x 4.9x
WellPoint, Inc. WLP $60.92 82% $20,433 $12,590 $61,493 $13,209 $5,110 21.5% 8.3% 0.2x 2.5x
Humana, Inc. HUM $68.63 71% $11,303 $3,775 $38,625 $8,094 $2,363 21.0% 6.1% NM NM
Centene Corp. CNC $41.00 80% $2,123 $1,575 $7,815 $1,211 $127 15.5% 1.6% 0.2x NM
Magellan Health Services, Inc. MGLN $49.00 87% $1,369 $1,092 $3,099 $236 $207 7.6% 6.7% 0.4x 5.3x
WellCare Health Plans, Inc. WCG $48.69 65% $2,128 $995 $7,021 $1,212 $362 17.3% 5.2% 0.1x 2.7x
Universal American Corp. UAM $8.59 63% $730 $692 $2,151 $491 $110 22.8% 5.1% 0.3x 6.3x
Health Net, Inc. HNT $24.30 59% $2,032 $573 $11,645 $1,472 $176 12.6% 1.5% NM 3.3x
Molina Healthcare, Inc. MOH $27.06 73% $1,250 $440 $5,757 $896 $79 15.6% 1.4% 0.1x 5.6x
Average 78% $11,841 $10,541 $27,971 $7,038 $2,294 20.9% 6.1% 0.3x 4.7x
Median 80% $2,128 $1,575 $11,645 $1,472 $362 21.0% 6.1% 0.3x 5.3x
LTM Margins LTMLTM
Enterprise Value /

HYDE PARK CAPITAL Investment Banking | Mergers & Acquisitions | Capital Raising
Industry Sector Overview – Public Company Analysis
Healthcare Equipment & Supplies
($ in millions, except per share)
14
Source: S&P Capital IQ
Healthcare Distribution
Closing Price % of 52 Equity Enterprise
Company Ticker 12/31/12 Week High Value Value Revenue Gross Profit EBITDA Gross Profit EBITDA Revenue EBITDA
Medtronic, Inc. MDT $41.02 92% $42,780 $51,643 $16,318 $12,347 $5,447 75.7% 33.4% 3.2x 9.5x
Covidien plc COV $57.74 95% $28,062 $31,236 $11,852 $6,844 $3,273 57.7% 27.6% 2.6x 9.5x
Stryker Corp. SYK $54.82 96% $21,011 $18,917 $8,534 $5,793 $2,488 67.9% 29.2% 2.2x 7.6x
Zimmer Holdings, Inc. ZMH $66.66 96% $11,824 $12,075 $4,459 $3,340 $1,499 74.9% 33.6% 2.7x 8.1x
CR Bard, Inc. BCR $97.74 90% $8,327 $8,811 $2,947 $1,828 $948 62.0% 32.2% 3.0x 9.3x
DENTSPLY International, Inc. XRAY $39.61 96% $5,695 $7,514 $2,913 $1,525 $528 52.4% 18.1% 2.6x 14.2x
Varian Medical Systems, Inc. VAR $70.24 97% $7,970 $7,377 $2,807 $1,196 $658 42.6% 23.4% 2.6x 11.2x
Alere, Inc. ALR $18.50 68% $1,482 $5,388 $2,714 $1,409 $607 51.9% 22.4% 2.0x 8.9x
The Cooper Companies, Inc. COO $92.48 92% $4,546 $4,927 $1,445 $924 $400 63.9% 27.6% 3.4x 12.3x
Sirona Dental Systems, Inc. SIRO $64.46 100% $3,658 $3,586 $979 $524 $249 53.5% 25.4% 3.7x 14.4x
Steris Corp. STE $34.73 93% $2,027 $2,306 $1,439 $593 $301 41.2% 21.0% 1.6x 7.7x
Average 92% $12,489 $13,980 $5,128 $3,302 $1,491 58.5% 26.7% 2.7x 10.2x
Median 95% $7,970 $7,514 $2,913 $1,525 $658 57.7% 27.6% 2.6x 9.5x
Enterprise Value /
LTM LTM Margins LTM
Closing Price % of 52 Equity Enterprise
Company Ticker 12/31/12 Week High Value Value Revenue Gross Profit EBITDA Gross Profit EBITDA Revenue EBITDA
McKesson Corp. MCK $96.96 97% $23,755 $24,505 $123,186 $6,743 $2,960 5.5% 2.4% 0.2x 8.3x
Cardinal Health, Inc. CAH $41.18 93% $14,320 $14,711 $106,649 $4,616 $2,230 4.3% 2.1% 0.1x 6.6x
AmerisourceBergen Corp. ABC $43.18 98% $11,093 $11,473 $79,490 $2,654 $1,426 3.3% 1.8% 0.1x 8.0x
Henry Schein, Inc. HSIC $80.42 97% $7,260 $8,157 $8,872 $2,497 $738 28.1% 8.3% 0.9x 11.1x
Omnicare, Inc. OCR $36.10 98% $4,118 $5,502 $6,188 $1,466 $700 23.7% 11.3% 0.9x 7.9x
Patterson Companies, Inc. PDCO $34.23 94% $3,629 $3,904 $3,588 $1,170 $398 32.6% 11.1% 1.1x 9.8x
Owens & Minor, Inc. OMI $28.51 91% $1,792 $1,928 $8,779 $868 $251 9.9% 2.9% 0.2x 7.7x
PharMerica Corp. PMC $14.24 92% $424 $618 $1,895 $296 $104 15.6% 5.5% 0.3x 5.9x
Average 95% $8,299 $8,850 $42,331 $2,539 $1,101 15.4% 5.7% 0.5x 8.2x
Median 95% $5,689 $6,830 $8,825 $1,982 $719 12.8% 4.2% 0.3x 8.0x
LTM Margins
Enterprise Value /
LTM LTM

HYDE PARK CAPITAL Investment Banking | Mergers & Acquisitions | Capital Raising
Overview of the Transaction
Boyd is a leading manufacturer of examination and operatory equipment. The Company offers a full-service, one-stop-shop for operatory equipment and cabinetry to the orthodontic, pediatric dental and other specialty healthcare provider markets.
Salt Creek Capital is a San Francisco Bay area based private equity firm focused on making investments in profitable, middle market companies with $3 million to $50 million in revenue.
Hyde Park Capital’s Role
Hyde Park Capital marketed the opportunity to select strategic and financial sponsors and identified, negotiated and closed the transaction with Salt Creek Capital.
has been acquired by
Featured Hyde Park Capital Transactions
Boyd Industries, Inc. has been acquired by Salt Creek Capital
Diagnostic Clinic Medical Group, P.A. has been acquired by Florida Blue
Overview of the Transaction
Diagnostic Clinic Medical Group, based in Largo, Florida, is a multi-specialty medical practice focused on the primary care relationship and has been serving its patients for over 40 years.
Florida Blue, Florida's Blue Cross and Blue Shield company, is a not-for-profit, policyholder-owned, tax-paying mutual company headquartered in Jacksonville, Florida. Florida Blue has approximately 4 million health care members and serves 15.5 million people in 16 states through its affiliated companies.
Hyde Park Capital’s Role
Hyde Park Capital was retained by Diagnostic Clinic Medical Group’s Board of Directors to render a fairness opinion for this transaction.
has been acquired by

HYDE PARK CAPITAL Investment Banking | Mergers & Acquisitions | Capital Raising
Member FINRA/SIPC
Recent Transactions
HYDE PARK CAPITAL Investment Banking | Mergers & Acquisitions | Capital Raising Integrity | Expertise | Results
Hyde Park Capital Advisors, LLC 701 N. Franklin Street
Tampa, FL 33602 Tel: 813-383-0202
www.hydeparkcapital.com
John Hill Senior Managing Director [email protected] (813) 383-0205 John McDonald Senior Managing Director [email protected] (813) 383-0206 Keith Hodgdon Senior Vice President [email protected] (813) 383-0208 Jeffrey Bridge Vice President [email protected] (813) 383-0204 Michael Mariani Associate [email protected] (813) 597-2649 Jennifer Paul Associate [email protected] (813) 383-0203
has been recapitalized by
Harbert Mezzanine Partners
&
&has been acquired byhas been recapitalized by
has been acquired bySouthern Management Corp.
with mezzanine financing from ADG Acquisition
Holdings, LLC
has been acquired by
has been acquired by
has been acquired by
a subsidiary of
N. Harris Computer Corp.
has acquired has been acquired by has been acquired by
has acquired has been acquired byhas been acquired byhas been acquired by has been acquired by