Healthcare-associated Infections - Utah Department...
52
2013 Utah Department of Health Division of Disease Control and Prevention Published October 2014 Healthcare-associated Infections in Utah
Transcript of Healthcare-associated Infections - Utah Department...
2013
Utah Department of Health
Division of Disease Control
and Prevention
Published October 2014
Healthcare-associated Infections in Utah
ii
2013 Annual Report
Prepared by Rebecca L. Ward Division of Disease Control and Prevention Bureau of Epidemiology Utah Department of Health
Special thanks to the following individuals for their subject matter expertise, data resources, editing and consultations.
Utah Department of Health
Executive Director’s Office: Robert T. Rolfs, MD State Epidemiologist: Allyn K. Nakashima, MD Healthcare-Associated Infections Prevention Program:
Felicia Alvarez Jordan Pyper Louise Eutropius Sherry Varley
Communicable Disease Investigation and Response Program:
Kris Russell Melissa Stevens Dimond
Utah Hospitals
Chief Executive Officers Infection Preventionists Chief Medical Officers Chief Nursing Officers Quality Improvement Directors
Suggested Citation: Utah Department of Health. Healthcare-Associated Infections in Utah, 2013 Annual Report. Salt Lake City, UT: Utah Department of Health; October 2014.
http://health.utah.gov/epi/diseases/HAI/surveillance/2013_HAI_Report.pdf
Healthcare-associated Infections in Utah

iii
FOREWORD
Healthcare-associated infections (HAIs) are a major, yet often preventable,
threat to patient safety. The Utah Department of Health’s (UDOH) HAI
Prevention and Control Program is committed to helping Utah patients receive
the best and safest care. Implementing statewide HAI prevention efforts is an
essential part of a comprehensive patient safety program. Publicly releasing HAI
data is an important step in creating transparency for healthcare safety and
quality in Utah.
Patients want to feel safe and assured that we are doing everything possible to
eliminate infections. Thanks to all the healthcare professionals and facilities in
Utah who work tirelessly to realize this goal. Two of the keys to elimination of
HAIs are 1) the accurate collection of data to assess prevention impact, and 2)
the dissemination of results to healthcare providers and consumers.
Conscientious efforts in data reporting contribute toward meeting HAI prevention
efforts and control needs.
This 2013 Annual Healthcare Associated Infections Report was developed in
collaboration with the Utah Healthcare Infection Prevention (UHIP) Governance
Committee, a multi-disciplinary panel of state leaders in patient safety, infectious
diseases, and infection control. It provides an update on previous HAI reports
detailing Utah’s progress toward the goal of reducing and, ultimately, eliminating
HAIs.
This report will allow Utahns to compare HAIs among licensed hospitals in Utah. The
data in this report are self-reported to the National Healthcare Safety Network by
each facility required to report HAIs by the Centers for Medicare and Medicaid
Services (CMS). The UDOH analyzes the data, using proven statistical methods, to
provide comparison information.
Validation of these data by UDOH is limited. Additional validation is needed to
better understand any inconsistent data and to improve the quality of HAI
surveillance. Despite these limitations, Utah’s results for many HAIs are
encouraging and, as additional data are collected, more specific results will be
possible, allowing for increased HAI surveillance and prevention efforts.
Allyn K. Nakashima, MD
State Epidemiologist
Utah Department of Health
Healthcare-associated Infections in Utah 2013 Annual Report
iv
Executive Summary
Healthcare-associated infections (HAIs) are infections that are acquired while patients are receiving
treatment for another condition in a healthcare setting. Utah state regulation requires the Utah
Department of Health (UDOH) to collect data on HAIs and report this data to the public on an
annual basis. Validation of these data by UDOH is limited. This report contains the following data:
All infections for which Centers for Medicare and Medicaid Services (CMS) requires reporting
to NHSN:
o Central line-associated bloodstream infections (CLABSIs)
o Catheter-associated urinary tract infections (CAUTIs)
o Surgical site infections (SSIs) -- exclusive to colon surgeries and abdominal
hysterectomy surgeries
o Clostridium difficile (C. difficile) infections
o Methicillin Resistant Staphylococcus aureus (MRSA) bacteremia infections.
Self-reported data to the National Healthcare Safety Network (NHSN) by each Utah facility
that is required to report HAIs by the Centers for Medicare and Medicaid Services (CMS).
Identified facilities, as required by the Utah Health Code, Title 26, Chapter 6, Section 31.
A comparison of data in acute care facilities, long-term acute care facilities and inpatient
rehabilitation facilities.
For acute care facilities: a comparison of 2013 infection rates compared to national baseline
data.
For long-term acute care facilities, inpatient rehabilitation facilities and dialysis facilities: baseline
Utah data. As 2013 was the first year long-term acute care and inpatient rehabilitation facilities
provided CLABSI and CAUTI data to NHSN, there is currently insufficient data to establish a national
comparison for these facilities.
Healthcare-associated Infections in Utah 2013 Annual Report
v
32
33
86
93
200
467
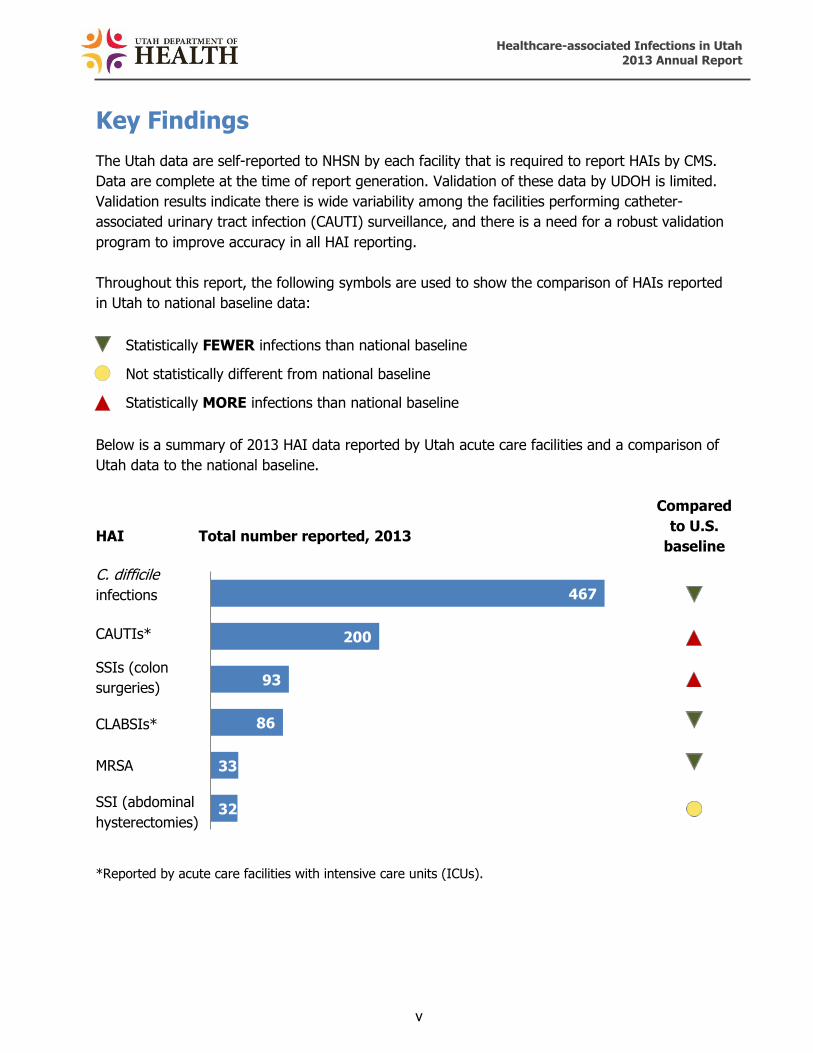
Key Findings The Utah data are self-reported to NHSN by each facility that is required to report HAIs by CMS.
Data are complete at the time of report generation. Validation of these data by UDOH is limited.
Validation results indicate there is wide variability among the facilities performing catheter-
associated urinary tract infection (CAUTI) surveillance, and there is a need for a robust validation
program to improve accuracy in all HAI reporting.
Throughout this report, the following symbols are used to show the comparison of HAIs reported
in Utah to national baseline data:
Statistically FEWER infections than national baseline
Not statistically different from national baseline
Statistically MORE infections than national baseline
Below is a summary of 2013 HAI data reported by Utah acute care facilities and a comparison of
Utah data to the national baseline.
HAI
Total number reported, 2013
Compared
to U.S.
baseline
C. difficile
infections
CAUTIs*
SSIs (colon
surgeries)
CLABSIs*
MRSA
SSI (abdominal
hysterectomies)
*Reported by acute care facilities with intensive care units (ICUs).
Healthcare-associated Infections in Utah 2013 Annual Report
vi
Table of Contents Acknowledgments ........................................................................................................... ii Foreword ........................................................................................................................ iii Executive Summary........................................................................................................ iv Key Findings .................................................................................................................... v Introduction ................................................................................................................... 1 How are Utah HAI Data Collected? ................................................................................ 3 Interpreting HAI Data
Calculating Standardized Infection Ratios ..................................................................... 4
What does the SIR Mean ............................................................................................ 4
Calculating Rates ....................................................................................................... 5 Central Line-Associated Bloodstream Infections (CLABSIs)
Acute Care Facilities ................................................................................................... 6
Long-term Acute Care Facilities ................................................................................... 8 Catheter-Associated Urinary Tract Infections (CAUTIs)
Acute Care Facilities ................................................................................................... 9 Long-term Acute Care Facilities .................................................................................. 11 Inpatient Rehabilitation Facilities ................................................................................ 11
Surgical Site Infections (SSIs)
Colon Surgeries ........................................................................................................ 12 Abdominal Hysterectomy Surgeries ............................................................................. 14
Clostridium difficile Infections .................................................................................... 16
Methicillin-resistant Staphylococcus aureus (MRSA) Bacteremia .............................. 18 Dialysis Events .............................................................................................................. 20
Healthcare-associated Infections in Utah 2013 Annual Report
vii
Table of Contents Data Quality Validation
Background .............................................................................................................. 21
Procedure................................................................................................................. 21 Key Validation Findings .............................................................................................. 21 Conclusions .............................................................................................................. 22
Appendices
Appendix A: Understanding CLABSI and CAUTI Standardized Infection Ratio Data in Acute Care Facilities with Intensive Care Units (ICUs) ............................................................ 23 Appendix B: Understanding SSI Data in Acute Care Facilities ........................................ 27
Appendix C: Understanding Clostridium difficile and MRSA Bacteremia Data in Acute Care Facilities ................................................................................................................... 31
Appendix D: Understanding CAUTI and CLABSI Rates in Long-term Acute Care Facilities with Intensive Care Units and Wards or Inpatient Rehabilitation Facilities ...................... 35 Appendix E: Definitions ............................................................................................. 40
References ..................................................................................................................... 43 List of Figures
Figure 1. Central line-associated bloodstream infection in acute care facilities with intensive care units, Utah, 2013 .................................................................................. 7
Figure 2. Catheter-associated urinary tract infections in acute care facilities with intensive care units, Utah, 2013 ............................................................................................... 10 Figure 3. Surgical site infections associated with colon surgeries in acute care facilities, Utah, 2013 ............................................................................................................... 13 Figure 4. Surgical site infections associated with colon surgeries in acute care facilities, Utah, 2013 ............................................................................................................... 15 Figure 5. C. difficile infections in acute care facilities, Utah, 2013 .................................. 17
Figure 6. Methicillin-resistant Staphylococcus aureus bacteremia in acute care facilities, Utah, 2013 ............................................................................................................... 19

Healthcare-associated Infections in Utah 2013 Annual Report
viii
Table of Contents List of Tables
Table 1. Central line-associated bloodstream infections in acute care facilities with intensive care units, Utah, 2013 ................................................................................. 25 Table 2. Catheter-associated urinary tract infections in acute care facilities with intensive care units, Utah, 2013 ............................................................................................... 26
Table 3. Surgical site infections associated with colon surgeries in acute care facilities,
Utah, 2013 ............................................................................................................... 29
Table 4. Surgical site infections associated with abdominal hysterectomy surgeries in
acute care facilities, Utah, 2013 ................................................................................. 30
Table 5. C. difficile infections in acute care facilities, Utah, 2013 ................................... 33 Table 6. Methicillin-resistant Staphylococcus aureus bacteremia in acute care facilities, Utah, 2013 ............................................................................................................... 34
Table 7. Central-line associated bloodstream infections in long-term acute care facilities with intensive care units and wards, Utah, 2013 ............................................. 37 Table 8. Catheter-associated urinary tract infections in long-term acute care facilities
with intensive care units and wards, Utah, 2013 .......................................................... 38
Table 9. Catheter-associated urinary tract infections in inpatient rehabilitation facilities, Utah, 2013 ............................................................................................................... 39

Healthcare-associated Infections in Utah 2013 Annual Report
1
Introduction
Healthcare-associated infections, or HAIs, are infections that people acquire while they are
receiving treatment for another condition in a healthcare setting. HAIs can be acquired
anywhere healthcare is delivered, including inpatient acute care hospitals, outpatient settings
such as ambulatory surgical centers and end-stage renal disease facilities, and long-term care
facilities such as nursing homes and rehabilitation centers. HAIs may be caused by any
infectious agent, including bacteria, fungi, and viruses, as well as other less common types of
pathogens.
HAIs are a significant cause of morbidity and mortality. On any given day, about 1 in every 25
hospital patients has at least one healthcare-associated infection. There were an estimated
722,000 HAIs in U.S acute care hospitals in 2011. About 75,000 hospital patients with HAIs died
during their hospitalizations. More than half of all HAIs occurred outside of the intensive care
unit.1 These infections cost the U.S. health care system billions of dollars each year and lead to
the loss of tens of thousands of lives. In addition, HAIs can have devastating emotional,
financial and medical consequences.2
Infections may occur as a result of complications following a surgical procedure, known as a
surgical site infection (SSI), or when staff fail to closely follow infection control practices like
hand washing. Patients receiving medical care and taking antibiotics for long periods of time
may be more susceptible to HAIs such as C. difficile infections. These infections now rival
methicillin-resistant Staphylococcus aureus (MRSA) as the most common organism to cause
HAIs in the United States.
HAIs may also be caused by the use of various types of invasive devices, such as a central line
or urinary catheter when patients are ill. The use of such devices can harm patients’ natural
defenses against germs and the longer these devices are in place, the greater the risk of
infection.3 Types of HAIs associated with devices include central line-associated bloodstream
infections (CLABSIs), catheter-associated urinary tract infections (CAUTIs), or infections
associated with the usage of ventilators. CLABSIs, CAUTIs, and ventilator-associated pneumonia
account for roughly two-thirds of all HAIs.4
Patients who undergo dialysis or ”hemodialysis” treatment (a treatment for patients with
inadequate kidney function) also have an increased risk for an HAI. They are at high risk
because this artificial process of getting rid of waste and unwanted water in the body requires
frequent use of catheters or insertion of needles to access the bloodstream. Hemodialysis
patients also have weakened immune systems, which increase their risk for infection. They also
require frequent hospitalizations and surgery where they might acquire an infection.5
Another common HAI is caused by the bacteria C. difficile. Most C. difficile infections are
connected with receiving medical care and taking antibiotics for long periods of time.6
Healthcare-associated Infections in Utah 2013 Annual Report
2
Half of all hospital patients with C. difficile infections have the infection when admitted and may
spread it within the facility.7 The most dangerous source of spread to others is patients with
diarrhea.
Methicillin-resistant Staphylococcus aureus (MRSA) is a bacterium that is resistant to many
antibiotics and common in healthcare facilities. In the community, most MRSA infections are
skin infections. In medical facilities, MRSA causes life-threatening bloodstream (or
bacteremia) infections, pneumonia and surgical site infections. MRSA bacteremia infections
reported by Utah acute care facilities are included in this report.

Healthcare-associated Infections in Utah 2013 Annual Report
3
How are Utah HAI data collected?
Identifying HAIs requires an organized approach involving several different types of activity. It
is important to determine if infections are healthcare-associated or already present upon facility
admission. Because of the concerns about deadly and costly HAIs, state regulation (Rule 386‐
705, Epidemiology, Healthcare-Associated Infection) requires the Utah Department of Health
(UDOH) to collect and report data on HAIs.
Since 2008, acute care hospitals with intensive care units have submitted data directly to the
UDOH for the annual HAI report; however, reporting facilities were not identified by name. In
2011, the Centers for Medicare and Medicaid Services (CMS) required acute healthcare facilities
to report specific HAI data to the National Healthcare Safety Network (NHSN) for payment
reimbursement. In 2012, Utah Health Code Title 26, Chapter 6, Section 31, Public Reporting of
Healthcare Associated Infections, was passed requiring the UDOH to: a) access and analyze
facility-specific NHSN data required by CMS; b) publish an annual HAI report for the public in
which facilities are identified by name; and c) conduct validation activities.
For an HAI to be publicly reported in Utah under Title 26, Chapter 6, Section 31, an HAI must
meet CMS’s specific reporting measures required for reporting to NHSN. The UDOH works with
NHSN and other partners to monitor and prevent these infections because they are a significant
threat to patient safety.
Facilities in Utah submit data about specific healthcare-associated infections (HAIs) to the
Centers for Disease Control and Prevention’s (CDC) National Healthcare Safety Network
(NHSN), a secure, online tracking system used by hospitals and other healthcare facilities. The
Utah data are self-reported to NHSN by each facility that is required to report HAIs to CMS.
Healthcare-associated Infections in Utah 2013 Annual Report
4
Interpreting HAI Data
Calculating Standardized Infection Ratios (SIRs)
The standardized infection ratio (SIR) is a summary statistic developed by NHSN used to track
HAI prevention progress over time. Progress is measured at the national, state, local or facility
level.
The SIR compares the total number of HAI events in a healthcare facility to the predicted
number of HAI events, based on “standard population” data. For purposes of this report, the
standard population data are HAI data reported nationally by thousands of facilities using
NHSN. Facilities with small numbers of patients may not have enough HAI events to reliably
compare to the standard population. SIRs for these facilities are not included. SIRs are also not
included for long-term acute care facilities or dialysis facilities because a national baseline has
not yet been established.
What does the SIR mean?
SIR Value Interpretation
Less than 1 There were fewer infections reported in Utah in 2013 compared
to the national baseline data, indicating progress has been
made in preventing infections
Equal to 1 There were about the same number of infections reported in
Utah in 2013 compared to the national baseline data, indicating
no progress has been made.
More than 1 There were more infections reported in Utah in 2013 compared
to the national baseline data, indicating there has been an
increase in infections.
A confidence interval (CI) is provided if an SIR was estimated for a given healthcare facility. The
CI describes the uncertainty associated with the SIR estimate. Facilities with more device days
or that perform more procedures will have narrower CIs, which means there is less doubt
associated with the accuracy of their SIRs compared to facilities performing fewer
procedures. This is because there is more information about a facility's performance with
additional procedures. A 95% CI means that an SIR 95 times out of 100, the true value would
be expected to fall within the range shown. When 1.0 is not included in the CI, this means that
the SIR is "statistically significant.” That is, there is sufficient information to conclusively state
that the SIR is either more or less than the national baseline.

Healthcare-associated Infections in Utah 2013 Annual Report
5
Actual values calculated for the SIR, along with confidence intervals, are found in Tables 1-9 in
the Appendix.
Figures 1-6 summarize the SIR data, taking into account whether the SIR is meaningful
statistically, using these icons:
Statistically FEWER infections than national baseline
Not statistically different from national baseline
Statistically MORE infections than national baseline
Calculating Rates
When information for estimating a predicted number of events is not available, raw incidence
rates are provided. An incidence rate is a summary measure developed by NHSN to track HAIs
at the national, state, local or facility level over time, and describes how frequently HAIs occur
within a specific period. This rate is calculated by taking the number of HAI events, dividing it
by the total number of device days, and multiplying that by the desired time frame. Because
healthcare facilities vary in size and patient mix, incidence rates should not be directly
compared to others. A larger facility that treats more severe illnesses will naturally have a
higher incidence rate, and consequently, is not indicative of the quality of care relative to other
facilities. Overall incidence rates for the state are not given in this report, as NHSN does not
provide these and they would not be comparable to other states.
Healthcare-associated Infections in Utah 2013 Annual Report
6
Central Line-Associated Bloodstream Infections
(CLABSIs)
Acute Care Facilities
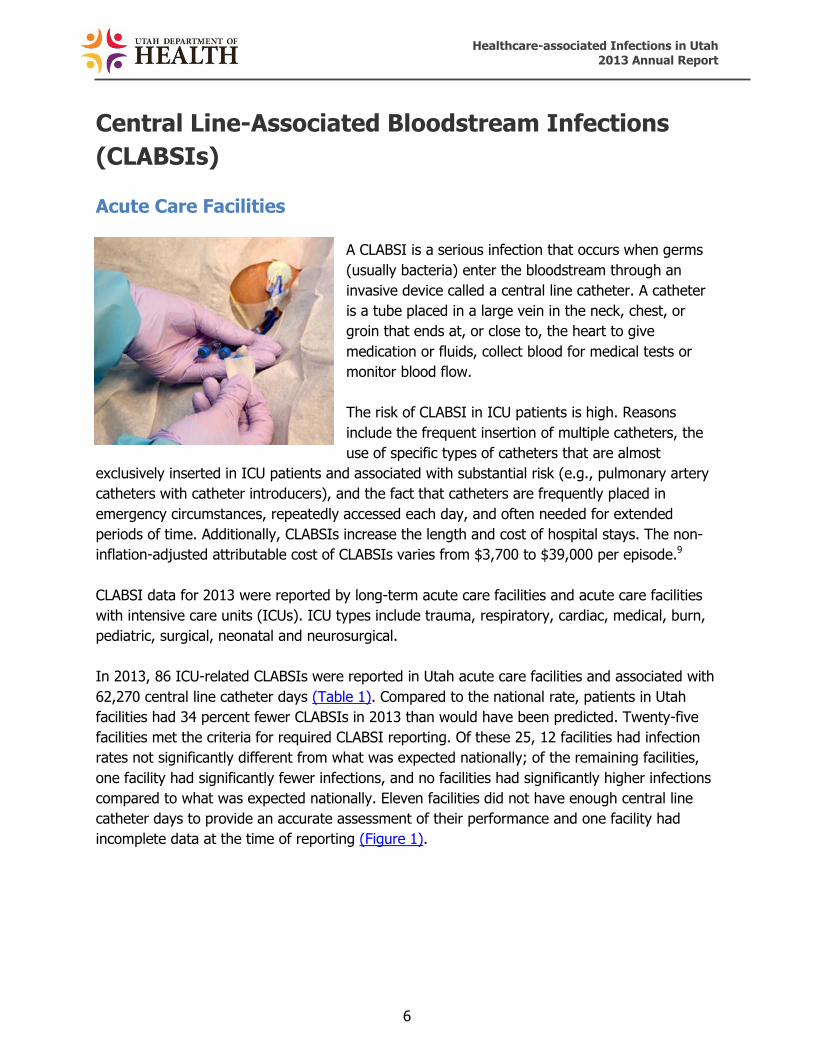
A CLABSI is a serious infection that occurs when germs
(usually bacteria) enter the bloodstream through an
invasive device called a central line catheter. A catheter
is a tube placed in a large vein in the neck, chest, or
groin that ends at, or close to, the heart to give
medication or fluids, collect blood for medical tests or
monitor blood flow.
The risk of CLABSI in ICU patients is high. Reasons
include the frequent insertion of multiple catheters, the
use of specific types of catheters that are almost
exclusively inserted in ICU patients and associated with substantial risk (e.g., pulmonary artery
catheters with catheter introducers), and the fact that catheters are frequently placed in
emergency circumstances, repeatedly accessed each day, and often needed for extended
periods of time. Additionally, CLABSIs increase the length and cost of hospital stays. The non-
inflation-adjusted attributable cost of CLABSIs varies from $3,700 to $39,000 per episode.9
CLABSI data for 2013 were reported by long-term acute care facilities and acute care facilities
with intensive care units (ICUs). ICU types include trauma, respiratory, cardiac, medical, burn,
pediatric, surgical, neonatal and neurosurgical.
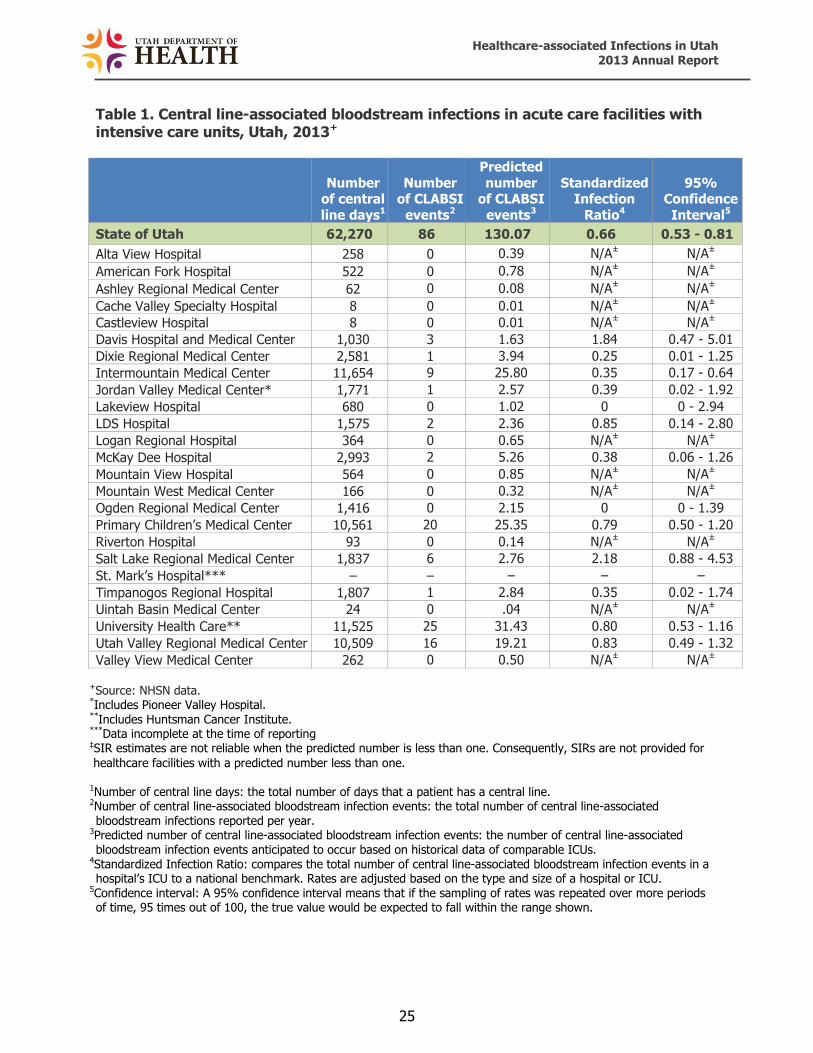
In 2013, 86 ICU-related CLABSIs were reported in Utah acute care facilities and associated with
62,270 central line catheter days (Table 1). Compared to the national rate, patients in Utah
facilities had 34 percent fewer CLABSIs in 2013 than would have been predicted. Twenty-five
facilities met the criteria for required CLABSI reporting. Of these 25, 12 facilities had infection
rates not significantly different from what was expected nationally; of the remaining facilities,
one facility had significantly fewer infections, and no facilities had significantly higher infections
compared to what was expected nationally. Eleven facilities did not have enough central line
catheter days to provide an accurate assessment of their performance and one facility had
incomplete data at the time of reporting (Figure 1).

Healthcare-associated Infections in Utah 2013 Annual Report
7
Figure 1. Central line-associated bloodstream infections in acute care facilities with
intensive care units, Utah, 2013+
Hospital CLABSIs
State of Utah
Alta View Hospital --
American Fork Hospital --
Ashley Regional Medical Center --
Cache Valley Specialty Hospital --
Castleview Hospital --
Davis Hospital and Medical Center
Dixie Regional Hospital
Intermountain Medical Center
Jordan Valley Hospital (includes Pioneer Valley Hospital)
Lakeview Hospital
LDS Hospital
Logan Regional Hospital --
McKay-Dee Hospital
Mountain View Hospital --
Mountain West Medical Center --
Ogden Regional Medical Center
Primary Children’s Medical Center
Riverton Hospital --
Salt Lake Regional Medical Center
St. Mark’s Hospital **
Timpanogos Regional Hospital
Uintah Basin Medical Center --
University Health Care (includes Huntsman Cancer Institute)
Utah Valley Regional Medical Center
Valley View Medical Center --
+Source: NHSN data
Statistically FEWER infections than national baseline
Not statistically different from national baseline
Statistically MORE infections than national baseline
-- Facilities had insufficient data to reliably compare their data to the
standard population
** Data incomplete at the time of reporting

Healthcare-associated Infections in Utah 2013 Annual Report
8
CLABSI data from 2008 through 2013 in Utah acute care facilities ranged from a rate of 1.0 to
2.2 per 1,000 central line days with an average rate of 1.6. The information is pertinent
because it identifies the current trend for CLABSIs within ICUs in the state of Utah. Recognition
of the infection burden is necessary to promote proven interventions and prevention strategies.
Long-term Acute Care Facilities
In 2013, three CLABSIs were reported in Utah long-term acute care facilities with intensive care
units and wards and associated with 13,558 central line catheter days (Table 7). Because 2013
was the first year long-term acute care facilities provided CLABSI data to NHSN, there is
currently insufficient data to establish a national comparison. As more data become available,
recognition of the infection burden can be determined to promote proven interventions and
prevention strategies.

Healthcare-associated Infections in Utah 2013 Annual Report
9
Catheter-Associated Urinary Tract Infections
(CAUTIs)
Acute Care Facilities
A urinary tract infection (UTI) is an infection that can happen
anywhere along the urinary tract, including the kidneys,
ureters, urinary bladder, and the urethra. A UTI that occurs in a
patient or resident with a catheter is known as a catheter-
associated UTI (CAUTI).
CAUTI data for 2013 were reported by acute care facilities with
intensive care units (ICU), long-term acute care facilities (LTAC)
and inpatient rehabilitation facilities (IRF). Acute care ICU types
include trauma, respiratory, cardiac, medical, burn, pediatric, surgical, neonatal and
neurosurgical. LTAC and IRF data include ICUs and wards.
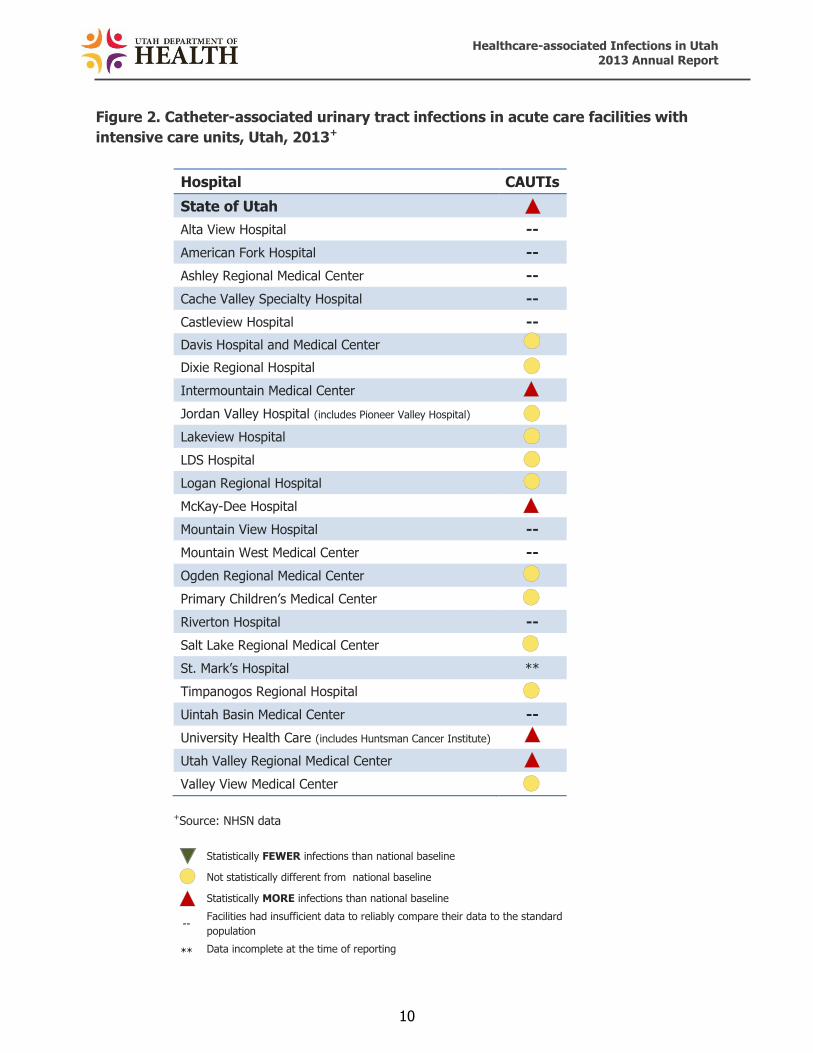
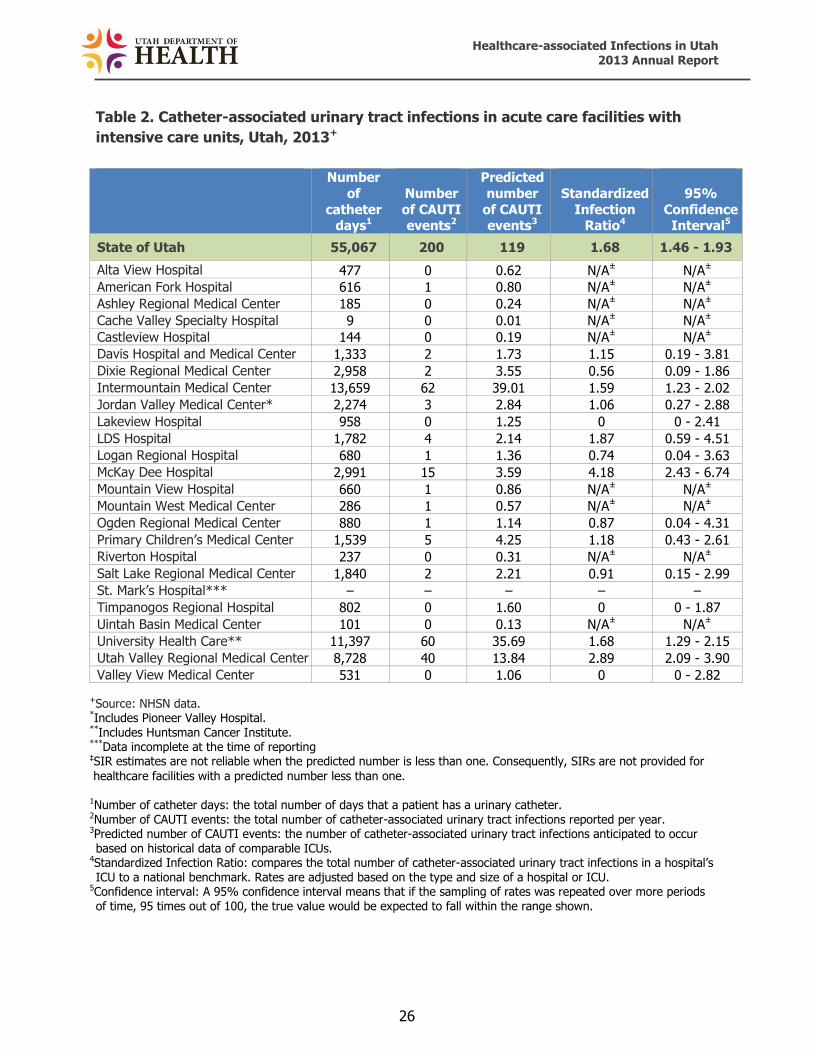
In 2013, 200 ICU-related CAUTIs were reported in Utah acute care facilities and associated with
55,067 catheter days (Table 2). Compared to the national rate, none of the Utah facilities had
fewer CAUTIs in 2013 than would have been predicted. Twenty-five facilities met the criteria for
required CAUTI reporting. Of these 25, 11 facilities had CAUTI rates not significantly different
from expected national rates; four facilities had significantly higher infections compared to what
was expected nationally. Nine facilities did not have enough catheter days to provide an
accurate assessment of their performance and one facility had incomplete data at the time of
reporting (Figure 2).
Healthcare-associated Infections in Utah 2013 Annual Report
10
Figure 2. Catheter-associated urinary tract infections in acute care facilities with
intensive care units, Utah, 2013+
Hospital CAUTIs
State of Utah
Alta View Hospital --
American Fork Hospital --
Ashley Regional Medical Center --
Cache Valley Specialty Hospital --
Castleview Hospital --
Davis Hospital and Medical Center
Dixie Regional Hospital
Intermountain Medical Center
Jordan Valley Hospital (includes Pioneer Valley Hospital)
Lakeview Hospital
LDS Hospital
Logan Regional Hospital
McKay-Dee Hospital
Mountain View Hospital --
Mountain West Medical Center --
Ogden Regional Medical Center
Primary Children’s Medical Center
Riverton Hospital --
Salt Lake Regional Medical Center
St. Mark’s Hospital **
Timpanogos Regional Hospital
Uintah Basin Medical Center --
University Health Care (includes Huntsman Cancer Institute)
Utah Valley Regional Medical Center
Valley View Medical Center
+Source: NHSN data
Statistically FEWER infections than national baseline
Not statistically different from national baseline
Statistically MORE infections than national baseline
-- Facilities had insufficient data to reliably compare their data to the standard
population
** Data incomplete at the time of reporting

Healthcare-associated Infections in Utah 2013 Annual Report
11
Long-term Acute Care Facilities
In 2013, six CAUTIs were reported in Utah long-term acute care facilities with intensive care
units and wards and associated with 8,141 catheter days (Table 8). Because 2013 was the first
year long-term acute care facilities provided CAUTI data to NHSN, there is currently insufficient
data to establish a national comparison. As more data become available, recognition of the
infection burden can be determined to promote proven interventions and prevention strategies.
Inpatient Rehabilitation Facilities
In 2013, 29 CAUTIs were reported in Utah inpatient rehabilitation facilities and associated with
4,902 catheter days (Table 9). Because 2013 was the first year inpatient rehabilitation facilities
provided CAUTI data to NHSN, there is currently insufficient data to establish a national
comparison. As more data become available, recognition of the infection burden can be
determined to promote proven interventions and prevention strategies.

Healthcare-associated Infections in Utah 2013 Annual Report
12
Surgical Site Infections (SSIs)
A surgical site infection is an infection that occurs after surgery in the part of the body where
the surgery took place. Surgical site infections are the most common and most costly HAI in the
United States (160,000-300,000 SSIs per year).10 The two SSI types required for reporting in
Utah are those following colon surgeries and abdominal hysterectomy surgeries.
Colon Surgeries
Colon surgery is an operation performed on the large intestine, rectum, anus and/or the
perianal area. The colon (the large bowel or large intestine) is the tube-like part of the digestive
tract that stores stool and pushes it out from the body. Colon surgery is often the main
treatment for earlier stage colon cancers. It is also performed to repair damage to the colon or
treat diseases such as diverticulitis and inflammatory bowel disease.
Colon surgical data for 2013 were reported only by acute care facilities.
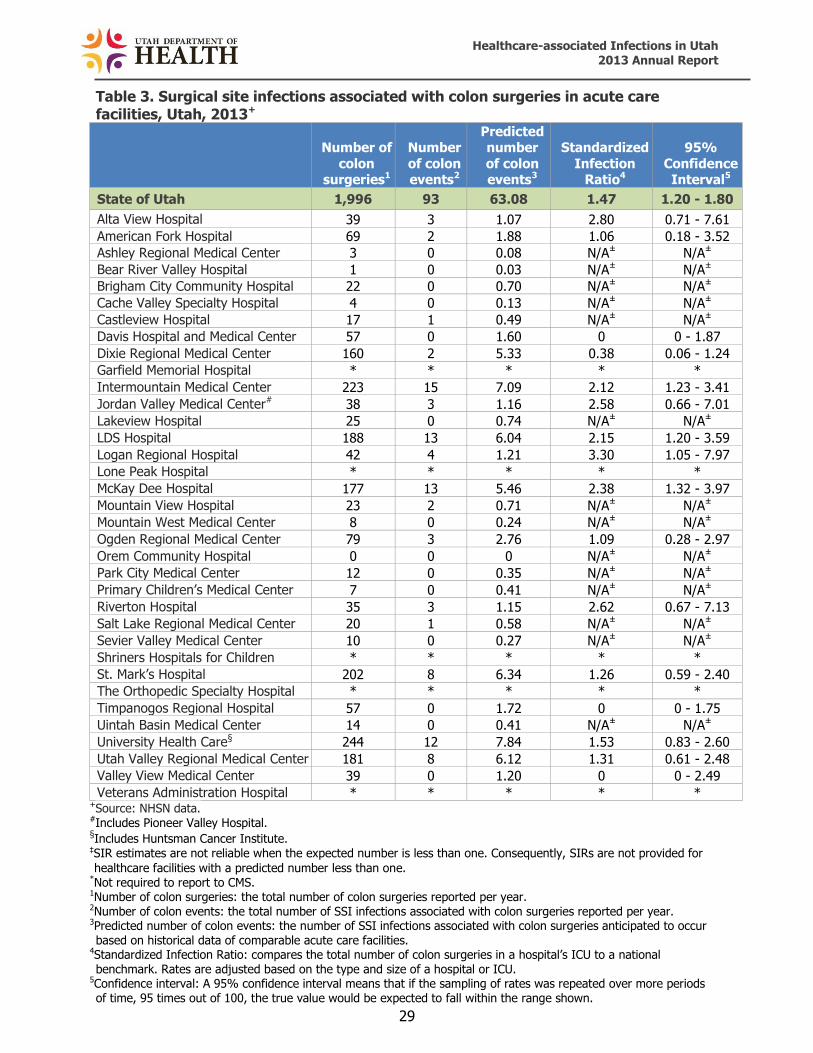
In 2013, 93 SSIs associated with colon surgeries were reported in Utah and associated with
1,996 colon surgeries (Table 3). Compared to the national rate, none of the Utah facilities had
fewer SSIs associated with colon surgeries in 2013 than would have been predicted. Thirty
facilities met the criteria for required reporting of SSIs associated with colon surgeries. Of these
30, 12 facilities had infection rates not statistically significant from what was expected
nationally; four facilities had significantly higher infection rates. Fourteen facilities did not have
enough data to provide an accurate assessment of their performance (Figure 3).

Healthcare-associated Infections in Utah 2013 Annual Report
13
Figure 3. Surgical site infections associated with colon surgeries in acute care
facilities, Utah, 2013+
Hospital Colon SSIs
State of Utah
Alta View Hospital
American Fork Hospital
Ashley Regional Medical Center --
Bear River Valley Hospital --
Brigham City Community Hospital --
Cache Valley Specialty Hospital --
Castleview Hospital --
Davis Hospital and Medical Center
Dixie Regional Hospital
Garfield Memorial Hospital *
Intermountain Medical Center
Jordan Valley Hospital (includes Pioneer Valley Hospital)
Lakeview Hospital --
LDS Hospital
Logan Regional Hospital
Lone Peak Hospital *
McKay-Dee Hospital
Mountain View Hospital --
Mountain West Medical Center --
Ogden Regional Medical Center
Orem Community Hospital --
Park City Medical Center --
Primary Children’s Medical Center --
Riverton Hospital
Salt Lake Regional Medical Center --
Sevier Valley Medical Center --
Shriners Hospitals for Children *
St. Mark’s Hospital
The Orthopedic Specialty Hospital (TOSH) *
Timpanogos Regional Hospital
Uintah Basin Medical Center --
University Health Care (includes Huntsman Cancer Institute)
Utah Valley Regional Medical Center
Valley View Medical Center
Veterans Administration Hospital *
+Source: NHSN data
Statistically FEWER infections than national baseline Not statistically different from national baseline Statistically MORE infections than national baseline Facilities had insufficient data to reliably compare their data to the standard population Not required to report to CMS
-- *
Healthcare-associated Infections in Utah 2013 Annual Report
14
Abdominal Hysterectomy Surgeries
An abdominal hysterectomy is a surgical procedure in which the uterus is removed through an
incision in the lower abdomen. This operation is most commonly used when the uterus is
enlarged, the ovaries and fallopian tubes are being removed, or when disease has spread to the
pelvic cavity as in endometriosis or cancer. The most common complications following a
hysterectomy are fever and infection.
Abdominal hysterectomy surgical data for 2013 were reported only by acute care facilities.
In 2013, 32 SSIs associated with abdominal hysterectomies were reported in Utah and
associated with 2,529 abdominal hysterectomy surgeries (Table 4). Compared to the national
rate, none of the Utah facilities had fewer SSIs associated with abdominal hysterectomies in
2013 than would have been predicted. Thirty facilities met the criteria for required reporting of
SSIs associated with abdominal hysterectomies. Of these 30, seven facilities had infection rates
not statistically significant from what was expected nationally; two facilities had significantly
higher infections compared to what is expected nationally. Twenty-one facilities did not have
enough data to provide an accurate assessment of their performance (Figure 4).

Healthcare-associated Infections in Utah 2013 Annual Report
15
Figure 4. Surgical site infections associated with abdominal hysterectomy surgeries in acute care facilities, Utah, 2013+
Hospital Abdominal
hysterectomy SSIs
State of Utah
Alta View Hospital --
American Fork Hospital --
Ashley Regional Medical Center --
Bear River Valley Hospital --
Brigham City Community Hospital --
Cache Valley Specialty Hospital --
Castleview Hospital --
Davis Hospital and Medical Center
Dixie Regional Medical Center --
Garfield Memorial Hospital *
Intermountain Medical Center
Jordan Valley Medical Center (includes Pioneer Valley Hospital) --
Lakeview Hospital --
LDS Hospital
Logan Regional Hospital --
Lone Peak Hospital *
McKay-Dee Hospital
Mountain View Hospital --
Mountain West Medical Center --
Ogden Regional Medical Center
Orem Community Hospital --
Park City Medical Center --
Primary Children’s Medical Center --
Riverton Hospital
Salt Lake Regional Medical Center --
Sevier Valley Medical Center --
Shriners Hospitals for Children *
St. Mark’s Hospital
The Orthopedic Specialty Hospital (TOSH) *
Timpanogos Regional Hospital --
Uintah Basin Medical Center --
University Health Care (includes Huntsman Cancer Institute)
Utah Valley Regional Medical Center
Valley View Medical Center --
Veterans Administration Hospital * +Source: NHSN data
Statistically FEWER infections than national baseline Not statistically different from national baseline Statistically MORE infections than national baseline Facilities had insufficient data to reliably compare their data to the standard population
Not required to report to CMS
-- *

Healthcare-associated Infections in Utah 2013 Annual Report
16
C. difficile Infections
Most cases of C. difficile infections occur in patients
taking antibiotics. The elderly and people with certain
medical problems have the greatest chance of
acquiring C. difficile. C. difficile can live outside the
human body for a very long time and may be found
on things in the environment such as bed linens, bed
rails, bathroom fixtures, and medical equipment. C.
difficile infections can spread from person to person
on contaminated equipment and on the hands of
doctors, nurses, other healthcare providers and
visitors.
C. difficile causes at least 250,000 hospitalizations and 14,000 deaths every year, and was
recently categorized by CDC as an urgent threat to patient safety.7
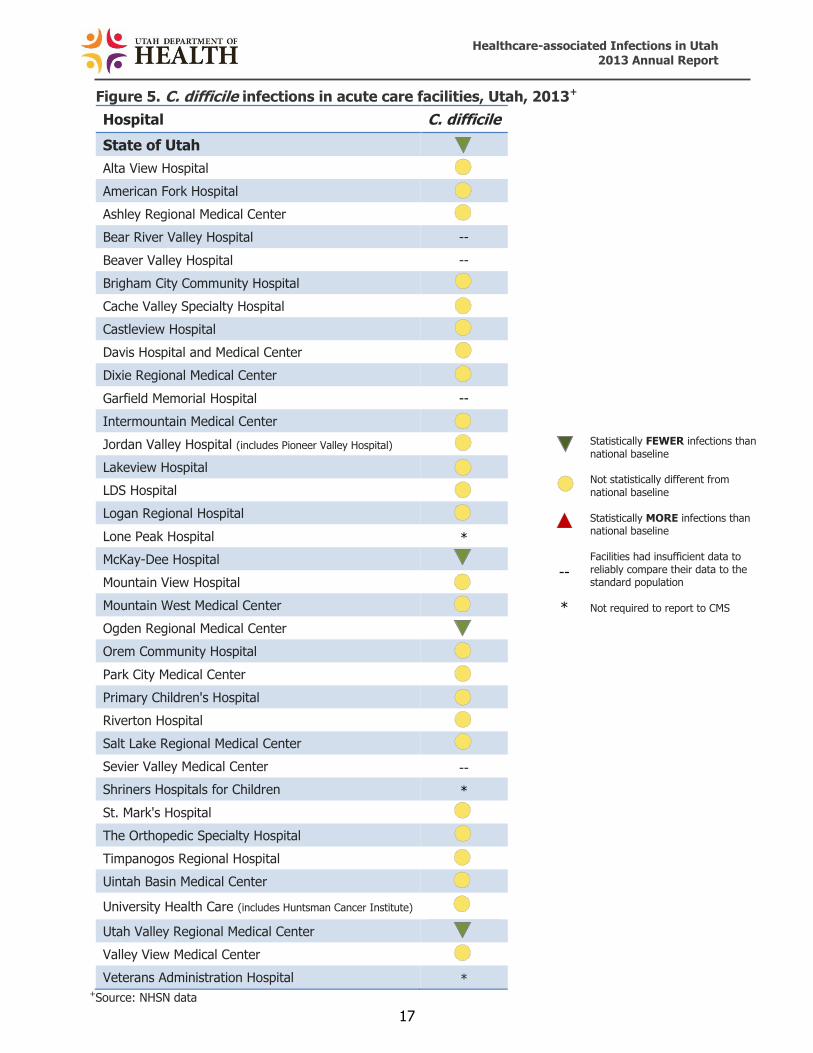
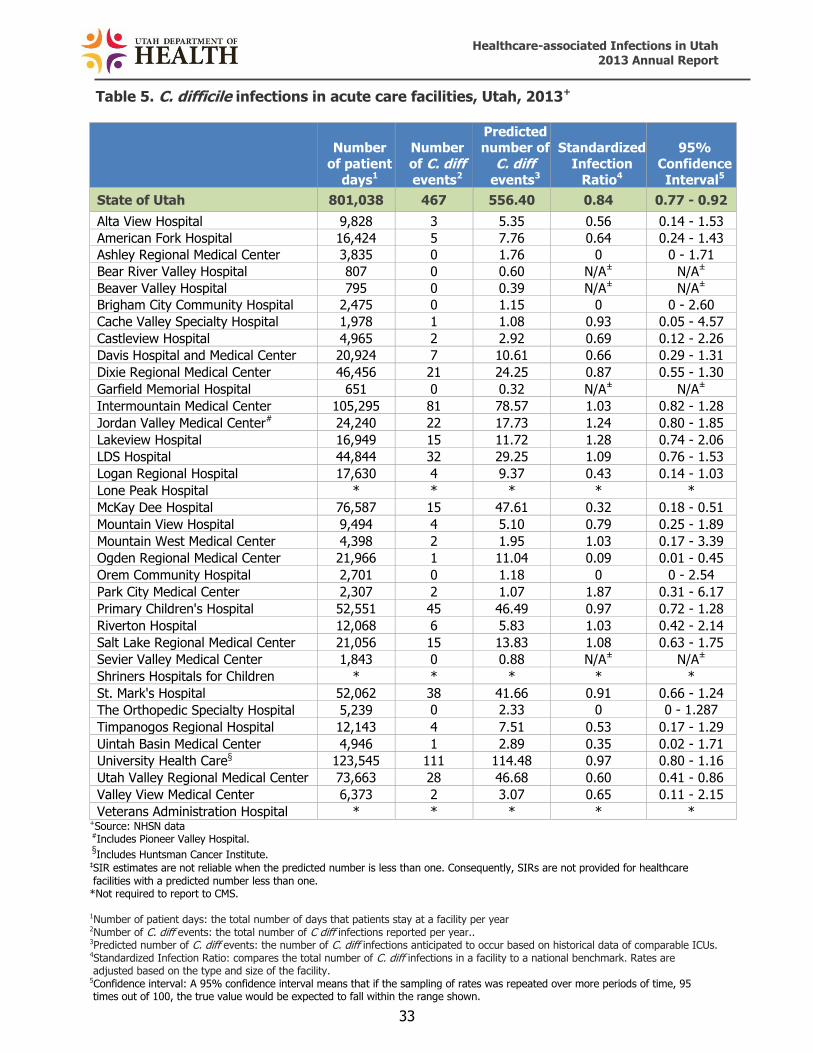
In 2013, 467 C. difficile infections were reported in Utah acute care facilities (Table 5).
Compared to the national rate, three of the Utah facilities had fewer C. difficile infections in
2013 than would have been predicted. Thirty-three facilities met the criteria for required
reporting of C. difficile infections. Of these 33, 26 facilities had infection rates not statistically
significant from what was expected nationally. Four facilities did not have enough data to
provide an accurate assessment of their performance (Figure 5).
Healthcare-associated Infections in Utah 2013 Annual Report
17
Figure 5. C. difficile infections in acute care facilities, Utah, 2013+
Hospital C. difficile
State of Utah
Alta View Hospital
American Fork Hospital
Ashley Regional Medical Center
Bear River Valley Hospital --
Beaver Valley Hospital --
Brigham City Community Hospital
Cache Valley Specialty Hospital
Castleview Hospital
Davis Hospital and Medical Center
Dixie Regional Medical Center
Garfield Memorial Hospital --
Intermountain Medical Center
Jordan Valley Hospital (includes Pioneer Valley Hospital)
Lakeview Hospital
LDS Hospital
Logan Regional Hospital
Lone Peak Hospital *
McKay-Dee Hospital
Mountain View Hospital
Mountain West Medical Center
Ogden Regional Medical Center
Orem Community Hospital
Park City Medical Center
Primary Children's Hospital
Riverton Hospital
Salt Lake Regional Medical Center
Sevier Valley Medical Center --
Shriners Hospitals for Children *
St. Mark's Hospital
The Orthopedic Specialty Hospital
Timpanogos Regional Hospital
Uintah Basin Medical Center
University Health Care (includes Huntsman Cancer Institute)
Utah Valley Regional Medical Center
Valley View Medical Center
Veterans Administration Hospital * +Source: NHSN data
Statistically FEWER infections than national baseline Not statistically different from national baseline Statistically MORE infections than national baseline Facilities had insufficient data to reliably compare their data to the standard population Not required to report to CMS
-- *
Healthcare-associated Infections in Utah 2013 Annual Report
18
Methicillin-resistant Staphylococcus aureus (MRSA) Bacteremia Infections
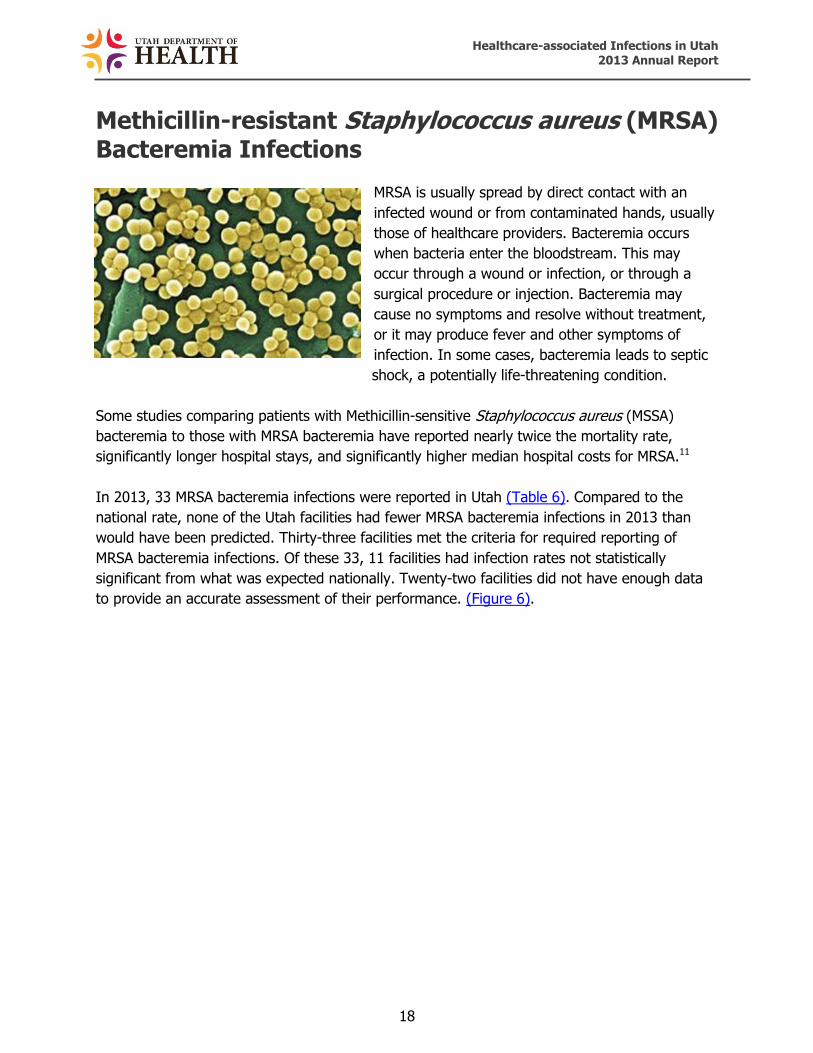
MRSA is usually spread by direct contact with an
infected wound or from contaminated hands, usually
those of healthcare providers. Bacteremia occurs
when bacteria enter the bloodstream. This may
occur through a wound or infection, or through a
surgical procedure or injection. Bacteremia may
cause no symptoms and resolve without treatment,
or it may produce fever and other symptoms of
infection. In some cases, bacteremia leads to septic
shock, a potentially life-threatening condition.
Some studies comparing patients with Methicillin-sensitive Staphylococcus aureus (MSSA)
bacteremia to those with MRSA bacteremia have reported nearly twice the mortality rate,
significantly longer hospital stays, and significantly higher median hospital costs for MRSA.11
In 2013, 33 MRSA bacteremia infections were reported in Utah (Table 6). Compared to the
national rate, none of the Utah facilities had fewer MRSA bacteremia infections in 2013 than
would have been predicted. Thirty-three facilities met the criteria for required reporting of
MRSA bacteremia infections. Of these 33, 11 facilities had infection rates not statistically
significant from what was expected nationally. Twenty-two facilities did not have enough data
to provide an accurate assessment of their performance. (Figure 6).

Healthcare-associated Infections in Utah 2013 Annual Report
19
Figure 6. Methicillin-resistant Staphylococcus aureus bacteremia in acute care facilities, Utah, 2013+
Hospital MRSA
State of Utah
Alta View Hospital --
American Fork Hospital --
Ashley Regional Medical Center --
Bear River Valley Hospital --
Beaver Valley Hospital --
Brigham City Community Hospital --
Cache Valley Specialty Hospital --
Castleview Hospital --
Davis Hospital and Medical Center
Dixie Regional Medical Center
Garfield Memorial Hospital --
Intermountain Medical Center
Jordan Valley Hospital (includes Pioneer Valley Hospital)
Lakeview Hospital --
LDS Hospital
Logan Regional Hospital --
Lone Peak Hospital *
McKay-Dee Hospital
Mountain View Hospital --
Mountain West Medical Center --
Ogden Regional Medical Center
Orem Community Hospital --
Park City Medical Center --
Primary Children’s Medical Center
Riverton Hospital --
Salt Lake Regional Medical Center --
Sevier Valley Medical Center --
Shriners Hospitals for Children *
St. Mark’s Hospital
The Orthopedic Specialty Hospital --
Timpanogos Regional Hospital --
Uintah Basin Medical Center --
University Health Care (includes Huntsman Cancer Institute)
Utah Valley Regional Medical Center
Valley View Medical Center --
Veteran Administration Hospital *
+Source: NHSN data
-- *
Statistically FEWER infections than national baseline Not statistically different from national rate Statistically MORE infections than national baselilne Facilities had insufficient data to reliably compare their data to the standard population
Not required to report to CMS
Healthcare-associated Infections in Utah 2013 Annual Report
20
Dialysis Infection Events
The kidneys perform several critical functions. They clean blood, remove excess fluid from the
body, and produce hormones needed for other important bodily functions. When the kidneys
are unable to perform these functions, they can fail, resulting in the need for hemodialysis, the
process of filtering the waste products collected in the blood. Bloodstream and other types of
infections are a leading cause of death among hemodialysis patients, second only to vascular
disease.
Dialysis facilities are required to report the number of patients requiring initiation of antibiotic
therapy, the number of patients with laboratory results indicating infection in their bloodstream,
and patients with signs and symptoms of catheter access infections (i.e., redness and/or pus).
In 2013, 37 outpatient dialysis facilities in Utah met the criteria for required reporting. There are
currently insufficient data to establish a national comparison. When there is sufficient
information that can be deemed reliable, it will be contained in future reports.
Healthcare-associated Infections in Utah 2013 Annual Report
21
Data Quality Validation
Background Validation audits were completed during 2014 based upon recommendations made by the
Utah Healthcare Infection Prevention Governance Committee. The focus of the validation
was to determine how NHSN CAUTI standards were interpreted and applied to data
collection. The validations, conducted by UDOH HAI Prevention Program staff, were
performed in six facilities. These facilities were randomly selected based on their 2013
CAUTI rates being higher or lower than the expected range of events for their facility type
when compared to the national NHSN benchmark.
Validation activities are intended to compare reported information with audit findings and
outcomes to enhance accuracy and completeness of CAUTI reporting. A standardized
validation method was chosen to serve as a test of proficiency in surveillance methods and
accuracy in case findings. A targeted sample of medical records of adult patients who had
positive urine cultures during their 2013 ICU stay were validated; this approach was one of
several recommended by the NHSN.
Procedure During May and June 2014, a full day on-site medical record audit was conducted at
targeted facilities. An interview with infection prevention and control staff preceded the
audit to determine surveillance methodology, risk adjustment variables such as appropriate
patient care location mapping, modifications to/implementation of electronic medical record
systems and ability to track candidate CAUTI events. In each facility, a sample size of up to
20 NHSN reported CAUTI cases were reviewed. Additionally, 30 charts of patients with
positive urine cultures during their ICU stay were reviewed to determine if any reportable
infections were missed. A standardized audit tool developed by the CDC was used. Results
of the validation findings were reviewed with the facility to provide immediate onsite
education to improve HAI surveillance and reporting. Facilities were expected to correct
data in NHSN based on validation findings.
Validation Key Findings
The accuracy and completeness of HAI surveillance and reporting can be calculated. These
findings include sensitivity, specificity, and positive predictive value (PPV). Sensitivity answers
the question, “How likely are patients with an infection accurately identified as having an
infection?”. Specificity answers the question, “How likely are patients without an infection
accurately identified as not having an infection?”. The PPV is the proportion of HAIs reported
that met the surveillance criteria accurately.
UDOH auditors reviewed 197 positive urine cultures for CAUTI validation from six facilities. The
auditors found 26 disparities. The facilities had identified and reported a total of 51 CAUTIs.
Auditors determined only 33 should have been reported. Eighteen did not meet surveillance
Healthcare-associated Infections in Utah 2013 Annual Report
22
criteria. The PPV reveals that the surveillance performed in these six facilities identified CAUTIs
meeting the NHSN CAUTI surveillance criteria only 65% of the time.
For the other 146 positive urine cultures reviewed in these six facilities identified as not meeting
CAUTI surveillance criteria, the auditors identified eight additional CAUTIs. The calculated
sensitivity reveals that routine surveillance identified only 81% of the CAUTIs occurring. The
calculated specificity reveals surveillance accurately “ruled out” CAUTIs 89% of the time.
It should be noted that results from these six facilities may not be generalized to all facilities in
the state. Also, because the audit sample was targeted and unweighted, aggregate findings are
not necessarily indicative of NHSN data quality throughout the state.
Conclusions
Validation results indicate there is wide variability among the six facilities performing CAUTI
surveillance. Discussing discordant findings may lead to improving the quality of HAI
surveillance. Challenges for infection preventionists included the interpretation of CAUTI
surveillance criteria. This may be due to lack of education, experience subjectivity, and/or
inappropriate case finding. Additional constraints may be limited time dedicated for surveillance
activities and difficulty accessing clinical data points.
Overall, UDOH auditors were very well received by the six facilities, and several healthcare
systems invited the auditors to conduct validations for additional HAIs. Due to lack of resources
and staffing, current validation activities are limited in scope and these requests could not be
accommodated.
Validation results demonstrate the need for a robust validation program to improve accuracy in
all HAI reporting. It is important to determine if infections are healthcare-associated or already
present upon facility admission in order to implement appropriate infection prevention
measures.

Healthcare-associated Infections in Utah 2013 Annual Report
23
Appendix A
Understanding CLABSI and CAUTI Standardized Infection Ratio
Data in Acute Care Facilities with Intensive Care Units
The device infection event tables depict specific device-associated infections (central line-
associated bloodstream infections [CLABSI] or catheter-associated urinary tract infections
[CAUTI]) reported by acute care facilities within their intensive care units.
To understand the HAI report, it is important to know the meaning of each of the data elements
in the table. Below is an example of a fictitious hospital’s data. Each column is numbered and
provides an explanation of each data element and its result.
Table A. Device infection events in acute care facilities with intensive care units, Utah, 2013
Number of HAI device days
Number of HAI device events
Predicted number
of HAI device events
Standardized
Infection Ratio
95%
Confidence Interval
State of Utah # # # # #
Facility A 5,817 8 13 .62 0.26-1.21
1. Acute care facilities (hospitals) with intensive care units (ICU) are listed here by name
(Facility A).
2. For each reporting facility listed, patients in ICUs with central line catheters/urinary
catheters (devices) are identified every day. A device count is performed at the same time
each day. Each patient with one or more central line catheters at the time the count is
performed is counted as having one device day. Each patient with a urinary catheter at the
time the count is performed is counted as having one device day. For example, a patient
with one or more central line catheters and one urinary catheter would be counted as
having one central line day and one urinary catheter day. The number of device days in this
column (5,817) represents the total number of specific device days for all patients who were
in Facility A’s intensive care unit(s) during the year.
3. When a patient develops an HAI device-associated infection while having a device in place
or within one day after removal of the device, the infection is considered a device-
associated HAI if it meets the criteria set forth by NHSN. The number of HAI events in this
column (8) represents the total number of specific HAIs identified in patients in Facility A’s
intensive care units during the year.
4. The predicted number of HAI device events is adjusted to allow facilities to be more fairly
compared. Risk adjustments account for differences in patient populations in terms of
1 2 3 4 5 6

Healthcare-associated Infections in Utah 2013 Annual Report
24
severity of illness and other factors that may affect the risk of developing an HAI. A facility
that uses many devices on very sick patients would be predicted to have a higher device
infection rate than a facility that uses fewer devices and has healthier patients. The
predicted number of HAI device events for Facility A, based on comparison to a national HAI
benchmark of similar hospitals, is calculated as 13.
5. The standardized infection ratio (SIR) is a summary measure developed by NHSN to track
HAIs at the national, state, local or facility level over time. The SIR compares the total
number of HAI device events for Facility A (8) to the predicted number of HAI device events
(13), based on “standard population” data. For purposes of this report, the standard
population is HAI data reported nationally by thousands of facilities using NHSN. The SIR for
Facility A, based on comparison to a national HAI benchmark of facilities that are similar to
Facility A, is calculated as 0.62. Facilities with a predicted number of HAI events less than
one do not have enough device day data to reliably compare their data to the standard
population. Consequently, SIRs are not provided for healthcare facilities with a predicted
number less than one.
6. A confidence interval (CI) will be provided if an SIR was estimated for a given healthcare
facility. A CI describes the uncertainty associated with the SIR estimate. Facilities with more
device days will have a narrower CI, which means there is less doubt associated with the
accuracy of the SIR compared to facilities with fewer device days. This is because there is
more information about a facility's performance with additional device days. A 95% CI
means that 95 times out of 100, the true value would be expected to fall within the range
shown.
Healthcare-associated Infections in Utah 2013 Annual Report
25
Table 1. Central line-associated bloodstream infections in acute care facilities with intensive care units, Utah, 2013+
Number of central
line days1
Number of CLABSI
events2
Predicted
number of CLABSI
events3
Standardized Infection
Ratio4
95% Confidence
Interval5
State of Utah 62,270 86 130.07 0.66 0.53 - 0.81
Alta View Hospital 258 0 0.39 N/A± N/A±
American Fork Hospital 522 0 0.78 N/A± N/A±
Ashley Regional Medical Center 62 0 0.08 N/A± N/A±
Cache Valley Specialty Hospital 8 0 0.01 N/A± N/A±
Castleview Hospital 8 0 0.01 N/A± N/A±
Davis Hospital and Medical Center 1,030 3 1.63 1.84 0.47 - 5.01
Dixie Regional Medical Center 2,581 1 3.94 0.25 0.01 - 1.25
Intermountain Medical Center 11,654 9 25.80 0.35 0.17 - 0.64
Jordan Valley Medical Center* 1,771 1 2.57 0.39 0.02 - 1.92
Lakeview Hospital 680 0 1.02 0 0 - 2.94
LDS Hospital 1,575 2 2.36 0.85 0.14 - 2.80
Logan Regional Hospital 364 0 0.65 N/A± N/A±
McKay Dee Hospital 2,993 2 5.26 0.38 0.06 - 1.26
Mountain View Hospital 564 0 0.85 N/A± N/A±
Mountain West Medical Center 166 0 0.32 N/A± N/A±
Ogden Regional Medical Center 1,416 0 2.15 0 0 - 1.39
Primary Children’s Medical Center 10,561 20 25.35 0.79 0.50 - 1.20
Riverton Hospital 93 0 0.14 N/A± N/A±
Salt Lake Regional Medical Center 1,837 6 2.76 2.18 0.88 - 4.53
St. Mark’s Hospital*** – – – – –
Timpanogos Regional Hospital 1,807 1 2.84 0.35 0.02 - 1.74
Uintah Basin Medical Center 24 0 .04 N/A± N/A±
University Health Care** 11,525 25 31.43 0.80 0.53 - 1.16
Utah Valley Regional Medical Center 10,509 16 19.21 0.83 0.49 - 1.32
Valley View Medical Center 262 0 0.50 N/A± N/A±
+Source: NHSN data. *Includes Pioneer Valley Hospital. **Includes Huntsman Cancer Institute. ***Data incomplete at the time of reporting ISIR estimates are not reliable when the predicted number is less than one. Consequently, SIRs are not provided for
healthcare facilities with a predicted number less than one. 1Number of central line days: the total number of days that a patient has a central line. 2Number of central line-associated bloodstream infection events: the total number of central line-associated bloodstream infections reported per year.
3Predicted number of central line-associated bloodstream infection events: the number of central line-associated bloodstream infection events anticipated to occur based on historical data of comparable ICUs.
4Standardized Infection Ratio: compares the total number of central line-associated bloodstream infection events in a hospital’s ICU to a national benchmark. Rates are adjusted based on the type and size of a hospital or ICU.
5Confidence interval: A 95% confidence interval means that if the sampling of rates was repeated over more periods of time, 95 times out of 100, the true value would be expected to fall within the range shown.
Healthcare-associated Infections in Utah 2013 Annual Report
26
Table 2. Catheter-associated urinary tract infections in acute care facilities with
intensive care units, Utah, 2013+
Number
of
catheter days1
Number
of CAUTI events2
Predicted
number
of CAUTI events3
Standardized
Infection Ratio4
95%
Confidence Interval5
State of Utah 55,067 200 119 1.68 1.46 - 1.93
Alta View Hospital 477 0 0.62 N/A± N/A±
American Fork Hospital 616 1 0.80 N/A± N/A±
Ashley Regional Medical Center 185 0 0.24 N/A± N/A±
Cache Valley Specialty Hospital 9 0 0.01 N/A± N/A±
Castleview Hospital 144 0 0.19 N/A± N/A±
Davis Hospital and Medical Center 1,333 2 1.73 1.15 0.19 - 3.81
Dixie Regional Medical Center 2,958 2 3.55 0.56 0.09 - 1.86
Intermountain Medical Center 13,659 62 39.01 1.59 1.23 - 2.02
Jordan Valley Medical Center* 2,274 3 2.84 1.06 0.27 - 2.88
Lakeview Hospital 958 0 1.25 0 0 - 2.41
LDS Hospital 1,782 4 2.14 1.87 0.59 - 4.51
Logan Regional Hospital 680 1 1.36 0.74 0.04 - 3.63
McKay Dee Hospital 2,991 15 3.59 4.18 2.43 - 6.74
Mountain View Hospital 660 1 0.86 N/A± N/A±
Mountain West Medical Center 286 1 0.57 N/A± N/A±
Ogden Regional Medical Center 880 1 1.14 0.87 0.04 - 4.31
Primary Children’s Medical Center 1,539 5 4.25 1.18 0.43 - 2.61
Riverton Hospital 237 0 0.31 N/A± N/A±
Salt Lake Regional Medical Center 1,840 2 2.21 0.91 0.15 - 2.99
St. Mark’s Hospital*** – – – – –
Timpanogos Regional Hospital 802 0 1.60 0 0 - 1.87
Uintah Basin Medical Center 101 0 0.13 N/A± N/A±
University Health Care** 11,397 60 35.69 1.68 1.29 - 2.15
Utah Valley Regional Medical Center 8,728 40 13.84 2.89 2.09 - 3.90
Valley View Medical Center 531 0 1.06 0 0 - 2.82
+Source: NHSN data. *Includes Pioneer Valley Hospital. **Includes Huntsman Cancer Institute. ***Data incomplete at the time of reporting
ISIR estimates are not reliable when the predicted number is less than one. Consequently, SIRs are not provided for
healthcare facilities with a predicted number less than one.
1Number of catheter days: the total number of days that a patient has a urinary catheter. 2Number of CAUTI events: the total number of catheter-associated urinary tract infections reported per year. 3Predicted number of CAUTI events: the number of catheter-associated urinary tract infections anticipated to occur based on historical data of comparable ICUs.
4Standardized Infection Ratio: compares the total number of catheter-associated urinary tract infections in a hospital’s ICU to a national benchmark. Rates are adjusted based on the type and size of a hospital or ICU.
5Confidence interval: A 95% confidence interval means that if the sampling of rates was repeated over more periods of time, 95 times out of 100, the true value would be expected to fall within the range shown.
Healthcare-associated Infections in Utah 2013 Annual Report
27
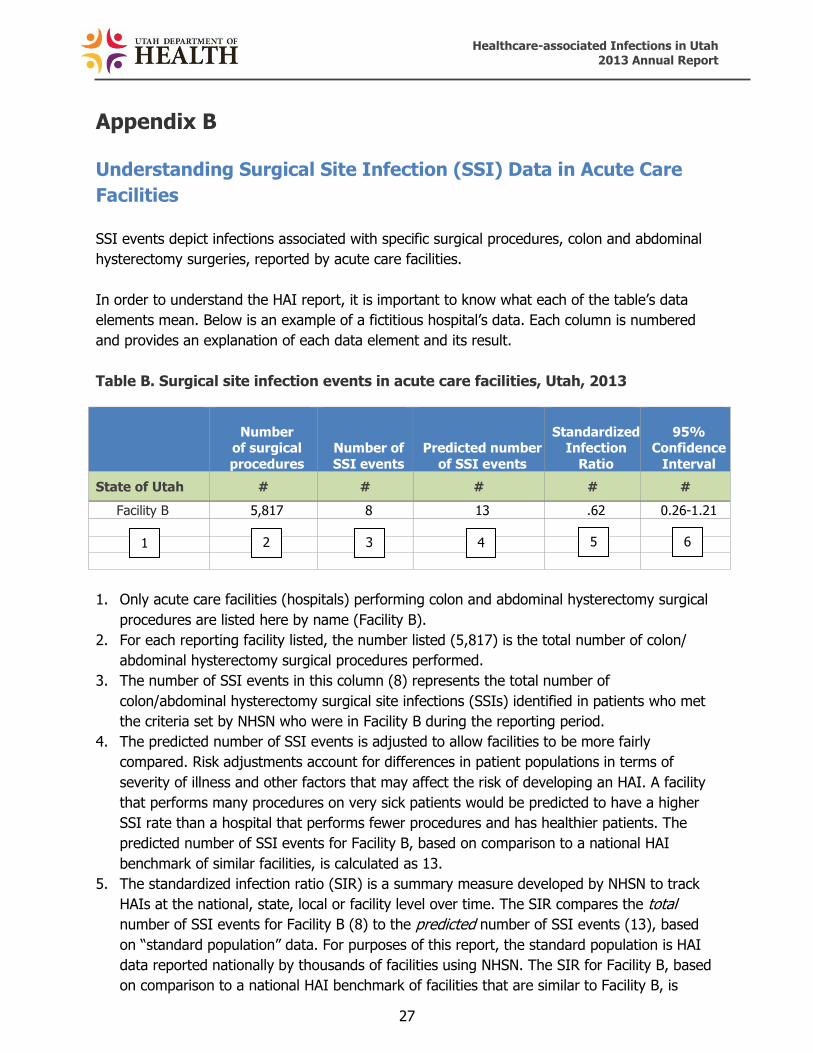
Appendix B
Understanding Surgical Site Infection (SSI) Data in Acute Care
Facilities
SSI events depict infections associated with specific surgical procedures, colon and abdominal
hysterectomy surgeries, reported by acute care facilities.
In order to understand the HAI report, it is important to know what each of the table’s data
elements mean. Below is an example of a fictitious hospital’s data. Each column is numbered
and provides an explanation of each data element and its result.
Table B. Surgical site infection events in acute care facilities, Utah, 2013
Number of surgical
procedures
Number of
SSI events
Predicted number
of SSI events
Standardized Infection
Ratio
95% Confidence
Interval
State of Utah # # # # #
Facility B 5,817 8 13 .62 0.26-1.21
1. Only acute care facilities (hospitals) performing colon and abdominal hysterectomy surgical
procedures are listed here by name (Facility B).
2. For each reporting facility listed, the number listed (5,817) is the total number of colon/
abdominal hysterectomy surgical procedures performed.
3. The number of SSI events in this column (8) represents the total number of
colon/abdominal hysterectomy surgical site infections (SSIs) identified in patients who met
the criteria set by NHSN who were in Facility B during the reporting period.
4. The predicted number of SSI events is adjusted to allow facilities to be more fairly
compared. Risk adjustments account for differences in patient populations in terms of
severity of illness and other factors that may affect the risk of developing an HAI. A facility
that performs many procedures on very sick patients would be predicted to have a higher
SSI rate than a hospital that performs fewer procedures and has healthier patients. The
predicted number of SSI events for Facility B, based on comparison to a national HAI
benchmark of similar facilities, is calculated as 13.
5. The standardized infection ratio (SIR) is a summary measure developed by NHSN to track
HAIs at the national, state, local or facility level over time. The SIR compares the total
number of SSI events for Facility B (8) to the predicted number of SSI events (13), based
on “standard population” data. For purposes of this report, the standard population is HAI
data reported nationally by thousands of facilities using NHSN. The SIR for Facility B, based
on comparison to a national HAI benchmark of facilities that are similar to Facility B, is
1 2 3 4 5 6
Healthcare-associated Infections in Utah 2013 Annual Report
28
calculated as 0.62. Facilities with a predicted number of HAI events less than one do not
have enough data to reliably compare their data to the standard population. Consequently,
SIRs are not provided for healthcare facilities with a predicted number less than one.
6. A confidence interval (CI) will be provided if an SIR was estimated for a given facility. A CI
describes the uncertainty associated with the SIR estimate. Facilities performing more
procedures will have a narrower CI, which means there is less doubt associated with the
accuracy of the SIR compared to facilities performing fewer procedures. This is because
there is more information about a facility's performance with additional procedures. A 95%
CI means that 95 times out of 100, the true value would be expected to fall within the
range shown.
Healthcare-associated Infections in Utah 2013 Annual Report
29
Table 3. Surgical site infections associated with colon surgeries in acute care facilities, Utah, 2013+
Number of
colon surgeries1
Number
of colon events2
Predicted number
of colon events3
Standardized
Infection Ratio4
95%
Confidence Interval5
State of Utah 1,996 93 63.08 1.47 1.20 - 1.80
Alta View Hospital 39 3 1.07 2.80 0.71 - 7.61
American Fork Hospital 69 2 1.88 1.06 0.18 - 3.52
Ashley Regional Medical Center 3 0 0.08 N/A± N/A±
Bear River Valley Hospital 1 0 0.03 N/A± N/A±
Brigham City Community Hospital 22 0 0.70 N/A± N/A±
Cache Valley Specialty Hospital 4 0 0.13 N/A± N/A±
Castleview Hospital 17 1 0.49 N/A± N/A±
Davis Hospital and Medical Center 57 0 1.60 0 0 - 1.87
Dixie Regional Medical Center 160 2 5.33 0.38 0.06 - 1.24
Garfield Memorial Hospital * * * * *
Intermountain Medical Center 223 15 7.09 2.12 1.23 - 3.41
Jordan Valley Medical Center# 38 3 1.16 2.58 0.66 - 7.01
Lakeview Hospital 25 0 0.74 N/A± N/A±
LDS Hospital 188 13 6.04 2.15 1.20 - 3.59
Logan Regional Hospital 42 4 1.21 3.30 1.05 - 7.97
Lone Peak Hospital * * * * *
McKay Dee Hospital 177 13 5.46 2.38 1.32 - 3.97
Mountain View Hospital 23 2 0.71 N/A± N/A±
Mountain West Medical Center 8 0 0.24 N/A± N/A±
Ogden Regional Medical Center 79 3 2.76 1.09 0.28 - 2.97
Orem Community Hospital 0 0 0 N/A± N/A±
Park City Medical Center 12 0 0.35 N/A± N/A±
Primary Children’s Medical Center 7 0 0.41 N/A± N/A±
Riverton Hospital 35 3 1.15 2.62 0.67 - 7.13
Salt Lake Regional Medical Center 20 1 0.58 N/A± N/A±
Sevier Valley Medical Center 10 0 0.27 N/A± N/A±
Shriners Hospitals for Children * * * * *
St. Mark’s Hospital 202 8 6.34 1.26 0.59 - 2.40
The Orthopedic Specialty Hospital * * * * *
Timpanogos Regional Hospital 57 0 1.72 0 0 - 1.75
Uintah Basin Medical Center 14 0 0.41 N/A± N/A±
University Health Care§ 244 12 7.84 1.53 0.83 - 2.60
Utah Valley Regional Medical Center 181 8 6.12 1.31 0.61 - 2.48
Valley View Medical Center 39 0 1.20 0 0 - 2.49
Veterans Administration Hospital * * * * * +Source: NHSN data. #Includes Pioneer Valley Hospital. §Includes Huntsman Cancer Institute.
ISIR estimates are not reliable when the expected number is less than one. Consequently, SIRs are not provided for
healthcare facilities with a predicted number less than one. *Not required to report to CMS. 1Number of colon surgeries: the total number of colon surgeries reported per year. 2Number of colon events: the total number of SSI infections associated with colon surgeries reported per year. 3Predicted number of colon events: the number of SSI infections associated with colon surgeries anticipated to occur based on historical data of comparable acute care facilities.
4Standardized Infection Ratio: compares the total number of colon surgeries in a hospital’s ICU to a national benchmark. Rates are adjusted based on the type and size of a hospital or ICU.
5Confidence interval: A 95% confidence interval means that if the sampling of rates was repeated over more periods of time, 95 times out of 100, the true value would be expected to fall within the range shown.

Healthcare-associated Infections in Utah 2013 Annual Report
30
Table 4. Surgical site infections associated with abdominal hysterectomy surgeries in acute care facilities, Utah, 2013+
Number
of abdominal
hyst1
Number of
abdominal hyst
events2
Predicted number of
abdominal hyst
events3
Standardized Infection
Ratio4
95% Confidence
Interval5
State of Utah 2,529 32 23.32 1.37 0.96 – 1.91
Alta View Hospital 55 0 0.53 N/A± N/A±
American Fork Hospital 92 3 0.68 N/A± N/A±
Ashley Regional Medical Center 22 0 0.18 N/A± N/A±
Bear River Valley Hospital 0 0 0 N/A± N/A±
Brigham City Community Hospital 34 0 0.43 N/A± N/A±
Cache Valley Specialty Hospital 2 0 0.03 N/A± N/A±
Castleview Hospital 9 0 0.08 N/A± N/A±
Davis Hospital and Medical Center 235 0 1.86 0 0 - 1.61
Dixie Regional Medical Center 43 0 0.36 N/A± N/A±
Garfield Memorial Hospital * * * * *
Intermountain Medical Center 243 3 2.18 1.38 0.35 - 3.75
Jordan Valley Medical Center# 53 2 0.35 N/A± N/A±
Lakeview Hospital 29 0 0.34 N/A± N/A±
LDS Hospital 197 6 1.86 3.22 1.31 - 6.71
Logan Regional Hospital 42 0 0.45 N/A± N/A±
Lone Peak Hospital * * * * *
McKay Dee Hospital 159 2 1.54 1.30 0.22 - 4.29
Mountain View Hospital 36 0 0.36 N/A± N/A±
Mountain West Medical Center 16 1 0.16 N/A± N/A±
Ogden Regional Medical Center 189 0 2.41 0 0 - 1.24
Orem Community Hospital 22 1 0.17 N/A± N/A±
Park City Medical Center 18 1 0.13 N/A± N/A±
Primary Children’s Medical Center 0 0 0 N/A± N/A±
Riverton Hospital 193 2 1.77 1.13 0.19 - 3.74
Salt Lake Regional Medical Center 32 1 0.26 N/A± N/A±
Sevier Valley Medical Center 8 0 0.05 N/A± N/A±
Shriners Hospitals for Children * * * * *
St. Mark’s Hospital 166 5 1.51 3.31 1.21 - 7.34
The Orthopedic Specialty Hospital * * * * *
Timpanogos Regional Hospital 110 0 0.87 N/A± N/A±
Uintah Basin Medical Center 19 0 0.18 N/A± N/A±
University Health Care§ 272 4 2.55 1.57 0.50 - 3.78
Utah Valley Regional Medical Center 207 1 1.80 0.56 0.03 - 2.74
Valley View Medical Center 26 0 0.23 N/A± N/A±
Veterans Administration Hospital * * * * * +Source: NHSN data. #Includes Pioneer Valley Hospital. §Includes Huntsman Cancer Institute. ISIR estimates are not reliable when the predicted number is less than one. Consequently, SIRs are not provided for
healthcare facilities with a predicted number less than one. *Not required to report to CMS. 1Number of abdominal hysterectomies: the total number of abdominal hysterectomies reported per year. 2Number of abdominal hyst events: the total number of SSI infections associated with abdominal hysterectomies reported per year. 3Predicted number of abdominal hyst events: the number of abdominal hysterectomies anticipated to occur based on historical data of comparable acute care facilities.
4Standardized Infection Ratio: compares the total number of abdominal hysterectomies in a hospital’s ICU to a national benchmark. Rates are adjusted based on the type and size of a hospital or ICU.
5Confidence interval: A 95% confidence interval means that if the sampling of rates was repeated over more periods of time, 95 times out of 100, the true value would be expected to fall within the range shown.

Healthcare-associated Infections in Utah 2013 Annual Report
31
Appendix C
Understanding C. difficile and MRSA Bacteremia Data in Acute
Care Facilities
The tables depict Clostridium difficile infections (CDI) and Methicillin-resistant Staphylococcus
aureus (MRSA) bacteremia infections reported by acute care facilities.
In order to understand the HAI report, it is important to know what each of the table’s data
elements mean. Below is an example of a fictitious hospital’s data. Each column is numbered
and provides an explanation of each data element and its result.
Table C. Bacterial infection events in acute care facilities, Utah, 2013
Number
of patient days
Number of
infections
Predicted number
of infections
Standardized Infection
Ratio
95% Confidence
Interval
State of Utah # # # # #
Facility C 5,817 8 13 .62 0.26-1.21
1. Acute care facilities are listed here by name (Facility C).
2. For each reporting facility listed, the number listed (5,817) is the total number of days
patients have stayed at that facility.
3. When a patient develops a CDI or MRSA bacteremia infection, the infection is considered an
HAI if it meets the criteria set forth by NHSN. The number of HAI events in this column (8)
represents the total number of specific HAIs identified in patients in Facility C during the
year.
4. The predicted number of infections is adjusted to allow facilities to be more fairly compared.
Risk adjustments account for differences in patient populations in terms of severity of illness
and other factors that may affect the risk of developing an HAI. A facility that generally has
more severely ill patients would be predicted to have a higher rate than a facility that has
healthier patients. The predicted number of infections for Facility C, based on comparison to
a national HAI benchmark of similar facilities, is calculated as 13.
5. The standardized infection ratio (SIR) is a summary measure developed by NHSN to track
HAIs at the national, state, local or facility level over time. The SIR compares the total
number of infections for Facility C (8) to the predicted number of infections (13), based on
“standard population” data. For purposes of this report, the standard population is HAI data
reported nationally by thousands of facilities using NHSN. The SIR for Facility C, based on
comparison to a national HAI benchmark of facilities that are similar to Facility C, is
calculated as 0.62. Facilities with a predicted number of HAI events less than one do not
1 2 3 4 5 6

Healthcare-associated Infections in Utah 2013 Annual Report
32
have enough data to reliably compare their data to the standard population. Consequently,
SIRs are not provided for healthcare facilities with a predicted number less than one.
6. A confidence interval (CI) will be provided if an SIR was estimated for a given facility. A CI
describes the uncertainty associated with the SIR estimate. Facilities performing with more
patient days will have a narrower CI, which means there is less doubt associated with the
accuracy of the SIR compared to facilities performing fewer procedures. This is because
there is more information about a facility's performance with additional patient days. A 95%
CI means that 95 times out of 100, the true value would be expected to fall within the
range shown.
Healthcare-associated Infections in Utah 2013 Annual Report
33
Table 5. C. difficile infections in acute care facilities, Utah, 2013+
Number
of patient
days1
Number
of C. diff events2
Predicted number of
C. diff events3
Standardized
Infection
Ratio4
95%
Confidence
Interval5
State of Utah 801,038 467 556.40 0.84 0.77 - 0.92
Alta View Hospital 9,828 3 5.35 0.56 0.14 - 1.53
American Fork Hospital 16,424 5 7.76 0.64 0.24 - 1.43
Ashley Regional Medical Center 3,835 0 1.76 0 0 - 1.71
Bear River Valley Hospital 807 0 0.60 N/A± N/A±
Beaver Valley Hospital 795 0 0.39 N/A± N/A±
Brigham City Community Hospital 2,475 0 1.15 0 0 - 2.60
Cache Valley Specialty Hospital 1,978 1 1.08 0.93 0.05 - 4.57
Castleview Hospital 4,965 2 2.92 0.69 0.12 - 2.26
Davis Hospital and Medical Center 20,924 7 10.61 0.66 0.29 - 1.31
Dixie Regional Medical Center 46,456 21 24.25 0.87 0.55 - 1.30
Garfield Memorial Hospital 651 0 0.32 N/A± N/A±
Intermountain Medical Center 105,295 81 78.57 1.03 0.82 - 1.28
Jordan Valley Medical Center# 24,240 22 17.73 1.24 0.80 - 1.85
Lakeview Hospital 16,949 15 11.72 1.28 0.74 - 2.06
LDS Hospital 44,844 32 29.25 1.09 0.76 - 1.53
Logan Regional Hospital 17,630 4 9.37 0.43 0.14 - 1.03
Lone Peak Hospital * * * * *
McKay Dee Hospital 76,587 15 47.61 0.32 0.18 - 0.51
Mountain View Hospital 9,494 4 5.10 0.79 0.25 - 1.89
Mountain West Medical Center 4,398 2 1.95 1.03 0.17 - 3.39
Ogden Regional Medical Center 21,966 1 11.04 0.09 0.01 - 0.45
Orem Community Hospital 2,701 0 1.18 0 0 - 2.54
Park City Medical Center 2,307 2 1.07 1.87 0.31 - 6.17
Primary Children's Hospital 52,551 45 46.49 0.97 0.72 - 1.28
Riverton Hospital 12,068 6 5.83 1.03 0.42 - 2.14
Salt Lake Regional Medical Center 21,056 15 13.83 1.08 0.63 - 1.75
Sevier Valley Medical Center 1,843 0 0.88 N/A± N/A±
Shriners Hospitals for Children * * * * *
St. Mark's Hospital 52,062 38 41.66 0.91 0.66 - 1.24
The Orthopedic Specialty Hospital 5,239 0 2.33 0 0 - 1.287
Timpanogos Regional Hospital 12,143 4 7.51 0.53 0.17 - 1.29
Uintah Basin Medical Center 4,946 1 2.89 0.35 0.02 - 1.71
University Health Care§ 123,545 111 114.48 0.97 0.80 - 1.16
Utah Valley Regional Medical Center 73,663 28 46.68 0.60 0.41 - 0.86
Valley View Medical Center 6,373 2 3.07 0.65 0.11 - 2.15
Veterans Administration Hospital * * * * * +Source: NHSN data #Includes Pioneer Valley Hospital. §Includes Huntsman Cancer Institute. ISIR estimates are not reliable when the predicted number is less than one. Consequently, SIRs are not provided for healthcare
facilities with a predicted number less than one. *Not required to report to CMS.
1Number of patient days: the total number of days that patients stay at a facility per year 2Number of C. diff events: the total number of C diff infections reported per year.. 3Predicted number of C. diff events: the number of C. diff infections anticipated to occur based on historical data of comparable ICUs. 4Standardized Infection Ratio: compares the total number of C. diff infections in a facility to a national benchmark. Rates are adjusted based on the type and size of the facility. 5Confidence interval: A 95% confidence interval means that if the sampling of rates was repeated over more periods of time, 95 times out of 100, the true value would be expected to fall within the range shown.
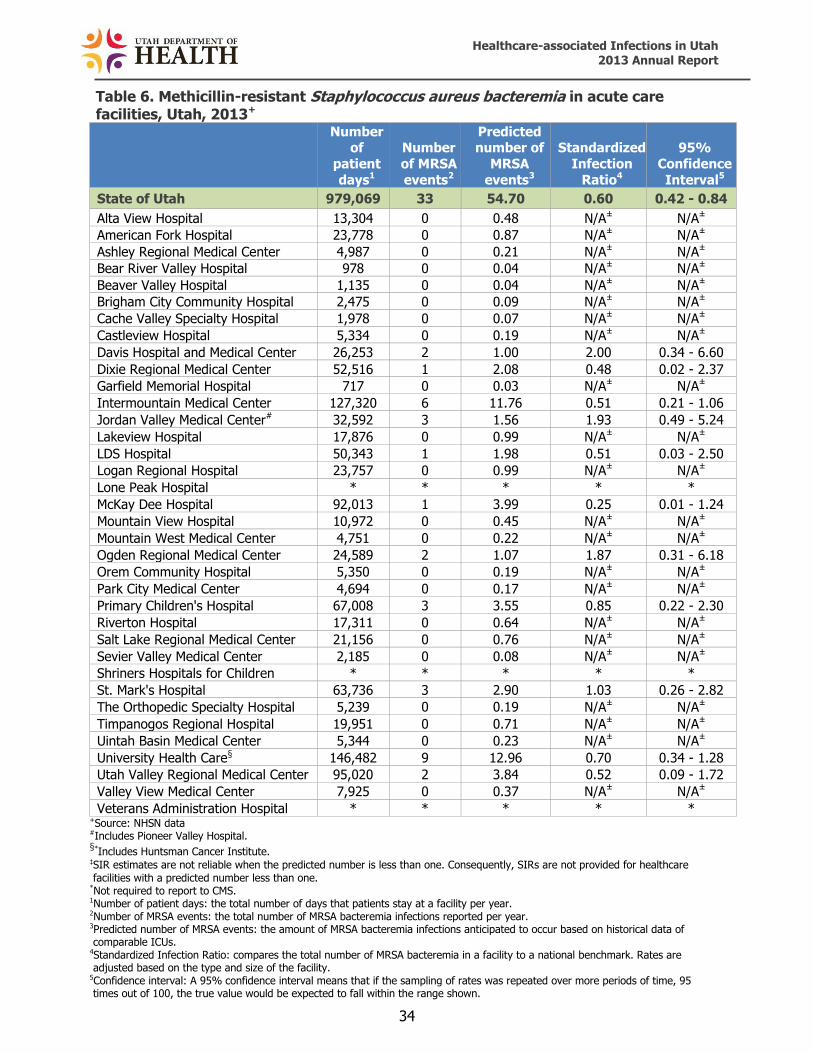
Healthcare-associated Infections in Utah 2013 Annual Report
34
Table 6. Methicillin-resistant Staphylococcus aureus bacteremia in acute care facilities, Utah, 2013+
Number of
patient
days1
Number
of MRSA
events2
Predicted number of
MRSA
events3
Standardized
Infection
Ratio4
95%
Confidence
Interval5
State of Utah 979,069 33 54.70 0.60 0.42 - 0.84
Alta View Hospital 13,304 0 0.48 N/A± N/A±
American Fork Hospital 23,778 0 0.87 N/A± N/A±
Ashley Regional Medical Center 4,987 0 0.21 N/A± N/A±
Bear River Valley Hospital 978 0 0.04 N/A± N/A±
Beaver Valley Hospital 1,135 0 0.04 N/A± N/A±
Brigham City Community Hospital 2,475 0 0.09 N/A± N/A±
Cache Valley Specialty Hospital 1,978 0 0.07 N/A± N/A±
Castleview Hospital 5,334 0 0.19 N/A± N/A±
Davis Hospital and Medical Center 26,253 2 1.00 2.00 0.34 - 6.60
Dixie Regional Medical Center 52,516 1 2.08 0.48 0.02 - 2.37
Garfield Memorial Hospital 717 0 0.03 N/A± N/A±
Intermountain Medical Center 127,320 6 11.76 0.51 0.21 - 1.06
Jordan Valley Medical Center# 32,592 3 1.56 1.93 0.49 - 5.24
Lakeview Hospital 17,876 0 0.99 N/A± N/A±
LDS Hospital 50,343 1 1.98 0.51 0.03 - 2.50
Logan Regional Hospital 23,757 0 0.99 N/A± N/A±
Lone Peak Hospital * * * * *
McKay Dee Hospital 92,013 1 3.99 0.25 0.01 - 1.24
Mountain View Hospital 10,972 0 0.45 N/A± N/A±
Mountain West Medical Center 4,751 0 0.22 N/A± N/A±
Ogden Regional Medical Center 24,589 2 1.07 1.87 0.31 - 6.18
Orem Community Hospital 5,350 0 0.19 N/A± N/A±
Park City Medical Center 4,694 0 0.17 N/A± N/A±
Primary Children's Hospital 67,008 3 3.55 0.85 0.22 - 2.30
Riverton Hospital 17,311 0 0.64 N/A± N/A±
Salt Lake Regional Medical Center 21,156 0 0.76 N/A± N/A±
Sevier Valley Medical Center 2,185 0 0.08 N/A± N/A±
Shriners Hospitals for Children * * * * *
St. Mark's Hospital 63,736 3 2.90 1.03 0.26 - 2.82
The Orthopedic Specialty Hospital 5,239 0 0.19 N/A± N/A±
Timpanogos Regional Hospital 19,951 0 0.71 N/A± N/A±
Uintah Basin Medical Center 5,344 0 0.23 N/A± N/A±
University Health Care§ 146,482 9 12.96 0.70 0.34 - 1.28
Utah Valley Regional Medical Center 95,020 2 3.84 0.52 0.09 - 1.72
Valley View Medical Center 7,925 0 0.37 N/A± N/A±
Veterans Administration Hospital * * * * * +Source: NHSN data #Includes Pioneer Valley Hospital. §*Includes Huntsman Cancer Institute. ISIR estimates are not reliable when the predicted number is less than one. Consequently, SIRs are not provided for healthcare
facilities with a predicted number less than one. *Not required to report to CMS. 1Number of patient days: the total number of days that patients stay at a facility per year.
2Number of MRSA events: the total number of MRSA bacteremia infections reported per year. 3Predicted number of MRSA events: the amount of MRSA bacteremia infections anticipated to occur based on historical data of comparable ICUs. 4Standardized Infection Ratio: compares the total number of MRSA bacteremia in a facility to a national benchmark. Rates are adjusted based on the type and size of the facility. 5Confidence interval: A 95% confidence interval means that if the sampling of rates was repeated over more periods of time, 95 times out of 100, the true value would be expected to fall within the range shown.

Healthcare-associated Infections in Utah 2013 Annual Report
35
Appendix D
Understanding CLABSI and CAUTI Rates in Long-term Acute Care
Facilities with Intensive Care Units and Wards or Inpatient
Rehabilitation Facilities
The device infection event tables depict specific device-associated infections (central line-
associated bloodstream infections [CLABSI], catheter-associated urinary tract infections
[CAUTI]), reported by long-term acute care facilities with intensive care units and inpatient
rehabilitation facilities.
To understand the HAI report, it is important to know what each of the data elements in the
table mean. Below is an example of fictitious data from a long-term acute care facility (LTAC) or
inpatient rehabilitation facility (IRF). Each column is numbered and provides an explanation of
each data element and its result.
Table D. Device infection events in long-term acute care facilities with intensive care units and wards or inpatient rehabilitation facilities, Utah, 2013
Number of HAI device days
Number of HAI device events
Incidence rate
per 1,000 device days
Confidence
interval for HAI rate
State of Utah # # # #
Facility D 5,817 8 1.36 0.64-2.56
1. Long-term acute care facilities or inpatient rehabilitation facilities are listed here by name
(Facility D).
2. For each reporting facility listed, patients with central line catheters/urinary catheters
(devices) are identified every day. A device count is performed at the same time each day.
Each patient with one or more central line catheters at the time the count is performed is
counted as having one device day. Each patient with a urinary catheter at the time the count
is performed is counted as having one device day. For example, a patient with one or more
central line catheters and one urinary catheter would be counted as having one central line
day and one urinary catheter day. The number of device days in this column (5,817)
represents the total number of device days for patients with that specific device who were in
Facility D during the year.
3. When a patient develops an HAI device-associated infection while having a device in place or
within one day after removal of the device, the infection is considered a device-associated
HAI if it meets the criteria set forth by NHSN. The number of HAI events in this column (8)
1 2 3 4 5
Healthcare-associated Infections in Utah 2013 Annual Report
36
represents the total number of specific HAIs identified in patients in Facility D during the
year.
4. An incidence rate is a summary measure developed by NHSN to track HAIs at the national,
state, local or facility level over time, and describes how frequently HAIs occur within a
specific period. This rate is calculated by taking the number of device events (8), dividing it
by the total number of device days (5,817), and multiplying that by the desired time frame
(1,000 device days). A result of 1.36 communicates that 1.36 HAI events are occurring every
1,000 device days at Facility D.
5. A confidence interval (CI) describes the uncertainty associated with the incidence rate
estimate. Facilities with more device days or more HAI events will have a narrower CI, which
means there is less doubt associated with the accuracy of that rate compared to facilities
with fewer device days or events. This is because there is more information about a facility's
performance with additional device days. A 95% CI means that 95 times out of 100, the true
value would be expected to fall within the range shown in the table.
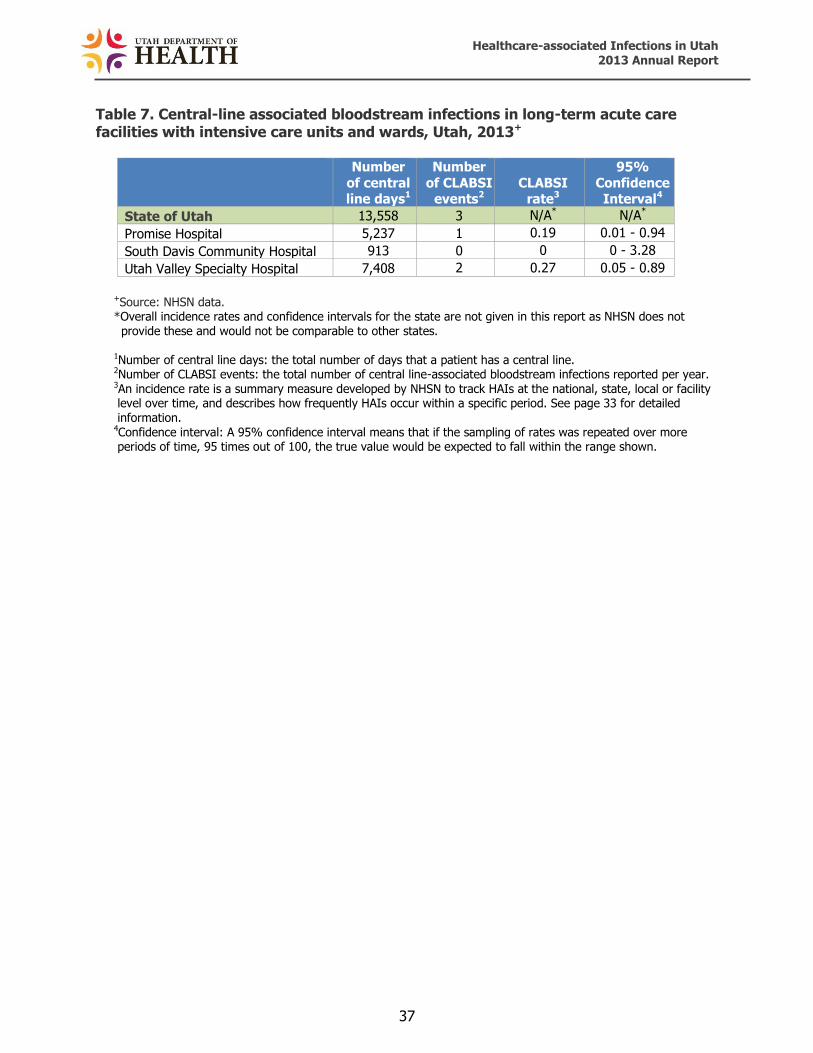
Healthcare-associated Infections in Utah 2013 Annual Report
37
Table 7. Central-line associated bloodstream infections in long-term acute care facilities with intensive care units and wards, Utah, 2013+
Number
of central line days1
Number
of CLABSI events2
CLABSI rate3
95%
Confidence Interval4
State of Utah 13,558 3 N/A* N/A*
Promise Hospital 5,237 1 0.19 0.01 - 0.94
South Davis Community Hospital 913 0 0 0 - 3.28
Utah Valley Specialty Hospital 7,408 2 0.27 0.05 - 0.89
+Source: NHSN data. *Overall incidence rates and confidence intervals for the state are not given in this report as NHSN does not provide these and would not be comparable to other states.
1Number of central line days: the total number of days that a patient has a central line. 2Number of CLABSI events: the total number of central line-associated bloodstream infections reported per year. 3An incidence rate is a summary measure developed by NHSN to track HAIs at the national, state, local or facility level over time, and describes how frequently HAIs occur within a specific period. See page 33 for detailed information. 4Confidence interval: A 95% confidence interval means that if the sampling of rates was repeated over more periods of time, 95 times out of 100, the true value would be expected to fall within the range shown.
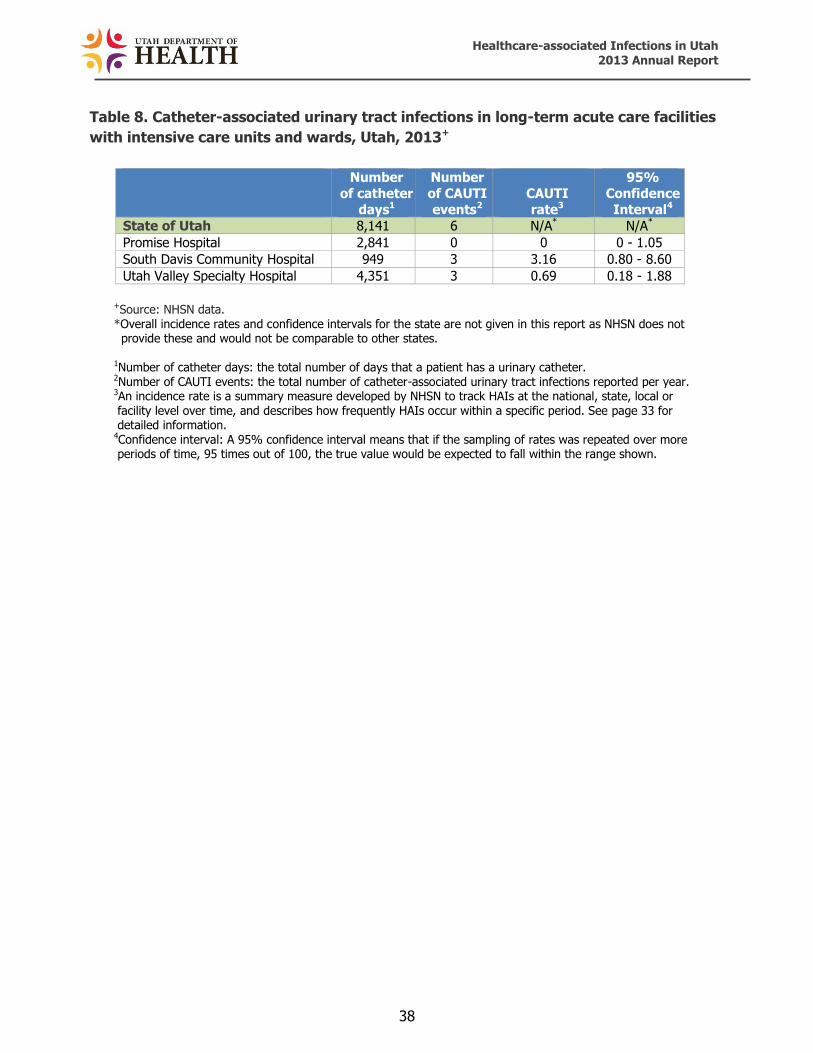
Healthcare-associated Infections in Utah 2013 Annual Report
38
Table 8. Catheter-associated urinary tract infections in long-term acute care facilities
with intensive care units and wards, Utah, 2013+
Number
of catheter
days1
Number
of CAUTI
events2
CAUTI
rate3
95%
Confidence
Interval4
State of Utah 8,141 6 N/A* N/A*
Promise Hospital 2,841 0 0 0 - 1.05
South Davis Community Hospital 949 3 3.16 0.80 - 8.60
Utah Valley Specialty Hospital 4,351 3 0.69 0.18 - 1.88
+Source: NHSN data. *Overall incidence rates and confidence intervals for the state are not given in this report as NHSN does not provide these and would not be comparable to other states.
1Number of catheter days: the total number of days that a patient has a urinary catheter. 2Number of CAUTI events: the total number of catheter-associated urinary tract infections reported per year. 3An incidence rate is a summary measure developed by NHSN to track HAIs at the national, state, local or facility level over time, and describes how frequently HAIs occur within a specific period. See page 33 for detailed information. 4Confidence interval: A 95% confidence interval means that if the sampling of rates was repeated over more periods of time, 95 times out of 100, the true value would be expected to fall within the range shown.
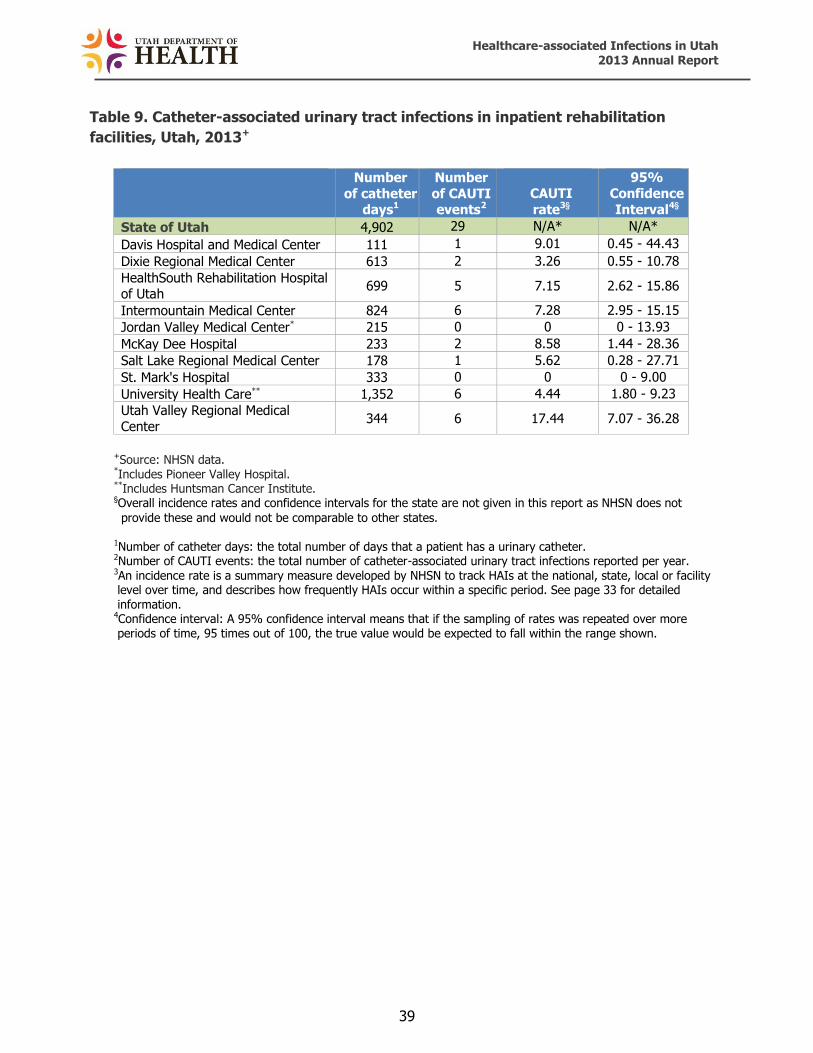
Healthcare-associated Infections in Utah 2013 Annual Report
39
Table 9. Catheter-associated urinary tract infections in inpatient rehabilitation
facilities, Utah, 2013+
Number
of catheter days1
Number
of CAUTI events2
CAUTI
rate3'
95%
Confidence
Interval4'
State of Utah 4,902 29 N/A* N/A*
Davis Hospital and Medical Center 111 1 9.01 0.45 - 44.43
Dixie Regional Medical Center 613 2 3.26 0.55 - 10.78
HealthSouth Rehabilitation Hospital of Utah
699 5 7.15 2.62 - 15.86
Intermountain Medical Center 824 6 7.28 2.95 - 15.15
Jordan Valley Medical Center* 215 0 0 0 - 13.93
McKay Dee Hospital 233 2 8.58 1.44 - 28.36
Salt Lake Regional Medical Center 178 1 5.62 0.28 - 27.71
St. Mark's Hospital 333 0 0 0 - 9.00
University Health Care** 1,352 6 4.44 1.80 - 9.23
Utah Valley Regional Medical
Center 344 6 17.44 7.07 - 36.28
+Source: NHSN data. *Includes Pioneer Valley Hospital. **Includes Huntsman Cancer Institute. 'Overall incidence rates and confidence intervals for the state are not given in this report as NHSN does not
provide these and would not be comparable to other states. 1Number of catheter days: the total number of days that a patient has a urinary catheter. 2Number of CAUTI events: the total number of catheter-associated urinary tract infections reported per year. 3An incidence rate is a summary measure developed by NHSN to track HAIs at the national, state, local or facility level over time, and describes how frequently HAIs occur within a specific period. See page 33 for detailed information. 4Confidence interval: A 95% confidence interval means that if the sampling of rates was repeated over more periods of time, 95 times out of 100, the true value would be expected to fall within the range shown.
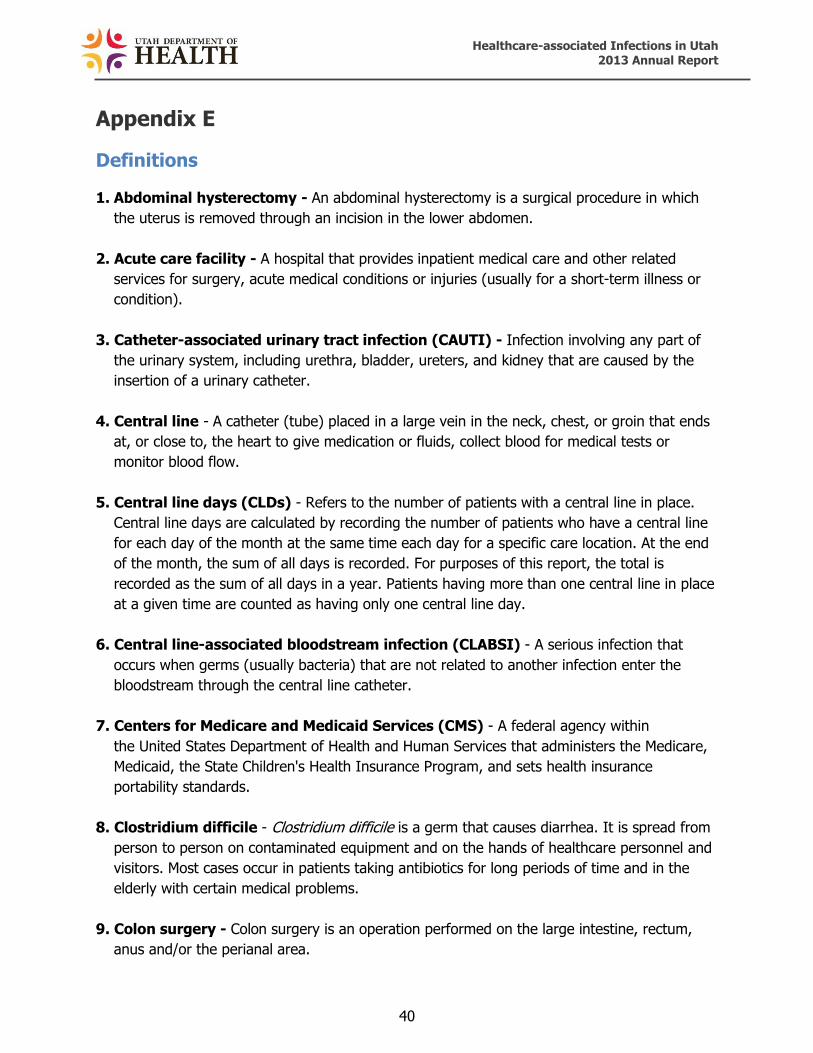
Healthcare-associated Infections in Utah 2013 Annual Report
40
Appendix E
Definitions 1. Abdominal hysterectomy - An abdominal hysterectomy is a surgical procedure in which
the uterus is removed through an incision in the lower abdomen.
2. Acute care facility - A hospital that provides inpatient medical care and other related
services for surgery, acute medical conditions or injuries (usually for a short-term illness or
condition).
3. Catheter-associated urinary tract infection (CAUTI) - Infection involving any part of
the urinary system, including urethra, bladder, ureters, and kidney that are caused by the
insertion of a urinary catheter.
4. Central line - A catheter (tube) placed in a large vein in the neck, chest, or groin that ends
at, or close to, the heart to give medication or fluids, collect blood for medical tests or
monitor blood flow.
5. Central line days (CLDs) - Refers to the number of patients with a central line in place.
Central line days are calculated by recording the number of patients who have a central line
for each day of the month at the same time each day for a specific care location. At the end
of the month, the sum of all days is recorded. For purposes of this report, the total is
recorded as the sum of all days in a year. Patients having more than one central line in place
at a given time are counted as having only one central line day.
6. Central line-associated bloodstream infection (CLABSI) - A serious infection that
occurs when germs (usually bacteria) that are not related to another infection enter the
bloodstream through the central line catheter.
7. Centers for Medicare and Medicaid Services (CMS) - A federal agency within
the United States Department of Health and Human Services that administers the Medicare,
Medicaid, the State Children's Health Insurance Program, and sets health insurance
portability standards.
8. Clostridium difficile - Clostridium difficile is a germ that causes diarrhea. It is spread from
person to person on contaminated equipment and on the hands of healthcare personnel and
visitors. Most cases occur in patients taking antibiotics for long periods of time and in the
elderly with certain medical problems.
9. Colon surgery - Colon surgery is an operation performed on the large intestine, rectum,
anus and/or the perianal area.

Healthcare-associated Infections in Utah 2013 Annual Report
41
10. Confidence interval (CI) - A statistical measure of the precision of a rate estimate. It is a
plus-or-minus range around the infection rate reported. A 95% confidence interval means
that if the sampling of rates was repeated over more periods of time, 95 times out of 100,
the true value would be expected to fall within the range shown.
11. Dialysis - Kidney dialysis is a life-support treatment that uses a special machine to filter
harmful wastes, salt, and excess fluid from the blood. This restores the blood to a normal,
healthy balance. Dialysis replaces many of the kidney's important functions. Hemodialysis is
when the blood is filtered using a dialyzer and dialysis machine.
12. Dialysis facility - An outpatient facility where a medical procedure (dialysis) is administered
to people with end stage kidney disease.
13. Healthcare-associated infection (HAI) - An infection that develops in a person who is
cared for in any setting where healthcare is delivered (i.e., acute care hospital, skilled
nursing facility, dialysis center, etc.) that was not developing or present at the time of
admission to that healthcare setting.
14. Inpatient rehabilitation facilities (IRFs) - IRFs are freestanding rehabilitation hospitals
and rehabilitation units in acute care hospitals. They provide an intensive rehabilitation
program and patients who are admitted must be able to tolerate three hours of intense
rehabilitation services per day.
15. Intensive Care Unit (ICU) - An area in the hospital where severely ill patients are closely
monitored and receive advanced life support.
16. Long-term acute care facility - A facility that provides a range of institutional healthcare
programs and services, such as comprehensive rehabilitation, respiratory therapy, head
trauma treatment, and pain management, outside the acute care hospital.
17. MRSA bacteremia - An infection in the blood that is caused by the bacteria Staphylococcus
aureus and is resistant to methicillin antibiotics.
18. National rate - The national rate is determined by the NHSN as similar facilities and specific
infection events are compared nationwide.
19. National Healthcare Safety Network (NHSN) - The nation’s most widely used
healthcare-associated infection (HAI) tracking system. NHSN provides facilities, states,
regions, and the nation with data needed to identify problem areas, measure progress of
prevention efforts, and ultimately eliminate HAIs. The system is supported by the U.S.
Centers for Disease Control and Prevention.

Healthcare-associated Infections in Utah 2013 Annual Report
42
20. Standardized infection ratio (SIR) - A statistic used to calculate, track and interpret the
number of new HAIs. The SIR is determined by comparing the actual number of HAIs to the
predicted number of HAIs for a specific group of patients admitted to a specific patient care
unit.
21. Standard population - The population against which each of its essential classes or groups
can be compared. For purposes of this report, the standard population is the national HAI
data reported by the thousands of United States facilities that use the NHSN system.
22. Surgical site infection (SSI) - A surgical site infection is an infection that occurs after
surgery in the part of the body where the surgery took place. Many SSIs involve the skin
only. Other SSIs are more serious and involve deep tissue or organs and usually result in
prolonged or rehospitalization.
23. Utah Healthcare Infection Prevention Governance Committee (UHIP GC) - A multi-
disciplinary panel of state leaders in patient safety, infectious diseases, and infection control.
Membership is comprised of a broad base of care delivery groups across the state and
organized under and staffed by the Utah Department of Health.
24. Urinary catheter - A flexible tube that is inserted through the urethra and into the bladder
to drain urine from the bladder into a bag or container.

Healthcare-associated Infections in Utah 2013 Annual Report
43
References
1. Magill SS, Edwards JR, Bamberg W, et al. Multistate Point-Prevalence Survey of Health
Care–Associated Infections. N Engl J Med 2014;370:1198-208. Accessed July 2014.
2. National Action Plan to Prevent Healthcare-Associated Infections: Road Map to
Elimination.
http://www.health.gov/hai/prevent_hai.asp#hai. Accessed July 2014.
3. How-to Guide: Prevent Central Line-Associated Bloodstream Infections. Cambridge, MA:
Institute for Healthcare Improvement; 2012.
4. CDC. Healthcare-associated Infections. http://www.cdc.gov/HAI/infectionTypes.html.
Accessed June 2014.
5. CDC. Dialysis. http://www.cdc.gov/dialysis. Accessed July 2014.
6. Strategies to Prevent Clostridium difficile Infections in Acute Care Hospitals: 2014
Update. http://www.jstor.org/stable/10.1086/676023. Accessed July 2014.
7. CDC. Vital Signs. Stopping C. difficile Infections. March 2012.
http://www.cdc.gov/vitalsigns/pdf/2012-03-vitalsigns.pdf Accessed July 2014.
8. CDC. National Healthcare Safety Network (NHSN). http://www.cdc.gov/nhsn/. Accessed
June 2014.
9. Strategies to Prevent Central Line–Associated Bloodstream Infections in Acute
Care Hospitals: 2014 Update. http://www.jstor.org/stable/10.1086/676533. Accessed
July 2014.
10. Strategies to Prevent Surgical Site Infections in Acute Care Hospitals: 2014
Update. http://www.jstor.org/stable/10.1086/676022. Accessed July 2014.
11. Strategies to Prevent Methicillin-Resistant Staphylococcus aureus Transmission
and Infection in Acute Care Hospitals: 2014 Update.
http://www.jstor.org/stable/10.1086/676534. Accessed July 2014.

Utah Department of Health
Healthcare-Associated Infections
Prevention & Reporting Program
P.O. Box 142104
Salt Lake City, UT 84114
http://health.utah.gov/epi/diseases/HAI/index.html
PH 801-538-6191 • FAX 801-538-9923