
Healthcare and Social Assistance Sector...
4
OTTAWA Integrated Local Labour Market Plan Healthcare and Social Assistance Sector Overview Updated March 2013 2013 Update The views expressed in this document do not necessarily reflect those of Employment Ontario.
Transcript of Healthcare and Social Assistance Sector...
OTTAWA Integrated Local
Labour Market Plan
Healthcare and
Social Assistance Sector Overview
Updated March 2013
2013 Update
The views expressed in this document do not
necessarily reflect those of Employment Ontario.
Ottawa Integrated Local Labour Market Plan - 2013 Update HEALTHCARE AND SOCIAL ASSISTANCE SECTOR 1
Healthcare and Social Assistance
2013 OTTAWA OUTLOOK/UPDATE
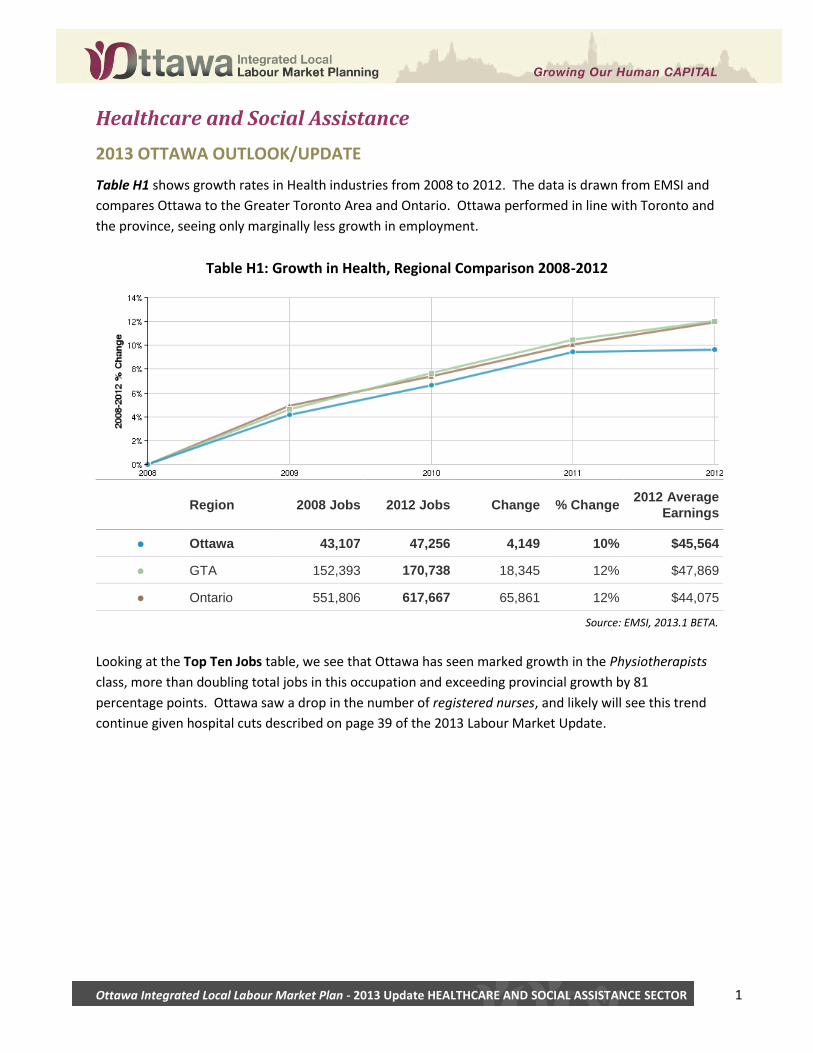
Table H1 shows growth rates in Health industries from 2008 to 2012. The data is drawn from EMSI and
compares Ottawa to the Greater Toronto Area and Ontario. Ottawa performed in line with Toronto and
the province, seeing only marginally less growth in employment.
Table H1: Growth in Health, Regional Comparison 2008-2012
Region 2008 Jobs 2012 Jobs Change % Change 2012 Average
Earnings
● Ottawa 43,107 47,256 4,149 10% $45,564
● GTA 152,393 170,738 18,345 12% $47,869
● Ontario 551,806 617,667 65,861 12% $44,075
Source: EMSI, 2013.1 BETA.
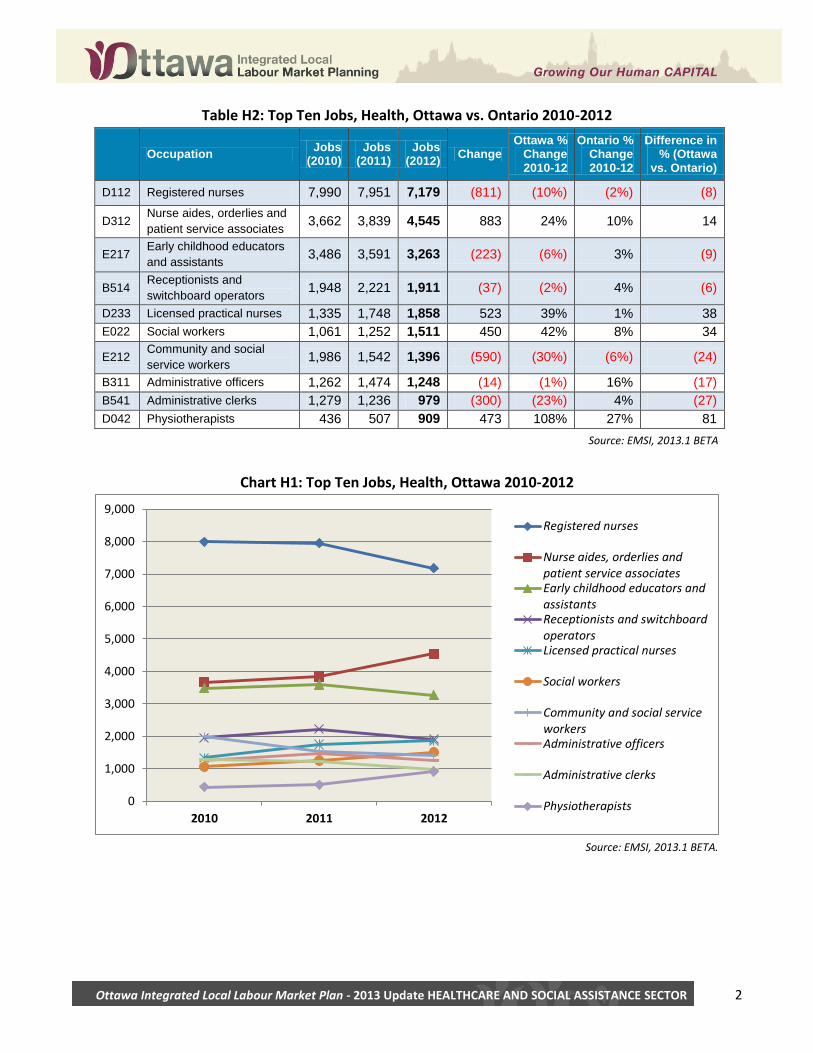
Looking at the Top Ten Jobs table, we see that Ottawa has seen marked growth in the Physiotherapists
class, more than doubling total jobs in this occupation and exceeding provincial growth by 81
percentage points. Ottawa saw a drop in the number of registered nurses, and likely will see this trend
continue given hospital cuts described on page 39 of the 2013 Labour Market Update.
Ottawa Integrated Local Labour Market Plan - 2013 Update HEALTHCARE AND SOCIAL ASSISTANCE SECTOR 2
Table H2: Top Ten Jobs, Health, Ottawa vs. Ontario 2010-2012
Occupation
Jobs (2010)
Jobs (2011)
Jobs (2012)
Change Ottawa %
Change 2010-12
Ontario % Change 2010-12
Difference in % (Ottawa
vs. Ontario)
D112 Registered nurses 7,990 7,951 7,179 (811) (10%) (2%) (8)
D312 Nurse aides, orderlies and
patient service associates 3,662 3,839 4,545 883 24% 10% 14
E217 Early childhood educators
and assistants 3,486 3,591 3,263 (223) (6%) 3% (9)
B514 Receptionists and
switchboard operators 1,948 2,221 1,911 (37) (2%) 4% (6)
D233 Licensed practical nurses 1,335 1,748 1,858 523 39% 1% 38
E022 Social workers 1,061 1,252 1,511 450 42% 8% 34
E212 Community and social
service workers 1,986 1,542 1,396 (590) (30%) (6%) (24)
B311 Administrative officers 1,262 1,474 1,248 (14) (1%) 16% (17)
B541 Administrative clerks 1,279 1,236 979 (300) (23%) 4% (27)
D042 Physiotherapists 436 507 909 473 108% 27% 81
Source: EMSI, 2013.1 BETA
Chart H1: Top Ten Jobs, Health, Ottawa 2010-2012
Source: EMSI, 2013.1 BETA.
0
1,000
2,000
3,000
4,000
5,000
6,000
7,000
8,000
9,000
2010 2011 2012
Registered nurses
Nurse aides, orderlies andpatient service associatesEarly childhood educators andassistantsReceptionists and switchboardoperatorsLicensed practical nurses
Social workers
Community and social serviceworkersAdministrative officers
Administrative clerks
Physiotherapists
Ottawa Integrated Local Labour Market Plan - 2013 Update HEALTHCARE AND SOCIAL ASSISTANCE SECTOR 3
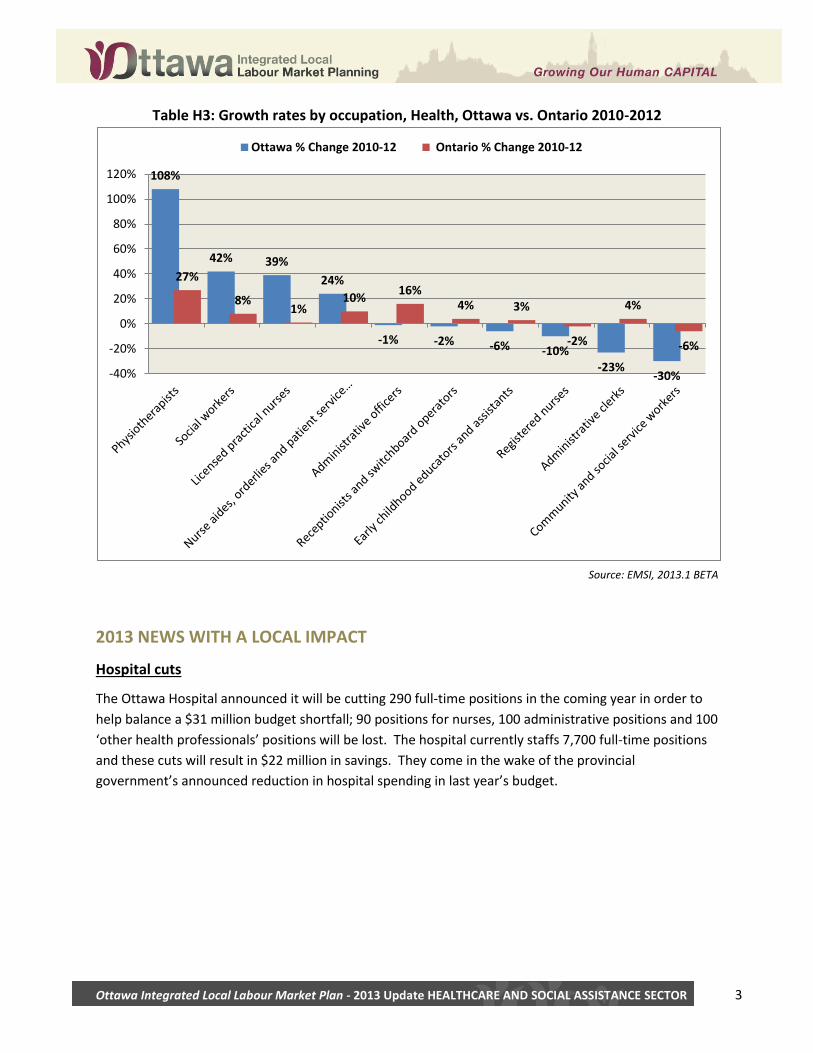
Table H3: Growth rates by occupation, Health, Ottawa vs. Ontario 2010-2012
Source: EMSI, 2013.1 BETA
2013 NEWS WITH A LOCAL IMPACT
Hospital cuts
The Ottawa Hospital announced it will be cutting 290 full-time positions in the coming year in order to
help balance a $31 million budget shortfall; 90 positions for nurses, 100 administrative positions and 100
‘other health professionals’ positions will be lost. The hospital currently staffs 7,700 full-time positions
and these cuts will result in $22 million in savings. They come in the wake of the provincial
government’s announced reduction in hospital spending in last year’s budget.
108%
42% 39%
24%
-1% -2% -6% -10% -23%
-30%
27%
8% 1%
10% 16%
4% 3%
-2%
4%
-6%
-40%
-20%
0%
20%
40%
60%
80%
100%
120%
Ottawa % Change 2010-12 Ontario % Change 2010-12


![MyCharityConnects Ottawa - Social Media Policies [2011-03-22]](https://static.fdocuments.in/doc/165x107/5458c2e1af79590b088b5550/mycharityconnects-ottawa-social-media-policies-2011-03-22.jpg)


