

Health Workforce in Canada -...
31
Health Workforce in Canada Francine Anne Roy Canadian Institute for Health Information Canada International Medical Workforce Collaborative 10th Conference, Vancouver, B.C., Canada March 2007
-
Upload
hoangtuong -
Category
Documents
-
view
217 -
download
0
Transcript of Health Workforce in Canada -...

Health Workforce in Canada
Francine Anne RoyCanadian Institute for Health Information Canada
International Medical Workforce Collaborative10th Conference, Vancouver, B.C., CanadaMarch 2007

Today’s Health Workforce Through . . .
• Innovations in data collection
• Data modelling and planning initiatives
. . . in Canada
Innovations in Data Collection
• New partnerships
• Using a mix of administrative and survey data
• Expanding national supply of data collection beyond physicians and nurses
• Development of multi-profession supply databases by provinces/territories
• Health Canada projects
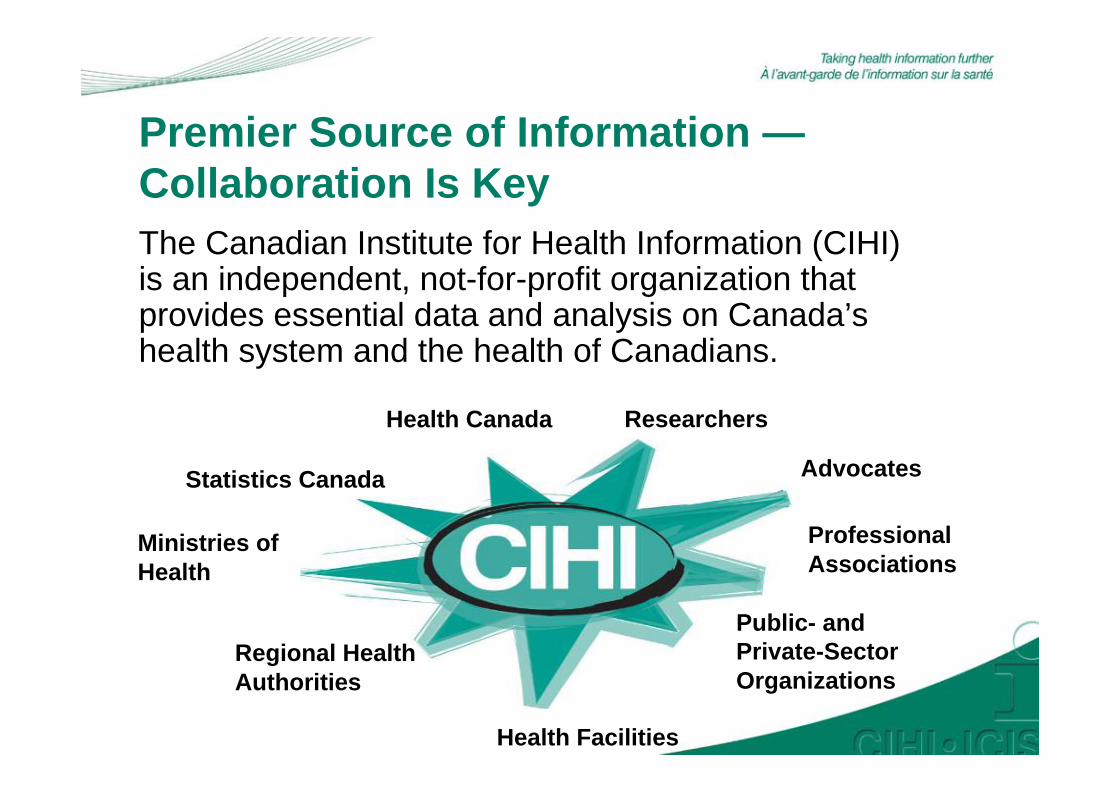
Premier Source of Information —Collaboration Is KeyThe Canadian Institute for Health Information (CIHI) is an independent, not-for-profit organization that provides essential data and analysis on Canada’s health system and the health of Canadians.
Statistics Canada
Ministries of Health
Regional Health Authorities
Health Facilities
Public- and Private-Sector Organizations
Professional Associations
Advocates
ResearchersHealth Canada

Health Human Resources (HHR)Distribution of Health Personnel by Occupation in Canada, 2005
Total Regulated Nurses
43%
Physicians9%
Pharmacists3%
Midwives 1%
Other Regulated and Unregulated Health Personnel
45%
Sources: Labour Force Survey, Statistics Canada; Canadian Regulated Nurses Databases, Scott’s Medical Database, CIHI, 2005.

Age Distribution, Canada, 1980–2005
0%
5%
10%
15%
20%
25%
<30 30-34 35-39 40-44 45-49 50-54 55-59 60-64 65-69 70+ <30 30-34 35-39 40-44 45-49 50-54 55-59 60-64 65-69 70+
Age Group (yrs)
1980 2005
Source: Scott’s Medical Database, CIHI, 2005.
Family Medicine Physicians Specialist Physicians
0%
5%
10%
15%
20%
25%
< 25 25-29 30-34 35-39 40-44 45-49 50-54 55-59 60+
Age Group (yrs)
1980 2005
Registered Nurses
Source: Registered Nurses Database, CIHI, 2005.
Average Age in 2005:
Family Physicians: 48.0
Specialists: 49.9
Average Age in 2005:
RN: 44.7

• Scott’s Medical Database, 1968 to 2005 (CIHI)
• National Physician Database, 1972 to 2004 (CIHI)
• Registered Nurses Database, 1980 to 2005 (CIHI)
• Registered Psychiatric Nurses Database, 2002 to 2005 (CIHI)
• Licensed Practical Nurses Database, 2002 to 2005 (CIHI)
• Health Personnel Database, 1970 to 2004 (CIHI)
• National Physician Survey (CMA, CFPC, RCPSC)
• CMA Masterfile (CMA)
• National Survey of the Work and Health of Nurses (SC)
• Labour Force Survey (SC)
• Canadian Community Health Survey (SC)
• Census (SC)
• CAPER (AFMC)
• ORIS (AFMC)
• Many others . . .
HHR Data Sources

• First survey conducted in 2004
• Second wave launched January 2007 – Results will start to be available in
November 2007
Introducing New Data
• National Survey of the Work and Health of Nurses (NSWHN)—partnership project between CIHI, Statistics Canada and Health Canada (telephone survey completed in the fall of 2005)
• Canadian Physician Health Survey—to be conducted in 2007

Level of Satisfaction
Physicians Nurses
Source: NPS, CMA, CFPC, RCPSC, 2004; NSWHN, Statistics Canada, 2005.
Very Dissatisfied
2%Somewhat Dissatisfied
9%
Somewhat Satisfied
47%
Very Satisfied
42%Very
Satisfied28%
Somewhat Satisfied
45%
Somewhat Dissatisfied
12%
Very Dissatisfied
4%
Neutral11%

0
20
40
60
80
100
120
140
160
180
N.L. P.E.I. N.S. N.B. Que. Ont. Man. Sask. Alta. B.C.
Tota
l Num
ber o
f FT
E Ph
ysic
ians
FFS APP
Enhancing the Collection of Physician Payment Data
Preliminary data: NPDB, CIHI, 2007.
FTE Physicians per 100,000 Population by Type of Payment, 2004/05

28% 36% 45%
Performing Surgery
Providing Surgical
AssistanceDelivering
Babies
16%
Hospital Inpatient Care
Providing Mental Health
Care
31%No Change
Providing Anesthesia
Services
Evolving Role of Fee-for-Service Family Physicians
Source: National Physician Database, CIHI; in collaboration with Dr. Joshua Tepper.
Change Nationally
Between 1994 and 2003
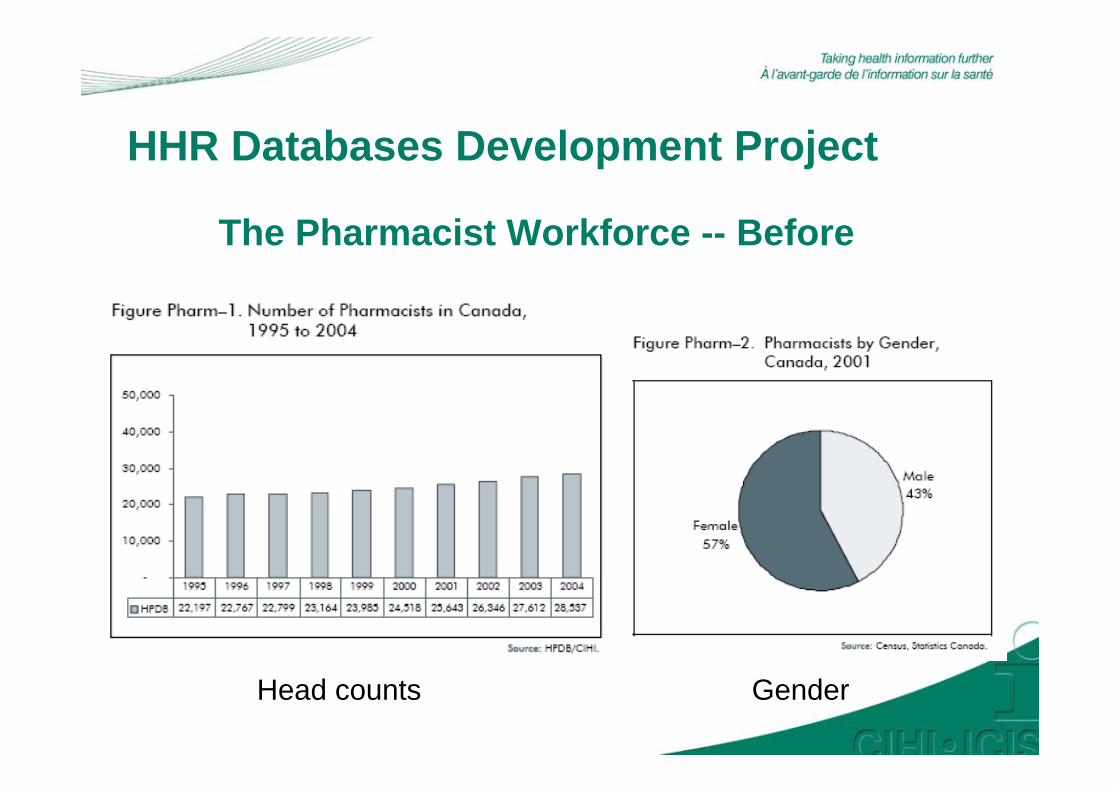
HHR Databases Development Project
Head counts Gender
The Pharmacist Workforce -- Before

The Pharmacist Workforce -- After
Physicians
Pharmacists
Head count FTE
4%
18%
For example, what is the difference between headcounts and FTE methodology in one Canadian province?
Pharmacist Source: PDB 2006 preliminary data, CIHIPhysician Source: 2002-2003 NPDB, CIHI
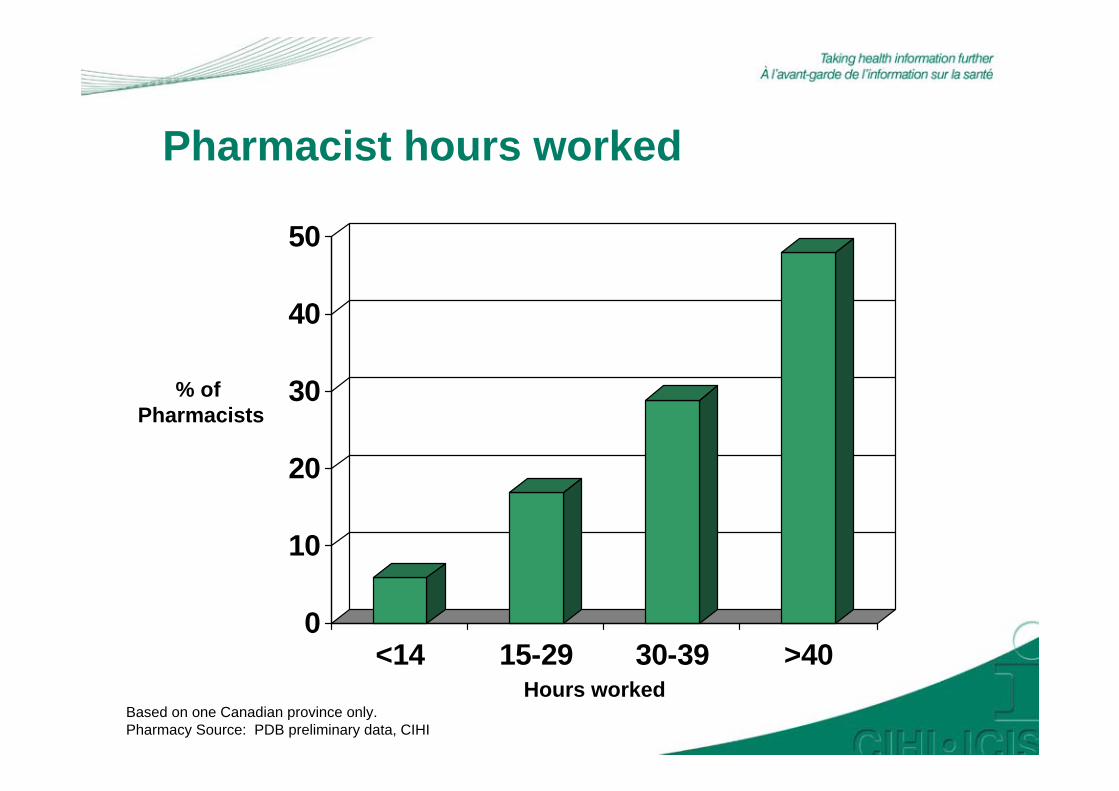
Pharmacist hours worked
0
10
20
30
40
50
<14 15-29 30-39 >40
Based on one Canadian province only.Pharmacy Source: PDB preliminary data, CIHI
% of Pharmacists
Hours worked

Pharmacist hours worked and gender
010203040506070
<14 15-29 30-39 >40
Female MaleBased on one Canadian province only.Pharmacy Source: PDB preliminary data, CIHI
% of Pharmacists
Hours worked

B.C.
N.W.T./Nun.
Alta.Sask. Man. Ont.
N.L.
N.B.N.S. 43
22
6865375132≥5
22
Nurse Practitioners, Canada, 2005
<5
Licensed NP Workforce
2003 = 725
2004 = 878
2005 = 1,026
Percent Change = 41.5%
Source: Canadian Regulated Nursing Professions Database, CIHI, 2005.

Database Collaboration
Note: Full-time faculty includes professors, associate and assistant professors, instructors and other faculty. Part-time faculty includes paid and volunteer faculty members. Faculty counts for 2005–2006 are preliminary.Sources: Office of Research and Information Services (ORIS) and Canadian Post-M.D. Education Registry (CAPER), Association of Faculties of Medicine of Canada, 2007.
CAPER & ORIS DATA: Faculty of Medicine Faculty Counts and MD Students/Post-MD Trainees, Canada, 1992/93-2005/06
0
2,000
4,000
6,000
8,000
10,000
12,000
14,000
16,000
18,000
20,000
92/93 93/94 94/95 95/96 96/97 97/98 98/99 99/00 00/01 01/02 02/03 03/04 04/05 05/06
Number of Full-Time Faculty Number of Part-Time Faculty
Total MD Students + Post-MD Trainees

Migration of Physicians
Source: Scott’s Medical Database, CIHI, 2005.
0
100
200
300
400
500
600
70019
69
1971
1973
1975
1977
1979
1981
1983
1985
1987
1989
1991
1993
1995
1997
1999
2001
2003
2005
Year
Num
ber o
f Ph
ysic
ians
Moving Abroad Returning f rom Abroad
Number of Physicians Who Moved Abroad or Returned From Abroad, Canada, 1969 to 2005

Internationally Educated Physicians and Nurses in Canada
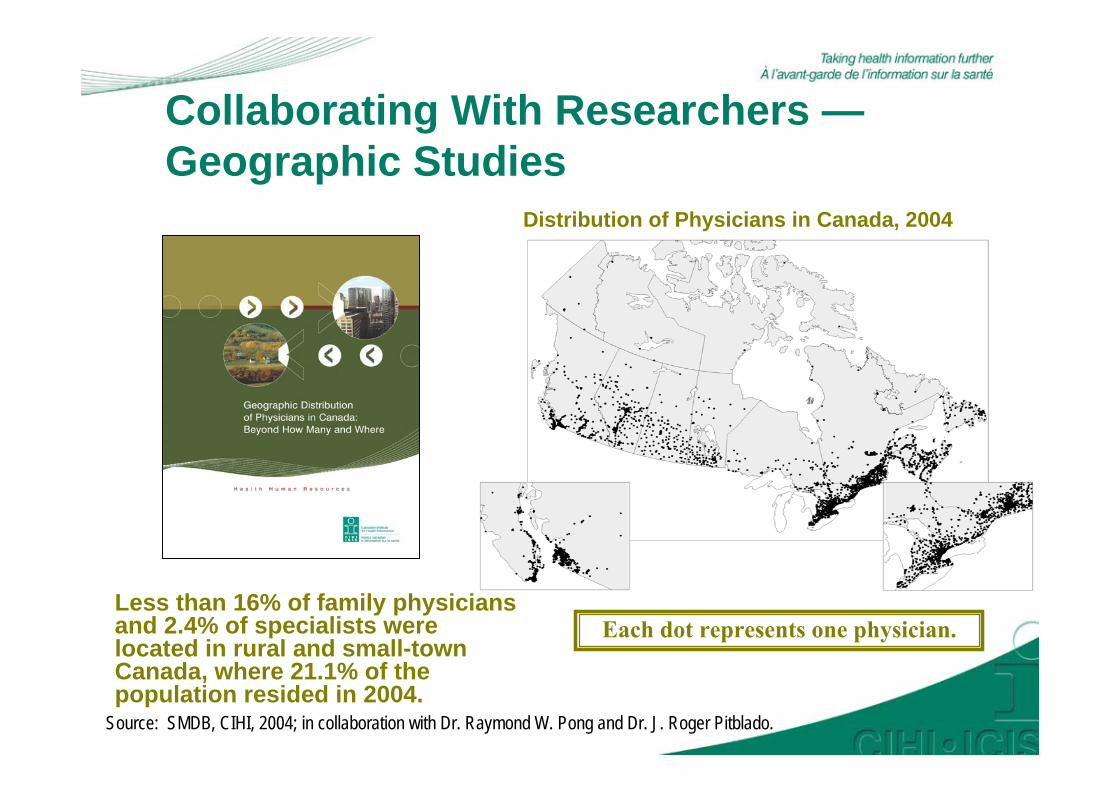
Collaborating With Researchers —Geographic Studies
Distribution of Physicians in Canada, 2004
Source: SMDB, CIHI, 2004; in collaboration with Dr. Raymond W. Pong and Dr. J. Roger Pitblado.
Each dot represents one physician.Less than 16% of family physicians and 2.4% of specialists were located in rural and small-town Canada, where 21.1% of the population resided in 2004.
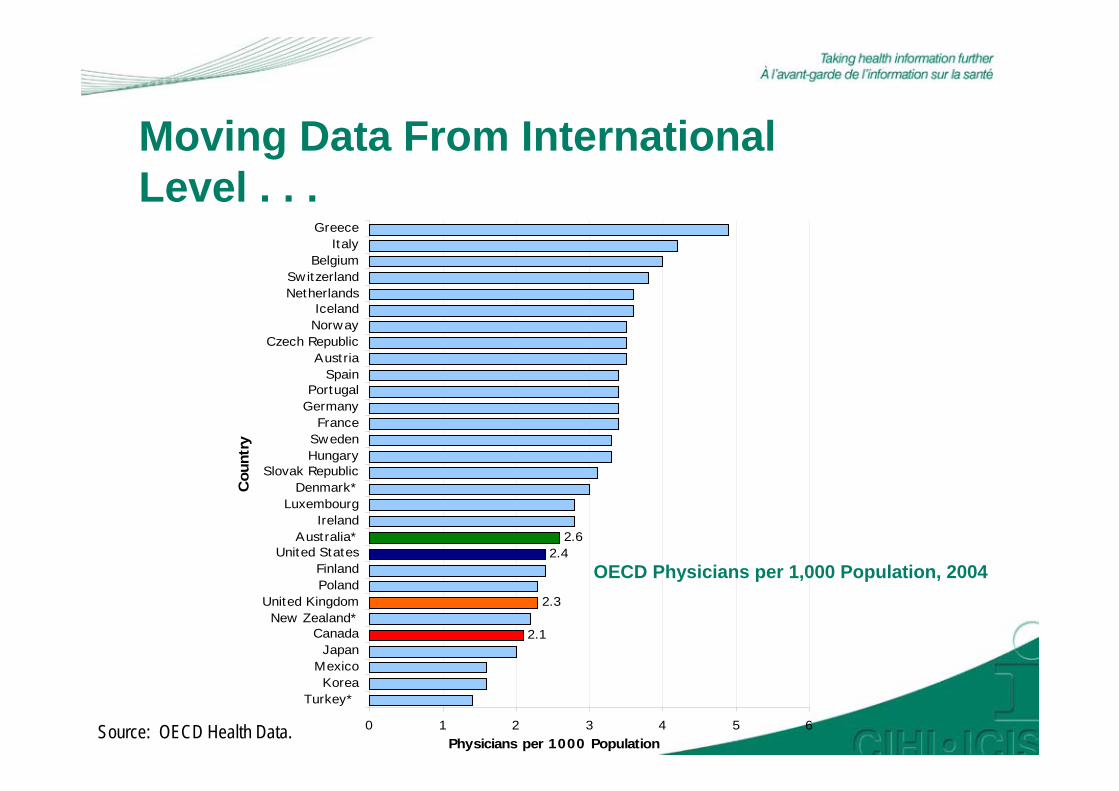
Moving Data From International Level . . .
2.62.4
2.3
2.1
0 1 2 3 4 5 6
Turkey* Korea
MexicoJapan
CanadaNew Zealand*
United KingdomPolandFinland
United StatesAustralia*
IrelandLuxembourg
Denmark*Slovak Republic
HungarySwedenFrance
GermanyPortugal
SpainAustria
Czech RepublicNorwayIceland
NetherlandsSwitzerland
BelgiumItaly
GreeceC
ount
ry
Physicians per 1000 PopulationSource: OECD Health Data.
OECD Physicians per 1,000 Population, 2004

1968 = 108
1993 = 191
2005 = 190
. . . to National Level . . .Number of Canadian Physicians per 100,000 Population
Source: National Physician Database, CIHI.
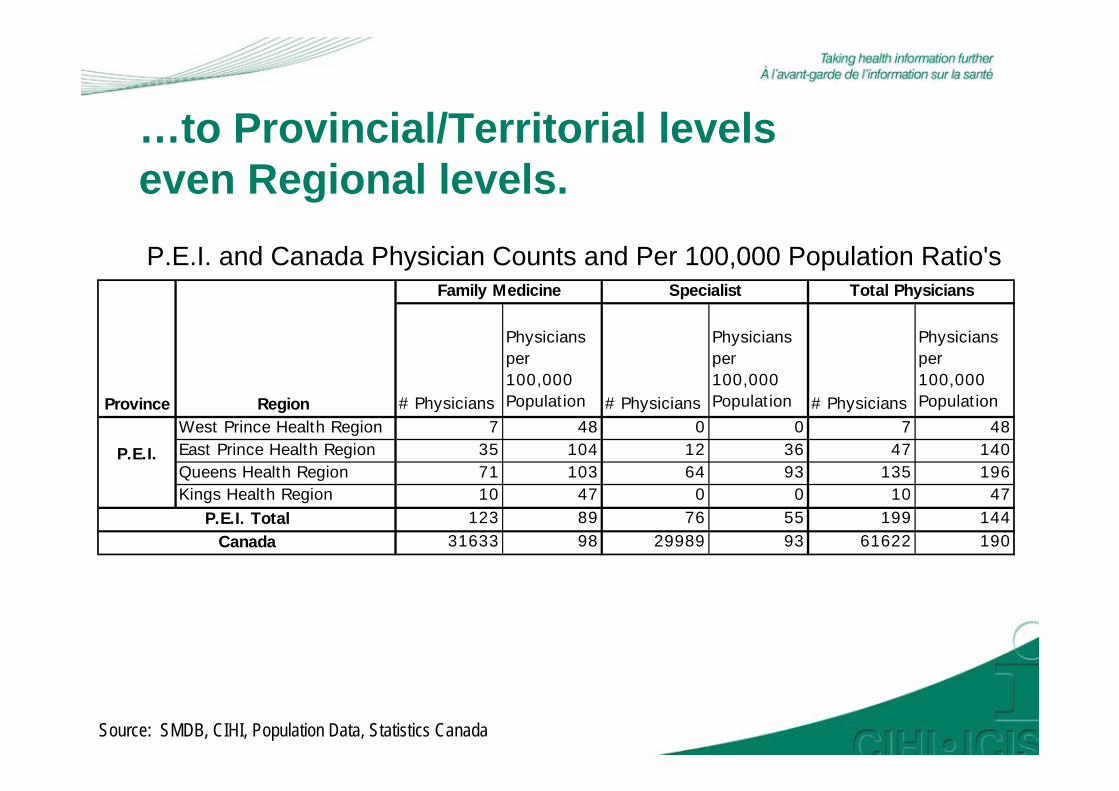
…to Provincial/Territorial levelseven Regional levels.P.E.I. and Canada Physician Counts and Per 100,000 Population Ratio's
Source: SMDB, CIHI, Population Data, Statistics Canada
# Physicians
Physicians per 100,000 Population # Physicians
Physicians per 100,000 Population # Physicians
Physicians per 100,000 Populat ion
West Prince Health Region 7 48 0 0 7 48East Prince Health Region 35 104 12 36 47 140Queens Health Region 71 103 64 93 135 196Kings Health Region 10 47 0 0 10 47
123 89 76 55 199 14431633 98 29989 93 61622 190Canada
Province Region
P.E.I.
Family Medicine Specialist Total Physicians
P.E.I. Total

Multi-Professional Databases

Multi-Professional Databases
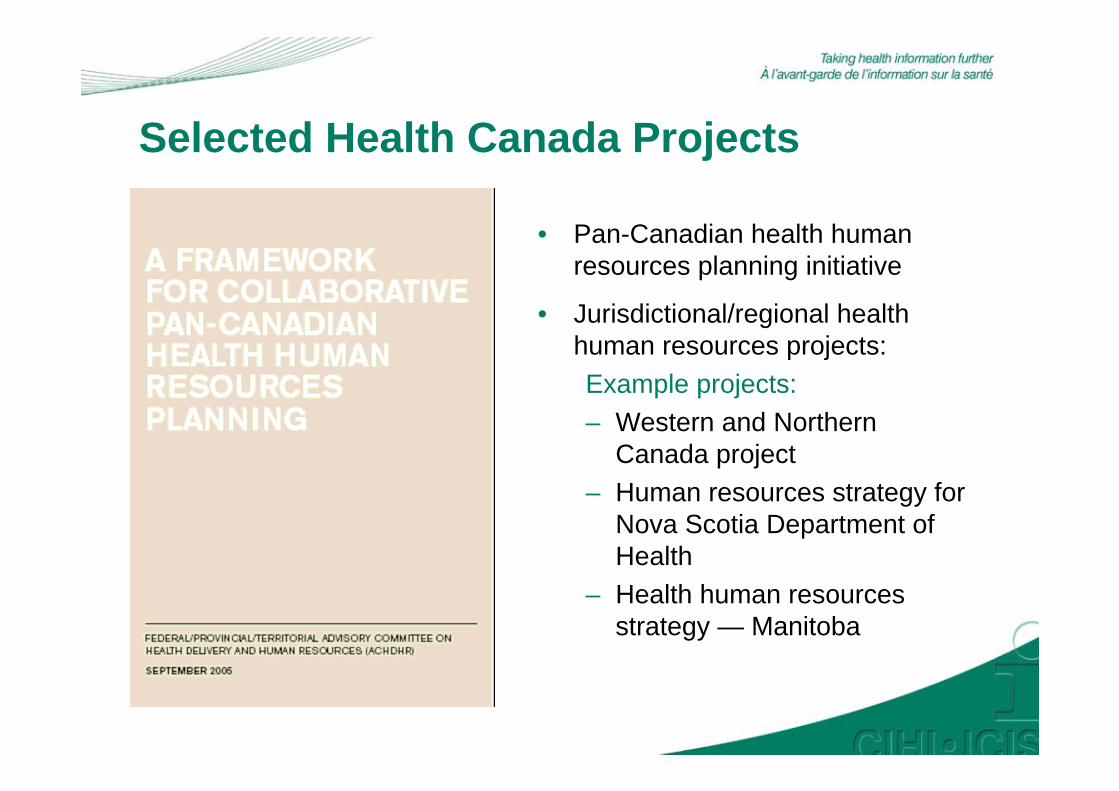
Selected Health Canada Projects
• Pan-Canadian health human resources planning initiative
• Jurisdictional/regional health human resources projects:Example projects:– Western and Northern
Canada project– Human resources strategy for
Nova Scotia Department of Health
– Health human resources strategy — Manitoba

Data Modelling and Planning Initiatives
To identify and address HHR forecasting needs, Health Canada has committed funding to:– Inventory forecasting models under development and being
used in Canada– Assess models against their scope, utility and ability to meet
needs– Determine jurisdictional forecasting needs– Identify gaps in forecasting capacity
Goal:To share knowledge and increase
modelling capacity nationally

Data Modelling — Atlantic Canada• Develop a simulation model for the Atlantic region to:
– Simulate gaps in the supply of and need for HHR– Test the effectiveness of policy initiatives in dealing with HHR
gaps prior to full implementation of the policy intervention.
• How it works:– Estimates and compares provider supply with requirements.
Needs Module
Productivity Module
Training Module
Supply Module
Population, health status, level of service, service
requirements, activity-adjusted providers required
Productivity, worked hours, activity-adjusted providers available
Provider Requirements
Seats, program attrition, program length,
number of students, graduate out-migration
Graduate entry rates, graduate age distribution,
in-migration, provider stock, exit rates
Provider Supply

What’s Next?

Some Challenges
• Changing environment and landscape for health human resources
• Changing environment and landscape of privacy legislation (e.g., data loss)
• Infrastructure and systems (e.g., NUI)
• Resources
• Multitude of stakeholders and users = increasing and varied demands