HEALTH STATUS, HEALTH CARE AND INEQUALITY ... Status, Health Care and Inequality: Canada vs. the...
44
NBER WORKING PAPER SERIES HEALTH STATUS, HEALTH CARE AND INEQUALITY: CANADA VS. THE U.S. June E. O'Neill Dave M. O'Neill Working Paper 13429 http://www.nber.org/papers/w13429 NATIONAL BUREAU OF ECONOMIC RESEARCH 1050 Massachusetts Avenue Cambridge, MA 02138 September 2007 This paper was presented at the NBER Frontiers in Health Policy Research Conference, June, 2007. We acknowledge the excellent research assistance of Mei Liao and financial support from the Achelis Foundation and the Weismann Foundation and appreciate the helpful comments of conference participants. The views expressed herein are those of the author(s) and do not necessarily reflect the views of the National Bureau of Economic Research. © 2007 by June E. O'Neill and Dave M. O'Neill. All rights reserved. Short sections of text, not to exceed two paragraphs, may be quoted without explicit permission provided that full credit, including © notice, is given to the source.
Transcript of HEALTH STATUS, HEALTH CARE AND INEQUALITY ... Status, Health Care and Inequality: Canada vs. the...

NBER WORKING PAPER SERIES
HEALTH STATUS, HEALTH CARE AND INEQUALITY:CANADA VS. THE U.S.
June E. O'NeillDave M. O'Neill
Working Paper 13429http://www.nber.org/papers/w13429
NATIONAL BUREAU OF ECONOMIC RESEARCH1050 Massachusetts Avenue
Cambridge, MA 02138September 2007
This paper was presented at the NBER Frontiers in Health Policy Research Conference, June, 2007.We acknowledge the excellent research assistance of Mei Liao and financial support from the AchelisFoundation and the Weismann Foundation and appreciate the helpful comments of conference participants.The views expressed herein are those of the author(s) and do not necessarily reflect the views of theNational Bureau of Economic Research.
© 2007 by June E. O'Neill and Dave M. O'Neill. All rights reserved. Short sections of text, not to exceedtwo paragraphs, may be quoted without explicit permission provided that full credit, including © notice,is given to the source.

Health Status, Health Care and Inequality: Canada vs. the U.S.June E. O'Neill and Dave M. O'NeillNBER Working Paper No. 13429September 2007JEL No. I1,I11,I12,I18
ABSTRACT
Does Canada's publicly funded, single payer health care system deliver better health outcomes anddistribute health resources more equitably than the multi-payer heavily private U.S. system? We showthat the efficacy of health care systems cannot be usefully evaluated by comparisons of infant mortalityand life expectancy. We analyze several alternative measures of health status using JCUSH (The JointCanada/U.S. Survey of Health) and other surveys. We find a somewhat higher incidence of chronichealth conditions in the U.S. than in Canada but somewhat greater U.S. access to treatment for theseconditions. Moreover, a significantly higher percentage of U.S. women and men are screened for majorforms of cancer. Although health status, measured in various ways is similar in both countries, mortality/incidenceratios for various cancers tend to be higher in Canada. The need to ration resources in Canada, wherecare is delivered "free", ultimately leads to long waits. In the U.S., costs are more often a source ofunmet needs. We also find that Canada has no more abolished the tendency for health status to improvewith income than have other countries. Indeed, the health-income gradient is slightly steeper in Canadathan it is in the U.S.
June E. O'NeillBaruch CollegeDept. of Eco/Fin17 Lexington Ave.New York, NY 10010and [email protected]
Dave M. O'NeillBaruch [email protected]

Health Status, Health Care and Inequality: Canada vs. the U.S. The ongoing debate over how to cover the uninsured has generated interest and
support for a nationalized single payer system as an alternative to our mainly private
multi-payer system.1 The Canadian single payer system is often upheld as an example of
the improvements in health outcomes, savings in costs, and more equitable distribution of
resources that could be achieved with a system change. The U.S. health care system is
often critiqued by noting that health expenditures in the U.S. are the highest among the
OECD countries---twice as high on a per capita basis as Canada’s. Yet, as measured by
two popular indicators of health status— infant mortality and life expectancy ---the U.S.
lags behind Canada and many other OECD countries. However, both infant mortality
and life expectancy are poor measures of the efficacy of a health care system because
they are influenced by many factors that are unrelated to the quality and accessibility of
medical care.
In this paper we focus on three questions: (1) What does the evidence show
regarding differences in health status that can be attributed to the two systems?; (2) How
does access to needed health care resources compare between the two countries?; and (3)
Is inequality in access to resources different in the two countries? In other words, what do
the data show about differences in the health/income gradient between the two countries?
In this paper we address these issues using a recent data set from the Joint Canada/
U.S. Survey of Health (JCUSH). The survey has the unique feature of being a single
survey, designed and conducted jointly by Statistics Canada and the U.S. National Center
for Health Statistics. Representative samples of U.S. and Canadian residents were asked
the same set of questions under similar conditions. The survey provides information on a
wide array of issues related to health status, access to health resources and personal
demographic, behavioral and economic characteristics.
We supplement our findings from JCUSH with analysis of data from other Canadian and
U.S. surveys and other national and international sources.
1 For example, Physicians for A National Health Program, an organization of 14,000 members, strongly advocates conversion to a single payer system.
1

Briefly, our findings are: No significant differences are evident in the four health
status indicators available in the JCUSH data; A somewhat greater incidence of chronic
health conditions in the U.S. combined with evidence of greater access to health
treatments in the U.S.; greater access in the U.S. to important health care resources and
no evidence that the income/health gradient is any different between the U.S. and
Canada. Finally, on two questions asked about satisfaction with health services and the
ranking of the quality of services recently received, more U.S. residents than Canadians
answered fully satisfied and excellent.
We start by reviewing background information on the Canadian system. We then
examine traditional measures of a nation’s health status: life expectancy and mortality
before turning to our analysis of health status differences as shown in JCUSH and other
surveys. Resources are bound to affect the quality of care and we briefly compare those
in Canada and the U.S. Finally we analyze and compare the effect of income on health
status in the two countries.
Background on the Canadian Health System
Since the late 1960s Canada essentially has had a universal health insurance system
covering all services provided by physicians and hospitals. To implement universal
coverage the federal and provincial governments took over full funding of both hospital
and physician services, setting physician fees and hospital budgets. During the 70’s
physicians, dissatisfied with the official fee amounts, chose to work outside the system
and bill patients at higher amounts. But with the passage of the Canadian Health Act of
1984 Canada outlawed extra billing and became a rigid one-tier system which restricted
the provision of any “core” services outside the public’s so-called “Medicare” system
(Irvine, Ferguson and Cackett).
All care is “free” for insured services —those provided by physicians and hospitals.
No premiums, deductibles or co-payments are imposed. (Other services such as dental
care and prescription drugs must be paid for either through private insurance or out-of-
pocket.) When no one is faced with any charge for services, demand is unrestrained and
costs surge. During the 90’s the federal government cut back the block amounts given to
2

the provinces. It is not surprising that shortages developed and explicit rationing became
widespread in Canada. 2
The shortages and queues that resulted became an increasingly sore subject in
Canada. The condition for shortages was enhanced because of the provision in the 1984
Act that decreed that any service that the single payer provides, no matter how much in
short supply it may be, cannot be privately insured or produced and sold in Canada.
Relief came, however, in 2005 when the 1984 Act was struck down as unconstitutional
by Canada’s highest court {Chaoulli v.Quebec (Attorney General), 2005, IS.C.R. 791,
2005 SCC 35}. A slim 4/3 majority ruled that the government’s argument—that allowing
a private sector, would undermine their public system—was not supported by the actual
experience of other countries (U.K., France and Germany) that had converted from single
payer to dual systems.
Some legal experts have concluded that the Chaoulli decision does not require the
government to give up its single payer system as long as it keeps waiting times within a
reasonable amount, especially for serious cases. But in practice the decision seems to
have led to a large increase in private facilities providing core services, with the
expectation that the government will not bring them to court given the Chaoulli decision
(Krauss, NY Times, 2006). To many observers Canada now is on its way to becoming a
two-tier system.
Private-sector spending on health has been growing faster than public spending and
now makes up a little more than 30% of total health expenditures. Canada spends far less
of its GDP on health expenditures than the United States (10.4%in 2005 compared to
16%in the U.S.). Public funding of health expenditures has grown in the U.S. and now
pays for more than 45 % of the nation’s health bill.
Two Traditional Measures of System Performance and Their Drawbacks
Life expectancy and infant mortality are the two measures most frequently cited as
evidence of the superiority of the Canadian system. of medical care. Current data show
that life expectancy at birth in the U.S. is 80.1 years for women and 74.8 years for men,
more than 2 years below Canada’s levels of 82.4 and 77.4 (Table1). Similarly, infant 2 Provincial governments develop fee schedules and set up physician funding pools. If a pool goes over budget, “claw-back clauses” are enforced to ratchet down pay or doctors may be urged to close for a few days. Hospitals meet cost cutting by closing down hospital beds. See MacKenzie,1999.
3

mortality in the U.S. is 6.8 (deaths per 1000 live births) and 5.3 in Canada. But as noted
above, both of these measures are influenced by many factors that are unrelated to the
quality and accessibility of medical care. We discuss them briefly in turn.
It is well established that infant mortality is strongly linked to low birth weight and
to preterm births. Preterm births accounted for 36.5% of all infant deaths in the U.S. in
2004 according to the Center for Disease Control (CDC, 1999-2004). The preterm-related
infant mortality rate is particularly high for non-Hispanic black mothers---3.5 times
higher than the rate for non-Hispanic white mothers. This obviously is an important
factor underlying the huge gap in infant mortality between blacks and whites in the U.S.
as shown in table 1.
It has long been known that babies born to teenage mothers are at particularly high
risk of infant mortality due to their high prevalence of low birth weight. The teenage
birth rate in the U.S., despite a substantial decline since the early 1990s is the highest
among comparable countries (United Nations Statistics Division, 2004). In 2004, the
teenage birth rate was 41.4 (per 1000 girls 15-19) and that was 2.8 times the rate in
Canada and 7 times the rates in Japan and Sweden (which have the lowest infant
mortality rates). Within the U.S. the infant mortality rate, the pre-term related infant
mortality rate and the teen birth rate are considerably higher for blacks than for whites.3
The relatively high percentage of births to teenage mothers in the U.S. and the
accompanying high rates of infant deaths due to pre-term and low-birth weight births
surely contribute to the higher U.S. infant mortality rate.
Evidence that these factors can explain the infant mortality differential between the
U.S. and Canada is shown in Table 2 which is based on results of a study by Kramer et.
al. investigating the decline in infant mortality in the U.S. Canada and other countries. As
a by-product, the findings provide data on the distribution of births by birth weight in
Canada and the U.S. and the birth-weight specific infant mortality rates in each country.
The data for 1997 (1995-97 in Canada) are displayed in Table 2 and show that the U.S.
has disproportionately more low weight births than Canada. For example in the U.S.
1.4% of births were under 1500 grams compared to 0.9% in Canada. However, within
3 In 2004 the infant mortality rate of black non-Hispanic mothers was 13.6 compared to 5.7 for white non-Hispanic mothers. About 35% was preterm- related for blacks; 32% for whites. The teenage birth rate in the same year was 60 for blacks and 27 for white non-Hispanics.
4
birth weight specific categories, mortality rates in the U.S. were generally the same as in
Canada. In fact, our calculations indicate that if in Canada the distribution of births by
birth weight was the same as in the U.S. their infant mortality rate would rise to 7.06
from the observed level of 5.5. Similarly if births in the U.S. had the same distribution
by birth-weight as Canadian births, the U.S. infant mortality rate would have been 5.401
instead of 6.85.
Clearly a multitude of behaviors unrelated to the health care system such as substance
abuse, smoking and obesity as well as low education and cultural factors are related to the
low birth weight and preterm births that underlie the infant death syndrome (Corman and
Grossman, 1985; 1987; Joyce, Racine, McCalla and Wehbeh, 1995; Joyce and
Grossman, 1990; Kestner, Joyce and Wehbeh,, 1996). It has proven difficult for public
efforts to improve birth outcomes for low socioeconomic groups simply by reducing
financial barriers to prenatal care. Improvement in access to health care for low income
women through extension of Medicaid seems to have increased prenatal care but failed to
reduce the gap in birth outcomes for poor and non-poor women (Dubay, Joyce, Kaestner
and Dubay 2001; Currie and Gruber,1996).
Life expectancy shares similar problems as a measure of a country’s quality of health
care. It is influenced by infant mortality and at older ages and does not delineate between
causes of death susceptible to improved medical treatment ad those that are not (deaths
from homicide, auto and other accidents). As shown in Table 3, the U.S. leads the
advanced countries in obesity. The percent of the female population in the U.S. that is
obese is 33.2% and in Canada it is 19.0%, and similar differentials prevail for the men. It
is noteworthy that in Japan the percent of women who are obese is only 3.2% (men 2.8%)
and Japan also has the greatest longevity. Clearly the large differential between the U.S.
and Canada in obesity accounts for some of their differential in mortality and therefore in
life expectancy.
Table 4 shows the differences between Canada and the U.S. in the causes of mortality
at different age groups. Although the overall mortality rate is higher in the U.S. at all age
groups, the importance non-disease related factors (accidents and homicides) is much
greater in the U.S. For men accidents and homicides account for 84% of the gap in
mortality rates at age group 20-24. This percentage declines as age increases, but still
5

accounts for close to 30% of the gap at ages 40-44. At older ages diseases of the heart
are the primary causes of the gap. Although the health system can surely play a role,
diseases of the heart are also influenced by factors like obesity, which contributes to high
blood pressue, diabetes and other diseases.
Other Measures of Health Status and of Resource Availability
Our analysis of the well known differentials in life expectancy and infant mortality
suggests that the differentials in these measures of health status (especially infant
mortality) are not likely to be due to health care system differences between Canada and
the U.S. We continue our search for evidence of health outcome differentials that can be
attributed to the effectiveness of the two systems. We utilize the various measures of
health status available in the JCUSH data as well as in other data sources and we examine
other indicators of health care services and resources including the waiting times that
have been sore spots in characterizing the Canadian system. The indicators chosen
include some of those on the OECD’s list of useful indicators for measuring system
performance.
JCUSH--the Joint Canada/U.S. Survey of Health—was conducted by means of a
telephone survey of residents of the U.S. and Canada aged 18 and older living in private
dwellings with telephones. The data were collected during the period November 2002-
March 2003. Interviewers were trained and the survey was administered in English or
Spanish to Americans and in English or French to Canadians as need dictated. The final
samples include 3,505 Canadians and 5,183 from the U.S. The US samples were
stratified by four regions; the Canadian sample by province. Appendix Table A-1
presents the weighted characteristics of the samples for the two countries used in our
analysis.
Alternative Health Status Measures
Table 5 presents a subjective measure of health status that reflects how individuals rate
their overall level of health: poor, fair, good, very good and excellent. This is a widely
used measure in health research. But it has two drawbacks for the purpose of comparing
the relative efficacy of our two health care systems. One is that it is so broad that it surely
reflects many factors other than the efficacy of the health care systems. The other is the
6
purely subjective nature of the measure. If the frame of reference influencing the concept
of good health differs significantly between two countries it may not useful for answering
the question whether one population is healthier than the other. Given that Canada and
the U.S. are so close geographically and similar culturally in many ways, this may not be
a serious problem. In Table 5 we control for two obvious non-system factors that affect
health status—age and race. We also present results estimated from other major surveys
of health status in the U.S. and Canada which ask the same question.
The results in Table 5 show either no difference in self-perceived health status or a
slight indication of a higher percentage reporting excellent health in the U.S. It is
reassuring for the validity of the measure that the older population (ages 65years or more)
indicates poorer health in both countries. Results from the other surveys –The National
Health Interview Survey(NHIS) and the U.S. Medical Expenditures Panel Survey
(MEPS) for the U.S. and the Canadian Community Health Survey (CCHS) for Canada
are based on much larger sample than the JCUSH data but show very similar results.
These results are obviously not hard evidence that the quality of health care is the same in
both countries. More detailed and objective measures of health status must be sought.
Table 6 shows three more indicators of health status (all from JCUSH) that are more
objective, but remain subject to many factors other than the efficacy of the health care
system. The first measure is the individual’s score on the Health Utility Index (HUI). The
index, based on the Comprehensive Health Status Measurement System(CHSMS)
developed at McMaster University, provides a description of an individual’s overall
functional health based on eight attributes—vision, hearing, speech, mobility (ability to
get around), dexterity of hands and fingers, memory and thinking, emotion, and pain and
discomfort. The HUI maps the responses into a scale ranging from negative to 1 (where
one means perfect health and negative means worse than death). The HUI sequence of
questions was administered to all respondents. The second measure refers to the
probability of a major depression in the last year based on a set of questions from the
Composite International Diagnostic Interview. The last measure is a response to a
question whether the respondent has pain that prevents some or most activities.
The comparisons are shown by age and by race. We use the 65+ age break here and
throughout the paper because Medicare provides near universal coverage for that age
7

group in the U.S., a factor that might change the relative standing of the countries when
compared with results for the younger respondents. We show separate results for whites
because non-whites are a larger proportion of the population in the U.S.(for 18-64 group
26% for US and 19% for Canada); the composition of the non-white group differs by
country—predominantly black in the U.S., but Asian in Canada; and racial differences in
health outcomes may differ in the two countries.
For the 18-64 year old age group the results show no significant difference on any
of the three indicators especially when the comparison is restricted to whites only.
The depression index shows a 0.7 percentage point higher probability of depression
Differences are minimal for the other indicators. For the older group the differentials
between the U.S. and Canada are about the same as for the younger group. But again
we note that in comparison with the younger group the older group shows generally
weaker health based on the lower HUI and the higher level of reported pain. The older
group also shows a lower level of the probability of depression, which is consistent with
general psychiatric data that shows that serious mental disorders are more likely to begin
at younger ages with recovery accompanying the aging process.
What can be concluded from this type of data? Seemingly the results suggest that
if there is a difference in health status it is not large enough to be noticed by the
population or to generate differences in the other three indices that are based on more
objective criteria. But the results still cannot tell us whether the health systems are
equally efficient.
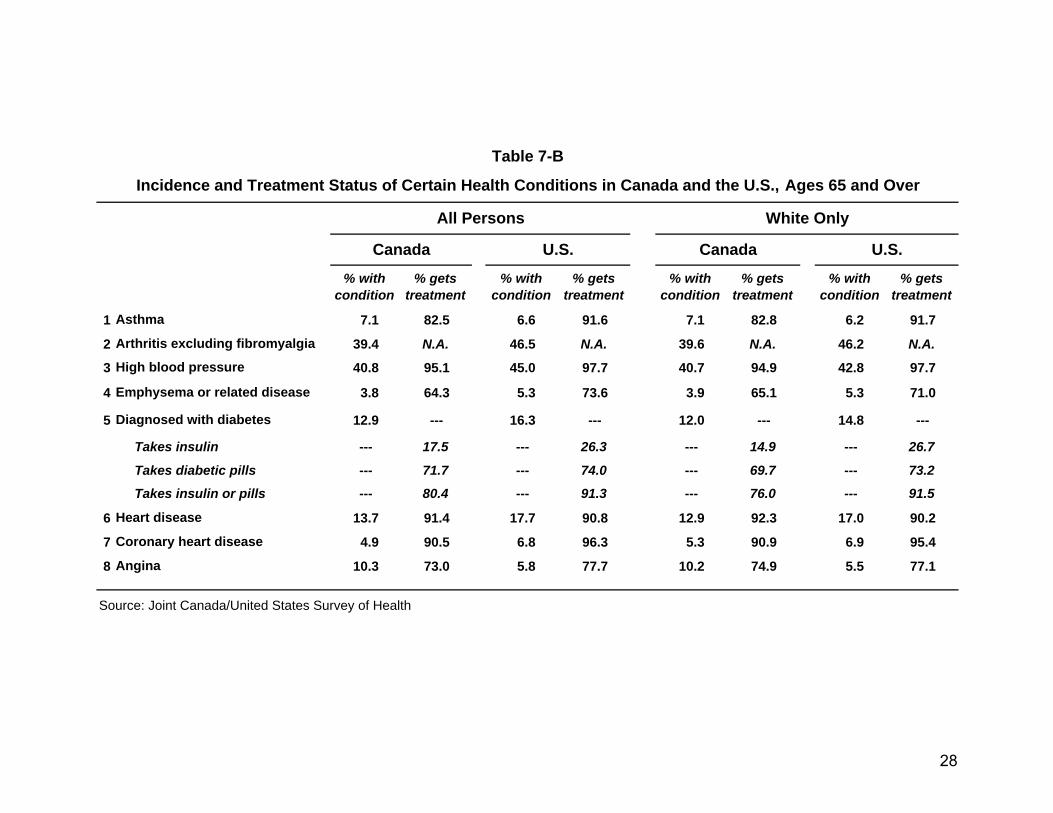
Table 7A (for the younger population) and 7B (for those ages 65+) contain measures
related to the incidence of significant chronic health conditions. Such health status
indicators are more specific and are less subjective than overall self reported health
status. However, like our more subjective measures, they are still influenced by
socioeconomic status, life styles and genetic factors. But they are likely to be responsive
to improvement through medical treatment. Table 7A shows that for the first five
conditions, Canada has a lower incidence in all categories, but the difference is rather
small except for high blood pressure. For the last three conditions that relate to the
functioning of the heart, the two countries are nearly the same. The tables also show the
percentage of those currently with the condition who are receiving treatment for it. On
8

this indicator of access to care the U.S. generally performs better with respect to the
treatment of all conditions except that of asthma.
As expected, the incidence of the specified conditions is greater for the over 65 group
than for the younger group. The percent getting treatment also increases. For the older
group, the U.S. shows significantly higher incidences of heart disease and coronary heart
disease and significantly lower incidence of angina, while for those under 65 there is little
difference between the countries in the much lower incidence figures for these three
conditions. However, due to sample size limitations the results for the older group are
less reliable.
In sum the message of Tables 7A and 7B is that the incidence of important chronic
conditions is somewhat higher in the U.S., especially for those that are not heart related,
while the utilization of treatment for these conditions is somewhat greater in the U.S. We
next turn to JCUSH and other data sources to investigate the availability of certain key
health care services in the two countries.
Resource Availability
Table 8 shows utilization rates of preventive care services by Canadians and
Americans. We look at mammography, PAP Smears and colonoscopy or sigmoidoscopy
(CorS) for women, and the incidence of PSA testing and (CorS) for men in the two
countries for relevant age groups. The table shows first, for each age group, the percent of
women who at the time of the survey said they had ever had a mammogram or PAP
smear. The table then distributes this same sub-group by how recently they had their last
mammogram or PAP smear, but using the total number of women in the age group in the
denominator. (The percent having the procedure more than 5 years ago is not shown.)
The table clearly shows that these two significant cancer screening health services are
used significantly less in Canada than in the U.S., especially when the percentages who
said they had been screened quite recently are compared. Given the significance of these
treatments for preventing mortality due to breast and cervical cancer these differentials
have to loom large in any comparison between the two countries. The difference in PSA
testing (for prostate cancer) is also very large as is the difference in (CorS). Again given
the importance of these two screening devices (especially colonoscopies for colon
9

cancer) these have to be considered as potentially affecting the health outcomes produced
by Canada.
Table 9 looks at the mental health status of the populations of the two countries,
focusing on depression and the type of professional help obtained to treat it. The index
used to measure depression was constructed from a series of questions relating to
classical symptoms of depression—anxiety attacks; inability to sleep; inability to
concentrate on job or other normal aspects of life. The index was used to assign to each
individual a probability of having an episode of serious depression in the coming year.
About 87% of respondents in the 18-64 age group were assigned a zero probability. We
looked at the roughly 10 percent of the age group with a 90% probability of a major
depressive episode in the coming year. The percent with a high probability of a major
depression was somewhat higher in the U.S. than in Canada (9.7% versus 9%). Of that
group we calculated the percent who consulted a health professional in the past 12
months and then for those who received professional help we tabulated the type of
professional consulted. The type of professional consulted is of interest. The percentage
that was treated by a psychiatrist is significantly higher in the U.S. (26% in the U.S.
versus 17% in Canada). However, the institutionalized population is absent from the
survey. Differences in policy concerning deinstitutionalization may influence these
results.
Table 10 presents data on the availability of Magnetic Resonance Imaging (MRI)
and Computed Tomography (CT) Scanners in Canada and the U.S. and also provides
comparison with other OECD countries. The gap between the U.S. and Canada is very
large—32.0 per million vs 11.3 per million for CTs and 27.0 per million vs 5.5 per
million for MRIs. Note that it is difficult to make accurate comparisons across countries
in some cases because of differences in the location of the equipment—hospitals or
specialized facilities or exclusions of private facilities. But for the U.S. and Canada this
is not a problem. (See the notes to the table.) Again, as with the differentials in
screening, the huge gap in equipment has the potential to create differentials in health
outcomes. On the other hand, if such expensive equipment is inefficiently used in the
10

U.S. it could contribute to the higher expenditures in the U.S. but have little effect on
health outcomes as some critics suggest. 4
Waiting Times—How Long and How Important To Health Outcomes?
One useful side effect of the Chaoulli decision has been an increase in the collection
of data on waiting time for various medical services in Canada. Waiting times are an
emotionally charged issue in Canada and evidence on the number and lengths of
significant waiting times have the potential of moving the country closer to a “two-tier”
system.
How widespread and how long are actual waiting times in Canada? And how do
these waiting times compare with the U.S.? Table 11 shows how times vary in Canada by
type of source. The shortest waiting time shown was collected by Statistics Canada (but
refers to two procedures combined). The longest estimates are those of the Fraser
Institute. The medium estimates are those of the OECD. Although the methodology
appears to be the same, one cannot be sure that they are so in all respects. For example,
there could be differences in the voluntary component of scheduling which are not taken
into account.
The issue of waiting time has not been prominent in the U.S. and is not routinely
surveyed by the U.S. statistical agencies. The JCUSH data do not measure lengths of
waiting spells but do present information on the significance of waiting to individuals in
the two countries. The question is addressed as part of an inquiry about whether the
respondent experienced unmet medical needs and if so, what the reason was for the
unmet need. Among those ages 18-64, a somewhat higher percentage of Americans
(14.4%) than of Canadians (11.3%) reported experiencing one or more unmet health care
needs in the year prior to the survey (Table 12). Among older people the percentages
reporting unmet needs are about the same in the two countries. Those with an unmet need
were then asked the reason for the unmet need ---had to wait too long or service not
available; cost ( i.e. could not afford service); or a reason other than those two. As Table
12 shows, the wait too long/service not available reason dominates among the Canadians
4 In their study of the British health care system Aaron and Schwartz address the relatively low level of spending by the British on imaging machines, raising the question, “Sensible Savings or Foolish Frugality?” (pp.89).
11

who had an unmet need, while for U.S. residents cost was the major factor and wait too
long was relatively minor. Other reasons were about equally important in both countries.
Table 13 provides some direct information about the length of the wait for services in
Canada and in the U.S. For knee-replacement surgery the study cited in shows a median
waiting time of 12 weeks in Canada versus 5 weeks in the U.S. (These figures include
both the time it took to see a specialist and the time elapsed between the specialist’s
decision on surgery and the actual performance of the surgery.) The other comparison in
Table 13 is based on a special survey of individuals funded by the Commonwealth
Institute and carried out by the Canadian Institute for Health Information. (These figures
give separately the times to go from an internist to a specialist and from the specialist’s
surgery decision to the actual surgery). The waiting times are significantly greater in
Canada.5
Clearly “all the instruments agree”, waiting times are significantly longer in Canada
than in the U.S.. But does the extra waiting time have an important effect on well being?
Using the JCUSH data we cross-classified individuals in each country who reported
having an unmet need by the reason for it and whether they reported suffering significant
pain during the year (see Table 6 above). We found that among those who gave “wait too
long or not available” as reasons, 33% of the Canadians said they had pain that limits
their activities while 22% of the much smaller group of Americans who indicated that
waiting time was a reason for an unmet need reported pain. Among those who gave
“cost” as the reason for the unmet need, 29% of Americans reported pain—37% of the
smaller group of Canadians.
We also examined the effect of unmet needs on the Health Utility Measure (HUI) of
health status and found that in Canada unmet needs reduced the HUI by 0.097 (compared
to a mean of 0.898) when the individual cited waiting as a reason for unmet need
(holding other variables constant in a multiple regression model; see Appendix Table2).
The effect is much smaller and not significant for Americans.
5 Note that the Fraser Institute data in Table 11 for joint replacement surgery (for which knee replacement is a major component) indicate a much longer waiting time (30 weeks) than the study cited in Table 13. These differences could be attributed to differences in sampling as well as differences in concept. But both indicate long waits.
12

Evidence of Differential System Effectiveness
Based on our analysis of JCUSH and of other large health interview surveys in
Canada and the U.S. we find significant differences between the two countries in the use
of early detection testing (mammograms, pap tests, PSA tests and colonoscopies) and in
the availability of medical imaging machines used for early detection (MRIs and Ct
Scans). The US is a much greater user of testing and has many more units of imaging
machines per capita. If these procedures and machines are impacting on health outcomes
we should observe it in data on mortality rates for those who have cancer. Ideally on
would want to know the results of broadly applicable studies of survival rates conducted
under the same circumstances in both countries, but those are difficult to find. Table 14
provides a very rough approximation of a cancer outcomes study.
Table 14 shows relevant data collected by cancer institutes in Canada and the U.S. on
mortality rates and incidence rates for five types of cancer that could be affected by early
detection tests as well as by treatment efficacy. Note that the relevant comparison is
between the ratios of the mortality rate to the incidence rate in the two countries. The
lower this ratio, the lower is the death rate for those who have the disease (roughly
speaking). Comparing the mortality rate with the incidence rate is important because high
mortality taken alone may simply be the result of a high incidence of the cancer due to
environmental, cultural or other such factors. As shown in Table 14, among women the
age adjusted cancer incidence rate is higher in the United States than in Canada for all of
the types of cancer shown and the mortality rates are somewhat higher in three of the four
cancers. The ratio of mortality to incidence is somewhat lower in the U.S. for all cancers
together and for three out of the four cancers shown (cervical cancer being the
exception). Among men the story is similar, but the ratio is lower in the U.S. for all
cancers shown. Thus in terms of the detection and treatment of cancer, the performance
of the U.S would appear to be somewhat better than Canada’s.
Evidence on the Difference in the Income/Health Gradient
We turn now to evidence on the claim that in Canada the relation between favorable
health outcomes and income is minimal or is much less strong than in the U.S. In other
words we investigate whether the income/health gradient is steeper in the U.S. than in
Canada. One of the benefits anticipated from a single payer system is a more equitable
13
distribution of health resources and health outcomes than would occur in a system where
access partly depends on ability to pay.
Although numerous studies have examined the relation between income and health,
not many have related inequality in income of individuals to inequality in their health
status within a given country. Some studies have looked broadly at the relation between
health and income-- historically; and across and within countries (Cutler, Deaton and
Lleras-Muney. Many studies simply look at variation in mean income across areas
(countries, states) and relate it to observed measures of health status (Marmot 2002).
Other across-location studies relate measures of inequality of income (variation across
areas) to variation in the average level of health across areas (Ross et al., 2000).
Our interest, however, is in the correlation across individuals in their personal
income and their personal health status, and in the comparison of this relationship in
Canada and the U.S. The data demands of such a study are ordinarily difficult to meet.
because of the difficulty of assembling data for different countries with similar measures
of both income and health status. Data on the personal incomes of individuals and
households are collected in both Canada and the U.S, as are some measures of health
status (typically self reported health status). But the data on income are both measured
and published in different formats making unbiased estimates in both countries difficult
to execute. The main empirical problem in comparing gradients in the U.S. and Canada is
that both the mean and relative variation of income is significantly greater in the U.S.
And the crude techniques for measuring personal income variation have biased most
existing estimates toward finding a steeper gradient in the U.S.
We utilize mainly JCUSH, which offers the best opportunity for measuring incomes in
each country in the same way and thus derive unbiased estimates of the gradient in each
country. Studies comparing gradients between countries have finessed the problem of
non-comparable income distribution data by using a crude measure of income inequality
(Decker and Remler, 2004). We use the JCUSH data to illustrate the bias in the previous
studies.
Tables 15-A and 15-B present evidence on the size of the income/health gradient in
the U.S. and Canada, separately by age and for whites and the total population. For the
younger group it is clear that except for one comparison (among whites for the poor or
14

fair measure of health status) there is a steeper gradient in the U.S. between the average
of the health indicator for all those below the median vs all those above the median. For
example the average percent poor or fair drops by 9.8 percentage points for all Canadians
while in the US the corresponding drop is 11.8 percentage points. Similarly the average
percent reporting very good or excellent health rises by 18.8 percentage points in Canada
and by 23.7 percentage points in the U.S. However, for the older group the results are
not so clear cut. In more than half the comparisons the gradients are steeper in Canada.
But all of the above and below the median comparisons in these tables are biased
toward finding a steeper slope in the U.S. This bias is revealed when one uses the
relatively detailed income data in JCUSH to compute the mean income of those
individuals with incomes above and below the median. (The means of those above and
below the median are displayed in the tables.) Note that the ratio of mean income of those
above the median to the mean income of those below median income in the U.S. is
significantly greater for both the all person comparisons and the white only
comparisons. For all persons the Canadian ratio is 3.27 and the U.S. ratio is 3.54, while
for the white only comparison the Canadian ratio is 3.21 and the U.S. is 3.40. This means
that the relative variance of income across persons is much greater in the U.S., and this
would generate a larger spread in the measures of health status even if the gradient were
the same in both countries. By simply using above and below the median in each country
we are in effect forcing a steeper gradient on the U.S. data.
Fortunately, the JCUSH data enable us to make comparisons using a
continuous income variable that assigns a value to each individual. Thus the greater
relative spread in the U.S. income data can be measured with some accuracy. The rate of
change can be estimated as the partial regression coefficient of the income variable in
separate multiple regression equations for Canada and the U.S. (using the health measure
as the dependent variable) and the results for the two countries can be compared. The
larger the coefficient (in absolute value), the steeper will be the gradient. Tables 16 and
17 show the results of our analysis. With JCUSH we were able to do two analyses, one
using the Health Utility Index (HUI) to measure health status (Table 16) and one using
self reported poor/fair (Table 17).
15

Table 16 shows the partial effect of income on the health utility index in three
multiple regression models that hold different numbers of other variables constant.
Income, as Cutler, Deaton and Lleras-Muney (2005) note, itself is likely to be affected
by health. It is also correlated with other variables that affect health status such as
education and chronic conditions. We don’t expect to resolve these difficult
problems of cause and effect. But we do the regression in stages so that changes in the
effect of income on health can be observed when different variables are included in the
regression. Model 1 contains controls for demographic variables and education.
Model II adds variables that measure health risks such as underweight, obesity, smoking
currently or formerly, and a series of chronic conditions. Model III adds health access
variables—unmet needs due to waiting, cost or other reasons, whether has a regular
doctor and whether needed medicine but couldn’t afford it. Means of all the variables and
full results for all the independent variables in the model III version
With HUI as the dependent variable are provided in the Appendix.
Note that among the 18-64 year olds, the gradient in all three HUI regression models
is actually steeper in Canada than in the U.S. (Table 16). And the same result holds when
we use fair/poor to measure health status (Table 17). For this measure of health status the
Canadian coefficients are quite a bit steeper than those in the U.S.. The results are less
consistent for the older age group. In the HUI regression results the gradient is weaker in
Canada than in the U.S. and is not statistically significant. But the results with fair/poor
as the health status measure again show steeper gradients for the older group in Canada.6
Perhaps it should not be surprising to find that the gradient is alive and well in
Canada despite the presence of a single payer system. It is difficult for any society to
change traits that are health risks and that are usually strongly correlated with income.
Nor does free access to medical care guarantee equal ability to navigate and use the
health care system.
Consumer Satisfaction
6 Income for retired individuals, however, can be unreliable because income from assets and imputed income from owned homes are a larger component of income but are not adequately reflected in the income measure.
16
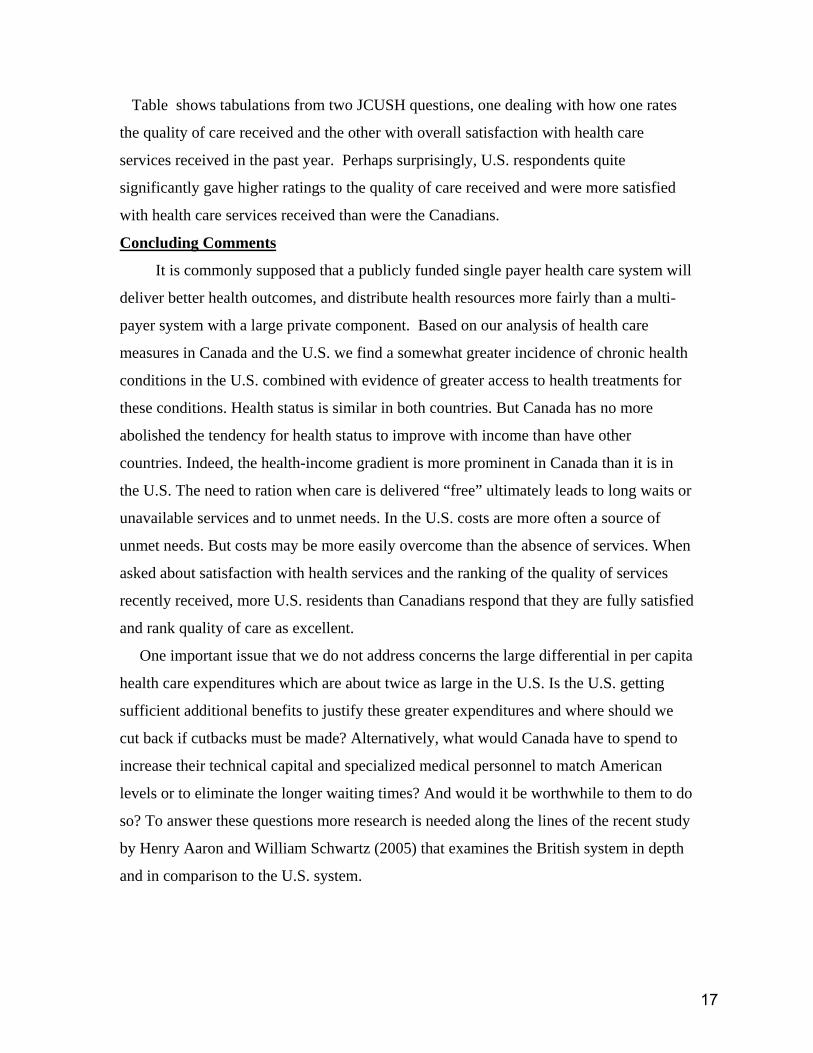
Table shows tabulations from two JCUSH questions, one dealing with how one rates
the quality of care received and the other with overall satisfaction with health care
services received in the past year. Perhaps surprisingly, U.S. respondents quite
significantly gave higher ratings to the quality of care received and were more satisfied
with health care services received than were the Canadians.
Concluding Comments
It is commonly supposed that a publicly funded single payer health care system will
deliver better health outcomes, and distribute health resources more fairly than a multi-
payer system with a large private component. Based on our analysis of health care
measures in Canada and the U.S. we find a somewhat greater incidence of chronic health
conditions in the U.S. combined with evidence of greater access to health treatments for
these conditions. Health status is similar in both countries. But Canada has no more
abolished the tendency for health status to improve with income than have other
countries. Indeed, the health-income gradient is more prominent in Canada than it is in
the U.S. The need to ration when care is delivered “free” ultimately leads to long waits or
unavailable services and to unmet needs. In the U.S. costs are more often a source of
unmet needs. But costs may be more easily overcome than the absence of services. When
asked about satisfaction with health services and the ranking of the quality of services
recently received, more U.S. residents than Canadians respond that they are fully satisfied
and rank quality of care as excellent.
One important issue that we do not address concerns the large differential in per capita
health care expenditures which are about twice as large in the U.S. Is the U.S. getting
sufficient additional benefits to justify these greater expenditures and where should we
cut back if cutbacks must be made? Alternatively, what would Canada have to spend to
increase their technical capital and specialized medical personnel to match American
levels or to eliminate the longer waiting times? And would it be worthwhile to them to do
so? To answer these questions more research is needed along the lines of the recent study
by Henry Aaron and William Schwartz (2005) that examines the British system in depth
and in comparison to the U.S. system.
17

References
Aaron, Henry J. and Schwartz, W.B. 2005. Can We Say NO? The Challenge of Rationing
Health Care, The Brookings Institution, Washington, DC
Canadian Institute for Health Information, CIHI report shows increases in MRI and CT
scanners, up more than 75% in the last decade, 2004.
Canadian Institute for Health Information, Health care spending to reach $142 billion this
year, 2005.
Corman, H., Joyce, T., and Grossman, M. 1987. "Birth Outcome Production Functions in
the U.S." Journal of Human Resources. 22: 339-360.
Corman, Hope, and Grossman, M. 1985. “Determinants of Neonatal Mortality Rates in
the U.S.: A Reduced Form Model.” Journal of Health Economics, 4 (3): 213-236.
Currie, J, and J. Gruber. 1996. "Saving Babies: The Efficacy and Cost of Recent
Expansions of Medicaid Eligibility for Pregnant Women." Journal of Political
Economy 104 (6): 1263-96.
Cutler, David, A. Deaton and A. Lleras-Muney, “The Determinants of Mortality”,
Harvard University and Princeton University, December 2005.
Decker, Sandra L and Remler, D. K 2004. “How Much Might Universal Health Insurance
Reduce Socioeconomic Disparities in Health? A Comparison of the US and
Canada.” Applied Health Economics and Health Policy, 3 (4): 205-216.
Dubay, L., Joyce, T., Kaestner, R. and G. Kenney. 2001. “Changes in Prenatal Care
Timing and Low Birth Weight by Race and Socioeconomic Status: Implications
for the Medicaid Expansions for Pregnant Women.” Health Services Research. 36
(2): 373-398.
18

Joyce, T., Racine, A., McCalla, S., and Wehbeh, H. 1995. "The Impact of Prenatal
Exposure to Cocaine on Newborn Costs and Length of Stay." Health Services
Research 30: 341-358.
Joyce, T. 1994. "Self Selection, Prenatal Care and Birthweight among Blacks, Whites,
and Hispanics in New York City." Journal of Human Resources 29: 762-794.
Joyce, T., and Grossman, M. 1990. "The Dynamic Relationship Between Low
Birthweight and Induced Abortion in New York City: An Aggregate Time-Series
Analyses." Journal of Health Economics. 9: 273-288.
Kaestner, R., Joyce, T., and Wehbeh, H. 1996. "The Effect of Drug Use on Birth Weight:
Measurement Error in Binary Variables." Economic Inquiry 34: 617-629.
Kelley, Edward and Hurst, Jeremy, “Health Care Quality Indicators Project Initial
Indicators Report”, OECD HEALTH WORKING PAPERS # 22, 2006
Kramer, Michael; Barros, Fernando; Demissie, Kitaw; Liu, Shillang; Kiely, John and
Joseph, K.S., “Does reducing infant mortality depend on preventing low
birthweight? An analysis of tempoortal trends in the Americas”, Pediatric and
Perinatal Epidemiology, 19, 445-451, 2005
Krauss, Clifford, “As Canada’s Slow-Motion PublicHealth System Falters, Private Medical Care
Is Surging”, News Article, The New York Times, February 26, 2006
MacKenzie, K. Roy, 1999. “Canada: A Kinder, Gentler Health Care System?”
Psychiatric Services, 50 (4):489-491.
Marmot, M., “The Influence of Income on Health: Views of an Epidemiologist”, Health
Affairs, 21 (2): 31-46
19

Nicolucci, Antonio; Greenfield, Sheldon and Mattke, Soeren, “Selecting indicators for
the quality of diabetes care at the health systems level in OECD countries”
International Journal for Quality in Health Care, September 2006
Organization for Economic Cooperation and Development, OECD Health Data2006:
How Does Canada Compare,
Ross, Nancy, et.al., “Relation Between Income Inequality and Mortality in Canada and
the United States: Cross-sectional Assessment, Using Census Data and Vital
Statistics”, British Medical Journal, 320:898-902, 2000
Schoen, C, et. al., “International Comparison: Effectiveness”, 2004 Commonwealth Fund
International Health Policy Survey, The Commonwealth Fund, Dec. 2006
Stanton, Mark W., “The High Concentration of U.S. Health Care Expenditures”,
Rockville (MD), Agency for Healthcare Research and Quality, 2005, Research in
Action Issue 19, AHRQ Pub. No 06-0060
Statistics Canada, “Access to Health Care Services in Canada”, Canadian Community
Health Survey, Health Services Access Subsample, 2003 and 2005
United Nations Statistics Division,”Teen Birth Rates: How Does the United States
Compare” Demographic Yearbook 2004, New York, United Nations
World Health Organization, “International Comparison: Effectiveness”, WHO Vaccine-
Preventable Diseases Monitoring System, The Commonwealth Fund, Dec.2006
20

Table 1
Life Expectancy and Infant mortality in Canada, the U.S. and Selected OECD Countries (2003).
Life Expectancy Infant Mortality
(per 1000 live births)At birth At 65 years of age
Male Female Male Female
U.S 74.8 80.1 16.8 19.8 6.8 White 75.3 80.5 16.9 19.8 5.7 Black 69.0 76.1 15.9 18.5 13.5Canada 77.4 82.4 17.4 20.8 5.3Denmark 75.1 79.9 15.5 18.6 4.4France 75.9 82.9 17.1 1) 21.4 1) 4.0Germany 75.7 81.4 16.1 19.6 4.2Italy 76.8 82.5 16.6 1) 20.6 1) 3.9
Japan 78.4 85.3 18.0 23.0 3.0
Korea 73.9 80.8 15.1 19.0 5.3 1)
Luxembourg 75.0 81.0 15.5 19.0 4.9
Sweden 77.9 82.5 17.0 20.3 3.1
U.K 76.2 80.7 16.1 1) 19.1 1) 5.3
1) Reported for 2002.
Source: OECD Health Data 2007 . CDC-NCHS, National Vital Statistics.
21

Table 2
Birthweight Distributions (in %) a) and Birthweight-specific Infant Mortality (per 1000 live births)
in Canada and the United States
Birthweight Distributions
Birthweight-specific Infant Mortality
U.S. Canada U.S. Canada
1997(n=3,884,329)
1995–97(n=656,553) 1997 1995-97
Birthweightcategory (g)
<1500 1.4 0.9 247.3 262.21500-1999 1.5 1.1 29.3 36.62000-2499 4.6 3.7 12.2 12.92500-2999 16.6 15.0 4.8 4.4≥3000 75.9 78.9 2.1 2.0Unknown b) 0.0 0.5 187.8 33.8<2500 7.5 5.7 60.4 58.0
a) %s for birthweight distribution are of those with known birthweight.
b) % of total births.
Source: Michael S. Kramer, Fernando C. Barros, Kitaw Demissie, Shiliang Liu, John Kiely and K. S. Joseph. "Does reducing infant mortality depend on preventing low birthweight? An analysis of temporal trends in the Americas." Paediatric and Perinatal Epidemiology 2005, 19:447–448, derived from Table 1 and Table 2.
22
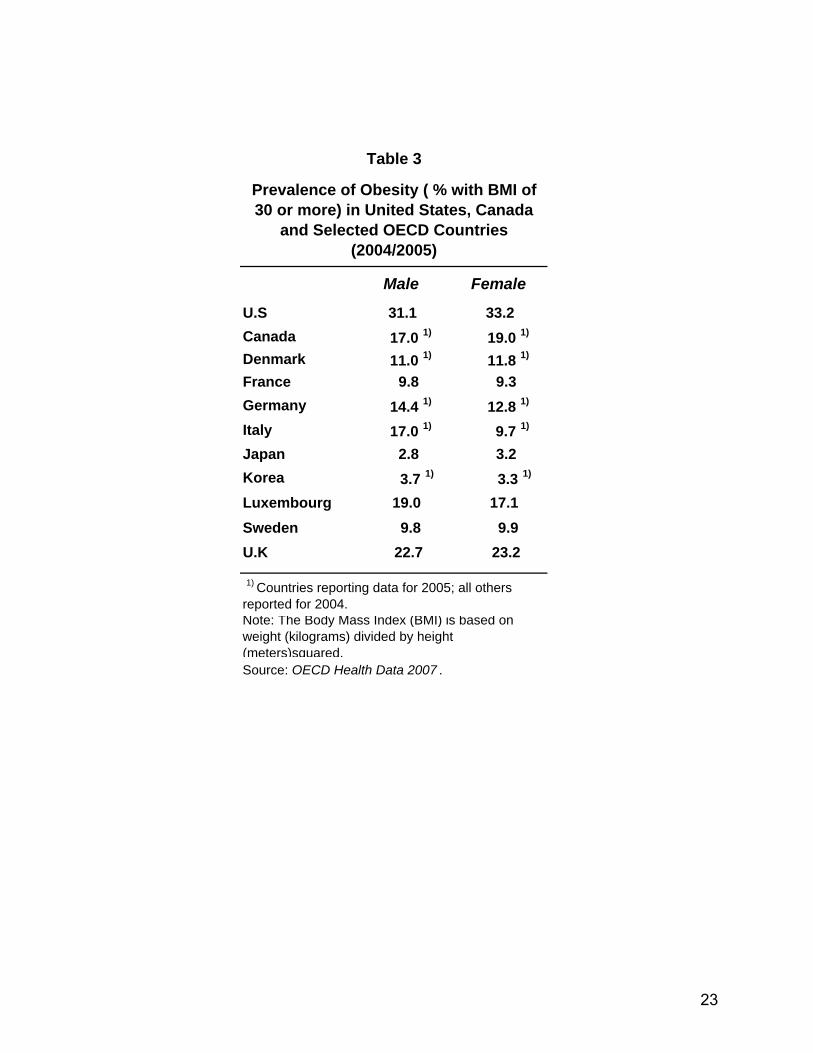
Table 3
Prevalence of Obesity ( % with BMI of 30 or more) in United States, Canada
and Selected OECD Countries (2004/2005)
Male Female
U.S 31.1 33.2Canada 17.0 1) 19.0 1)
Denmark 11.0 1) 11.8 1)
France 9.8 9.3Germany 14.4 1) 12.8 1)
Italy 17.0 1) 9.7 1)
Japan 2.8 3.2Korea 3.7 1) 3.3 1)
Luxembourg 19.0 17.1Sweden 9.8 9.9U.K 22.7 23.2
1) Countries reporting data for 2005; all others reported for 2004.Note: The Body Mass Index (BMI) is based on weight (kilograms) divided by height (meters)squared.Source: OECD Health Data 2007 .
23
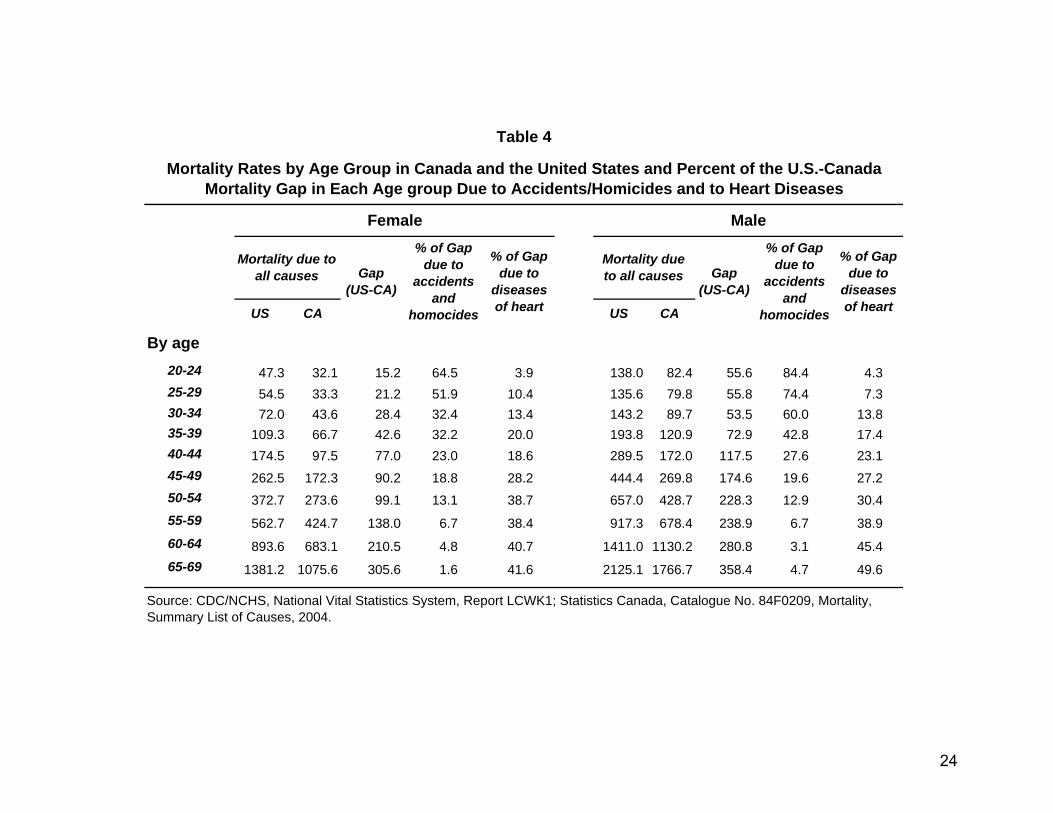
Table 4
Mortality Rates by Age Group in Canada and the United States and Percent of the U.S.-Canada Mortality Gap in Each Age group Due to Accidents/Homicides and to Heart Diseases
Female Male
Mortality due to all causes Gap
(US-CA)
% of Gap due to
accidents and
homocides
% of Gap due to
diseases of heart
Mortality due to all causes Gap
(US-CA)
% of Gap due to
accidents and
homocides
% of Gap due to
diseases of heartUS CA US CA
By age20-24 47.3 32.1 15.2 64.5 3.9 138.0 82.4 55.6 84.4 4.325-29 54.5 33.3 21.2 51.9 10.4 135.6 79.8 55.8 74.4 7.330-34 72.0 43.6 28.4 32.4 13.4 143.2 89.7 53.5 60.0 13.835-39 109.3 66.7 42.6 32.2 20.0 193.8 120.9 72.9 42.8 17.440-44 174.5 97.5 77.0 23.0 18.6 289.5 172.0 117.5 27.6 23.145-49 262.5 172.3 90.2 18.8 28.2 444.4 269.8 174.6 19.6 27.250-54 372.7 273.6 99.1 13.1 38.7 657.0 428.7 228.3 12.9 30.455-59 562.7 424.7 138.0 6.7 38.4 917.3 678.4 238.9 6.7 38.960-64 893.6 683.1 210.5 4.8 40.7 1411.0 1130.2 280.8 3.1 45.465-69 1381.2 1075.6 305.6 1.6 41.6 2125.1 1766.7 358.4 4.7 49.6
Source: CDC/NCHS, National Vital Statistics System, Report LCWK1; Statistics Canada, Catalogue No. 84F0209, Mortality, Summary List of Causes, 2004.
24

Table 5
Self Reported Health Status in Canada and the US: Results from Different Surveys
JCUSH Canada CCHS
U.S. NHIS
U.S. MEPSAll Persons White Only
Canada U.S. Canada U.S. All White All White All White
Ages 18-64 Ages 20-64 Ages 18-64Self reported health status (% distribution) Poor 2.6 3.2 2.6 2.6 2.1 2.1 2.3 2.2 2.8 2.7
Fair 6.0 8.6 6.4 5.9 7.4 7.1 7.2 6.7 8.2 7.6 Good 26.2 25.9 24.0 24.6 29.4 28.4 24.4 23.7 26.9 26.2
Very good 38.1 33.8 39.3 36.9 37.2 38.2 33.8 34.5 34.8 35.8
Excellent 27.0 28.6 27.7 30.0 24.0 24.3 32.3 33.0 27.4 27.8
Ages 65+Self reported health status (% distribution)
Poor 7.9 9.5 8.1 8.5 6.8 6.5 7.3 6.6 6.8 6.5
Fair 19.4 19.4 17.7 16.7 19.9 19.1 18.3 17.2 17.0 16.0
Good 37.6 30.3 36.2 30.9 36.7 36.4 35.8 36.2 33.8 33.6Very good 27.0 25.8 29.6 27.9 25.2 26.2 26.1 27.0 28.2 28.9
Excellent 8.0 15.0 8.4 16.0 11.5 11.8 12.6 13.0 14.2 15.0
Source: Joint Canada/United States Survey of Health(JCUSH), Canadian Community Health Survey (CCHS), United States National Health Interview Survey (U.S. NHIS), and United States Medical Expenditure Panel Survey (U.S. MEPS): all in year 2003.
25

Table 6
Other Indicators of Health Status in Canada and the U.S.
All Persons White Only
Canada U.S. Canada U.S.
Ages 18-64 Health Utility Index(HUI) Mean score 0.898 0.883 0.897 0.892
% with major depression 1) 9.0 9.7 9.1 9.8
% reported pain that limits activities 11.0 11.9 11.2 10.6
Ages 65+Health Utility Index(HUI) Mean score 0.795 0.782 0.798 0.798
% with major depression 1) 3.6 3.7 3.9 3.2
% reported pain that limits activities 20.3 20.7 20.6 18.7
1) Major depression refers to those with 90 percent probability of depression. This variable calculates the probability that the respondent would have been diagnosed as having experienced a major depressive episode in the past 12 months, if they had completed the Long-Form Composite International Diagnostic Interview (CIDI). The items used to measure depression are a subset of items from the CIDI that measure major depressive episode (MDE). The short-form of MDE used in the JCUSH was developed to operationalize the diagnosis of MDE.
Source: Joint Canada/United States Survey of Health.
26

Table 7-A
Incidence and Treatment Status of Certain Health Conditions in Canada and the U.S., Ages 18-64
All Persons White Only
Canada U.S. Canada U.S.% with
condition% gets
treatment% with
condition% gets
treatment% with
condition% gets
treatment% with
condition% gets
treatment
1 Asthma 6.6 80.3 7.8 78.8 6.9 82.7 7.7 77.62 Arthritis excluding fibromyalgia 11.6 N.A. 12.5 N.A. 12.4 N.A. 13.1 N.A.
3 High blood pressure 8.8 84.1 13.1 88.3 9.1 83.2 12.5 87.3
4 Emphysema or related disease 0.5 53.0 1.3 73.1 0.6 53.0 1.4 69.4
5 Diagnosed with diabetes 3.2 --- 4.9 --- 3.1 --- 3.8 ---
Takes insulin --- 24.6 --- 28.8 --- 30.6 --- 24.7Takes diabetic pills --- 63.4 --- 72.0 --- 58.4 --- 65.2Takes insulin or pills --- 80.3 --- 83.9 --- 79.9 --- 79.9
6 Heart disease 2.4 67.2 2.6 69.6 2.7 69.4 2.4 73.27 Coronary heart disease 0.9 88.9 1.0 94.8 0.9 87.5 0.8 95.6
8 Angina 0.9 74.6 1.1 61.0 0.9 70.7 0.8 75.1
Source: Joint Canada/United States Survey of Health.
27
1
2
3
4
5
6
7
8
Table 7-B
Incidence and Treatment Status of Certain Health Conditions in Canada and the U.S., Ages 65 and Over
All Persons White Only
Canada U.S. Canada U.S.
% with condition
% gets treatment
% with condition
% gets treatment
% with condition
% gets treatment
% with condition
% gets treatment
Asthma 7.1 82.5 6.6 91.6 7.1 82.8 6.2 91.7
Arthritis excluding fibromyalgia 39.4 N.A. 46.5 N.A. 39.6 N.A. 46.2 N.A.
High blood pressure 40.8 95.1 45.0 97.7 40.7 94.9 42.8 97.7
Emphysema or related disease 3.8 64.3 5.3 73.6 3.9 65.1 5.3 71.0
Diagnosed with diabetes 12.9 --- 16.3 --- 12.0 --- 14.8 ---
Takes insulin --- 17.5 --- 26.3 --- 14.9 --- 26.7
Takes diabetic pills --- 71.7 --- 74.0 --- 69.7 --- 73.2
Takes insulin or pills --- 80.4 --- 91.3 --- 76.0 --- 91.5
Heart disease 13.7 91.4 17.7 90.8 12.9 92.3 17.0 90.2
Coronary heart disease 4.9 90.5 6.8 96.3 5.3 90.9 6.9 95.4
Angina 10.3 73.0 5.8 77.7 10.2 74.9 5.5 77.1
Source: Joint Canada/United States Survey of Health
28
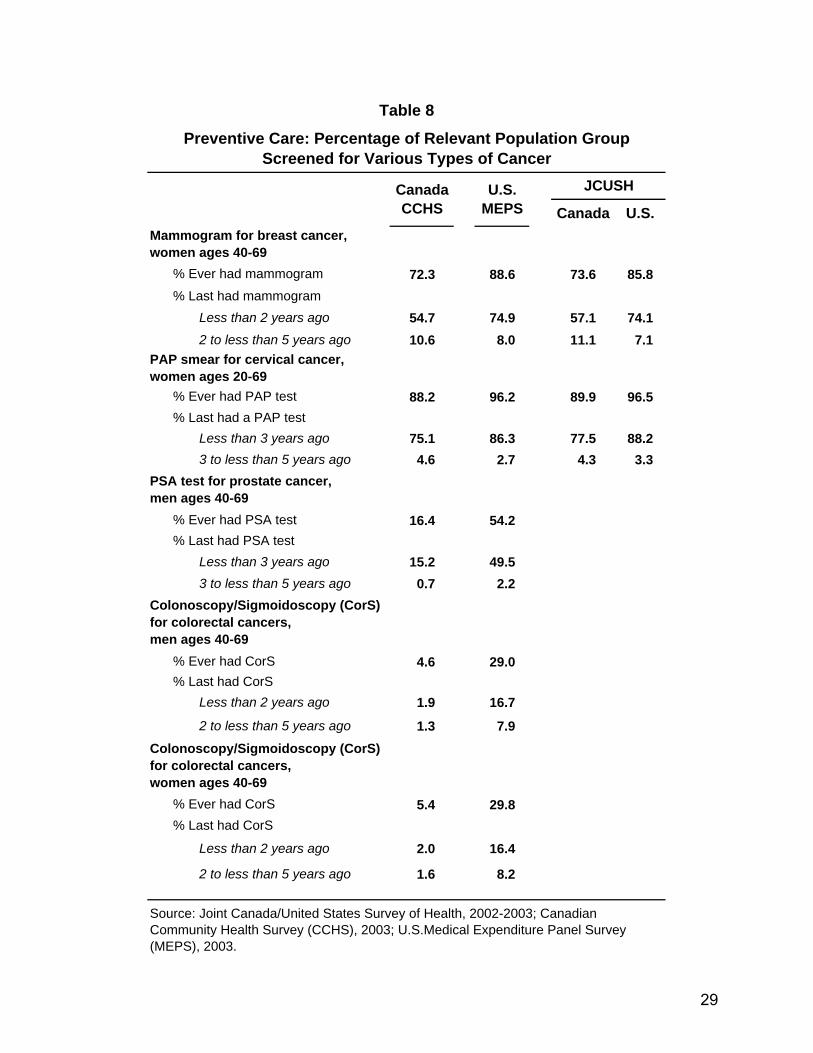
Table 8
Preventive Care: Percentage of Relevant Population Group Screened for Various Types of Cancer
Canada CCHS
U.S. MEPS
JCUSH
Canada U.S.Mammogram for breast cancer, women ages 40-69
% Ever had mammogram 72.3 88.6 73.6 85.8% Last had mammogram
Less than 2 years ago 54.7 74.9 57.1 74.12 to less than 5 years ago 10.6 8.0 11.1 7.1
PAP smear for cervical cancer, women ages 20-69
% Ever had PAP test 88.2 96.2 89.9 96.5% Last had a PAP test
Less than 3 years ago 75.1 86.3 77.5 88.23 to less than 5 years ago 4.6 2.7 4.3 3.3
PSA test for prostate cancer, men ages 40-69
% Ever had PSA test 16.4 54.2% Last had PSA test
Less than 3 years ago 15.2 49.53 to less than 5 years ago 0.7 2.2
Colonoscopy/Sigmoidoscopy (CorS) for colorectal cancers, men ages 40-69
% Ever had CorS 4.6 29.0% Last had CorS
Less than 2 years ago 1.9 16.7
2 to less than 5 years ago 1.3 7.9Colonoscopy/Sigmoidoscopy (CorS) for colorectal cancers, women ages 40-69
% Ever had CorS 5.4 29.8% Last had CorS
Less than 2 years ago 2.0 16.4
2 to less than 5 years ago 1.6 8.2
Source: Joint Canada/United States Survey of Health, 2002-2003; Canadian Community Health Survey (CCHS), 2003; U.S.Medical Expenditure Panel Survey (MEPS), 2003.
29
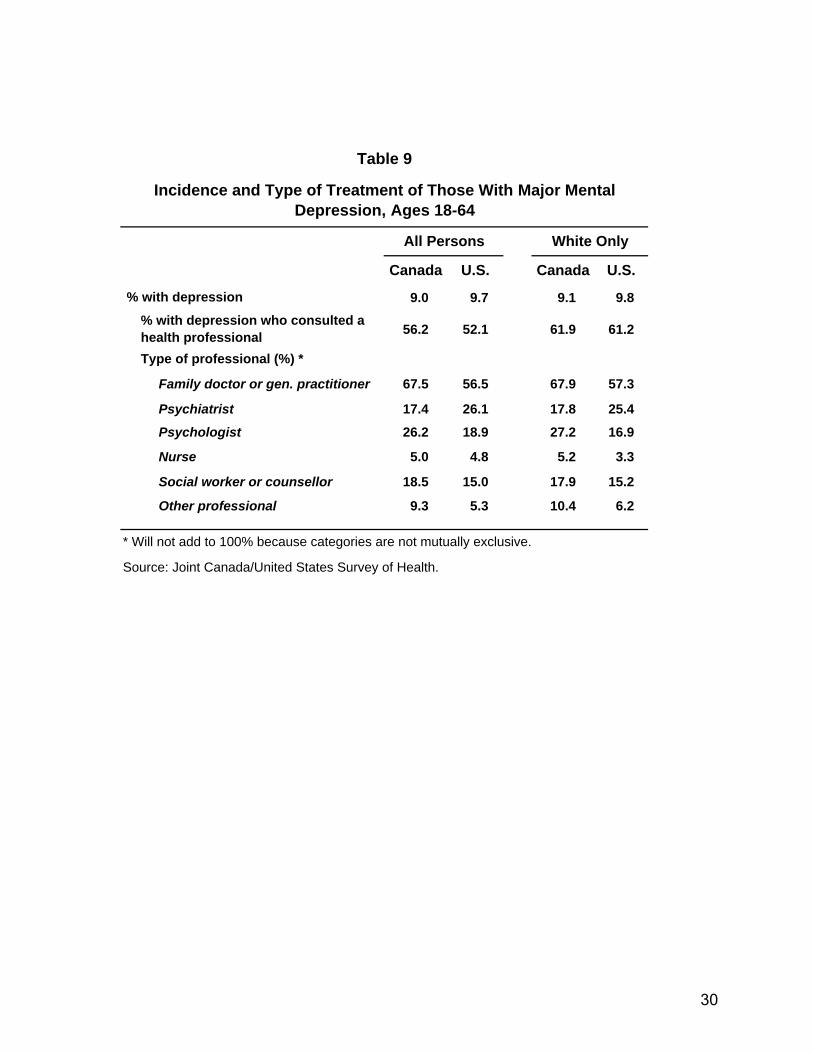
Table 9
Incidence and Type of Treatment of Those With Major Mental Depression, Ages 18-64
All Persons White Only
Canada U.S. Canada U.S.
% with depression 9.0 9.7 9.1 9.8% with depression who consulted a health professional 56.2 52.1 61.9 61.2
Type of professional (%) *
Family doctor or gen. practitioner 67.5 56.5 67.9 57.3
Psychiatrist 17.4 26.1 17.8 25.4
Psychologist 26.2 18.9 27.2 16.9
Nurse 5.0 4.8 5.2 3.3
Social worker or counsellor 18.5 15.0 17.9 15.2
Other professional 9.3 5.3 10.4 6.2
* Will not add to 100% because categories are not mutually exclusive.
Source: Joint Canada/United States Survey of Health.
30

Table 10Number of Computed Tomography (CT) Scanners per Million
Population and Number of Magnetic Resonance Imaging (MRI) Scanners per Million Population in Selected OECD Countries
Number of CTs per Million Population
Number of MRIs per Million Population
Country (Year reported):
Japan (2002) 92.6 35.3UNITED STATES (2004) 32.0 27.0Korea (2003) 31.9 9.0Austria (2003) 27.2 13.5Italy (2003) 24.0 11.6Switzerland (2003) 18.0 14.2Greece (2002) 17.1 2.3Denmark (2003) 14.5 9.1Sweden (1999) 14.2 7.9Germany (2002) 14.2 6.0Finland (2003) 14.0 12.8Spain (2003) 13.0 7.3Czech Republic (2003) 12.6 2.4New Zealand (2004) 12.1 ---CANADA (2005) 11.3 5.5Slovak Republic (2003) 8.7 2.0France (2003) 8.4 2.8Turkey (2003) 7.3 ---UK (2004) 7.0 5.0
Sources: Canadian Institute for Health Information, Medical Imaging in Canada , 2005, pp. 55-56, derived from Figure 17 and Figure 18.Notes:
a) In Canada, units located both in hospitals and in free-standing imaging facilities are included. Data is as of January 1, 2005.b) In Japan, only units located in hospitals and general clinics are counted.c) In Greece, CT scanners/MRI units from military hospitals and private diagnostic centres are also included.
d) In the UK, raw numbers of CT/MRI units for England and Wales have been increased by the OECD Secretariat to provide an estimate for the UK. The private sector is not included in the data.
e) In the U.S., units located both in hospitals and in non-hospital sites are included. IMV was used as the data source, because it counts the number of CTs, whereas OECD figures are a count of the number of hospitals that report having at least one scanner.
f) In Germany, data on medical technology includes equipment installed in acute care hospitals and in prevention and rehabilitation homes. The table comprises CT units as well as PET units.
31

Table 11
Waiting Times in Canada for Non-Emergency Surgery: Estimates from Different Data Sources
Median Weeks Waiting
Data Source and Procedure:
Statistics Canada 1
Joint Replacement and Cataract Surgery 8
OECD 2
Joint Replacement 20Cataract Surgery 12
Fraser Institute 3
Joint Replacement 30Cataract Surgery 12
1 “Access to Health Care Services in Canada”, January to December 2005, Statistics Canada.2 Siciliani & Hurst, “Explaining Waiting Times Variations for Elective Surgery across OECD Countries”, OECD HEALTH WORKING PAPERS (2003) #7.3 Nadeem Esmail & Michael Walker, “Waiting Your Turn 16th Edition: Hospital Waiting Lists in Canada”, The Fraser Institute, 2006.
Note: The data were derived from different underlying populations. Statistics Canada bases its numbers on the responses of individuals to questions about their waiting time experiences. The information is obtained as a by-product of their household survey. The OECD utilizes administrative data collected by various provincial governmental agencies. The Fraser Institute generates its own survey of specialist physicians and asks them to estimate patient waiting time from the date the surgery was scheduled to the date the surgery actually took place. All the estimates shown above also refer to that same period—weeks elapsed between the date scheduled by the specialist and the actual surgery. Information (not shown) is also collected on the waiting time between referral to a specialist and the actual meeting with the specialist.
32

Table 12
Percent of Those with Self Reported Unmet Health Need and Reason for Unmet Need
Ages 18-64 Ages 65+
Canada U.S. Canada U.S.
% with unmet need 11.3 14.4 7.4 6.4
Reason for unmet need (%) :
Wait too long or not available 56.3 13.2 51.9 24.6
Cost 8.6 54.7 2.2 35.9
Other reasons 36.6 33.2 45.9 42.6
* Categories with reasons are not mutually exclusive and therefore will not add to a hundred.
Source: Joint Canada/United States Survey of Health.
33
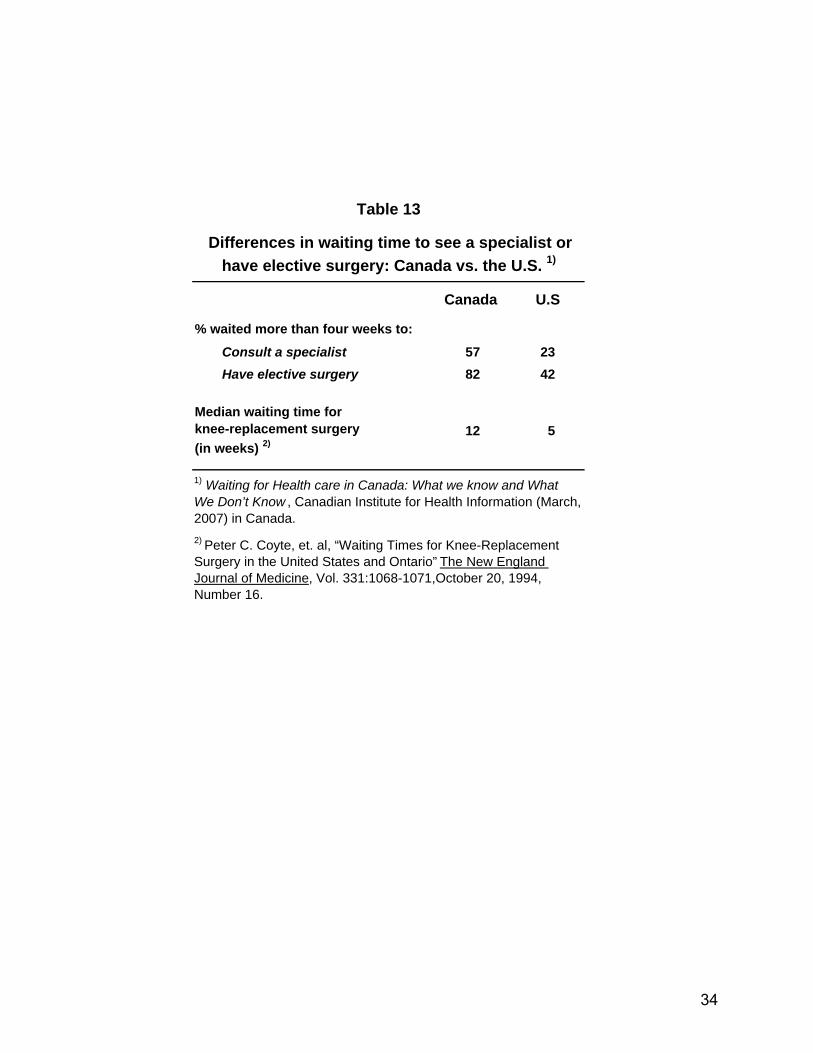
Table 13
Differences in waiting time to see a specialist or have elective surgery: Canada vs. the U.S. 1)
Canada U.S
% waited more than four weeks to:
Consult a specialist 57 23Have elective surgery 82 42
Median waiting time for knee-replacement surgery (in weeks) 2)
12 5
1) Waiting for Health care in Canada: What we know and What We Don’t Know , Canadian Institute for Health Information (March, 2007) in Canada. 2) Peter C. Coyte, et. al, “Waiting Times for Knee-Replacement Surgery in the United States and Ontario” The New England Journal of Medicine, Vol. 331:1068-1071,October 20, 1994, Number 16.
34
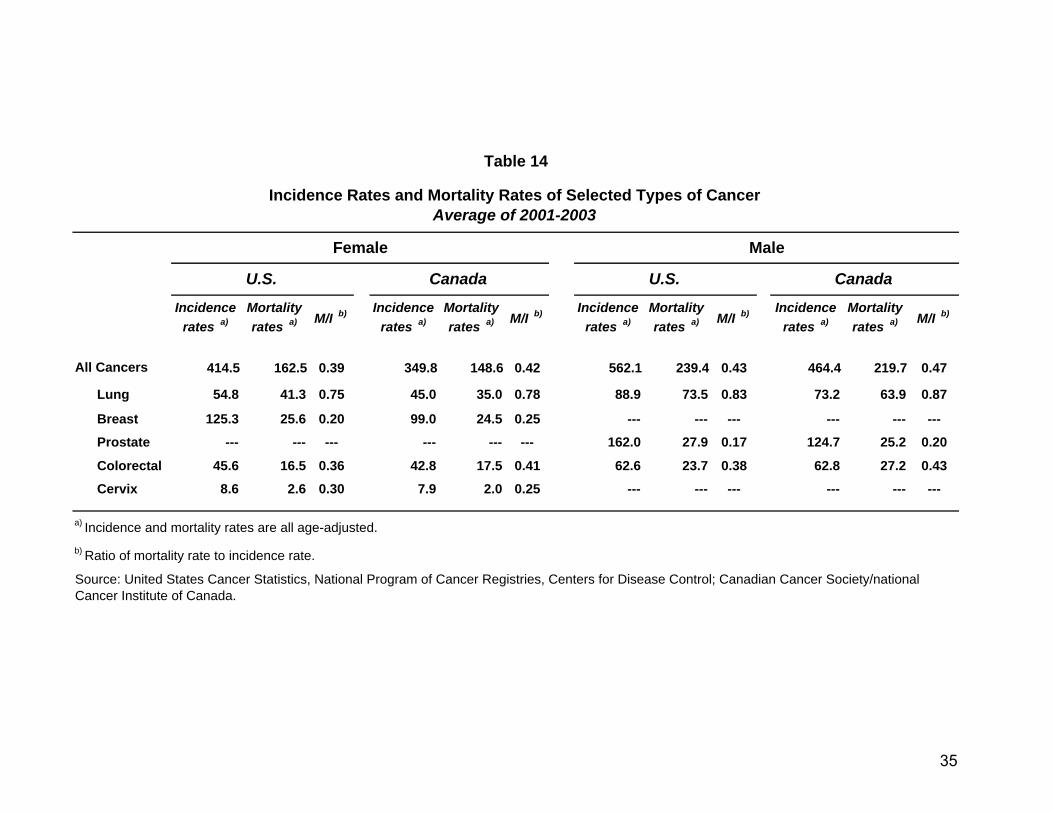
Table 14
Incidence Rates and Mortality Rates of Selected Types of Cancer Average of 2001-2003
Female Male
U.S. Canada U.S. Canada
Incidence rates a)
Mortality rates a) M/I b) Incidence
rates a)Mortality rates a) M/I b) Incidence
rates a)Mortality rates a) M/I b) Incidence
rates a)Mortality rates a) M/I b)
All Cancers 414.5 162.5 0.39 349.8 148.6 0.42 562.1 239.4 0.43 464.4 219.7 0.47
Lung 54.8 41.3 0.75 45.0 35.0 0.78 88.9 73.5 0.83 73.2 63.9 0.87
Breast 125.3 25.6 0.20 99.0 24.5 0.25 --- --- --- --- --- ---
Prostate --- --- --- --- --- --- 162.0 27.9 0.17 124.7 25.2 0.20
Colorectal 45.6 16.5 0.36 42.8 17.5 0.41 62.6 23.7 0.38 62.8 27.2 0.43
Cervix 8.6 2.6 0.30 7.9 2.0 0.25 --- --- --- --- --- ---
a) Incidence and mortality rates are all age-adjusted.b) Ratio of mortality rate to incidence rate.
Source: United States Cancer Statistics, National Program of Cancer Registries, Centers for Disease Control; Canadian Cancer Society/national Cancer Institute of Canada.
35

Table 15-A
Income and Self-reported Health Status Differences, Ages 18-64 (US dollars *)
Mean of income category (000's)
Poor or fair
Very good or excellent Excellent
All Canadian <median 25.7 14.7 54.2 21.2
≥ median 81.3 4.9 73.0 30.4All US
<median 28.9 17.6 50.2 21.2 ≥ median 96.7 5.8 73.9 34.5
White Canadian
<median 25.9 15.6 55.9 22.4≥ median 81.6 5.1 73.6 30.7
White US
<median 30.6 12.8 54.6 23.0
≥ median 98.7 5.3 75.6 34.8
* Canadian dollars converted to US dollars using purchasing power parity.
Source: Joint Canada/United States Survey of Health.
36

Table 15-B
Income and Self-reported Health Status Differences, Ages 65 and Over
(US dollars * )
Mean of income category (000's)
Poor or fair
Very good or excellent Excellent
All Canadian <median 21.9 30.9 30.2 5.8
≥ median 71.7 17.2 54.2 19.1All US
<median 24.9 34.2 36.0 11.7
≥ median 88.3 15.3 57.1 23.8
White Canadian
<median 22.0 29.9 33.1 6.6
≥ median 70.7 14.8 57.5 17.1
White US
<median 26.0 29.8 38.1 12.5
≥ median 88.4 15.9 56.9 23.7
* Canadian dollars converted to US dollars using purchasing power parity.
Source: Joint Canada/United States Survey of Health.
37

Table 16
Effect of Income on Health Utility Index (HUI), JCUSH
Canada U.S.
Regression model: I II III I II III
Controls: Demographic
factors
Adds: health risks
Adds: unmet needs
Controls: Demographic
factors
Adds: health risks
Adds: unmet needs
Ages 18-64
Partial effect of income (000's) 0.0009 *** 0.0006 *** 0.0005 *** 0.0008 *** 0.0005 *** 0.0004 ***
Adj. R-Square 0.0687 0.2396 0.2749 0.0995 0.2818 0.3143
Mean of dependent variable
0.8978 0.8840
Sample size 2663 3797
Ages 65+
Partial effect of income (000's) 0.0005 0.0003 0.0003 0.0008 *** 0.0006 ** 0.0005
Adj. R-Square 0.0677 0.2098 0.2240 0.1165 0.2564 0.2826
Mean of dependent variable
0.7961 0.7830
Sample size 684 1017
Note: Complete regression results are shown in the Appendix for Model III (mean characteristics and variable coefficients). The demographic variables in Model I include sex, age group, education, whether nonwhite, whether immigrant, whether married and whether lives alone. Model II adds whether obese and other weight related variables, current and former smoking, incidence of various chronic diseases. Model III adds unmet needs and whether has regular doctor. Starred figures denote statistical significance at the following levels: *10%; ** 5%; ***1%.
Source: Joint Canada/United States Survey of Health (JCUSH) microdata file.
38

*
Table 17
Effect of Income on Whether Reported Poor/Fair Health Status, JCUSH
Canada U.S.
Regression model: I II III I II IIIControls:
Demographic factors
Adds: health risks
Adds: unmet needs
Controls: Demographic
factors
Adds: health risks
Adds: unmet needs
Ages 18-64Partial effect of income (000's) -0.0013 *** -0.0008 *** -0.0008 *** -0.0009 *** -0.0004 ** -0.0003 **
Adj. R-Square 0.0623 0.2082 0.2203 0.0929 0.2437 0.2589
Mean of dependent variable
0.0854 0.1163
Sample size 2710 3870
Ages 65+Partial effect of income (000's) -0.0019 *** -0.0014 * -0.0014 ** -0.0017 *** -0.0011 ** -0.0009 *
Adj. R-Square 0.0432 0.2300 0.232. 0.0831 0.2328 0.2407Mean of dependent variable
0.2725 0.2860
Sample size 732 1090
Note: The demographic variables in Model I include sex, age group, education, whether nonwhite, whether immigrant, whether married and whether lives alone. Model II adds whether obese and other weight related variables, current and former smoking, incidence of various chronic diseases. Model III adds unmet needs and whether has regular doctor. Starred figures denote statistical significance at the following levels: *10%; ** 5%; ***1%. (The regression specification is the same as that for the HUI regression detailed in the appendix. Regression results are available from the authors.)
Source: Joint Canada/United States Survey of Health (JCUSH) microdata file.
39

Table 18
Quality and Satisfaction with Health Care Services
Ages 18-64 Ages 65+
Canada U.S. Canada U.S.
Rate the quality of health care received
Excellent 37.7 40.4 45.8 49.6Good 46.7 47.5 43.8 41.8Fair 12.9 10.0 8.3 6.6Poor 2.8 2.1 2.1 2.1
Satisfaction with health care services
Very satisfied 41.5 51.3 55.4 63.8Somewhat satisfied 44.8 38.2 35.4 28.8Neither satisfied nor dissatisfied 5.3 3.7 3.1 2.2
Somewhat or very dissatisfied 8.5 6.8 6.1 5.3
Source: Joint Canada/United States Survey of Health.
40

Appendix Table 1
Means of Characteristics Use in HUI Regressions *
Ages 18-64 Ages 65+
Canada U.S. Canada U.S.Household income (in thousands) 52.459 54.506 26.250 27.607Household income missing (0,1) 0.132 0.183 0.223 0.329Female (0,1) 0.499 0.512 0.559 0.574Age groups: 18-29 (0,1) 0.259 0.237 --- --- 30-44 (0,1) 0.363 0.388 --- --- 45-64 (0,1) 0.378 0.375 --- --- 65-74 (0,1) --- --- 0.594 0.589
Less than high school (0,1) 0.145 0.095 0.452 0.207High school graduate (0,1) 0.318 0.371 0.266 0.387Attended community college or vocation school (0,1) 0.231 0.142 0.138 0.134Attended university or college (0,1) 0.307 0.392 0.144 0.272
Non-white (0,1) 0.187 0.264 0.131 0.157Immigrant (0,1) 0.186 0.171 0.264 0.106Married (0,1) 0.662 0.644 0.615 0.606Live alone (0,1) 0.115 0.203 0.286 0.332
Underweight (0,1) 0.028 0.022 0.024 0.020Overweight (0,1) 0.320 0.321 0.384 0.359Obese (0,1) 0.151 0.201 0.146 0.203Body Mass Index missing (0,1) 0.035 0.039 0.026 0.035
Daily smoker (0,1) 0.203 0.184 0.102 0.068Former daily smokers (0,1) 0.307 0.237 0.413 0.439
Has asthma (0,1) 0.066 0.077 0.069 0.060Has arthritis (excluding fibromyalgia) (0,1) 0.116 0.123 0.394 0.459Has high blood pressure (0,1) 0.087 0.130 0.405 0.452Has emphysema (0,1) 0.005 0.012 0.041 0.044Has diabetes (0,1) 0.032 0.048 0.127 0.157Has heart disease (0,1) 0.024 0.023 0.133 0.167Has coronary heart disease (0,1) 0.008 0.008 0.053 0.063Has angina (0,1) 0.009 0.011 0.101 0.050Has major depression (0,1) 0.089 0.096 0.033 0.033
Has regular medical doctor (0,1) 0.826 0.771 0.964 0.929Needed medicines but could not afford it (0,1) 0.055 0.100 0.015 0.079Unmet health need due to: Long wait or not available (0,1) 0.063 0.018 0.036 0.017 Cost (0,1) 0.009 0.077 0.001 0.022 Other reasons (0,1) 0.042 0.046 0.032 0.025
* All variables are weighted.
Source: JCUSH microdata file.
41

Appendix Table 2Determinants of Health Status As Measured By Health Utility Index (HUI):
Partial Regression CoefficientsAges 18-64 Ages 65+
Canada U.S Canada U.SCoef. t-stat Coef. t-stat Coef. t-stat Coef. t-stat
Intercept 0.933 65.19 0.931 77.18 0.728 11.55 0.746 19.15Household income (in thousands) 0.000 4.79 0.000 5.06 0.000 0.62 0.000 1.59Household income missing (0,1) 0.012 1.11 0.019 2.26 0.008 0.31 0.014 0.73Female (0,1) 0.001 0.23 0.006 1.04 0.001 0.05 0.032 1.88Age groups: 18-29 (0,1) 0.018 2.17 0.010 1.29 45-64 (0,1) 0.002 0.31 -0.020 -3.12 65-74 (0,1) 0.082 4.29 0.061 3.96Less than high school (0,1) -0.036 -3.80 -0.058 -5.86 -0.037 -1.65 -0.087 -4.27Attended comm. col./voc. (0,1) 0.000 0.02 0.000 0.03 -0.007 -0.24 0.010 0.44Attended univ. col. (0,1) 0.008 1.01 0.018 2.70 0.020 0.68 0.038 2.01
Non-white (0,1) -0.001 -0.11 -0.002 -0.33 -0.035 -1.28 0.004 0.18Immigrant (0,1) -0.015 -1.72 0.003 0.39 -0.053 -2.51 0.003 0.12Married (0,1) 0.023 2.85 0.009 1.37 0.073 2.49 0.073 3.56Live alone (0,1) -0.009 -0.77 -0.004 -0.51 0.105 3.40 0.074 3.72
Underweight (0,1) -0.029 -1.58 -0.027 -1.44 0.038 0.63 -0.164 -3.10Overweight (0,1) -0.013 -1.81 -0.007 -1.06 0.000 -0.02 0.047 2.71Obese (0,1) -0.013 -1.46 -0.020 -2.57 -0.020 -0.71 -0.019 -0.90Body Mass Index missing (0,1) 0.011 0.66 -0.004 -0.29 -0.009 -0.15 -0.056 -1.38
Daily smoker (0,1) -0.022 -2.64 -0.013 -1.72 -0.052 -1.63 -0.004 -0.12Former daily smokers (0,1) -0.009 -1.28 -0.016 -2.37 -0.006 -0.28 -0.001 -0.05
Has asthma (0,1) -0.051 -4.18 -0.030 -2.98 -0.044 -1.20 -0.006 -0.19Has arthritis (0,1) -0.115 -11.77 -0.112 -12.74 -0.116 -6.14 -0.113 -7.38Has high blood pressure (0,1) -0.030 -2.71 -0.021 -2.35 0.002 0.11 -0.013 -0.82Has emphysema (0,1) -0.030 -0.68 -0.106 -4.28 -0.073 -1.56 -0.045 -1.22Has diabetes (0,1) -0.012 -0.72 -0.046 -3.51 -0.060 -2.10 -0.099 -4.81Has heart disease (0,1) -0.021 -0.94 -0.040 -1.93 -0.012 -0.36 -0.068 -3.02Has coronary heart disease (0,1) -0.021 -0.58 -0.063 -1.84 0.046 0.94 -0.060 -1.79Has angina (0,1) -0.081 -2.36 -0.055 -1.95 -0.168 -4.95 0.008 0.23Has major depression (0,1) -0.137 -12.58 -0.151 -15.86 -0.183 -3.50 -0.190 -4.61
Has regular medical doctor (0,1) -0.019 -2.34 -0.010 -1.50 0.070 1.45 0.006 0.22Needed med. couldn't afford (0,1) -0.076 -5.53 -0.081 -7.94 -0.042 -0.56 -0.059 -2.01Unmet health need due to: Long wait or not available (0,1) -0.097 -7.89 -0.028 -1.38 -0.068 -1.38 -0.025 -0.45 Cost (0,1) -0.043 -1.37 -0.058 -5.20 -0.438 -1.12 -0.170 -3.24 Other reasons (0,1) -0.079 -5.25 -0.089 -6.88 -0.178 -3.37 -0.204 -4.32
Adj. R-Square 0.2749 0.3143 0.1042 0.2826Dependent mean 0.8978 0.8840 0.2240 0.7830Sample size 2663 3797 684 1017
* Regressions are weighted.
Source: JCUSH microdata file.
42