Health, Social Security and Housing - States of Jersey Health, Social Security and Housing Scrutiny...
126
Health, Social Security and Housing Scrutiny Sub-Panel Review of Benefit Levels Presented to the States on 28 th March 2011 S.R.3/2011
Transcript of Health, Social Security and Housing - States of Jersey Health, Social Security and Housing Scrutiny...

Health, Social Securityand Housing
Scrutiny Sub-Panel
Review of Benefit LevelsPresented to the States on 28th March 2011
S.R.3/2011


Review of Benefit Levels
1
CONTENTS
1. Chairman’s Foreword .............................................................................................3
2. Key Findings and Recommendations .....................................................................7
3. Terms of Reference..............................................................................................15
4. Sub-Panel Membership ........................................................................................17
4.1 Health, Social Security and Housing Scrutiny Sub-Panel ...............................17
4.2 Advisors ..........................................................................................................17
5. Introduction.............................................................................................................19
6. Case Studies ..........................................................................................................27
7. Jersey Income Distribution Survey 2009 / 10 .........................................................35
8. Jersey Annual Social Survey 2010 (JASS 2010) ....................................................41
9. The Levels of Income Support ................................................................................49
10. The relationship between Income Support and relative income standards.............51
11. Family Composition, Income Support and risk of Low Income...............................57
12. The relationship between Income Support and minimum income standards. ........63
13. Accountability and Transparency Issues. ..............................................................69
14. Income Support and the Housing Market ..............................................................75
15. Funding Social Housing: A Failing System. ...........................................................81
16. Income Support and Private Sector Rental............................................................85
17. Income Support and Earnings. ..............................................................................89
18. Income Tax............................................................................................................97
19. Pensions and Savings .........................................................................................103
20. Health Care..........................................................................................................109
21. Conclusion. ..........................................................................................................117
22. Glossary...............................................................................................................119
Appendix 1...................................................................................................................121
Appendix 2...................................................................................................................123

Review of Benefit Levels
2

Review of Benefit Levels
3
1. Chairman’s Foreword
1.1 When the HSSH Income Support Sub-Panel set out in October 2009, to produce
a report on the levels of benefit and the structures put in place under the Income
Support system, I realised that we had taken on a massive task. Not only was
Income Support designed to replace some 14 separate benefits, it was intended
to be both the safety net for the vulnerable and to support those in work.
1.2 In addition, Income Support is a complex system, which attempts to meet the
needs of a wide range of households. We also had to examine the interaction of
Income Support with other fiscal and social policies such as minimum wage
levels and rental policies.
1.3 The HSSH Sub-Panel has been fortunate to be able to co-ordinate its own
research with the publication of two other pieces of work undertaken by the
States of Jersey Statistics Unit:
Jersey Income Distribution Survey 2009/10
Jersey Annual Social Survey 2010
1.4 The first of these is vital in setting accurate and up to date low-income thresholds
by which Income Support levels can be judged. We were pleased to work with
the Social Security Department and States Statistics Unit to devise a
comprehensive questionnaire, which formed the basis for chapter 12 in the
Jersey Annual Social Survey 2010. The survey explored individual reactions to
the financial difficulties involved in living in Jersey.
1.5 With such an ambitious piece of research, it is almost inevitable that some topics
receive greater attention than others do. In this case we have not managed to
give due attention to the interaction of Income Support with other benefits for
those with disability. This topic deserves its own investigation at some stage.
1.6 However, 3 years on from the introduction of Income Support, this report is able
Review of Benefit Levels
4
to make some definitive analysis of the effectiveness of the system. Despite
evidence of some improvements in the ability of the Income Support system to
alleviate conditions for those in our community who are the least well off, the
overall picture is of a system that contains inherent structural faults which cannot
be described as “minor teething troubles”. These structural faults, in the opinion
of the Sub-Panel require a fundamental rethink of what the realistic goals of
Income Support should be, and how it can best be organised to achieve those
aims.
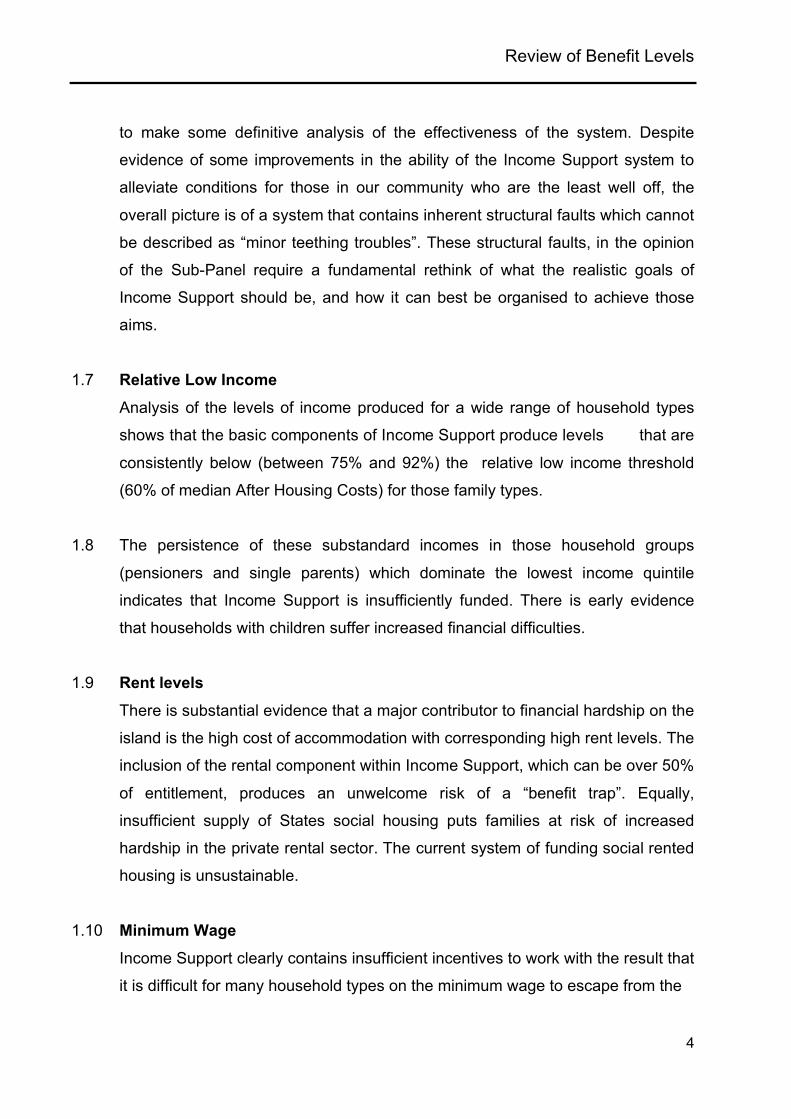
1.7 Relative Low Income
Analysis of the levels of income produced for a wide range of household types
shows that the basic components of Income Support produce levels that are
consistently below (between 75% and 92%) the relative low income threshold
(60% of median After Housing Costs) for those family types.
1.8 The persistence of these substandard incomes in those household groups
(pensioners and single parents) which dominate the lowest income quintile
indicates that Income Support is insufficiently funded. There is early evidence
that households with children suffer increased financial difficulties.
1.9 Rent levels
There is substantial evidence that a major contributor to financial hardship on the
island is the high cost of accommodation with corresponding high rent levels. The
inclusion of the rental component within Income Support, which can be over 50%
of entitlement, produces an unwelcome risk of a “benefit trap”. Equally,
insufficient supply of States social housing puts families at risk of increased
hardship in the private rental sector. The current system of funding social rented
housing is unsustainable.
1.10 Minimum Wage
Income Support clearly contains insufficient incentives to work with the result that
it is difficult for many household types on the minimum wage to escape from the

Review of Benefit Levels
5
need for Income Support. The tapers and disregards in Income Support result in
work at the minimum wage producing only £1 per hour additional income. Income
Support can be seen as propping up the current level of the minimum wage
through tax revenues.
1.11 Income Support and income tax
For some household types it is possible simultaneously to be in receipt of Income
Support and to pay income tax. This is obviously inefficient and must be
addressed.
1.12 Pensioner Savings
The system of “deemed income” applied to capital assets is a heavy disincentive
to save and discriminates against those (especially pensioners) who have
managed to save. It should be replaced by a system which encourages saving.
1.13 Medical Costs
There is substantial evidence that medical, dental and ophthalmic costs are a
cause of financial hardship for many households, especially for pensioners and
families with children, where demand is high. There is also evidence that there is
sufficient anxiety about medical costs to prevent some from seeing their GP
when they fall ill. This runs directly against policies to promote preventative care
through the primary care system, and must be addressed as a priority.
1.14 All of the above problems go beyond the possibility of “minor” adjustments to the
system, but require a major rethink of the structure and performance of Income
Support.
1.15 It is hoped that this scrutiny report will be seen as a positive contribution to better
understanding the issues involved in formulating and properly targeting social
and economic policy over the coming decade.

Review of Benefit Levels
6
1.16 This has been a significant piece of work that has been achieved as a result of
the hard work of the supporting officers. The many extra hours involved in the
public consultation part of the review is recognised and appreciated.
1.17 The Sub-Panel wishes to extend its thanks in particular to them and to all those
who have contributed to this report.
Deputy G.P. Southern of St. Helier,
Chairman, Health, Social Security & Housing Scrutiny Sub-Panel: Income
Support
Review of Benefit Levels
7
2. Key Findings and Recommendations
Please note: Each key finding is accompanied by a reference to that part of the
report where further explanation and justification may be found.
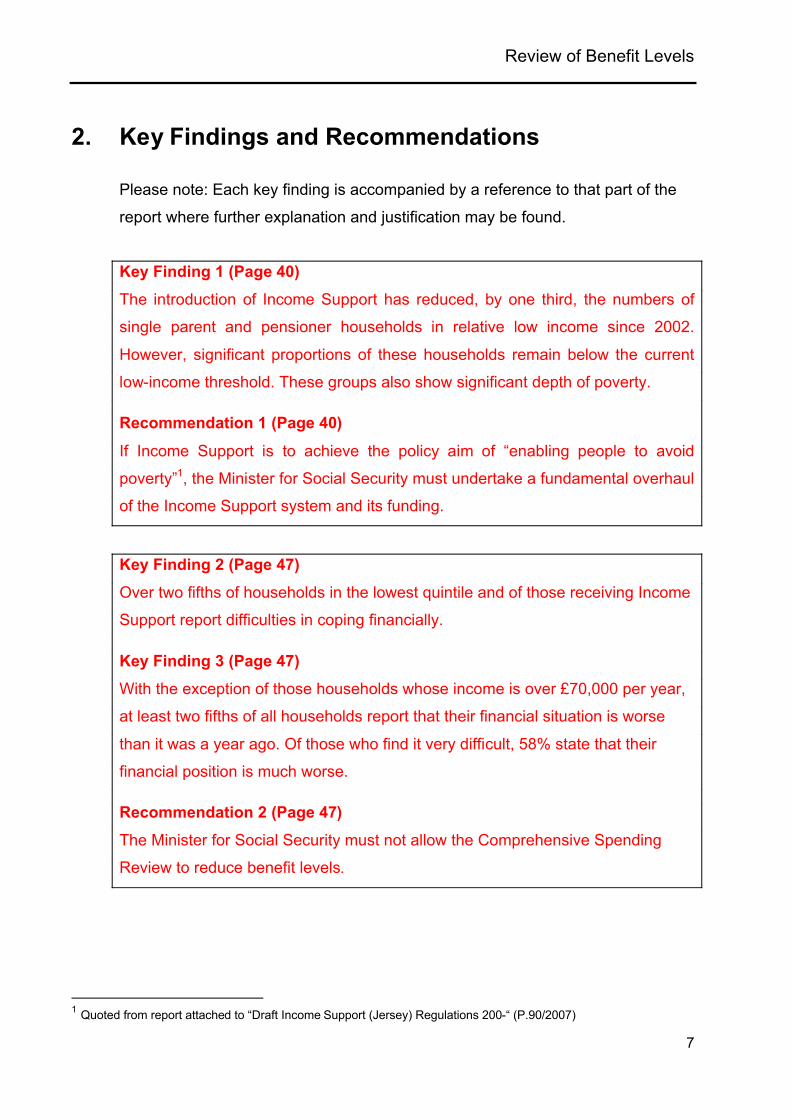
Key Finding 1 (Page 40)
The introduction of Income Support has reduced, by one third, the numbers of
single parent and pensioner households in relative low income since 2002.
However, significant proportions of these households remain below the current
low-income threshold. These groups also show significant depth of poverty.
Recommendation 1 (Page 40)
If Income Support is to achieve the policy aim of “enabling people to avoid
poverty”1, the Minister for Social Security must undertake a fundamental overhaul
of the Income Support system and its funding.
Key Finding 2 (Page 47)
Over two fifths of households in the lowest quintile and of those receiving Income
Support report difficulties in coping financially.
Key Finding 3 (Page 47)
With the exception of those households whose income is over £70,000 per year,
at least two fifths of all households report that their financial situation is worse
than it was a year ago. Of those who find it very difficult, 58% state that their
financial position is much worse.
Recommendation 2 (Page 47)
The Minister for Social Security must not allow the Comprehensive Spending
Review to reduce benefit levels.
1 Quoted from report attached to “Draft Income Support (Jersey) Regulations 200-“ (P.90/2007)
Review of Benefit Levels
8
Key Finding 4 (Page 56)
High rental levels are a major contributor to financial hardship in Jersey. 21% of
households in the lowest quintile report arrears for rent whilst between 10% and
15% were in arrears for their domestic energy bills.
Key Finding 5 (Page 59)
The HSSH Sub-Panel considers that the eligibility rules for the rental component
of Income Support for under 25 year olds are discriminatory and may be subject
to challenge under the Human Rights (Jersey) Law 2000.
Recommendation 3 (Page 59)
The Minister for Social Security must review, as a matter of urgency, his policy
on the eligibility for the accommodation component of Income Support of under
25 year olds.
Key Finding 6 (Page 62)
The basic components of Income Support are currently set at rates that are well
below the relative low-income threshold for a wide range of household types.
Recommendation 4 (Page 62)
The Minister for Social Security must bring a report to the States outlining his
targets for more closely aligning Income Support rates with the low income
threshold over a measured timescale.
Key Finding 7 (Page 68)
Despite the additional weighting in the original design of Income Support given to
families with children, the evidence contained in this chapter indicates increased
financial difficulties for these households.
Recommendation 5 (Page 68)
The Minister for Social Security must address the role of Income Support for
families with children, in conjunction with the development of the Strategic
Framework for Children and Young People.

Review of Benefit Levels
9
Key Finding 8 (Page 70)
Applicants for Income Support do not receive sufficient information to allow them
to understand how their benefit is made up.
Recommendation 6 (Page 70)
The Minister for Social Security must ensure that applicants for Income Support
are given a breakdown of their Income Support components in the letter notifying
them of their award. The Income Support calculator must be made available to
the public by the Social Security on its web site and in the department.
Key Finding 9 (Page 71)
There is clearly a need to make public a regular report schedule on Income
Support, including the cost of each component.
Recommendation 7 (Page 71)
The Minister for Social Security must publish the cost of each component of
Income Support in his Department Annual Report and Accounts.
Key Finding 10 (Page 72)
The effectiveness of Income Support at reaching vulnerable groups has not so
far been analysed.
Recommendation 8 (Page 72)
The Minister for Social Security should agree, across departments, a set of
standards for assessing the needs of particular vulnerable groups and for the
measurement of performance in targeting those needs.
Key Finding 11 (Page 73)
There is no evidence that research has been conducted into the under claiming
of Income Support.
Recommendation 9 (Page 73)
The Minister for Social Security should analyse the data contained in JIDS
2009/10 and other sources to assess take-up rates for Income Support.
Review of Benefit Levels
10
Key Finding 12 (Page 80)
Accurate figures for the sums which are paid to the States Housing Department
and to private landlords are essential for the development of future housing
policy.
Recommendation 10 (Page 80)
The Sub-Panel recommends that the Minister for Social Security makes public
accurate figures of gross annual payments of the accommodation components of
Income Support.
Key Finding 13 (Page 83)
Clearly, there are significant structural problems in the social housing finance
policy, causing restricted access to affordable social rented housing. It puts great
pressure on the tenants receiving Income Support subsidies in the private sector.
Recommendation 11 (Page 83)
The Minister for Social Security must work with the Ministers for Treasury and
Resources and Housing to ensure that the mechanism for financing social
housing is separate from the provision of means-tested Income Support benefits.
Key Finding 14 (Page 87)
The application of the accommodation component of Income Support set at the
fair rent level to those households renting in the private sector may result in
increased hardship especially for families with children.
Recommendation 12 (Page 87)
The Ministers for Social Security and Housing must establish a mechanism for
reviewing fair rent levels at regular intervals.
Key Finding 15 (Page 88)

Review of Benefit Levels
11
The current savings requirements imposed by the Comprehensive Spending
Review places the funds available to maintain the accommodation component at
‘fair rent’ levels at risk.
Recommendation 13 (Page 88)
Pending a long term solution to the funding of social housing, (Recommendation
12) the Minister for Social Security must resist any pressure to cap the rising cost
of the accommodation component of Income Support.
Key Finding 16 (Page 95)
At its current rate, the minimum wage results in high demand for Income Support
from a wide range of household types.
Recommendation 14 (Page 95)
The Minister for Social Security, in his own review of Income Support, must
examine the interaction between the level of the minimum wage and the overall
cost of Income Support.
Key Finding 17 (Page 95)
The system of tapers and disregards for earned income in the Income Support
structure provides insufficient incentives to work.
Recommendation 15 (Page 95)
The Minister for Social Security, in his own review of Income Support, must
conduct a thorough overhaul of tapers and disregards for earned income in order
to greatly improve incentives to work.

Review of Benefit Levels
12
Key Finding 18 (Page 101)
Potential or actual overlap between Income Support and Income Tax thresholds
is a major defect in the system.
Recommendation 16 (Page 101)
The Ministers for Social Security and Treasury and Resources must work
together to reduce the overlap between Income Support levels and Income Tax
thresholds at the lower end of the earnings distribution in order to correct
inefficiencies and report their findings within 12 months.
Recommendation 17 (Page 101)
The Ministers for Social Security and Treasury and Resources should pursue the
potential benefit from improved modelling of the tax and benefit system to
produce profiles similar to that produced by the UK Government entitled “Tax
Benefit Model Tables” and report their findings within 12 months.
Key Finding 19 (Page 107)
The current Deemed Income system, which is currently charged on savings at an
annual interest rate equivalent to 20.9%, severely penalises those who have
saved for their retirement.
Recommendation 18 (Page 107)
The Minister for Social Security should set an interest rate to be charged on
savings over the threshold at a realistic level to reflect actual bank interest rates.
This rate should be reviewed annually.
Review of Benefit Levels
13
Key Finding 20 (Page 115)
There is evidence to show that medical costs (G.P, dental and ophthalmic
consultations) are a serious problem for many households, especially low-income
households in receipt of Income Support, to the extent that significant numbers of
people report that the cost stops them going to their GP.
Recommendation 19 (Page 115)
The Minister for Social Security must ensure that information is fully and readily
available to the recipients of Income Support about how medical costs are to be
met.
Key Finding 21 (Page 115)
In principle, Household Medical Accounts are a useful mechanism to assist
Income Support clients to save for their GP costs.
Recommendation 20 (Page 115)
The Minister for Social Security should ensure that all Income Support claimants
who wish to can set up a Household Medical Account.
Key Finding 22 (Page 116)
The withdrawal of free access to GPs for some low-income households under the
HIE scheme following the introduction of Income Support has, in many cases,
had a negative impact.
Recommendation 21 (Page 116)
The Minister for Social Security should review the funding of medical care to
develop a costed scheme to provide limited free access to GPs for certain
vulnerable groups and report his findings within 12 months.

Review of Benefit Levels
14
Review of Benefit Levels
15
3. Terms of Reference
The Sub-Panel agree to the following Terms of Reference (ToR):
ToR 1
To assess whether Income Support benefit levels and structures are set
appropriately in relation to:
The changing income distribution and the relative poverty standard; and
Minimum standard of living and price inflation, with particular reference to
rent levels and the effects of price inflation on households below average
income
ToR 2
To assess how the level of Income Support benefits and their design potentially
interact with other areas of fiscal and social policy, with particular regard to:
Income tax thresholds,
Social Insurance contributions,
Minimum wage levels,
Pensions and
Social rent-setting policy and housing finance
With particular examination of:
Treatment of earned and unearned income,
Tapers and disregards,
Fixed Tariff Income and
The incentive structures that result from such design, especially those
regarding incentives for employment and saving.
Review of Benefit Levels
16
ToR 3
To review the delivery of Special Payments with particular regard to dental and
medical needs.
ToR 4
To examine the structure of the components of Income Support and their
treatment of potentially vulnerable target groups, to specifically include:
Children,
Pensioners,
Single parent families,
Young people and
Those with a disability.
ToR 5
To examine evidence concerning the impact of the phasing out of transitional
payments.
ToR 6
To consider any other pertinent matters that may arise during the course of the
review.

Review of Benefit Levels
17
4. Sub-Panel Membership
4.1 Health, Social Security and Housing Scrutiny Sub-Panel
Membership: Income Support Review of Benefit Levels
Deputy G.P. Southern of St. Helier: Chairman
Deputy D.J. De Sousa of St. Helier: Vice-Chairman
Connétable S.A. Yates of St. Martin
(until 21st June 2010 and from 7th October 2010)
Connétable D.W. Mezbourian of St. Lawrence
Deputy T.A. Vallois of St. Saviour (until 15th February 2011)
4.2 Advisors
Mr. E. Le Quesne
Mr. E. Le Quesne retired in 2001 as Head of Science at Victoria College, a post
he enjoyed for 28 years. He has taken an interest in local issues, for example as
a founder member and current Treasurer of JHOG (Jersey Homeless Outreach
Group). He is secretary of the CTJ Housing Trust, which has over 120 properties
to rent. He is chairperson of the Amos group of Christians Together in Jersey,
which meets monthly to look at social issues in Jersey and comment on
proposals put forward by States ministers. The group made comments and were
consulted on the original proposals for an Income Support system. Mr Le Quesne
also assisted on a previous Income Support Sub-Panel.
Dr. Martin Evans
Dr. Martin Evans is Senior Research Fellow in the Department of Social Policy
and Social Work and works in both the Social Disadvantage Research Centre
and the Centre for South African Social Policy at the University of Oxford. He
joined the Department in March 2007 having previously worked at the University
of Bath and at the London School of Economics. His research interests are in

Review of Benefit Levels
18
income, poverty and social security, developing countries, neighborhood
deprivation and welfare to work programmes.
He was an Economic and Social Research Council Research Fellow 2005-08
during which his research profiled the changes in British social policy since 1979
using an innovatory model lifetime approach. In 2006 he was Visiting Fellow at
the School of Social Welfare at the University of California, Berkeley. He is an
associate of the Centre for Analysis of Social Exclusion at the LSE. Before
gaining his PhD from the LSE in 1992, Martin worked in community law centre
and advice centres.
Dr. Susan Harkness
Dr. Susan Harkness (DPhil London; MA Sussex; MA Cantab) is a senior lecturer
in Social Policy at the University of Bath. She is a labour economist and was
previously a lecturer in economics at the Universities of Bristol and Sussex and a
researcher at the LSE. Her main research interests are in the areas of poverty
and inequality, female and household patterns of employment and child poverty.
Officers
Mrs. C. Le Quesne, Scrutiny Officer.
Mr. M. Robbins, Scrutiny Officer.

Review of Benefit Levels
19
5. Introduction
5.1 The Income Support system was introduced to replace 14 separate welfare
benefits from a number of sources. It was designed to produce a more
coherent and efficient mechanism for the delivery of benefits to the poor and
the vulnerable. There can be no doubt that the introduction of Income Support
has been the most significant piece of social policy reform of the last decade.
5.2 Income Support has now been operating for three full years, since January
2008. Previous reviews of Income Support have dealt with the design and
performance of Income Support.
i. HSSH Delivery of Income Support: Structure (S.R.5/2006)
ii. HSSH Review of Income Support (S.R.17/2007)
iii. Distributional Analysis of Income Support Households. June
2008 Social Security Department.
iv. HSSH Review of Income Support (S.R.5/2009)
5.3 The Panel decided, at the end of 2009, to constitute a Sub-Panel to undertake
a review on benefits and to focus on the policy underlying the provision of the
existing system. The intention of the Sub-Panel was to look at Income Support
on a fundamental level, in terms of what it does to alleviate poverty.
5.4 Since then, of course, the Income Support system has come under increasing
pressure from the impact of the recession on household incomes. This has
resulted in increased demand on resources and the increasing bill for Income
Support has had to be met through additional temporary funding from the
Treasury. The Sub-Panel notes, however, that funding for Income Support
remains subject to potential reductions in the Comprehensive Spending
Review plans for 2012 and 2013.
Review of Benefit Levels
20
5.5 In focussing on what benefits are being delivered to what household types,
the Panel has been able to draw on extensive data from the Department of
Social Security (DSS). In addition, the review has been designed to draw on
two further pieces of research conducted by the States of Jersey Statistics
Unit:
Jersey Income Distribution Survey Report 2009/10 (JIDS 2009/10)Jersey Annual Social Survey 2010 (JASS 2010)
5.6 The former, published in October 2010, was based on data collected in late
2009 and early 2010. It therefore forms an accurate basis for comparison of
levels of Income Support with relative low income levels and median / mean
income levels in the Island.
5.7 The Sub-Panel conducted a large survey regarding the ability for households to
cope financially in Jersey.
5.8 In conducting this part of the research the Sub-Panel decided to incorporate
some new methods of engaging with the public in addition to the usual media
approach.
5.9 The survey could be accessed in several ways
On the Scrutiny web site.
Through Facebook.
In face to face interviews at Brook and elsewhere.
At the Scrutiny ‘Big Red Tent’ in King Street on several occasions,
when members of the public were able to give their opinions directly to
the Members of the Sub-Panel.
By post and hard copy to the Parish Halls and other locations.
There were 870 respondents.
5.10 This self-selecting survey of opinion gave many useful insights into the
financial situation of Jersey Households. This is reflected in the many quotes
from the public included in this report.

Review of Benefit Levels
21
5.11 However, the real value of this approach to ‘deprivation markers’ is given by
the properly weighted numbers contained in the JASS 2010 (Chapter 12),
conducted by the States Statistics Unit, which can be taken with a high level
of confidence to be representative of the overall population.
5.12 The report accompanying the Draft Income Support (Jersey) Regulations 200-
(P.90/2007) which put the Income Support system into operation, contained
some very ambitious aims;
“The new system will help and enable people to both avoid poverty and to
take appropriate actions and life decisions to get out of poverty. The
system will do this by effectively tackling real needs whilst promoting work
and encouraging self-reliance…” 2
5.13 Notwithstanding these lofty ambitions, the HSSH Panel, based on its research
into the structures proposed for the implementation of Income Support,
published a number of reservations in SR 17/2007 as follows;
Policy makers, States Members and Ministers have to be more
questioning of simple platitudes of strategic policy aims and think more
about design and implementation and the necessary resources to make
them happen. Platitudes are easy, making things improve across the
board is a bigger challenge.
Second, some priorities have to be agreed. Commitments to end child and
pensioner poverty within a set timetable and programmes re-orientated to
do so could be adopted. Such promises will require better-understood
and considered programmes to support employment and saving. Such an
approach would better match the wider policy aims and may help focus
policy makers’ minds on the real trade-offs that have to be made when
trying to promote opportunity to work alongside income benefits.
2 Quote from report attached to P90/2007
Review of Benefit Levels
22
Third, there is the opportunity to tinker with the structures of Income
Support – but fundamentally, it is not an anti-poverty programme that
makes work pay. Neither is it an anti-poverty programme for the elderly
that supports saving for old age. The essence of the reforms has been to
squeeze out any resources that promote and reinforce work to those on
low to moderate incomes. Any radical change is beyond tinkering but
would require complete rethinking.
Fourth, there is the need to prepare for the potential negative effects that
Income Support will have on work and saving, even if no larger reform is
possible. These are potentially considerable without some immediate
action to change the incentive structures to improve the gains from work
and to reward savings.’
5.14 In this report we have built on the earlier research and we examine the fact
that during the development process many key funding elements considered
to be essential to the effective delivery of Income Support were not incorporated
into the new scheme. For example, the work done by the Centre for Research
in Social Policy (CRSP) “minimum budget standards”3, which was intended
to provide a costed set of family-based minimum living standards that could
be used to calibrate an anti-poverty programme such as Income Support, was
abandoned.
5.15 Income Support was subsequently implemented on 28 January 2008 to ‘over
8,000 households’ and the only intervening report on the numbers and
composition of recipients was published in June 2008 and referred to the
position in late April 2008 on 8,079 households.4
5.16 It is now more than two years since the release of those detailed statistics on
the numbers of Income Support claimants and the amount of public reporting
3 Household Budgetary Requirements, Centre for Research in Social Policy, Loughborough University December
19984 Distributional Analysis of Income Support Households. June 2008 Social Security Department.
Review of Benefit Levels
23
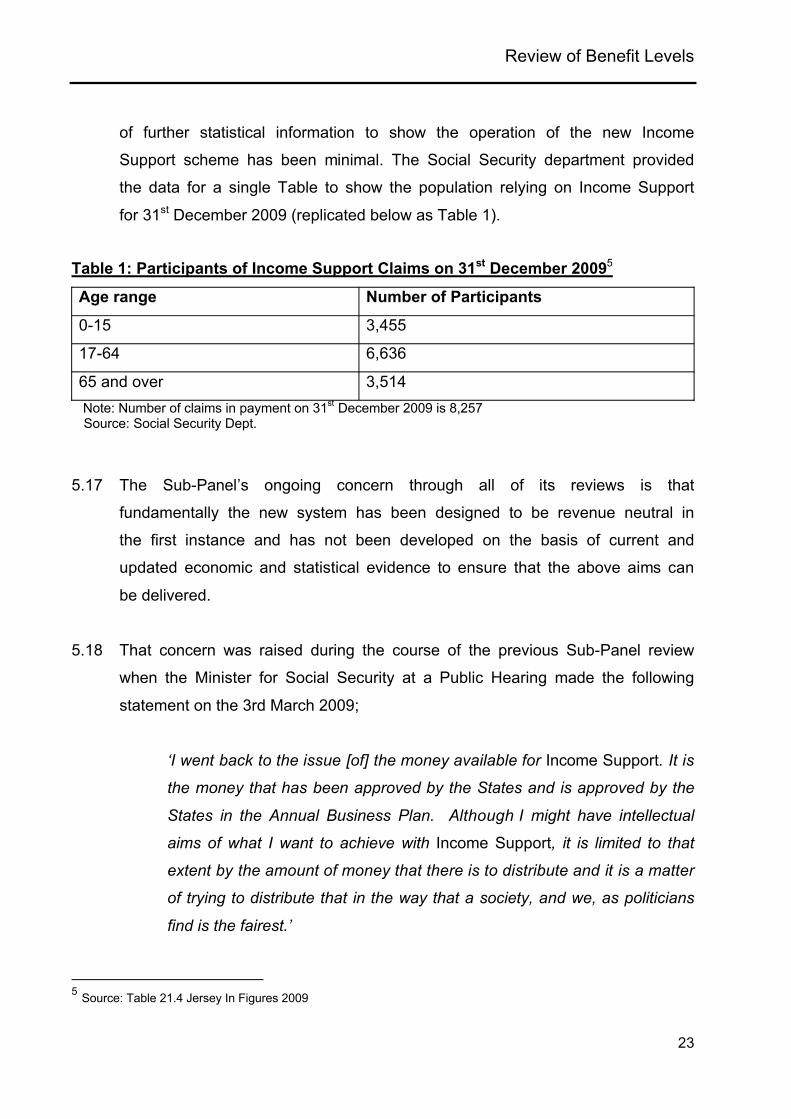
of further statistical information to show the operation of the new Income
Support scheme has been minimal. The Social Security department provided
the data for a single Table to show the population relying on Income Support
for 31st December 2009 (replicated below as Table 1).
Table 1: Participants of Income Support Claims on 31st December 20095
Age range Number of Participants
0-15 3,455
17-64 6,636
65 and over 3,514 Note: Number of claims in payment on 31st December 2009 is 8,257
Source: Social Security Dept.
5.17 The Sub-Panel’s ongoing concern through all of its reviews is that
fundamentally the new system has been designed to be revenue neutral in
the first instance and has not been developed on the basis of current and
updated economic and statistical evidence to ensure that the above aims can
be delivered.
5.18 That concern was raised during the course of the previous Sub-Panel review
when the Minister for Social Security at a Public Hearing made the following
statement on the 3rd March 2009;
‘I went back to the issue [of] the money available for Income Support. It is
the money that has been approved by the States and is approved by the
States in the Annual Business Plan. Although I might have intellectual
aims of what I want to achieve with Income Support, it is limited to that
extent by the amount of money that there is to distribute and it is a matter
of trying to distribute that in the way that a society, and we, as politicians
find is the fairest.’
5 Source: Table 21.4 Jersey In Figures 2009

Review of Benefit Levels
24
5.19 The Sub Panel believes that there is still no clear indication as to whether or
not benefit levels are appropriate to ensure that low-income households do
not suffer hardship and that raw data upon which to base those levels is
currently not available. The Minister for Social Security stated at a public
hearing on the 21st May 2010;
‘That is one of the things that will come out of the Income Distribution
Survey. We will be able to see where people are, what incomes they are
living on, how they are managing and we will be able to see whether
Income Support is effectively reaching them and they are being helped.
We have not done any other piece of work there but that is one big thing
that we believe will come out and that will help us look at where our
component levels are, whether they are set at the appropriate level or not,
whether they need to be adjusted or not. It is an important piece of work
that.’
5.20 The intention of this report is to focus on two areas:
i) whether the levels of benefit are set at the correct level to address the
financial hardship experienced by different groups in society and
ii) where the greatest needs are and how best to focus on delivering support
where demand is greatest.
5.21 A better understanding of the answers to these questions should form the basis
for social policy decisions.
5.22 The Sub-Panel has focused its attention on understanding the financial ‘pinch
points’ felt by low-income families and those requiring help from Income
Support. It has sought to identify areas which appear to need further
investigation by the Minister.

Review of Benefit Levels
25
5.23 Incentives to work and to save, the cost of childcare, high rental levels and
medical costs are all issues that have repeatedly been drawn to the Sub-
Panel’s attention. It recognises that the existing Income Support system is an
administrative system that does not include the old community care aspects
that formed part of the former parochial welfare system. It must be said,
however, that as a result the services delivered by Income Support are far more
inflexible than the system it replaced. The existing structure has insufficient
discretion to respond effectively to individual needs in a crisis.

Review of Benefit Levels
26
Review of Benefit Levels
27
6. Case Studies
6.1 “I feel that I need to grovel to Income Support by way of going into
Social Security every week and getting my 'Looking for work'
booklet signed, yet when I was working I didn't ask Social to justify
taking 6% of my wages every week. I am desperate to get off
Income Support as it makes me feel like a scrounger. Since
becoming unemployed I have applied for so many jobs but only a
handful have got back to me which is very disheartening!”6
6.2 In this part of the report the Panel considers hypothetical case studies7 that
examine Income Support income levels and incentives to work. These case
studies graphically illustrate some of the failings of the current level and structure
of the Income Support system. For these examples, current 2010/11 Income
Support rates from the revised DSS Income Support Calculator for October
20108 are used.
6.3 Single Householder of Working Age: ‘Marie’
6.4 In this hypothetical case study ‘Marie’ is 26 and rents a one-bedroom flat. Her
basic needs are covered in the ‘basic components’ of Income Support that total
£140.70 per week (£7,352 per year). In addition, her rent will be covered in full
(as long as the rent is at or below the accommodation component that Income
Support uses for such property types).
6.5 Until recently, Marie was sleeping on her friend’s couch and had been for two
months. Despite looking for accommodation which was affordable, she had been
unable to find anything suitable. During this time her weekly Income Support to
meet her basic needs was £92.12 (£4,813.27 per annum) as a non-householder.
6 Response to survey 2927 These are called ‘model families’ in UK literature and can be compared to the published ‘Tax Benefit Model Tables’
that are produced every year.8 Now called the IS Audit calculator.

Review of Benefit Levels
28
6.6 The large majority of Income Support recipients rent their accommodation (68%
of all claimants). As a single, fit and healthy young person with no special needs,
Marie is not eligible for States housing despite being a low earner. She therefore
is one of the 30% of all Income Support claimants who rent in the private sector.
After two months of searching, she is grateful to have found a one bedroom flat
at the fair rent level of £152.53. Her rent is fully covered by the accommodation
component of her Income Support.
6.7 When we add together her basic and rent components we see that rent is a very
high proportion of her overall Income Support levels. Her total Income Support is
£293.23 (£140.70 +152.53) of which 52% is rent. Her annual income from
Income Support is £15,247.
6.8 Marie works full time (37.5 hour weekly), at the minimum wage of £6.20 per hour.
She therefore earns a gross weekly wage of £232.50 which is a net wage of
£218.55 after social security contributions. This means that her earnings are
topped up by Income Support by the amount of £113.04 a week.
6.9 Marie’s employer asks her to increase her hours to 40 hours a week (an
additional 2.5 hours). Her gross earnings rise to £248 and her take-home pay to
£233.12. Her Income Support, however, falls to £101.03 per week. This means
that her extra wages of £15.50 only gave rise to a net increase in income of
£2.56. Her additional hours had a real hourly rate of just £1.02 as she faced an
‘effective deduction rate’ (from social security contributions and Income Support
withdrawal) of 83% for every pound of additional earnings.
6.10 Her extra hours are because several other colleagues at work have been made
redundant and her boss has told her that her job is also not secure. Marie is
worried about being made redundant but realises that if she were, she would only
be £40.92 worse off if she were unemployed. She works out that she would be
able to manage on the £293.23 she would get if she were unemployed. Maybe
redundancy would not be that bad but she worries about getting another job.
Review of Benefit Levels
29
6.11 Some weeks later it is pointed out to her that if she continues to work 40 hours a
week, her gross earnings over the year will rise to £12,900, and that this is above
the tax threshold of £12,650 (until January 2011) on her gross earnings. By
working the additional 2.5 hour a week, she has made herself eligible to pay tax.
She is £133.12 pence better off a year but is now liable to pay tax at the marginal
rate of 27% on £250 of her earnings; a tax bill of £67.50.
6.12 Does Marie’s income from Income Support mean that she is in ‘poverty’?
6.13 The after housing cost (AHC) relative low-income threshold for Marie, taken from
JIDS2009/10 data, is £210 (60% of median). If she continues to work 40 hours a
week, her net income, after she pays her rent, will be £181.62, leaving her below
the low-income threshold.
6.14 Marie’s case shows that she is caught in a ‘poverty trap’ because
she needs help from Income Support even when working a full week
at the minimum wage;
of the combination of a low minimum wage and high rent levels;
working extra hours produces very little reward;
her weekly income will drop by only £40 if she were to become
unemployed.
On top of which, she may be liable to pay income tax whilst still receiving Income Support.
6.15 A Married Couple with no Children: ‘Jackie and Bill’
6.16 The second hypothetical case study is a family profile of a married couple of
working age, called ‘Jackie and Bill’ for illustrative purposes, who have no
children.
6.17 Their Income Support basic components total £232.82 a week (£12,165 per
annum), made up of two adults (at £92.12) and household component of £48.58.
Review of Benefit Levels
30
As a couple, Jackie and Bill receive 166% of a single person’s basic
components. Like Marie, Jackie and Bill can have their rent met in full at the fair
rent level of £152.52. This brings the maximum level of Income Support
entitlement to £385.34 a week, (£20,037 per annum).
6.18 Jackie and Bill both work full time on the minimum wage. At a 37.5 hour working
week, this provides a combined take-home pay of £437.10 per week. This level
of earnings reduces their Income Support to £24.98 in 2010. Their total income in
this year is £462.08 a week.
6.19 This case study so far has assumed that Jackie and Bill are paying the ‘fair rent’
for their accommodation. The reality of the housing situation makes this
extremely unlikely. Jack and Bill have no children; are fit and able; without
special needs and are under 50 years of age. They are not eligible for States
housing and have to live in the private sector. Jackie and Bill are paying £200 per
week9 for their 1 bedroom flat.
6.20 At the market rate of £200 per week Jackie and Bill fall significantly below 60% of
the equivalised median income (relative low income threshold) for a couple. Even
if Jackie and Bill were paying the ‘fair rent’ at £152.52, their income would still fall
below this low-income threshold after housing costs.
6.21 Their scenario is not unusual in Jersey. Meeting the cost of such a high rent
takes them below the 60% equivalised median after housing costs and below the
relative low-income level by £51 per week.
6.22 Liability for income tax for couples also depends on the number of earners as
liability is based on joint earnings and there is Wife’s Earned Income Allowance
alongside the Married Personal Allowance.
9 Jersey Insight / Jersey Evening Post 7th Dec 2010.
Review of Benefit Levels
31
6.23 The potential overlap between Income Tax and Income Support therefore also
depends on how such allowances are taken up alongside individual and dual
earnings. The level of annual earnings at which Jackie and Bill begin to pay
Income Tax has remained constant through 2009 and 2010 and is £20,280 if
there is just one earner and £24,780 if both are earning.
6.24 Their gross earnings were £24,180 not including Income Support. As Income
Support is exempt from Income Tax, they fall below the level where they would
be required to pay tax. The couple are better off by £76.73 each week if they
work than they would be if unemployed and solely supported by Income Support.
6.25 Bill gets the offer of promotion at work. He is offered a post of supervisor at £7 an
hour. This means that he is responsible for training up new recruits. His annual
salary rises by £1,560, from £12,090 to £13,650. Their entitlement to Income
Support, however, is reduced by £23.25 to £1.73. This equates to his earning an
extra £6.25 per week.
6.26 His salary now stands at £13,650, which combined with his wife’s earnings of
£12,090 takes them to combined gross earnings of £25,740. This is £960 over
the income tax threshold for a working couple. It will result in a tax bill of £259 at
the end of a full year or £4.98 each week.
6.27 By taking a promotion and improving his earnings, he is better off by the grand
total of £1.27 per week.
6.28 Jackie and Bill’s case shows:
the effect of high rents in the private sector;
the need for both to work if they are to escape the need for Income
Support and
the potential overlap between Income Support and the income tax
threshold which reduce incentives to earn more.
Review of Benefit Levels
32
6.29 A Working Age Couple with Children: ‘The Maretts’
6.30 The last hypothetical case examines the Maretts, who have two children of
school age. Here we first examine the interaction between wages and Income
Support levels before turning to the costs of childcare.
6.31 The Maretts’ basic Income Support entitlement for a family with two children is
£360.78 per week. The accommodation component for a three-bedroomed
house is £251.72. That is, a total entitlement of £612.50, when neither parent is
in work. In this case, we shall assume that the Maretts are living in States
accommodation and pay no more than the ‘fair rent’ level. However, it must be
noted that a significant proportion of families with children are housed in the
private sector10 and may be subject to higher rent levels. As noted elsewhere,
this means that families will use other components to make up the shortfall. The
end result is that children are less well supported by the system.
6.32 If only one of the Maretts works on minimum wage for 37.5 hours a week, this
would result in £218.55 take home pay. Income Support provides £432.31, which
gives a total income before housing costs of £650.86 for this family of four,
making the family £38.36 better off than they would be without work.
6.33 If one partner works full time and the other part time, that raises their take home
pay by £104.90. As a result of this increase in earnings, however, the Income
Support that they receive is reduced by £86.49 per week. This leaves the family
better off by a further £18.41.
6.34 The reason why there is so little net benefit from the hours worked is that the
household is already in receipt of all the disregards and tapers it is entitled to.
Given that the additional part time work would incur some associated ‘expenses’
such as bus fares which could easily amount to £16 per week11, it effectively
10 Social Security Data 46% of households with children in private sector housing.11 Bus fares from the East to St. Helier approx £3.20 per day.
Review of Benefit Levels
33
means that the net additional income coming into the household could be £2.41
pence per week.
6.35 The Maretts have seen little significant improvement to their situation from the
extra part time work. Mrs Marrett decides to work full time. Their combined take
home pay is now £437.10 per week. Their Income Support entitlement drops to
£252.13, providing a total weekly income of £689.23. The combined total of 75
hours work each week makes them better off by £76.73 than they were with
neither of them working.
6.36 Are the Maretts poor? The After Housing Cost low income threshold for a couple
with two children is given in Table 5 as £438 per week. When both the Maretts
are working full time at the minimum wage, their combined take home pay is
£437.10 per week as we have seen above. Income Support at £252 effectively
covers their rent. Their total income puts them almost exactly at the low-income
threshold after housing costs (AHC).
6.37 Full time work at the minimum wage is required if this family are to maintain
anything close to a decent standard of living. However, any interruption to full
time work, for example, should the children fall ill, will cause financial difficulties.
Any time taken off work is unlikely to be paid and the Income Support system
does not automatically provide support for a parent taking unpaid leave. Income
Support is not designed to respond to instances of very short-term loss of
earnings. In addition to losing income, the family will of course be subject to
medical costs.
6.38 With both parents working full time some form of child care at either end of the
school day is likely to be necessary. For example, the cost of breakfast club for
one hour per day before school and two hours after school club, including
transport is £117.50 per child, per week. For the Maretts, this totals £235 per
week12. In this case, the Maretts would not receive support for childcare,
12 2010 charges at Centre Point website

Review of Benefit Levels
34
because the weekly cost of the childcare exceeds the gross wages of one parent. Full time work for both parents is, therefore, an unlikely option.
6.39 When considering Income Tax, the Maretts noted that the tax threshold for their
family is £30,780. They recognise that they are earning £24,180, which is below
the threshold. The money they receive from Income Support is exempt.
6.40 The Maretts’ case shows that:
without adequate funding for the provision of childcare the financial benefit of both parents working is negated;
This is the result of the combination of a low minimum wage with
Unrealistic disregards and tapers
Inadequate funding of childcare
A standard working week on the minimum wage is insufficient to
meet the criteria of the childcare component of Income Support.
Review of Benefit Levels
35
7. Jersey Income Distribution Survey 2009 / 10
7.1 “At the moment we are living as a family in constant debt, but if it
were not for buying most of our food from the out of date section at
all of the supermarkets I really don't know if we could afford to, or
want to live in Jersey where it costs so much to live here. If it were
not for the safety and beauty of the Island for our children, I think we
would be off at the drop of a hat.”13
“[It is] very difficult to manage on state pension always having to dip
into savings each year.”14
7.2 The Jersey Income Distribution Survey 2009/10 (JIDS 2009/10) contained a
number of findings on household incomes which are relevant to this review of
benefit levels. Of particular importance in discussing the alleviation of poverty are
the following terms:
i. Median Income
This differs from the mean (average income), being the income of the middle, or
50th percentile household. The median household income is particularly useful
where the distribution is skewed, as income distributions usually are. The median
(equivalised) for households in Jersey, before housing costs (BHC), was £667
per week, and £522 after housing costs (AHC).
ii. Relative Low Income
Relative Low Income is defined as an equivalised household income below 60%
of the median (See chapter 10.3). In 2009/10 this threshold was £400 per week
BHC and £313 AHC.
13 Response to survey 13014. Response to survey 262
Review of Benefit Levels
36
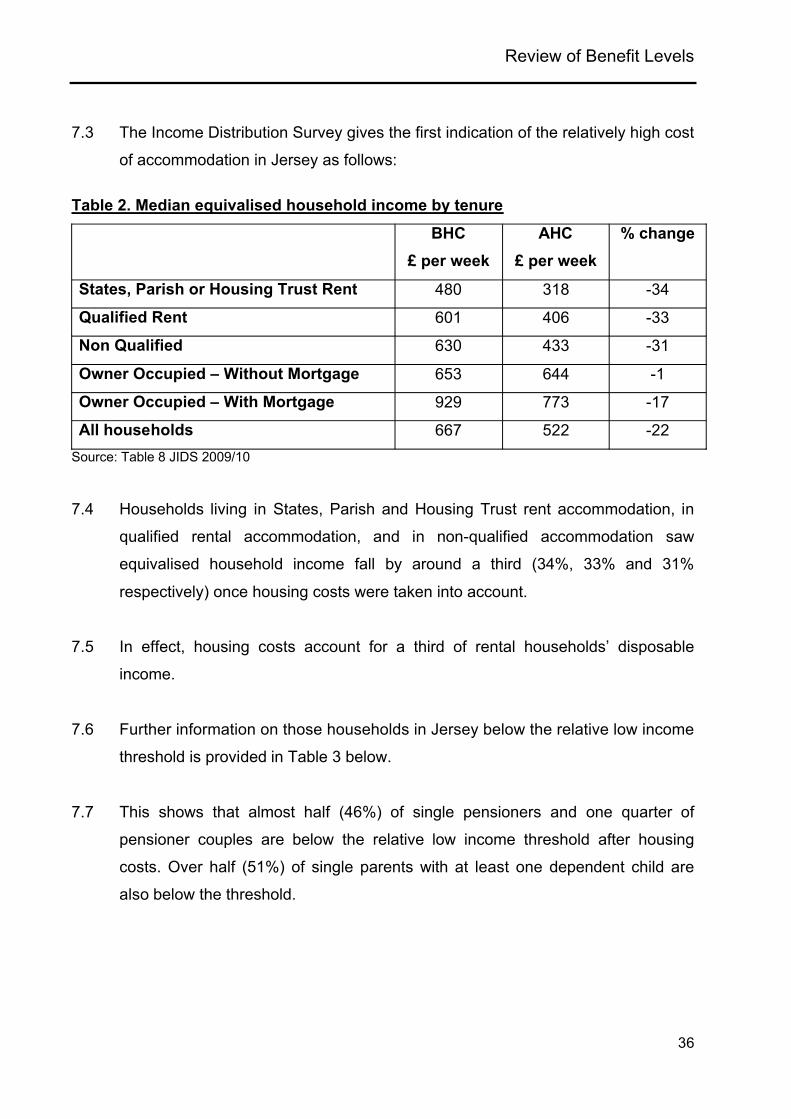
7.3 The Income Distribution Survey gives the first indication of the relatively high cost
of accommodation in Jersey as follows:
Table 2. Median equivalised household income by tenure
BHC£ per week
AHC£ per week
% change
States, Parish or Housing Trust Rent 480 318 -34
Qualified Rent 601 406 -33
Non Qualified 630 433 -31
Owner Occupied – Without Mortgage 653 644 -1
Owner Occupied – With Mortgage 929 773 -17
All households 667 522 -22Source: Table 8 JIDS 2009/10
7.4 Households living in States, Parish and Housing Trust rent accommodation, in
qualified rental accommodation, and in non-qualified accommodation saw
equivalised household income fall by around a third (34%, 33% and 31%
respectively) once housing costs were taken into account.
7.5 In effect, housing costs account for a third of rental households’ disposable
income.
7.6 Further information on those households in Jersey below the relative low income
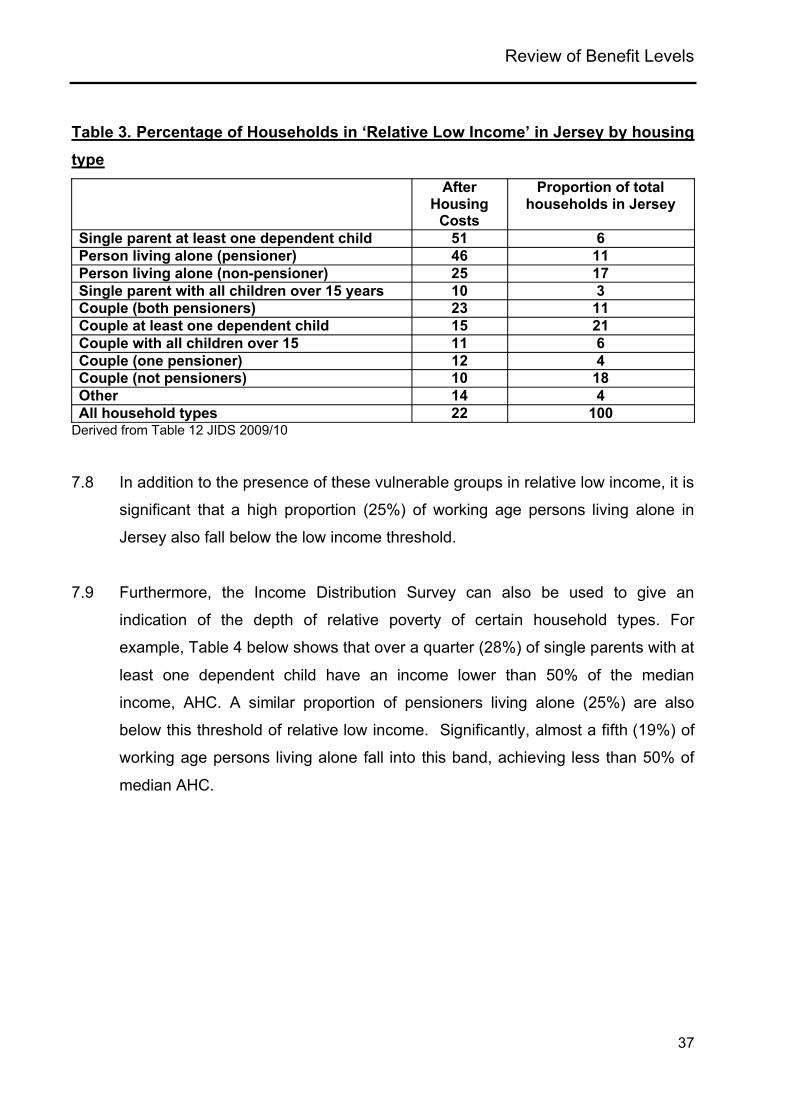
threshold is provided in Table 3 below.
7.7 This shows that almost half (46%) of single pensioners and one quarter of
pensioner couples are below the relative low income threshold after housing
costs. Over half (51%) of single parents with at least one dependent child are
also below the threshold.
Review of Benefit Levels
37
Table 3. Percentage of Households in ‘Relative Low Income’ in Jersey by housing type
Derived from Table 12 JIDS 2009/10
7.8 In addition to the presence of these vulnerable groups in relative low income, it is
significant that a high proportion (25%) of working age persons living alone in
Jersey also fall below the low income threshold.
7.9 Furthermore, the Income Distribution Survey can also be used to give an
indication of the depth of relative poverty of certain household types. For
example, Table 4 below shows that over a quarter (28%) of single parents with at
least one dependent child have an income lower than 50% of the median
income, AHC. A similar proportion of pensioners living alone (25%) are also
below this threshold of relative low income. Significantly, almost a fifth (19%) of
working age persons living alone fall into this band, achieving less than 50% of
median AHC.
After Housing
Costs
Proportion of total households in Jersey
Single parent at least one dependent child 51 6Person living alone (pensioner) 46 11Person living alone (non-pensioner) 25 17Single parent with all children over 15 years 10 3Couple (both pensioners) 23 11Couple at least one dependent child 15 21Couple with all children over 15 11 6Couple (one pensioner) 12 4Couple (not pensioners) 10 18Other 14 4All household types 22 100

Review of Benefit Levels
38
Table 4. Percentage of each household type falling below given relative low income threshold, after housing costs.
Below median
Below 60% median
Below 50% median
Single parent at least one dependent child 81 51 28
Person living alone (pensioner) 76 46 25
Person living alone (non pensioner) 60 25 19
Single parent with all children over 15yrs 57 10 8
Couple (both pensioners) 52 23 12
Couple at least one dependent child 43 15 7
Couple with all children over 15yrs 30 11 5
Couple (one pensioner) 35 12 10
Couple (not pensioners) 32 10 6
Other 49 14 9
All household types 50 22 13Derived from Table 17 JIDS 2009/10
7.10 Since JIDS 2009/10 is based on a questionnaire covering all members of the
household and includes all income, both earned and unearned, including
pensions, benefits and Income Support, these figures might suggest at this early
stage that:
Either Income Support is set at levels, which do not lift these
households above relative low-income thresholds; or
Income Support is not being claimed in all cases.
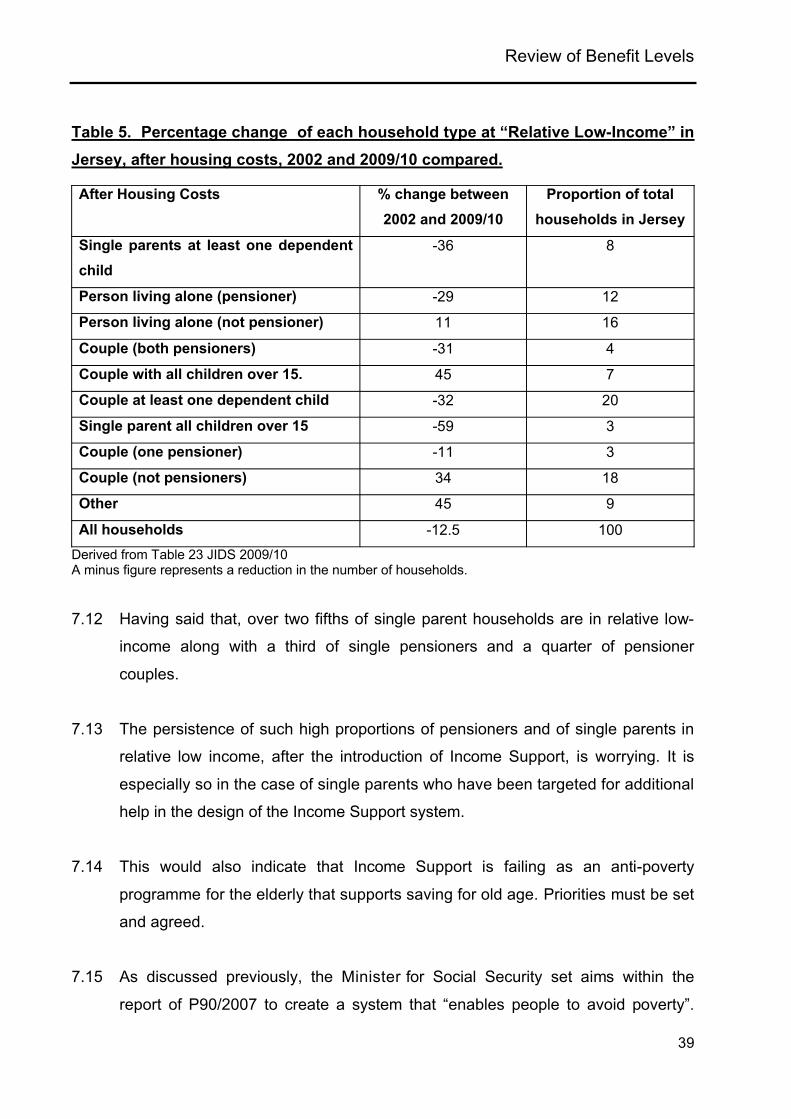
7.11 The JIDS 2009/10 report gives an indication of how successful Income Support
has been in alleviating poverty for a variety of households. Thus Table 5 shows
that there has been a 12.5% reduction overall in the numbers of households
below the relative low-income threshold. Significantly, there has been a reduction
in the numbers of single parent households and pensioner households in relative
poverty by around one third.
Review of Benefit Levels
39
Table 5. Percentage change of each household type at “Relative Low-Income” in Jersey, after housing costs, 2002 and 2009/10 compared.
After Housing Costs % change between 2002 and 2009/10
Proportion of total households in Jersey
Single parents at least one dependent child
-36 8
Person living alone (pensioner) -29 12
Person living alone (not pensioner) 11 16
Couple (both pensioners) -31 4
Couple with all children over 15. 45 7
Couple at least one dependent child -32 20
Single parent all children over 15 -59 3
Couple (one pensioner) -11 3
Couple (not pensioners) 34 18
Other 45 9
All households -12.5 100Derived from Table 23 JIDS 2009/10A minus figure represents a reduction in the number of households.
7.12 Having said that, over two fifths of single parent households are in relative low-
income along with a third of single pensioners and a quarter of pensioner
couples.
7.13 The persistence of such high proportions of pensioners and of single parents in
relative low income, after the introduction of Income Support, is worrying. It is
especially so in the case of single parents who have been targeted for additional
help in the design of the Income Support system.
7.14 This would also indicate that Income Support is failing as an anti-poverty
programme for the elderly that supports saving for old age. Priorities must be set
and agreed.
7.15 As discussed previously, the Minister for Social Security set aims within the
report of P90/2007 to create a system that “enables people to avoid poverty”.

Review of Benefit Levels
40
Clearly, if the specifically targeted areas of the scheme such as single parents
are not achieving those aspirations, as evidenced above, the current system is
failing in that regard,
7.16 That such failure sits alongside the lofty ambitions suggests that the scheme may
be designed to a budget, rather than to meet the stated aspirations. Difficult
decisions need to be made to confirm the position. Either more money needs to
be made available or the aspirations of the scheme need to be re-defined.
Key Finding 1
The introduction of Income Support has reduced, by one third, the numbers of
single parent and pensioner households in relative low income since 2002.
However, significant proportions of these households remain below the current
low-income threshold. These groups also show significant depth of poverty.
Recommendation 1
If Income Support is to achieve the policy aim of “enabling people to avoid
poverty”15, the Minister for Social Security must undertake a fundamental
overhaul of the Income Support system and its funding.
15 Quoted from report attached to “Draft Income Support (Jersey) Regulations 200-“ (P.90/2007)
Review of Benefit Levels
41
8. Jersey Annual Social Survey 2010 (JASS 2010)
8.1 “Got into difficulty after losing a well paid job over a year ago and
has been a struggle since working now but only earning half as
much.”16
“Pay freeze for public sector employees has hit me badly. Prices
rising but wages staying the same constitutes a pay cut. As a
teacher contributing a great deal to Jersey, I feel under valued
and am contemplating returning to the UK.”17
8.2 We now turn to examine the results of the JASS 2010 questionnaire on how well
or otherwise households are coping with their financial burden in 2010. Around
3,200 households were selected at random by the States Statistics Unit to
complete the survey in June and July 2010. The response from the public was
extremely high, with over 51% of sampled households completing and returning
the forms. This means that the results from the survey are both representative
and accurate. The results are contained in Chapter 12 “Money Matters” of JASS
2010.
8.3 The first thing to note from this survey was that JASS was able to obtain
responses from the full range of household incomes, as given below in figure 1.
8.4 It is noteworthy that two thirds (66%) of households with total annual income of
less than £15,000 were comprised of one adult.
16 Response to survey 2517 Response to survey 225

Review of Benefit Levels
42
Figure 1. Approximately, what is your household’s total annual income?
12%
17%
12%
10%
12%10%
6% 5%
4%
12%
0%
5%
10%
15%
< £15,0
00
£15,0
00 - £
24,99
9
£25,0
00 - £
34,99
9
£35,0
00 - £
44,99
9
£45,0
00 -
£54,9
99
£55,0
00 -
£64,9
99
£65,0
00 - £
74,99
9
£75,0
00 - £
84,99
9
£85,0
00 - £
94,99
9
£95,0
00 +
Source: Fig 12.1 JASS 2010
8.5 The responses to the question “How easy or how difficult do you find it to cope
financially as a household?” were analysed in Figure 2, as follows:
8.6 This highlights a marked difference between households with children and those
without. Twice the proportion (38%) of households with children report difficulties
with coping financially compared to households without children (18%). The
problems of childcare costs and the balance between work and child rearing
responsibilities and its impact on household incomes is discussed in some detail
later in this report.
8.7 Given the preponderance of pensioner households below the relative low-income
threshold, illustrated in JIDS, the response obtained from pensioner households
comes as somewhat of a surprise. Pensioner households, in fact, report the
lowest (9%) figure for difficulty in coping financially.

Review of Benefit Levels
43
Figure 2. As a household, how easy or difficult do you find it to cope financially?
7%
15%
18%
11%
13%
18%
27%
32%
24%
24%
38%
40%
41%
39%
39%
31%
14%
7%
20%
19%
7%
5%
5%
0% 20% 40% 60% 80% 100%
Household withchildren
Household withoutchildren
Household withpensioner
Household withoutpensioner
All households
Very easy Quite easy Neither easy or difficult Quite difficult Very difficult
Source: Fig 12.2 JASS 2010
8.8 This low rate may be explained in one of two ways;
either pensioners are better at coping, that is, they do manage their budgets
better and to some extent are prepared to “do without”; or
whether they are coping or not, they simply do not complain about it.
8.9 Respondents to JASS were asked whether they or anyone in their household
received Income Support18. The responses indicated that around half (49%) of
households with a total income of less than £20,000 per year did include
someone who receives Income Support, compared to about one in eight (13%) of
those households with total income between £20,000 and £33,333.
8.10 A difference was apparent between pensioner and non-pensioner households; a
fifth (20%) of households containing at least one pensioner reported receiving
Income Support compared to about one in ten (11%) of non-pensioner
households. However, there was no difference in the proportions of households
with and without children which received Income Support.
18 Respondents may have used a different definition of a “household” to that used by the Social Security Department.

Review of Benefit Levels
44
8.11 Comparing those households that contain someone who pays income tax/ITIS
with those households that contain someone receiving Income Support showed
that:
around one in twenty (6%) households that have someone paying income
tax/ITIS also contained someone receiving Income Support;
Six out of ten households (59%) with no member paying income tax/ITIS
contain someone who receives Income Support.
Table 6. As a household, how easy or difficult do you find it to cope financially? Percentages
As a household, how easy or difficult do you find it to cope financially?
Receive Income SupportPay
income tax/ITIS
AllYes No Yes No
Very or Quite Easy 17 40 39 23 37
Neither Easy nor Difficult 39 39 39 41 39
Very or Quite Difficult 44 21 22 36 24
Total 100 100 100 100 100
Source: Table 12.2 JASS 2010
8.12 More than two-fifths (44%) of households with someone receiving Income
Support reported finding it difficult at some level to cope financially, compared
with about a fifth (21%) of households not containing a person on Income
Support. The reverse trend applies to those households who pay income tax.
Only 22% of tax paying households find it difficult to cope compared with 36% of
those households without a taxpayer.
8.13 Interestingly there is a reported overlap (6%) where households contain
members who pay income tax and members in receipt of Income Support. The
potential for overlap between those who pay Income Tax and Income Support is
explored in greater detail in chapter 19 of this report.

Review of Benefit Levels
45
8.14 Analysing the responses by equivalised household income shows that greater
proportions of households in the lower quintiles find it difficult to cope financially,
with more than two-fifths (42%) of those in the lowest quintile reporting it difficult
to cope compared with around 6% in the upper quintile (see Figure 3).
8.15 Unsurprisingly, there is a clear inverse relationship between household income
and the difficulty of coping financially. Those with the lowest incomes (below
£20,000 per year) find it most difficult.
Figure 3. As a household, how easy or difficult do you find it to cope financially? By equivalised income quintile
4%
7%
8%
9%
30%
10%
21%
24%
37%
33%
45%
42%
40%
42%
31%
32%
22%
22%
11%
6%
10%
7%
6%
0% 20% 40% 60% 80% 100%
< £20,000
£20,000 - £33,333
£33,334 - £50,000
£50,001 - £70,000
> £70,000
Very easy Quite easy Neither easy or difficult Quite difficult Very difficult
Source: Figure 12.4 JASS 2010
8.16 Impact of the recession
8.17 Obviously, Income Support has faced additional pressures over the past two
years from the effects of the recession on the economy. Wages have stayed low
whilst costs have gone up. Income Support has had to deal with increased
pressure from the number of unemployed especially amongst the young.
8.18 Respondents were asked to compare their current financial situation with that
one year previously. Overall, twice as many households (39%) said their situation
Review of Benefit Levels
46
was a little or much worse, whilst almost one-fifth (18%) indicated that their
situation was a little or much improved.
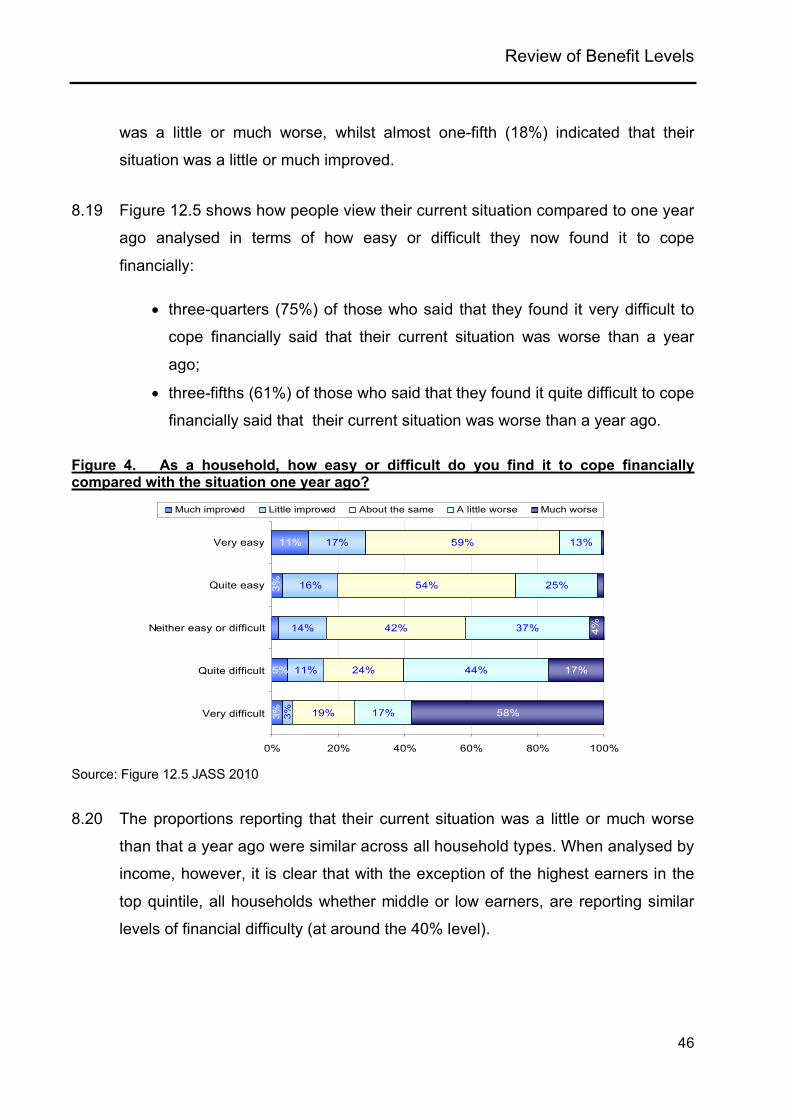
8.19 Figure 12.5 shows how people view their current situation compared to one year
ago analysed in terms of how easy or difficult they now found it to cope
financially:
three-quarters (75%) of those who said that they found it very difficult to
cope financially said that their current situation was worse than a year
ago;
three-fifths (61%) of those who said that they found it quite difficult to cope
financially said that their current situation was worse than a year ago.
Figure 4. As a household, how easy or difficult do you find it to cope financially compared with the situation one year ago?
11%
5%
17%
16%
14%
11%
59%
54%
42%
24%
19%
13%
25%
37%
44%
17%
17%
58%3%3%
3%
4%
0% 20% 40% 60% 80% 100%
Very easy
Quite easy
Neither easy or difficult
Quite difficult
Very difficult
Much improved Little improved About the same A little worse Much worse
Source: Figure 12.5 JASS 2010
8.20 The proportions reporting that their current situation was a little or much worse
than that a year ago were similar across all household types. When analysed by
income, however, it is clear that with the exception of the highest earners in the
top quintile, all households whether middle or low earners, are reporting similar
levels of financial difficulty (at around the 40% level).
Review of Benefit Levels
47
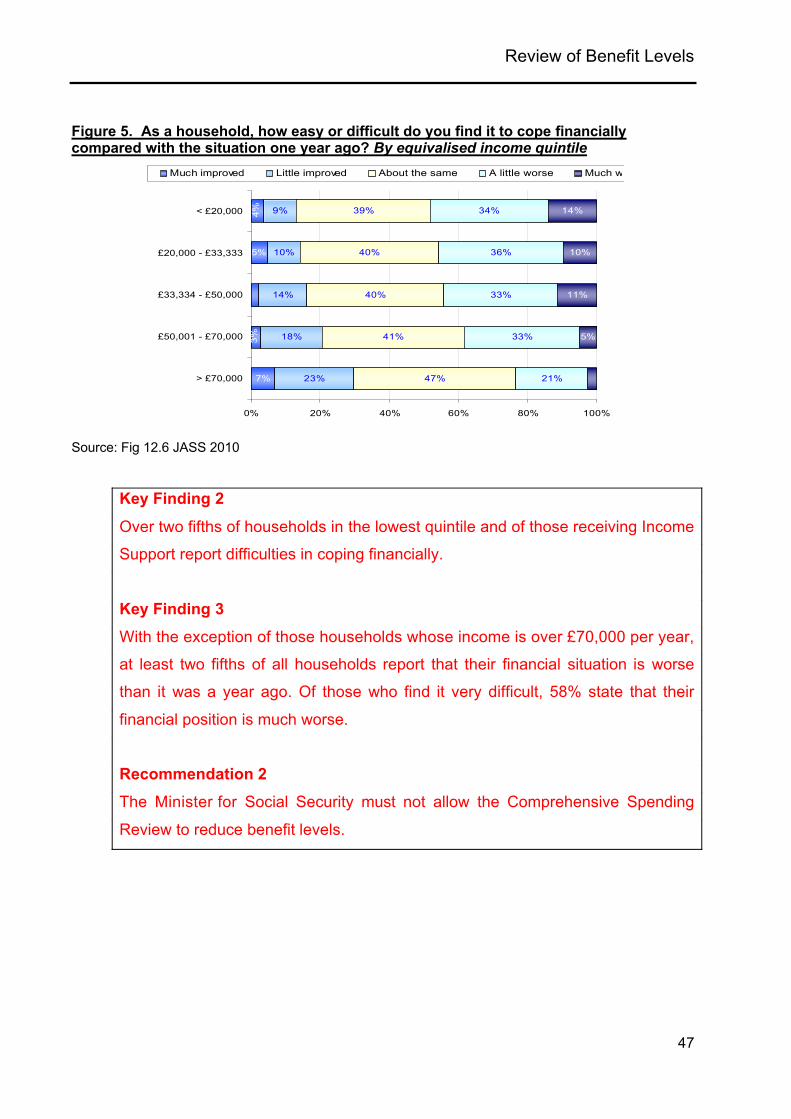
Figure 5. As a household, how easy or difficult do you find it to cope financially compared with the situation one year ago? By equivalised income quintile
Source: Fig 12.6 JASS 2010
Key Finding 2
Over two fifths of households in the lowest quintile and of those receiving Income
Support report difficulties in coping financially.
Key Finding 3
With the exception of those households whose income is over £70,000 per year,
at least two fifths of all households report that their financial situation is worse
than it was a year ago. Of those who find it very difficult, 58% state that their
financial position is much worse.
Recommendation 2
The Minister for Social Security must not allow the Comprehensive Spending
Review to reduce benefit levels.
5%
7%
9%
10%
14%
18%
23%
39%
40%
40%
41%
47%
34%
36%
33%
33%
21%
14%
10%
11%
5%
4%
3%
0% 20% 40% 60% 80% 100%
< £20,000
£20,000 - £33,333
£33,334 - £50,000
£50,001 - £70,000
> £70,000
Much improved Little improved About the same A little worse Much worse

Review of Benefit Levels
48

Review of Benefit Levels
49
9. The Levels of Income Support
9.1 “I only receive Income Support and find it very difficult to manage
with what I get. Especially when it's been cold, trying to heat my
house. I like the old system (payments) better. There are people I
know that also find if very difficult to manage with the little money
they get.”19
9.2 The States of Jersey Income Support scheme is an income-related benefit,
introduced in 2008, that provides financial support towards the costs of living,
housing, medical needs and childcare. Carers can also receive support. It is the
statutory framework to prevent financial deprivation in Jersey and provides
assistance to those who are out of work and to those who are in work but have
low incomes and need support.
9.3 In 2008, Income Support replaced 14 individual benefits that were administered
by numerous agencies including the twelve parishes and Social Security. The
benefit is now centrally financed and administered. The Income Support (Jersey)
Law 2007 and subordinate Regulations and Orders provide the framework for the
policy and delivery of the benefits.
9.4 It is a fundamental and crucial aspect of Income Support that it is not solely an
‘out of work’ safety net benefit. For example, in late January 2010, 44% of non-
pensioner Income Support claimants had earnings. For some groups, Income
Support is primarily an ‘in work benefit’: for instance, 83% of couples with
children and 54% of lone parents receiving Income Support have earnings.
9.5 Even when Income Support is received by non-working families they are likely to
have other sources of income. Ninety nine percent of pensioners on Income
Support claim it alongside a pension, 47% of working age families with a disabled
person claiming Income Support receive other benefits mainly from the Social
19 Response to survey 90

Review of Benefit Levels
50
Security Department, and 44% of non-pensioner Income Support claimants who
have no children or disability receive other benefits. 20
9.6 To understand the value of ‘Income Support benefit levels’ and to compare them
to relative or minimum income standards, it is crucial to look not only at the basic
Income Support income levels but at the overall income levels that families
receiving Income Support achieve. For many claimants, Income Support
supplements other sources of income, namely, pensions, earnings, interest from
savings, maintenance payments etc. The interaction of Income Support with
these other sources is explored in depth in later sections of this report.
20 The DSS Data Report 2010.

Review of Benefit Levels
51
10. The relationship between Income Support and relative income standards.
10.1 “Although we live as a family and budget very well, it is simply
because we have no other option. Utility bills I find are not so bad,
although I would comment that rent is far greater than it should be
compared with the UK.”21
10.2 The prime aim of this report is;
To assess whether benefit levels and structures are set appropriately in
relation to the changing income distribution and the relative poverty
standard.
10.3 The level of Income Support can be measured using the data in the Jersey
Income Distribution Survey (JIDS) 2009 report that provides a measure of
relative low income for 2009/10 based on a representative survey of private
households in Jersey.
10.4 The relative low-income measure, contained in JIDS 2009, is set at 60% of
median equivalised income in accordance with European Union (EU) approaches
to poverty risk. The United Kingdom (UK) has also adopted this as a relative
poverty22 standard as part of its targets to reduce child poverty. This report
adopts the 60% of median income level throughout.
10.5 The standard reference for JIDS 2009/10 income equivalisation (using a Modified
OECD scale) is that an adult couple living together has a weighting of 1.00 in the
equivalence scales23. This means that the Income Support rates for a couple can
be compared to the relative low-income lines reported in the JIDS 2009/10
directly.
21 Response to survey 25222 Relative Poverty - ‘Relative Low Income’ used locally23 see JIDS Report, Appendix definitions page 34
Review of Benefit Levels
52
10.6 One of the dilemmas faced in setting relative low-income levels is how far to use
the ‘Before Housing Cost (BHC)’ data as opposed to the “After Housing Cost
(AHC)’ data when seeking an income definition. In Table 7, the maximum level
of rent payable by Income Support (calculated using the Social Security
Department Income Support Calculator) is added to the AHC level and compared
to BHC relative low-income levels. (This means that the BHC figure is inclusive of
rent and is therefore the higher figure. AHC figures show the Income Support
entitlement with rent removed and as such is the lower figure).
10.7 The BHC is complex because owner-occupiers, people renting and those lodging
are all treated differently with regard to the accommodation component of Income
Support. It is further complicated by differences between private and public
sector rent levels and by family size. However, AHC is far more representative of
the disposable income available to individuals or families and therefore more
indicative of relative low income. In this report, after this initial discussion, only
AHC figures will be used.
10.8 Income Support is made up of basic weekly components based on the family
composition. Additional components exist for disability, childcare costs, medical
care and other ‘non-standard’ elements of needs and the housing cost
component.
10.9 Given the number of variable components it is not straightforward to compare
Income Support levels to the relative low income threshold.
10.10 In Table 7 and throughout this report additional components for disability,
childcare, medical and other needs24 are ignored in order to compare the ‘basic
Income Support components’ to AHC defined relative low income levels for
householders. In Tables 7 to 11, the low-income threshold is converted into cash
values which can therefore be directly compared with Income Support levels.
24 Medical (impairment) components such as personal care level (1 to 3), mobility elements, clinical costs (levels 1
and 2) and Child Daycare components.
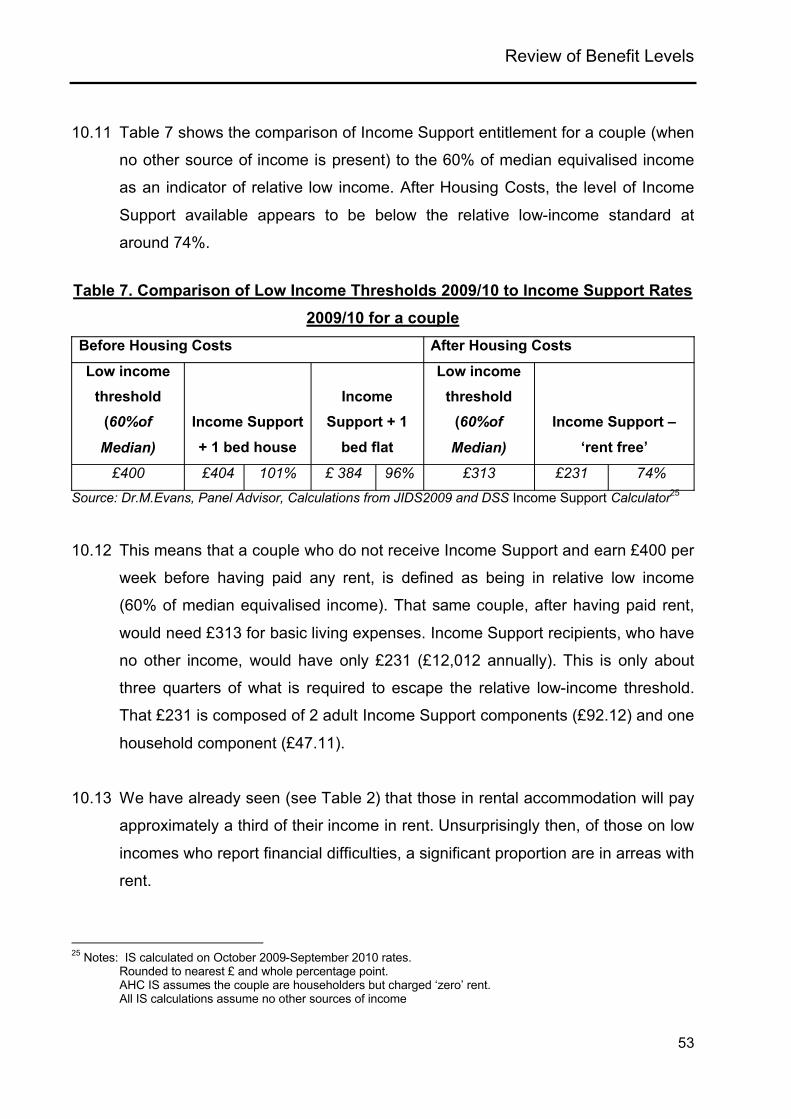
Review of Benefit Levels
53
10.11 Table 7 shows the comparison of Income Support entitlement for a couple (when
no other source of income is present) to the 60% of median equivalised income
as an indicator of relative low income. After Housing Costs, the level of Income
Support available appears to be below the relative low-income standard at
around 74%.
Table 7. Comparison of Low Income Thresholds 2009/10 to Income Support Rates 2009/10 for a couple
Before Housing Costs After Housing Costs
Low income threshold
(60%of
Median)
Income Support
+ 1 bed house
Income Support + 1
bed flat
Low income threshold
(60%of
Median)
Income Support –
‘rent free’
£400 £404 101% £ 384 96% £313 £231 74%Source: Dr.M.Evans, Panel Advisor, Calculations from JIDS2009 and DSS Income Support Calculator25
10.12 This means that a couple who do not receive Income Support and earn £400 per
week before having paid any rent, is defined as being in relative low income
(60% of median equivalised income). That same couple, after having paid rent,
would need £313 for basic living expenses. Income Support recipients, who have
no other income, would have only £231 (£12,012 annually). This is only about
three quarters of what is required to escape the relative low-income threshold.
That £231 is composed of 2 adult Income Support components (£92.12) and one
household component (£47.11).
10.13 We have already seen (see Table 2) that those in rental accommodation will pay
approximately a third of their income in rent. Unsurprisingly then, of those on low
incomes who report financial difficulties, a significant proportion are in arreas with
rent.
25 Notes: IS calculated on October 2009-September 2010 rates.
Rounded to nearest £ and whole percentage point.AHC IS assumes the couple are householders but charged ‘zero’ rent.All IS calculations assume no other sources of income
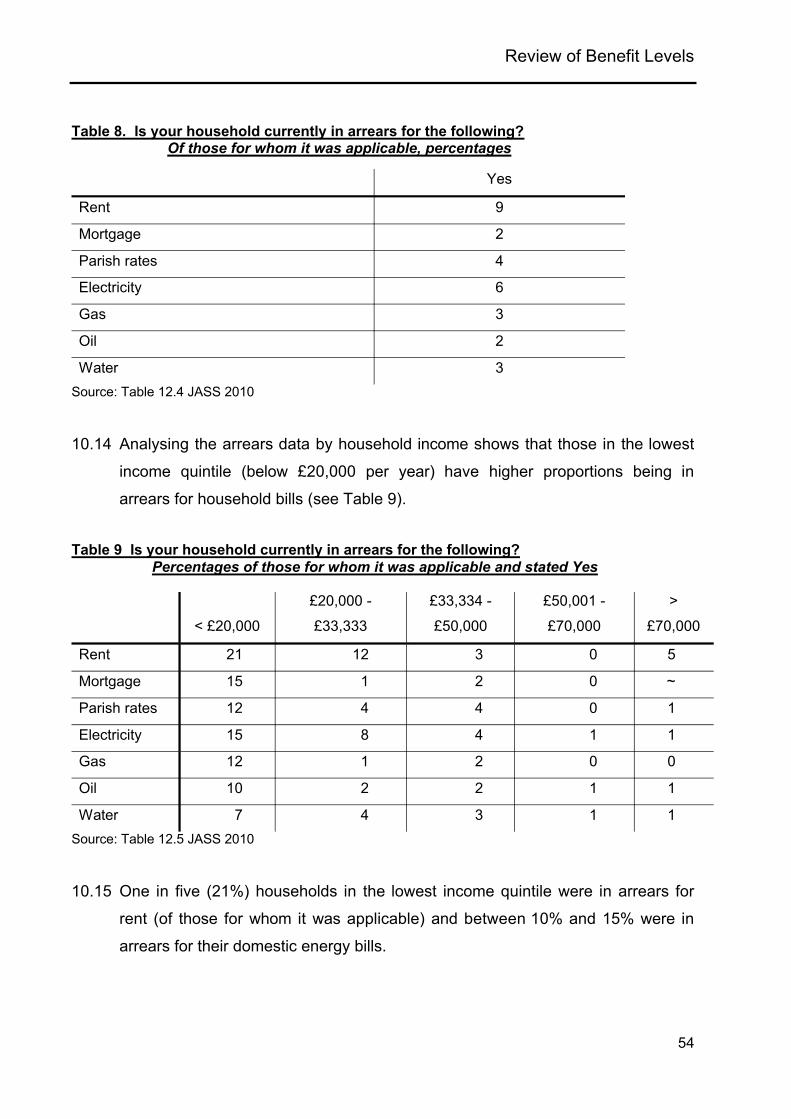
Review of Benefit Levels
54
Table 8. Is your household currently in arrears for the following?Of those for whom it was applicable, percentages
Yes
Rent 9
Mortgage 2
Parish rates 4
Electricity 6
Gas 3
Oil 2
Water 3Source: Table 12.4 JASS 2010
10.14 Analysing the arrears data by household income shows that those in the lowest
income quintile (below £20,000 per year) have higher proportions being in
arrears for household bills (see Table 9).
Table 9 Is your household currently in arrears for the following? Percentages of those for whom it was applicable and stated Yes
< £20,000
£20,000 -
£33,333
£33,334 -
£50,000
£50,001 -
£70,000
>
£70,000
Rent 21 12 3 0 5
Mortgage 15 1 2 0 ~
Parish rates 12 4 4 0 1
Electricity 15 8 4 1 1
Gas 12 1 2 0 0
Oil 10 2 2 1 1
Water 7 4 3 1 1Source: Table 12.5 JASS 2010
10.15 One in five (21%) households in the lowest income quintile were in arrears for
rent (of those for whom it was applicable) and between 10% and 15% were in
arrears for their domestic energy bills.

Review of Benefit Levels
55
It is also worth noting here that a greater proportion of households with a person
in receipt of Income Support (14%) were in arrears for rent compared with 8% of
households in which no one was claiming Income Support.
10.16 Turning to more general poverty indicators, we see that those in States or Parish
housing report markedly higher levels of difficulty.
Figure 6. As a household, how easy or difficult do you find it to cope financially?By tenure
17%
5%
30%
17%
12%
21%
36%
46%
36%
45%
15%
25%
36%
12%
11%
9%
4%
12%
3%
7%
0% 20% 40% 60% 80% 100%
Owner occupied
Qualified rent
States / Parish housing
Non qualified rent
Very easy Quite easy Neither easy or difficult Quite difficult Very difficult
Source: JASS 2010 fig 21.3
10.17 Analysing these results by tenure type (Figure 6) indicates that:
almost half (47%) of households living in States/Parish housing said it was difficult to cope financially;
around a third (32%) of households living in private rental accommodation reported it was difficult to cope financially;
around a fifth (21%) of households living in non-qualified rental said it was difficult to cope financially;

Review of Benefit Levels
56
10.18 These figures reflect the reality that the most needy sectors of our society tend to
be housed in States rental accommodation. This is shown in JIDS 2009/1026
where 45% of those in States housing are below the relative low-income
threshold after housing costs.
Key Finding 4
High rental levels are a major contributor to financial hardship in Jersey. 21% of
households in the lowest quintile report arrears for rent whilst between 10% and
15% were in arrears for their domestic energy bills.
26 Jersey Income Distribution Survey Report 2009/10 table 25.

Review of Benefit Levels
57
11. Family Composition, Income Support and risk of Low Income.
11.1 “Having been made redundant in October 2009 and having to rely
on Income Support to get by, I find the levels and amount paid
very low to have to try and live and survive in my own Island. After
taking my rent out of my benefit I find trying to live on £80 a week
to fund food and bills impossible…”27
11.2 We now move on in Chapters 12, 13 and 14 to other family types and consider
single people and families with children. JIDS 2009/10 provides breakdowns by
household types but the typologies provided are not precise definitions of
‘families’ but groupings (for instance, recording the presence of children rather
than the actual number of children in that family).
11.3 Similarly, the Social Security Department also provided a range of data on
aggregate family types rather than specific definitions of families.
11.4 This has required us to use illustrative profiles in the following analysis. Income
Support levels will be compared to a profile derived from re-weighted JIDS
2009/10 profiles so that they match. The following family types will be used:
a) Single person;
b) Lone parent, 1 child;
c) Lone parent, 2 children;
d) Couple, 1 child; and
e) Couple, 2 children.
11.5 Contextual information on rents from the SSD Data Report 2010 will be referred
to with a clear caveat that it is not matched exactly to the profile.
27 Response to survey 244
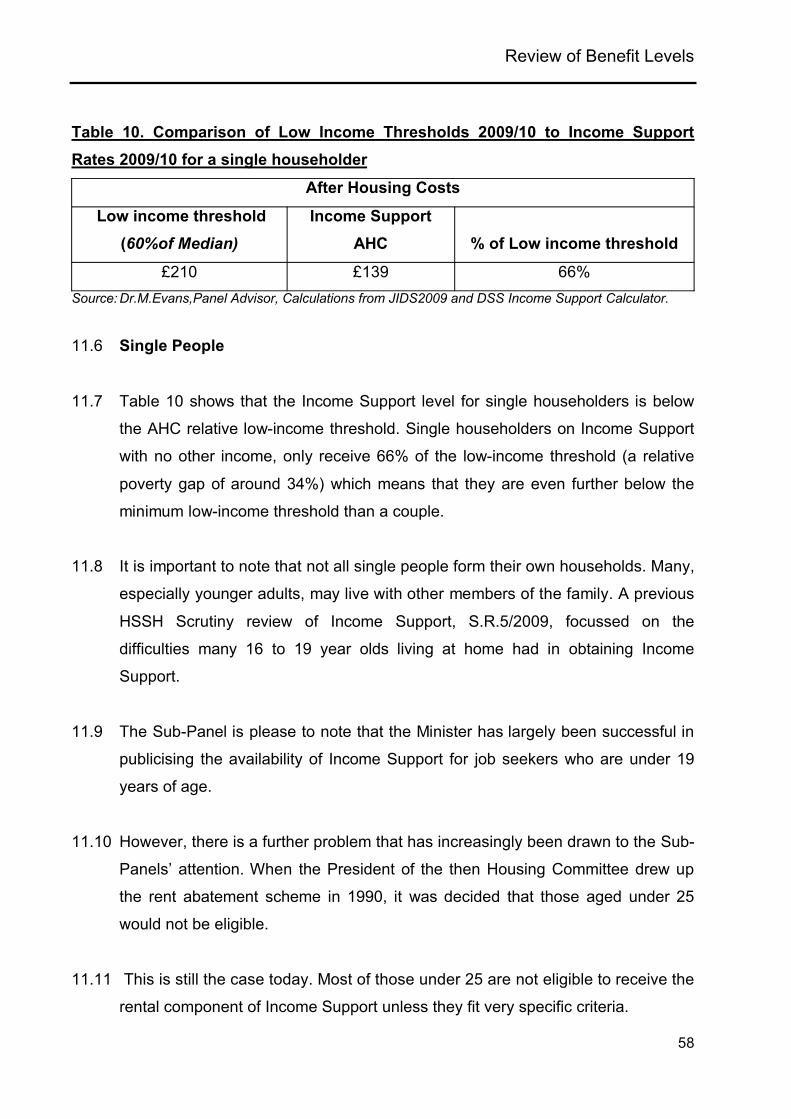
Review of Benefit Levels
58
Table 10. Comparison of Low Income Thresholds 2009/10 to Income SupportRates 2009/10 for a single householder
After Housing Costs
Low income threshold(60%of Median)
Income Support AHC % of Low income threshold
£210 £139 66%Source: Dr.M.Evans,Panel Advisor, Calculations from JIDS2009 and DSS Income Support Calculator.
11.6 Single People
11.7 Table 10 shows that the Income Support level for single householders is below
the AHC relative low-income threshold. Single householders on Income Support
with no other income, only receive 66% of the low-income threshold (a relative
poverty gap of around 34%) which means that they are even further below the
minimum low-income threshold than a couple.
11.8 It is important to note that not all single people form their own households. Many,
especially younger adults, may live with other members of the family. A previous
HSSH Scrutiny review of Income Support, S.R.5/2009, focussed on the
difficulties many 16 to 19 year olds living at home had in obtaining Income
Support.
11.9 The Sub-Panel is please to note that the Minister has largely been successful in
publicising the availability of Income Support for job seekers who are under 19
years of age.
11.10 However, there is a further problem that has increasingly been drawn to the Sub-
Panels’ attention. When the President of the then Housing Committee drew up
the rent abatement scheme in 1990, it was decided that those aged under 25
would not be eligible.
11.11 This is still the case today. Most of those under 25 are not eligible to receive the
rental component of Income Support unless they fit very specific criteria.
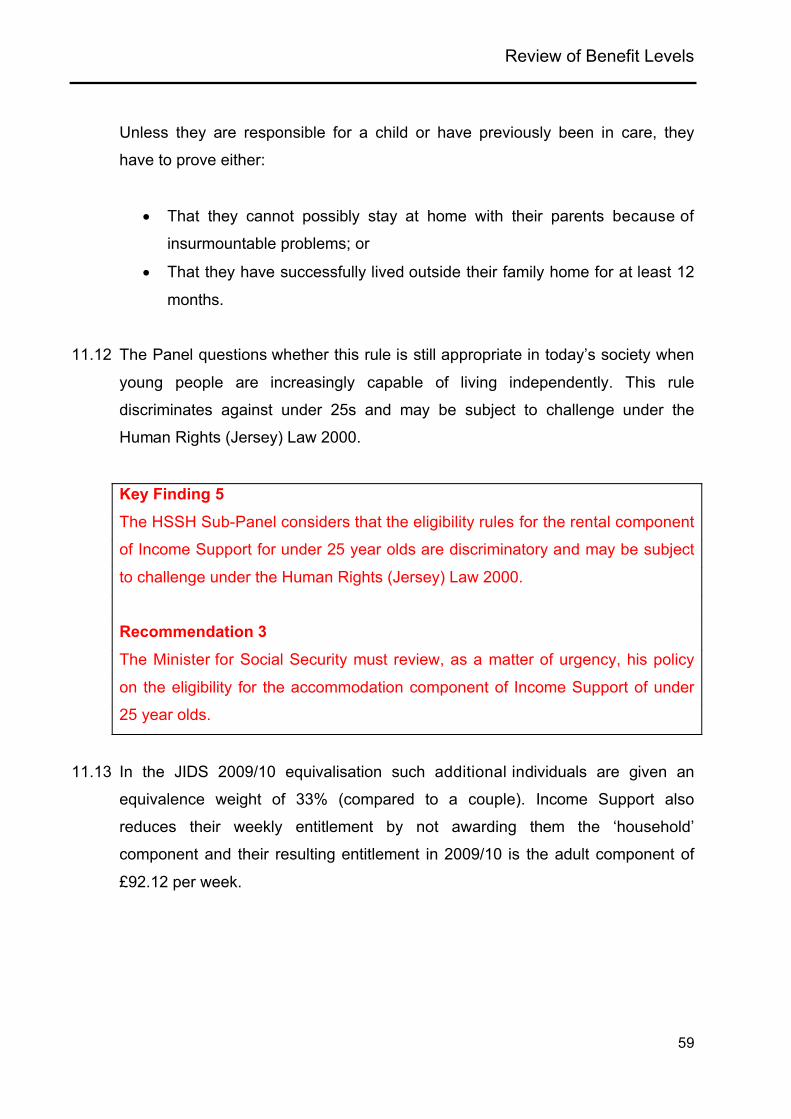
Review of Benefit Levels
59
Unless they are responsible for a child or have previously been in care, they
have to prove either:
That they cannot possibly stay at home with their parents because of
insurmountable problems; or
That they have successfully lived outside their family home for at least 12
months.
11.12 The Panel questions whether this rule is still appropriate in today’s society when
young people are increasingly capable of living independently. This rule
discriminates against under 25s and may be subject to challenge under the
Human Rights (Jersey) Law 2000.
Key Finding 5
The HSSH Sub-Panel considers that the eligibility rules for the rental component
of Income Support for under 25 year olds are discriminatory and may be subject
to challenge under the Human Rights (Jersey) Law 2000.
Recommendation 3
The Minister for Social Security must review, as a matter of urgency, his policy
on the eligibility for the accommodation component of Income Support of under
25 year olds.
11.13 In the JIDS 2009/10 equivalisation such additional individuals are given an
equivalence weight of 33% (compared to a couple). Income Support also
reduces their weekly entitlement by not awarding them the ‘household’
component and their resulting entitlement in 2009/10 is the adult component of
£92.12 per week.

Review of Benefit Levels
60
Table 11. Comparison of AHC Low Income Thresholds 2009/10 to Income SupportRates 2009/10 for a single non-householder28
After Housing Costs
Low income threshold(60%of Median)
Income Support non Householder
% of Low income threshold
£103 £92 89%Source: Dr. M. Evans, Panel Advisor, Authors Calculations from JIDS2009 and DSS Income Support
Calculator.
11.14 Table 11 shows that Income Support for non-householder co-resident adults is
11% below the low income threshold.
11.15 Families with Children
11.16 We shall now examine what relative living standard Income Support provides for
families with children. Before looking at profiles by household type, it is worth
outlining how underlying equivalence assumptions operate in the measurement
of living standards in JIDS 2009/10 and comparing them to Income Support.
11.17 Table 13 shows how the two sets of assumptions treat the needs of additional
members of the household and underlying economies of scale that arise from co-
residence.
11.18 Income Support gives less weighting to the needs of a single person compared
to a couple. It gives far higher relative weighting to single parents. A single parent
with one child is weighted as more than a couple without children by Income
Support. However, the Organisation for Economic Co-operation and
Development (OECD) equivalence scale is lower.
28 Notes: IS calculated on October 2009-September 2010 rates.
Rounded to nearest £ and whole percentage point.All IS calculations assume no other sources of income

Review of Benefit Levels
61
The additional incremental weighting for each child is also higher in Income
Support (0.27) than in the OECD equivalence scale (0.2). Clarifying these
differences in assumptions will help us interpret the comparisons that follow.
Table 12. Equivalence Assumptions of Modified OECD Scale and Jersey Income Support
Household composition
JIDS 2009/10
Modified OECD
Income Support
(householders without rent)
Couple 1.00 1.00
Single 0.67 0.60
Single Parent with one child 0.87 1.04
Single Parent with two children 1.07 1.31
Couple Parent with one child 1.20 1.27
Couple Parent with two children 1.40 1.54
Source: Dr. M. Evans, Panel Advisor, Authors Calculations.29
11.19 The higher weightings for single parents contained in the Income Support section
of Table 12 reflect the aim of the then Social Security Minister to target support
for this vulnerable group of households at the outset of Income Support. This is
confirmed by the figures contained in Table 13 where support for single parent
households provides a significantly greater proportion of the AHC relative low-
income threshold than that for couples with children. Having said that, single
parents still remain below the low-income threshold.
29 Equivalisation in JIDS2009 uses the basis of a couple's needs (without children) as 1 and then adjusts (equivalises) incomes to be consistent to this. Table 4 does this for IS rates on the same basis.So that the couple rate with householder component (but ignoring rent and medical/disability components) is £231.35 =1 and this means, by comparison that a lone parent with one child who receives £241.71 for the same component has an 'equivalised' needs levels (Compared to the couple with no children) of 1.04 and a lone parent with two children (£303.80 IS) would be 1.31 similarly.The basic calculation is to divide the IS level for the family type by the underlying IS level for a couple with no children. This gives a clear indication of the weighting of IS needs and how it compares to the povery/low income profiles in JIDS.
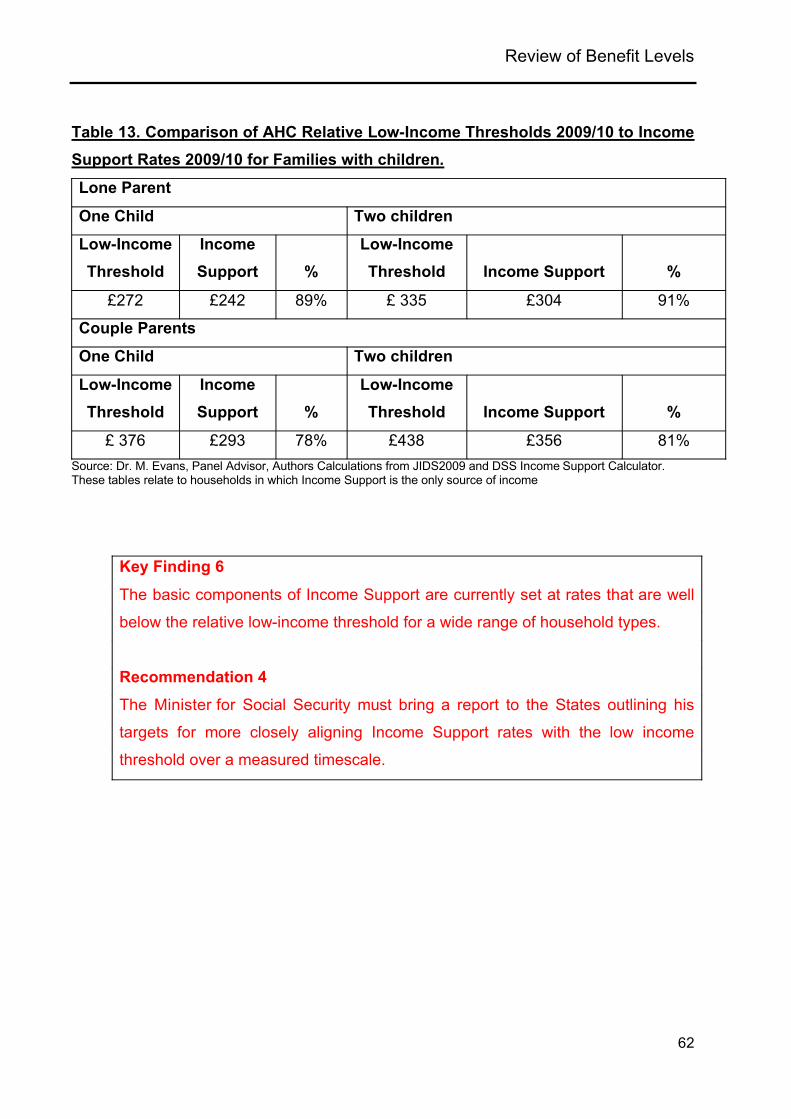
Review of Benefit Levels
62
Table 13. Comparison of AHC Relative Low-Income Thresholds 2009/10 to Income Support Rates 2009/10 for Families with children.
Lone Parent
One Child Two children
Low-Income Threshold
Income Support %
Low-Income Threshold Income Support %
£272 £242 89% £ 335 £304 91%
Couple Parents
One Child Two children
Low-Income Threshold
Income Support %
Low-Income Threshold Income Support %
£ 376 £293 78% £438 £356 81%Source: Dr. M. Evans, Panel Advisor, Authors Calculations from JIDS2009 and DSS Income Support Calculator.These tables relate to households in which Income Support is the only source of income
Key Finding 6
The basic components of Income Support are currently set at rates that are well
below the relative low-income threshold for a wide range of household types.
Recommendation 4
The Minister for Social Security must bring a report to the States outlining his
targets for more closely aligning Income Support rates with the low income
threshold over a measured timescale.
Review of Benefit Levels
63
12. The relationship between Income Support and minimum income standards.
12.1 “We try and manage our finances to ensure we always have a
roof over our head, food on the table and clothes on our back. As
parents we always go without to ensure that our son doesn't. We
basically don't have a social life and do without new clothes…”30
12.2 In the late 1990’s and early 2000’s, the Social Security Department
commissioned research by the Centre for Research in Social Policy (CRSP) at
Loughborough University. That work produced a range of costed minimum living
standards for Jersey, the last of which was assessed in 2002.
12.3 The Research method was based on a “basket of goods” approach to set
minimum income standards and as such could be said to represent an absolute
rather than a relative benchmark for minimum living standards. Given the
complex nature of the accommodation sector in Jersey, the standards did not
attempt to include housing costs.
12.4 This minimum income standards approach provides an alternative, based on an
assessment of needs, to the relative low-income threshold. Currently, the 2002
standards are the only ones available for use. Up-rating the 2002 minimum
income standards using the inflation indices produced by the Statistics Unit for
the purposes of this report is shown in Table 15.
12.5 The 2002 minimum income standards, set according to a basket of goods and
services agreed between 1998 and 2000, have been adjusted upwards to reflect
price inflation to show the cost of that set of goods and services at today’s prices.
30 Response to survey 150
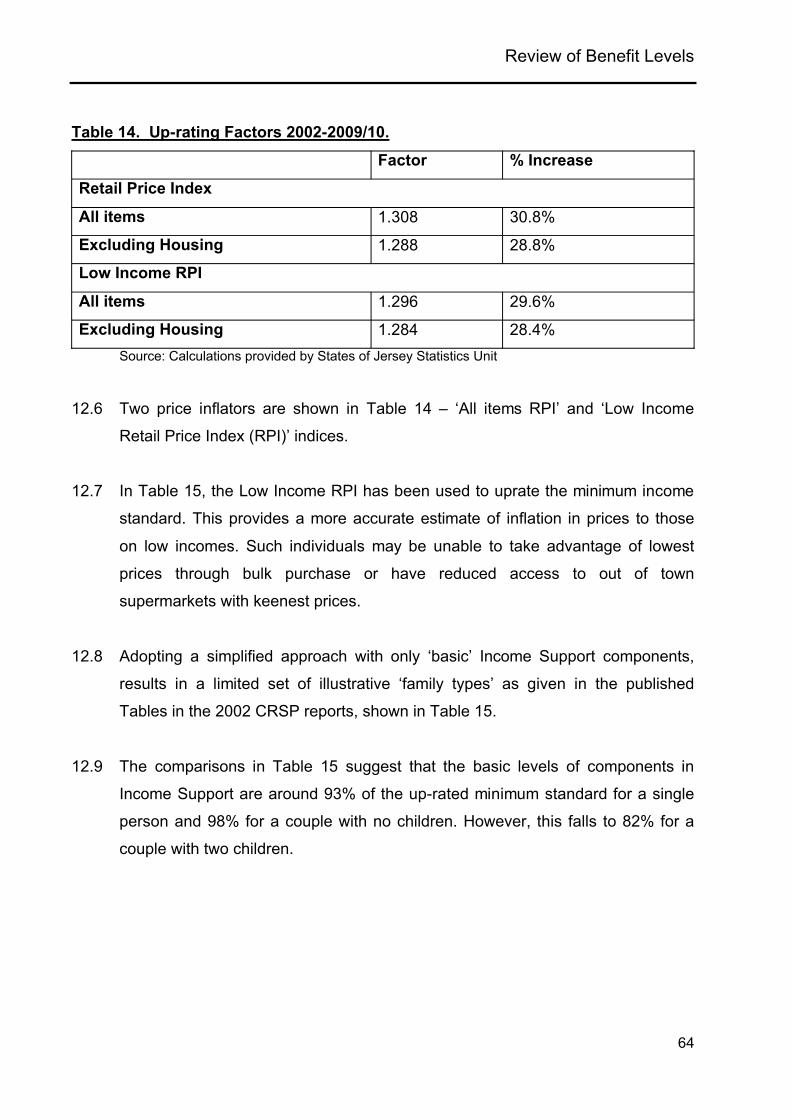
Review of Benefit Levels
64
Table 14. Up-rating Factors 2002-2009/10.
Factor % Increase
Retail Price Index
All items 1.308 30.8%
Excluding Housing 1.288 28.8%
Low Income RPI
All items 1.296 29.6%
Excluding Housing 1.284 28.4%Source: Calculations provided by States of Jersey Statistics Unit
12.6 Two price inflators are shown in Table 14 – ‘All items RPI’ and ‘Low Income
Retail Price Index (RPI)’ indices.
12.7 In Table 15, the Low Income RPI has been used to uprate the minimum income
standard. This provides a more accurate estimate of inflation in prices to those
on low incomes. Such individuals may be unable to take advantage of lowest
prices through bulk purchase or have reduced access to out of town
supermarkets with keenest prices.
12.8 Adopting a simplified approach with only ‘basic’ Income Support components,
results in a limited set of illustrative ‘family types’ as given in the published
Tables in the 2002 CRSP reports, shown in Table 15.
12.9 The comparisons in Table 15 suggest that the basic levels of components in
Income Support are around 93% of the up-rated minimum standard for a single
person and 98% for a couple with no children. However, this falls to 82% for a
couple with two children.
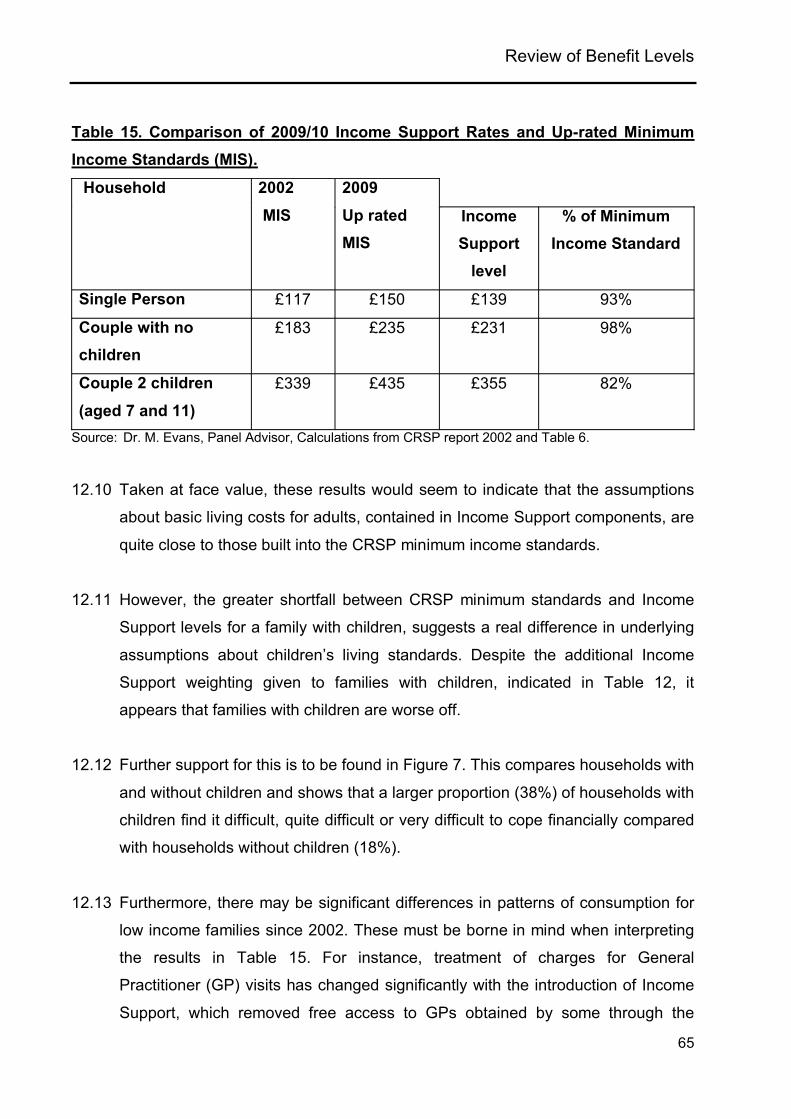
Review of Benefit Levels
65
Table 15. Comparison of 2009/10 Income Support Rates and Up-rated Minimum Income Standards (MIS).
Household 2002
MIS
2009
Up ratedMIS
Income Support
level
% of Minimum Income Standard
Single Person £117 £150 £139 93%
Couple with no children
£183 £235 £231 98%
Couple 2 children
(aged 7 and 11)£339 £435 £355 82%
Source: Dr. M. Evans, Panel Advisor, Calculations from CRSP report 2002 and Table 6.
12.10 Taken at face value, these results would seem to indicate that the assumptions
about basic living costs for adults, contained in Income Support components, are
quite close to those built into the CRSP minimum income standards.
12.11 However, the greater shortfall between CRSP minimum standards and Income
Support levels for a family with children, suggests a real difference in underlying
assumptions about children’s living standards. Despite the additional Income
Support weighting given to families with children, indicated in Table 12, it
appears that families with children are worse off.
12.12 Further support for this is to be found in Figure 7. This compares households with
and without children and shows that a larger proportion (38%) of households with
children find it difficult, quite difficult or very difficult to cope financially compared
with households without children (18%).
12.13 Furthermore, there may be significant differences in patterns of consumption for
low income families since 2002. These must be borne in mind when interpreting
the results in Table 15. For instance, treatment of charges for General
Practitioner (GP) visits has changed significantly with the introduction of Income
Support, which removed free access to GPs obtained by some through the

Review of Benefit Levels
66
Health Insurance Exemption (HIE) scheme. GP charges are examined in
Chapter 21 of this report.
12.14 However, this early analysis suggests the need for further research of the
position of families with children in relation to low income.
Figure 7. As a household, how easy or difficult do you find it to cope financially?
Source: Fig 12.2 JASS 2010
12.15 Further on in JASS 2010, in the section headed ‘Spending - difficulties paying for
household items’ we find a similar difference between households with and
without children.
12.16 As Table 16 shows, around one in ten (11%) households said that they had
difficulties keeping their house adequately warm because of a shortage of
money. About a sixth (17%) said they found it difficult to replace furniture or
electrical appliances, whilst almost a quarter (23%) said that they had difficulties
paying for a holiday away from home once a year.
7%
15%
18%
11%
13%
18%
27%
32%
24%
24%
38%
40%
41%
39%
39%
31%
14%
7%
20%
19%
7%
5%
5%
0% 20% 40% 60% 80% 100%
Household withchildren
Household withoutchildren
Household withpensioner
Household withoutpensioner
All households
Very easy Quite easy Neither easy or difficult Quite difficult Very difficult
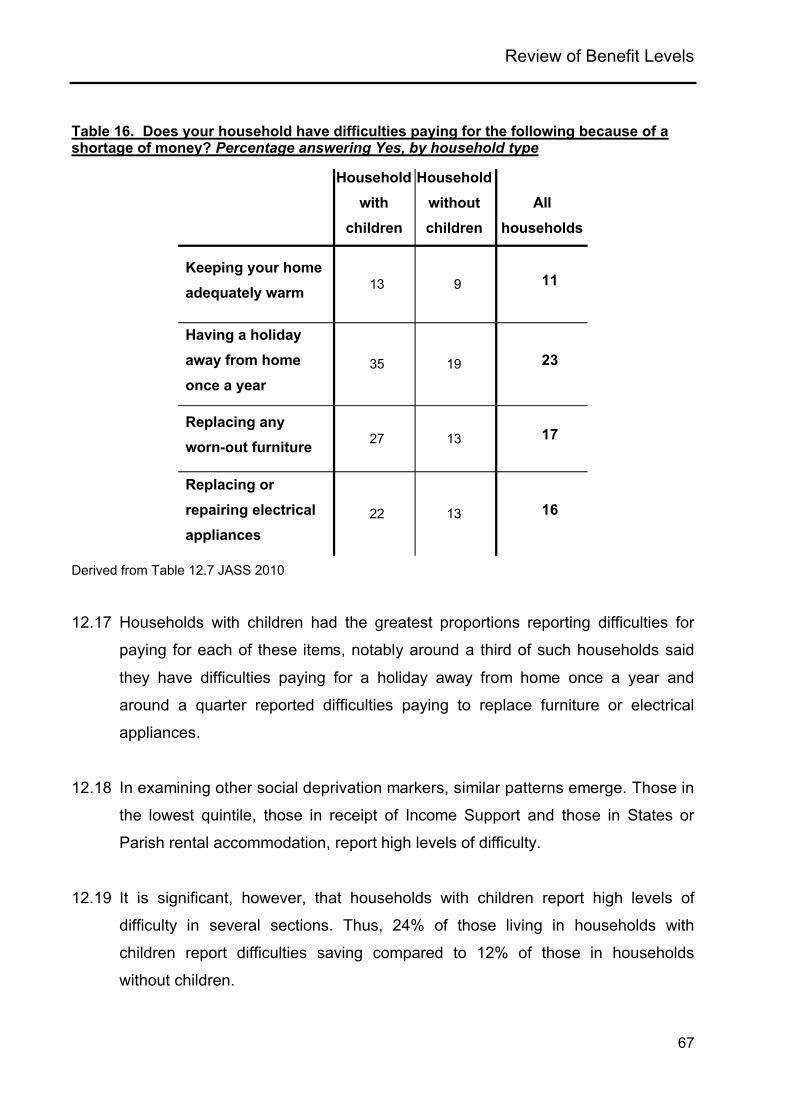
Review of Benefit Levels
67
Table 16. Does your household have difficulties paying for the following because of a shortage of money? Percentage answering Yes, by household type
Household with
children
Household without children
All households
Keeping your home adequately warm 13 9 11
Having a holiday away from home once a year
35 19 23
Replacing any worn-out furniture 27 13 17
Replacing or repairing electrical appliances
22 13 16
Derived from Table 12.7 JASS 2010
12.17 Households with children had the greatest proportions reporting difficulties for
paying for each of these items, notably around a third of such households said
they have difficulties paying for a holiday away from home once a year and
around a quarter reported difficulties paying to replace furniture or electrical
appliances.
12.18 In examining other social deprivation markers, similar patterns emerge. Those in
the lowest quintile, those in receipt of Income Support and those in States or
Parish rental accommodation, report high levels of difficulty.
12.19 It is significant, however, that households with children report high levels of
difficulty in several sections. Thus, 24% of those living in households with
children report difficulties saving compared to 12% of those in households
without children.
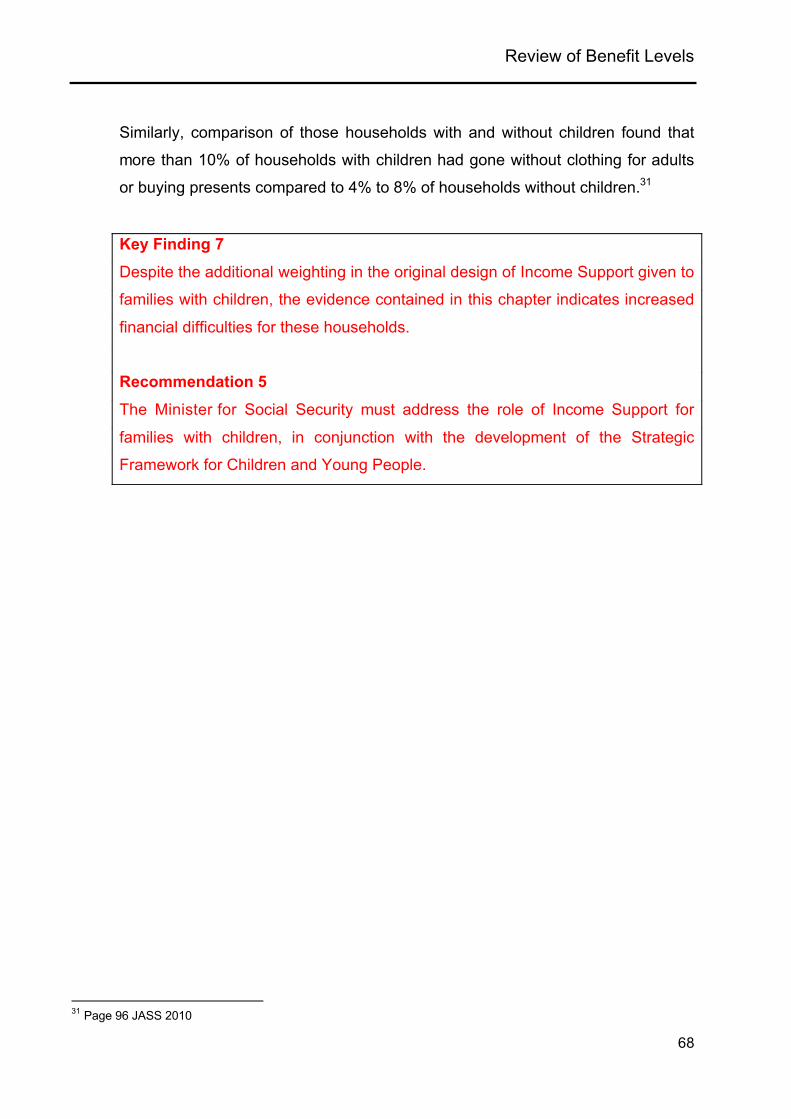
Review of Benefit Levels
68
Similarly, comparison of those households with and without children found that
more than 10% of households with children had gone without clothing for adults
or buying presents compared to 4% to 8% of households without children.31
Key Finding 7
Despite the additional weighting in the original design of Income Support given to
families with children, the evidence contained in this chapter indicates increased
financial difficulties for these households.
Recommendation 5
The Minister for Social Security must address the role of Income Support for
families with children, in conjunction with the development of the Strategic
Framework for Children and Young People.
31 Page 96 JASS 2010
Review of Benefit Levels
69
13. Accountability and Transparency Issues.
13.1 “Very upset at the fact of having to fill in a booklet for Income
Support at the age of 65 and being asked why I want to cut down
on my working hours. I have worked all my life and bought up five
children on my own.”32
“What is not helpful, is when a father decides to pay [maintenance]
one week, then not the next, … When I was with welfare, they just
asked for a statement to confirm no payment and they made up my
money. Why can’t Income Support be more flexible? There is not
enough communication [from the Social Security Department]…,
not letting me know why. I have to phone regularly to ask why,
which again cost me money. Why can’t there be a free phone?”33
13.2 This chapter deals with four aspects of the Income Support system, which are
related to issues of transparency and accountability:
i) a constant theme of many contributors to this review is that claimants
find the system difficult to understand and complain about the lack of
clear information on Income Support;
ii) by rolling 14 separate benefits into one the Minister has reduced the
accountability in the system, which in turn makes it difficult to analyse
how effective the system is;
iii) more accurate assessment of needs and accurate targeting; and
iv) the issue of take-up which is a major problem for all benefit systems,
especially those which are means tested.
32 Response to survey 24733 Response to survey 206

Review of Benefit Levels
70
13.3 A previous HSSH report, S.R.5/2009, has highlighted the problems associated
with clearly communicating to applicants how Income Support works and what
their entitlement is. For example, the letter informing applicants of the level of
their Income Support award does not give a breakdown of the components.
Recipients cannot therefore check that their circumstances have been accurately
recorded.
13.4 Furthermore, there is a simple computer-based Income Support calculator which
has been made available to some stakeholders (CAB, St Helier Community
Services, and the HSSH Scrutiny Panel.) This calculator is relatively simple to
use and should be made available to clients. Indeed, the UK makes its calculator
available and easily accessible on numerous web pages including
‘Direct.gov.uk’34
Key Finding 8
Applicants for Income Support do not receive sufficient information to allow them
to understand how their benefit is made up.
Recommendation 6
The Minister for Social Security must ensure that applicants for Income Support
are given a breakdown of their Income Support components in the letter notifying
them of their award. The Income Support calculator must be made available to
the public by the Social Security on its web site and in the department.
13.5 The 14 different benefit systems, which formed the basis for the Income Support
System, were funded separately. The cost to the Island of each benefit was
known and recorded. Today, there is no separation of the various components.
13.6 The Social Security Report and Accounts 2009 records Income Support in
‘Statistical Appendix 4’ with only one line showing the total expenditure on
Income Support for 2008 as £70,832,000 and 2009 as £83,286,000. The
document is reproduced in appendix 1 of this report. 34 http://www.direct.gov.uk/en/Diol1/DoItOnline/DoItOnlineByCategory/DG_172666
Review of Benefit Levels
71
13.7 There is clearly a need to provide a regular report schedule on Income Support,
including a profile of beneficiaries and claims in payment. For the sake of
transparency, accountability, analysis and future policy making, figures should be
available on the cost to the Island of every component in the Income Support
scheme. This would allow monitoring of the effectiveness of Income Support by
all stakeholder groups. (States Assembly, Scrutiny Panels, CAB, Age Concern
etc.)
Key Finding 9
There is clearly a need to make public a regular report schedule on Income
Support, including the cost of each component.
Recommendation 7
The Minister for Social Security must publish the cost of each component of
Income Support in his Department Annual Report and Accounts.
13.8 As we have seen in JIDS 2010, Jersey has adopted the 60% of median
equivalised household income as the relative low-income threshold, as we have
in this report. Table 12, however, reveals that a different set of assumptions and
weightings has been used to design the Income Support system. If the Income
Support System is to be used to target the needs of particular vulnerable groups,
then we need to agree;
A set of standards across departments for the methodology used in
surveying and assessing those needs; and
an internally agreed Jersey standard for the measurement of the
performance and targeting of the benefit system.
13.9 Decomposition analysis of how effective Income Support is in supporting various
groups such as:
low waged households

Review of Benefit Levels
72
those receiving pensions or incapacity benefits, and
parents with young children
would give a better understanding of the effective and applied levels of
benefits.
13.10 A more detailed analysis of JIDS 2009/10 to examine the interaction between
Income Support and earned or other income would greatly assist in assessing
the performance of Income Support across the board. Further analysis of the
interaction between earned income, Income Tax and Income Support is explored
in Chapters 18 and 19 of this report.
Key Finding 10
The effectiveness of Income Support at reaching vulnerable groups has not so
far been analysed.
Recommendation 8
The Minister for Social Security should agree, across departments, a set of
standards for assessing the needs of particular vulnerable groups and for the
measurement of performance in targeting those needs.
13.11 Under-claiming of benefit is a very significant issue in measuring the
performance of any benefit scheme35. Insufficient or unclaimed take up does not
provide a system with an effective reach, leaves individuals from vulnerable
groups unprotected and does not adequately reflect the need in the community.
13.12 Many who are entitled to Income Support will not claim it for a number of
reasons, some of which are listed below –
they do not realise they are entitled;
they do not consider it worth claiming;
35 ‘Pubilc Finance’ 3rd February 2011 – Poorest are loosing out on welfare benefits.
Review of Benefit Levels
73
they are put off by the stigma that attaches to it or to the welfare system
that preceded it; or,
they are put off by the application form.
13.13 The Panel recommends an analysis of JIDS 2009/10 to assess ‘take-up’ rates for
Income Support. Such analysis should include assessment of the factors that
relate to non-take-up and should assess how far full take-up would alter profiles
of ‘poverty headcounts’ and ‘poverty gaps’ (the number above and below relative
income lines and the income shortfall that those who are below it have).
13.14 These two additional pieces of applied analysis from the JIDS 2009/10 would
assist in a clearer picture of the effective income levels that are delivered by
Income Support. There appears to have been no research into this area. This is
clearly problematic.
Key Finding 11
There is no evidence that research has been conducted into the under-claiming
of Income Support.
Recommendation 9
The Minister for Social Security should analyse the data contained in JIDS
2009/10 and other sources to assess take-up rates for Income Support.

Review of Benefit Levels
74

Review of Benefit Levels
75
14. Income Support and the Housing Market
14.1 “It is very hard to live in Jersey specially because the rents are so high. I
'm a single mother with 2 daughters. One is 2 years old and the other is
16 years old. We live in the same bedroom because I can’t pay for a 2
bedroom flat. I asked housing for help because I got my quals but they
told me to wait 18 months.”36
14.2 Jersey is a densely populated small island with several factors that contribute to
a tight housing market with:
high prices;
a rising population but with household formation rising more quickly;
high per-capita GDP;
structural land-use restrictions from spatial planning policy; and
very limited subsidised domestic building programmes.
14.3 House prices are high relative to the UK:
“House prices in Jersey in the 4th quarter of 2008 were 132% above those
in the South West of England and 52% higher than in Greater London.” 37
and house price inflation in recent years has been high, prior to the
financial crisis: “Average house prices in Jersey rose by 53% between
2002 and 2008.”(ibid).
14.4 A minority of Income Support claimants, around 9%, mostly elderly, own their
home (either outright or with a mortgage).38 For these claimants there is
obviously no rental component available. Income Support provides a limited
contribution to owners for their accommodation costs to a maximum of £11.13
which reflect liabilities for buildings insurance, ground rent or leasehold charges,
36 Response to survey 12537 Cambridge Centre for Housing and Planning Research (2009) A Review of Social Housing in Jersey. Main Report
(the Whitehead Report), (page 14) July 2009, Cambridge: CCHP University of Cambridge,38 DSS Data Report 2010’

Review of Benefit Levels
76
maintenance, parish rates and other housing costs (with the exception of
mortgage payments). Such payments will not be considered in this analysis.
14.5 Overall, Figure 8 shows that over two thirds (68%) of households claiming
Income Support live in rented accommodation - 30% in private and 38% in public
rented accommodation. The issue of rent is paramount in appreciating both the
extent of coverage and the level of Income Support.
Figure 8. Tenure of Income Support Claimants
Source: Report of Panel advisor Dr. M. Evans
14.6 It comes as no surprise that the largest portion of Income Support payments are
to householders in States rental accommodation, based on household income as
follows:
(2573) 30%
(3,267) 38%
(772) 9%
(1,193),14%
(774) 9%
private rented
public rented
own occ
other
residential care

Review of Benefit Levels
77
Table 17. Median equivalised household income by tenure
BHC £ per
week
AHC £ per
week
% change
States, Parish or Housing Trust rent 480 318 -34
Qualified rent 601 406 -33
Non qualified 630 433 -31
Owner occupied – without mortgage 653 644 -1
Owner occupied – with mortgage 929 773 -17
All households 667 522 -22Source: Table 8 JIDS 2009/10
14.7 States housing tenants are characterised by:
low incomes: 80% of tenants are in the bottom two quintiles, with household
incomes of less than £28,000 per annum, and 64% of States tenants are in
receipt of Income Support;
high proportions of pensioners (32%) and single parents (13%). More than
two in five (44%) of all States tenants are separated, divorced or widowed
women;
lower levels of economic activity compared to other tenures: over half (55%)
of States tenants are economically inactive. Nearly half of the economically
inactive (44%) are retired, over a quarter (27%) are either homemakers or in
full time education and more than a fifth (22%) are long term sick or disabled.
14.8 Consequently, the overwhelming majority of social housing tenants are likely to
be lifelong renters. Even among those tenants who leave States housing every
year, nearly 80% continue to rent, moving into care, to the Cottage Homes, to the
Housing Trusts or into the private rental sector. Only 10%, or some 20 tenants
each year, move to owner-occupation, reflecting the gap between the average
levels of earnings among States tenants and house prices in Jersey.

Review of Benefit Levels
78
14.9 The large percentage of social rented houses rented by low income families
leads to significant proportions of the total rent being paid through the previous
rent abatement scheme and now through the accommodation components of
Income Support. Data released by States Housing Department to Scrutiny gives
the proportions of total rental income attributable to rent abatement prior to 2008.
This is shown in Table 18 below.
Table 18.
14.10 Overall, the proportion of total gross rental income to the States Housing
Department attributable to rebates has been consistently above 45%. In 2007,
the final year of the abatement scheme prior to Income Support, abatement
accounted for 46% of gross rent. Around three out of every four tenants were in
Review of Benefit Levels
79
receipt of abatement. A similar proportion of tenants are today in receipt of the
Income Support accommodation component.
14.11 Such levels of support for social housing can be compared with those in the
private sector, where an increase in demand over supply has led to high levels of
rent inflation in recent years. With little new States housing stock, the private
rented sector has also had to respond to demand from those unable to access
social housing along with those delaying or deferring purchase of their own
homes.
14.12 Again, prior to 2008, the previous rent rebate system enabled rent subsidies to
be paid to those on low income. Table 19 shows the rising level of expenditure
that resulted in the period of 1990-2007. In nominal terms, rebates for private
rents grew enormously, by over 6.6% per annum (over one hundred and twelve
times in total) from £0.8million in 1990 to £9.1 million in 2007. The cost of
supporting low-income tenants in the private sector now has to be met by the
Income Support system.
14.13 No comparable figures for post 2008 payments by Income Support have been
made available to the Panel for this report. Clearly, it is more difficult to assess
how much Income Support is paid towards rent since Income Support is a
cumulative calculation that includes rent as one of many components. Any
income from other sources is then deducted to produce the entitlement, some or
all of which may go towards paying the rent.
14.14 However, the Panel believes that accurate figures for the sums which are paid to
the States Housing Department and to private landlords are essential if we are to
understand the role of Income Support in housing finance and to any future
development of social housing policy.

Review of Benefit Levels
80
Table 19.
Key Finding 12
Accurate figures for the sums which are paid to the States Housing Department
and to private landlords are essential for the development of future housing
policy.
Recommendation 10
The Sub-Panel recommends that the Minister for Social Security makes public
accurate figures of gross annual payments of the accommodation components of
Income Support.
Review of Benefit Levels
81
15. Funding Social Housing: A Failing System.
15.1 “The price of housing and rental is at least three times its [real]
value, yet wages are below the rest of the UK.” 39
“Rent, both housing and private rents, are extremely high and its
impossible to buy your own home unless you're a very high
earner.”40
15.2 Public provision of social rented accommodation, primarily through the States of
Jersey Housing Department but with a small number of Housing Trusts, is based
on a financial model that is peculiar to Jersey.
15.3 There is no loan debt on Social Rental Housing in Jersey and rent levels are set
to cover three main elements:
(i) the costs of direct administration and management costs;
(ii) the costs of household rent subsidies (previously rent rebates but now
the accommodation component of Income Support); and,
(iii) to make a contribution to the States financial budget.
15.4 Deputy Power, when Minister for Housing, described this model as inadequate.
As Professor Whitehead states in her report:
“At the present time income and expenditure on States Housing
match one another in that there is a ‘surplus’ of £22m over direct
operating costs but a similar amount is being expended by the
States through the contribution to investment (£3.55m) and the
payment of Income Support to States tenants (£19m). 39 Response to survey 25040 Response to survey 91

Review of Benefit Levels
82
Thus taken together, States Housing could in some sense be said
to wash its own face. However this funding model does not enable
long term investment in the existing stock.”41
15.5 The resulting rent levels for States rental accommodation are described as ‘fair
rents’ but the level of such rents does not cover the extensive costs of
maintenance, major repair or refurbishment of current stock. As such, these
social ‘fair rents’ are completely divorced from the principles of private market-
based rent setting. States social rental levels are theoretically set at around 90%
of market levels. However, they are only reviewed intermittently and in practice
sometimes drift to lower rates.
15.6 The accommodation component, as with all components of Income Support, is
means tested. Relying on means testing for the provision of social assistance as
the basis of providing ‘affordable housing’ for low income households is
problematic and a clear weakness in overall housing finance policy.
15.7 There is a point at which providing accommodation subsidies to low income
tenants is less efficient than the reduction of rents at source. It is clear that,
without some policy reconsideration, Jersey is approaching that point at some
velocity, as recent increases in housing inflation are double overall price
growth42.
15.8 The Whitehead Report indicated that there are significant structural problems in
the social housing finance policy, causing restricted access to affordable social
rented housing. While this remains unresolved, it puts great pressure on tenants
receiving Income Support subsidies in the private sector.
15.9 Given that the role of the Housing Department in the provision of social rented
housing is under review, following the findings of the Whitehead Report, it is an 41 (Cambridge Centre for Housing and Planning Research (2009) p. 18).42 Housing costs rose by 4% over the year to September 2010 (Jersey Retail Prices Index September 2010, States of
Jersey Statistics Unit). Private housing rents rose by 36% (averaging 4.5% pa) between 2002 and 2009 (Jersey House Price Index 2009, Jersey Statistics Unit).

Review of Benefit Levels
83
ideal time to ensure that the financing of social housing provides affordable
housing whilst reducing the burden on Income Support.
15.10 Clearly, there is a need for structural change to determine where direct funding is
required for the construction, management and maintenance of social rented
housing. Currently means-tested rent subsidies are being used to meet that
requirement.
Key Finding 13
Clearly, there are significant structural problems in the social housing finance
policy, causing restricted access to affordable social rented housing. It puts great
pressure on the tenants receiving Income Support subsidies in the private sector.
Recommendation 11
The Minister for Social Security must work with the Ministers for Treasury and
Resources and Housing to ensure that the mechanism for financing social
housing is separate from the provision of means-tested Income Support benefits.

Review of Benefit Levels
84

Review of Benefit Levels
85
16. Income Support and Private Sector Rental
16.1 “Is very hard to live in Jersey specially because the rents are so
high. I'm a single mother with 2 daughters. One is 2 years old and
the other 16 years old. We live in the same bedroom because I
can’t pay for a 2 bedroom flat. I asked housing for help because I
got my quals but they told me to wait 18 months. I went to the
Housing Trust and they put me on the list.”43
“I am not happy with the housing situation in Jersey. We had to go
private rented because we were not offered a social house. Our flat
(2 bed) is very damp and we have had several problems, electricity,
leaking etc.. But if we wanted to move we would have to find new
tenants before we could move or pay for Slomans to find them. We
then need to pay hundreds of pounds in paperwork fees. All this to
live in a flat that we pay £1,000 a month for and it's not even
healthy to live in.”44
16.2 For private rents, covering 100% of rent at the margins can lead to market
distortions: put simply, landlords can set rents and increase them knowing that
the bill will be picked up by the Social Security Department.
16.3 Rules in Income Support 45 set the ‘Accommodation Component’ to counter
market distortion. At present, the component matches the ‘fair rent’ policy of the
Minister for Housing. Whilst this level is adequate for States Social Housing and
Housing Trusts, unfortunately if not correctly balanced within the Housing Trusts
and private sector, this could lead to problems with affordability. This applies
particularly where the approach is not flexible enough to reflect and respond to
the underlying market shortage and high accommodation costs.
43 Response to survey 12544 Response to survey 24345 Income Support (Jersey) Law 2007, Article 5 Components and rates of Income Support 3 (a) a rate in respect of
the reasonable costs of the household.
Review of Benefit Levels
86
16.4 Since the introduction of Income Support, the Income Support accommodation
component rates have been set at the same level as the Housing Department’s
‘fair rents’. These are nominally set at a maximum of 90% of the market rate. The
Ministers for Social Security and Housing currently work co-operatively to ensure
parity. However, the Income Support law requires component levels to be
reviewed at least once a year but there is no established mechanism to require
the two Ministers to agree on the ‘fair rent’ level.
16.5 A further problem associated with rising rents is that they increase the number of
tenants in the private sector who have rents that are deemed too high to be
covered in full by the Income Support accommodation component.
16.6 High and rising rents would place a significant pressure on Income Support
without the existing ability to set maximum rates for the accommodation
components to match ‘fair rent’ levels. However, capping the level may lead to
significant proportions of private tenants on Income Support having their rent only
partially covered.
16.7 Setting accurate and reasonable limits for accommodation rates relies on high
quality information on both ‘stock rents’ and the price of ‘new lettings’ in the
private and public sector.
16.8 If clients only have their rent partially covered, it means that they are forced to
use non-rental components in order to pay their rent. This reduces the overall
effectiveness of these other components. Partial coverage of private sector rents
will take households further below the low-income threshold.
16.9 There is a significant proportion of Income Support claimants who rent privately
and whose rent exceeds the ‘fair rent’ levels. Table 20 shows the extent to which
this occurs. 46% of couples with children, 35% of lone parents and 17% of
pensioners in the private sector do not have their full rent covered by their
Income Support accommodation component. Comparable levels in States Social
Rented Housing are at 1% or less.

Review of Benefit Levels
87
Table 20. Tenure of Income Support and likelihood of reduced rent coverage.
Lone Parents Couples with Children
Pensioners
No. % with partial rent coverage
No. % with partial rent coverage
No. % with partial rent coverage
Private
Tenancy 524 35% 293 46% 581 17%
States Tenancy 626 1% 264 1% 1199 <1%
Source: SSD Data Report 2010 Tables 6 a), b) c) & d)
16.10 As a result of the accommodation component being applied to the private sector,
there is considerable danger to living standards and affordability of housing for
low-income families. These components may well be set too low and revised too
slowly to provide a balanced set of priorities that allow affordability at the same
time as discouraging under-occupation.
Key Finding 14
The application of the accommodation component of Income Support set at the
fair rent level to those households renting in the private sector may result in
increased hardship especially for families with children.
Recommendation 12
The Ministers for Social Security and Housing must establish a mechanism for
reviewing fair rent levels at regular intervals.
16.11 The current savings requirements imposed by the Comprehensive Spending
Review could place the funds available to maintain the accommodation
component at ‘fair rent’ levels at risk. An approach that puts undue emphasis on
capping Income Support subsidies would be unfair. It would also lead to more
tenants on Income Support receiving less assistance with their rent and this
would significantly erode the effective level of Income Support rates.

Review of Benefit Levels
88
16.12 The consequences of any reduction or freezing of the accommodation
component combined with an increase in Housing Department ‘fair rent’ levels
would mean that Income Support recipients in social rented housing would be
faced with the same difficulties as those in the private sector. Recipients would
be required to use a proportion of their basic Income Support components to
meet their rental shortfall.
Key Finding 15
The current savings requirements imposed by the Comprehensive Spending
Review places the funds available to maintain the accommodation component at
‘fair rent’ levels at risk.
Recommendation 13
Pending a long term solution to the funding of social housing, (Recommendation
12) the Minister for Social Security must resist any pressure to cap the rising cost
of the accommodation component of Income Support.
Review of Benefit Levels
89
17. Income Support and Earnings.
17.1 “The minimum wage at [around} £6.00 is far too low, with food and
accommodation in Jersey the most expensive in the world.”46
“I found a new job with better prospects, term time only but when
reassessed at Income Support my extra wage makes up for what I
am losing on Income Support, so [I am] no better off for changing
jobs.”47
“I am looking to going back to work in the future (when youngest
child goes to school nursery) Having great difficulty in getting
support for relevant (support training) prior to this. Am concerned
that if I go back to work, I will be worse off or no better off than I am
now on Income Support.”48
17.2 The earlier Tables 7 and 8 showed the large effect that rent had on relative low-
income assessments. In effect, the high proportion of benefit allocated to the
accommodation component distorts the benefit system dramatically. Further
evidence is seen in Table 2 of this report, which shows that rent as a proportion
of average incomes by tenure is around 33% in all rental sectors. They are on
the whole, less well off than owner occupiers.
17.3 The fact that the accommodation component makes up such a large proportion
of the benefit payable has two negative impacts on the effectiveness of Income
Support:
i) Income Support operates on a considerable range of earnings and thus
reduces work incentives over that range; and
46 Response to survey 23947 Response to survey 3148 Response to survey 71

Review of Benefit Levels
90
ii) Income Support entitlement continues further up the income distribution
than a simple consideration of ‘benefit rates’ suggests and this means
there is potentially interaction with other fiscal measures, and in particular,
income tax.
17.4 Rising rent levels produced by the linkage of ‘fair rents’ to 90% of market levels
will compound these ‘stretch effects’ over time. These ‘stretch effects’ are
discussed in later sections of this report.
17.5 The report so far has considered only the basic Income Support components that
claimants receive in the absence of any other form of income whether earned or
otherwise.
17.6 Income Support was designed to be both a safety net for families with no income
and an in-work benefit to supplement those on low or fixed incomes. The majority
of claimants49 have other forms of income in addition to Income Support.
17.7 The Sub-Panel will now examine the financial impact on households when
Income Support is paid alongside earnings and how other areas of social policy
affect Income Support recipients.
17.8 Before looking at the influence of wages, it is important to take into account what
is termed the “stretch effect” that the accommodation component has on
increasing the range of incomes over which Income Support operates.
17.9 The Social Security Department Data Report 2010 provides Tables that show the
average rents paid by Income Support claimants in early 2010. These are
reported in Table 21 along with the minimum basic components of Income
Support payable (that for a single householder) to give an indication of the
potential ‘stretch’.
49 Social Security Data 2009

Review of Benefit Levels
91
17.10 On average, the amount paid in rent is greater than the minimum basic
components for a single householder – 110% (or 10% over) and private rents
121% (21% over). Whilst for larger families, rent will represent a lower
percentage of underlying Income Support, it is worth pointing out that, crudely,
rent will raise Income Support levels considerably and double them in some
cases.
17.11 Table 21 puts such figures in both weekly and annual terms to allow subsequent
comparison with potential earnings at the minimum wage and with annual
incomes for taxation purposes.
Table 21. Rents and Income Support – Weekly and Annual Comparisons.50
States Tenants Private Tenants
No of Income Support cases 3,267 2,540
Rent
Average weekly gross rent £153 £168
Gross rent - annual equivalent £8,020 £8,772
Basic Component of Income Support
Single householder - weekly £139 £139
annual equivalent £7,275 £7,275
Combined Rent and Basic Component
weekly £293 £309
annual £15,295 £16,047Source: DSS Data Report 2010 Tables 6 a), b) c) & d and DSS Income Support Calculator
17.12 For a single person in receipt of Income Support, if they have no other income,
their basic entitlements including rent will range from £245 (if they live in a bedsit)
to around £300 (if they live in a one bedroom house). This is equivalent to gross
earnings at the minimum wage obtainable from working 39 to 48 hours a week.
50 Notes: Average rents are weighted averages across whole IS claimant renting populations. All sums rounded to
nearest £1

Review of Benefit Levels
92
17.13 However, once Social Security contributions are deducted, this is equivalent to
between 42 and 51 hours at the minimum wage. Therefore, many low earners in
rental accommodation will be entitled to Income Support. This entitlement will
increase as family size increases (with partners and/or children) and as rents
increase.
17.14 But these simple comparisons of rates and rents do not tell the whole story. We
now examine the effect of Income Support disregards and tapers on earnings to
determine net household incomes.
17.15 Table 22 illustrates three hypothetical cases – a single person, a couple with no
children and a couple with two school-age children. It shows the gross and net
wages (after deduction of Social Security contributions) which result from
employment at the minimum wage. The impact of earnings on the level of
Income Support available is shown in column four and as a percentage of net
wages in column five. These three scenarios have been more fully explored in
the case studies in Chapter 6 of this report.
17.16 The levels of rent used in these calculations are realistic. Median rents in the
private sector for couples with children are reported at £226 weekly in the Social
Security Department Data Report 2010 and the level used in the computation for
a couple in Table 22 is below the ‘fair rent’ level for a three-bedroom house.
17.17 A range of work scenarios is explored in which 37.5 hours is taken as equivalent
to one full-time worker. For each household, the number of hours of work that are
required to lift the family out of the need for Income Support is highlighted.
17.18 Full time (37.5 hours) minimum wage employment for a single person (paying
£150 per week rent) will attract £98.58 Income Support weekly. That is
equivalent to 42% of their net wages.

Review of Benefit Levels
93
Table 22. Minimum Wage Employment and Income Support Entitlement.51
Minimum Wage Employment Income Support
Hours per week
Gross Wage
Net wage after SS contributions
IncomeSupportPayable % of net wage
Single Person - £150 rent
0 0 0 £289.23 -
37.5 £232.50 £218.55 £98.58 42%
57 £353.40 £332.20 0 -
Couple - £150 rent
0 0 0 £381.35 -
37.5 £232.50 £218.55 £190.70 87%
56 £347.20 £326.37 £96.65 30%
75 £465.00 £437.10 0 -
Couple with two children - £250 rent
0 0 0 £605.53 -
37.5 232.5 £218.55 £414.18 190%
56 347.2 £326.37 £320.83 98%
75 465 £437.10 £224.23 51%
119 737.8 £693.53 0 -Source: Dr. M. Evans, Panel Advisor, calculations using DSS Income Support Calculator
17.19 This person would have to work 57 hours a week at the minimum wage (or
increase their hourly earnings to £9.42) to achieve the level of income available
from Income Support. His or her gross earnings would then be £353.40 per
week. This is equivalent to 56% of average earnings in Jersey in June 2010.52
17.20 A couple without children, if not working, would be entitled to £381.35 in Income
Support. With one full time worker employed at the minimum wage, Income
Support is reduced to £190.70 or 87% of take-home pay. Only if they both
51 Notes: Orange cells - The minimum hours required to reduce IS to zero at the margin of entitlement.52 Index of Average Earnings June 2010 – Statistics Unit States of Jersey.

Review of Benefit Levels
94
worked full time, a total of 75 hours, would they escape Income Support
entitlement.
17.21 Finally, a couple with two children (paying £250 rent on a three-bedroom house)
would be entitled to receive £605.53 if neither parent was in work. With one full-
time worker at minimum wage, Income Support would be reduced to £414.18. If
both parents worked full time (75 hours per week in total) then Income Support
would be reduced to £224.23 or 51% of their take-home pay.
17.22 To escape Income Support, the couple would have to work a combination of 119
hours a week at the minimum wage, providing a joint gross wage of £737.80 per
week.
17.23 The figures in Table 22 show that for a single person and a couple with two
children, full time work at the minimum wage does not allow these households to
escape from dependency on Income Support.
17.24 The fact is that any rise in the minimum wage will be matched by a reduction in
the Income Support paid to that household. Since almost 50% of participants in
Income Support are of working age, it must be recognised that large savings in
the Income Support bill (currently £62m) could be achieved by simply raising the
minimum wage at a rate above inflation.
17.25 It is arguable that the Income Support system is in effect subsidising employers
who pay low wages. In considering the level of the minimum wage rate every
year, much consideration is given by the States to the economic impact on
employers. Equal weighting should be given to the impact on the overall Income
Support bill in future.
17.26 It is evident that the combination of the minimum wage as currently set and the
tapers and disregards built into Income Support produce very little incentive to
work.

Review of Benefit Levels
95
Key Finding 16
At its current rate, the minimum wage results in high demand for Income Support
from a wide range of household types.
Recommendation 14
The Minister for Social Security, in his own review of Income Support, must
examine the interaction between the level of the minimum wage and the overall
cost of Income Support.
Key Finding 17
The system of tapers and disregards for earned income in the Income Support
structure provides insufficient incentives to work.
Recommendation 15
The Minister for Social Security, in his own review of Income Support, must
conduct a thorough overhaul of tapers and disregards for earned income in order
to greatly improve incentives to work.

Review of Benefit Levels
96

Review of Benefit Levels
97
18. Income Tax
18.1 “I am aged 67 years and still work 40 hours a week. The cost of
things is very bad here… I have lived here since I was two and a
half years old…. I have never asked for help, but now I could do
with it as I am finding the ITIS very hard to cope with. Surely
special rates should apply to the elderly and make the wealthy
immigrants pay more.”53
“As an OAP who has worked all my life, I have a pension which I
contributed to from my work place. Unfortunately it is not index
linked, therefore doesn't keep up with the rising cost of living. I
also have the Jersey OAP Pension. This is my entire income and
I do get help through Income Support with my rent. But because
my two pensions just take me into the Income Tax bracket I have
no other help and have to find approx £600 per annum in Income
Tax. I feel that there must be some way that people who just fall
into this trap could be given some thought.”54
18.2 All Income Support payments are disregarded in calculating a household’s
Income Tax liability. However, the figures provided in Table 24 show that a single
person can have earned income which takes him above the tax threshold of
£12,650 and still be eligible to claim Income Support.
18.3 A couple with no children are treated somewhat differently and will not, in general,
be subject to Income Tax whilst they remain on Income Support. The presence
of two children however, may well bring households into income tax.
18.4 There are three fundamental questions which need to be answered in relation to
earnings from employment for those on Income Support and income tax
thresholds. 53 Response to survey 13654 Response to survey 284
Review of Benefit Levels
98
These are:
i) Is there an overlap between Income Support and Income Tax
thresholds?
ii) Should recipients of Income Support be paying tax at all?
iii) Does the interaction between Income Support levels and Income Tax
thresholds produce equitable outcomes?
18.5 Clearly, the earlier Tables confirm that incomes from earnings in Income Support
cases can reach levels that attract liability for Income Tax. The extent to which
this occurs and how such cases are treated is something that requires urgent
consideration and further exploration.
18.6 The Social Security Department Data Report 2010 shows that median and
average gross earnings levels for couples with children on Income Support were
between £22,000 and £23,000 per annum and similar earnings for lone parents
were over £15,000.
18.7 Some of these cases may represent higher income ‘transitional support’ cases.
However, the potential overlap with Income Tax thresholds is present and is
demonstrated in Table 24.
18.8 Table 23 shows the entry and exit points for any overlap between Income Support
and Income Tax for a range of families, rent and earning assumptions.

Review of Benefit Levels
99
Table 23. Income Tax and Income Support Entitlement.55
Single Person
Couple with no children Couple with 2 children
1 earner 2 earners 1 earner 2 earners
Income Tax
Earnings threshold £12,650 £20,280 £24,780 £26,280 £30,780
Income Support as % of Income Tax Earnings Threshold
At Median States Rental 109% 92% 75% 109% 93%
At Median Private Rental 117% 97% 79% 113% 96%
Earnings at which entitlement to Income Support ends as % of Income Tax
Earnings Threshold
143% 118% 97% 128% 109%Source: Dr. M. Evans, Panel Advisor, calculations from States of Jersey Tax office Income Tax Model; DSS Income Support Calculator
18.9 For a single person, Income Support eligibility including rent is over basic
thresholds for liability for tax (between 9% and 17% over the threshold depending
on the rent assumption). Once that person starts earning the overlap continues
until earnings are 43% over the tax threshold, at which point eligibility to Income
Support ends at the upper margin.
18.10 For couples with no children the underlying entitlement to Income Support is
below Income Tax thresholds but where only one parent works, then earnings
and Income Support components can bring the family into income tax.
18.11 For couples with two children, Income Support levels are generally below Income
Tax thresholds where both adults are working. If only one adult is working, then
the household may become liable for income tax. This disparity between a single
55 Notes^ Using only basic tax allowances and thresholds and without inclusion of any other allowable relief or deduction. Using 2009/10 IS rates and 2010 Income Tax allowances Income Tax calculations agreed with States of Jersey Tax Office. Rent levels taken from DSS Data Report 2010.

Review of Benefit Levels
100
earner or two earning adults in a household, continues across the full range of
earnings.
18.12 This brings us back to the three fundamental questions we asked at the
beginning of this Chapter:
1. Is there an overlap between Income Support and Income Tax
thresholds?
18.13 Although the examples used in Tables 22 and 23 are only illustrative, the results
would indicate that there is, potentially, an overlap between receipt of Income
Support in conjunction with earnings and liability to pay Income Tax.
2. Should recipients of Income Support be paying tax at all?
18.14 It appears axiomatic that Government should not be paying benefit to households
with one hand only to take it back with the other.
3. Does the interaction between Income Support levels and Income
Tax thresholds produce equitable outcomes?
18.15 The answer here appears to be negative in that a liability for tax in the illustrative
examples of households used shows wide variations.
18.16 The evidence shows that the Income Support Scheme has been developed
without sufficient consideration being given to potential or actual overlaps with
Income Tax thresholds. As discussed earlier, the ‘stretch’ effects of the large
rental component of Income Support means that some households find
themselves receiving benefit and paying tax. This is clearly economically
inefficient.
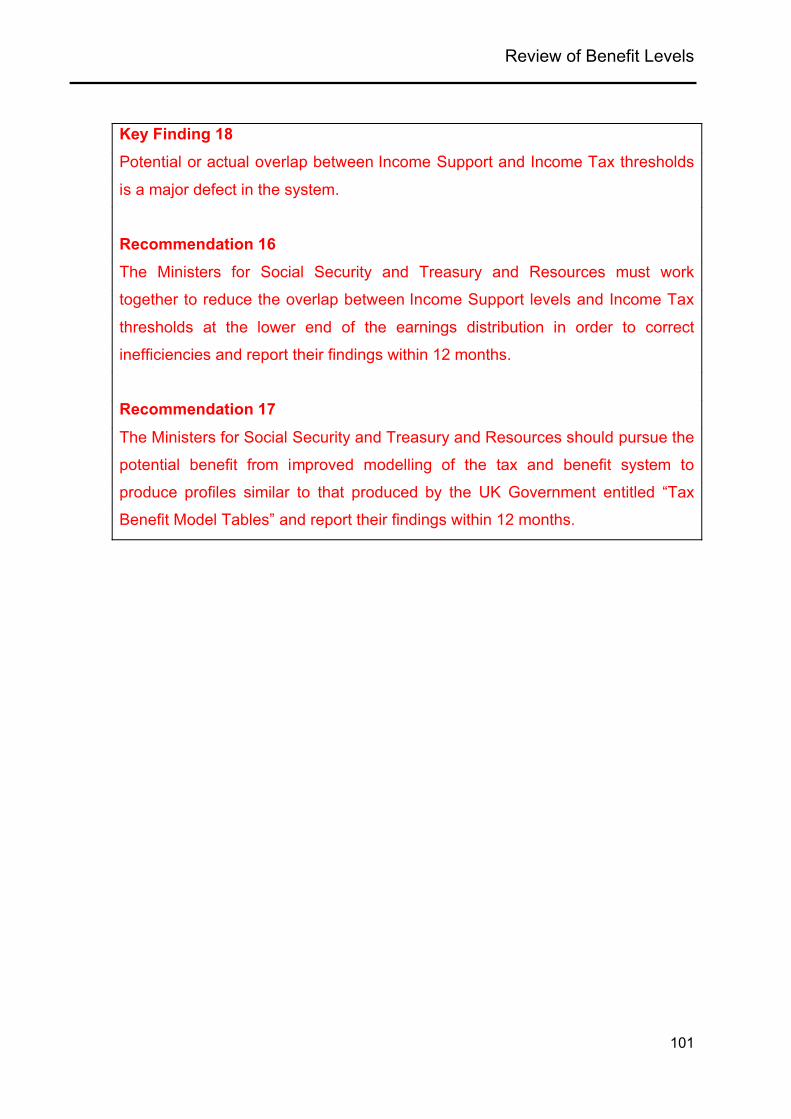
Review of Benefit Levels
101
Key Finding 18
Potential or actual overlap between Income Support and Income Tax thresholds
is a major defect in the system.
Recommendation 16
The Ministers for Social Security and Treasury and Resources must work
together to reduce the overlap between Income Support levels and Income Tax
thresholds at the lower end of the earnings distribution in order to correct
inefficiencies and report their findings within 12 months.
Recommendation 17
The Ministers for Social Security and Treasury and Resources should pursue the
potential benefit from improved modelling of the tax and benefit system to
produce profiles similar to that produced by the UK Government entitled “Tax
Benefit Model Tables” and report their findings within 12 months.

Review of Benefit Levels
102

Review of Benefit Levels
103
19. Pensions and Savings
19.1 “The cost of living has definitely affected our lifestyle over the last
year. Low bank interest, GST, taxation levels on fuel etc have
prevented us from making that little bit extra on our savings for
our desire to remain as independent as possible as we get older.
We are very concerned about the cost of nursing homes.”56
“It is very difficult to manage on a States pension always having to
dip into savings each year. We also believe it is wrong for people
who have looked after themselves and saved all their adult lives
to have to pay more for their later healthcare years.. .”57
19.2 The Social Security Department (SSD) Data Report 2010 shows that 31.6% of all
Income Support claims are for households where at least one person is of
pensionable age. The States of Jersey Statistics Units’ population model
estimates that around 23%-25% of Jersey’s elderly population relies on Income
Support.
19.3 That report also shows that the median (typical) private rent paid by elderly
Income Support claimants is £143 per week – with a mean rent of between £130
and £135, suggesting that there is a skew towards lower than typical private rent
levels in the overall distribution of rent paid by this group.
19.4 For illustrative purposes, and ignoring cases that currently get Income Support
under transitional protection arrangements, then a ‘typical pensioner’ claimant in
2009/10 would get approximately £120 per week from Income Support as
calculated -
56 Response to survey 24057 Response to survey 262
Review of Benefit Levels
104
Basic component (single adult) in own household £92.12 + £47.11 = £139.23
Rent £125.30
Total ‘needs’ £264.53
Income from Jersey Pension £178.01 (£32.06 disregard) - £145.32
Income Support Entitlement £119.21
19.5 Savings. The Social Security Data Report 2010 shows that 90% of Income
Support pensioner households have some level of savings. Of these, a minority,
nearly 15%, have very low savings, i.e. less than £1,000. The typical level of
savings (the median case of those with positive savings) is £8,560 (for
households with a disability component) and £6,870 (for those without). The
mean figure for pensioner savings is £23,767.
19.6 The threshold for the deduction of income from capital in Income Support is set
at £13,053 for a single pensioner and £21,636 for a pensioner couple. This
means that for all savings below these thresholds any income from such savings
is disregarded.
19.7 For those pensioners with significant savings over the threshold, Income Support
operates a system of ‘Deemed income’. Every £250 of savings above the
threshold is deemed to return £1 a week (£52.25 per annum) in income. This is
an annual interest rate equivalent to 20.9%. Such rates are obviously unrealistic,
nevertheless, for every £1 of deemed income above the threshold, £1 is
withdrawn from the Income Support payable. With current interest rates returning
less than 12 pence per week from £250 invested, this use of deemed income
severely penalises those who have saved for their retirement.
19.8 Many pensioners rely on their savings to supplement their incomes. Since the
introduction of Income Support in January 2008, interest rates have fallen
significantly. This has meant a reduction in the standard of living for pensioner
households. Whilst this might be a relatively minor problem for those with low
savings, it is significant for those whose savings are above the threshold.

Review of Benefit Levels
105
19.9 The Minister for Social Security has effectively acknowledged that there is a
problem with “Deemed Income” by increasing capital thresholds over the past
two years. Figure 9 shows the difference between 2008 and 2010 income from
savings following its treatment by Income Support. It shows 2 lines based on 5%
(a higher interest rate available in 2008) and 2.5% (the low rate available in
2010) on the same ranges of savings for single and a couple pensioner cases.
Figure 9. Income Support and Income from Savings 2008 and 2010
Source: Dr. M. Evans, Panel Advisor, calculations and DSS Data Report 2010
19.10 What Figure 9 demonstrates is that whilst actual income from savings has fallen
from 2008 to 2010 (due to lower interest rates) the treatment by Income Support
has made such shortfalls in income worse.
19.11 For those with low levels of savings Income Support ignores any income. Their
interest has fallen and their incomes are lower. For those with savings above the
thresholds at which deemed income is calculated then the effects of up-rating the
-£40
-£35
-£30
-£25
-£20
-£15
-£10
-£5
£0
£5
£10
£15
£20
£25
Net
Eff
ect o
n W
eekl
y In
com
e fo
r Inc
ome
Supp
ort P
urpo
ses
Savings Total
2010 single
2010 couple
2008 Single
2008 Couple
Median 2010 Savings£6,880
Average 2010 Savings£23,767
Review of Benefit Levels
106
thresholds has been completely outstripped by the fall in interest rates alongside
a constant rate of assumed return set in the regulations.
19.12 For a pensioner couple (Figure 9, green lines) in 2008 the deduction of Deemed
Income did not eliminate the actual interest earned until savings were well above
£26,000. In 2010 the lower interest rates meant that the Deemed Income
eliminated any return from savings at £25,000.
19.13 For single pensioners (Figure 9 red lines) the lower threshold makes this effect
occur on lower levels of savings, so that Deemed Income was greater than actual
interest at £18,000 in 2008 but at around £15,000 in 2010.
19.14 To put it simply, the ‘net’ income from savings for a single pensioner on Income
Support with £16,000 savings has changed from £3.31 a week in 2008 to a
reduction of £4.34 in 2010. This is a total reduction in weekly income of £7.65.
19.15 The issue of Deemed Income has been raised in the submission of the Citizens
Advice Bureau on 7th May 2010, as follows,
“We recommend that the “Deemed Income” from capital figure of £1 per
week for every £250, is reviewed. The current figure equates to a 21%
return on capital which is unrealistic in the current economic climate.”
19.16 This raises the obvious question of how sensible it is to have a fixed tariff income
assumption at all, particularly at the rate applied which many consider punitive.
This is made worse during a period of rapidly falling interest rates. Pensioners
who are income poor but have moderate assets have been hit hard.
19.17 The interest rate charged on savings should be set at a realistic rate to reflect
actual bank interest rates and consequently the amount of income generated
from those savings.

Review of Benefit Levels
107
Key Finding 19
The current Deemed Income system, which is currently charged on savings at an
annual interest rate equivalent to 20.9%, severely penalises those who have
saved for their retirement.
Recommendation 18
The Minister for Social Security should set an interest rate to be charged on
savings over the threshold at a realistic level to reflect actual bank interest rates.
This rate should be reviewed annually.

Review of Benefit Levels
108

Review of Benefit Levels
109
20. Health Care
20.1 “I have found myself out of work since November through no fault
of my own and therefore have gone from earning a good wage to
Income Support ..I have actually had to cancel Doctors due to the
cost of £35 each visit.” 58
“As one gets older, it is a fact of life that visits to the Doctor are
more frequent and the fees involved are a continual worry. My
surgery charges £35.20 for each visit and considerably more if I
need a home visit. I have been in hospital 3 times in the last 2
years, which fortunately is free but it has cost me several hundreds
of pounds for Doctors fees in between…..”59
20.2 The treatment of medical costs by Income Support has been an ongoing issue
throughout the past two years. Under the previous welfare schemes there were
some who received free GP consultations by virtue of the Health Insurance
Exemption Scheme (HIE).
20.3 In the new scheme, a Household Medical Account (HMA) was brought in. The
HMA was not a replacement for the HIE. HIE claimants were allocated an HMA
under Income Support. This was to help them adjust to the new system. Initially,
it was proposed that Income Support recipients with HMA would pay £5 per GP
consultation with the balance paid from the clients HMA. This £5 part payment
was soon abandoned.
20.4 Income Support households with a HMA have a small weekly amount (£1.93 per
person initially) withheld from their benefit and set aside to pay for up to four GP
consultations annually.
58 Quote from survey reply number 5659 Quote from survey reply number 273

Review of Benefit Levels
110
20.5 Should the client require more visits to the GP due to a chronic or debilitating
condition then the client can apply for the additional cost to be met from funding
via a Clinical Cost Component at Level 1 (up to 8 visits) or Level 2 (up to 12
visits). Should urgent extra treatment be required for a short-term illness
requiring GP assistance then the cost of any GP visits may be met by Special
Payments.
20.6 On some occasions, clients and GPs appear to have been unaware that the
clients were able to seek financial assistance with the unforeseen extra medical
costs from Special Payments. This resulted in clients becoming anxious as to
how they could cope with doctors’ bills (sometimes amounting to hundreds of
pounds). In some cases the Social Security Department demanded that the
clients arrange to pay back the overspend on their HMA accounts.
20.7 Overall, it is clear that the HMA does allow Income Support clients to make
provision to pay for their planned GP bills in the form of regular small amounts
from their weekly benefit. The existing Clinical Components are set up to address
chronic or debilitating illness but are not designed to cope with unforeseen
medical visits and expenses. This provision is only available through Special
Payments and requires either the GP or the client to make an application for the
funds to be paid into the HMA.
20.8 Concerns about the removal of HIE and the effectiveness of HMAs is reflected in
the comments submitted by CAB.
“The Social Security Department need to carry out a publicity
exercise to ensure that all Income Support households understand
that the basic personal component for each member of the Income
Support unit includes the provision for up to four GP visits per year.
We also recommend that the setting up of HMAs should be
mandatory where there are any members of the unit in receipt of
clinical cost components.”
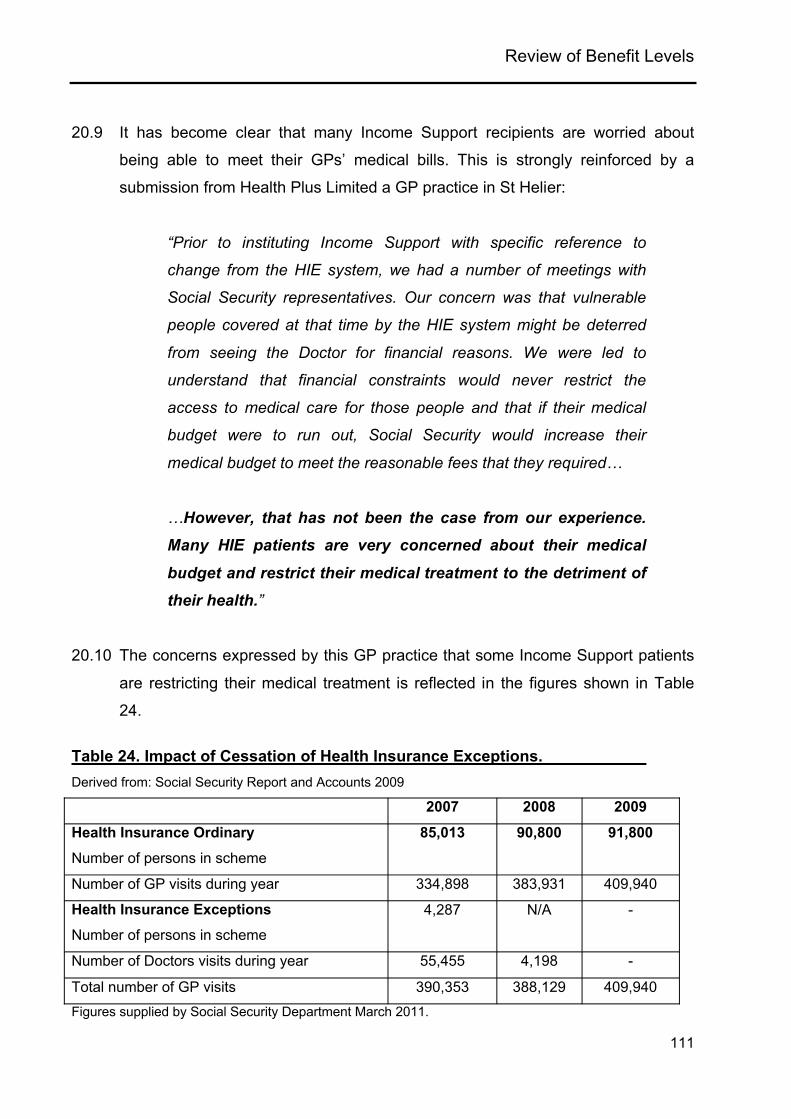
Review of Benefit Levels
111
20.9 It has become clear that many Income Support recipients are worried about
being able to meet their GPs’ medical bills. This is strongly reinforced by a
submission from Health Plus Limited a GP practice in St Helier:
“Prior to instituting Income Support with specific reference to
change from the HIE system, we had a number of meetings with
Social Security representatives. Our concern was that vulnerable
people covered at that time by the HIE system might be deterred
from seeing the Doctor for financial reasons. We were led to
understand that financial constraints would never restrict the
access to medical care for those people and that if their medical
budget were to run out, Social Security would increase their
medical budget to meet the reasonable fees that they required…
…However, that has not been the case from our experience. Many HIE patients are very concerned about their medical
budget and restrict their medical treatment to the detriment of their health.”
20.10 The concerns expressed by this GP practice that some Income Support patients
are restricting their medical treatment is reflected in the figures shown in Table
24.
Table 24. Impact of Cessation of Health Insurance Exceptions.Derived from: Social Security Report and Accounts 2009
2007 2008 2009
Health Insurance Ordinary
Number of persons in scheme
85,013 90,800 91,800
Number of GP visits during year 334,898 383,931 409,940
Health Insurance Exceptions
Number of persons in scheme
4,287 N/A -
Number of Doctors visits during year 55,455 4,198 -
Total number of GP visits 390,353 388,129 409,940Figures supplied by Social Security Department March 2011.
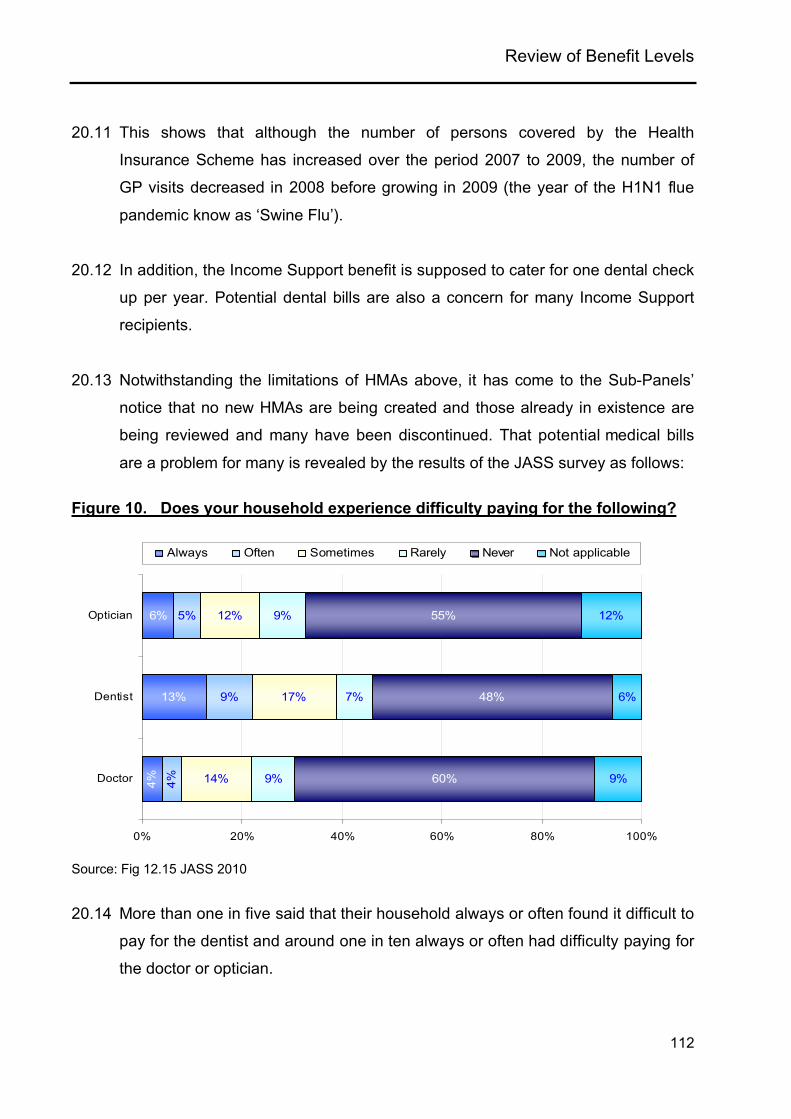
Review of Benefit Levels
112
20.11 This shows that although the number of persons covered by the Health
Insurance Scheme has increased over the period 2007 to 2009, the number of
GP visits decreased in 2008 before growing in 2009 (the year of the H1N1 flue
pandemic know as ‘Swine Flu’).
20.12 In addition, the Income Support benefit is supposed to cater for one dental check
up per year. Potential dental bills are also a concern for many Income Support
recipients.
20.13 Notwithstanding the limitations of HMAs above, it has come to the Sub-Panels’
notice that no new HMAs are being created and those already in existence are
being reviewed and many have been discontinued. That potential medical bills
are a problem for many is revealed by the results of the JASS survey as follows:
Figure 10. Does your household experience difficulty paying for the following?
13%
6%
9%
5%
14%
17%
12%
9%
7%
9%
60%
48%
55%
9%
6%
12%
4% 4%
0% 20% 40% 60% 80% 100%
Doctor
Dentist
Optician
Always Often Sometimes Rarely Never Not applicable
Source: Fig 12.15 JASS 2010
20.14 More than one in five said that their household always or often found it difficult to
pay for the dentist and around one in ten always or often had difficulty paying for
the doctor or optician.

Review of Benefit Levels
113
20.15 Analysing these results by income reveals that a greater proportion of individuals
from households with a lower income had difficulty paying, as shown in Figure
11.
Figure 11. Does your household experience difficulty paying for the following? Percentage answering Always or Often, by household income
19%
12%
7%
3%
43%
31%
27%
9%
2%
28%
17%
11%
4%
1%
0% 20% 40%
< £20,000
£20,000 - £33,333
£33,334 - £50,000
£50,001 - £70,000
> £70,000
Doctor Dentist Optician
Source: Fig 12.16 JASS 2010
20.16 Two-fifths (43%) of households with total annual income below £20,000 had
experienced difficulty paying for the dentist, over a quarter (28%) had
experienced difficulty paying for the optician and a fifth (19%) for the doctor.
20.17 A third (34%) of households containing at least one child had experienced
difficulty paying for the dentist, compared with a sixth (17%) of households
without children (see Table 25). The proportions of households with children
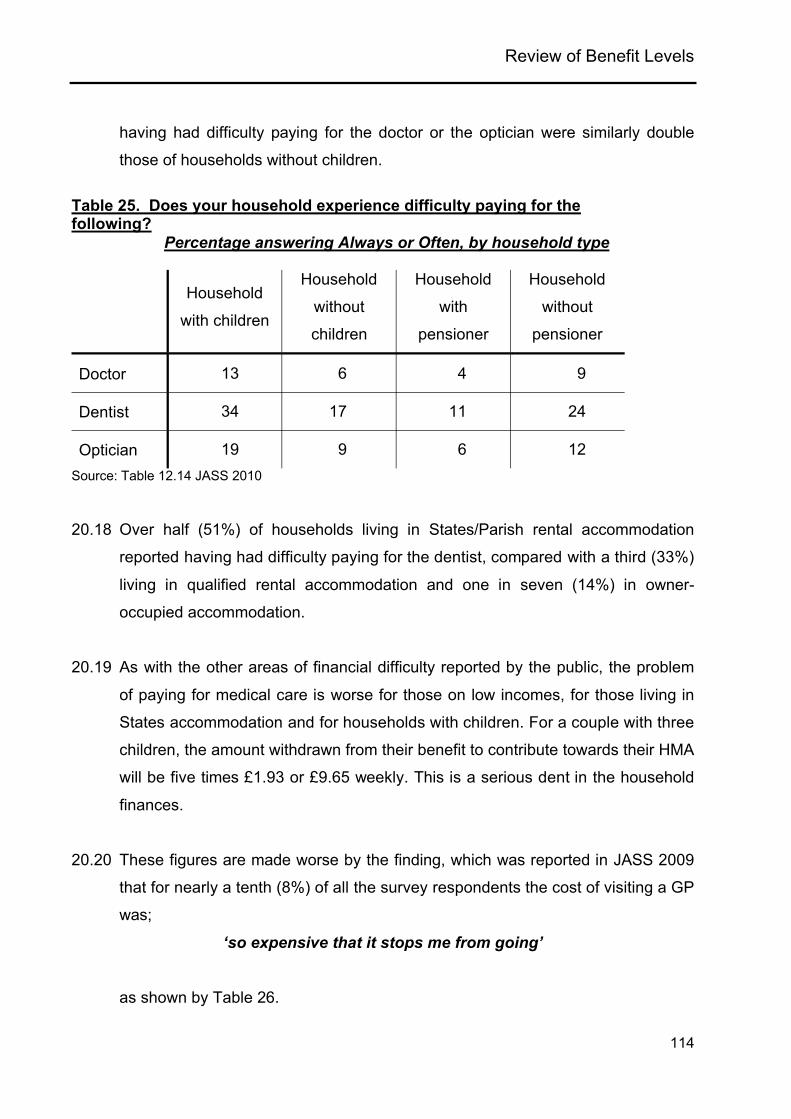
Review of Benefit Levels
114
having had difficulty paying for the doctor or the optician were similarly double
those of households without children.
Table 25. Does your household experience difficulty paying for the following?
Percentage answering Always or Often, by household type
Household
with children
Household
without
children
Household
with
pensioner
Household
without
pensioner
Doctor 13 6 4 9
Dentist 34 17 11 24
Optician 19 9 6 12Source: Table 12.14 JASS 2010
20.18 Over half (51%) of households living in States/Parish rental accommodation
reported having had difficulty paying for the dentist, compared with a third (33%)
living in qualified rental accommodation and one in seven (14%) in owner-
occupied accommodation.
20.19 As with the other areas of financial difficulty reported by the public, the problem
of paying for medical care is worse for those on low incomes, for those living in
States accommodation and for households with children. For a couple with three
children, the amount withdrawn from their benefit to contribute towards their HMA
will be five times £1.93 or £9.65 weekly. This is a serious dent in the household
finances.
20.20 These figures are made worse by the finding, which was reported in JASS 2009
that for nearly a tenth (8%) of all the survey respondents the cost of visiting a GP
was;
‘so expensive that it stops me from going’
as shown by Table 26.

Review of Benefit Levels
115
Table 26. Do you think that the cost of visiting a GP is..?
16-34 yrs
35-44 yrs
45-54 yrs
55-64 yrs
65 yrs or
more
All ages
Good value for money 2 4 4 6 7 4About right 12 13 16 19 18 15
Expensive but worth it 20 18 20 25 33 22Expensive and therefore I
only go when I have to54 57 55 46 39 51
So expensive that it stops me from going
12 8 5 4 3 8
Total 100 100 100 100 100 100Source: Table 11.1 JASS 2009
20.21 In 2009 respondents were asked how much they paid the last time they saw the
GP. For those whose last visit was a surgery appointment the average (median)
paid was £32. For home visits the average (median) paid was £55.
Key Finding 20
There is evidence to show that medical costs (G.P, dental and ophthalmic
consultations) are a serious problem for many households, especially low-income
households in receipt of Income Support, to the extent that significant numbers of
people report that the cost stops them going to their GP.
Recommendation 19
The Minister for Social Security must ensure that information is fully and readily
available to the recipients of Income Support about how medical costs are to be
met.
Key Finding 21
In principle, Household Medical Accounts are a useful mechanism to assist
Income Support clients to save for their GP costs.
Recommendation 20
The Minister for Social Security should ensure that all Income Support claimants
who wish to can set up a Household Medical Account.

Review of Benefit Levels
116
Key Finding 22
The withdrawal of free access to GPs for some low-income households under the
HIE scheme following the introduction of Income Support has, in many cases,
had a negative impact.
Recommendation 21
The Minister for Social Security should review the funding of medical care to
develop a costed scheme to provide limited free access to GPs for certain
vulnerable groups and report his findings within 12 months.
Review of Benefit Levels
117
21. Conclusion.
21.1 We have seen quite clearly in this report that the Income Support system is far
from the finished article. It is not an anti-poverty programme that makes work
pay. Neither is it an anti-poverty programme for the elderly that supports saving
for old age. The impact of high rent levels on the cost of Income Support render
the current structure unsustainable.
21.2 For a wide range of family types across the island, Income Support fails to lift
households above the relative low income threshold. In failing to do so, it falls
short of the fundamental aims laid out for it at its outset:
“The new system will help and enable people to both avoid
poverty and to take appropriate actions and life decisions to get
out of poverty. The system will do this by effectively tackling real
needs whilst promoting work and encouraging self-reliance…”
21.3 In addition, the potential overlap of Income Support with income tax thresholds,
even at the level of the minimum wage, must mean that a major overhaul is
required.
21.4 All of the above problems go beyond the possibility of “minor” adjustments to the
system, but require a major rethink of the structure and performance of Income
Support. We need a credible study of the needs of vulnerable groups in our
community along with an assessment of how we can focus our support systems
to best meet those needs.
21.5 It is to be hoped that this report, along with the Minister’s current review, will form
the basis of further work to better understand the issues involved in formulating
and properly targeting social and economic policy over the coming decade.

Review of Benefit Levels
118
Review of Benefit Levels
119
22. Glossary
After Housing Costs (AHC) After consideration of accommodation costs
Before Housing Costs (BHC) Prior to consideration of accommodation costs
Components of Income Support
Income Support can help with different areas of day-to-day basic living costs. These different areas are known as 'components'.
Disregards Income disregarded for the purposes of Income Support
Equivalised Weighting of the household income for the type of household to produce a similar standard of living.
Income Support
Income Support is an income-related benefit that provides financial support towards the costs of living, housing, medical needs and childcare. Carers can also receive support.
Income tax threshold Point at which income becomes liable for tax paymentsITIS Income Tax Instalment SystemJASS 2010 Jersey Annual Social Survey 2010JIDS 2009/10 Jersey Income Distribution Survey 2009/10Mean AverageMedian Income The income of the middle or 50th percentile householdMinimum Wage From 1st April 2010 £6.20 per hourPensions Pension is a benefit that is paid at a certain age.
Quintiles Level of income in order from lowest to highest in 20% blocks.
Relative Low Income Income below 60% of the median income
Relative Poverty Standard Referred to within the States of Jersey as relative low income.
Self-Selecting Survey Survey process that allows anyone who is interested to respond
Social Insurance contributions 6% of gross earnings go to Social Security,
SSD Social Security Department
Special payments One-off payments to help cover the costs of emergencies.
Tapers Fixed percentage deduction of benefit due to earned income after disregards.
Weighting Specification of the relative importance of items when combined.

Review of Benefit Levels
120

Review of Benefit Levels
121
Appendix 1

Review of Benefit Levels
122

Review of Benefit Levels
123
Appendix 2
Note from Social Security explaining HMAs
Response to Scrutiny Query on HMAs
It is important to emphasise that the HMA is not actually a benefit, but a means of administration to allow direct payment to the GP of the co-payment cost of their fees. Its introduction was a direct consequence of those on the legacy benefit of HIE not being accustomed to budgeting for GP fees.
Under Income Support, many people receive additional support with their GP fees through Clinical Cost components, which are provided to individuals on the basis of specific clinical need.The HMA itself provides no additional funding for GP costs; it is just a payment mechanism. The number of active HMAs is not an indicator of the number of people receiving financial assistance with healthcare costs.
New HMAs are available if an individual is not able to manage their money (and has no-one to assist them) or there is a specific reason (often health related) why an HMA is needed to ensure that the individual visits the GP on a regular basis. These individuals are identified through a case worker or directly by the Department or a GP.
HMAs are also set up for people entering residential care where the care fees are being met in full i.e. the individual has no other monies with which to pay the doctor. The HMA is used as the route of payment, rather than request these individuals, or rather their GPs, to submit bills each time the individual has a consultation i.e. it is less bureaucratic.
The expenditure through the HMA can indicate where someone may need more, or less, assistance with GP fees. As part of the transition from former benefits, all previous recipients of HIE received a Clinical Cost component automatically. But HIE was not assessed on clinical need (it was just a means test), so the transition resulted in some people receiving money for GP visits when they did not have any ongoing clinical need.
Ongoing review of HMAs ensures that Clinical Cost components are set at the correct level and that HMA deductions are not being taken inappropriately. A number of HMAs have been closed where a high credit balance has built up because individuals have had very few doctors’ visits. In this case, the HMA deductions cease allowing the claimant to allocate this money to other household needs. The majority of people on Income Support are capable of managing their own money and this includes intermittent healthcare costs. HMAs will also be closed as part of day to day business as families move out of Income Support.
When an HMA is closed, the household receives a letter confirming that they will now be required to pay their GP co-payment in full.
If an HMA is identified with a high debit balance, the household may be entitled to an additional clinical cost component or a special payment, to supplement their ongoing entitlement.
On 28/1/2008 there were 2,748 households with an active HMA. At 31/12/2010 there were 2,135 active HMAs.

Review of Benefit Levels
124