Health, Safety, and Nutrition for the Young Child, 8th...
21
Australia • Brazil • Japan • Korea • Mexico • Singapore • Spain • United Kingdom • United States Health, Safety, and Nutrition for the Young Child Eighth Edition Lynn R. Marotz, RN, Ph.D. University of Kansas Copyright 2010 Cengage Learning. All Rights Reserved. May not be copied, scanned, or duplicated, in whole or in part. Due to electronic rights, some third party content may be suppressed from the eBook and/or eChapter(s). Editorial review has deemed that any suppressed content does not materially affect the overall learning experience. Cengage Learning reserves the right to remove additional content at any time if subsequent rights restrictions require it.
Transcript of Health, Safety, and Nutrition for the Young Child, 8th...

Australia • Brazil • Japan • Korea • Mexico • Singapore • Spain • United Kingdom • United States
Health, Safety, and Nutrition for the Young Child
Eighth Edition
Lynn R. Marotz, RN, Ph.D.
University of Kansas
Copyright 2010 Cengage Learning. All Rights Reserved. May not be copied, scanned, or duplicated, in whole or in part. Due to electronic rights, some third party content may be suppressed from the eBook and/or eChapter(s).
Editorial review has deemed that any suppressed content does not materially affect the overall learning experience. Cengage Learning reserves the right to remove additional content at any time if subsequent rights restrictions require it.

© 2012, 2009 Wadsworth, Cengage Learning
ALL RIGHTS RESERVED. No part of this work covered by the copyright herein may be reproduced, transmitted, stored, or used in any form or by any means graphic, electronic, or mechanical, including but not limited to photocopying, recording, scanning, digitizing, taping, Web distribution, information networks, or information storage and retrieval systems, except as permitted under Section 107 or 108 of the 1976 United States Copyright Act, without the prior written permission of the publisher.
Library of Congress Control Number: 2010925892
Student EditionISBN-13: 978-1-111-29837-1ISBN-10: 1-111-29837-8
Loose-leaf Edition:ISBN-13: 978-1-111-35580-7 ISBN-10: 1-111-35580-0
Wadsworth20 Davis DriveBelmont, CA 94002-3098USA
Cengage Learning is a leading provider of customized learning solutions with office locations around the globe, including Singapore, the United Kingdom, Australia, Mexico, Brazil, and Japan. Locate your local office at www.cengage.com/global.
Cengage Learning products are represented in Canada by Nelson Education, Ltd.
To learn more about Wadsworth, visit www.cengage.com/wadsworth
Purchase any of our products at your local college store or at our preferred online store www.cengagebrain.com.
Health, Safety, and Nutrition for the Young Child, Eighth EditionLynn R. Marotz
Executive Publisher: Linda Schreiber-Ganster
Executive Editor: Mark D. Kerr
Senior Developmental Editor: Lisa Mafrici
Assistant Editor: Beckie Dashiell
Media Editor: Media Editor: Elizabeth Momb
Editorial Assistant: Genevieve Allen
Marketing Manager: Kara Kindstrom
Marketing Assistant: Dimitri Hagnéré
Marketing Communications Manager: Tami Strang
Content Project Manager: Samen Iqbal
Art Director: Maria Epes
Print Buyer: Mary Beth Hennebury
Rights Acquisitions Specialist: Don Schlotman
Production Service: Lindsay Schmonsees, MPS Limited, a Macmillan Company
Text and Cover Designer: tani hasegawa
Photo Researcher: Scott Rosen, Bill Smith Group
Text Researcher: Sarah D’Stair
Copy Editor: Cathy Albano
Cover Image: Diana Ong/SuperStock/Getty Images
“Girl biting an orange” image: Meg Takamura/IZA Stock/Getty Images
Compositor: MPS Limited, a Macmillan Company
Printed in Canada1 2 3 4 5 6 7 14 13 12 11 10
For product information and technology assistance, contact us atCengage Learning Customer & Sales Support, 1-800-354-9706.
For permission to use material from this text or product,submit all requests online at www.cengage.com/permissions.
Further permissions questions can be e-mailed to [email protected].
Copyright 2010 Cengage Learning. All Rights Reserved. May not be copied, scanned, or duplicated, in whole or in part. Due to electronic rights, some third party content may be suppressed from the eBook and/or eChapter(s).
Editorial review has deemed that any suppressed content does not materially affect the overall learning experience. Cengage Learning reserves the right to remove additional content at any time if subsequent rights restrictions require it.

318
Nutritional Guidelines
�� NAEYC Standards Chapter Links
� #1 a, b, and c: Promoting child development and learning
� #2 a and c: Building family and community relationships
� #3 a, b, c, and d: Observing, documenting, and assessing to support young children and
families
� #6 b, c, and e: Becoming a professional
�� Learning Objectives
After studying this chapter, you should be able to:
� Outline the steps for evaluating the nutrient content of a meal or meals.
� Use the Dietary Guidelines for Americans to achieve your personal nutritional goals.
� Classify foods according to the Food Guide Pyramid and identify the nutrient strengths of
each major food group.
� Evaluate the nutritional quality of a food item from its package label.
Diet has a direct effect on the quality of a person’s health and well-being. It is also important
to note that all persons throughout life require the same nutrients, but in varying amounts.
Young children have a significant need for nutrients that support growth and provide energy; older
children and adults require nutrients to maintain and repair body tissue and to provide energy.
To teach healthy food habits, teachers and families must first set a good example. Children
typically model the eating behaviors of adults they love and admire. To set a positive example,
adults must be knowledgeable about basic nutrition and understand how to maintain healthy eat-
ing habits. The ability to apply this knowledge to the care of children will, it is hoped, follow.
Nutrition is the study of food and how it is used by the body. Nutritionists study foods because
foods contain nutrients, which are chemical substances that serve specific purposes. Nutrients
meet the body’s need for:
� sources of energy
� materials for growth and maintenance of body tissue
� regulation of body processes
CHAPTER
12
nutrition – the study of food and how it is used by the body.
nutrients – the components or substances that are found in food.
Copyright 2010 Cengage Learning. All Rights Reserved. May not be copied, scanned, or duplicated, in whole or in part. Due to electronic rights, some third party content may be suppressed from the eBook and/or eChapter(s).
Editorial review has deemed that any suppressed content does not materially affect the overall learning experience. Cengage Learning reserves the right to remove additional content at any time if subsequent rights restrictions require it.

Chapter 12 Nutritional Guidelines 319
Table 12–1 shows the relationship between nutrients and their functions. Note that most
nutrients serve one or two primary functions; however, protein plays a critical role in all three.
Nutrients are needed in adequate amounts for normal body function to take place. An inad-
equate supply or poor utilization of nutrients may lead to malnutrition or undernutrition and
result in abnormal body function and poor general health. Malnutrition may also result from exces-
sive intake of one or more nutrients to the exclusion of others. This, too, may interfere with normal
body functions and contribute to health problems. For example, there is currently much concern
about excessive consumption of dietary fats and cholesterol and of self-supplementation with
specific minerals and vitamins.
Approximately 50 nutrients are known to be essential for humans. An essential nutrient is
one that must be provided by food substances, as the body is unable to manufacture it in adequate
amounts. Persons of all ages require the same essential nutrients, only in different amounts. Fac-
tors such as age, activity, gender, health status, and lifestyle determine how much of a particular
nutrient is required. Information regarding the amounts of nutrients found in specific foods can be
found online (http://www.nal.usda.gov/fnic/foodcomp/search) and in many books.
A healthful diet is based on a daily intake of nutritious foods and meals. What should we eat?
What should we not eat? How much should we eat? The answers to these important questions have
led to the development of a number of nutritional tools and guidelines. Each provides information
that will promote healthful eating habits; the choice lies with the individual and may depend on the
time available, the ease of use, and personal interest.
Regardless of the guideline selected, the common factor necessary for optimum nutrition is
the inclusion of a wide variety of foods. Some foods contain many nutrients, while others yield only
a few. No single food includes enough of all nutrients to support life. Thus, consuming a diet that
includes a variety of foods improves the likelihood that all essential nutrients will be obtained.
�� Dietary Reference Intakes (DRIs)The “master guideline” for nutrition planning in the United States and Canada is the Dietary Ref-erence Intakes (DRIs). The latest revision of this plan reflects major changes in the format and
philosophy of the original 1941 document known as the Recommended Daily Dietary Allowances
Calories per Gram
EnergyBuild/Maintain Body Tissues
Regulators
Carbohydrates 4 X
Fats 9 X
Proteins (needed for every function)
4 X X X
Minerals X X
Water X X
Vitamins X*
* required in a regulatory role only.
Table 12–1 Nutrients and Their Roles
malnutrition – prolonged inadequate or excessive intake of nutrients and/or calories required by the body.
undernutrition – an inadequate intake of one or more required or essential nutrients.
essential nutrient – nutrient that must be provided in food because it cannot be synthesized by the body at a rate
sufficient to meet the body’s needs.
Dietary Reference Intake (DRI) – a plan that presents the recommended goals of nutrient intakes for various age
and gender groups.
Copyright 2010 Cengage Learning. All Rights Reserved. May not be copied, scanned, or duplicated, in whole or in part. Due to electronic rights, some third party content may be suppressed from the eBook and/or eChapter(s).
Editorial review has deemed that any suppressed content does not materially affect the overall learning experience. Cengage Learning reserves the right to remove additional content at any time if subsequent rights restrictions require it.

320 UNIT 3 Foods and Nutrients: Basic Concepts
(RDAs). Emphasis is now placed on the relationship between dietary intake, health, and the
reduced risk of chronic disease. The updated guideline, released over a period of several years, is
presented as four components. Table 12–2 illustrates the first two portions of the document. The
DRIs consist of:
� Recommended Daily Allowance (RDA)—goals for nutrient intake by individuals.
� Adequate Intake (AI)—goals for nutrient intake when an RDA has not been determined.
� Estimated Average Requirement (EAR)—amount of a nutrient that is estimated to meet the
requirements of 50 percent of the individuals in a given life-stage or gender group; this num-
ber is used to establish the RDAs.
� Tolerable Upper Intake Level (UL)—the highest intake level that is likely to pose no health
risk; exceeding this limit could cause potential toxicity and health risks.
The DRIs are used to set national nutritional policy as well as for assessing the nutrient intakes
of individuals/groups and planning diets for individuals/groups (Wiener et al., 2009). They are also
used for determining the nutrient information present on food labels (Miller et al., 2009; Taylor,
2009). It is suggested that RDAs, AIs, and ULs be used in planning diets for individuals, while the
EAR is more useful in planning for groups. EARs are believed to be important in the nutrient intake
assessment of individuals and groups (Clark & Fox, 2009).
For the Dietary Reference Intake guidelines to be meaningful, the nutrient content of foods
must be known (see www.nal.usda.gov/fnic/foodcomp/search). To evaluate a diet by means of the
Dietary Reference Intake guidelines, the following steps are required:
1. List the amounts of all foods and beverages consumed during one 24-hour period.
2. Use nutrient value tables or a computer software program to determine the nutrient con-
tent of each food and beverage consumed.
3. Total the amount of each nutrient consumed during the day.
4. Determine if the amount of nutrients consumed is sufficient by comparing the total amount
of each nutrient consumed with the Dietary Reference Intake for the appropriate age and
gender group (Table 12–2).
�� Dietary Guidelines for AmericansThe National Nutrition Monitoring and Related Research Act of 1990 requires the Secretaries of
Health and Human Services (HHS) and the U.S. Department of Agriculture (USDA) to issue a joint
report, called the Dietary Guidelines for Americans, at least every 5 years. The new 2010 Dietary
Guidelines for Americans reflect the Advisory Committee’s efforts to establish recommendations
based on current scientific evidence regarding nutrition’s role in health maintenance and disease
prevention. This document is available online (http://www.dietaryguidelines.gov).
The Dietary Guidelines have come to serve as the basis for nearly all nutrition information in
the United States (USDA, 2010). While the Dietary Reference Intakes (DRIs) address only specific
nutrients, the Dietary Guidelines focus on eating and activity behaviors and their impact on the
health of persons 2 years of age and older. Key recommendations include:
� Adequate nutrients within calorie needs—including a wide variety of nutrient-dense
foods in one’s diet while limiting fats, cholesterol, sugars, salt, and alcohol.
� Weight management—maintaining a healthy balance of calories consumed ( food and bever-
ages) with calories burned through physical activity to lower the risk of becoming overweight or
obese.
Dietary Guidelines for Americans – a report that provides recommendations for daily food choices, to be balanced with physi-
cal activity, to promote good health and reduce certain disease risks.
Copyright 2010 Cengage Learning. All Rights Reserved. May not be copied, scanned, or duplicated, in whole or in part. Due to electronic rights, some third party content may be suppressed from the eBook and/or eChapter(s).
Editorial review has deemed that any suppressed content does not materially affect the overall learning experience. Cengage Learning reserves the right to remove additional content at any time if subsequent rights restrictions require it.

Chapter 12 Nutritional Guidelines 321
Lif
e S
tag
e G
rou
pV
it A
(μ
g/d
)a
Vit
C
(mg
/d)
Vit
D
(μg
/d)b,
c
Vit
E
(mg
/d)d
Vit
K
(μg
/d)
Th
iam
in
(mg
/d)
Rib
ofl
avin
(m
g/d
)N
iaci
n
(mg
/d)e
Vit
B6
(mg
/d)
Fola
te
(μg
/d)f
Vit
B12
(μ
g/d
)
Pa
nto
- th
enic
Aci
d
(mg
/d)
Bio
tin
(μ
g/d
)C
ho
lin
eg
(mg
/d)
Infa
nts
0–6
mo
400*
40*
5*
4* 2
.0*
0.2*
0.3*
2*0.
1*65
*0.
4*1.
7* 5
*12
5*
7–12
mo
500*
50*
5*
5* 2
.5*
0.3*
0.4*
4*0.
3*80
*0.
5*1.
8* 6
*15
0*
Ch
ild
ren
1–3
y30
015
5*
6 3
0*0.
50.
56
0.5
150
0.9
2* 8
*20
0*
4–8
y40
025
5*
7 5
5*0.
60.
68
0.6
200
1.2
3*12
*25
0*
Ma
les
9–13
y60
045
5*
11 6
0*0.
90.
912
1.0
300
1.8
4*20
*37
5*
14–1
8 y
900
75 5
*15
75*
1.2
1.3
161.
340
02.
45*
25*
550*
19–3
0 y
900
90 5
*15
120*
1.2
1.3
161.
340
02.
45*
30*
550*
31–5
0 y
900
90 5
*15
120*
1.2
1.3
161.
340
02.
45*
30*
550*
51–7
0 y
900
9010
*15
120*
1.2
1.3
161.
740
02.
4i5*
30*
550*
70 y
900
9015
*15
120*
1.2
1.3
161.
740
02.
4i5*
30*
550*
Fem
ale
s
9–13
y60
045
5*
11 6
0*0.
90.
912
1.0
300
1.8
4*20
*37
5*
14–1
8 y
700
65 5
*15
75*
1.0
1.0
141.
240
0i2.
45*
25*
400*
19–3
0 y
700
75 5
*15
90*
1.1
1.1
141.
340
0i2.
45*
30*
425*
31–5
0 y
700
75 5
*15
90*
1.1
1.1
141.
340
0i2.
45*
30*
425*
51–7
0 y
700
7510
*15
90*
1.1
1.1
141.
540
02.
4h5*
30*
425*
70 y
700
7515
*15
90*
1.1
1.1
141.
540
02.
4h5*
30*
425*
Ta
ble
12
–2
Die
tary
Re
fere
nce
In
tak
es (
DR
Is):
Rec
om
men
ded
In
tak
es f
or
Ind
ivid
ua
ls
(con
tinu
ed)
Copyright 2010 Cengage Learning. All Rights Reserved. May not be copied, scanned, or duplicated, in whole or in part. Due to electronic rights, some third party content may be suppressed from the eBook and/or eChapter(s).
Editorial review has deemed that any suppressed content does not materially affect the overall learning experience. Cengage Learning reserves the right to remove additional content at any time if subsequent rights restrictions require it.

322 UNIT 3 Foods and Nutrients: Basic Concepts
Lif
e S
tag
e G
rou
pV
it A
(μ
g/d
)a
Vit
C
(mg
/d)
Vit
D
(μg
/d)b,
c
Vit
E
(mg
/d)d
Vit
K
(μg
/d)
Th
iam
in
(mg
/d)
Rib
ofl
avin
(m
g/d
)N
iaci
n
(mg
/d)e
Vit
B6
(mg
/d)
Fola
te
(μg
/d)f
Vit
B12
(μ
g/d
)
Pa
nto
- th
enic
Aci
d
(mg
/d)
Bio
tin
(μ
g/d
)C
ho
lin
eg
(mg
/d)
Pre
gn
an
cy
14–1
8 y
750
805*
1575
*1.
41.
418
1.9
600j
2.6
6*30
*45
0*
19–3
0 y
770
855*
1590
*1.
41.
418
1.9
600j
2.6
6*30
*45
0*
31–5
0 y
770
855*
1590
*1.
41.
418
1.9
600j
2.6
6*30
*45
0*
La
cta
tio
n
14–1
8 y
1,20
011
55*
1975
*1.
41.
617
2.0
500
2.8
7*35
*55
0*
19–3
0 y
1,30
012
05*
1990
*1.
41.
617
2.0
500
2.8
7*35
*55
0*31
–50
y1,
300
120
5*19
90*
1.4
1.6
172.
050
02.
87*
35*
550*
Not
e: T
his
tabl
e (t
aken
fro
m t
he D
RI r
epor
ts, s
ee w
ww
.nap
.edu
) pre
sent
s R
ecom
men
ded
Die
tary
Allo
wan
ces
(RD
As)
in b
old
type
and
Ade
quat
e In
take
s (A
Is) i
n or
dina
ry t
ype
follo
wed
by
an a
ster
isk(
*). R
DA
s an
d A
Is m
ay b
oth
be u
sed
as g
oals
for
indi
vidu
al in
take
. RD
As
are
set t
o m
eet t
he n
eeds
of a
lmos
t all
(97
to 9
8 pe
rcen
t) in
divi
dual
s in
a g
roup
. Fo
r he
alth
y br
east
fed
infa
nts,
the
AI i
s th
e m
ean
inta
ke. T
he A
I for
oth
er li
fe s
tage
and
gen
der
grou
ps is
bel
ieve
d to
cov
er n
eeds
of a
ll in
divi
dual
s in
the
gro
up, b
ut la
ck o
f dat
a or
un
cert
aint
y in
the
dat
a pr
even
t bei
ng a
ble
to s
peci
fy w
ith
confi
den
ce t
he p
erce
ntag
e of
indi
vidu
als
cove
red
by t
his
inta
ke.
a A
s re
tinol
act
ivit
y eq
uiva
lent
s (R
AEs
). 1
RA
E�1
μg r
etin
ol, 1
2 μg
�-c
arot
ene,
24
μg �
-car
oten
e, o
r 24
μg
�-c
rypt
oxan
thin
. The
RA
E fo
r di
etar
y pr
ovit
amin
A c
arot
enoi
ds is
tw
ofol
d gr
eate
r th
an r
etin
ol e
quiv
alen
ts (R
E), w
here
as t
he R
AE
for
perf
orm
ed v
itam
in A
is t
he s
ame
as R
E.b A
s ch
olec
alci
fero
l, 1
μg c
hole
calc
ifer
ol �
40
IU v
itam
in D
.c I
n th
e ab
senc
e of
ade
quat
e ex
posu
re t
o su
nlig
ht.
d As
�-t
ocop
hero
l. �
-Toc
ophe
rol i
nclu
des
RRR-
�-t
ocop
hero
l, th
e on
ly f
orm
of �
-toc
ophe
rol t
hat o
ccur
s na
tura
lly in
foo
ds, a
nd t
he 2
R-st
ereo
isom
eric
for
ms
of �
-toc
ophe
rol (
RRR-
, RS
R-, R
RS-�
-toc
ophe
rol)
that
occ
ur in
for
tifi e
d fo
ods
and
supp
lem
ents
. It d
oes
not i
nclu
de t
he 2
S-s
tere
oiso
mer
ic f
orm
s of
�-t
ocop
hero
l (SR
R-, S
SR-,
SRS-
, and
SSS
-�-t
ocop
hero
l),
also
fou
nd in
for
tifi e
d fo
ods
and
supp
lem
ents
.e A
s ni
acin
equ
ival
ents
(NE)
. 1 m
g of
nia
cin
� 6
0 m
g of
try
ptop
han;
0–6
mon
ths
= p
erfo
rmed
nia
cin
(not
NE)
.f A
s di
etar
y fo
late
equ
ival
ents
(DFE
). 1
DFE
� 1
μg
food
fol
ate
= 0
.6 μ
g of
fol
ic a
cid
from
for
tifi e
d fo
od o
r as
a s
uppl
emen
t con
sum
ed w
ith
food
= 0
.5 μ
g of
a s
uppl
emen
t tak
en o
n an
em
pty
stom
ach.
g Alt
houg
h A
Is h
ave
been
set
for
cho
line,
the
re a
re f
ew d
ata
to a
sses
s w
heth
er a
die
tary
sup
ply
of c
holin
e is
nee
ded
at a
ll st
ages
of t
he li
fe c
ycle
, and
it m
ay b
e th
at t
he c
holin
e re
quir
emen
t can
be
met
by
endo
geno
us s
ynth
esis
at s
ome
of t
hese
sta
ges.
h B
ecau
se 1
0 to
30
perc
ent o
f old
er p
eopl
e m
ay m
alab
sorb
foo
d-bo
und
B12
, it i
s ad
visa
ble
for
thos
e ol
der
than
50
year
s to
mee
t the
ir R
DA
mai
nly
by c
onsu
min
g fo
ods
fort
ifi ed
wit
h B
12 o
r a
supp
lem
ent c
onta
inin
g B
12.
i In
view
of e
vide
nce
linki
ng f
olat
e in
take
wit
h ne
ural
tube
def
ects
in t
he f
etus
, it i
s re
com
men
ded
that
all
wom
en c
apab
le o
f bec
omin
g pr
egna
nt c
onsu
me
400
μg f
rom
su
pple
men
ts o
r fo
rtifi
ed f
oods
in a
ddit
ion
to in
take
of f
ood
fola
te f
rom
a v
arie
d di
et.
j It i
s as
sum
ed t
hat w
omen
will
con
tinue
con
sum
ing
400
μg f
rom
sup
plem
ents
or
fort
ifi ed
foo
d un
til t
heir
pre
gnan
cy is
con
fi rm
ed a
nd t
hey
ente
r pr
enat
al c
are,
whi
ch o
rdin
arily
oc
curs
aft
er t
he e
nd o
f the
per
icon
cept
iona
l per
iod—
the
crit
ical
tim
e fo
r fo
rmat
ion
of t
he n
eura
l tub
e.C
opyr
ight
200
4 by
the
Nat
iona
l Aca
dem
y of
Sci
ence
s. A
ll ri
ghts
res
erve
d.So
urce
: Die
tary
Ref
eren
ce In
take
s (D
RIs
): R
ecom
men
ded
Inta
kes
for
Indi
vidu
al V
itam
ins,
Foo
d an
d N
utri
tion
, 200
6. R
epri
nted
wit
h pe
rmis
sion
of t
he N
atio
nal A
cade
my
of
Sci
ence
s, c
ourt
esy
of t
he N
atio
nal A
cade
mie
s P
ress
, Was
hing
ton,
D.C
.
Ta
ble
12
–2
Die
tary
Re
fere
nce
In
tak
es (
DR
Is):
Rec
om
men
ded
In
tak
es f
or
Ind
ivid
ua
ls (
cont
inue
d)
Copyright 2010 Cengage Learning. All Rights Reserved. May not be copied, scanned, or duplicated, in whole or in part. Due to electronic rights, some third party content may be suppressed from the eBook and/or eChapter(s).
Editorial review has deemed that any suppressed content does not materially affect the overall learning experience. Cengage Learning reserves the right to remove additional content at any time if subsequent rights restrictions require it.

Chapter 12 Nutritional Guidelines 323
� Physical activity—participating in some form of physical activity each day. The Ameri-
can Academy of Pediatrics (AAP), National Association for Sport & Physical Education
(NASPE), and Canadian Academy of Sport Medicine (CASM) support this recommendation
and encourage children of all ages to engage in moderate to vigorous activity daily (AHA,
2009; NASPE, 2009; CDC, 2008) (Figure 12–1). Excess weight and a sedentary lifestyle have
been linked to many chronic diseases. Teachers have a responsibility to plan appropriate
physical activities for children and to model their own enjoyment and participation in these
activities.
� Food groups to encourage—consuming more fruits, vegetables, whole grain products, and
low-fat dairy products is strongly encouraged. Many children’s diets fail to include adequate
servings of these foods, which can result in deficiencies of vitamins, minerals, and other
nutrients essential for healthy growth and development (Dave et al., 2009; Horodynski et al.,
2009). Adults are also encouraged to increase their consumption of fruits, vegetables, whole-
grain products and to select fat-free or low-fat dairy products. Whole grains are an excellent
source of fiber and other nutrients essential to a balanced diet and are also low in fat. Fruits
and vegetables are rich sources of many vitamins and minerals and are also naturally high
in fiber.
� Fats—high fat intake is associated with the development of some chronic diseases and,
when combined with minimal physical activity, can promote obesity. Total fat intake should
be limited to no more than 20–30 percent of one’s daily calories. Less than 10 percent of these
calories should come from saturated (animal) fats. Cholesterol intake should be limited to
less than 300 mg per day. Meat and dairy products should be low-fat and trans-fats avoided
in all processed foods.
� Carbohydrates—are an important source of energy and fiber. However, foods high in added
refined sugar should be limited. Adequate servings of fruits, vegetables, and whole grain
products should be included each day.
� Sodium and potassium—reducing high sodium (salt) and low potassium intake to address
the increasing incidence of high blood pressure in this country. Although sodium is essential
for life, most people obtain enough from their food without adding extra salt. Sodium intake
should be limited to no more than 1500-2000 mg (approximately 3/4 teaspoon) or less each
day. Fruits, vegetables, and whole grains in their simplest forms contain little sodium and
are ideal for including in one’s diet; many are also rich sources of potassium. Most processed
foods, canned and fast foods are quite high in sodium and salt and, thus, their consumption
should be limited.
� Alcoholic beverages—persons who choose to consume alcohol should do so in moderation
(one drink/day for women, two drinks/day for men). Women who are pregnant or breast-
feeding should avoid alcohol.
The American Academy of Pediatrics (AAP), National Association for Sport & Physical Edu-
cation (NASPE), and Canadian Academy of Sport Medicine (CASM) encourage daily physical
activity for children of all ages:
– infants should have ample opportunities to explore their environment and should not
be confined to a stroller or carrier for longer than 60 minutes/day.
– toddlers should accumulate at least 30 minutes of structured, vigorous physical activity
and at least 60 minutes or more of free play.
– preschoolers and school-age children should participate in at least 60 minutes of
structured physical activity during the day. They should also be given opportunities to
engage in several hours of unstructured physical activity.
Figure 12–1 Physical activity recommendations for children.
Copyright 2010 Cengage Learning. All Rights Reserved. May not be copied, scanned, or duplicated, in whole or in part. Due to electronic rights, some third party content may be suppressed from the eBook and/or eChapter(s).
Editorial review has deemed that any suppressed content does not materially affect the overall learning experience. Cengage Learning reserves the right to remove additional content at any time if subsequent rights restrictions require it.

324 UNIT 3 Foods and Nutrients: Basic Concepts
� Food safety—young children are at a higher risk for food-borne illnesses. Washing hands,
keeping food preparation areas clean, cooking food to proper temperatures, storing foods in
proper refrigeration, and following instructions on food labels are important steps for reduc-
ing the risk of food-borne illness.
Canada has developed similar guidelines, entitled Canada’s Food Guide. The newest version
of this document was released in 2007 and encourages citizens to follow healthy eating patterns.
A companion document, Canada’s Physical Activity Guide to Healthy Active Living, stresses the
importance of establishing daily activity practices.
Other Nutrition GuidelinesThe U.S. Public Health Service continues to update the original Healthy People guidelines. Several
statements in the Healthy People 2020 document that specifically address children’s nutritional
needs are:
� eliminating very low food insecurity among children in U.S. households
� reducing the proportion of children who are overweight or obese
� increasing the contribution of fruits, vegetables, whole grains, and calcium to the diets of
children 2 years and older
� reducing the consumption of calories from solid fats and added sugars in the population
aged 2 years and older
� increasing the proportion of States and school districts that require regularly scheduled
elementary school recess
� increasing the proportion of consumers who follow key food safety practices
Several non-profit organizations, including the American Heart Association and the National
Cancer Institute, also advise similar healthy eating and physical activity behaviors. Their guidelines
call for reducing fat, cholesterol, sodium, and alcohol in the diet and increasing vegetable, fruit, and
whole grain consumption.
�� The Food Guide PyramidThe Food Guide Pyramid provides a graphic illustration of the Dietary Guidelines for Americans
(Figure 12–2). It emphasizes the importance of consuming a wide variety of foods from each food
group and recommends intakes that are flex-
ible for individuals of different ages, gender, and
activity levels. The vertical stripes represent
each of the essential food groups:
Figure 12–2 MyPyramid is an interactive, web-based tool designed to promote healthy eating and activity habits.
� orange for grains
� green for vegetables
� red for fruits
� yellow for oils
� blue for milk
� purple for meats and beans
The Pyramid conveys the importance of
consuming a meal pattern that includes a wide
variety of foods (represented by the various
color bands) and moderation of eating that is
balanced with physical activity. The varying
widths of the Pyramid’s stripes indicate the
Copyright 2010 Cengage Learning. All Rights Reserved. May not be copied, scanned, or duplicated, in whole or in part. Due to electronic rights, some third party content may be suppressed from the eBook and/or eChapter(s).
Editorial review has deemed that any suppressed content does not materially affect the overall learning experience. Cengage Learning reserves the right to remove additional content at any time if subsequent rights restrictions require it.

Chapter 12 Nutritional Guidelines 325
relative proportion of food from each food group that should be included in one’s diet each day.
The interactive website (http://www.mypyramid.gov) offers weekly menus and allows individu-
als to plan, record, and monitor their daily food intake and activity levels (USDA, 2005).
GrainsFoods such as breads, breakfast cereals, pastas, and rice make up the Grains group. Food choices
from this group provide complex carbohydrates and should be whole grain or enriched grain prod-
ucts. Whole grain products retain all of their original nutrients and are an ideal source of fiber.
Enriched breads and cereals are products that have been processed and then fortified with specific
amounts of certain vitamins and minerals equivalent to those found in the original whole grain.
Nutrients that are commonly added to enriched foods include iron, calcium, thiamin, riboflavin,
and niacin. Most grain products today are also fortified with folacin ( folic acid), which reduces
the incidence of spina bifida, cleft lip, and cleft palate birth defects (Massi et al., 2009; Thompson,
Cole, & Ray, 2009).
A typical serving from the Grain group consists of one slice of bread, one cup of dry, ready-to-
eat cereal, or one-half cup of cooked rice, cereal, or pasta. As with the other food groups, a child’s
serving is approximately one-half the size of the adult serving. The Pyramid plan recommends that
adults consume a minimum of 6 ounces of grain products daily; children require 3 to 4 ounces. At
least half of the servings should be whole grain.
VegetablesThe Vegetable group contributes notable amounts of minerals, vitamins, and fiber to a person’s diet
and also represents a wide range and variety of color, flavor, and food options. Daily choices should
include dark green vegetables such as broccoli and leafy greens as well as orange-colored foods
such as sweet potatoes, squash, and carrots, which are rich in vitamin A (Table 12–3). The Pyramid
plan recommends that adults consume 2½ cups of vegetables every day (based on a 2,000-calorie
intake); children need only 1 to 1½ cups depending on their age.
The Food Guide Pyramid, developed by the U.S. Department of Agriculture, was initially designed as a teaching tool to be used in conjunction with the Dietary Guidelines for Americans. Although the Dietary Guidelines are reviewed and updated every 5 years, the original Pyramid had not been re-evaluated since it was first released. The current Pyramid continues to raise questions regarding some of the nutritional recommendations that it promotes. For example, one such criticism suggests that the Pyramid recommendations for the Milk group may be too high (Mitka, 2005). Others have criticized the heavy emphasis on a meat-based diet and the difficulty of using the Pyramid when advising children who follow a vegetarian dietary pattern (Renda & Fischer, 2009).
� What additional criticisms of the Food Guide Pyramid might legitimately be raised?
� Would you consider the Food Guide Pyramid to be an effective guideline for healthy eating given the increasing rates of child and adult obesity?
� How might you change the Pyramid (e.g., design, nutritional information) to make it a more effective consumer education tool?
Food Guide PyramidIssues To Consider
Copyright 2010 Cengage Learning. All Rights Reserved. May not be copied, scanned, or duplicated, in whole or in part. Due to electronic rights, some third party content may be suppressed from the eBook and/or eChapter(s).
Editorial review has deemed that any suppressed content does not materially affect the overall learning experience. Cengage Learning reserves the right to remove additional content at any time if subsequent rights restrictions require it.

326 UNIT 3 Foods and Nutrients: Basic Concepts
The health benefits of dietary fiber are receiving increased attention, yet many children fail
to consume adequate fiber because their fruit and vegetable intake is often limited (Anderson
et al., 2009). However, a child’s diet that includes too much fiber can interfere with the absorp-
tion of essential vitamins and minerals. A practical recommendation for fiber intake for chil-
dren over 2 years of age is the “age plus 5” rule. For example, Tasha, age 3 years, would require
8 grams of fiber/day. A sampling of food sources and their fiber contribution is presented in
Table 12–4.
FruitsThe Fruit group is a major contributor of vitamins, especially vitamins A and C, and fiber. At least
one vitamin C-rich and one vitamin A-rich selection should be included in an individual’s diet every
day (Table 12–5 and Table 12–3).
OilsThe thin yellow line on the Pyramid represents the Oils group. This group consists of fats that
are liquid at room temperature, such as the vegetable (plant) oils (canola, corn, cottonseed, olive,
cantaloupe winter squashcarrots greenspumpkin apricotssweet potatoes watermelon*spinach broccoli
*May cause allergic reactions.
Table 12–3 Good to Excellent Vitamin A Sources
Table 12–4 Dietary Fiber Content of Some Common Foods
Food Amount Fiber (gram)
cheerios 1/2 cup 1.5
raisin bran 1/2 cup 2.5
oatmeal 1/4 cup 1.9
macaroni, enriched 1/2 cup 1.3
bread, whole wheat 1/2 slice 0.9
bread, white 1/2 slice 0.6
graham crackers 1 square 0.5
orange sections 1/2 cup 2.2
banana, sliced 1/2 cup 1.9
apple with skin 1/2 cup 1.3
acorn squash 1/4 cup 2.3
green peas 1/4 cup 2.2
corn, frozen 1/4 cup 1.0
pinto beans 1/2 cup 5.5
black beans 1/2 cup 7.5
Copyright 2010 Cengage Learning. All Rights Reserved. May not be copied, scanned, or duplicated, in whole or in part. Due to electronic rights, some third party content may be suppressed from the eBook and/or eChapter(s).
Editorial review has deemed that any suppressed content does not materially affect the overall learning experience. Cengage Learning reserves the right to remove additional content at any time if subsequent rights restrictions require it.
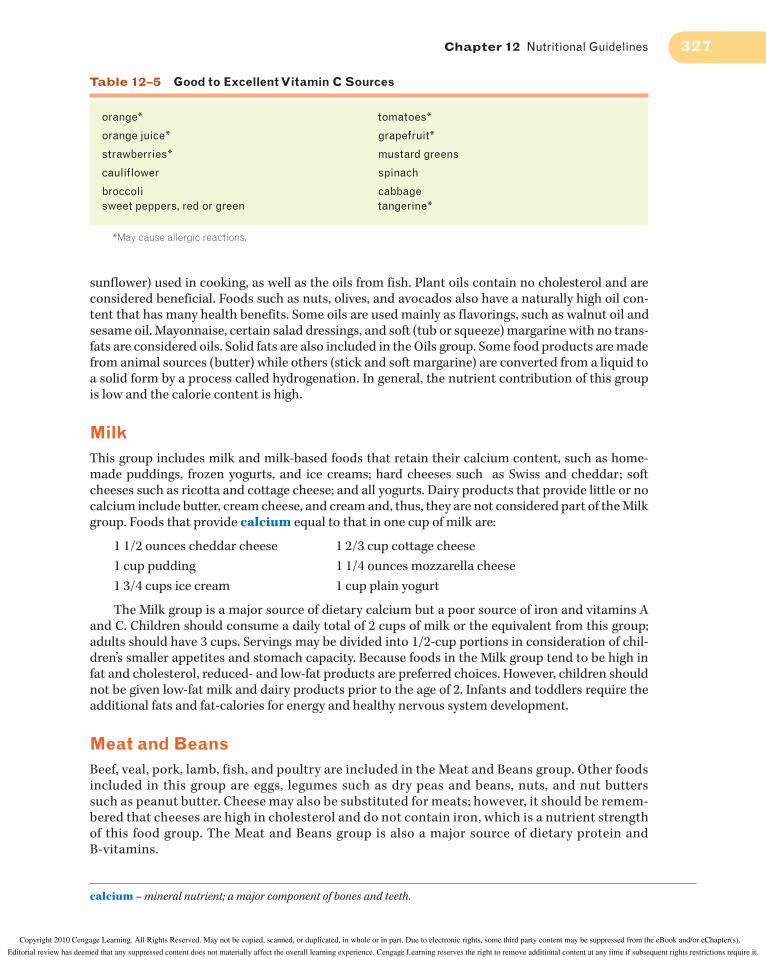
Chapter 12 Nutritional Guidelines 327
sunflower) used in cooking, as well as the oils from fish. Plant oils contain no cholesterol and are
considered beneficial. Foods such as nuts, olives, and avocados also have a naturally high oil con-
tent that has many health benefits. Some oils are used mainly as flavorings, such as walnut oil and
sesame oil. Mayonnaise, certain salad dressings, and soft (tub or squeeze) margarine with no trans-
fats are considered oils. Solid fats are also included in the Oils group. Some food products are made
from animal sources (butter) while others (stick and soft margarine) are converted from a liquid to
a solid form by a process called hydrogenation. In general, the nutrient contribution of this group
is low and the calorie content is high.
MilkThis group includes milk and milk-based foods that retain their calcium content, such as home-
made puddings, frozen yogurts, and ice creams; hard cheeses such as Swiss and cheddar; soft
cheeses such as ricotta and cottage cheese; and all yogurts. Dairy products that provide little or no
calcium include butter, cream cheese, and cream and, thus, they are not considered part of the Milk
group. Foods that provide calcium equal to that in one cup of milk are:
1 1/2 ounces cheddar cheese 1 2/3 cup cottage cheese
1 cup pudding 1 1/4 ounces mozzarella cheese
1 3/4 cups ice cream 1 cup plain yogurt
The Milk group is a major source of dietary calcium but a poor source of iron and vitamins A
and C. Children should consume a daily total of 2 cups of milk or the equivalent from this group;
adults should have 3 cups. Servings may be divided into 1/2-cup portions in consideration of chil-
dren’s smaller appetites and stomach capacity. Because foods in the Milk group tend to be high in
fat and cholesterol, reduced- and low-fat products are preferred choices. However, children should
not be given low-fat milk and dairy products prior to the age of 2. Infants and toddlers require the
additional fats and fat-calories for energy and healthy nervous system development.
Meat and BeansBeef, veal, pork, lamb, fish, and poultry are included in the Meat and Beans group. Other foods
included in this group are eggs, legumes such as dry peas and beans, nuts, and nut butters
such as peanut butter. Cheese may also be substituted for meats; however, it should be remem-
bered that cheeses are high in cholesterol and do not contain iron, which is a nutrient strength
of this food group. The Meat and Beans group is also a major source of dietary protein and
B-vitamins.
orange* tomatoes*
orange juice* grapefruit*
strawberries* mustard greens
cauliflower spinach
broccoli cabbagesweet peppers, red or green tangerine*
*May cause allergic reactions.
Table 12–5 Good to Excellent Vitamin C Sources
calcium – mineral nutrient; a major component of bones and teeth.
Copyright 2010 Cengage Learning. All Rights Reserved. May not be copied, scanned, or duplicated, in whole or in part. Due to electronic rights, some third party content may be suppressed from the eBook and/or eChapter(s).
Editorial review has deemed that any suppressed content does not materially affect the overall learning experience. Cengage Learning reserves the right to remove additional content at any time if subsequent rights restrictions require it.

328 UNIT 3 Foods and Nutrients: Basic Concepts
The recommended daily intake from the Meat and Beans group, as with the other groups, varies
by individual, based on age, gender, and physical activity. Children 2 to 3 years old require approxi-
mately 2-ounce equivalents daily; children 4 and older require 3- to 4-ounce equivalents. The follow-
ing foods contain protein that is approximately equal to that in one ounce of meat, poultry, or fish:
1 egg
1 ounce of cheese
1/4 cup cottage cheese
1/4 cup cooked dried peas or beans
2 tablespoons peanut butter
Discretionary CaloriesFoods consumed from each of the Pyramid
groups provide calories for energy. How many
calories an individual needs to take in varies
according to age, gender, and level of physical
activity. The interactive Food Pyramid offers
tools that help a person determine how many
calories are needed each day (http://www.
mypyramid.gov).
Discretionary calories represent the dif-
ference between the number of calories a per-
son takes in from the recommended servings
in each food group and one’s ideal or target
caloric goal. They can be compared to discre-
tionary income: Just as your budget contains
discretionary or extra income to cover special
expenses like vacation trips or DVDs, your diet
may contain a small number of discretionary
calories that can be “spent” on foods that may be higher in fats, added sugar, and/or alcohol. Per-
sons who are relatively sedentary will have, on the average, between 100–300 discretionary calories
each day depending on the foods they have chosen to consume from each of the food groups.
Adding a large number of foods that contain discretionary calories can dilute the healthful
quality of a person’s diet (Story, 2009; Bachman et al., 2008). For example, the vitamin C and calo-
rie contribution of an apple is altered significantly when sugars, fats, and flour are added, such as
when making an apple pie (Table 12–6).
Calories Potassium Vitamin C
Banana, 1/2 cup sliced 67 268 mg 6.5 mg
Banana chips, 1 ounce 147 152 mg 1.8 mg
Banana pudding, 1/2 cup 72 62 mg 0.3 mg
Banana bread, 1 slice 196 80 mg 1.0 mg
Banana cream pie, 1/8 pie 387 238 mg 2.3 mg
Banana waffle, 1 small round 212 140 mg 1.1 mg
Table 12–6 How Added Sugar and Fats Alter a Food’s Calories and Nutrient Contribution
protein – class of nutrients used primarily for structural and regulatory functions.
Children’s nutrient needs are influenced by age, gender and activity level.
© C
enga
ge L
earn
ing
Copyright 2010 Cengage Learning. All Rights Reserved. May not be copied, scanned, or duplicated, in whole or in part. Due to electronic rights, some third party content may be suppressed from the eBook and/or eChapter(s).
Editorial review has deemed that any suppressed content does not materially affect the overall learning experience. Cengage Learning reserves the right to remove additional content at any time if subsequent rights restrictions require it.

Chapter 12 Nutritional Guidelines 329
�� Food LabelsThe Nutritional Labeling and Education Act, passed in 1990, resulted in significant changes in food
product labeling. The food label, regulated by the Food and Drug Administration (FDA) and the
U.S. Department of Agriculture (USDA), underwent further revision in 1994 (Figure 12–3), which
resulted in the current label format that provides:
� Easy-to-read nutrition information on packaged foods.
� Serving sizes in commonly consumed amounts. This prevents using small serving sizes to
make food products that are high in fat, cholesterol, sodium, or calories look better than
they are.
� A list of all ingredients (in decreasing order relative to the total amount) on their label.
� Percent Daily Values (%DV) that show how a serving of food fits into a total day’s diet.
� Nutrition claims that mean the same on every product (Figure 12–4).
� Voluntary information for the most commonly eaten fresh fruits and vegetables, raw fish,
and cuts of meat. This information may appear on posters or in brochures in the same area
as the food is sold.
Food manufacturers are required to list trans-fats (liquid oils that have been converted into
solid fats, such as margarine) as well as saturated fats and cholesterol on their labels. Food aller-
gens (milk, eggs, tree nuts [such as almonds, walnuts], peanuts, shellfish [such as shrimp, crab,
lobster], fish, wheat, and soy) that could potentially cause life-threatening reactions must also be
identified on food labels (U.S. Food & Drug Administration, 2006). Manufacturers are allowed to
list health claims on their labels, such as “may reduce the risk of heart disease,” as long as there is
scientific evidence to back up the statement.
Calories from FatLabels must also disclose the amounts of fat, saturated fat, trans-fats, and the number of calories
from fat. With this information present (amount of fat and calories from fat), the percent of calories
from fat can easily be determined:
Percent of calories from fat � fat calories/serving
� 100
total calories/serving
To calculate the number of calories from fat, use this formula:
calories from fat � grams (g) of fat/serving � 9 (cal/g)
Reflective Thoughts
The use of the Pyramid as a guide for making healthy food choices requires an understanding that individual foods within a food group can vary greatly in nutrient content relative to sugar, fat, and calories. Choose different foods within a given Pyramid food group and assign them to one of the following categories:
a. unrestricted—eat any amount every day (high nutrient content but low in fat and sugar)
b. moderately restricted—eat only one to three times per day (moderately high in fat and/or sugar)
c. very restricted—eat only two to three times per week (high in fat and/or sugar and calories)
��
Percent Daily Values (%DV) – measures of the nutritional values of food; used in nutrition labeling.
nutrition claims – statements of reduced calories, fat, or salt on the food labels.
Copyright 2010 Cengage Learning. All Rights Reserved. May not be copied, scanned, or duplicated, in whole or in part. Due to electronic rights, some third party content may be suppressed from the eBook and/or eChapter(s).
Editorial review has deemed that any suppressed content does not materially affect the overall learning experience. Cengage Learning reserves the right to remove additional content at any time if subsequent rights restrictions require it.

330 UNIT 3 Foods and Nutrients: Basic Concepts
Figure 12–3 A typical food label.
Figure 12–4 Commonly used labeling terms defined.
WHAT SOME CLAIMS MEAN
high-protein: at least 10 grams (g) high-quality protein per serving
good source of calcium: at least 100 milligrams (mg) calcium per serving
more iron: at least 1.8 mg more iron per serving than reference food. (Label will say 10 percent more of the Daily Value for iron.) fat-free: less than 0.5 g fat per serving
low-fat: 3 g or less fat per serving. (If the serving size is 30 g or less or 2 tablespoons or less, 3 g or less fat per 50 g of the food.)
reduced or fewer calories: at least 25 percent fewer calories per serving than the reference food
reduced sugar: reduced sugar: at least 25% less sugar per serving when compared with a similar food
sodium-free: less than 5 mg. of sodium per serving
low cholesterol: 20 mg. or less of cholesterol and 2 gm. or less of saturated fat per serving
sugar-free: less than 0.5 g sugar per serving
light or lite (two meanings):
one-third fewer calories or 50% less fatper serving than the reference food. (Ifmore than half of the food’s calories arefrom fat, the fat must be reduced by 50 percent)
a “low-calorie” or “low-fat” food whosesodium content has been reduced by50 percent of the reference food
Copyright 2010 Cengage Learning. All Rights Reserved. May not be copied, scanned, or duplicated, in whole or in part. Due to electronic rights, some third party content may be suppressed from the eBook and/or eChapter(s).
Editorial review has deemed that any suppressed content does not materially affect the overall learning experience. Cengage Learning reserves the right to remove additional content at any time if subsequent rights restrictions require it.

Chapter 12 Nutritional Guidelines 331
The following calculations (percent of calories from fat) for some selected foods will show how
the fat content reported on labels may sometimes be misleading:
Cheddar cheese—1 ounce � 115 calories and 9 g of fat:
Calories from fat � 9 � 9 � 81
Percent calories from fat � 81/115 � 100 � 70%
Eggs—one egg � 75 calories and 6 g of fat:
Calories from fat � 6 � 9 � 54
Percent calories from fat � 54/75 � 100 � 72%
90% fat-free ground beef—3 ounces � 185 calories and 10 g of fat:
Calories from fat � 10 � 9 � 90
Percent calories from fat � 90/185 � 100 � 49%
For all of these examples, the grams of fat (9, 6, and 10) are low, yet they all presented more than
30 percent of calories from fat.
The recommendation that no more than 30 percent of calories should come from fat does not
mean that all healthy food choices must derive less than 30 percent of their calories from fat. This
would virtually eliminate all red meat and most dairy products. However, it does mean that if you
eat a lean hamburger with 49 percent fat-calories, it might be better to skip the French fries at 47
percent fat-calories and substitute an apple, banana, or orange with less than 10 percent of calories
from fat.
The procedure for calculating the percent of fat-calories may seem somewhat tedious at first.
However, after completing several of these calculations you will be able to quickly skim a label and
estimate a food item’s nutrient density or fat-calorie ratio.
Dietary Guidelines for Americans
� The Dietary Guidelines for Americans encourages a diet that is moderate in sugar consump-tion. Many foods such as milk/dairy products and fruit have naturally occurring sugars. Foods that have sugars added during processing or preparation contribute unnecessary calories and are often low in many vitamins and minerals. Although sugar is not harmful when consumed in limited amounts, it provides no beneficial dietary nutrients.
� Know your food labels: A reduced sugar food item contains at least 25 percent less sugar than the reference food. No added sugar or without added sugar foods indicate that no sugars were added during processing or packaging. Sugar-free foods contain less than 0.5 grams sugar per serving.
� The following terms, if listed as the first or second ingredient of a food label, indicate the food is likely high in sugar: Brown sugar, corn sweetener or corn syrup, fructose, fruit juice concentrate, glucose, dextrose, high-fructose corn syrup, honey, lactose, maltose, molasses, raw sugar, table sugar (sucrose), syrup.
� Major food sources of sugar in the United States include sodas, cakes, candy, cookies, pies, fruit drinks and punches, and dairy desserts such as ice cream. Healthy foods that contain added sugar should be limited in the diet: chocolate milk, presweetened cereals, and fruits packed in syrup. If these foods are eaten, do so in moderation and choose smaller serving sizes. (A serv-ing of soda in the 1950s was 6.5 ounces compared to a 20-ounce serving today!)
Focus On Families
Copyright 2010 Cengage Learning. All Rights Reserved. May not be copied, scanned, or duplicated, in whole or in part. Due to electronic rights, some third party content may be suppressed from the eBook and/or eChapter(s).
Editorial review has deemed that any suppressed content does not materially affect the overall learning experience. Cengage Learning reserves the right to remove additional content at any time if subsequent rights restrictions require it.
332 UNIT 3 Foods and Nutrients: Basic Concepts
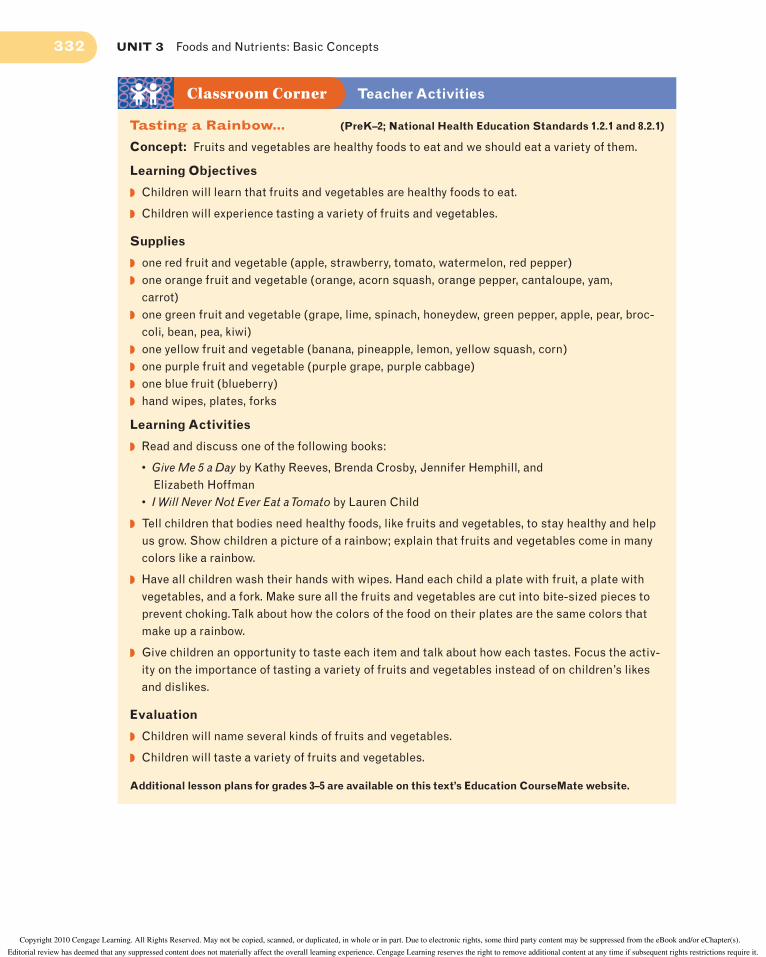
Teacher ActivitiesClassroom Corner
Tasting a Rainbow... (PreK–2; National Health Education Standards 1.2.1 and 8.2.1)
Concept: Fruits and vegetables are healthy foods to eat and we should eat a variety of them.
Learning Objectives
� Children will learn that fruits and vegetables are healthy foods to eat.
� Children will experience tasting a variety of fruits and vegetables.
Supplies
� one red fruit and vegetable (apple, strawberry, tomato, watermelon, red pepper) � one orange fruit and vegetable (orange, acorn squash, orange pepper, cantaloupe, yam,
carrot) � one green fruit and vegetable (grape, lime, spinach, honeydew, green pepper, apple, pear, broc-
coli, bean, pea, kiwi) � one yellow fruit and vegetable (banana, pineapple, lemon, yellow squash, corn) � one purple fruit and vegetable (purple grape, purple cabbage) � one blue fruit (blueberry) � hand wipes, plates, forks
Learning Activities
� Read and discuss one of the following books:
• Give Me 5 a Day by Kathy Reeves, Brenda Crosby, Jennifer Hemphill, and Elizabeth Hoffman
• I Will Never Not Ever Eat a Tomato by Lauren Child
� Tell children that bodies need healthy foods, like fruits and vegetables, to stay healthy and help us grow. Show children a picture of a rainbow; explain that fruits and vegetables come in many colors like a rainbow.
� Have all children wash their hands with wipes. Hand each child a plate with fruit, a plate with vegetables, and a fork. Make sure all the fruits and vegetables are cut into bite-sized pieces to prevent choking. Talk about how the colors of the food on their plates are the same colors that make up a rainbow.
� Give children an opportunity to taste each item and talk about how each tastes. Focus the activ-ity on the importance of tasting a variety of fruits and vegetables instead of on children’s likes and dislikes.
Evaluation
� Children will name several kinds of fruits and vegetables.
� Children will taste a variety of fruits and vegetables.
Additional lesson plans for grades 3–5 are available on this text’s Education CourseMate website.
Copyright 2010 Cengage Learning. All Rights Reserved. May not be copied, scanned, or duplicated, in whole or in part. Due to electronic rights, some third party content may be suppressed from the eBook and/or eChapter(s).
Editorial review has deemed that any suppressed content does not materially affect the overall learning experience. Cengage Learning reserves the right to remove additional content at any time if subsequent rights restrictions require it.

Chapter 12 Nutritional Guidelines 333
�� Chapter Review
A. By Yourself:
1. Match the foods in column I to the appropriate food group in column II. Some foods may
include more than one food group.
Column I Column II
1. Navy beans a. Milk group
2. Rice b. Meat and Beans group
3. Spaghetti c. Grain group
4. Hamburger pizza d. Vegetable group
5. Macaroni and cheese e. Fruit group
6. Peanut butter sandwich f. Oils group
7. French fries g. Discretionary calories
8. Ice cream
9. Popcorn
10. Carbonated beverages
�� Summary � The dietary reference intakes (DRI) are nutrient goals based on gender and age that are considered
essential for maintaining health. They are used for policy development, dietary assessment, meal
planning, and appear on food labels.
� The Dietary Guidelines for Americans are a set of recommendations that encourage food selections
which meet nutrient needs, reduce the known harmful effects of over consumption of some nutri-
ent groups, promote physical activity, and stress food safety.
� The Food Guide Pyramid is the most practical guide for making healthful food choices; foods are
grouped by similar characteristics and nutrient strengths. A health-promoting diet is ensured by
consuming a variety of foods from all food groups in the amounts recommended.
� Food labels must include a list of all ingredients in a product; nutrient values, fat, and calories pres-
ent in the item based on serving size; known allergens; and, manufacturer‘s contact information.
� Determining the percent of calories from fat in a given food serving is useful for limiting excessive
dietary fat intake.
nutrition p. 318
nutrients p. 318
malnutrition p. 319
undernutrition p. 319
essential nutrient p. 319
Dietary Reference Intake
(DRI) p. 319
Dietary Guidelines for
Americans p. 320
calcium p. 327
protein p. 328
Percent Daily Values (%DV)
p. 329
nutrition claims p. 329
�� Terms to Know
Copyright 2010 Cengage Learning. All Rights Reserved. May not be copied, scanned, or duplicated, in whole or in part. Due to electronic rights, some third party content may be suppressed from the eBook and/or eChapter(s).
Editorial review has deemed that any suppressed content does not materially affect the overall learning experience. Cengage Learning reserves the right to remove additional content at any time if subsequent rights restrictions require it.

334 UNIT 3 Foods and Nutrients: Basic Concepts
�� Application Activities
1. Record your personal food intake for the past 24 hours. Go to www.MyPyramid.gov and generate
“My Pyramid Plan” by entering your age, gender, and activity level. Analyze the results of your
24-hour food intake by comparing it with the Pyramid Plan recommendations.
2. Plan a day’s menu for a 4-year-old girl who does an extra 45 minutes of activity each day.
Include the recommended amounts from each food group, the calorie pattern on which the
recommendations are based, and the number of oils/discretionary calories recommended per
day from My Pyramid Plan.
3. Assume that a child is allergic to citrus fruit and strawberries (common food allergies).What
fruit and/or vegetable choices could be substituted to provide adequate vitamin C?
4. The next time you eat pizza, note the amount that you consumed. Use the Pyramid as a guide to
evaluate the number of servings you received from each of the different food groups. If you had
a green salad with your pizza, what nutrients did it add? Estimate how many 1-cup servings the
salad would have yielded.
B. As a Group:
1. Describe the energy sources in food. What nutrients yield energy?
2. Discuss how an individual might use the Dietary Guidelines for Americans to improve their
personal well-being.
3. Explain what dietary reference intakes are and how they can be used for planning a child’s daily
diet.
4. Debate the merits and limitations of the current Food Guide Pyramid.
5. Explain how foods labeled low-fat, fat-free, and reduced calories differ.
�� Case Study 1. Betsy, age 3½ , drinks milk to the exclusion of adequate amounts of foods from other food
groups. What nutrient is Betsy receiving in excess? What two nutrients are most likely to be deficient?
2. Jason, age 4, refuses to eat fruit. He will occasionally accept a small serving of applesauce and a few bites of banana but little else. What two nutrients are probably deficient in Jason’s diet?
3. Jeremy, age 3, is allergic to milk and dairy products. What nutrient is deficient in Jeremy’s diet?
4. Tommy, age 2, by choice will eat only high carbohydrate foods, preferably those that are sweet. He rejects high-protein, high-fat foods such as meats and cheese. How would you change his diet to provide adequate protein and fat for normal growth and nerve development without increasing his carbohydrate intake with high-fat pastries, cakes, and so on?
5. Mary, age 4, refuses milk and all milk products; she likes to drink a variety of juices. How would you adjust her diet to ensure that she meets her calcium requirement?
Copyright 2010 Cengage Learning. All Rights Reserved. May not be copied, scanned, or duplicated, in whole or in part. Due to electronic rights, some third party content may be suppressed from the eBook and/or eChapter(s).
Editorial review has deemed that any suppressed content does not materially affect the overall learning experience. Cengage Learning reserves the right to remove additional content at any time if subsequent rights restrictions require it.

Chapter 12 Nutritional Guidelines 335
�� Helpful Web Resources
Canada’s Food Guide http://www.hc-sc.gc.ca/fn-an/food-
guide-aliment/index-eng.php
Federal Citizen Information Center http://www.pueblo.gsa.gov
Food and Drug Administration (FDA) (Food labels) http://www.fda.gov/Food/default.htm
Food Guide Pyramid for Kids http://www.mypyramid.gov/kids
Tufts University Center on Nutrition Science and Policy http://nutrition.tufts.edu
United States Department of Agriculture (USDA) News Site http://www.usda.gov
United States Department of Agriculture MyPyramid.gov http://www.mypryamid.gov
You are just a click away from additional health, safety, and nutrition resources! Go to www.
CengageBrain.com to access this text’s Education CourseMate website, where you’ll find:
• glossary flashcards, activities, tutorial quizzes, videos, web links, and more
�� ReferencesAmerican Heart Association (AHA). (2009). Exercise (physical activity) and children. Accessed on December 18,
2009 from http://www.americanheart.org/presenter.jhtml?identifier=4596.
Anderson, J., Baird, P., Davis, R., Ferreri, S., Knudtson, M., Koraym, A., Waters, V., & Williams, C. (2009). Health
benefits of dietary fiber, Nutrition Reviews, 67(4), 188–205.
Bachman, J., Reedy, J., Subar, A., & Krebs-Smith, S. (2008). Sources of food group intakes among the US population,
2001–2002, Journal of the American Dietetic Association, 108(5), 804–814.
Centers for Disease Control & Prevention (CDC). (2008). How much physical activity do children need? Accessed on
December 18, 2009 from http://www.cdc.gov/physicalactivity/everyone/guidelines/children.html.
Clark, M., & Fox, M. (2009). Nutritional quality of the diets of US public school children and the role of the school
meal programs, Journal of the American Dietetic Association, 109(2), S44–S56.
Dave, J., Evans, A., Saunders, R., Watkins, K., & Pfeiffer, K. (2009). Associations among food insecurity, accultura-
tion, demographic factors, and fruit and vegetable intake at home in Hispanic children, Journal of the American
Dietetic Association, 109(4), 697–701.
Horodynski, M., Brophy-Herb, H., Chen, C., Stommel, M., & Weatherspoon, L. (2009). Mother’s self-efficacy, “picky
eater” perception, food choices and toddler’s fruit and vegetable consumption in low-income African American
and Caucasian mothers, Journal of Nutrition Education and Behavior, 41(4), S13–S19.
Massi, L., Silk, K., Von Friederichs-Fitzwater, M., Hamner, H., Prue, C., & Boster, F. (2009). Developing effective cam-
paign messages to prevent neural tube defects: A qualitative assessment of women’s reactions to advertising
concepts, Journal of Health Communication, 14(2), 131–159.
Miller, G., Drewnowski, A., Fulgoni, V., Heaney, R., King, J., & Kennedy, E. (2009). It is time for a positive approach to
dietary guidance using nutrient density as a basic principle, Journal of Nutrition, 139(6), 1198–1202.
Mitka, M. (2005). Government unveils new food pyramid: Critics say nutrition tool is flawed. Journal of the American
Medical Association, 1(293), 2581–2582.
National Association for Sport and Physical Education (NASPE). (2009). Physical activity for children: A statement
of guidelines for children ages 5–12, (2nd ed.). Accessed on December 18, 2009 from http://www.aahperd.org/
naspe/standards/nationalGuidelines/PA-Children-5-12.cfm.
Renda, M., & Fischer, P. (2009). Vegetarian diets in children and adolescents, Pediatrics in Review, 30(1), e1–8.
Story, M. (2009). The third School Nutrition Dietary Assessment study: Findings and policy implications for improv-
ing the health of US children, Journal of the American Dietetic Association, 109(2), S7–S13.
Copyright 2010 Cengage Learning. All Rights Reserved. May not be copied, scanned, or duplicated, in whole or in part. Due to electronic rights, some third party content may be suppressed from the eBook and/or eChapter(s).
Editorial review has deemed that any suppressed content does not materially affect the overall learning experience. Cengage Learning reserves the right to remove additional content at any time if subsequent rights restrictions require it.

336 UNIT 3 Foods and Nutrients: Basic Concepts
Taylor, C. (2009). How the nutrition food label was developed, Part 1: The Nutrition Facts Panel, Journal of the Ameri-
can Dietetic Association, 108(3), 437–442.
Thompson, M., Cole, D., & Ra y, J. (2009). Vitamin B-12 and neural tube defects: The Canadian experience, American
Journal of Clinical Nutrition, 89(2), 697S–701S.
USDA. (2005). MyPyramid.gov. Accessed on December 18, 2009 from http://www.mypyramid.gov.
USDA. (2010). Dietary Guidelines for Americans. Accessed on June 3, 2010 from http://www.cnpp.usda.gov/dietary-
guidelines.htm.
U.S. Food & Drug Administration. (2006). Food Allergen Labeling and Consumer Protection Act of 2004. Accessed
on December 18, 2009 from http://www.cfsan.fda.gov/~dms/alrgact.html.
Wiener, F., Schmidt, M., Munson, K., Khoury, P., Kalkwarf, H., & Daniels, S. (2009). Dietary intake of 3 year old chil-
dren: Do they meet recommended intake? Current Pediatric Reviews, 5(2), 128–134.
Copyright 2010 Cengage Learning. All Rights Reserved. May not be copied, scanned, or duplicated, in whole or in part. Due to electronic rights, some third party content may be suppressed from the eBook and/or eChapter(s).
Editorial review has deemed that any suppressed content does not materially affect the overall learning experience. Cengage Learning reserves the right to remove additional content at any time if subsequent rights restrictions require it.