Health NSW Health Pathology
45
AGENCY REPORT Health NSW Health Pathology NSW | PMES 2017 | ND0437
Transcript of Health NSW Health Pathology
AGENCY REPORTHealth
NSW Health Pathology
NSW | PMES 2017 | ND0437

HEADLINESRESPONSERATE
36%1,667 OF 4,663 TOTAL RESPONDENTS
EMPLOYEE ENGAGEMENT
60%DIFFERENCE FROM 2016 0
DIFFERENCE FROM CLUSTER -4
DIFFERENCE FROM PUBLIC SECTOR -5
SENIOR MANAGERS
38%DIFFERENCE FROM 2016 0
DIFFERENCE FROM CLUSTER -7
DIFFERENCE FROM PUBLIC SECTOR -9
COMMUNICATION
53%DIFFERENCE FROM 2016 +4
DIFFERENCE FROM CLUSTER -5
DIFFERENCE FROM PUBLIC SECTOR -7
QUESTIONS ARE GROUPED INTO THEMES IN THIS REPORT.
This page compares the aggregate scores for key themes. The individual questions in each group are listed in the All Questions section. Comparisons with 2016 are not included where the number of questions were reduced for 2017.
ENGAGEMENT WITH WORK
68%DIFFERENCE FROM CLUSTER -4
DIFFERENCE FROM PUBLIC SECTOR -4
HIGH PERFORMANCE
57%DIFFERENCE FROM CLUSTER -6
DIFFERENCE FROM PUBLIC SECTOR -6
PUBLIC SECTOR VALUES
53%DIFFERENCE FROM CLUSTER -5
DIFFERENCE FROM PUBLIC SECTOR -8
DIVERSITY & INCLUSION
61%DIFFERENCE FROM CLUSTER -4
DIFFERENCE FROM PUBLIC SECTOR -6
The Employee Engagement score is weighted. It cannot be compared to the other scores which are the average of the % agreement results (strongly agree and agree scores).
Response Rate: some entities exceed 100% where responses were greater than the employee headcount. This is thought to be primarily due to employees selecting the wrong work location in the survey or closing a partially completed survey then needing to start a new one if their password is forgotten or lost.
ORC International | www.orcinternational.comPAGE 02NSW People Matter Employee Survey 2017

KEY DRIVERS OF ENGAGEMENT
WHAT TO FOCUS ON?
Employee Engagement scores at different levels are shown in earlier and following pages.
These results show the issues that are the most significant influencers of employee engagement in the workplace at this reporting level.
If engagement scores are high, other scores are often high as well.
AGREEMENT % AGREEMENT 2016
AGREEMENT CLUSTER
% AGREEMENT PUBLIC SECTOR
1 Q7f. My organisation is committed to developing its employees 36% 40% 49% 50%
2 Q6h. I feel that senior managers listen to employees 32% 30% 38% 41%
3 Q7a. My organisation focuses on improving the work we do 63% 71% 67% 69%
4 Q6b. I feel that senior managers effectively lead and manage change 36% 35% 43% 44%
5 Q6c. I feel that senior managers model the values of my organisation 39% 38% 45% 48%
6 Q7c. I feel that change is managed well in my organisation 33% 32% 41% 39%
ORC International | www.orcinternational.comPAGE 03NSW People Matter Employee Survey 2017

HIGHEST AND LOWEST QUESTIONS
l+ HIGHEST AGREEMENTSCORING QUESTIONS
AG
RE
EM
EN
T
2017
1a. I understand what is expected of me to do well in my role 89%
2a. My workgroup strives to achieve customer/client satisfaction 84%
2c. I receive help and support from other members of my workgroup 76%
2b. My workgroup works collaboratively to achieve its objectives 73%
1c. My job gives me a feeling of personal accomplishment 72%
8b. Personal background is not a barrier to success in my organisation 72%
5b. My manager listens to what I have to say 69%
8a. My organisation respects individual differences (e.g. cultures, working styles, backgrounds, ideas) 69%
1d. I feel motivated to contribute more than what is normally required at work 68%
8c. I am able to speak up and share a different view to my colleagues and manager 64%
l- LOWEST AGREEMENTSCORING QUESTIONS
AG
RE
EM
EN
T
2017
14. I believe action will be taken on the results from this survey by my organisation 30%
6h. I feel that senior managers listen to employees 32%
7c. I feel that change is managed well in my organisation 33%
7g. I have confidence in the way recruitment decisions are made 34%
9a. I have confidence in the ways my organisation resolves grievances 34%
6d. Senior managers encourage innovation by employees 35%
6g. I feel that senior managers keep employees informed about what's going on 35%
7f. My organisation is committed to developing its employees 36%
6b. I feel that senior managers effectively lead and manage change 36%
5h. My manager appropriately deals with employees who perform poorly 36%
YOUR PEOPLE MATTER QUESTION RESULTS AT A GLANCE
These are your highest and lowest scoring questions from the survey, based on respondents who have selected ‘Strongly Agree’ and ‘Agree’.
ORC International | www.orcinternational.comPAGE 04NSW People Matter Employee Survey 2017
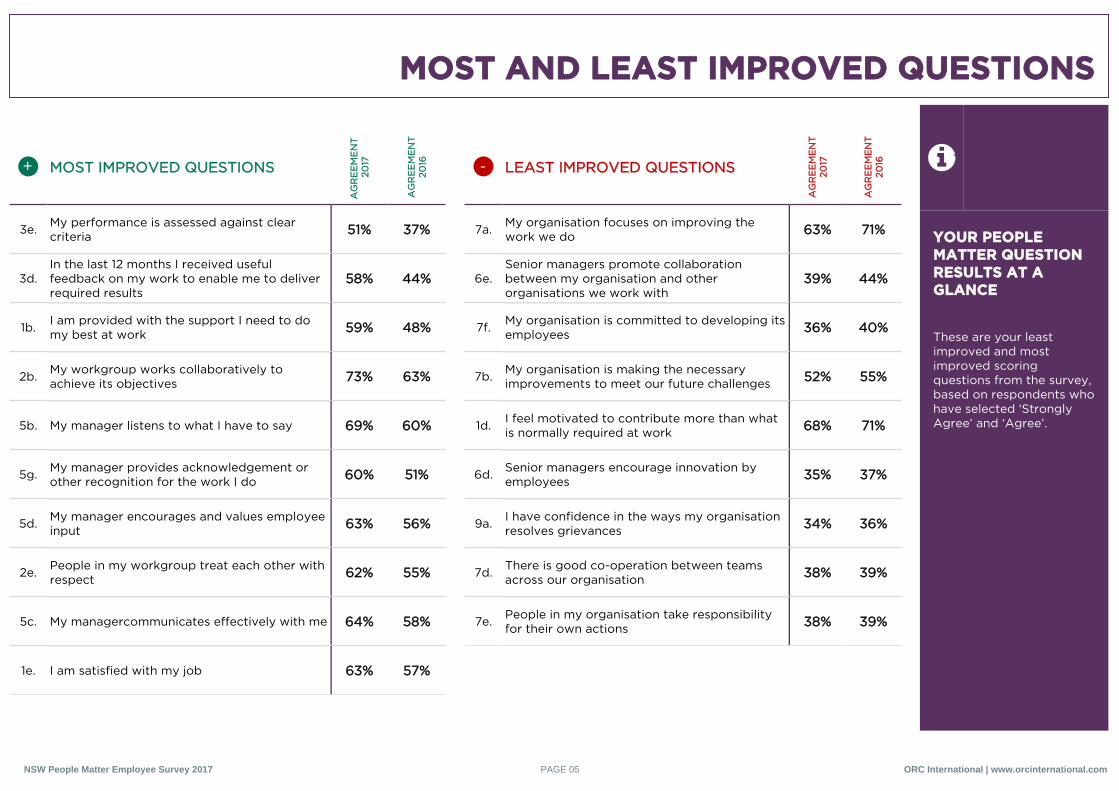
MOST AND LEAST IMPROVED QUESTIONS
l+ MOST IMPROVED QUESTIONS
AG
RE
EM
EN
T
2017
AG
RE
EM
EN
T20
16
3e. My performance is assessed against clear criteria 51% 37%
3d.In the last 12 months I received useful feedback on my work to enable me to deliver required results
58% 44%
1b. I am provided with the support I need to do my best at work 59% 48%
2b. My workgroup works collaboratively to achieve its objectives 73% 63%
5b. My manager listens to what I have to say 69% 60%
5g. My manager provides acknowledgement or other recognition for the work I do 60% 51%
5d. My manager encourages and values employee input 63% 56%
2e. People in my workgroup treat each other with respect 62% 55%
5c. My managercommunicates effectively with me 64% 58%
1e. I am satisfied with my job 63% 57%
l- LEAST IMPROVED QUESTIONS
AG
RE
EM
EN
T
2017
AG
RE
EM
EN
T20
16
7a. My organisation focuses on improving the work we do 63% 71%
6e.Senior managers promote collaboration between my organisation and other organisations we work with
39% 44%
7f. My organisation is committed to developing its employees 36% 40%
7b. My organisation is making the necessary improvements to meet our future challenges 52% 55%
1d. I feel motivated to contribute more than what is normally required at work 68% 71%
6d. Senior managers encourage innovation by employees 35% 37%
9a. I have confidence in the ways my organisation resolves grievances 34% 36%
7d. There is good co-operation between teams across our organisation 38% 39%
7e. People in my organisation take responsibility for their own actions 38% 39%
YOUR PEOPLE MATTER QUESTION RESULTS AT A GLANCE
These are your least improved and most improved scoring questions from the survey, based on respondents who have selected ‘Strongly Agree’ and ‘Agree’.
ORC International | www.orcinternational.comPAGE 05NSW People Matter Employee Survey 2017

BUSINESS UNIT COMPARISON
COMPARISON OF LOWER LEVEL BUSINESS UNITS
This page compares key question group scores for NSW Health Pathology
The Engagement Score is weighted. It cannot be compared with other scores which are the average of % agreement results for all questions in a group.
Significant differences have been highlighted to demonstrate best practice and areas that require attention.
NS
W H
ealt
h P
atho
log
y
Co
rpo
rate
Off
ice
Eas
t
Fo
rens
ic &
Ana
lyti
cal S
cien
ce
Ser
vice
No
rth
Rur
al &
Reg
iona
l
So
uth
Wes
t
NUMBER OF RESPONDENTS 1667 93 255 170 492 198 144 263
EMPLOYEE ENGAGEMENT 60% 79% 59% 55% 57% 60% 59% 60%
ENGAGEMENT WITH WORK 68% 78% 68% 58% 66% 71% 70% 70%
SENIOR MANAGERS 38% 78% 39% 34% 32% 36% 37% 40%
COMMUNICATION 53% 80% 52% 51% 47% 53% 51% 58%
HIGH PERFORMANCE 57% 81% 56% 54% 53% 56% 55% 60%
PUBLIC SECTOR VALUES 53% 81% 52% 50% 48% 52% 50% 56%
DIVERSITY & INCLUSION 61% 82% 61% 59% 58% 60% 60% 64%
KEY AT LEAST 5 PERCENTAGE POINTS GREATER THAN REPORT SCORE
AT LEAST 5 PERCENTAGE POINTS LESS THAN REPORT SCORE
r = DATA RESTRICTED AS BELOW CUT OFF LIMIT OF 10 RESPONDENTS
ORC International | www.orcinternational.comPAGE 06NSW People Matter Employee Survey 2017

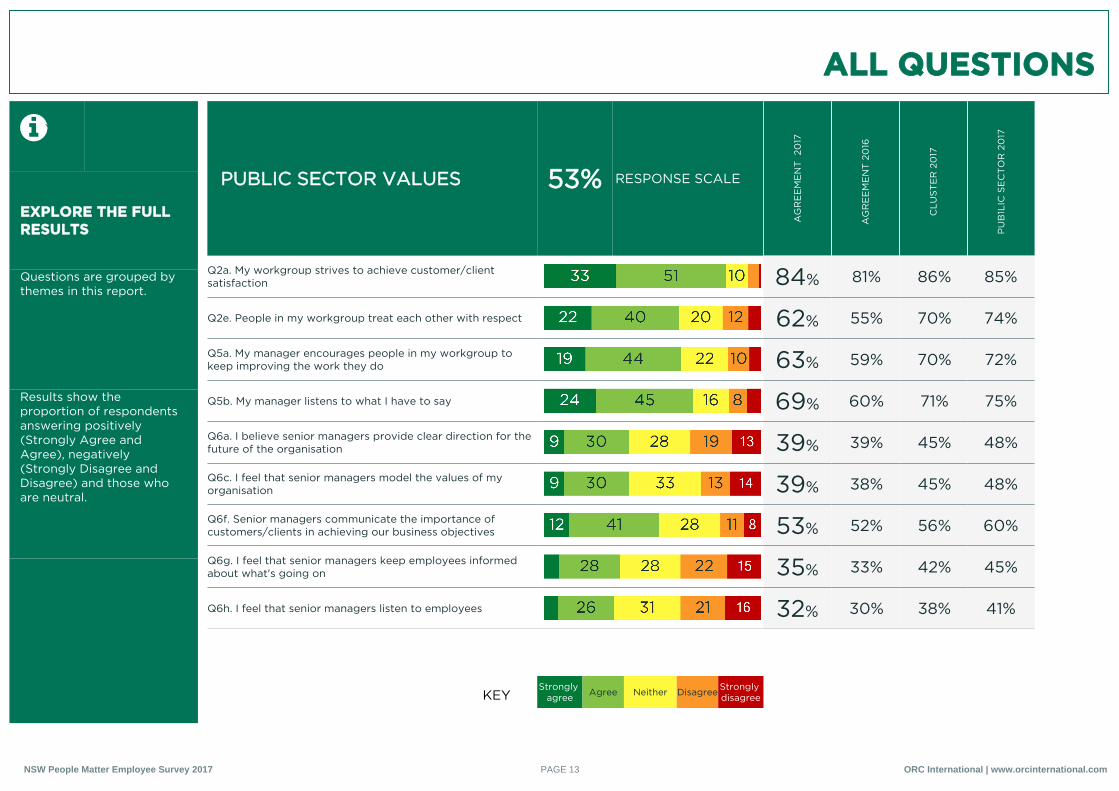
ALL QUESTIONS
EXPLORE THE FULL RESULTS
Questions are grouped by themes in this report.
Results show the proportion of respondents answering positively (Strongly Agree and Agree), negatively (Strongly Disagree and Disagree) and those who are neutral.
EMPLOYEE ENGAGEMENT 60% RESPONSE SCALE
AG
RE
EM
EN
T 2
017
AG
RE
EM
EN
T 2
016
CLU
ST
ER
20
17
PU
B1L
IC S
EC
TO
R 2
017
Q7i. I would recommend my organisation as a great place to work 49% 48% 59% 60%
Q7j. I am proud to tell others I work for my organisation 61% 60% 67% 68%
Q7k. I feel a strong personal attachment to my organisation 55% 54% 61% 63%
Q7l. My organisation motivates me to help it achieve its objectives 44% 43% 52% 53%
Q7m. My organisation inspires me to do the best in my job 45% 44% 53% 53%
KEYStrongly
agree Agree Neither Disagree Strongly disagree
ORC International | www.orcinternational.comPAGE 07NSW People Matter Employee Survey 2017

ALL QUESTIONS
EXPLORE THE FULL RESULTS
Questions are grouped by themes in this report.
Results show the proportion of respondents answering positively (Strongly Agree and Agree), negatively (Strongly Disagree and Disagree) and those who are neutral.
ENGAGEMENT WITH WORK 68% RESPONSE SCALE
AG
RE
EM
EN
T 2
017
AG
RE
EM
EN
T 2
016
CLU
ST
ER
20
17
PU
B1L
IC S
EC
TO
R 2
017
Q1c. My job gives me a feeling of personal accomplishment 72% 71% 76% 75%
Q1d. I feel motivated to contribute more than what is normally required at work 68% 71% 72% 72%
Q1e. I am satisfied with my job 63% 57% 68% 68%
KEYStrongly
agree Agree Neither Disagree Strongly disagree
ORC International | www.orcinternational.comPAGE 08NSW People Matter Employee Survey 2017

ALL QUESTIONS
EXPLORE THE FULL RESULTS
Questions are grouped by themes in this report.
Results show the proportion of respondents answering positively (Strongly Agree and Agree), negatively (Strongly Disagree and Disagree) and those who are neutral.
SENIOR MANAGERS 38% RESPONSE SCALE
AG
RE
EM
EN
T 2
017
AG
RE
EM
EN
T 2
016
CLU
ST
ER
20
17
PU
B1L
IC S
EC
TO
R 2
017
Q6a. I believe senior managers provide clear direction for the future of the organisation 39% 39% 45% 48%
Q6b. I feel that senior managers effectively lead and manage change 36% 35% 43% 44%
Q6c. I feel that senior managers model the values of my organisation 39% 38% 45% 48%
Q6d. Senior managers encourage innovation by employees 35% 37% 46% 48%
Q6e. Senior managers promote collaboration between my organisation and other organisations we work with 39% 44% 47% 51%
Q6f. Senior managers communicate the importance of customers/clients in achieving our business objectives 53% 52% 56% 60%
Q6g. I feel that senior managers keep employees informed about what's going on 35% 33% 42% 45%
Q6h. I feel that senior managers listen to employees 32% 30% 38% 41%
Q7c. I feel that change is managed well in my organisation 33% 32% 41% 39%
KEYStrongly
agree Agree Neither Disagree Strongly disagree
ORC International | www.orcinternational.comPAGE 09NSW People Matter Employee Survey 2017

ALL QUESTIONS
EXPLORE THE FULL RESULTS
Questions are grouped by themes in this report.
Results show the proportion of respondents answering positively (Strongly Agree and Agree), negatively (Strongly Disagree and Disagree) and those who are neutral.
COMMUNICATION 53% RESPONSE SCALE
AG
RE
EM
EN
T 2
017
AG
RE
EM
EN
T 2
016
CLU
ST
ER
20
17
PU
B1L
IC S
EC
TO
R 2
017
Q5c. My manager communicates effectively with me 64% 58% 68% 70%
Q5d. My manager encourages and values employee input 63% 56% 68% 71%
Q5e. My manager involves my workgroup in decisions about our work 57% 53% 63% 65%
Q6g. I feel that senior managers keep employees informed about what's going on 35% 33% 42% 45%
Q6h. I feel that senior managers listen to employees 32% 30% 38% 41%
Q8c. I am able to speak up and share a different view to my colleagues and manager 64% 62% 65% 66%
KEYStrongly
agree Agree Neither Disagree Strongly disagree
ORC International | www.orcinternational.comPAGE 10NSW People Matter Employee Survey 2017

ALL QUESTIONS
EXPLORE THE FULL RESULTS
Questions are grouped by themes in this report.
Results show the proportion of respondents answering positively (Strongly Agree and Agree), negatively (Strongly Disagree and Disagree) and those who are neutral.
HIGH PERFORMANCE 57% RESPONSE SCALE
AG
RE
EM
EN
T 2
017
AG
RE
EM
EN
T 2
016
CLU
ST
ER
20
17
PU
B1L
IC S
EC
TO
R 2
017
Q1a. I understand what is expected of me to do well in my role 89% 88% 91% 90%
Q2b. My workgroup works collaboratively to achieve its objectives 73% 63% 77% 78%
Q3f. I have received appropriate training and development to do my job well 63% 62% 68% 62%
Q5a. My manager encourages people in my workgroup to keep improving the work they do 63% 59% 70% 72%
Q5f. I have confidence in the decisions my manager makes 58% 52% 64% 67%
Q6d. Senior managers encourage innovation by employees 35% 37% 46% 48%
Q6e. Senior managers promote collaboration between my organisation and other organisations we work with 39% 44% 47% 51%
Q7a. My organisation focuses on improving the work we do 63% 71% 67% 69%
Q7b. My organisation is making the necessary improvements to meet our future challenges 52% 55% 55% 57%
KEYStrongly
agree Agree Neither Disagree Strongly disagree
ORC International | www.orcinternational.comPAGE 11NSW People Matter Employee Survey 2017

ALL QUESTIONS
EXPLORE THE FULL RESULTS
Questions are grouped by themes in this report.
Results show the proportion of respondents answering positively (Strongly Agree and Agree), negatively (Strongly Disagree and Disagree) and those who are neutral.
HIGH PERFORMANCE 57% RESPONSE SCALE
AG
RE
EM
EN
T 2
017
AG
RE
EM
EN
T 2
016
CLU
ST
ER
20
17
PU
B1L
IC S
EC
TO
R 2
017
Q7d. There is good co-operation between teams across our organisation 38% 39% 48% 47%
Q7h. My organisation generally selects capable people to do the job 51% 49% 53% 52%
KEYStrongly
agree Agree Neither Disagree Strongly disagree
ORC International | www.orcinternational.comPAGE 12NSW People Matter Employee Survey 2017
ALL QUESTIONS
EXPLORE THE FULL RESULTS
Questions are grouped by themes in this report.
Results show the proportion of respondents answering positively (Strongly Agree and Agree), negatively (Strongly Disagree and Disagree) and those who are neutral.
PUBLIC SECTOR VALUES 53% RESPONSE SCALE
AG
RE
EM
EN
T 2
017
AG
RE
EM
EN
T 2
016
CLU
ST
ER
20
17
PU
B1L
IC S
EC
TO
R 2
017
Q2a. My workgroup strives to achieve customer/client satisfaction 84% 81% 86% 85%
Q2e. People in my workgroup treat each other with respect 62% 55% 70% 74%
Q5a. My manager encourages people in my workgroup to keep improving the work they do 63% 59% 70% 72%
Q5b. My manager listens to what I have to say 69% 60% 71% 75%
Q6a. I believe senior managers provide clear direction for the future of the organisation 39% 39% 45% 48%
Q6c. I feel that senior managers model the values of my organisation 39% 38% 45% 48%
Q6f. Senior managers communicate the importance of customers/clients in achieving our business objectives 53% 52% 56% 60%
Q6g. I feel that senior managers keep employees informed about what's going on 35% 33% 42% 45%
Q6h. I feel that senior managers listen to employees 32% 30% 38% 41%
KEYStrongly
agree Agree Neither Disagree Strongly disagree
ORC International | www.orcinternational.comPAGE 13NSW People Matter Employee Survey 2017

ALL QUESTIONS
EXPLORE THE FULL RESULTS
Questions are grouped by themes in this report.
Results show the proportion of respondents answering positively (Strongly Agree and Agree), negatively (Strongly Disagree and Disagree) and those who are neutral.
PUBLIC SECTOR VALUES 53% RESPONSE SCALE
AG
RE
EM
EN
T 2
017
AG
RE
EM
EN
T 2
016
CLU
ST
ER
20
17
PU
B1L
IC S
EC
TO
R 2
017
Q7a. My organisation focuses on improving the work we do 63% 71% 67% 69%
Q7e. People in my organisation take responsibility for their own actions 38% 39% 47% 47%
KEYStrongly
agree Agree Neither Disagree Strongly disagree
ORC International | www.orcinternational.comPAGE 14NSW People Matter Employee Survey 2017

ALL QUESTIONS
EXPLORE THE FULL RESULTS
Questions are grouped by themes in this report.
Results show the proportion of respondents answering positively (Strongly Agree and Agree), negatively (Strongly Disagree and Disagree) and those who are neutral.
DIVERSITY & INCLUSION 61% RESPONSE SCALE
AG
RE
EM
EN
T 2
017
AG
RE
EM
EN
T 2
016
CLU
ST
ER
20
17
PU
B1L
IC S
EC
TO
R 2
017
Q1b. I am provided with the support I need to do my best at work 59% 48% 64% 63%
Q5b. My manager listens to what I have to say 69% 60% 71% 75%
Q5d. My manager encourages and values employee input 63% 56% 68% 71%
Q6i. Senior managers in my organisation support the career advancement of women 44% 40% 52% 58%
Q8a. My organisation respects individual differences (e.g. cultures, working styles, backgrounds, ideas) 69% 67% 72% 74%
Q8b. Personal background is not a barrier to success in my organisation 72% - 73% 74%
Q8c. I am able to speak up and share a different view to my colleagues and manager 64% 62% 65% 66%
Q8d. How satisfied are you with your ability to access and use flexible working arrangements?Response scale Very satisfied - Very unsatisfied
52% 49% 55% 57%
KEYStrongly
agree Agree Neither Disagree Strongly disagree
ORC International | www.orcinternational.comPAGE 15NSW People Matter Employee Survey 2017

ALL QUESTIONS
EXPLORE THE FULL RESULTS
Questions are grouped by themes in this report.
Results show the proportion of respondents answering positively (Strongly Agree and Agree), negatively (Strongly Disagree and Disagree) and those who are neutral.
RECRUITMENT 43% RESPONSE SCALE
AG
RE
EM
EN
T 2
017
AG
RE
EM
EN
T 2
016
CLU
ST
ER
20
17
PU
B1L
IC S
EC
TO
R 2
017
Q7g. I have confidence in the way recruitment decisions are made 34% - 38% 35%
Q7h. My organisation generally selects capable people to do the job 51% 49% 53% 52%
KEYStrongly
agree Agree Neither Disagree Strongly disagree
ORC International | www.orcinternational.comPAGE 16NSW People Matter Employee Survey 2017

ALL QUESTIONS
EXPLORE THE FULL RESULTS
Questions are grouped by themes in this report.
Results show the proportion of respondents answering positively (Strongly Agree and Agree), negatively (Strongly Disagree and Disagree) and those who are neutral.
PERFORMANCE FRAMEWORK & DEVELOPMENT 47% RESPONSE SCALE
AG
RE
EM
EN
T 2
017
AG
RE
EM
EN
T 2
016
CLU
ST
ER
20
17
PU
B1L
IC S
EC
TO
R 2
017
Q3d. In the last 12 months I received useful feedback on my work to enable me to deliver required results 58% 44% 63% 63%
Q3e. My performance is assessed against clear criteria 51% 37% 57% 54%
Q3g. I am satisfied with the opportunities available for career development in my organisation 38% 32% 51% 48%
Q5g. My manager provides acknowledgement or other recognition for the work I do 60% 51% 64% 67%
Q5h. My manager appropriately deals with employees who perform poorly 36% 31% 44% 44%
Q7f. My organisation is committed to developing its employees 36% 40% 49% 50%
KEYStrongly
agree Agree Neither Disagree Strongly disagree
ORC International | www.orcinternational.comPAGE 17NSW People Matter Employee Survey 2017

ALL QUESTIONS
EXPLORE THE FULL RESULTS
Questions are grouped by themes in this report.
Results show the proportion of respondents answering positively (Strongly Agree and Agree), negatively (Strongly Disagree and Disagree) and those who are neutral.
PAY 52% RESPONSE SCALE
AG
RE
EM
EN
T 2
017
AG
RE
EM
EN
T 2
016
CLU
ST
ER
20
17
PU
B1L
IC S
EC
TO
R 2
017
Q4a. I am paid fairly for the work I do 52% 49% 55% 60%
KEYStrongly
agree Agree Neither Disagree Strongly disagree
ORC International | www.orcinternational.comPAGE 18NSW People Matter Employee Survey 2017

ALL QUESTIONS
EXPLORE THE FULL RESULTS
Questions are grouped by themes in this report.
Results show the proportion of respondents answering positively (Strongly Agree and Agree), negatively (Strongly Disagree and Disagree) and those who are neutral.
WORKPLACE SUPPORT 62% RESPONSE SCALE
AG
RE
EM
EN
T 2
017
AG
RE
EM
EN
T 2
016
CLU
ST
ER
20
17
PU
B1L
IC S
EC
TO
R 2
017
Q1b. I am provided with the support I need to do my best at work 59% 48% 64% 63%
Q1f. I am able to keep my work stress at an acceptable level 55% 51% 61% 59%
Q2c. I receive help and support from other members of my workgroup 76% 72% 79% 81%
Q2d. There is good team spirit in my workgroup 58% 53% 66% 69%
KEYStrongly
agree Agree Neither Disagree Strongly disagree
ORC International | www.orcinternational.comPAGE 19NSW People Matter Employee Survey 2017

ALL QUESTIONS
EXPLORE THE FULL RESULTS
Questions are grouped by themes in this report.
Results show the proportion of respondents answering positively (Strongly Agree and Agree), negatively (Strongly Disagree and Disagree) and those who are neutral.
ACTION ABOUT SURVEY RESULTS 30% RESPONSE SCALE
AG
RE
EM
EN
T 2
017
AG
RE
EM
EN
T 2
016
CLU
ST
ER
20
17
PU
B1L
IC S
EC
TO
R 2
017
Q14. I believe action will be taken on the results from this survey by my organisation 30% 28% 35% 34%
KEYStrongly
agree Agree Neither Disagree Strongly disagree
ORC International | www.orcinternational.comPAGE 20NSW People Matter Employee Survey 2017

ALL QUESTIONS
EXPLORE THE FULL RESULTS
Questions are grouped by themes in this report.
Results show the proportion of respondents answering positively (Strongly Agree and Agree), negatively (Strongly Disagree and Disagree) and those who are neutral.
WORKPLACE CONDUCT 34% RESPONSE SCALE
AG
RE
EM
EN
T 2
017
AG
RE
EM
EN
T 2
016
CLU
ST
ER
20
17
PU
B1L
IC S
EC
TO
R 2
017
Q9a. I have confidence in the ways my organisation resolves grievances 34% 36% 37% 36%
KEYStrongly
agree Agree Neither Disagree Strongly disagree
ORC International | www.orcinternational.comPAGE 21NSW People Matter Employee Survey 2017

ALL QUESTIONS
EXPLORE THE FULL RESULTS
Questions are grouped by themes in this report.
PERFORMANCE FRAMEWORK & DEVELOPMENT
RESPONSE SCALE
2017
CLU
ST
ER
20
17
PU
BLI
C S
EC
TO
R 2
017
Q3a. I have a current performance and development plan that sets out my individual objectives
Yes 59% 67% 67%
No 41% 33% 33%
Q3b. I have informal feedback conversations with my manager
Yes 67% 73% 75%
No 33% 27% 25%
Q3c. I have scheduled feedback conversations with my manager
Yes 46% 56% 57%
No 54% 44% 43%
ORC International | www.orcinternational.comPAGE 22NSW People Matter Employee Survey 2017

ALL QUESTIONS
EXPLORE THE FULL RESULTS
Questions are grouped by themes in this report.
MOBILITY RESPONSE SCALE
2017
CLU
ST
ER
20
17
PU
BLI
C S
EC
TO
R 2
017
Q3h. Are you currently looking, or thinking about looking, for a new role within the NSW Public Sector but outside of your current workplace in order to broaden your experience?
Yes 41% 40% 41%
No 59% 60% 59%
ORC International | www.orcinternational.comPAGE 23NSW People Matter Employee Survey 2017

ALL QUESTIONS
EXPLORE THE FULL RESULTS
Questions are grouped by themes in this report.
MOBILITY RESPONSE SCALE
2017
CLU
ST
ER
20
17
PU
BLI
C S
EC
TO
R 2
017
Q3i. Are there any barriers preventing you from moving to another role?
There are no major barriers to my career progression 27% 32% 30%
Lack of visible opportunities 42% 30% 31%
Lack of promotion opportunities 42% 27% 30%
Lack of support from my manager / supervisor 19% 15% 14%
Geographic location considerations 28% 24% 28%
Personal / family considerations 32% 32% 33%
Insufficient training and development 19% 14% 16%
Lack of required capabilities or experience 13% 10% 11%
Lack of support for temporary assignments/secondments 15% 14% 15%
The application/recruitment process is too cumbersome or time consuming 15% 16% 23%
Other 7% 8% 9%
ORC International | www.orcinternational.comPAGE 24NSW People Matter Employee Survey 2017

ALL QUESTIONS
EXPLORE THE FULL RESULTS
Questions are grouped by themes in this report.
UNACCEPTABLE CONDUCT RESPONSE SCALE
2017
CLU
ST
ER
20
17
PU
BLI
C S
EC
TO
R 2
017
Q10a. In the last 12 months I have witnessed misconduct/wrongdoing at work
Yes 30% 30% 25%
No 55% 57% 62%
Don't know 15% 13% 13%
Q10b. If yes, have you reported the misconduct/wrongdoing you witnessed in the last 12 months?
Yes 62% 66% 63%
No 37% 33% 35%
Don't know 1% 2% 2%
ORC International | www.orcinternational.comPAGE 25NSW People Matter Employee Survey 2017

ALL QUESTIONS
EXPLORE THE FULL RESULTS
Questions are grouped by themes in this report.
UNACCEPTABLE CONDUCT RESPONSE SCALE
2017
CLU
ST
ER
20
17
PU
BLI
C S
EC
TO
R 2
017
Q10c. In the last 12 months I have witnessed bullying at work
Yes 38% 40% 33%
No 51% 51% 58%
Don't know 10% 9% 9%
Q10d. In the last 12 months I have been subjected to bullying at work
Yes 19% 22% 18%
No 73% 72% 76%
Don't know 8% 6% 6%
ORC International | www.orcinternational.comPAGE 26NSW People Matter Employee Survey 2017

ALL QUESTIONS
EXPLORE THE FULL RESULTS
Questions are grouped by themes in this report.
UNACCEPTABLE CONDUCT RESPONSE SCALE
2017
CLU
ST
ER
20
17
PU
BLI
C S
EC
TO
R 2
017
Q10e. Please indicate the role of the person who has been the source of the most serious bullying you have been subjected to in the last 12 months.
A senior manager 19% 19% 22%
Your immediate manager/supervisor 27% 24% 24%
A fellow worker at your level 30% 31% 27%
A subordinate 9% 6% 8%
A client or customer 1% 2% 2%
A member of the public other than a client or customer (r)
Other 3% 5% 4%
Prefer not to say 11% 12% 13%
ORC International | www.orcinternational.comPAGE 27NSW People Matter Employee Survey 2017

ALL QUESTIONS
EXPLORE THE FULL RESULTS
Questions are grouped by themes in this report.
Results show the proportion of respondents answering positively (Strongly Agree and Agree), negatively (Strongly Disagree and Disagree) and those who are neutral.
HEALTH QUESTIONS RESPONSE SCALE
AG
RE
EM
EN
T 2
017
AG
RE
EM
EN
T 2
016
CLU
ST
ER
20
17
Q1. Morale is good in my team 51% 47% 60%
Q2. I believe I am valued for what I can offer at my workplace 63% 60% 69%
Q3. In my workplace, we recognise our successes and innovations 54% 49% 64%
Q4. Staff are treated respectfully regardless of their job 65% 60% 67%
Q5. The senior managers at my workplace lead by example in creating a positive workplace 44% 40% 51%
Q6. Overall, I have confidence in the decisions made by my senior managers 44% 42% 51%
KEYStrongly
agree Agree Neither Disagree Strongly disagree
ORC International | www.orcinternational.comPAGE 28NSW People Matter Employee Survey 2017

ALL QUESTIONS
EXPLORE THE FULL RESULTS
Questions are grouped by themes in this report.
Results show the proportion of respondents answering positively (Strongly Agree and Agree), negatively (Strongly Disagree and Disagree) and those who are neutral.
HEALTH QUESTIONS RESPONSE SCALE
AG
RE
EM
EN
T 2
017
AG
RE
EM
EN
T 2
016
CLU
ST
ER
20
17
Q7. I have a say in decisions which affect my work 51% 44% 54%
Q8. Where I work, we share the lessons learnt when mistakes are made 69% 61% 67%
Q9. My team's objectives/work plans are clearly outlined 62% 55% 64%
Q10. Our objectives/work plans help us to deliver a quality service 64% 58% 66%
Q11. Overall, I believe the culture at my workplace has improved in the last 12 months 37% 31% 41%
KEYStrongly
agree Agree Neither Disagree Strongly disagree
ORC International | www.orcinternational.comPAGE 29NSW People Matter Employee Survey 2017

PROFILE OF RESPONDENTS
PERSONALPROFILES
RESPONSE SCALE
PE
RC
EN
TAG
E
Gender
Male 26%
Female 72%
Other 1%
ORC International | www.orcinternational.comPAGE 30NSW People Matter Employee Survey 2017

PROFILE OF RESPONDENTS
PERSONALPROFILES
RESPONSE SCALE
PE
RC
EN
TAG
E
Age
15 - 19 0%
20 - 24 3%
25 -29 9%
30 - 34 11%
35 - 39 13%
40 - 44 15%
45 - 49 14%
50 - 54 14%
55 - 59 12%
60 - 64 7%
65+ 2%
ORC International | www.orcinternational.comPAGE 31NSW People Matter Employee Survey 2017

PROFILE OF RESPONDENTS
PERSONALPROFILES
RESPONSE SCALE
PE
RC
EN
TAG
E
Do you speak a language other than English at home?
Yes 27%
No 68%
Prefer not to say 5%
Are you of Aboriginal and/or Torres Strait Islander origin?
Yes 1%
No 96%
Prefer not to say 3%
ORC International | www.orcinternational.comPAGE 32NSW People Matter Employee Survey 2017

PROFILE OF RESPONDENTS
PERSONALPROFILES
RESPONSE SCALE
PE
RC
EN
TAG
E
Do you have a disability?
Yes 1%
No 95%
Prefer not to say 4%
Do you identify as lesbian, gay, bisexual, transgender, intersex or as gender diverse?
Yes 4%
No 92%
Prefer not to say 4%
ORC International | www.orcinternational.comPAGE 33NSW People Matter Employee Survey 2017
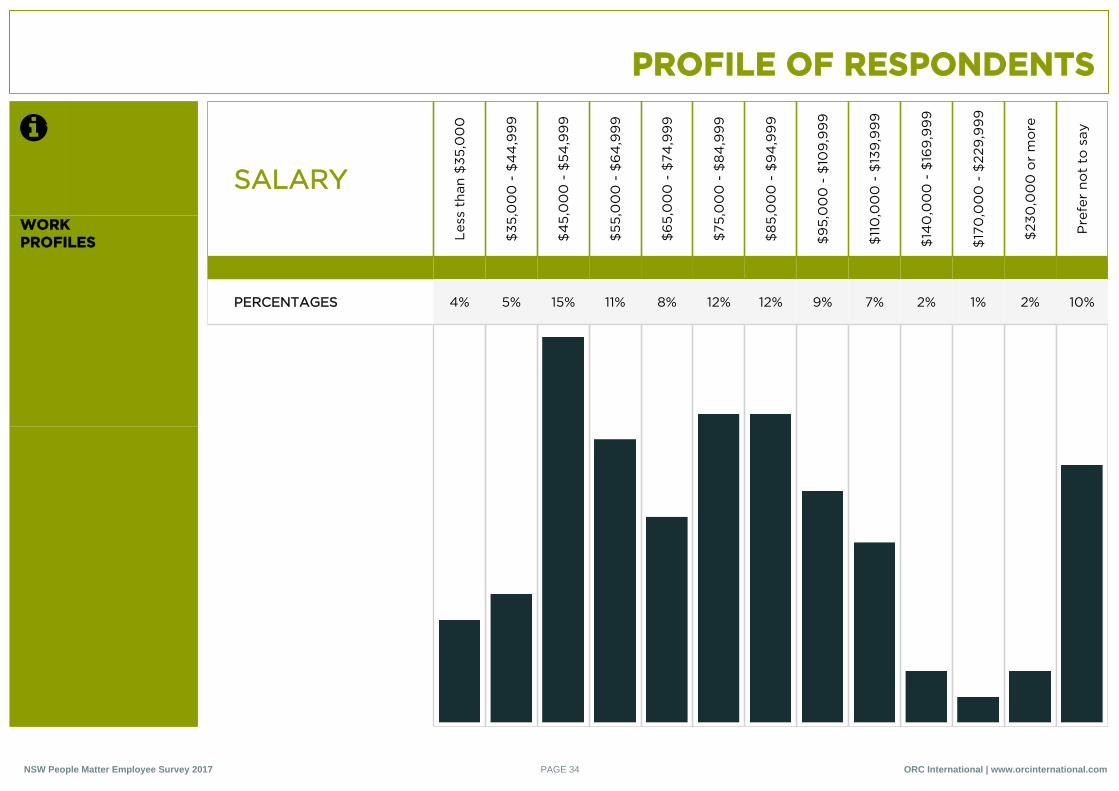
PROFILE OF RESPONDENTS
WORKPROFILES
SALARY
Les
s th
an $
35,0
00
$35
,00
0 -
$4
4,9
99
$4
5,0
00
- $
54,9
99
$55
,00
0 -
$6
4,9
99
$6
5,0
00
- $
74,9
99
$75
,00
0 -
$8
4,9
99
$8
5,0
00
- $
94
,99
9
$9
5,0
00
- $
109
,99
9
$11
0,0
00
- $
139
,99
9
$14
0,0
00
- $
169
,99
9
$17
0,0
00
- $
229
,99
9
$23
0,0
00
or
mo
re
Pre
fer
not
to s
ay
PERCENTAGES 4% 5% 15% 11% 8% 12% 12% 9% 7% 2% 1% 2% 10%
ORC International | www.orcinternational.comPAGE 34NSW People Matter Employee Survey 2017

RESULT BY TYPE OF WORK
EXPLORE THE RESULTS FOR DIFFERENT GROUPS OF EMPLOYEES
The Employee Engagement score is weighted. It cannot be compared to the other scores which are the average of the % agreement results (strongly agree and agree scores).
Differences have been highlighted where they are 5 or more % points above or below the scores in the first column.
NS
W H
ealt
h P
atho
log
y
Ser
vice
del
iver
y in
volv
ing
dir
ect
cont
act
wit
h th
e g
ener
al p
ublic
Oth
er s
ervi
ce d
eliv
ery
wo
rk
Ad
min
istr
ativ
e su
pp
ort
(e.
g.
exec
utiv
e/p
erso
nal a
ssis
tant
, re
cep
tio
nist
)
Co
rpo
rate
ser
vice
s
Po
licy
Res
earc
h
Pro
gra
m a
nd p
roje
ct m
anag
emen
t su
pp
ort
Leg
al (
incl
udin
g d
evel
op
ing
and
/or
revi
ewin
g le
gis
lati
on)
Oth
er
NUMBER OF RESPONDENTS 1667 343 529 131 120 3 14 19 3 422
EMPLOYEE ENGAGEMENT 60% 60% 56% 64% 70% (r) (r) (r) (r) 60%
ENGAGEMENT WITH WORK 68% 71% 63% 76% 71% (r) (r) (r) (r) 66%
SENIOR MANAGERS 38% 34% 33% 45% 59% (r) (r) (r) (r) 39%
COMMUNICATION 53% 49% 50% 57% 72% (r) (r) (r) (r) 53%
HIGH PERFORMANCE 57% 55% 53% 62% 70% (r) (r) (r) (r) 57%
PUBLIC SECTOR VALUES 53% 50% 49% 58% 69% (r) (r) (r) (r) 53%
DIVERSITY & INCLUSION 61% 58% 59% 68% 77% (r) (r) (r) (r) 61%
KEY AT LEAST 5 PERCENTAGE POINTS GREATER THAN REPORT SCORE
AT LEAST 5 PERCENTAGE POINTS LESS THAN REPORT SCORE
r = DATA RESTRICTED AS BELOW CUT OFF LIMIT OF 30 RESPONDENTS
ORC International | www.orcinternational.comPAGE 35NSW People Matter Employee Survey 2017

RESULT BY SALARY
EXPLORE THE RESULTS FOR DIFFERENT GROUPS OF EMPLOYEES
The Employee Engagement score is weighted. It cannot be compared to the other scores which are the average of the % agreement results (strongly agree and agree scores).
Differences have been highlighted where they are 5 or more % points above or below the scores in the first column.
NS
W H
ealt
h P
atho
log
y
Less
tha
n $
35,0
00
$35
,00
0 -
$4
4,9
99
$4
5,0
00
- $
54,9
99
$55
,00
0 -
$6
4,9
99
$6
5,0
00
- $
74,9
99
$75
,00
0 -
$8
4,9
99
$8
5,0
00
- $
94
,99
9
$9
5,0
00
- $
109
,99
9
$11
0,0
00
- $
139
,99
9
$14
0,0
00
- $
169
,99
9
$17
0,0
00
- $
229
,99
9
$23
0,0
00
or
mo
re
Pre
fer
not
to s
ay
NUMBER OF RESPONDENTS 1667 66 76 244 181 132 191 196 147 113 26 8 32 164
EMPLOYEE ENGAGEMENT 60% 60% 61% 62% 62% 62% 56% 56% 57% 65% (r) (r) 69% 56%
ENGAGEMENT WITH WORK 68% 68% 67% 72% 72% 69% 64% 66% 62% 75% (r) (r) 77% 59%
SENIOR MANAGERS 38% 36% 40% 40% 35% 34% 32% 36% 38% 54% (r) (r) 61% 33%
COMMUNICATION 53% 45% 53% 55% 53% 51% 49% 51% 56% 63% (r) (r) 69% 47%
HIGH PERFORMANCE 57% 57% 59% 60% 56% 56% 54% 54% 56% 65% (r) (r) 71% 51%
PUBLIC SECTOR VALUES 53% 50% 55% 54% 52% 49% 48% 50% 53% 65% (r) (r) 73% 47%
DIVERSITY & INCLUSION 61% 55% 65% 65% 65% 60% 56% 61% 62% 71% (r) (r) 72% 55%
KEY AT LEAST 5 PERCENTAGE POINTS GREATER THAN REPORT SCORE
AT LEAST 5 PERCENTAGE POINTS LESS THAN REPORT SCORE
r = DATA RESTRICTED AS BELOW CUT OFF LIMIT OF 30 RESPONDENTS
ORC International | www.orcinternational.comPAGE 36NSW People Matter Employee Survey 2017

RESULT BY TENURE IN ORGANISATION
EXPLORE THE RESULTS FOR DIFFERENT GROUPS OF EMPLOYEES
The Employee Engagement score is weighted. It cannot be compared to the other scores which are the average of the % agreement results (strongly agree and agree scores).
Differences have been highlighted where they are 5 or more % points above or below the scores in the first column.
NS
W H
ealt
h P
atho
log
y
Less
tha
n 1
year
1 -
2 ye
ars
2 -
5 ye
ars
5 -
10 y
ears
10 -
20
yea
rs
Mo
re t
han
20 y
ears
NUMBER OF RESPONDENTS 1667 127 166 308 302 378 285
EMPLOYEE ENGAGEMENT 60% 73% 67% 62% 55% 55% 57%
ENGAGEMENT WITH WORK 68% 82% 77% 69% 61% 62% 67%
SENIOR MANAGERS 38% 58% 46% 42% 33% 30% 34%
COMMUNICATION 53% 71% 63% 56% 47% 48% 48%
HIGH PERFORMANCE 57% 75% 66% 61% 52% 51% 52%
PUBLIC SECTOR VALUES 53% 70% 61% 56% 48% 47% 49%
DIVERSITY & INCLUSION 61% 78% 72% 66% 55% 57% 57%
KEY AT LEAST 5 PERCENTAGE POINTS GREATER THAN REPORT SCORE
AT LEAST 5 PERCENTAGE POINTS LESS THAN REPORT SCORE
r = DATA RESTRICTED AS BELOW CUT OFF LIMIT OF 30 RESPONDENTS
ORC International | www.orcinternational.comPAGE 37NSW People Matter Employee Survey 2017

RESULT BY AGE
EXPLORE THE RESULTS FOR DIFFERENT GROUPS OF EMPLOYEES
The Employee Engagement score is weighted. It cannot be compared to the other scores which are the average of the % agreement results (strongly agree and agree scores).
Differences have been highlighted where they are 5 or more % points above or below the scores in the first column.
NS
W H
ealt
h P
atho
log
y
15 -
19
20 -
24
25 -
29
30 -
34
35 -
39
40
- 4
4
45
- 4
9
50 -
54
55 -
59
60
- 6
4
65+
NUMBER OF RESPONDENTS 1667 1 47 148 176 204 231 216 214 193 103 38
EMPLOYEE ENGAGEMENT 60% (r) 71% 58% 60% 60% 60% 61% 60% 61% 55% 66%
ENGAGEMENT WITH WORK 68% (r) 81% 62% 71% 64% 65% 69% 69% 71% 66% 82%
SENIOR MANAGERS 38% (r) 52% 35% 38% 39% 38% 38% 39% 40% 31% 49%
COMMUNICATION 53% (r) 67% 55% 57% 54% 51% 54% 52% 53% 43% 64%
HIGH PERFORMANCE 57% (r) 73% 59% 59% 57% 57% 56% 56% 57% 50% 61%
PUBLIC SECTOR VALUES 53% (r) 67% 51% 55% 52% 52% 53% 53% 54% 48% 64%
DIVERSITY & INCLUSION 61% (r) 80% 64% 65% 61% 61% 61% 63% 62% 55% 69%
KEY AT LEAST 5 PERCENTAGE POINTS GREATER THAN REPORT SCORE
AT LEAST 5 PERCENTAGE POINTS LESS THAN REPORT SCORE
r = DATA RESTRICTED AS BELOW CUT OFF LIMIT OF 30 RESPONDENTS
ORC International | www.orcinternational.comPAGE 38NSW People Matter Employee Survey 2017

RESULT BY GENDER
EXPLORE THE RESULTS FOR DIFFERENT GROUPS OF EMPLOYEES
The Employee Engagement score is weighted. It cannot be compared to the other scores which are the average of the % agreement results (strongly agree and agree scores).
Differences have been highlighted where they are 5 or more % points above or below the scores in the first column.
NS
W H
ealt
h P
atho
log
y
Mal
e
Fem
ale
Oth
er
NUMBER OF RESPONDENTS 1667 413 1135 21
EMPLOYEE ENGAGEMENT 60% 60% 60% (r)
ENGAGEMENT WITH WORK 68% 68% 68% (r)
SENIOR MANAGERS 38% 41% 37% (r)
COMMUNICATION 53% 56% 52% (r)
HIGH PERFORMANCE 57% 60% 56% (r)
PUBLIC SECTOR VALUES 53% 56% 52% (r)
DIVERSITY & INCLUSION 61% 64% 61% (r)
KEY AT LEAST 5 PERCENTAGE POINTS GREATER THAN REPORT SCORE
AT LEAST 5 PERCENTAGE POINTS LESS THAN REPORT SCORE
r = DATA RESTRICTED AS BELOW CUT OFF LIMIT OF 30 RESPONDENTS
ORC International | www.orcinternational.comPAGE 39NSW People Matter Employee Survey 2017
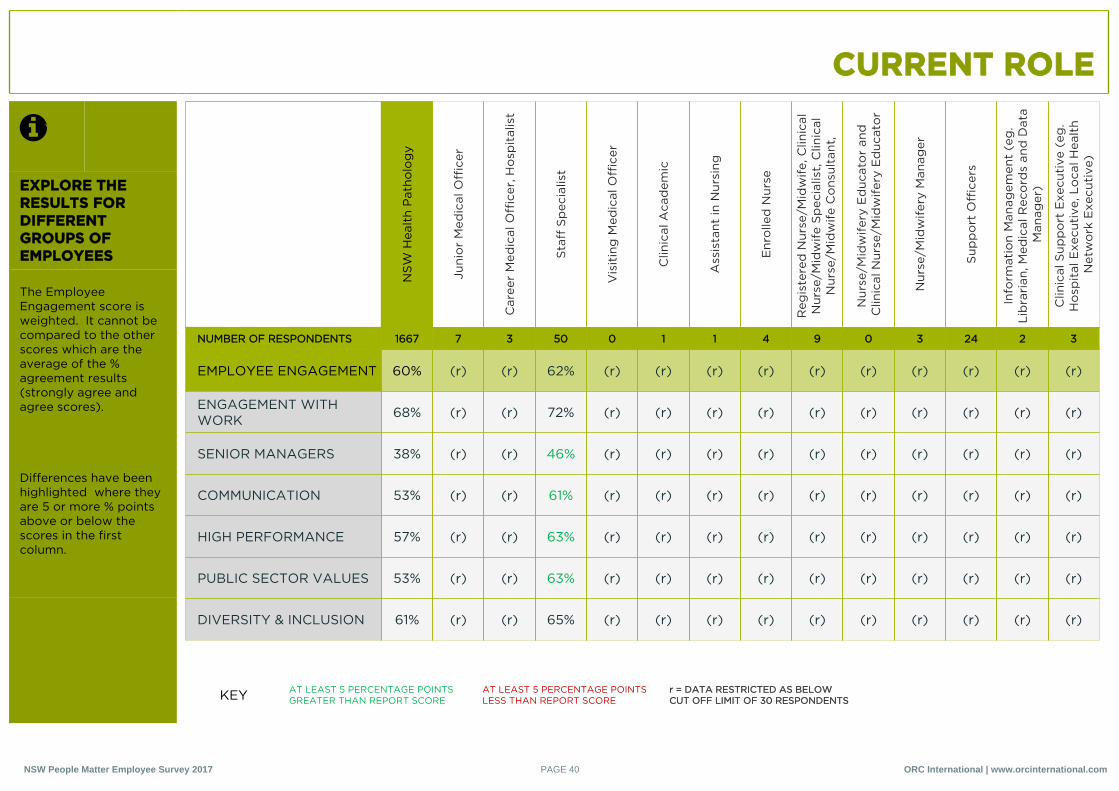
CURRENT ROLE
EXPLORE THE RESULTS FOR DIFFERENT GROUPS OF EMPLOYEES
The Employee Engagement score is weighted. It cannot be compared to the other scores which are the average of the % agreement results (strongly agree and agree scores).
Differences have been highlighted where they are 5 or more % points above or below the scores in the first column.
NS
W H
ealt
h P
atho
log
y
Juni
or
Med
ical
Off
icer
Car
eer
Med
ical
Off
icer
, Ho
spit
alis
t
Sta
ff S
pec
ialis
t
Vis
itin
g M
edic
al O
ffic
er
Clin
ical
Aca
dem
ic
Ass
ista
nt in
Nur
sing
Enr
olle
d N
urse
Reg
iste
red
Nur
se/M
idw
ife,
Clin
ical
N
urse
/Mid
wif
e S
pec
ialis
t, C
linic
al
Nur
se/M
idw
ife
Co
nsul
tant
, P
ract
itio
ner
Nur
se/M
idw
ifer
y E
duc
ato
r an
d
Clin
ical
Nur
se/M
idw
ifer
y E
duc
ato
r
Nur
se/M
idw
ifer
y M
anag
er
Sup
po
rt O
ffic
ers
Info
rmat
ion
Man
agem
ent
(eg
. Li
bra
rian
, Med
ical
Rec
ord
s an
d D
ata
Man
ager
)
Clin
ical
Sup
po
rt E
xecu
tive
(eg
. H
osp
ital
Exe
cuti
ve, L
oca
l Hea
lth
Net
wo
rk E
xecu
tive
)
NUMBER OF RESPONDENTS 1667 7 3 50 0 1 1 4 9 0 3 24 2 3
EMPLOYEE ENGAGEMENT 60% (r) (r) 62% (r) (r) (r) (r) (r) (r) (r) (r) (r) (r)
ENGAGEMENT WITH WORK 68% (r) (r) 72% (r) (r) (r) (r) (r) (r) (r) (r) (r) (r)
SENIOR MANAGERS 38% (r) (r) 46% (r) (r) (r) (r) (r) (r) (r) (r) (r) (r)
COMMUNICATION 53% (r) (r) 61% (r) (r) (r) (r) (r) (r) (r) (r) (r) (r)
HIGH PERFORMANCE 57% (r) (r) 63% (r) (r) (r) (r) (r) (r) (r) (r) (r) (r)
PUBLIC SECTOR VALUES 53% (r) (r) 63% (r) (r) (r) (r) (r) (r) (r) (r) (r) (r)
DIVERSITY & INCLUSION 61% (r) (r) 65% (r) (r) (r) (r) (r) (r) (r) (r) (r) (r)
KEY AT LEAST 5 PERCENTAGE POINTS GREATER THAN REPORT SCORE
AT LEAST 5 PERCENTAGE POINTS LESS THAN REPORT SCORE
r = DATA RESTRICTED AS BELOW CUT OFF LIMIT OF 30 RESPONDENTS
ORC International | www.orcinternational.comPAGE 40NSW People Matter Employee Survey 2017

CURRENT ROLE
EXPLORE THE RESULTS FOR DIFFERENT GROUPS OF EMPLOYEES
The Employee Engagement score is weighted. It cannot be compared to the other scores which are the average of the % agreement results (strongly agree and agree scores).
Differences have been highlighted where they are 5 or more % points above or below the scores in the first column.
NS
W H
ealt
h P
atho
log
y
Ad
min
istr
ativ
e an
d E
xecu
tive
A
ssis
tant
Co
rpo
rate
Ser
vice
s
Sen
ior
Man
ager
/Exe
cuti
ve
Alli
ed H
ealt
h P
rofe
ssio
nal
Alli
ed H
ealt
h A
ssis
tant
Hea
lth
Ed
ucat
ion,
Hea
lth
Pro
mo
tio
n an
d H
ealt
h P
rote
ctio
n
Co
unse
llor,
Wel
fare
Sup
po
rt
Inte
rpre
ters
and
Lia
iso
n O
ffic
er
Ab
ori
gin
al H
ealt
h W
ork
ers
and
A
bo
rig
inal
Ed
ucat
ion
Off
icer
s
Tec
hnic
ian/
Tec
hno
log
ist
Ho
spit
al S
cien
tist
/Bio
med
ical
E
ngin
eers
Res
earc
hers
Dat
a A
naly
st
NUMBER OF RESPONDENTS 1667 101 81 44 29 17 1 0 0 1 108 421 6 10
EMPLOYEE ENGAGEMENT 60% 65% 67% 79% (r) (r) (r) (r) (r) (r) 57% 54% (r) (r)
ENGAGEMENT WITH WORK 68% 74% 70% 87% (r) (r) (r) (r) (r) (r) 65% 63% (r) (r)
SENIOR MANAGERS 38% 47% 55% 78% (r) (r) (r) (r) (r) (r) 28% 32% (r) (r)
COMMUNICATION 53% 59% 67% 82% (r) (r) (r) (r) (r) (r) 44% 49% (r) (r)
HIGH PERFORMANCE 57% 64% 65% 82% (r) (r) (r) (r) (r) (r) 50% 52% (r) (r)
PUBLIC SECTOR VALUES 53% 60% 65% 83% (r) (r) (r) (r) (r) (r) 44% 49% (r) (r)
DIVERSITY & INCLUSION 61% 69% 74% 87% (r) (r) (r) (r) (r) (r) 53% 57% (r) (r)
KEY AT LEAST 5 PERCENTAGE POINTS GREATER THAN REPORT SCORE
AT LEAST 5 PERCENTAGE POINTS LESS THAN REPORT SCORE
r = DATA RESTRICTED AS BELOW CUT OFF LIMIT OF 30 RESPONDENTS
ORC International | www.orcinternational.comPAGE 41NSW People Matter Employee Survey 2017

CURRENT ROLE
EXPLORE THE RESULTS FOR DIFFERENT GROUPS OF EMPLOYEES
The Employee Engagement score is weighted. It cannot be compared to the other scores which are the average of the % agreement results (strongly agree and agree scores).
Differences have been highlighted where they are 5 or more % points above or below the scores in the first column.
NS
W H
ealt
h P
atho
log
y
Tec
hnic
al O
ffic
ers/
Tec
hnic
al
Ass
ista
nt
Den
tal O
ffic
er, T
hera
pis
ts a
nd
Hyg
ieni
st
Den
tal S
pec
ialis
t
Den
tal A
ssis
tant
Tra
inee
Den
tal A
ssis
tant
Op
erat
iona
l Am
bul
ance
Off
icer
s (i
nclu
din
g E
duc
ato
rs, D
OM
, DO
CO
, P
aram
edic
, AO
OC
, OC
O, S
OC
O, S
O,
PT
O)
Op
erat
iona
l Am
bul
ance
Man
ager
s (i
ncl Z
one
Man
ager
s, D
eput
y D
irec
tor
Op
erat
ions
, Co
ntro
l Cen
tre
Man
ager
)
Pro
ject
Dir
ecto
r
Pro
ject
Man
ager
Pro
ject
Off
icer
Cle
anin
g, L
inen
and
Fo
od
Mo
tor
Veh
icle
, Pat
ient
Tra
nsp
ort
Sec
urit
y S
ervi
ces,
Fir
e S
afet
y
NUMBER OF RESPONDENTS 1667 452 0 0 0 0 0 0 0 6 8 3 3 0
EMPLOYEE ENGAGEMENT 60% 60% (r) (r) (r) (r) (r) (r) (r) (r) (r) (r) (r) (r)
ENGAGEMENT WITH WORK 68% 69% (r) (r) (r) (r) (r) (r) (r) (r) (r) (r) (r) (r)
SENIOR MANAGERS 38% 36% (r) (r) (r) (r) (r) (r) (r) (r) (r) (r) (r) (r)
COMMUNICATION 53% 50% (r) (r) (r) (r) (r) (r) (r) (r) (r) (r) (r) (r)
HIGH PERFORMANCE 57% 57% (r) (r) (r) (r) (r) (r) (r) (r) (r) (r) (r) (r)
PUBLIC SECTOR VALUES 53% 50% (r) (r) (r) (r) (r) (r) (r) (r) (r) (r) (r) (r)
DIVERSITY & INCLUSION 61% 61% (r) (r) (r) (r) (r) (r) (r) (r) (r) (r) (r) (r)
KEY AT LEAST 5 PERCENTAGE POINTS GREATER THAN REPORT SCORE
AT LEAST 5 PERCENTAGE POINTS LESS THAN REPORT SCORE
r = DATA RESTRICTED AS BELOW CUT OFF LIMIT OF 30 RESPONDENTS
ORC International | www.orcinternational.comPAGE 42NSW People Matter Employee Survey 2017

CURRENT ROLE
EXPLORE THE RESULTS FOR DIFFERENT GROUPS OF EMPLOYEES
The Employee Engagement score is weighted. It cannot be compared to the other scores which are the average of the % agreement results (strongly agree and agree scores).
Differences have been highlighted where they are 5 or more % points above or below the scores in the first column.
NS
W H
ealt
h P
atho
log
y
Res
iden
tial
Car
e A
tten
dan
t, P
atie
nt
Car
e A
ssis
tant
, Pat
ient
Ser
vice
s,
War
dsp
erso
n
War
eho
use
staf
f
Tra
des
per
son
Ap
pre
ntic
e T
rad
e W
ork
er a
nd T
rad
e A
ssis
tant
Tra
inee
Vo
lunt
eer
Oth
er jo
b r
ole
Pre
fer
not
to s
ay
NUMBER OF RESPONDENTS 1667 0 1 1 0 9 0 64 118
EMPLOYEE ENGAGEMENT 60% (r) (r) (r) (r) (r) (r) 70% 56%
ENGAGEMENT WITH WORK 68% (r) (r) (r) (r) (r) (r) 73% 59%
SENIOR MANAGERS 38% (r) (r) (r) (r) (r) (r) 46% 32%
COMMUNICATION 53% (r) (r) (r) (r) (r) (r) 67% 44%
HIGH PERFORMANCE 57% (r) (r) (r) (r) (r) (r) 67% 51%
PUBLIC SECTOR VALUES 53% (r) (r) (r) (r) (r) (r) 62% 46%
DIVERSITY & INCLUSION 61% (r) (r) (r) (r) (r) (r) 72% 54%
KEY AT LEAST 5 PERCENTAGE POINTS GREATER THAN REPORT SCORE
AT LEAST 5 PERCENTAGE POINTS LESS THAN REPORT SCORE
r = DATA RESTRICTED AS BELOW CUT OFF LIMIT OF 30 RESPONDENTS
ORC International | www.orcinternational.comPAGE 43NSW People Matter Employee Survey 2017

TAKING ACTION
WHAT'S NEXT?
Sector employees have now given their feedback and these results show where actions and improvements are required.
Research has shown that a key reason why employees can become disengaged is if they are asked their opinion and then no action takes place as a result.
30%of employees replied favourably to:
‘I believe action will be taken on the results from this survey by my organisation.’
34% 35% 28%SECTOR CLUSTER 2016
Agreement Neither Agree nor Disagree Disagreement
ORC International | www.orcinternational.comPAGE 44NSW People Matter Employee Survey 2017

GUIDE TO THIS REPORT
Responses from individual employees are confidential and strict rules are in place to safeguard privacy at every stage of the survey process.
There is no way of tracing individuals in reports or through the de-identified survey data. There are limits on the size of workgroups that can be reported (10 or more employees) and responses from demographic groups (30 or more employees).
Where people work in small teams, the results are merged with larger business units and results are not available. Where this happens an ‘r’ is shown in reports.
PRIVACY
Results are presented as whole numbers for ease of reading, with rounding performed at the last stage of the calculation for maximum accuracy.
Values from .00 to .49 are rounded down, whereas values from .50 to .99 are rounded up. Therefore, in some instances the data will not add up to 100%.
ROUNDING
See the Main Findings report on the Public Service Commission web site.
MORE DETAILS ABOUT THE SURVEY AND ITS METHODOLOGY
SURVEY TIME FRAME
This report contains results from the 2017 People Matter Employee Survey which was open from 1 to 30 June 2017.
HOW TO READ THIS REPORT
The majority of questions have a 5-point answer scale. The Strongly Agree and Agree scores are combined to create an agreement (or positive) score which is shown as a rounded percentage.
ORC International | www.orcinternational.comPAGE 45NSW People Matter Employee Survey 2017