Health Needs Assessment: Gypsy and Traveller Communities ...
48
Health Needs Assessment: Gypsy and Traveller Communities in Blackpool Introduction The UK is home to around 300,000 Gypsies and Travellers (Matthews, 2008). It is difficult to make an accurate estimate of how many are present in any given locality as they can often lead a nomadic lifestyle, though this is not always the case. Many Gypsies and Travellers reside in housing, rather than caravan sites but they can also be overlooked as there is no specific coding for these groups in the national census. The terms ‘Gypsy’ and ‘Traveller’ are applied to diverse communities with a rich cultural heritage that include: English Gypsies / Romany; Welsh Gypsies; Scottish Travellers; Irish Travellers; European Roma; Circus/Fairground/Showmen and New (Age) Travellers. English Gypsies and Irish Travellers are now officially recognised as ethnic minorities. Gypsies and Traveller communities vary in their travelling patterns, with some remaining static and only travelling for short periods, whereas others may travel on a seasonal basis or for very long periods. There is a lack of reliable research evidence on the health status of Gypsies and Travellers in the UK, though there are indicators of considerable health inequalities. They have poorer overall health than the general population and also poorer health than people not of Traveller origin living in socially deprived areas (Parry et al, 2007). There is also some evidence of significant differences in life expectancy between Irish Travellers and the rest of the population (Barry et al, 1987), as well as higher maternal death rates than other ethnic groups (Lewis, 2001). The needs of Gypsies and Travellers are not always considered in the design and delivery of health care services. Like any other minority group in the UK, they can have cultural, attitudinal and behavioural differences from the ‘general’ population. This is of major concern given the often poor health status of these communities. Gypsies and Travellers in Blackpool Blackpool has had long standing links with the Gypsy and Traveller community, in some reports, going back to the early 1800s, with the presence of Gypsy encampments as well as seasonal visiting. In the past, a biannual count of Gypsy and Traveller caravans has been undertaken on a non-mandatory basis by local authorities on behalf of Central Government. The nomadic lifestyle of many Gypsies and Travellers means that these surveys have only captured the number of caravans present on any given day and does not indicate how many people were living in them. There is also no indication of how many of these community members are living in more conventional housing.
Transcript of Health Needs Assessment: Gypsy and Traveller Communities ...
Health Needs Assessment: Gypsy and Traveller Communities in Blackpool
Introduction
The UK is home to around 300,000 Gypsies and Travellers (Matthews, 2008). It is difficult to make an accurate estimate of how many are present in any given locality as they can often lead a nomadic lifestyle, though this is not always the case. Many Gypsies and Travellers reside in housing, rather than caravan sites but they can also be overlooked as there is no specific coding for these groups in the national census.
The terms ‘Gypsy’ and ‘Traveller’ are applied to diverse communities with a rich cultural heritage that include: English Gypsies / Romany; Welsh Gypsies; Scottish Travellers; Irish Travellers; European Roma; Circus/Fairground/Showmen and New (Age) Travellers.
English Gypsies and Irish Travellers are now officially recognised as ethnic minorities.
Gypsies and Traveller communities vary in their travelling patterns, with some remaining static and only travelling for short periods, whereas others may travel on a seasonal basis or for very long periods.
There is a lack of reliable research evidence on the health status of Gypsies and Travellers in the UK, though there are indicators of considerable health inequalities. They have poorer overall health than the general population and also poorer health than people not of Traveller origin living in socially deprived areas (Parry et al, 2007).
There is also some evidence of significant differences in life expectancy between Irish Travellers and the rest of the population (Barry et al, 1987), as well as higher maternal death rates than other ethnic groups (Lewis, 2001).
The needs of Gypsies and Travellers are not always considered in the design and delivery of health care services. Like any other minority group in the UK, they can have cultural, attitudinal and behavioural differences from the ‘general’ population. This is of major concern given the often poor health status of these communities.
Gypsies and Travellers in Blackpool
Blackpool has had long standing links with the Gypsy and Traveller community, in some reports, going back to the early 1800s, with the presence of Gypsy encampments as well as seasonal visiting.
In the past, a biannual count of Gypsy and Traveller caravans has been undertaken on a non-mandatory basis by local authorities on behalf of Central Government. The nomadic lifestyle of many Gypsies and Travellers means that these surveys have only captured the number of caravans present on any given day and does not indicate how many people were living in them. There is also no indication of how many of these community members are living in more conventional housing.

The table below shows the results of the 2005 count in Blackpool and in Lancashire as a whole.
Blackpool
Date Total Unauthorised Encampments
Plots on Authorised Sites: Council
Plots on Authorised Sites: Private
Jan 2005 71 0 41 30
Lancashire
Date Total Unauthorised Encampments
Plots on Authorised Sites: Council
Plots on Authorised Sites: Private
Jan 2005 223 28 65 130
Where the sites are located
The council managed Traveller site is at Chapel Road in Marton. There is also one privately-owned site on Whalley Lane in Clifton.
Blackpool also has a number of Gypsies and Travellers living in more conventional housing, though it is difficult to estimate how many as some may not identify themselves to services as being of Gypsy and Traveller origin or this may not even be an option on routine ethnicity monitoring.
Blackpool Gypsy and Traveller Health Needs Assessment
Little or no data exists on the health status of the local Gypsy and Traveller population in Blackpool
The information that does exist focuses on attitudes towards various health issues and services, such as mental health problems and routine immunisation and vaccination and the majority of this information is anecdotal at best.
A small-scale health needs assessment was carried out in 2010 to try and develop a profile of this population.
Study Aims
To carry out a health needs assessment of Blackpool’s Gypsy and Traveller communities, that will provide an evidence base to support the development of future and current services
To obtain a baseline profile of the health needs of this minority population, to ensure that services are developed in ways that meet their needs
To gain an understanding of the experience of service providers’ working with these communities
Objectives
Obtain the views of community members, health and other professionals
Establish key priorities for addressing unmet needs, including service development
The Project Team consisted of:
NHS Blackpool Public Health Directorate
Richard O’Neill Consulting
Members of the Cumbria and Blackpool Gypsy and Traveller Community
What was done:
The study consisted of the following:
Structured interviews with individuals from Blackpool’s Gypsy and Traveller Community to gather information on health status, health needs and access to services
Focus groups with community members, exploring health beliefs and experience of health services
Questionnaires sent to health and other professionals, exploring their experience of working with Gypsy and Traveller communities
Originally, the project plan had included two focus groups, one with women and the other with men. However, despite repeated attempts it proved difficult to arrange a focus group with men. The topic areas for the women’s focus group are outlined in Appendix 1.
The project group developed a questionnaire for the structured interviews using a set of questions that had been used for a similar study of the Traveller population in Cumbria. A total of 37 interviews were completed using this revised questionnaire (Appendix 2). A member of the Gypsy Traveller community was contracted to lead the data collection and was responsible for recruiting and coordinating community members to carry out the interviews. Unfortunately, it proved to be challenging to recruit locally and GRT community members from Cumbria were also used.
A further two questionnaires were developed, one for use with health professionals and one for non-health professionals and this was also based on an original questionnaire used for the study in Cumbria (Appendices 3 & 4). The relevant questionnaire and an explanatory
letter were sent to a number of groups including school nurses and health visitors, Children’s Centre staff, GPs and practice nurses, social care staff and police officers.
Gypsy Traveller health awareness sessions were also provided and invitations were sent to statutory and voluntary sector organisations. Participants at these sessions were asked to complete a questionnaire before attending the session.
A total of 68 questionnaires were completed by health professionals and 22 by non-health professionals.
All draft questionnaires and focus group topics were further developed by the project group and wider stakeholders before they were finalised.
Analysis
The focus group was recorded using hand written notes. The questionnaires were analysed using number of respondents and percentages
Traveller Community Questionnaire
Demographic Profile of Respondents:
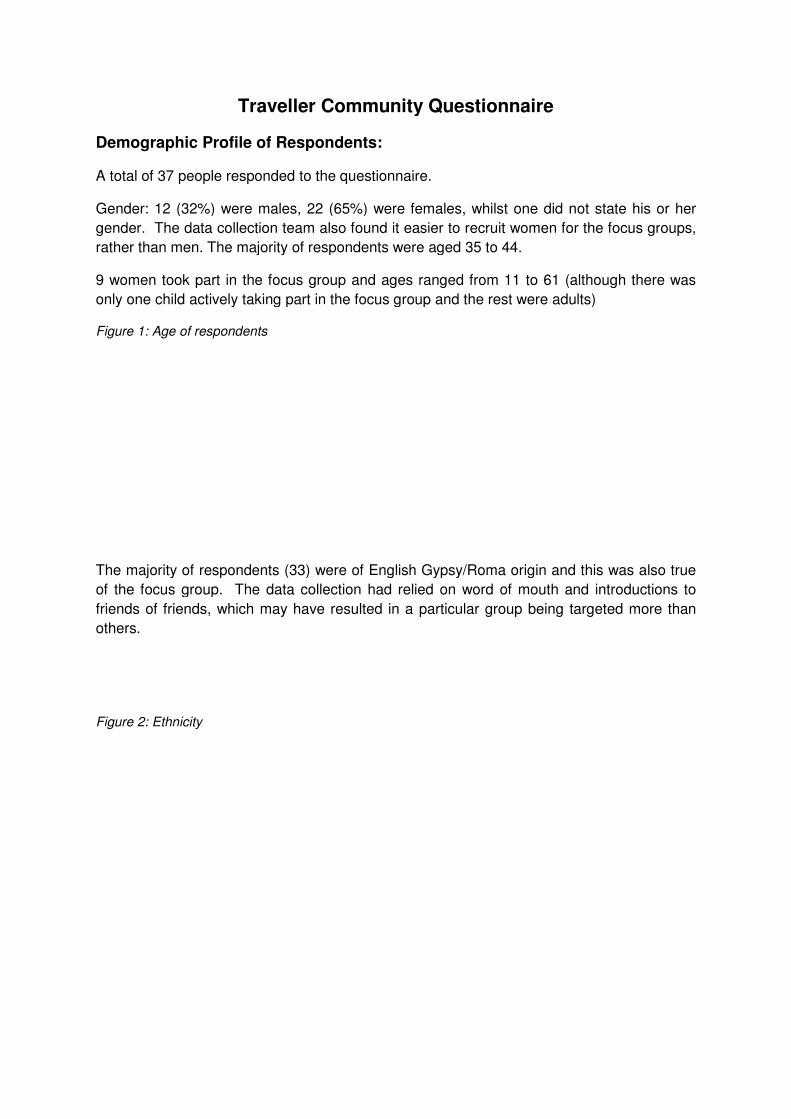
A total of 37 people responded to the questionnaire.
Gender: 12 (32%) were males, 22 (65%) were females, whilst one did not state his or her gender. The data collection team also found it easier to recruit women for the focus grrather than men. The majority of respondents were aged 35 to 44.
9 women took part in the focus group and ages ranged from 11 to 61 (although there was only one child actively taking part in the focus group and the rest were adults)
Figure 1: Age of respondents
The majority of respondents (33) were of English Gypsy/Roma origin and this was also true of the focus group. The data collection had relied on word of mouth and introductions to friends of friends, which may have resulted in a particular grothers.
Figure 2: Ethnicity
Traveller Community Questionnaire
Profile of Respondents:
A total of 37 people responded to the questionnaire.
Gender: 12 (32%) were males, 22 (65%) were females, whilst one did not state his or her gender. The data collection team also found it easier to recruit women for the focus grrather than men. The majority of respondents were aged 35 to 44.
9 women took part in the focus group and ages ranged from 11 to 61 (although there was only one child actively taking part in the focus group and the rest were adults)
The majority of respondents (33) were of English Gypsy/Roma origin and this was also true of the focus group. The data collection had relied on word of mouth and introductions to friends of friends, which may have resulted in a particular group being targeted more than
Gender: 12 (32%) were males, 22 (65%) were females, whilst one did not state his or her gender. The data collection team also found it easier to recruit women for the focus groups,
9 women took part in the focus group and ages ranged from 11 to 61 (although there was only one child actively taking part in the focus group and the rest were adults)
The majority of respondents (33) were of English Gypsy/Roma origin and this was also true of the focus group. The data collection had relied on word of mouth and introductions to
oup being targeted more than
Figure 3: Area of Residence
The majority of respondents were from Clifton. 21 out of 37 (57%) respondents stated they were located in privately owned accommodation, 11 (30%) stated they wereowned accommodation, whilst 5 (13%) did not identify ownership.
Table 1: Accommodation Type
Accommodation type Male
Trailer 0
Caravan 2
House 10
Total 12
The majority (24 out of 37 [65%]) of respondents stated they lived in houses, 10 (27%) stated they lived in trailers, while 3 (8%) stated they lived in a caravan, challenging the common perception that most Travellers reside in trailers or caravans.
When asked whether they were lmonths, most respondents answered negatively 26 (70%). The focus group participants stated that many people tended to travel in summer, whereas older people settled in one place all year round.
Table 2: Likely to Leave Current Accommodation by Gender
Response Male Female
Yes 5
No 7
Maybe
Total 12
The majority of respondents were from Clifton. 21 out of 37 (57%) respondents stated they were located in privately owned accommodation, 11 (30%) stated they wereowned accommodation, whilst 5 (13%) did not identify ownership.
Female Unknown Total
10 0 10
1 0 3
13 1 24
24 1 37
37 [65%]) of respondents stated they lived in houses, 10 (27%) stated they lived in trailers, while 3 (8%) stated they lived in a caravan, challenging the common perception that most Travellers reside in trailers or caravans.
When asked whether they were likely to leave their current accommodation within the next 3 months, most respondents answered negatively 26 (70%). The focus group participants stated that many people tended to travel in summer, whereas older people settled in one
Table 2: Likely to Leave Current Accommodation by Gender
Female Unknown Total
3 8
18 1 26
3 3
24 1 37
The majority of respondents were from Clifton. 21 out of 37 (57%) respondents stated they were located in privately owned accommodation, 11 (30%) stated they were living in council-
37 [65%]) of respondents stated they lived in houses, 10 (27%) stated they lived in trailers, while 3 (8%) stated they lived in a caravan, challenging the
ikely to leave their current accommodation within the next 3 months, most respondents answered negatively 26 (70%). The focus group participants stated that many people tended to travel in summer, whereas older people settled in one
�
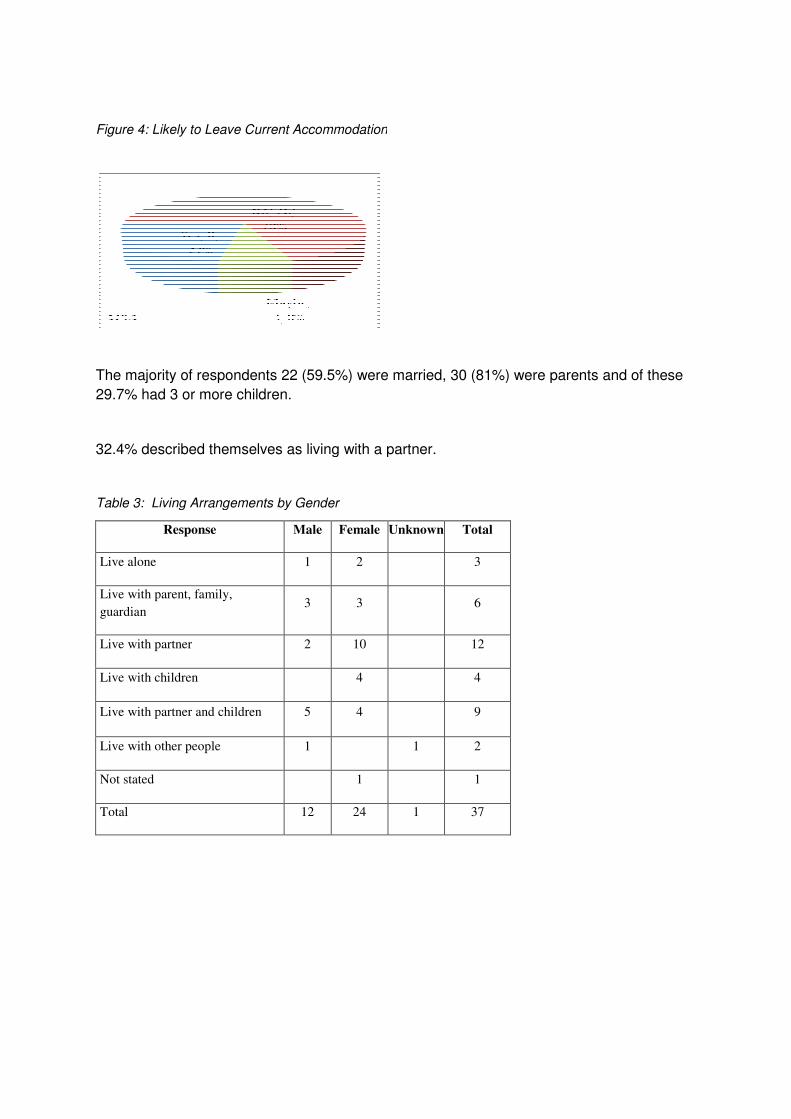
Figure 4: Likely to Leave Current Accommodation
The majority of respondents 22 (59.5%) were married, 30 (81%) were parents and of these 29.7% had 3 or more children.
32.4% described themselves as living with a partner.
Table 3: Living Arrangements by Gender
Response
Live alone
Live with parent, family, guardian
Live with partner
Live with children
Live with partner and children
Live with other people
Not stated
Total
Figure 4: Likely to Leave Current Accommodation
The majority of respondents 22 (59.5%) were married, 30 (81%) were parents and of these 29.7% had 3 or more children.
32.4% described themselves as living with a partner.
Table 3: Living Arrangements by Gender
Male Female Unknown Total
1 2 3
3 3 6
2 10 12
4 4
5 4 9
1 1 2
1 1
12 24 1 37
The majority of respondents 22 (59.5%) were married, 30 (81%) were parents and of these
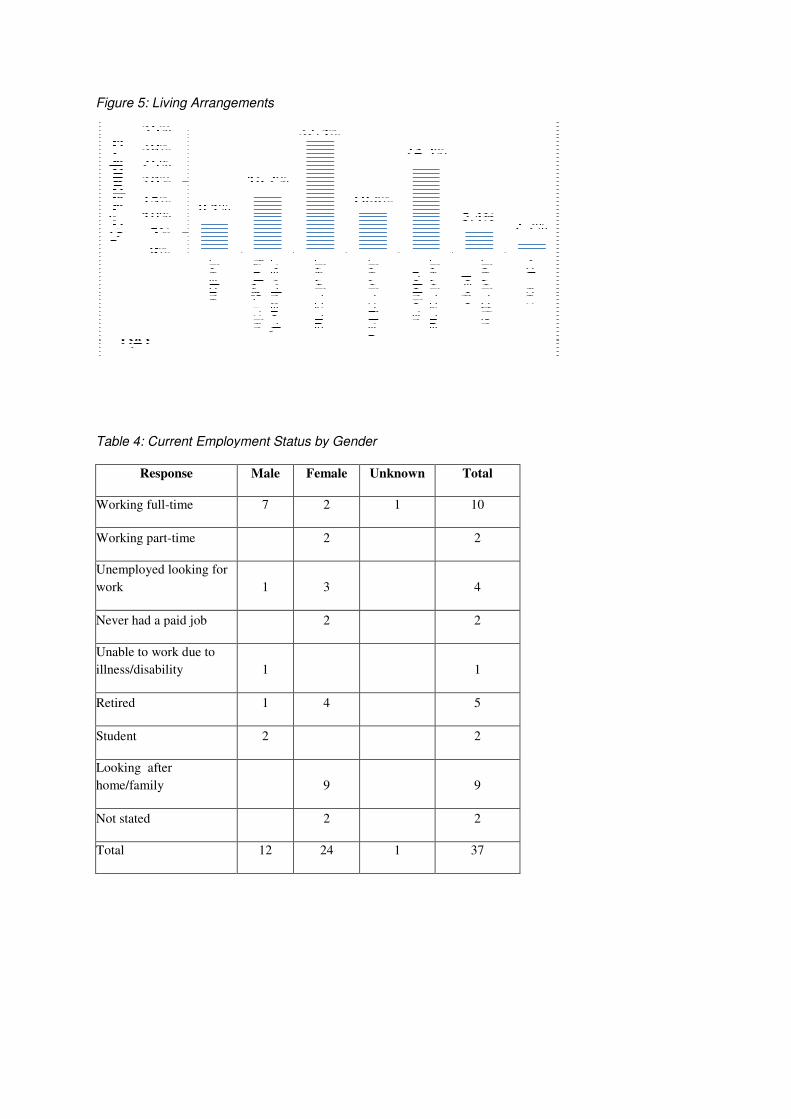
Figure 5: Living Arrangements
Table 4: Current Employment Status by Gender
Response Male
Working full-time 7
Working part-time
Unemployed looking for work 1
Never had a paid job
Unable to work due to illness/disability 1
Retired 1
Student 2
Looking after home/family
Not stated
Total 12
Table 4: Current Employment Status by Gender
Female Unknown Total
2 1 10
2 2
3 4
2 2
1
4 5
2
9 9
2 2
24 1 37
Figure 6: Current Employment Status
27% of respondents worked fullbeing female. 10.8% were unemployed.
Current Health Status
When asked, ‘In general, how would you say your health is?’ 10 out of the 37 (27%) respondents stated their health was good, whilst 5 out of 37 (13.5%) stated that their health was poor and all of these were female.
Figure 7: Current Health Status
Current Health Status Compared to Previous Year
Comparing their current health status to the previous year’s, 18 out of 37 (48.6%) respondents stated their health had remained about the same whilst 3 (8.1%), stated their health had become much worse and the same number stated their health had become somewhat better. These 6 respondents were all female.
Figure 6: Current Employment Status
27% of respondents worked full-time and 24.3% looked after their home/family, all of them were unemployed.
When asked, ‘In general, how would you say your health is?’ 10 out of the 37 (27%) respondents stated their health was good, whilst 5 out of 37 (13.5%) stated that their health was poor and all of these were female.
Current Health Status Compared to Previous Year
Comparing their current health status to the previous year’s, 18 out of 37 (48.6%) respondents stated their health had remained about the same whilst 3 (8.1%), stated their health had become much worse and the same number stated their health had become
ewhat better. These 6 respondents were all female.
time and 24.3% looked after their home/family, all of them
When asked, ‘In general, how would you say your health is?’ 10 out of the 37 (27%) respondents stated their health was good, whilst 5 out of 37 (13.5%) stated that their health
Comparing their current health status to the previous year’s, 18 out of 37 (48.6%) respondents stated their health had remained about the same whilst 3 (8.1%), stated their health had become much worse and the same number stated their health had become
Figure 8: Current Health Status Compared to Previous Year
Does Your Health Limit You
16 out of the 37 (44%) respondents stated that their health did not limit vigorous activities, whilst 6 (17%) stated their health limited vigorous activity a lot (4 females and 2 males) 8 females and 5 males described themselves as being limited a little. Vigorous physical activity included activities such as participating in strenuous sports and lifting heavy obj
Figure 9: Self reported effect of current health status on vigorous physical activity
25 out of the 37 respondents (69%) stated their health did not limit moderate activity, whilst 4 (11%) stated their health limited moderate activity a lot (3 physical activity included activities such as bowling or moving a table.
Figure 10: Effect of Current Health Status on Moderate Physical Activity
Figure 8: Current Health Status Compared to Previous Year
Does Your Health Limit You
16 out of the 37 (44%) respondents stated that their health did not limit vigorous activities, tated their health limited vigorous activity a lot (4 females and 2 males) 8
females and 5 males described themselves as being limited a little. Vigorous physical activity included activities such as participating in strenuous sports and lifting heavy obj
Figure 9: Self reported effect of current health status on vigorous physical activity
25 out of the 37 respondents (69%) stated their health did not limit moderate activity, whilst 4 (11%) stated their health limited moderate activity a lot (3 females and 1 male). Moderate physical activity included activities such as bowling or moving a table.
Figure 10: Effect of Current Health Status on Moderate Physical Activity
16 out of the 37 (44%) respondents stated that their health did not limit vigorous activities, tated their health limited vigorous activity a lot (4 females and 2 males) 8
females and 5 males described themselves as being limited a little. Vigorous physical activity included activities such as participating in strenuous sports and lifting heavy objects.
Figure 9: Self reported effect of current health status on vigorous physical activity
25 out of the 37 respondents (69%) stated their health did not limit moderate activity, whilst 4 females and 1 male). Moderate
12 out of 36 (33%) respondents stated their physical health made them cut amount of time they spent on work or other activities (9 females and 3 males), whilst 24 (67%) state they had no such experience.
Figure 11: Effect of Physical Health on Work and other Activities
12 out of the 35 (34%) respondents than they would have liked (9 females and 2 males), whilst 23 (64%) did not have such experiences.
Figure 12: Effect of Physical Health on Accomplishments
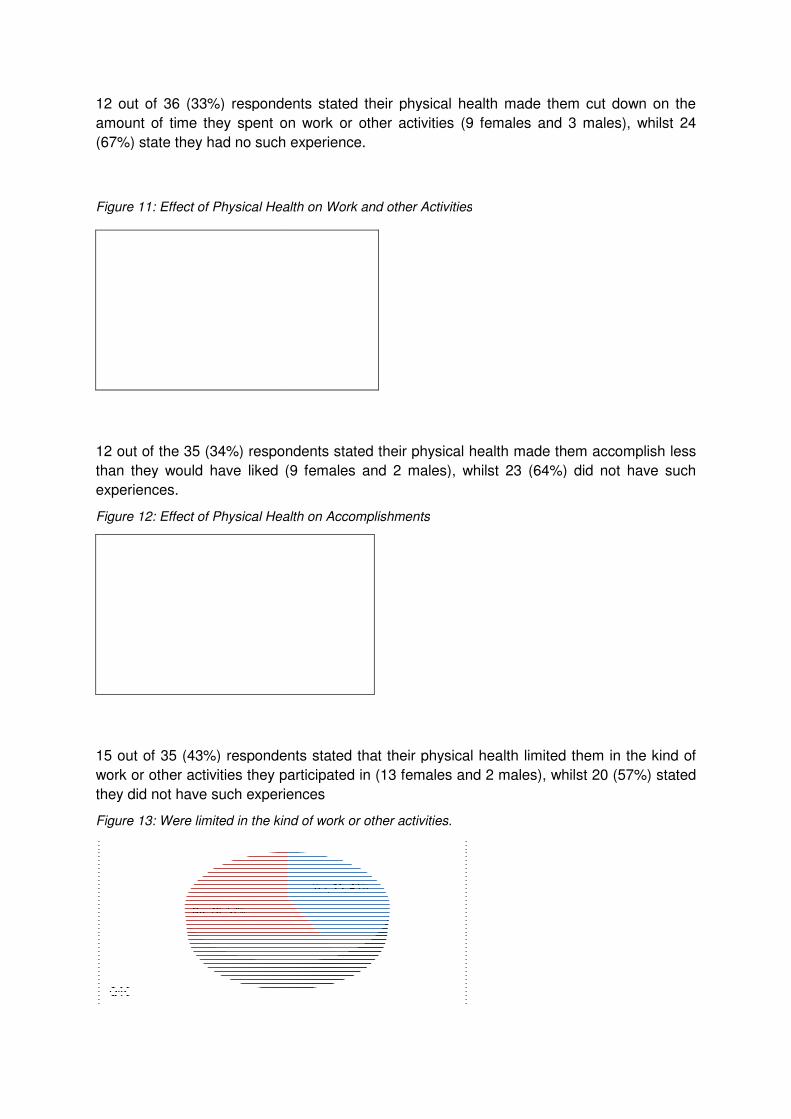
15 out of 35 (43%) respondents statedwork or other activities they participated in (13 females and 2 males), whilst 20 (57%) stated they did not have such experiences
Figure 13: Were limited in the kind of work or other activities.
12 out of 36 (33%) respondents stated their physical health made them cut amount of time they spent on work or other activities (9 females and 3 males), whilst 24 (67%) state they had no such experience.
Figure 11: Effect of Physical Health on Work and other Activities
12 out of the 35 (34%) respondents stated their physical health made them accomplish less than they would have liked (9 females and 2 males), whilst 23 (64%) did not have such
Figure 12: Effect of Physical Health on Accomplishments
15 out of 35 (43%) respondents stated that their physical health limited them in the kind of work or other activities they participated in (13 females and 2 males), whilst 20 (57%) stated they did not have such experiences
Figure 13: Were limited in the kind of work or other activities.
12 out of 36 (33%) respondents stated their physical health made them cut down on the amount of time they spent on work or other activities (9 females and 3 males), whilst 24
stated their physical health made them accomplish less than they would have liked (9 females and 2 males), whilst 23 (64%) did not have such
that their physical health limited them in the kind of work or other activities they participated in (13 females and 2 males), whilst 20 (57%) stated
17 out of 36 respondents stated their physical health made it difficult for them performing their work or other activities (14 females and 3 males) while 19 stated they did not have such experiences.
Figure 14: Had difficulty performing work or other activit
Effect of emotional health problems
13 out of 34 (38%) respondents stated their emotional health problems made them cut down on the amount of time you spent on work or other activities (10 females and 3 males) while 21 (62%) stated they did not have such experiences.
Figure 15: Cut down on the amount of time you spent on work or other activities.
14 out of 37 (37.8%) respondents stated their health problems had no effect on their social activities while 3 (16.2%) stateactivities (3 females and 0 males). 9 out of 37 felt that their health problems had a moderate effect (5 females and 3 males).
out of 36 respondents stated their physical health made it difficult for them performing their work or other activities (14 females and 3 males) while 19 stated they did not have such
Figure 14: Had difficulty performing work or other activities (e.g. it took extra effort)
Effect of emotional health problems
13 out of 34 (38%) respondents stated their emotional health problems made them cut down on the amount of time you spent on work or other activities (10 females and 3 males) while
62%) stated they did not have such experiences.
Figure 15: Cut down on the amount of time you spent on work or other activities.
14 out of 37 (37.8%) respondents stated their health problems had no effect on their social activities while 3 (16.2%) stated their health problems extremely interfered with their social activities (3 females and 0 males). 9 out of 37 felt that their health problems had a moderate effect (5 females and 3 males).
out of 36 respondents stated their physical health made it difficult for them performing their work or other activities (14 females and 3 males) while 19 stated they did not have such
ies (e.g. it took extra effort)
13 out of 34 (38%) respondents stated their emotional health problems made them cut down on the amount of time you spent on work or other activities (10 females and 3 males) while
14 out of 37 (37.8%) respondents stated their health problems had no effect on their social d their health problems extremely interfered with their social
activities (3 females and 0 males). 9 out of 37 felt that their health problems had a moderate
Figure 16: to what extent has your physical health or emsocial activities with family, friends, neighbours or groups?
In the focus group, the women stated that depression was common amongst Travellers. One person stated that they had been prescribed medication fexplain why you have it and how long you have to be on the meds”.
Lifestyle
Respondents were asked to score how healthy they perceived their current lifestyle to be on a scale of 1 to 10, where one is healthy and 10 is unhealthy. Female respondents had a median score of 4, while for males this was 7. Scores for females ranged frmales from 2 to 10.
Figure 17: Self-assessed Lifestyle
For physical activity in the 4 weeks preceding the interview, 12 out of 36 (33.3%) stated they had no day of physical activity lasting 30 minutes, whilst 2 (5.6%) stated they hadof physical activity for at least 20 days.
Figure 16: to what extent has your physical health or emotional problems interfered with your normal social activities with family, friends, neighbours or groups?
In the focus group, the women stated that depression was common amongst Travellers. One person stated that they had been prescribed medication for depression but, “they don’t explain why you have it and how long you have to be on the meds”.
Respondents were asked to score how healthy they perceived their current lifestyle to be on a scale of 1 to 10, where one is healthy and 10 is unhealthy. Female respondents had a median score of 4, while for males this was 7. Scores for females ranged fr
assessed Lifestyle
For physical activity in the 4 weeks preceding the interview, 12 out of 36 (33.3%) stated they had no day of physical activity lasting 30 minutes, whilst 2 (5.6%) stated they hadof physical activity for at least 20 days.
otional problems interfered with your normal
In the focus group, the women stated that depression was common amongst Travellers. or depression but, “they don’t
Respondents were asked to score how healthy they perceived their current lifestyle to be on a scale of 1 to 10, where one is healthy and 10 is unhealthy. Female respondents had a median score of 4, while for males this was 7. Scores for females ranged from 1 to 7 and for
For physical activity in the 4 weeks preceding the interview, 12 out of 36 (33.3%) stated they had no day of physical activity lasting 30 minutes, whilst 2 (5.6%) stated they had 30 minutes
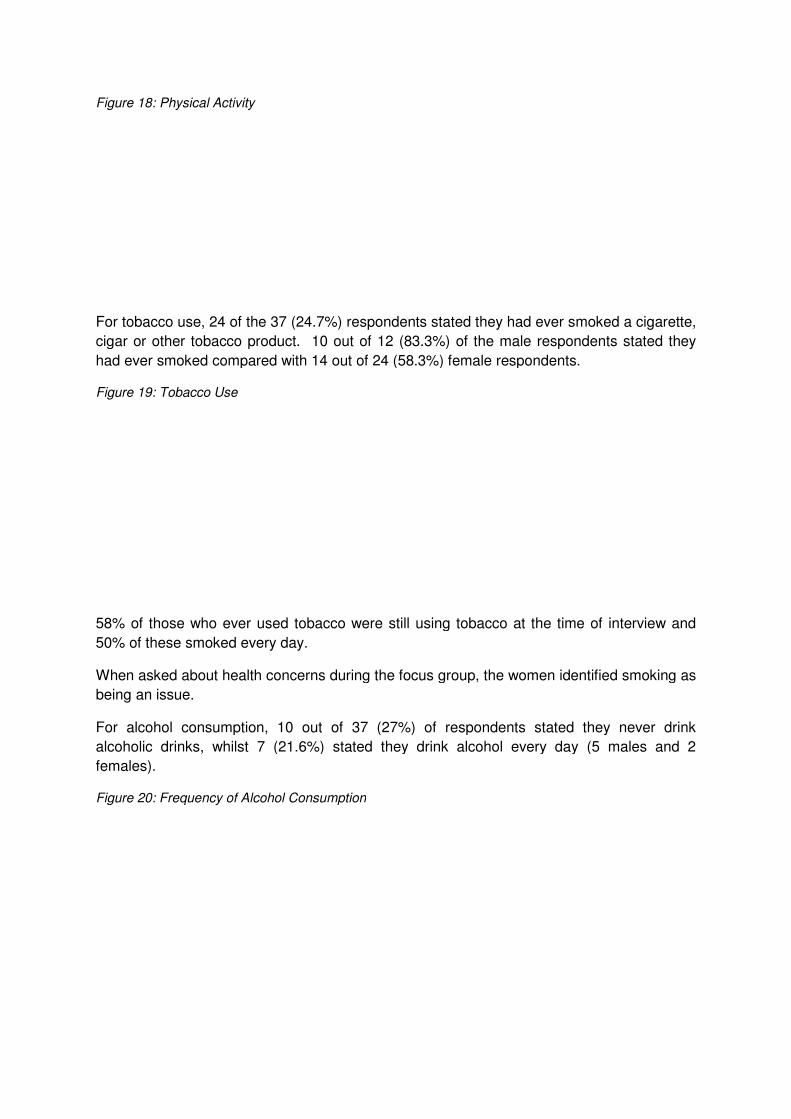
Figure 18: Physical Activity
For tobacco use, 24 of the 37 (24.7%) respondents stated they had ever smoked a cigarette, cigar or other tobacco product. 10 out of 12 (83.3%) of the male respondents had ever smoked compared with 14 out of 24 (58.3%) female respondents.
Figure 19: Tobacco Use
58% of those who ever used tobacco were still using tobacco at the time of interview and 50% of these smoked every day.
When asked about health concerns during the focus group, the women identified smoking as being an issue.
For alcohol consumption, 10 out of 37 (27%) of respondents stated they never drink alcoholic drinks, whilst 7 (21.6%) stated they drink alcohol every day (5 males and 2 females).
Figure 20: Frequency of Alcohol Consumption
For tobacco use, 24 of the 37 (24.7%) respondents stated they had ever smoked a cigarette, cigar or other tobacco product. 10 out of 12 (83.3%) of the male respondents had ever smoked compared with 14 out of 24 (58.3%) female respondents.
58% of those who ever used tobacco were still using tobacco at the time of interview and 50% of these smoked every day.
ncerns during the focus group, the women identified smoking as
For alcohol consumption, 10 out of 37 (27%) of respondents stated they never drink alcoholic drinks, whilst 7 (21.6%) stated they drink alcohol every day (5 males and 2
Figure 20: Frequency of Alcohol Consumption
For tobacco use, 24 of the 37 (24.7%) respondents stated they had ever smoked a cigarette, cigar or other tobacco product. 10 out of 12 (83.3%) of the male respondents stated they had ever smoked compared with 14 out of 24 (58.3%) female respondents.
58% of those who ever used tobacco were still using tobacco at the time of interview and
ncerns during the focus group, the women identified smoking as
For alcohol consumption, 10 out of 37 (27%) of respondents stated they never drink alcoholic drinks, whilst 7 (21.6%) stated they drink alcohol every day (5 males and 2
Most respondents drank normal strength beer / lager / shandy / stout / cider or wine. The highest average amount of type of alcoholic drinks consumed per week was strong beer/lager/cider - 30 pints per w
18 out of 22 (81.8%) who indicated their level of drinking in the week prior to the interview stated they usually drink that much, whilst 3 (13.6%) stated they usually drink more.
Access to Health Services
GP:
32 of the 37 (86%) of respondents were registered with a Blackpool GP and of the 5 that were not registered, 3 were male and 2 were female.
All focus group participants were registered with a GP, but some stated that many practices refused to register people if they li
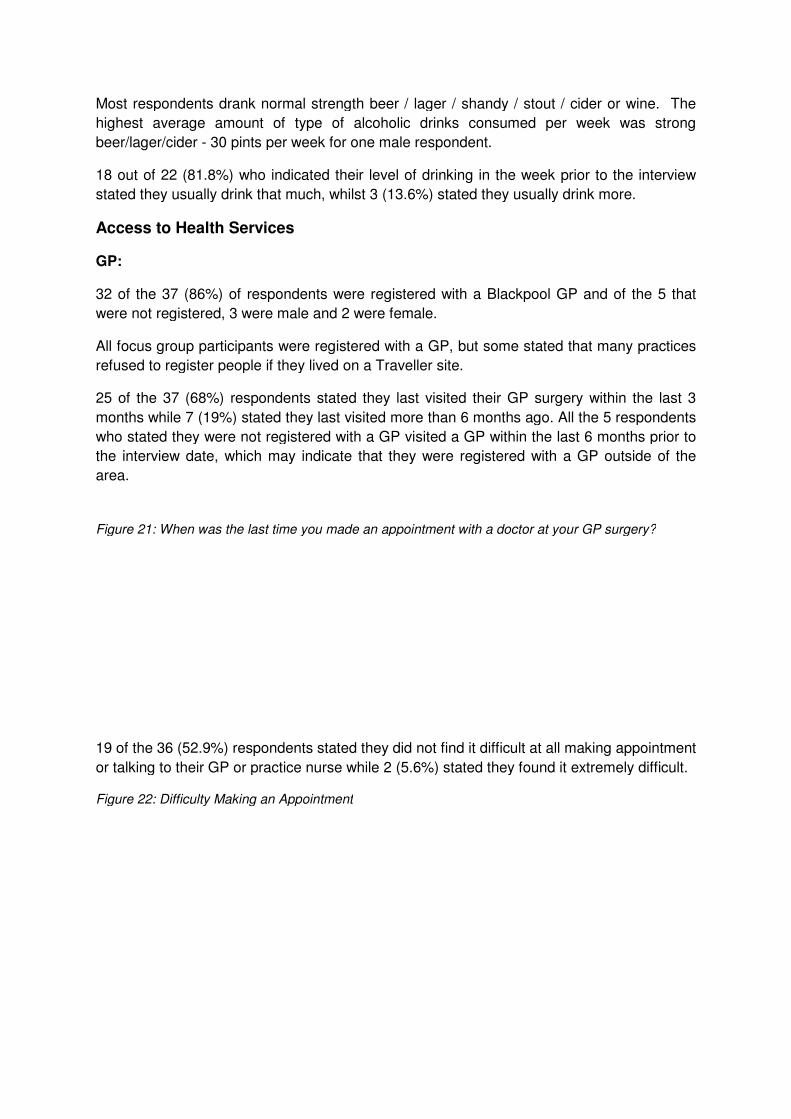
25 of the 37 (68%) respondents stated they last visited their GP surgery within the last 3 months while 7 (19%) stated they last visited more than 6 months ago. All the 5 respondents who stated they were not registered with a GP the interview date, which may indicate that they were registered with a GP outside of the area.
Figure 21: When was the last time you made an appointment with a doctor at your GP surgery?
19 of the 36 (52.9%) respondents stated they did not find it difficult at all making appointment or talking to their GP or practice nurse while 2 (5.6%) stated they found it extremely difficult.
Figure 22: Difficulty Making an Appointment
Most respondents drank normal strength beer / lager / shandy / stout / cider or wine. The highest average amount of type of alcoholic drinks consumed per week was strong
30 pints per week for one male respondent.
18 out of 22 (81.8%) who indicated their level of drinking in the week prior to the interview stated they usually drink that much, whilst 3 (13.6%) stated they usually drink more.
Access to Health Services
(86%) of respondents were registered with a Blackpool GP and of the 5 that were not registered, 3 were male and 2 were female.
All focus group participants were registered with a GP, but some stated that many practices refused to register people if they lived on a Traveller site.
25 of the 37 (68%) respondents stated they last visited their GP surgery within the last 3 months while 7 (19%) stated they last visited more than 6 months ago. All the 5 respondents who stated they were not registered with a GP visited a GP within the last 6 months prior to the interview date, which may indicate that they were registered with a GP outside of the
Figure 21: When was the last time you made an appointment with a doctor at your GP surgery?
(52.9%) respondents stated they did not find it difficult at all making appointment or talking to their GP or practice nurse while 2 (5.6%) stated they found it extremely difficult.
Figure 22: Difficulty Making an Appointment
Most respondents drank normal strength beer / lager / shandy / stout / cider or wine. The highest average amount of type of alcoholic drinks consumed per week was strong
18 out of 22 (81.8%) who indicated their level of drinking in the week prior to the interview stated they usually drink that much, whilst 3 (13.6%) stated they usually drink more.
(86%) of respondents were registered with a Blackpool GP and of the 5 that
All focus group participants were registered with a GP, but some stated that many practices
25 of the 37 (68%) respondents stated they last visited their GP surgery within the last 3 months while 7 (19%) stated they last visited more than 6 months ago. All the 5 respondents
visited a GP within the last 6 months prior to the interview date, which may indicate that they were registered with a GP outside of the
Figure 21: When was the last time you made an appointment with a doctor at your GP surgery?
(52.9%) respondents stated they did not find it difficult at all making appointment or talking to their GP or practice nurse while 2 (5.6%) stated they found it extremely difficult.
Dentist:
22 of the 37 respondents stated they were registered with a dentist (13 males and 8 females). Only 3 of the 9 focus group participants were registered with a dentist and one person stated they had to travel to Preston to access dentistry.
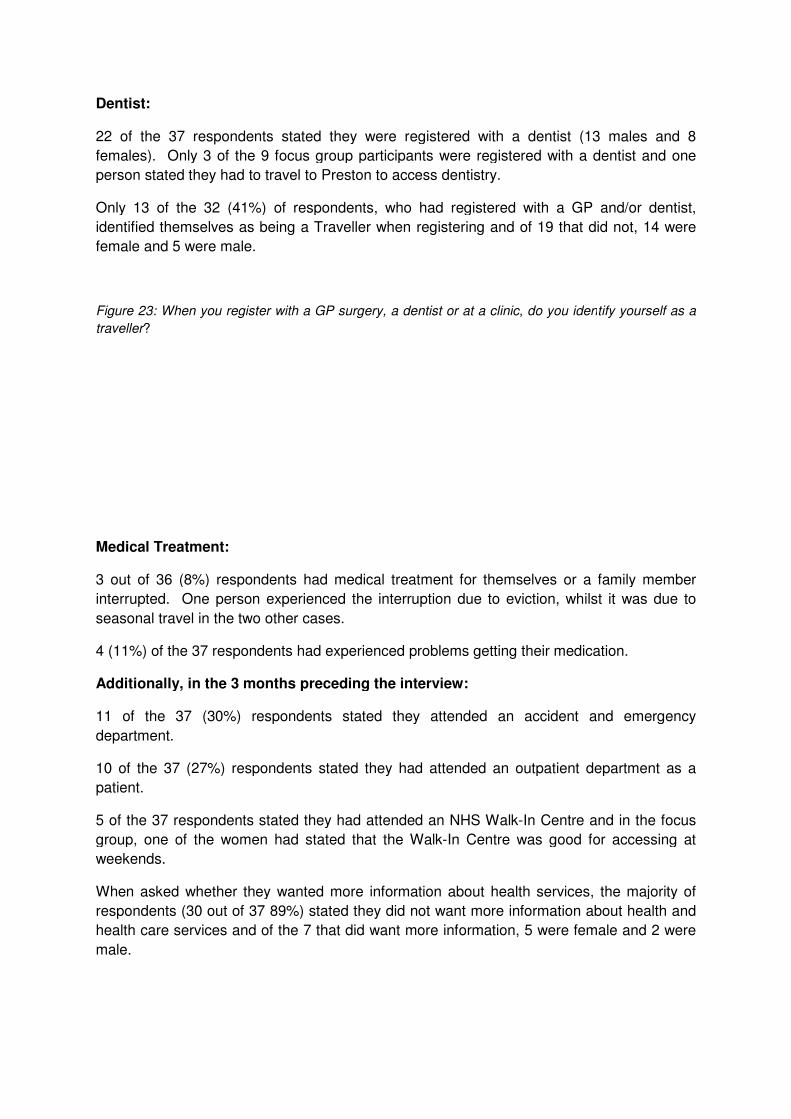
Only 13 of the 32 (41%) of responidentified themselves as being a Traveller when registering and of 19 that did not, 14 were female and 5 were male.
Figure 23: When you register with a GP surgery, a dentist or at a clinic, do you identraveller?
Medical Treatment:
3 out of 36 (8%) respondents had medical treatment for themselves or a family member interrupted. One person experienced the interruption due to eviction, whilst it was due to seasonal travel in the two other cases.
4 (11%) of the 37 respondents had experienced problems getting their medication.
Additionally, in the 3 months preceding the interview:
11 of the 37 (30%) respondents stated they attended an accident and emergency department.
10 of the 37 (27%) respondents stated they had attended anpatient.
5 of the 37 respondents stated they had attended an NHS Walkgroup, one of the women had stated that the Walkweekends.
When asked whether they wanted more information about health services, the majority of respondents (30 out of 37 89%) stated they did not want more information about health and health care services and of the 7 that did want more information, 5 wemale.
dents stated they were registered with a dentist (13 males and 8 females). Only 3 of the 9 focus group participants were registered with a dentist and one person stated they had to travel to Preston to access dentistry.
Only 13 of the 32 (41%) of respondents, who had registered with a GP and/or dentist, identified themselves as being a Traveller when registering and of 19 that did not, 14 were
Figure 23: When you register with a GP surgery, a dentist or at a clinic, do you iden
3 out of 36 (8%) respondents had medical treatment for themselves or a family member interrupted. One person experienced the interruption due to eviction, whilst it was due to
other cases.
4 (11%) of the 37 respondents had experienced problems getting their medication.
Additionally, in the 3 months preceding the interview:
11 of the 37 (30%) respondents stated they attended an accident and emergency
7%) respondents stated they had attended an outpatient department as a
5 of the 37 respondents stated they had attended an NHS Walk-In Centre and in the focus group, one of the women had stated that the Walk-In Centre was good for accessing at
When asked whether they wanted more information about health services, the majority of respondents (30 out of 37 89%) stated they did not want more information about health and health care services and of the 7 that did want more information, 5 were female and 2 were
dents stated they were registered with a dentist (13 males and 8 females). Only 3 of the 9 focus group participants were registered with a dentist and one
dents, who had registered with a GP and/or dentist, identified themselves as being a Traveller when registering and of 19 that did not, 14 were
Figure 23: When you register with a GP surgery, a dentist or at a clinic, do you identify yourself as a
3 out of 36 (8%) respondents had medical treatment for themselves or a family member interrupted. One person experienced the interruption due to eviction, whilst it was due to
4 (11%) of the 37 respondents had experienced problems getting their medication.
11 of the 37 (30%) respondents stated they attended an accident and emergency
outpatient department as a
In Centre and in the focus In Centre was good for accessing at
When asked whether they wanted more information about health services, the majority of respondents (30 out of 37 89%) stated they did not want more information about health and
re female and 2 were
How could the local health services better help?
There were 30 respondents to the question, ‘How could local health services better help Travellers?’ (some examples are provided below) and of these 30 respondents:
8 people felt that health services should be more understanding about the cultural background of Travellers:
“Learn to understand our way of life and ways better”
“Talk to Travellers and ask us what we need and want. Need to understand us better.”
“To be more tolerant of culture and background”
“You should be able to say what you are without feeling an outsider and different”
“More understanding and caring about our background”
“More understanding about walking in for appointments”
15 people made suggestions on the way services were delivered:
“Could have the doctor call on home visits more for older people”
“Shorter appointments”
“Make it easier to register permanently or just temporarily”
“A card you can show. I can’t read and write very well”
“Can dentists, health workers come and visit us on the site. We have a community centre you could use”
“Could have a traveller as an interpreter with nurse or doctor”
“More home visits. Easy temporary registration”
“Receptionists could do with some training on gypsy awareness”
“A health person could come along with council and police”
“Need dentist for us travellers. Need to know what is going on and explain things better”
“Don’t understand sometimes. Would use more if it was welcoming.”
4 people referred to literacy levels:
“I can’t read and write very well”
“We don’t read and write well”
“Make appointments easier by making a phone call because I’m a bad reader”

3 respondents expressed satisfaction with local health services.
“Very satisfied.”
“Happy with NHS”
Professionals Questionnaires
Completed forms for 68 Health Professionals and 22 Non-Health Professionals were returned for analysis.
Respondents included Health Visitors, School Nurses, community support workers and mental health workers. Many had attended or were planning to attend the Traveller health awareness sessions, which indicates that they may have had an existing professional interest in Traveller health issues.
Non-Health Professionals Questionnaire Results
16% of non-health professionals identified that Travellers talked to them about their health problems, but only 20% had a specific health professional contact they could refer or signpost Travellers to.
72% of non-health professionals felt that they would find a specific health professional contact for Traveller health useful and 60% had particular concerns or challenges.
60% of non-health professionals had particular concerns or challenges in working with Traveller communities.
Respondents were asked whether they had any professional contact with Travellers and 44% of health professionals stated they had contact. Those who had not had any contact were asked how they knew this was the case and responses included:
“As working in schools, I think I would have been aware, or have been told”
“Don’t know”
“Not to my knowledge”
“No one has informed me they were a Traveller”
Health Professionals Questionnaire Results
The results for the Health Professionals questionnaire showed that 54% of respondents identified patients as being of traveller origin by patients self-identifying. However, only 9% of respondents were aware of the READ coding system for Travellers.
35% of health professionals provided Travellers with help to complete forms.
34% of health professionals had found specific issues relating to non-attendance at appointments.

The majority of health professionals / services contacted Travellers for health checks, screening, vaccinations and immunisations through conventional methods such as letters and telephone calls, though some visited or informed people opportunistically. Only 9% of health professionals / services had special measure in place to increase uptake of health services for Travellers. These measures included personal visits, special leaflets and making enquiries about outstanding immunisations and providing information and advice.
35% of health professionals felt they or their service faced specific or clinical practical challenges when working with Travellers. These challenges included
• Access
• Attendance for clinic appointments / poor attendance / missed appointments / attending at different times
• Developing trust
• Safeguarding issues
• Large numbers of people being present at visits
• Literacy
• Multiple requests for assistance from family members once a family has built relationships with them
• Lack of awareness of health issues
• Lack of a clear address – difficulty in locating families in caravans
13% of health professionals had concerns about with Travellers. These concerns included:
Safety when accessing sites
“Their perceived health needs as opposed to my professional opinion on their needs”
Lack of knowledge and awareness of Traveller culture
Lack of formal education on the part of Travellers
Reluctance on the part of Travellers to accept input from health professionals
Lack of funding / staff to meet the needs of Travelling families
When asked how health services could improve to meet the needs of Travellers, the following suggestions were made:
• A Traveller ‘Link’ person and dedicated teams
• More flexibility in services – different times and localities and outreach
• Awareness training
• Provide services for the whole family, rather than individuals
• Development of Traveller specific care pathways

• Easy read leaflets
• Hand-held patient records
• Involve Travellers more and engage key members of the community to support attendance
• Services available on-site
• More resources / staff
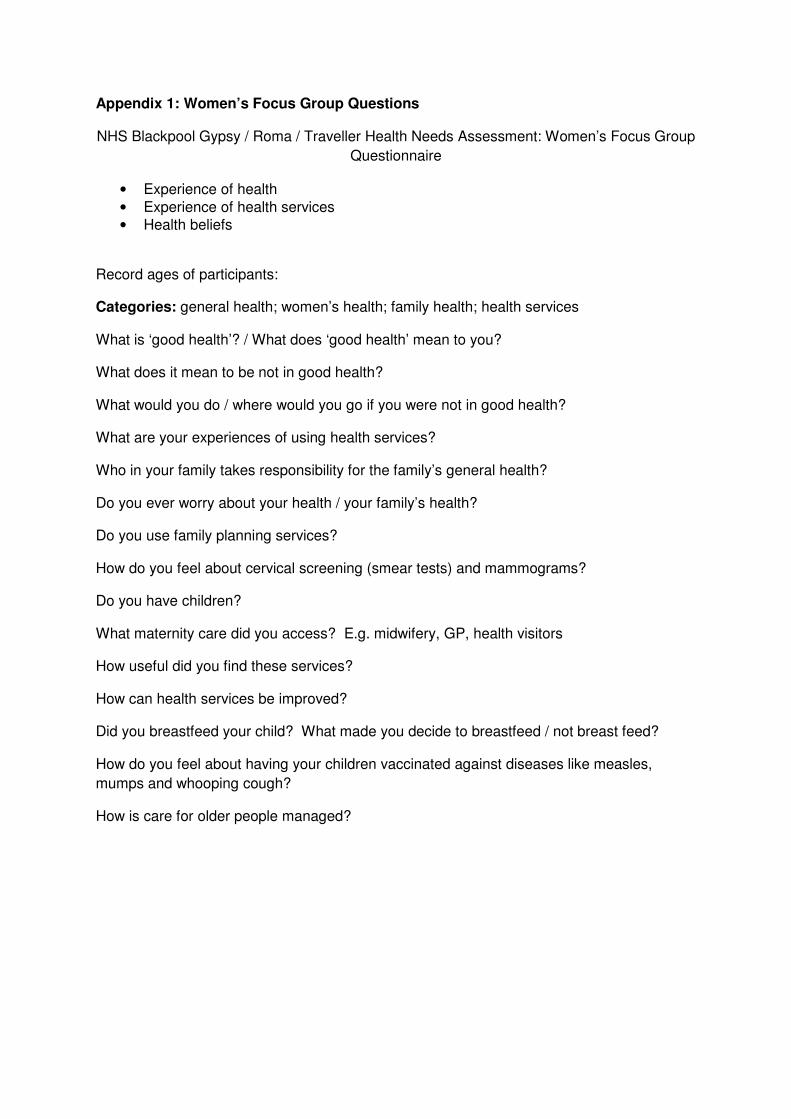
Appendix 1: Women’s Focus Group Questions
NHS Blackpool Gypsy / Roma / Traveller Health Needs Assessment: Women’s Focus Group Questionnaire
• Experience of health • Experience of health services • Health beliefs
Record ages of participants:
Categories: general health; women’s health; family health; health services
What is ‘good health’? / What does ‘good health’ mean to you?
What does it mean to be not in good health?
What would you do / where would you go if you were not in good health?
What are your experiences of using health services?
Who in your family takes responsibility for the family’s general health?
Do you ever worry about your health / your family’s health?
Do you use family planning services?
How do you feel about cervical screening (smear tests) and mammograms?
Do you have children?
What maternity care did you access? E.g. midwifery, GP, health visitors
How useful did you find these services?
How can health services be improved?
Did you breastfeed your child? What made you decide to breastfeed / not breast feed?
How do you feel about having your children vaccinated against diseases like measles, mumps and whooping cough?
How is care for older people managed?
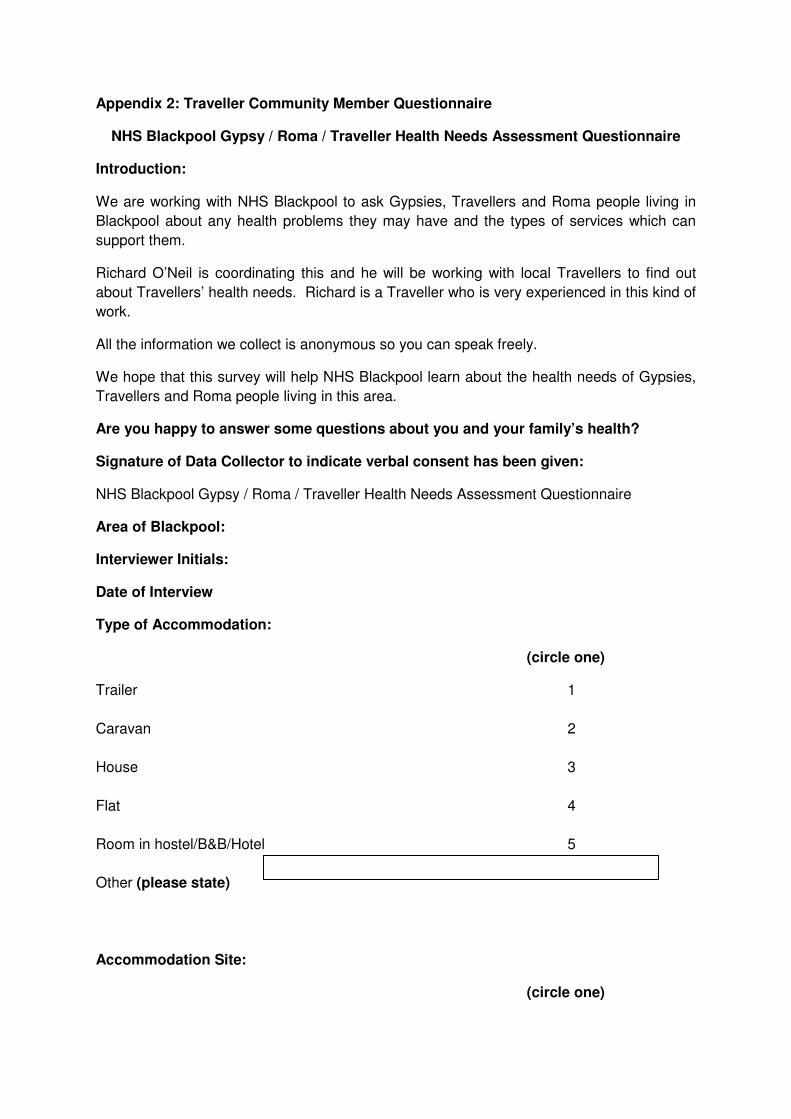
Appendix 2: Traveller Community Member Questionnaire
NHS Blackpool Gypsy / Roma / Traveller Health Needs Assessment Questionnaire
Introduction:
We are working with NHS Blackpool to ask Gypsies, Travellers and Roma people living in Blackpool about any health problems they may have and the types of services which can support them.
Richard O’Neil is coordinating this and he will be working with local Travellers to find out about Travellers’ health needs. Richard is a Traveller who is very experienced in this kind of work.
All the information we collect is anonymous so you can speak freely.
We hope that this survey will help NHS Blackpool learn about the health needs of Gypsies, Travellers and Roma people living in this area.
Are you happy to answer some questions about you and your family’s health?
Signature of Data Collector to indicate verbal consent has been given:
NHS Blackpool Gypsy / Roma / Traveller Health Needs Assessment Questionnaire
Area of Blackpool:
Interviewer Initials:
Date of Interview
Type of Accommodation:
(circle one)
Trailer 1
Caravan 2
House 3
Flat 4
Room in hostel/B&B/Hotel 5
Other (please state)
Accommodation Site:
(circle one)
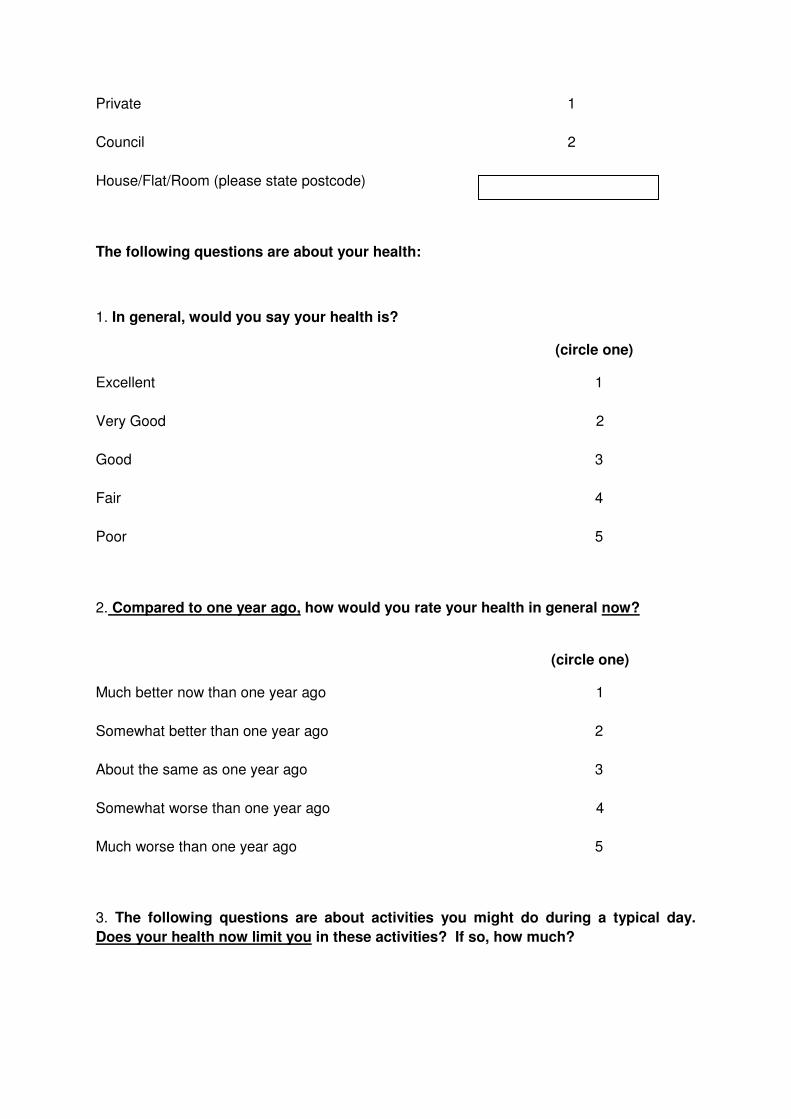
Private 1
Council 2
House/Flat/Room (please state postcode)
The following questions are about your health:
1. In general, would you say your health is?
(circle one)
Excellent 1
Very Good 2
Good 3
Fair 4
Poor 5
2. Compared to one year ago, how would you rate your health in general now?
(circle one)
Much better now than one year ago 1
Somewhat better than one year ago 2
About the same as one year ago 3
Somewhat worse than one year ago 4
Much worse than one year ago 5
3. The following questions are about activities you might do during a typical day. Does your health now limit you in these activities? If so, how much?
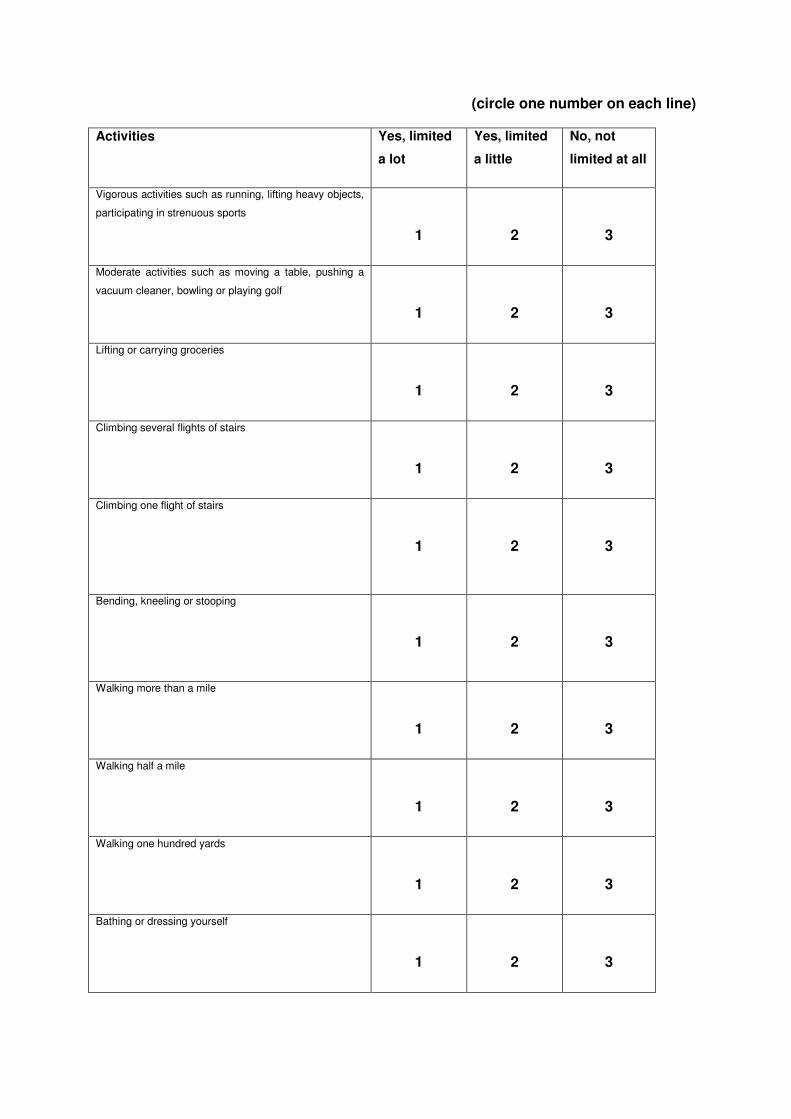
(circle one number on each line)
Activities Yes, limited
a lot
Yes, limited
a little
No, not
limited at all
Vigorous activities such as running, lifting heavy objects,
participating in strenuous sports
1
2
3
Moderate activities such as moving a table, pushing a
vacuum cleaner, bowling or playing golf
1
2
3
Lifting or carrying groceries
1
2
3
Climbing several flights of stairs
1
2
3
Climbing one flight of stairs
1
2
3
Bending, kneeling or stooping
1
2
3
Walking more than a mile
1
2
3
Walking half a mile
1
2
3
Walking one hundred yards
1
2
3
Bathing or dressing yourself
1
2
3

4. During the past 4 weeks, have you had any of the following problems with your work or other regular daily activities as a result of your physical health?
(circle one number on each line)
Yes No
Cut down on the amount of time you spent on work or other activities 1 2
Accomplished less than you would like 1 2
Were limited in the kind of work or other activities 1 2
Had difficulty performing the work or other activities (e.g. it took extra effort) 1 2
5. During the past 4 weeks, have you had any of the following problems with your work or other regular daily activities as a result of any emotional problems (feeling depressed or anxious - ‘nerves’)?
(circle one number on each line)
Yes No
Cut down on the amount of time you spent on work or other activities 1 2
Accomplished less than you would like 1 2
Didn’t do work or other activities as carefully as usual 1 2
6. During the past 4 weeks, to what extent has your physical health or emotional problems interfered with your normal social activities with family, friends, neighbours or groups?
(circle one)
Not at all 1
Slightly 2
Moderately 3

Quite a bit 4
Extremely 5
7. How much bodily pain have you had during the past 4 weeks?
(circle one)
None 1
Very mild 2
Mild 3
Moderate 4
Severe 5
Very severe 6
8. During the past 4 weeks, how much did pain interfere with your normal work (including both work outside the home and housework)?
(circle one)
Not at all 1
Slightly 2
Moderately 3
Quite a bit 4
Extremely 5
These questions are about how you feel and how things have been with you during the past 4 weeks. For each question please give the one answer that comes closest to the way you have been feeling.
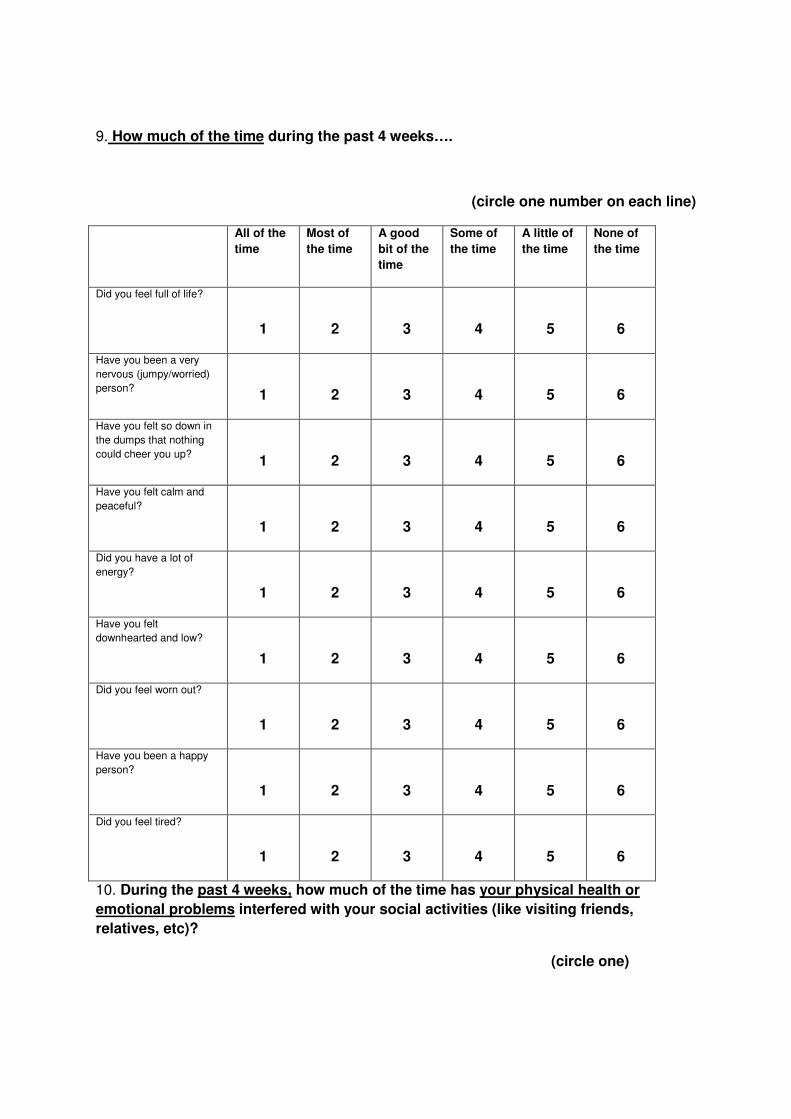
9. How much of the time during the past 4 weeks….
(circle one number on each line)
All of the time
Most of the time
A good bit of the time
Some of the time
A little of the time
None of the time
Did you feel full of life?
1
2
3
4
5
6
Have you been a very nervous (jumpy/worried) person?
1
2
3
4
5
6
Have you felt so down in the dumps that nothing could cheer you up?
1
2
3
4
5
6
Have you felt calm and peaceful?
1
2
3
4
5
6
Did you have a lot of energy?
1
2
3
4
5
6
Have you felt downhearted and low?
1
2
3
4
5
6
Did you feel worn out?
1
2
3
4
5
6
Have you been a happy person?
1
2
3
4
5
6
Did you feel tired?
1
2
3
4
5
6
10. During the past 4 weeks, how much of the time has your physical health or emotional problems interfered with your social activities (like visiting friends, relatives, etc)?
(circle one)

All of the time 1
Most of the time 2
Some of the time 3
A little of the time 4
None of the time 5
11. How TRUE or FALSE is each of the following statements to you?
Definitely true
Mostly true Don’t know Mostly false Definitely false
I seem to get ill more easily than other people
1
2
3
4
5
I am as healthy as anybody I know
1
2
3
4
5
I expect my health to get worse
1
2
3
4
5
My health is excellent
1
2
3
4
5
The following questions are about your lifestyle:
12. In the past 4 weeks, on how many days have you done 30 minutes of physical activity such as brisk walking, cycling, sport, exercise, active recreation, enough to cause you to breathe more deeply? Please do not indicate physical activity as part of your job. (circle one)
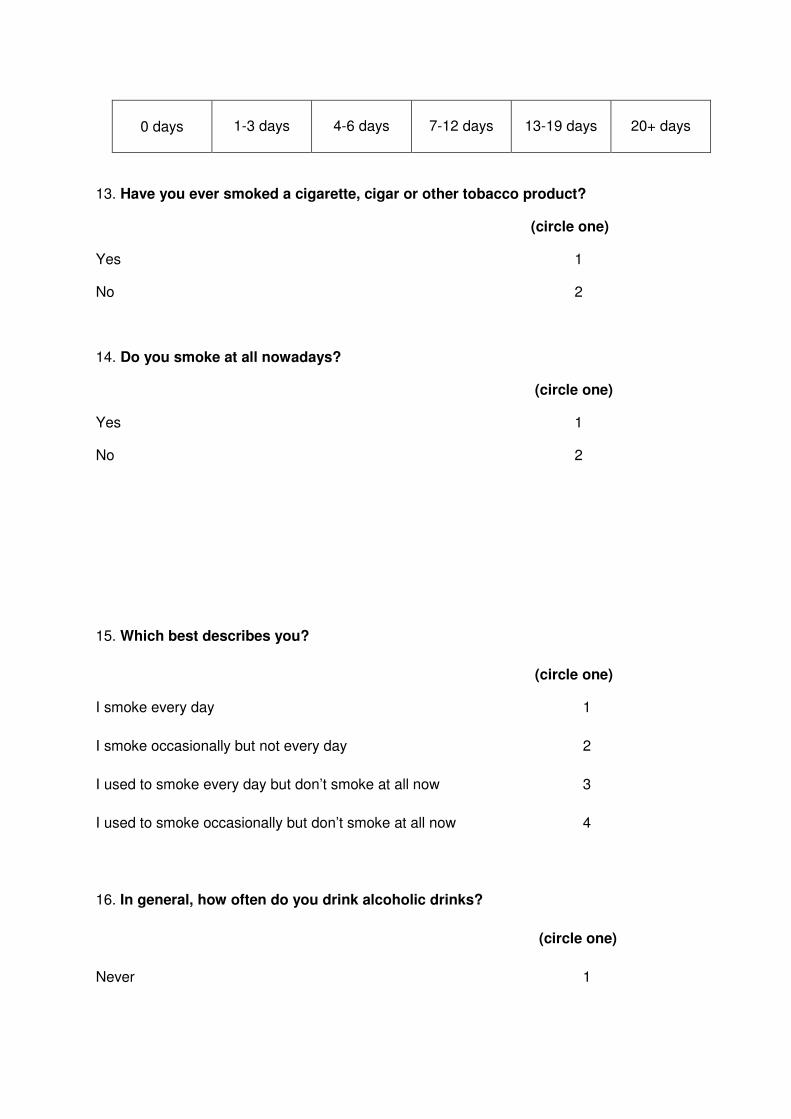
13. Have you ever smoked a cigarette, cigar or other tobacco product?
(circle one)
Yes 1
No 2
14. Do you smoke at all nowadays?
(circle one)
Yes 1
No 2
15. Which best describes you?
(circle one)
I smoke every day 1
I smoke occasionally but not every day 2
I used to smoke every day but don’t smoke at all now 3
I used to smoke occasionally but don’t smoke at all now 4
16. In general, how often do you drink alcoholic drinks?
(circle one)
Never 1
0 days
1-3 days
4-6 days
7-12 days
13-19 days
20+ days

Monthly or less 2
Once or twice a week 3
Three or four days a week 4
Every day or almost every day 5
17. How many of each of the following types of drinks did you consume in the last week?
Pints of non alcoholic beer/lager/cider
Pints of low alcoholic beer/lager/cider
Pints of normal strength beer/lager/shandy/stout/cider
Pints of strong beer/lager/cider
Bottles of alcopops
Single glasses of spirits (25ml)
Standard glasses of wine (175ml)
Single glasses of fortified wine (sherry, port, martini)
18. Was last week a typical week? (circle one)
Yes, I usually drink this much 1
No, I usually drink less 2
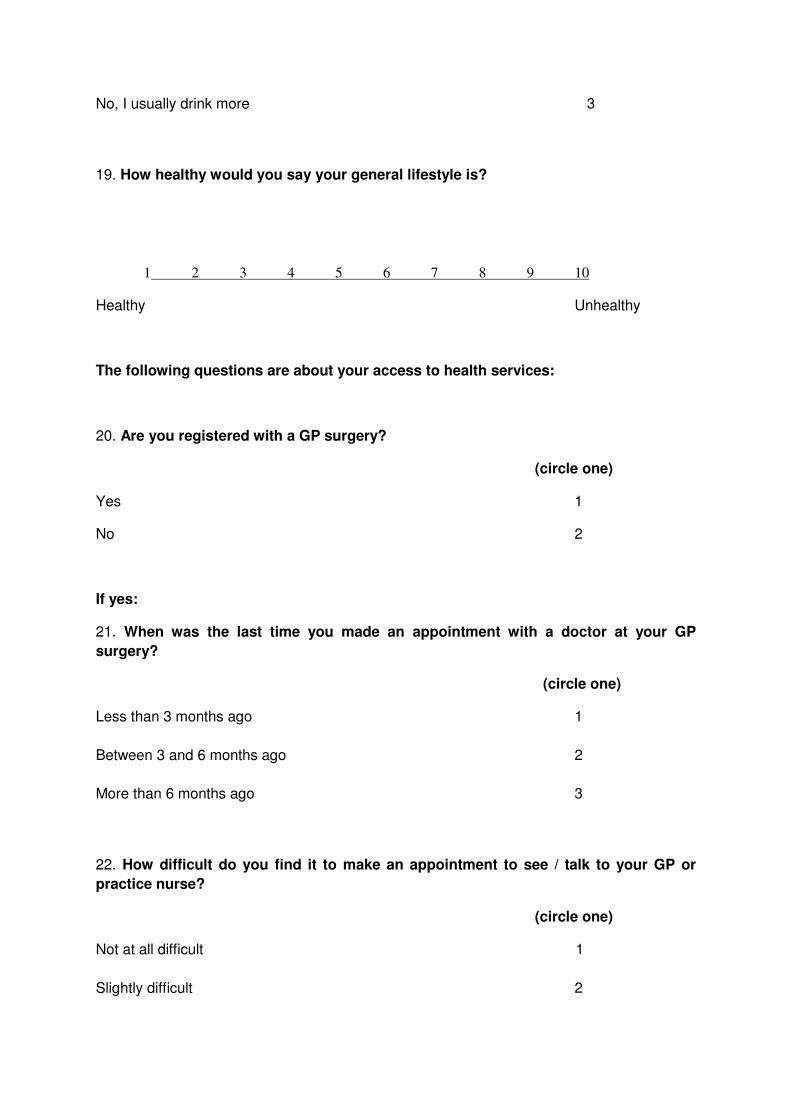
No, I usually drink more 3
19. How healthy would you say your general lifestyle is?
1 2 3 4 5 6 7 8 9 10
Healthy Unhealthy
The following questions are about your access to health services:
20. Are you registered with a GP surgery?
(circle one)
Yes 1
No 2
If yes:
21. When was the last time you made an appointment with a doctor at your GP surgery?
(circle one)
Less than 3 months ago 1
Between 3 and 6 months ago 2
More than 6 months ago 3
22. How difficult do you find it to make an appointment to see / talk to your GP or practice nurse?
(circle one)
Not at all difficult 1
Slightly difficult 2
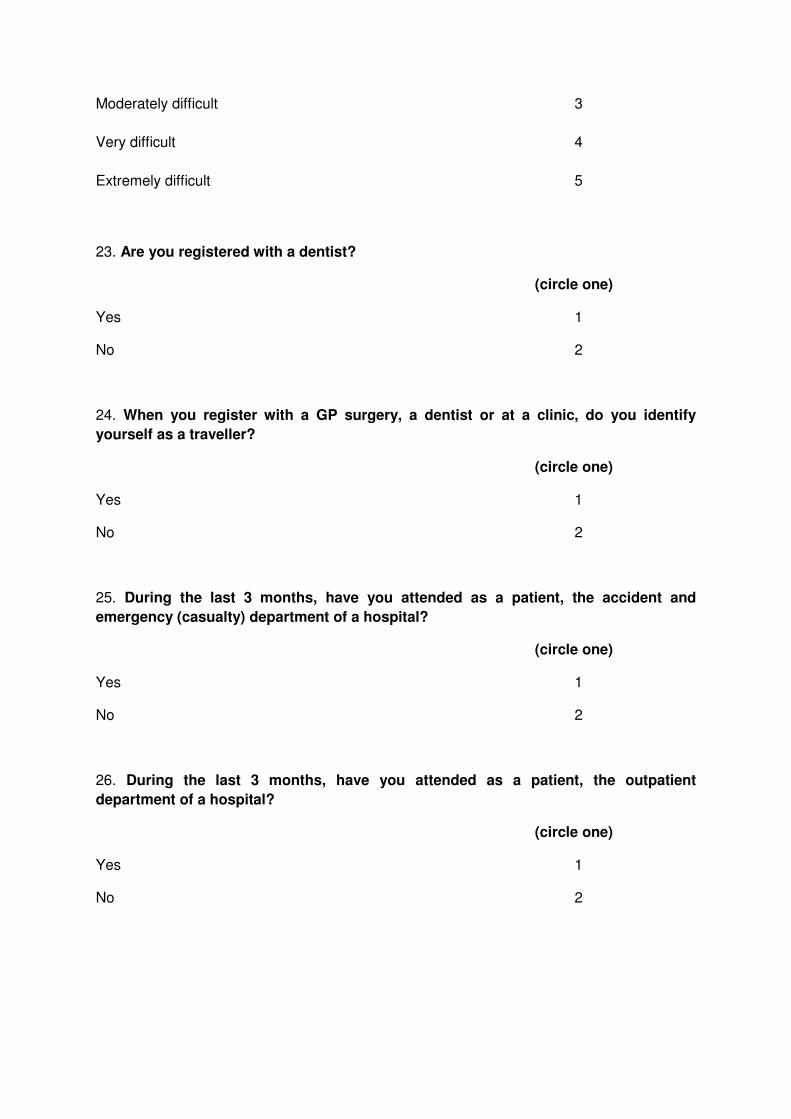
Moderately difficult 3
Very difficult 4
Extremely difficult 5
23. Are you registered with a dentist?
(circle one)
Yes 1
No 2
24. When you register with a GP surgery, a dentist or at a clinic, do you identify yourself as a traveller?
(circle one)
Yes 1
No 2
25. During the last 3 months, have you attended as a patient, the accident and emergency (casualty) department of a hospital?
(circle one)
Yes 1
No 2
26. During the last 3 months, have you attended as a patient, the outpatient department of a hospital?
(circle one)
Yes 1
No 2
27. During the last 3 months, have you attended as a patient, an NHS Walk-In Centre ?
(circle one)
Yes 1
No 2
28. If yes, did you have any difficulties with transport to your appointment?
(circle one)
Yes 1
No 2
29. Has any medical treatment you or your family has had been interrupted?
(circle one)
Yes 1
No 2
30. If yes, please tell us why you did not continue treatment?
(circle one)
Eviction 1
Problems with registering 2
Moving out of the area 3
Seasonal travelling 4
Other (please state)
31. Have you ever had any problems getting your medication?
(circle one)
Yes 1
No 2
32. Do you want more information about health and health care services?
(circle one)
Yes 1
No 2
33. How could the local health service better help Travellers?
34. Do you feel more comfortable talking to a women / man about women’s / men’s health problems?
(circle one)
Yes 1
No 2
These questions are about yourself:
35. Are you male or female?

(circle one)
Male 1
Female 2
36. How old are you?
(circle one)
Under 18 1
18 – 19 2
20 – 24 3
25 – 34 4
35 – 44 5
45 – 54 6
55 – 59 7
60 – 64 8
65 – 74 9
75 – 84 10
85 or over 11
37. What is your marital status?
(circle one)
Single 1
Co-habiting 2
Married (first marriage) 3
Separated 4
Separated (but still legally married) 5

Re- married 6
Divorced 7
Widowed 8
38. To which of these groups do you consider yourself to belong to?
(circle one)
English Gypsy / Romany 1
Welsh Gypsy 2
Scottish Traveller 3
Irish Traveller 4
European Roma 5
Circus/Fairground/Show man 6
New (Age) Travellers 7
Bargees 8
Other (please specify)
39. Are you a parent?
(circle one)
Yes 1
No 2
40. If yes, what age are your children?
41. How would you describe your living arrangements?
(circle one)
Live alone 1
Live with parents, family or guardian 2
Live with partner 3
Live with children 4
Live with partner and children 5
Live with other people who share my cooking/washing facilities 6
42. If option ‘6’ is selected above, please state:
Number of other people
Number of households / families
43. Are you likely to leave your current accommodation within the next 3 months?
(circle one)
Yes 1
No 2
Maybe 3
44. If ‘yes’, please state why:
45. What is your current employment status?
(circle all that apply)
Working full-time (30 hours or more a week) 1
Working part-time (less than 30 hours per week) 2
Unemployed and looking for work 3
I have never had a paid job 4
Unable to work due to illness/disability 5
Retired 7
Student 8
Looking after home/family 9
Other (please specify)
46. Are you willing to take part in more research? (mention focus groups)
(circle one)
Yes 1
No 2
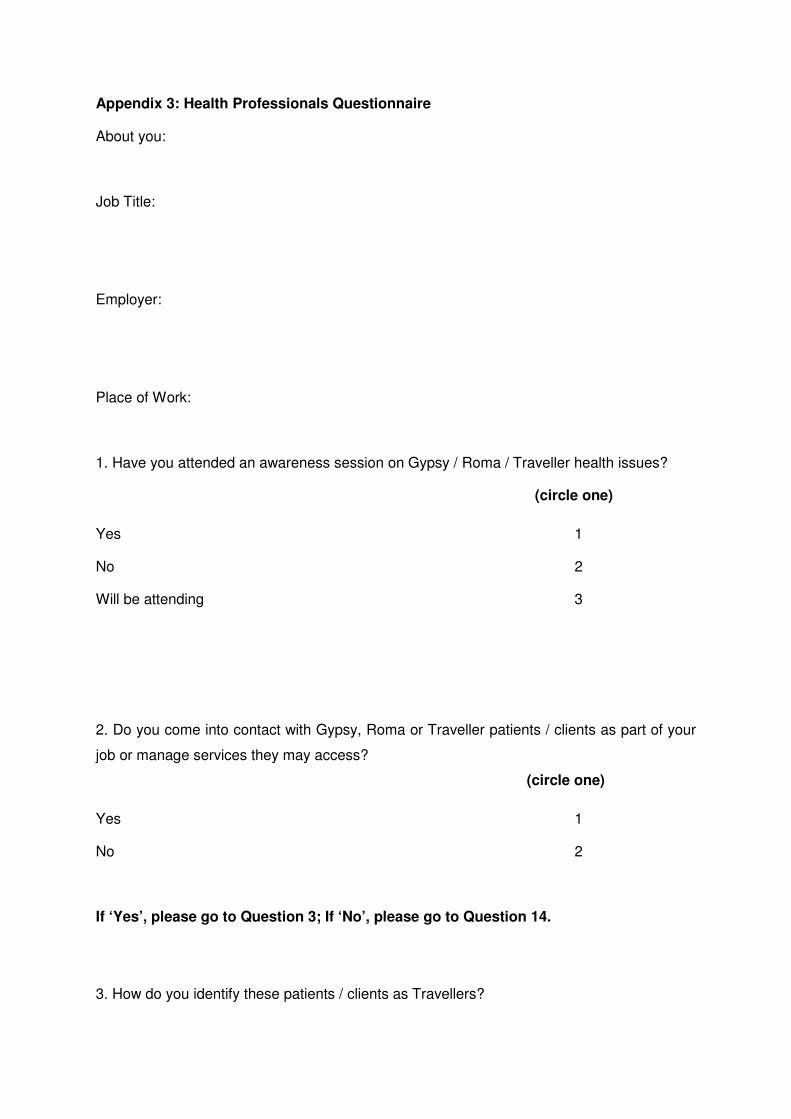
Appendix 3: Health Professionals Questionnaire
About you:
Job Title:
Employer:
Place of Work:
1. Have you attended an awareness session on Gypsy / Roma / Traveller health issues?
(circle one)
Yes 1
No 2
Will be attending 3
2. Do you come into contact with Gypsy, Roma or Traveller patients / clients as part of your
job or manage services they may access?
(circle one)
Yes 1
No 2
If ‘Yes’, please go to Question 3; If ‘No’, please go to Question 14.
3. How do you identify these patients / clients as Travellers?

(circle one or more)
Their address / location 1
Identify themselves as Travellers 2
Identified as a Traveller as part of a referral 3
Came with other known Travellers 4
Other (Please state)
4. Are you aware of the ethnic READ coding system for Gypsy / Roma / Travellers?
(circle one)
Yes 1
No 2
5. If ‘yes’, do you / your service use these codes to identify Gypsy / Roma / Travellers?
(circle one)
Yes 1
No 2
6. Do you provide Travellers with help to complete forms?
(circle one)
Yes 1
No 2
7. Have you found any specific issues relating to non-attendance at appointments?
(circle one)
Yes 1
No 2
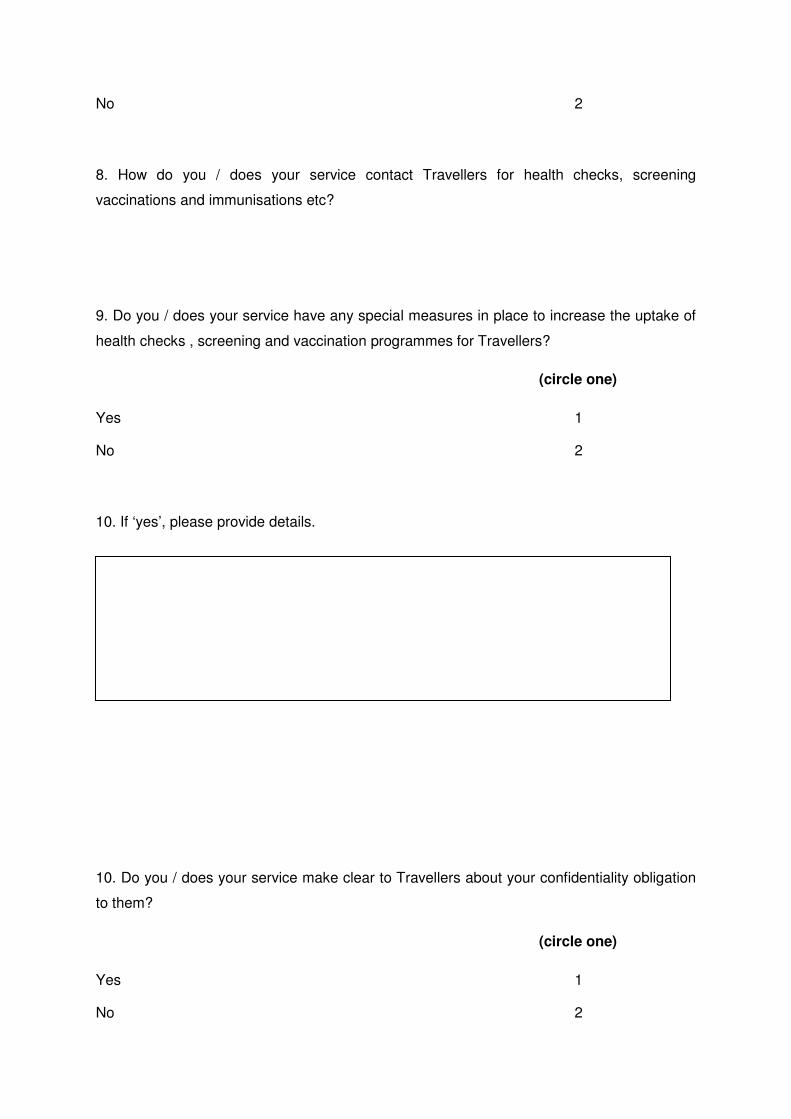
8. How do you / does your service contact Travellers for health checks, screening
vaccinations and immunisations etc?
9. Do you / does your service have any special measures in place to increase the uptake of
health checks , screening and vaccination programmes for Travellers?
(circle one)
Yes 1
No 2
10. If ‘yes’, please provide details.
10. Do you / does your service make clear to Travellers about your confidentiality obligation
to them?
(circle one)
Yes 1
No 2
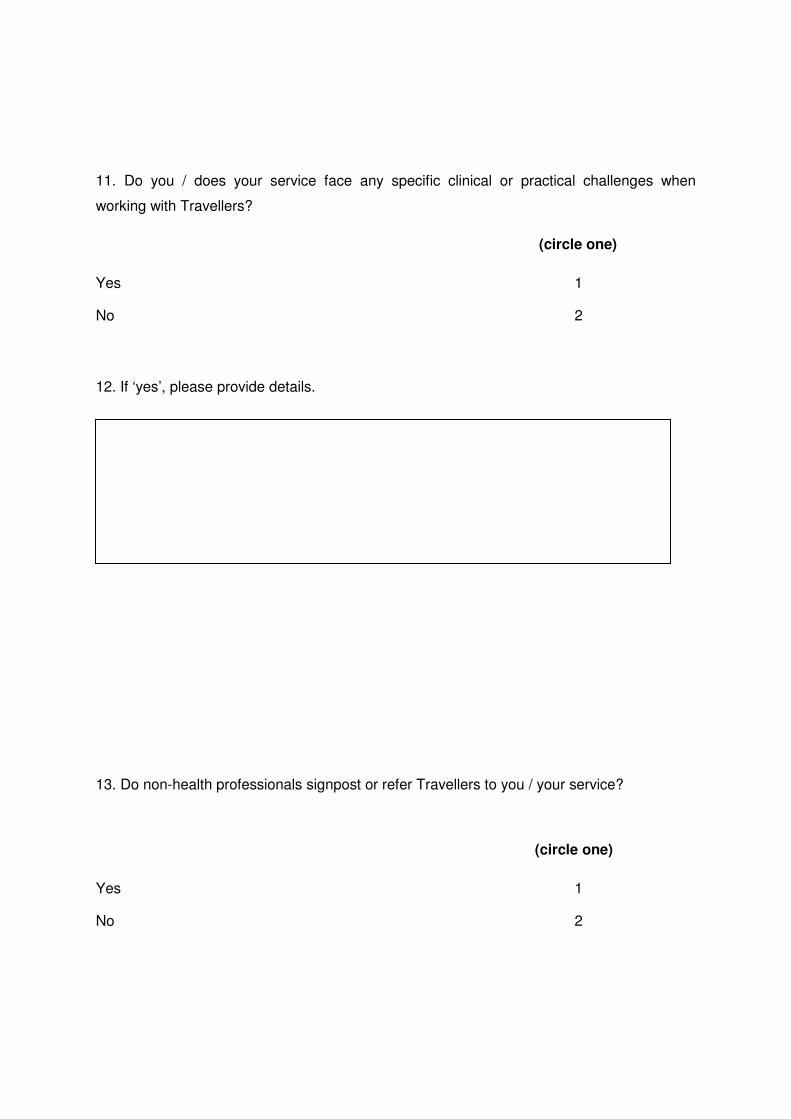
11. Do you / does your service face any specific clinical or practical challenges when
working with Travellers?
(circle one)
Yes 1
No 2
12. If ‘yes’, please provide details.
13. Do non-health professionals signpost or refer Travellers to you / your service?
(circle one)
Yes 1
No 2
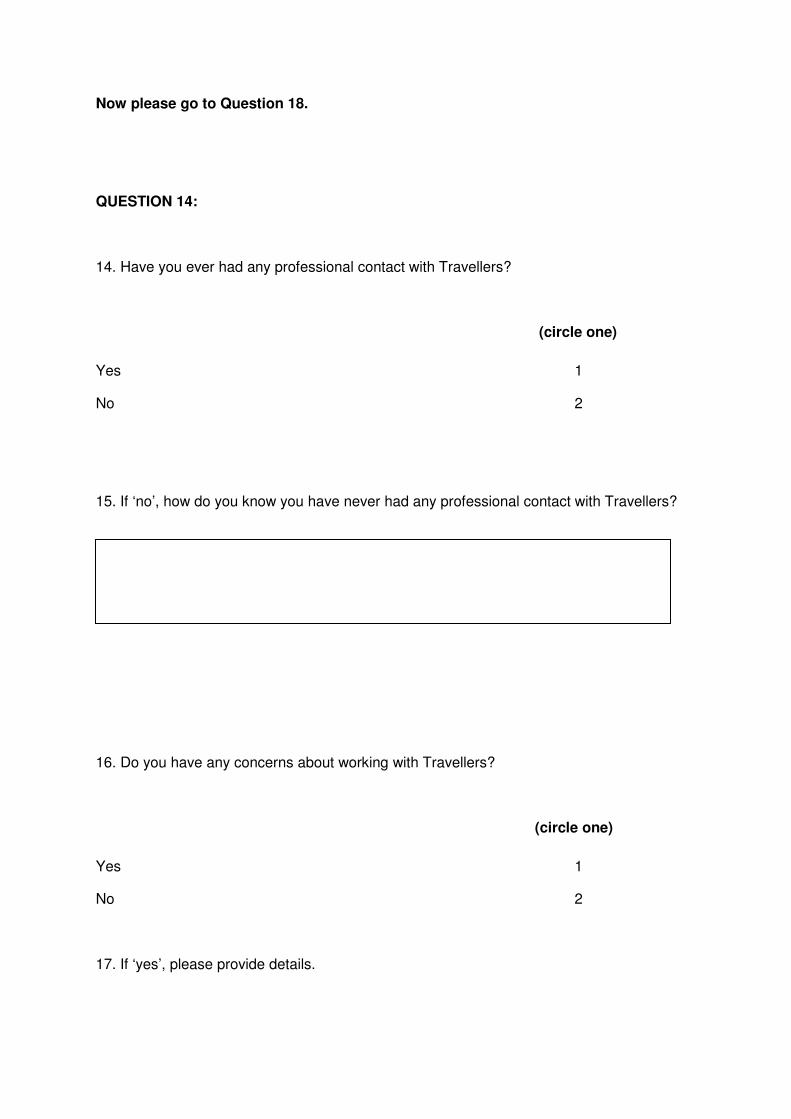
Now please go to Question 18.
QUESTION 14:
14. Have you ever had any professional contact with Travellers?
(circle one)
Yes 1
No 2
15. If ‘no’, how do you know you have never had any professional contact with Travellers?
16. Do you have any concerns about working with Travellers?
(circle one)
Yes 1
No 2
17. If ‘yes’, please provide details.
QUESTION 18:
18. What do you think health services could do to improve the health of Travellers?
Appendix 4: Non-health Professionals Questionnaire
About you:
Job Title:
Employer:
Place of Work:
1. Have you attended an awareness session on Gypsy / Roma / Traveller health issues?
(circle one)
Yes 1
No 2
Will be attending 3
2. Do Gypsies / Travellers / Roma people talk to you about their health problems and
concerns?
(circle one)
Yes 1
No 2
3. If ‘no’, why do you think this is?
4. If ‘yes’, why do you think this is?
5. Do you have a specific health professional contact who you can refer or signpost Gypsy /
Roma / Traveller people to?
(circle one)
Yes 1
No 2
6. If ‘no’, would you find such a contact useful?
(circle one)
Yes 1
No 2
7. Do you have any particular concerns about Gypsy / Roma / Traveller health?
(circle one)
Yes 1
No 2

8. If ‘yes’, please provide details.
9. Are there any specific examples of good practice that you are aware of in relation to
Gypsy / Roma / Traveller health?
10. Do you have any particular concerns or challenges in working with Gypsies / Gypsies /
Roma / Travellers?
(circle one)
Yes 1
No 2

11. If ‘yes’, please provide details.
12. What do you think could be done to make your work with Travellers easier or to help
overcome any challenges?
13. What do you think could be done to improve the health of Gypsy / Roma / Traveller
people?