Health Monitoring of Composite Overwrapped Pressure ...
18
Rick Russell NASA Kennedy Space Center David Grundy, David Jablonski, PhD, Christopher Martin, Andrew Washabaugh, PhD and Neil Goldfine, PhD JENTEK Sensors, Inc. Health Monitoring of Composite Overwrapped Pressure Vessels (COPVs) using Meandering Winding Magnetometer (MWM ® ) Eddy Current Sensors 12 th International Symposium on Nondestructive Characterization of Materials (NDCM-XII) June 2011
Transcript of Health Monitoring of Composite Overwrapped Pressure ...

Rick RussellNASA Kennedy Space Center
David Grundy, David Jablonski, PhD, Christopher Martin, Andrew Washabaugh, PhD
and Neil Goldfine, PhDJENTEK Sensors, Inc.
Health Monitoring of Composite Overwrapped Pressure Vessels (COPVs) using Meandering Winding Magnetometer (MWM®)
Eddy Current Sensors
12th
International Symposium on Nondestructive Characterization of Materials (NDCM-XII)
June 2011

Agenda•
Define COPV
•
Background•
Proof of concept test plan
•
MWM technology•
Coupon Testing/Results
•
Full COPV Testing/Results•
Conclusions
2

What is a COPV?
• NASA Orbiter Pressure Vessel• Need was a light weight high
strength pressure vessel• NASA COPV was designed
in 1970’s• Basic Composition:
• Boss• Composite Overwrap• Metallic Liner
• Safety is key factor
3
RR
Composite Overwrap Metallic Liner
Boss Boss

Background•
There are 3 mechanisms that affect the life of a COPV
–
The age life of the overwrap–
Cyclic fatigue of the metallic liner
–
Stress Rupture life
•
A COPV Stress Rupture is a sudden and catastrophic failure of the overwrap
while holding at a stress level below the ultimate strength for
an extended time.
•
Currently there is no simple, deterministic method of determining the stress rupture life of a COPV, nor a screening technique to determine if a particular COPV is close to the time of a stress rupture failure.
4
The first two mechanisms are understood through test and analysis

Stress Ratio•
A key factor in the stress reliability model is the Stress Ratio
•
The stress at burst varies from vessel to vessel, therefore the discrete stress ratio varies from vessel to vessel
•
Recent Orbiter COPV testing has proven that analytic prediction of the stress ratio and subsequent reliability modeling to be highly inaccurate
•
~20% off
•
Proposed technology would provide the ability to directly measure the stresses at various depths in the overwrap
and potential directly calculate the Stress Ratio
5
STRESS RATIO =Stress in Overwrap
@ MEOP
Stress in Overwrap
@ Burst

Proof of Concept Study
•
KSC funded a proof-of-concept study to study the ability eddy current sensors to measure stresses in a carbon wrapped COPV
•
Why MWM Eddy current?•
MWM and MWM-Arrays measure bulk conductivity within the depth of penetration with a selectivity biased towards those fibers aligned with the sensors drive windings
•
Conductivity and density of carbon fibers varies with stress
6

MWM®
Technology
•
Magnetic Stress Gages (MSGs) will be produced utilizing Meandering Winding Magnetometer (MWM) and/or MWM-Array eddy current sensor technology
–
What is MWM? (see slide 10 for an example of an MWM-Array)•
Primary winding is a linear construct that can be aligned with fibers•
Secondary windings for sensing the response•
Fabricated on thin flexible substrate creating a conformable sensor•
Can be manufactured in various array configurations•
Depth of penetration varies with sensor wavelength (spacing) and
frequency•
Vendor has capability to perform computer simulations
70.1
2
3
4
56789
1
2
3
4
5678
Pen
etra
tion
Dep
th (m
m)
104 105 106 107 108
Frequency (Hz)
4
5678910
2
3
4
56789100
2
3
Penetration D
epth (mils)
3.8 mm spatial wavelength
10.2 mm spatial wavelength
For a nonmagnetic material withelectrical conductivity of 0.02 %IACS

Proof-of-Concept Test Plan
•
Select an MWM eddy current sensor for COPV application
•
Design and test coupons for initial configuration testing
•
Adapt sensors and procedures•
Hydrostatic test with sensors on full COPV
•
Final report
8

Test Article
9
•Fibers: Toray T-800 24k•Resin: 826/Huntsman T403
1 helical 17 degrees
5 hoops
2 helicals
18 degrees
5 hoops
1 high angle helical ( 60 degrees)
1 helical 17 degreesAluminum
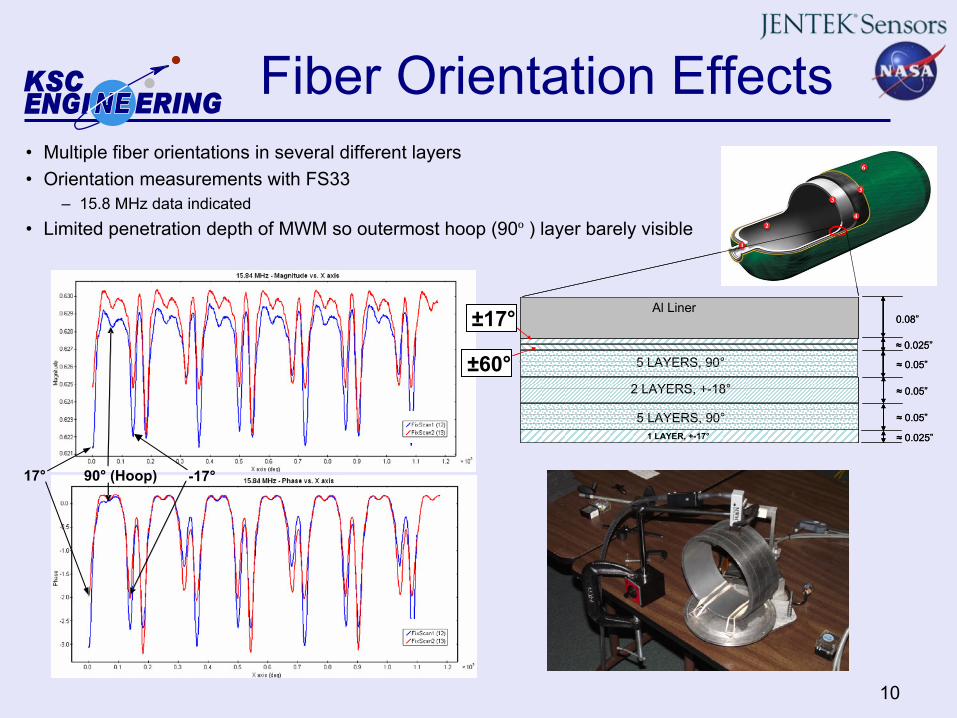
Fiber Orientation Effects •
Multiple fiber orientations in several different layers•
Orientation measurements with FS33–
15.8 MHz data indicated•
Limited penetration depth of MWM so outermost hoop (90º ) layer barely visible
10
17° 90°
(Hoop) -17°
Al Liner
1 LAYER, +-17°
5 LAYERS, 90°
5 LAYERS, 90°
2 LAYERS, +-18°
0.08”
≈ 0.025”
≈ 0.05”
≈ 0.025”
≈ 0.05”
≈ 0.05”
Al LinerAl Liner
1 LAYER, +-17°1 LAYER, +-17°
5 LAYERS, 90°5 LAYERS, 90°5 LAYERS, 90°
5 LAYERS, 90°5 LAYERS, 90°5 LAYERS, 90°
2 LAYERS, +-18°2 LAYERS, +-18°
0.08”
≈ 0.025”
≈ 0.05”
≈ 0.025”
≈ 0.05”
≈ 0.05”±60°
±17°±17°
±60°

Sensors Used
11
FA28
≈
150 mils
MWM-Array FA28 MWM FS36MWM-Array FA41
Near Channels
Drive Winding
Far Channels
FS36
≈
400.0 milsFA41
≈
480/190 mils

Coupon Testing
12
•
Coupon cut from center section of COPV (~4”
wide)•
Two test fixtures designed•
Due to cutting only hoop direction could be measured
•
Several different sensor designs and orientations were testedStresses produced by compressive loading of
tapered wedges
Stresses produced by tensile loading of specially design test
fixtureExample of results from compressive
loading of tapered wedges test

Hydrostat Test•
Full COPV tested hydrostatically at KSC on February 5, 2011•
Vessel cycled to 8,000 psi
and back to zero stopping at 2,000 psi
increments–
Pressure chosen to mimic MEOP –
Estimated design burst pressure of COPV is 16,000 psi•
Based on coupon tests 3 sensor configurations were chosen–
Different wavelength to obtain various depth of penetration•
Tests were performed with 3 sensor orientations–
90º, 60º
and 17º
to align sensor drive with fiber orientations
13

GridStation
Results
•
Channel to channel variability still being studied
•
Layer orientation variability will contribute to channel variability
•
Sensor magnitude correlates with pressure and strain
Hoop strain from strain gage Axial strain from stain gage
FA41 (far channel) magnitude at 17
sensor orientation
14

FA41(far channel) Results: 17, 60
and 90
Orientations
•
Average of 18 far channels of the FA41•
Two repeat pressure cycles: 0 psi
to 8,000 psi
and back to 0 psi
shown15
17
Sensor Orientation60
Sensor Orientation90
Sensor Orientation

FA41 and FA28 Comparison
•
Both sensors show a response and correlation with pressure•
FA41 response is much larger than FA28
16
FA41 Far Channels FA28
Note Scale Change (~10x)
90
Sensor Orientation60
Sensor Orientation17
Sensor Orientation
17
Sensor Orientation60
Sensor Orientation90
Sensor Orientation
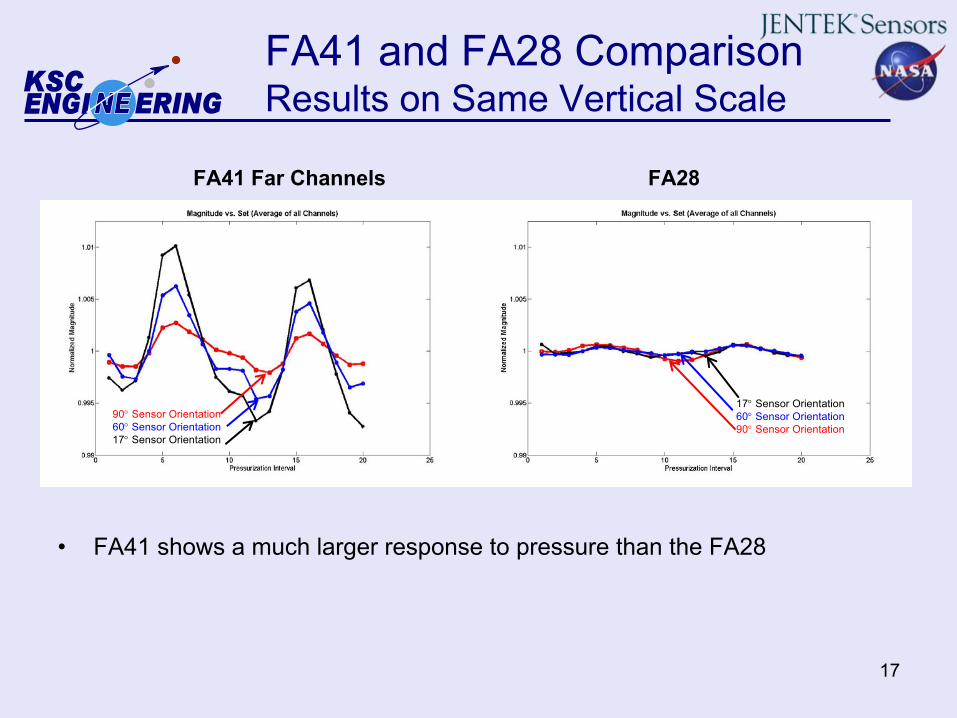
FA41 and FA28 Comparison Results on Same Vertical Scale
•
FA41 shows a much larger response to pressure than the FA28
17
FA41 Far Channels FA28
90
Sensor Orientation60
Sensor Orientation17
Sensor Orientation
17
Sensor Orientation60
Sensor Orientation90
Sensor Orientation

Conclusions
•
Demonstrated a correlation between MWM response and pressure or strain.
•
Demonstrated the ability to monitor stress in COPV at different orientations and depths.
•
FA41 provides best correlation with bottle pressure or stress.
18