Health Inequalities in Europe health... · health inequalities, but other inequalities and...
98
Health Inequalities in Europe: Setting the Stage for Progressive Policy Action Timon Forster, Alexander Kentikelenis and Clare Bambra
Transcript of Health Inequalities in Europe health... · health inequalities, but other inequalities and...
Health Inequalities
in Europe:Setting the Stage for
Progressive Policy Action
Timon Forster, Alexander Kentikelenis and Clare Bambra

Health Inequalities
in Europe:Setting the Stage for
Progressive Policy Action
Timon Forster, Alexander Kentikelenis and Clare Bambra
Published by:
TASC
101 Baggot Street Lower
Dublin 2
D02 TY29
Ireland
Tel: +353 1 616 9050
E-mail: [email protected]
Website: www.tasc.ie
Twitter: @TASCblog
Disclaimer
The present report does not represent the European Parliament’s views but only of the respective authors.
Timon Forster is a PhD candidate of the Berlin Graduate
School for Transnational Studies, Freie Universität Berlin. His
research interests include the distributional consequences
of economic reforms, international political economy, and
global public health.
Alexander Kentikelenis is Assistant Professor of Sociology
and Political Economy, Bocconi University. He has published
extensively on the social and political consequences of
economic reforms.
Clare Bambra is Professor of Public Health, Newcastle
University. Her research examines the political, social, and
economic determinants of health and health inequalities.
She has published extensively in these areas, focusing on
how public policies and interventions can reduce health
inequalities.
4
Health Inequalities in Europe: Setting the Stage for Progressive Policy Action
Table of Contents
Foreword 3
Preface 7
Executive Summary 9
Introduction 13
Part A: Health Inequalities in a European Context 21
A1. Health Inequality Trends in Comparative Perspective 22
A2. Welfare States, Health Systems, and Health Inequalities 31
Part B: The Determinants of Health Inequalities 37
B1. The Role of Health Systems 38
B2. Economic Policy 51
B3. The Social Determinants of Health Inequalities 58
Part C: The Impact of Health Inequalities 65
C1. Health Inequality, Empowerment, and the Economy 66
Conclusion and Policy Recommendations 71
Bibliography 75
1
Contents

Country CodesAT Austria FI Finland NL Netherlands
BE Belgium FR France PL Poland
BG Bulgaria HR Croatia PT Portugal
CY Cyprus HU Hungary RO Romania
CZ Czech Republic IE Ireland SE Sweden
DE Germany IT Italy SI Slovenia
DK Denmark LU Luxembourg SK Slovakia
EE Estonia LT Lithuania UK United Kingdom
EL Greece LV Latvia
ES Spain MT Malta
AbbreviationsEQLS European Quality of Life Survey
ESS European Social Survey
EU European Union
EU-SILC European Union Statistics on Income and Living Conditions
GDP Gross domestic product
GP General practitioner
ISCED International Standard Classification of Education
PPP Purchasing power parity
OECD Organization for Economic Co-Operation and Development
SDGs Sustainable Development Goals
UHC Universal health coverage
WHO World Health Organization
Acknowledgements
We thank Robert Anderson, Shana Cohen, Kirsty Doyle, Hans Dubois, Marina Karanikolos, Helena
Legido-Quigley, and Johan Mackenbach for their helpful comments; all errors are ours.
Health Inequalities in Europe: Setting the Stage for Progressive Policy Action
2

Foreword
3
Foreword
By Claus Wendt
Professor of Sociology of Health and Healthcare Systems, Siegen University
It was the sociologist T.H. Marshall who observed the development from civil rights to political rights
and further to social rights. Equal citizenship rights are not compatible with material conditions that
prevent individuals from making full use of their political and civil rights. This injustice is most evident
when focusing on the right to health. Without health and social measures that compensate for poor
health, individuals are not able to fully participate in political and social life. The great importance of
health is related to its value to all other life spheres. Not only do individuals have a right to health and
well-being, but they also have manifold individual rights that are constrained in the case of poor health.
From this perspective, health inequalities represent a particularly serious social injustice in modern
societies.
This report points to the fact that the life expectancy of people with low income and education is
about a decade shorter than that of people from higher social classes. When evaluating this vast social
problem, it is also necessary to take into account the fact that during their life course, people with low
income and education experience a lower level of health than do other population groups, and they also
experience related disadvantages in their jobs, leisure activities, and social and political commitments.
When we change the focus from the individual to the societal level, we lose vast economic, social, and
innovative potential for our societies as a result of poor health and health inequalities.
Another injustice is that health inequalities arise during infancy. Moreover, poor health increases
cumulatively, often through negative reciprocal effects for other living conditions. However, health
strains in early childhood can be reduced in later phases of life. Improving the health of disadvantaged
children is the responsibility not only of their families – who are often under multiple social and financial
strains – but also of the overall society. Usually, however, we experience the opposite. Negative health
effects are also apparent in working life, and the health of lower social groups is particularly negatively
affected through high work stress and other harmful circumstances.
Social policy institutions have been constructed in Europe to protect individuals and their families
against major social risks such as poverty, unemployment, and old age. This report explains the
welfare state’s role in moderating the effects of behavior and social determinants to health and health
inequalities. As part of these developments, healthcare systems in Europe have evolved to guarantee
universal coverage and access to good-quality healthcare in cases of accidents and illnesses. The
positive effects for health and health inequalities can be observed when studying mortality amenable
to healthcare. All these developments are based on values that are shared by the majority of citizens in
European countries. Citizens in European welfare states widely agree that access to healthcare should
be based on need and not on the size of an individual’s bank account.
Health Inequalities in Europe: Setting the Stage for Progressive Policy Action
4
Despite well-developed welfare states and healthcare systems, problems of large health inequalities
remain. In addition to social and health policies, it is essential to improve the social and economic
conditions that make people ill in the first place. This notion demonstrates the fact that the reduction of
health inequalities is a responsibility of society at large and that a wide set of actors and institutions are
necessary to achieve the goal of a more equal and healthy society.
The requirement of bringing together various actors and institutions can be seen simultaneously as
a problem and an opportunity. The challenge is to bring together various actors and institutions with
their particular interests and client groups and to overcome the often-conflicting interests of different
institutions. If this endeavor is successful, there is not only an added value in terms of the fight against
health inequalities, but other inequalities and injustices are reduced, as well.
This report explains the causes of the vast health inequalities that continue to exist, even in the most
affluent societies. It points toward the pronounced sensitivity of health and health inequalities to the
social environment. This social environment is alterable. Public and private actors and institutions at
all policy levels, companies, and the community have the responsibility to take proper account of the
evidence provided in this report and to help create healthy societies. These healthy societies and the
reduction of health inequalities begin with healthy childcare institutions, schools, and workplaces. They
require policies that fight egoism and social exclusion and foster civic-mindedness, tolerance, and
concern for others.
5
Foreword

6
Health Inequalities in Europe: Setting the Stage for Progressive Policy Action

Preface
7
Preface
By Ernst Stetter
Secretary General, Foundation for European Progressive Studies
In 2008, the World Health Organization published a report by the Commission on the Social Determinants
of Health which stated that ‘social justice is killing people on a grand scale.’30 This was a reference to
the dramatically different life chances that people have depending on the conditions in which they are
born, grow, live, work, and age. While the commission outlined the differences in life chances between
countries, it also highlighted the importance of the differences in life chances within countries.
Increasing health inequalities both within and between countries continue to remain a challenge for
the European Union. For example, a review of health inequalities for the WHO European region found
that life expectancy differs significantly across the region and even in affluent countries inequities have
increased.13 The European Commission have outlined their commitment to reducing health inequalities
in the Third Health Programme 2014-2020. Specifically, the Programme aims to foster healthy lifestyles,
through supportive environments and disease prevention, and to facilitate access to safe healthcare.
While the European Commission supports member-states in implementing the shared objectives
of the EU through the Health Programme, policy at state level is also paramount to reducing health
inequalities.
This FEPS TASC report highlights the important role that policy needs to have in combating health
inequalities both within and between countries. Specifically, it outlines how combating health inequalities
is not just the responsibility of health policy. Economic policy, including labour market policy and fiscal
policy, can also have an impact on health inequalities and therefore, has an important role in devising
policy strategies that address uneven and unequal access to quality care.
This report demonstrates the urgency of overcoming disparities in health, and thus life experience,
based on income, occupation, education and other differences. Equality in healthcare is an issue
fundamental to human rights and social justice, as Martin Luther King famously argued, and to the
economic, social, and political future of the European Union.
Health Inequalities in Europe: Setting the Stage for Progressive Policy Action
8

Executive Summary
9
Executive SummaryBy some measures, such as life expectancy at birth, the health of the European population is better
today than ever before. However, substantial inequalities in health continue to exist:
• Between European countries, life expectancy and mortality continue to be better in Western
European countries than in Eastern European countries.
• Within European countries, there are stark social gradients in morbidity, mortality, and life expectancy:
the higher the social position (approximated by level of education, occupation, or position in the
income distribution), the better the health. Such health inequalities are present in all countries, by
gender, and across different age groups.
This report examines health inequalities in Europe—the extent of inequalities, their costs to society,
their determinants, and what can be done by policymakers to reduce them. In Part A, we investigate
these health inequalities both between and within different European countries—highlighting recent
trends and key issues not only in health outcomes, but also in associated risk factors.
These health inequalities have multiple causes, outlined in Part B. We primarily focus on three major
determinants: health systems; economic policy; and the wider social determinants of health. Firstly, we
find that the cross-national variation in financing, resources, and coverage of healthcare may narrow or
widen health inequalities. National health systems that provide universal healthcare can reduce health
inequalities—particularly in terms of mortality amenable to healthcare.
Secondly, we emphasise two aspects of economic policy:
• Labour market policy seeks to address imperfections in labour markets and achieve full
employment. Yet, insecure and temporary employment—on the rise in the EU since the global
financial crisis—are associated with negative health consequences. Such forms of employment
are concentrated amongst people of lower socioeconomic status. Thus, we find that in the
absence of any protective measures, labour market deregulation may contribute to health
inequalities.
• Fiscal policy pertains to government resources and spending on social protection, public
health policy, or sustainability. We show that cuts in government spending on social protection
due to austerity have been linked to higher health inequalities in Europe (e.g., through rising
unemployment or loss of public services). Yet, we also illustrate that fiscal policy and public
health regulation can reduce health inequalities, as some European countries have shown
through combatting unhealthy diets or providing sustainable energy.
Thirdly, we examine the wider social determinants of health—the conditions in which people are born,
grow, live, work, and age. Specifically, we note:
• The health benefits of higher levels of education are clear, as individuals with tertiary education
are exposed to fewer risk factors, enjoy better opportunities in the labour market, and have
increased health literacy.
• Good work and employment conditions support health through multiple mechanisms—ranging
from financial stability to social status, and from providing social networks to the protection
Health Inequalities in Europe: Setting the Stage for Progressive Policy Action
10
from psychosocial hazards. Bad work and employment conditions—often concentrated
among populations in vulnerable situations—can have the opposite effect, thereby widening
inequalities in health.
• Income inequality is one of the most pressing issues of our time. Indeed, countries with higher
income inequality levels tend to have lower life expectancy, higher infant mortality rates, as
well as higher prevalence of mental illness and obesity. Put differently, more equitable societies
tend to be healthier societies.
In Part C, we draw attention to the sizeable economic costs of health inequalities. In the European Union,
they are estimated to cost €980 billion per year, or 9.4 percent of European GDP, as a result of lower
productivity and higher healthcare and welfare costs. Increasing the health of the lowest 50 percent of
the European population to the average health of the top half would improve labour productivity by 1.4
percent of GDP each year—meaning that within five years of these health improvements, the GDP of the
European Union would be more than 7 percent higher.
Based on a comprehensive mapping of the multiple causes of health inequalities in Europe, we
conclude by proposing a progressive agenda to act on their determinants:
1. Reforms in health policy should include provisions to ensure universal health coverage, along
with reforms that reduce barriers to accessing and utilising health services—such as lack of
health literacy.
2. In terms of economic policy, the regulation of labour markets and working conditions should
provide individuals with healthy work. Further, fiscal policy measures should improve job and
income stability of people in vulnerable situations.
3. Public health policy interventions should address risk factors pertaining to health-related be-
haviour, such as regulating the consumption of tobacco and alcohol, as well as targeting adver-
tising and the sale of unhealthy foods.
4. Improving the social determinants of health is a key element for reducing health inequalities in
Europe. Thus, governments should reduce barriers to accessing education and put redistributive
measures in place to make societies more equitable.
5. Along all policy dimensions, proposed reforms should be evaluated in advance of implemen-
tation to assess their health consequences. Thus, we advocate the use of health impact assess-
ments, an established framework through which the potential health impact of policies can be
systematically assessed.
In realising this agenda, policy interventions should be universal, but implemented at a level and
intensity of action proportionate to need—an approach known as ‘proportionate universalism.’ In doing
so, tackling health inequalities promises not only economic benefits at a national level, but—much
more importantly—delivers on a basic human right: the right to the highest attainable standard of
health, irrespective of place of birth, gender, ability, or socioeconomic background.
11
Executive Summary

12
Health Inequalities in Europe: Setting the Stage for Progressive Policy Action

Introduction
13
IntroductionHealthier but Still UnequalThe past decade has taken its toll on the economic and social outlook of the European Union (EU),
as the global financial crisis of 2007/8 engulfed the continent.1-4 The subsequent policy responses in
some countries—like Greece, Spain, or Ireland—did little to ensure a speedy or equitable recovery and
living standards declined. By contrast, other countries—like Germany or Sweden—implemented policy
measures that limited the macroeconomic impact of the shock. Nonetheless, the crisis and its policy
aftermath had devastating social consequences across the entire continent—some of which are only
now beginning to become apparent—and its political reverberations continue to be felt.5-6
At first glance, the impact of the crisis on population health across Europe is far from obvious. In the EU,
total life expectancy at birth—the average number of years an individual can expect to live at birth—
increased from 79.4 in 2008 to 81.0 in 2016. In fact, life expectancy improved across all 28 EU member-
states, although the trajectory since 2008 varies. For instance, Estonia records the biggest absolute
improvement, increasing life expectancy at birth from 74.4 years in 2008 to 78.0 in 2016. By contrast,
the respective gain in Hungary—starting from 74.2—over the period is 2.0 years (see also Figure A1.1).7
In fact, mortality rates in Europe have declined significantly amongst people from all levels of education
since 1990. Yet, such headline ‘success story’ figures obscure a more disconcerting reality: Gains in life
expectancy were smaller amongst men and women with a lower level of education such that relative
inequalities in mortality by education widened.8 For example, in Denmark, the difference in life expectancy
at age 30 between men with low education and those who have completed tertiary education rose
from 4.8 years to 6.4 years between 1987 and 2011. The respective gap for women increased from 3.7
years to 4.7 years over the same period.9 In England, a report by the British Department of Health shows
that health inequalities have increased more recently, too: In 2010, life expectancy for men in England’s
most deprived areas was 9.1 years less than for those in the richest areas; by 2015, the figure had risen
to 9.2 years. The equivalent gap for poor women also grew over that time, from 6.8 years to 7.1 years.10
Since the impact of policy reforms on life expectancy may take years to materialise, these changes cannot
be attributed to the past ten years alone. Thus, consider mental health—which is more responsive to the
immediate circumstances—as another example for the unequal progress in terms of health inequalities.
Different waves of the European Social Survey (ESS) enable analyses of depressive feelings in selected
European populations over the course of the financial crisis. Perhaps surprisingly, in all but 2 out of 19
countries—Cyprus and Spain—the general population reported fewer depressive feelings in 2014 than
in 2006.1 When disaggregating these trends by subsets of the general population, however, complex
trajectories of inequalities surface. On the one hand, inequalities between individuals who primarily rely
on public benefits for income and people with wage and financial income have decreased. On the other
hand, the development of depressive feelings was less favourable among the precariously employed
and the inactive relative to people working on unlimited contracts.11
1 No data are available on the following EU member-states: Czech Republic; Greece; Croatia; Italy; Luxem-bourg; Lithuania; Latvia; Malta; and Romania.
Health Inequalities in Europe: Setting the Stage for Progressive Policy Action
14
Although we caution to interpret these figures in isolation, both the data on life expectancy and mental
health point towards health inequalities. In this report, we understand health inequalities as ‘systematic,
avoidable, and important differences [in health],’12 which are—as we will show—substantially shaped by
a country’s policy environment.
Growing Awareness of Health Inequalities and the European Context Across Europe there is growing awareness of health inequalities. In 2013, the World Health Organization
(WHO) published its Review of Social Determinants and the Health Divide in the WHO European Region.
This report of health inequalities across the 53 member-states of the Region was commissioned to
support the development of a new European policy framework for health and well-being, Health 2020.13
In the same year, the European Commission published a policy statement, Health Inequalities in the
EU, based on research on health inequalities in the EU prepared by a consortium chaired by Michael
Marmot.14 Building on the global evidence of health inequalities, these reports highlight the complex
social and economic interventions required to reduce health inequalities, and the need for action at
national and European level.
More specifically in an EU policy context, promoting good health is an integral part of Europe 2020—the
EU’s 10-year economic-growth strategy. Of the seven flagship initiatives that support this project, The
European Platform against Poverty is particularly relevant to health inequalities.15 Following from the
European Commission’s Communication Solidarity in Health: Reducing Health Inequalities in the EU,16-17 it
encompasses measures to help EU countries and stakeholders identify and implement ‘best practices’;
to regularly survey the state of inequalities in the EU and successful strategies to reduce them; to
improve assessments on the impact of reforms on health inequalities; and to help countries use EU
funds to improve the health of the worst off and reduce regional health inequalities.15
The Social Gradient in Health InequalitiesHealth inequalities originate from the differing exposure and vulnerability to health risks by social
groups—between and within countries.18 Across different measures of social standing—such as level
of education, occupation, or income—the socially-advantaged tend to fare better than individuals from
lower socioeconomic backgrounds. This relationship is commonly referred to as the ‘social gradient
in health.’19 Figure 1.1 depicts stylised health gradients in two societies, denoted by [A] and [B]. In both
cases, higher social standing is associated with better health—although the slope of the gradients
differs (see Section A1 for empirical evidence). Four characteristics of health gradients merit further
discussion:20
• Social gradients are continuous—in Figure 1.1, health outcomes improve successively as social
standing increases. Thus, a discussion that focuses solely on the health gap between those
with the highest and lowest social status is incomplete.19
Introduction
15
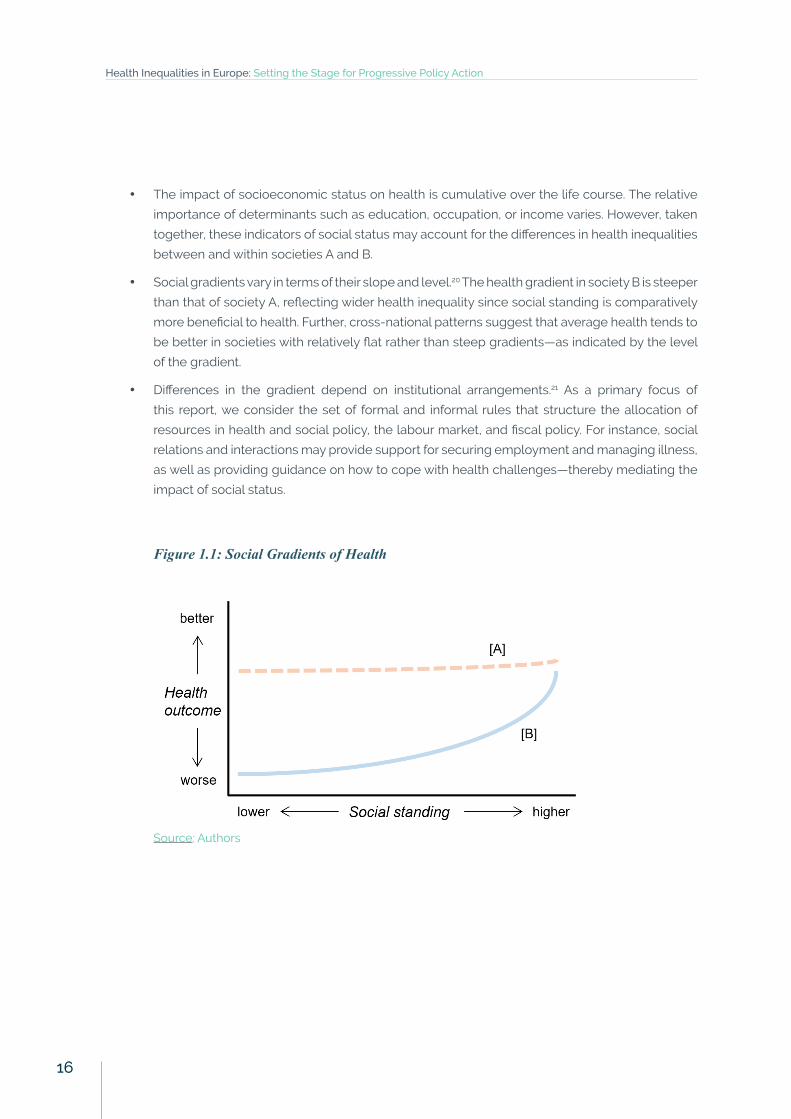
• The impact of socioeconomic status on health is cumulative over the life course. The relative
importance of determinants such as education, occupation, or income varies. However, taken
together, these indicators of social status may account for the differences in health inequalities
between and within societies A and B.
• Social gradients vary in terms of their slope and level.20 The health gradient in society B is steeper
than that of society A, reflecting wider health inequality since social standing is comparatively
more beneficial to health. Further, cross-national patterns suggest that average health tends to
be better in societies with relatively flat rather than steep gradients—as indicated by the level
of the gradient.
• Differences in the gradient depend on institutional arrangements.21 As a primary focus of
this report, we consider the set of formal and informal rules that structure the allocation of
resources in health and social policy, the labour market, and fiscal policy. For instance, social
relations and interactions may provide support for securing employment and managing illness,
as well as providing guidance on how to cope with health challenges—thereby mediating the
impact of social status.
Figure 1.1: Social Gradients of Health
Source: Authors
Health Inequalities in Europe: Setting the Stage for Progressive Policy Action
16
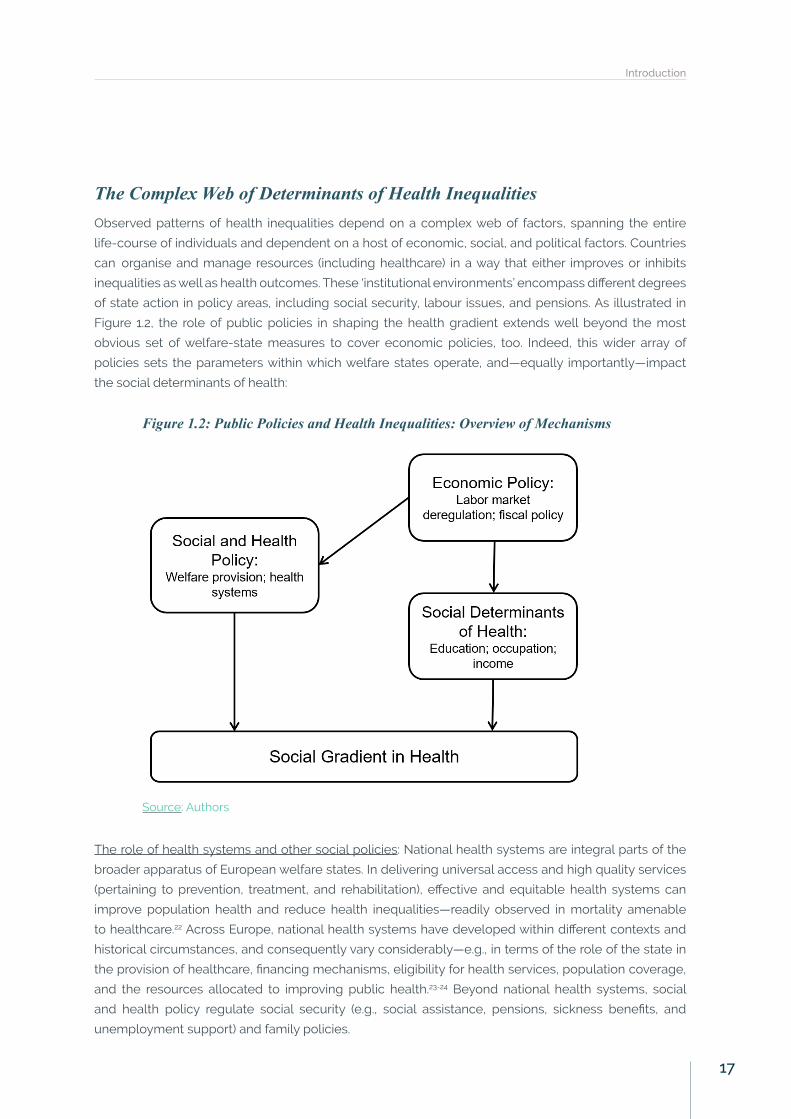
The Complex Web of Determinants of Health InequalitiesObserved patterns of health inequalities depend on a complex web of factors, spanning the entire
life-course of individuals and dependent on a host of economic, social, and political factors. Countries
can organise and manage resources (including healthcare) in a way that either improves or inhibits
inequalities as well as health outcomes. These ‘institutional environments’ encompass different degrees
of state action in policy areas, including social security, labour issues, and pensions. As illustrated in
Figure 1.2, the role of public policies in shaping the health gradient extends well beyond the most
obvious set of welfare-state measures to cover economic policies, too. Indeed, this wider array of
policies sets the parameters within which welfare states operate, and—equally importantly—impact
the social determinants of health:
Figure 1.2: Public Policies and Health Inequalities: Overview of Mechanisms
Source: Authors
The role of health systems and other social policies: National health systems are integral parts of the
broader apparatus of European welfare states. In delivering universal access and high quality services
(pertaining to prevention, treatment, and rehabilitation), effective and equitable health systems can
improve population health and reduce health inequalities—readily observed in mortality amenable
to healthcare.22 Across Europe, national health systems have developed within different contexts and
historical circumstances, and consequently vary considerably—e.g., in terms of the role of the state in
the provision of healthcare, financing mechanisms, eligibility for health services, population coverage,
and the resources allocated to improving public health.23-24 Beyond national health systems, social
and health policy regulate social security (e.g., social assistance, pensions, sickness benefits, and
unemployment support) and family policies.
Introduction
17
Economic policy: Variation in health outcomes further stems from the economic systems by which
societies allocate and distribute resources, and regulate economic activity. That is, economic policy
envisages different roles of the state, the market, individuals, and nongovernmental organisations
(NGOs) in the provision of goods and services. Due to the interdependence of institutional arrangements,
economic policy impacts upon the design and effectiveness of social and health policy. In fact, while it
is useful to distinguish between the two analytically—as discussed separately in this report—economic
and social policy are so closely intertwined that it is often difficult to disentangle them in practice.
For instance, economic production models shape employment and work conditions, thereby affecting
health and health inequality.25 At the same time, they determine the funds available for health and
social welfare sectors.26 These interconnections became most apparent in some of the hardest-hit
countries in crisis: With unemployment rates soaring, some countries—like Greece—implemented
measures of labour deregulation at the same time as rapid and radical reductions in social expenditure.
Subsequently, health and social policies became patently unable to protect populations in the most
vulnerable situations from the adverse consequences of unemployment, and even exacerbated the
impact of joblessness due to heightened insecurity and financial strain. Thus, the interplay of social
policies with the macroeconomic context has the potential to alleviate, or worsen, the health-inequality
impact of individual policies.
Social determinants of health: Economic policy also has profound implications on the social determinants
of health—the conditions ‘in which people are born, grow, live, work, and age.’27 While these conditions
cover the life course, we focus on education, the workplace, and income. The level of education is
widely used as a social marker. To understand the magnitude of such educational health inequalities,
we consider the educational attainment of individuals as well as policies that lead to upskilling. The
latter often occurs at the workplace, which is why employment and work conditions—in addition to
their independent effect on health inequalities—merit further discussion. Finally, wages are the main
source of income for a vast majority of workers. However, income is distributed unequally, and such
inequalities may further exacerbate health inequalities.
A Call for ActionWhy do health inequalities matter? Governments around the world have long acknowledged the right
to health—for example, through the Universal Declaration of Human Rights in 1948 or the Constitution
of the World Health Organization (WHO). In the EU, individuals are entitled to access healthcare and to
the highest attainable standard of health as one of their fundamental human rights,28-29 and such right
should not be conditional on one’s socioeconomic background. Better health empowers individuals to
lead flourishing lives, to fulfil their potential, and improves their well-being.30 In addition, the economic
costs of inequalities in health are sizeable. For example, welfare losses due to health inequalities are
estimated to amount to €980 billion per year, or 9.4 percent of GDP in the EU.31 Further, action on
the underlying causes of health inequalities—such as improving education, providing sustainable
employment, and narrowing income inequality—promises to enhance productivity and increase
innovation, thereby stimulating economic growth.
The multiple causes and consequences of health inequalities indicate that national health systems
in Europe need to become more responsive to the needs of their populations. As discussed above,
Health Inequalities in Europe: Setting the Stage for Progressive Policy Action
18
the EU has already acknowledged the highest attainable standard of health as a human right, and—
as Nobel-prize winning economist Amartya Sen has argued—‘[t]he acceptance of health as a right of
all is a demand to take action to promote that goal.’32 Such comprehensive action needs to address
the specific challenges to health equity in childhood, education, working age, and in retirement, while
taking into account their interdependencies over the life course. Further, due to the socially patterned
health outcomes, policy interventions need to cover the entire population, while being proportional to
needs—known as ‘proportionate universalism’—such that the reforms target the health of the relatively
disadvantaged groups the most.13,27 In doing so, addressing the multiple causes of health inequalities
in Europe also contributes to the achievement of the Sustainable Development Goals on health (no. 3),
education (no. 4), gender equality (no. 5), decent work (no. 8), and income inequality (no. 10). Towards this
objective, progressive action from policymakers—who are in a unique position to draw on an extended
evidence base, while taking into account the voices of civil society—is necessary.
Structure of the ReportThe report is structured as follows: In Part A, we introduce information on health inequalities both
within and between European countries, different welfare state arrangements (so-called ‘welfare state
regimes’), and national health systems. Towards this purpose, we present evidence on health inequality
in a comparative European perspective in Section A1. In Section A2, we describe clusters of welfare
provision in Europe. We link such discussion to the national health systems of selected European
countries in terms of organisation and governance, financing, and resources of health services. In Part B,
we investigate the determinants of health inequalities in Europe in more detail. Initially, we elaborate on
how health systems contribute towards reducing health inequalities in Section B1, providing comparative
evidence on their effectiveness, impact on access and utilisation of health services, and their resilience
in the face of crisis. Subsequently, we focus on two realms of economic policy in Section B2—labour
market regulation and fiscal policy. Both interact with social policy and impact upon their effectiveness.
We discuss indirect effects of economic policy through the social determinants of health inequality in
Section B3. While these conditions cover the entire life course of individuals, we emphasise the role of
(1) education; (2) employment and working conditions; and (3) income and poverty—three areas of great
importance to policymakers. Moving away from discussing the causes of health inequality, we turn to
their consequences in Part C. In Section C1, we explore how better health for all can contribute to society
and the economy. This section includes information on the economic cost of health inequalities, while
also illustrating the benefits of comprehensive action on risk factors and the social determinants of
health. In the final section, we conclude by bringing together the different threads of evidence covered
in this report, identify areas for future research, and offer tentative recommendations for progressive
policy action on health inequalities in Europe.
Introduction
19

20
Health Inequalities in Europe: Setting the Stage for Progressive Policy Action
Part A: Health Inequalities in
a European Context
21
Part A: Health Inequalities in a European Context As a result of the recent attention to social gradients in health and their determinants, a growing body of
literature has documented health inequalities in the European context.8,11,33-35 In Part A, we discuss such
information on health inequalities both within and across European countries, welfare state regimes,
and national health systems.
• Section A1 presents evidence on health inequality trends in comparative perspective. Health
inequality is a multidimensional concept and the conclusions drawn depend on the application
of a particular indicator—e.g., considering changes in absolute vis-à-vis relative health
inequality,8 or using income or education to approximate for socioeconomic status.19 Although
the statistics presented in this section are primarily driven by data availability, taken together,
they offer a comprehensive picture on health inequalities in the EU.
• Section A2 investigates welfare systems in selected European countries in more detail. We
link these ‘welfare regimes’ to health inequalities, and then develop classifications of one key
element of the welfare state—national health systems—which are subsequently applied to
analyses in Part B.
A1. Health Inequality Trends in Comparative Perspective Life Expectancy and Healthy Years of Living Between CountriesLife expectancy—the average number of years an individual can expect to live at a given age—by
education reveals substantial differences between countries and gender. For example, across 23
selected OECD countries, the gap in life expectancy at age 25 between individuals with high level of
education (tertiary education) and low level of education (primary and lower secondary education or
less) around 2011 is—on average—7.7 years for men and 4.6 years for women.36
However, reliable cross-national time-series data on life expectancy by level of education are not
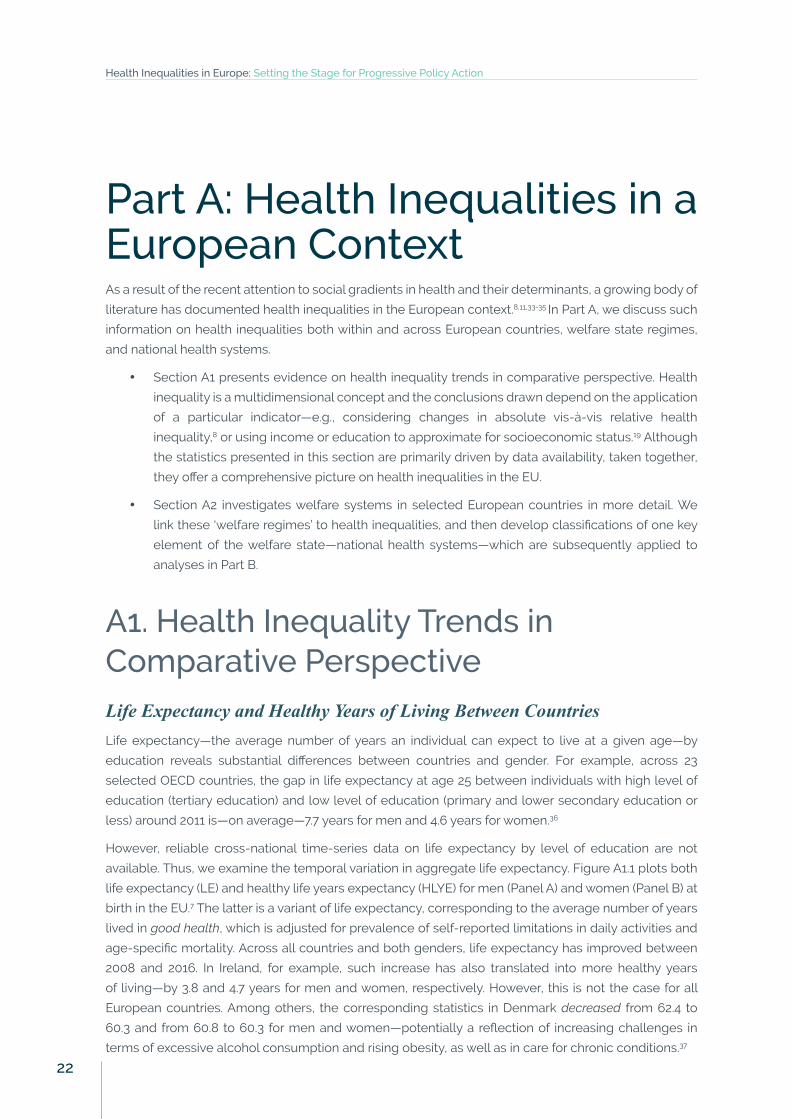
available. Thus, we examine the temporal variation in aggregate life expectancy. Figure A1.1 plots both
life expectancy (LE) and healthy life years expectancy (HLYE) for men (Panel A) and women (Panel B) at
birth in the EU.7 The latter is a variant of life expectancy, corresponding to the average number of years
lived in good health, which is adjusted for prevalence of self-reported limitations in daily activities and
age-specific mortality. Across all countries and both genders, life expectancy has improved between
2008 and 2016. In Ireland, for example, such increase has also translated into more healthy years
of living—by 3.8 and 4.7 years for men and women, respectively. However, this is not the case for all
European countries. Among others, the corresponding statistics in Denmark decreased from 62.4 to
60.3 and from 60.8 to 60.3 for men and women—potentially a reflection of increasing challenges in
terms of excessive alcohol consumption and rising obesity, as well as in care for chronic conditions.37
Health Inequalities in Europe: Setting the Stage for Progressive Policy Action
22
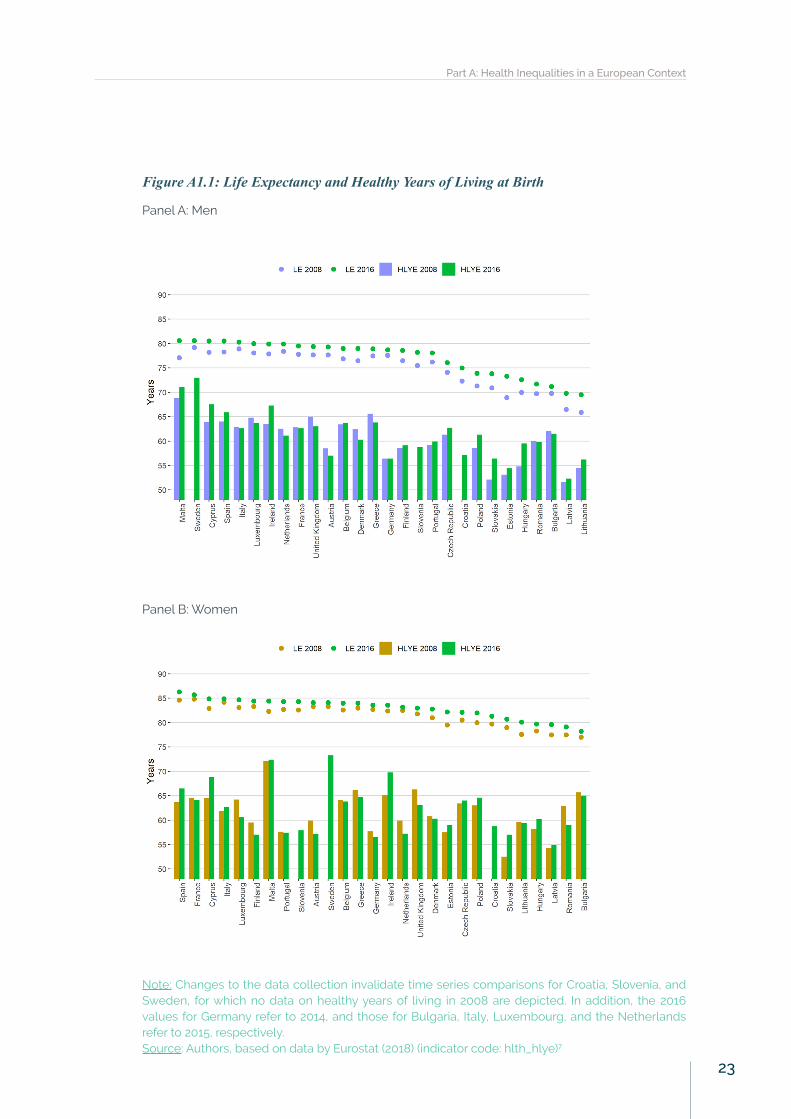
Figure A1.1: Life Expectancy and Healthy Years of Living at Birth
Panel A: Men
Panel B: Women
Note: Changes to the data collection invalidate time series comparisons for Croatia, Slovenia, and Sweden, for which no data on healthy years of living in 2008 are depicted. In addition, the 2016 values for Germany refer to 2014, and those for Bulgaria, Italy, Luxembourg, and the Netherlands refer to 2015, respectively.Source: Authors, based on data by Eurostat (2018) (indicator code: hlth_hlye)7
Part A: Health Inequalities in a European Context
23
National Income Levels as a Determinant of Between-Country Life ExpectancyIncome—reflecting a country’s development—can partly proxy for the different stages of the
epidemiological transition, i.e., national-level trends and changes in life expectancy and diseases. All else
being equal, richer states can afford to allocate more resources to healthcare. Consequently, between-
country health inequalities may originate in differences in income. Indeed, as Figure A1.2 shows, there
is a positive cross-national relationship between life expectancy and real per capita income7—known
as the Preston Curve. On average, life expectancy is better in countries with higher GDP per capita. This
general relationship appears to hold irrespective of population size (indicated by the relative size of the
circles). However, at higher levels of development the association between income and life expectancy
weakens: Although Luxembourg is wealthier than the remaining EU member-states (in per capita terms
and adjusted for purchasing power parity), life expectancy is higher in other countries. Thus, the Preston
Curve suggests income is one determinant of between-country health inequalities, but higher GDP per
capita is by no means a sufficient (or even necessary) condition to improve population health.
Figure A1.2: The Preston Curve: Life Expectancy and Real Per Capita Income
Note: Data refer to 2015. Observations are weighted by the relative population size, as indicated by the size of the circles.Source: Authors, based on data by Eurostat (2018) (indicator codes: demo_mlexpec; prc_ppp_ind; demo_gind)7
In most European nations, communicable diseases have declined some decades ago. Instead, today’s
primary health concerns in the region are non-communicable diseases, including cardiovascular
diseases and cancer.38 In these cases, interventions through health systems remain important, but
better health also depends largely on changes in population level behaviour (e.g., smoking, alcohol
consumption, or diet)—which are only imperfectly captured by national income levels.
Health Inequalities in Europe: Setting the Stage for Progressive Policy Action
24
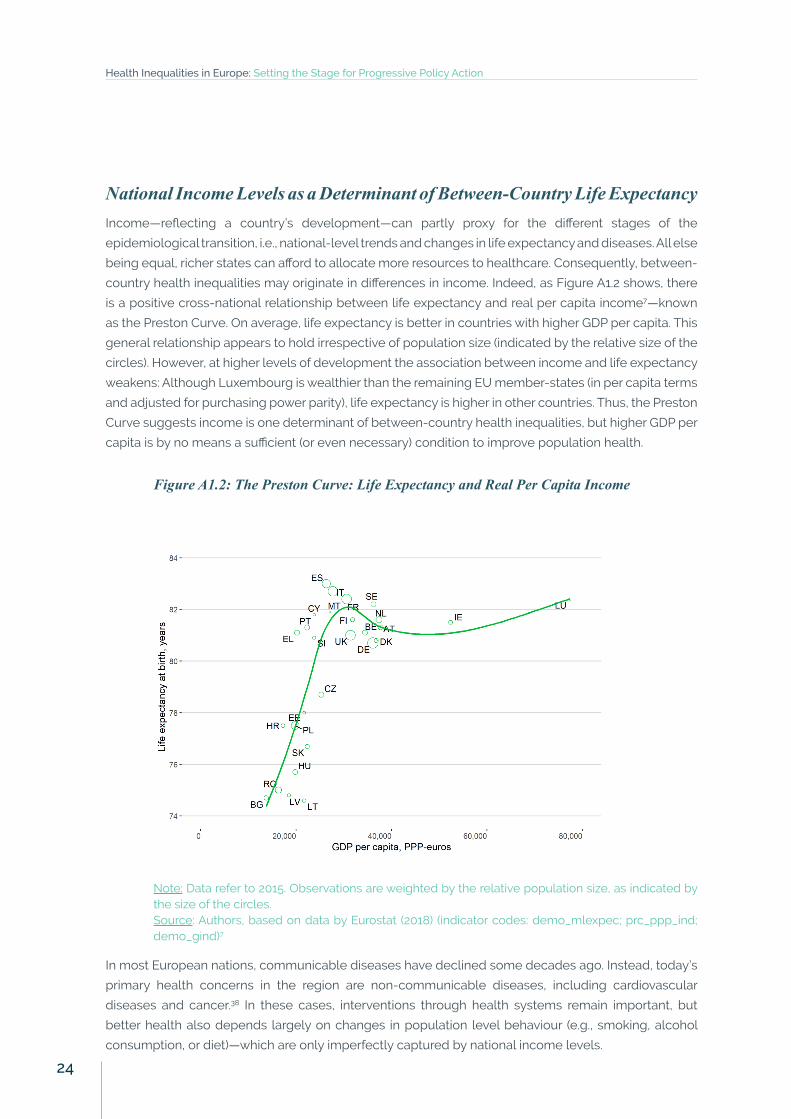
Inequalities in Self-Reported Health by IncomeEpidemiological data on life expectancy present important evidence on key aspects of the unequal
health of Europeans, but other available information helps generating a fuller picture. For instance,
indicators based on self-reported measures of health enables collecting information on health conditions
that escape objective measurement, such as well-being. Further, self-assessed health measures are
reasonable predictors of objective health status (particularly when individuals are aggregated at the
local level) and therefore provide valuable information for analyses of health inequalities.39-40 Much like
the data on life expectancy, self-reported health follows a social gradient. For example, Figure A1.3
documents that the proportion of individuals reporting good health—based on data from EU Statistics
on Income and Living Conditions (EU-SILC)—increases with income.7 In this case, the main measure of
interest is within-country health inequality—the difference in the proportion of people who report good
health by income groups. The mean value for the total population is plotted as a benchmark. Once
again, the EU statistic—where 60.0 percent in the lowest income quintile and 78.3 percent of high-
income individuals report to be in good health, respectively—masks considerable variation. Within-
country health inequalities are 21.5 percent in Ireland and 37.9 percent in Lithuania, the countries with
the highest and lowest proportion of adults in self-reported good health, respectively. As another
example, consider Portugal, where less than two out of five individuals with low income assess their
health to be good (36.2 percent), but 60.5 percent of high-income individuals do so.7
Figure A1.3: Disparities in Self-Reported Health by Income
Note: Data refer to 2016. Source: Authors, based on data by Eurostat (2018) (indicator code: hlth_silc_10)7
Part A: Health Inequalities in a European Context
25
Cross-national variation of individuals in the same income group should be interpreted cautiously since
they may reflect differences in reporting, culture, or trust.41 That is, many factors not attributable to
health may explain why average self-reported health in Ireland is higher than that of Lithuania. For the
purposes of this report, however, it is revealing that across Europe, inequalities in self-reported health
by income group exist within countries, and their extent differs.
The data in Figure A1.3 presents a static picture of self-reported health and is not without its limitations
due to differences in national surveys among countries. A recent report by Eurofound draws on data
from the European Quality of Life Survey (EQLS)—which is more homogeneously collected than EU-
SILC at the expense of a smaller sample size—and reveals health dynamics over time: The proportion of
people reporting bad health in the bottom income quartile rose from 14 percent in 2007 to 17 percent in
2011, but has since decreased to 13 percent in 2016. By contrast, little has changed for individuals in the
top income quartile, with about 1 in 20 people reporting bad health over the period under consideration.42
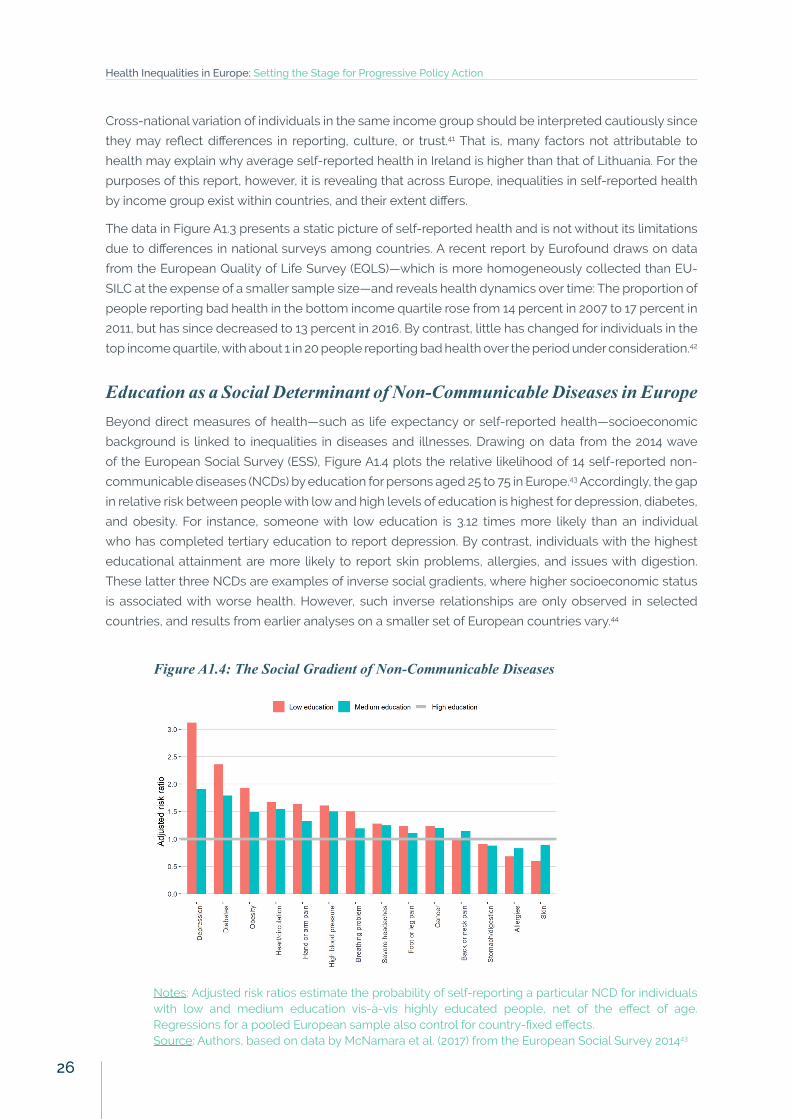
Education as a Social Determinant of Non-Communicable Diseases in EuropeBeyond direct measures of health—such as life expectancy or self-reported health—socioeconomic
background is linked to inequalities in diseases and illnesses. Drawing on data from the 2014 wave
of the European Social Survey (ESS), Figure A1.4 plots the relative likelihood of 14 self-reported non-
communicable diseases (NCDs) by education for persons aged 25 to 75 in Europe.43 Accordingly, the gap
in relative risk between people with low and high levels of education is highest for depression, diabetes,
and obesity. For instance, someone with low education is 3.12 times more likely than an individual
who has completed tertiary education to report depression. By contrast, individuals with the highest
educational attainment are more likely to report skin problems, allergies, and issues with digestion.
These latter three NCDs are examples of inverse social gradients, where higher socioeconomic status
is associated with worse health. However, such inverse relationships are only observed in selected
countries, and results from earlier analyses on a smaller set of European countries vary.44
Figure A1.4: The Social Gradient of Non-Communicable Diseases
Notes: Adjusted risk ratios estimate the probability of self-reporting a particular NCD for individuals with low and medium education vis-à-vis highly educated people, net of the effect of age. Regressions for a pooled European sample also control for country-fixed effects. Source: Authors, based on data by McNamara et al. (2017) from the European Social Survey 201443
Health Inequalities in Europe: Setting the Stage for Progressive Policy Action
26
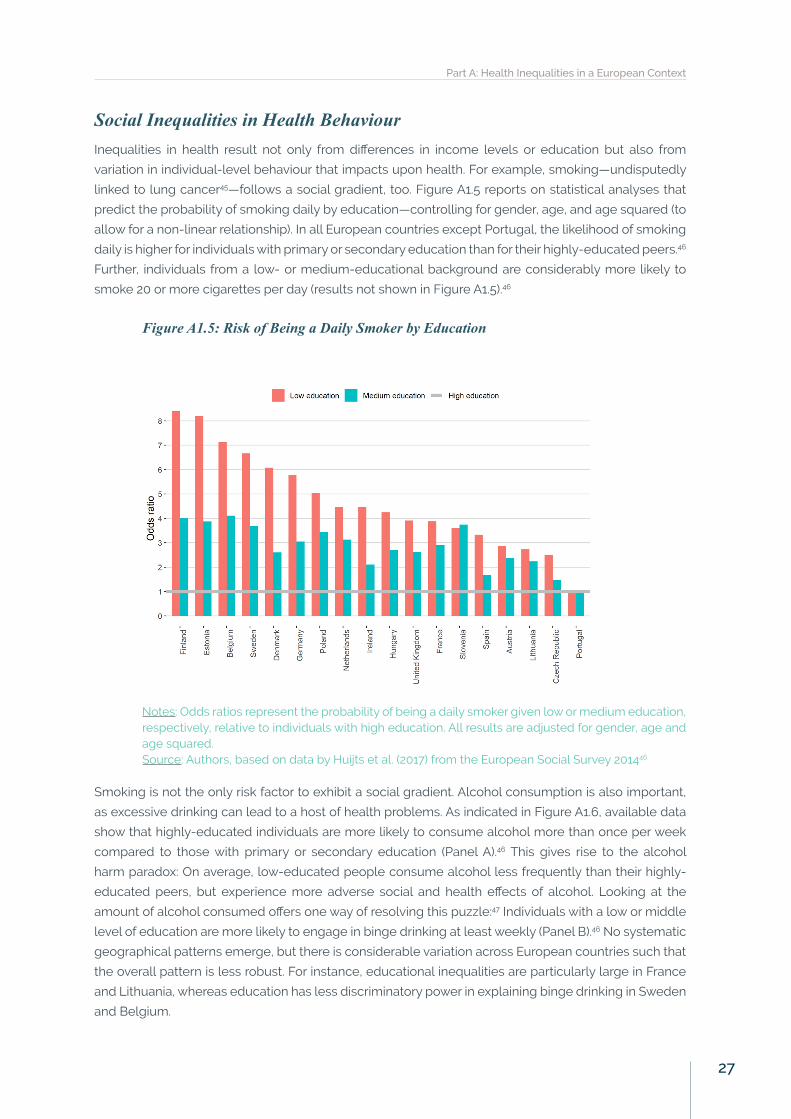
Social Inequalities in Health BehaviourInequalities in health result not only from differences in income levels or education but also from
variation in individual-level behaviour that impacts upon health. For example, smoking—undisputedly
linked to lung cancer45—follows a social gradient, too. Figure A1.5 reports on statistical analyses that
predict the probability of smoking daily by education—controlling for gender, age, and age squared (to
allow for a non-linear relationship). In all European countries except Portugal, the likelihood of smoking
daily is higher for individuals with primary or secondary education than for their highly-educated peers.46
Further, individuals from a low- or medium-educational background are considerably more likely to
smoke 20 or more cigarettes per day (results not shown in Figure A1.5).46
Figure A1.5: Risk of Being a Daily Smoker by Education
Notes: Odds ratios represent the probability of being a daily smoker given low or medium education, respectively, relative to individuals with high education. All results are adjusted for gender, age and age squared.Source: Authors, based on data by Huijts et al. (2017) from the European Social Survey 201446
Smoking is not the only risk factor to exhibit a social gradient. Alcohol consumption is also important,
as excessive drinking can lead to a host of health problems. As indicated in Figure A1.6, available data
show that highly-educated individuals are more likely to consume alcohol more than once per week
compared to those with primary or secondary education (Panel A).46 This gives rise to the alcohol
harm paradox: On average, low-educated people consume alcohol less frequently than their highly-
educated peers, but experience more adverse social and health effects of alcohol. Looking at the
amount of alcohol consumed offers one way of resolving this puzzle:47 Individuals with a low or middle
level of education are more likely to engage in binge drinking at least weekly (Panel B).46 No systematic
geographical patterns emerge, but there is considerable variation across European countries such that
the overall pattern is less robust. For instance, educational inequalities are particularly large in France
and Lithuania, whereas education has less discriminatory power in explaining binge drinking in Sweden
and Belgium.
Part A: Health Inequalities in a European Context
27
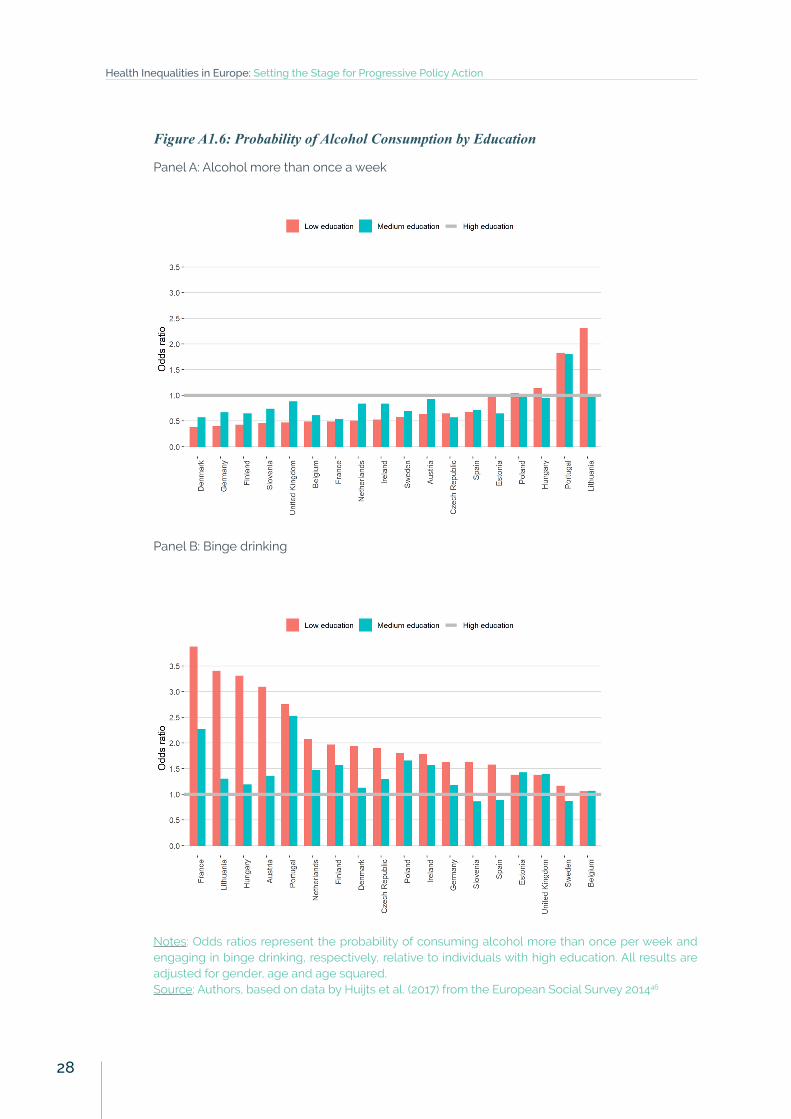
Figure A1.6: Probability of Alcohol Consumption by Education
Panel A: Alcohol more than once a week
Panel B: Binge drinking
Notes: Odds ratios represent the probability of consuming alcohol more than once per week and engaging in binge drinking, respectively, relative to individuals with high education. All results are adjusted for gender, age and age squared.Source: Authors, based on data by Huijts et al. (2017) from the European Social Survey 201446
Health Inequalities in Europe: Setting the Stage for Progressive Policy Action
28
Other important behavioural risk factors that follow a social—educational—gradient include physical
activity as well as the consumption of fruit and vegetables. Across all 21 countries in the sample of the
European Social Survey 2014 special module on health inequalities,34-35 highly educated individuals are
most likely to be physically active at least three times a week, followed by individuals with medium and
low levels of education, respectively. Again, this relationship varies by country. For instance, in Austria,
highly-educated people are more than four times as likely as individuals with a low level of education
to be physically active. By contrast, in Slovenia, education does not significantly predict differences in
physical activity. Finally, the probability of consuming fruit or vegetable at least once a day increases
with education.46 In short, evidence suggests that health inequalities may emanate from risky health
behaviour—which follow a social gradient themselves.
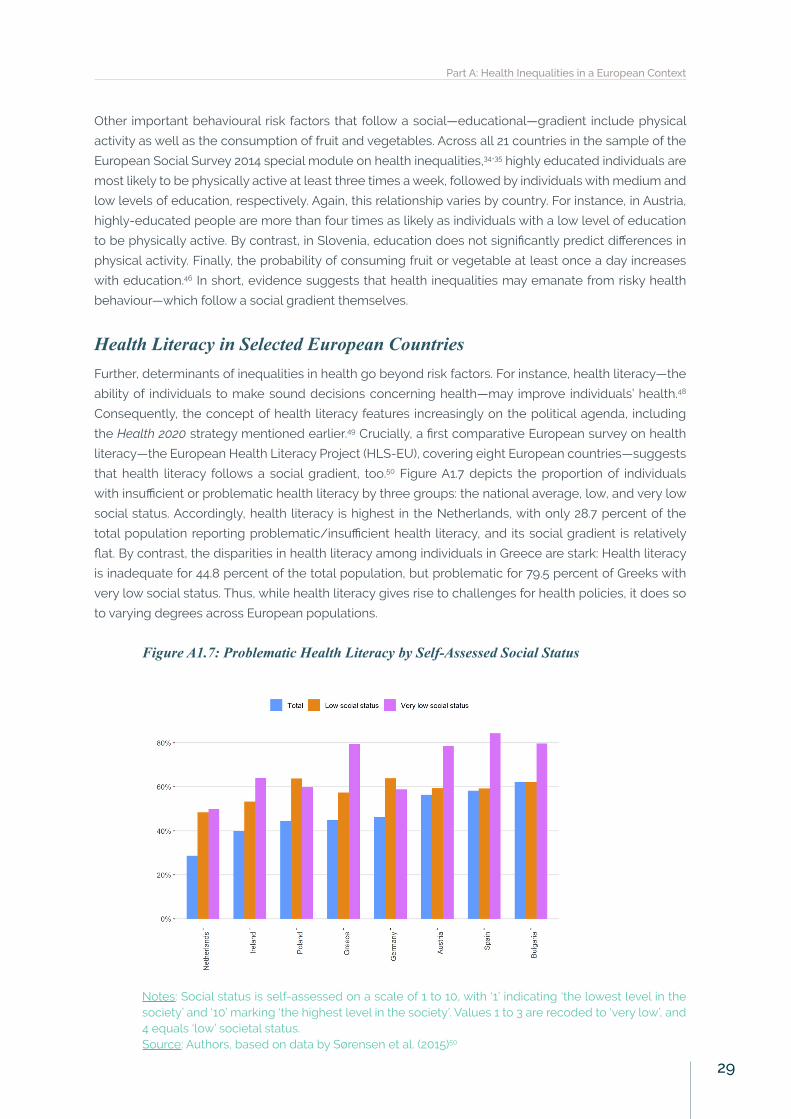
Health Literacy in Selected European CountriesFurther, determinants of inequalities in health go beyond risk factors. For instance, health literacy—the
ability of individuals to make sound decisions concerning health—may improve individuals’ health.48
Consequently, the concept of health literacy features increasingly on the political agenda, including
the Health 2020 strategy mentioned earlier.49 Crucially, a first comparative European survey on health
literacy—the European Health Literacy Project (HLS-EU), covering eight European countries—suggests
that health literacy follows a social gradient, too.50 Figure A1.7 depicts the proportion of individuals
with insufficient or problematic health literacy by three groups: the national average, low, and very low
social status. Accordingly, health literacy is highest in the Netherlands, with only 28.7 percent of the
total population reporting problematic/insufficient health literacy, and its social gradient is relatively
flat. By contrast, the disparities in health literacy among individuals in Greece are stark: Health literacy
is inadequate for 44.8 percent of the total population, but problematic for 79.5 percent of Greeks with
very low social status. Thus, while health literacy gives rise to challenges for health policies, it does so
to varying degrees across European populations.
Figure A1.7: Problematic Health Literacy by Self-Assessed Social Status
Notes: Social status is self-assessed on a scale of 1 to 10, with ‘1’ indicating ‘the lowest level in the society’ and ‘10’ marking ‘the highest level in the society’. Values 1 to 3 are recoded to ‘very low’, and 4 equals ‘low’ societal status.Source: Authors, based on data by Sørensen et al. (2015)50
Part A: Health Inequalities in a European Context
29
In sum, health inequalities in Europe persist, but they vary largely between and within countries.
This suggests that different causal mechanisms and policies are at play. Certain outcomes, like life
expectancy, may be more readily explained by cross-national differences in health systems and income.
However, risk factors and health literacy are subject to broader macroeconomic and institutional policies,
pertaining to education, the workplace, or income. Thus, it is important to consider both clusters—the
role of national health systems and the social determinants of health—and their interaction in explaining
health inequalities. Before doing so, Section A2 presents evidence on the relationship between welfare
regimes and national health systems of selected European countries.
Health Inequalities in Europe: Setting the Stage for Progressive Policy Action
30
A2. Welfare States, Health Systems, and Health InequalitiesWelfare States and Health Systems Matter for Health InequalitiesThe ‘welfare state’ refers to the collection of various social security entitlements (including social
assistance, pensions, sickness benefits, and unemployment support), family policies, and health
systems provided by the state.26 Such policies have an important role in moderating the effects of
the social and behavioural determinants of health and health inequalities.51-52 Yet, welfare states vary
across time and space. Thus, scholars have classified them into different types—commonly referred to
as welfare state regimes—which have underlying commonalities in how they try to achieve their goals
(e.g. in terms of financing, principles, or generosity).26,53-54 In comparative health research, five clusters of
welfare regimes are commonly identified:52,55-57
• Liberal or Anglo-Saxon: State provision of welfare is limited, social protection benefits are modest
and often subject to strict entitlement criteria, and recipients are usually means-tested.
• Conservative or Bismarckian: Welfare programs are tied closely to earnings such that they preserve
existing disparities by social status. The role of the family is also emphasised and the redistributive
impact is minimal. However, the role of the market is limited.
• Social Democratic or Scandinavian: These regimes are characterised by comparatively generous
public benefits and a commitment to full employment and income protection. A strongly interven-
tionist state promotes equality through a redistributive social security system.
• Southern or ‘familial’: The system of welfare provision is fragmented in that it consists of diverse in-
come maintenance schemes with different levels of generosity. Due to limited and partial coverage
of public services, reliance on the family and voluntary sector is a prominent feature.
• Eastern: Eastern European countries have experienced the demise of the universalism of the Com-
munist welfare state and a shift towards policies associated with marketisation and decentralisa-
tion. Compared to other EU member-states, they have limited welfare services.
Table A2.1 provides an overview of all EU member-states by welfare regime cluster.
Part A: Health Inequalities in a European Context
31
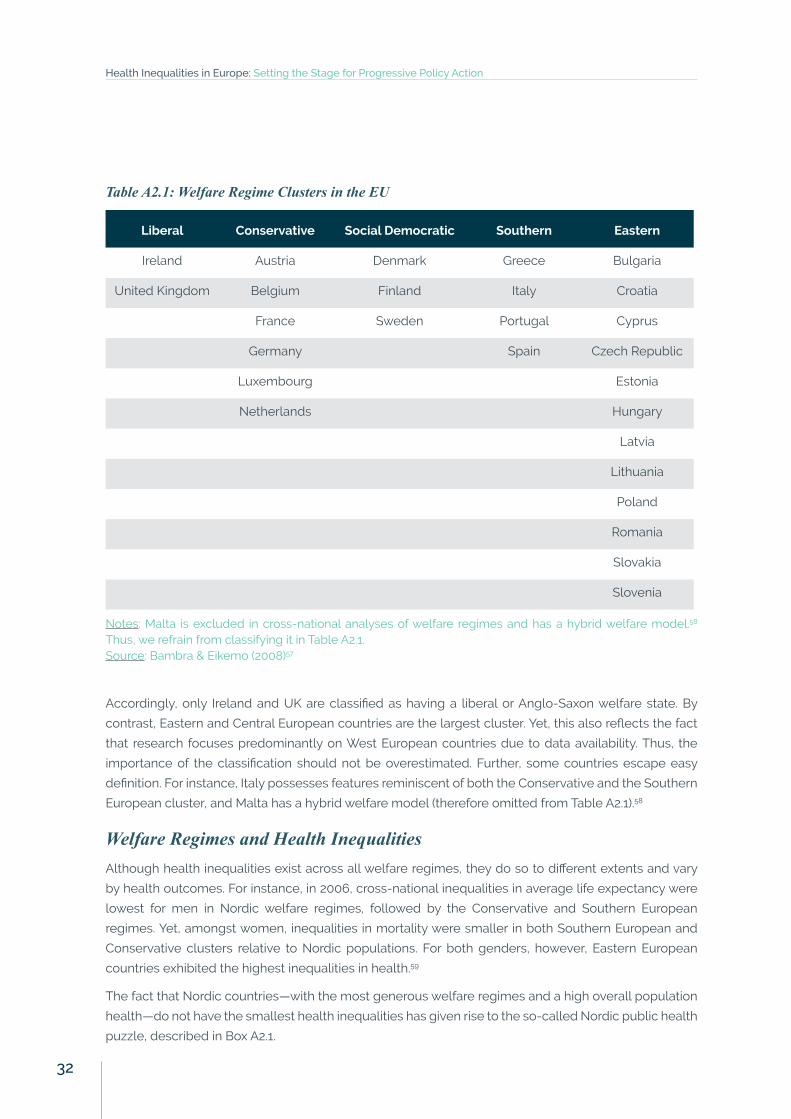
Table A2.1: Welfare Regime Clusters in the EU
Liberal Conservative Social Democratic Southern Eastern
Ireland Austria Denmark Greece Bulgaria
United Kingdom Belgium Finland Italy Croatia
France Sweden Portugal Cyprus
Germany Spain Czech Republic
Luxembourg Estonia
Netherlands Hungary
Latvia
Lithuania
Poland
Romania
Slovakia
Slovenia
Notes: Malta is excluded in cross-national analyses of welfare regimes and has a hybrid welfare model.58 Thus, we refrain from classifying it in Table A2.1.Source: Bambra & Eikemo (2008)57
Accordingly, only Ireland and UK are classified as having a liberal or Anglo-Saxon welfare state. By
contrast, Eastern and Central European countries are the largest cluster. Yet, this also reflects the fact
that research focuses predominantly on West European countries due to data availability. Thus, the
importance of the classification should not be overestimated. Further, some countries escape easy
definition. For instance, Italy possesses features reminiscent of both the Conservative and the Southern
European cluster, and Malta has a hybrid welfare model (therefore omitted from Table A2.1).58
Welfare Regimes and Health InequalitiesAlthough health inequalities exist across all welfare regimes, they do so to different extents and vary
by health outcomes. For instance, in 2006, cross-national inequalities in average life expectancy were
lowest for men in Nordic welfare regimes, followed by the Conservative and Southern European
regimes. Yet, amongst women, inequalities in mortality were smaller in both Southern European and
Conservative clusters relative to Nordic populations. For both genders, however, Eastern European
countries exhibited the highest inequalities in health.59
The fact that Nordic countries—with the most generous welfare regimes and a high overall population
health—do not have the smallest health inequalities has given rise to the so-called Nordic public health
puzzle, described in Box A2.1.
Health Inequalities in Europe: Setting the Stage for Progressive Policy Action
32
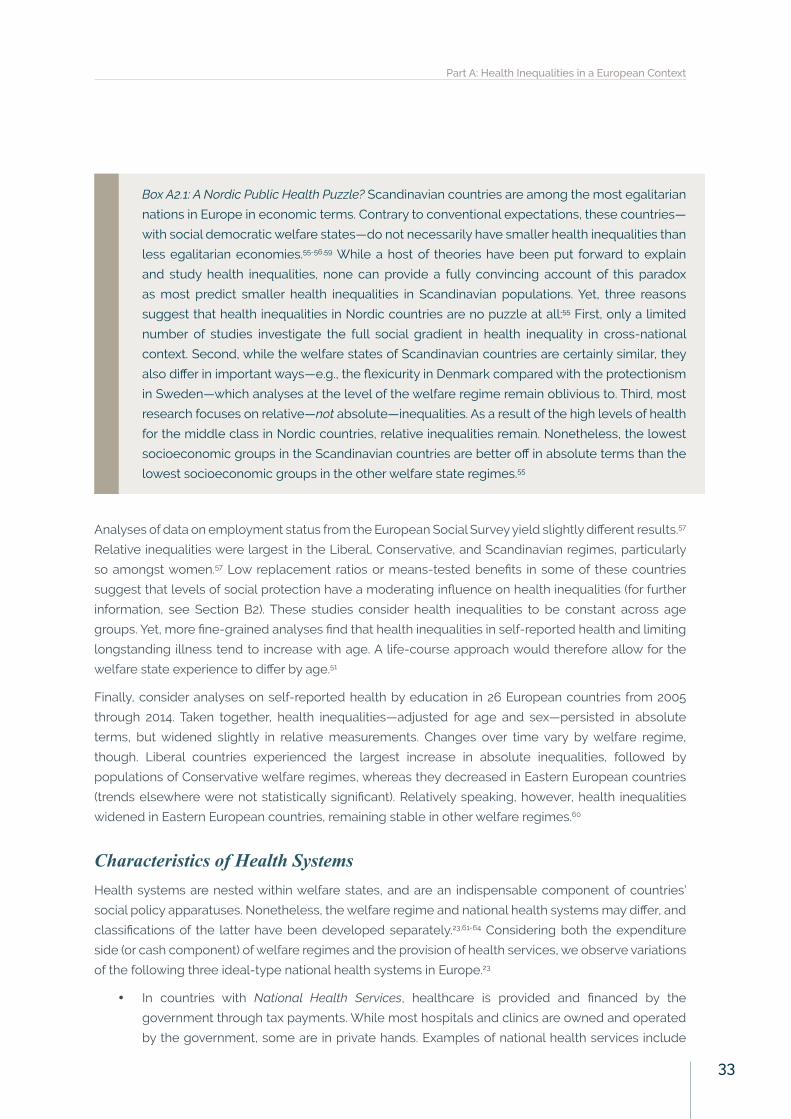
Box A2.1: A Nordic Public Health Puzzle? Scandinavian countries are among the most egalitarian
nations in Europe in economic terms. Contrary to conventional expectations, these countries—
with social democratic welfare states—do not necessarily have smaller health inequalities than
less egalitarian economies.55-56,59 While a host of theories have been put forward to explain
and study health inequalities, none can provide a fully convincing account of this paradox
as most predict smaller health inequalities in Scandinavian populations. Yet, three reasons
suggest that health inequalities in Nordic countries are no puzzle at all:55 First, only a limited
number of studies investigate the full social gradient in health inequality in cross-national
context. Second, while the welfare states of Scandinavian countries are certainly similar, they
also differ in important ways—e.g., the flexicurity in Denmark compared with the protectionism
in Sweden—which analyses at the level of the welfare regime remain oblivious to. Third, most
research focuses on relative—not absolute—inequalities. As a result of the high levels of health
for the middle class in Nordic countries, relative inequalities remain. Nonetheless, the lowest
socioeconomic groups in the Scandinavian countries are better off in absolute terms than the
lowest socioeconomic groups in the other welfare state regimes.55
Analyses of data on employment status from the European Social Survey yield slightly different results.57
Relative inequalities were largest in the Liberal, Conservative, and Scandinavian regimes, particularly
so amongst women.57 Low replacement ratios or means-tested benefits in some of these countries
suggest that levels of social protection have a moderating influence on health inequalities (for further
information, see Section B2). These studies consider health inequalities to be constant across age
groups. Yet, more fine-grained analyses find that health inequalities in self-reported health and limiting
longstanding illness tend to increase with age. A life-course approach would therefore allow for the
welfare state experience to differ by age.51
Finally, consider analyses on self-reported health by education in 26 European countries from 2005
through 2014. Taken together, health inequalities—adjusted for age and sex—persisted in absolute
terms, but widened slightly in relative measurements. Changes over time vary by welfare regime,
though. Liberal countries experienced the largest increase in absolute inequalities, followed by
populations of Conservative welfare regimes, whereas they decreased in Eastern European countries
(trends elsewhere were not statistically significant). Relatively speaking, however, health inequalities
widened in Eastern European countries, remaining stable in other welfare regimes.60
Characteristics of Health SystemsHealth systems are nested within welfare states, and are an indispensable component of countries’
social policy apparatuses. Nonetheless, the welfare regime and national health systems may differ, and
classifications of the latter have been developed separately.23,61-64 Considering both the expenditure
side (or cash component) of welfare regimes and the provision of health services, we observe variations
of the following three ideal-type national health systems in Europe.23
• In countries with National Health Services, healthcare is provided and financed by the
government through tax payments. While most hospitals and clinics are owned and operated
by the government, some are in private hands. Examples of national health services include
Part A: Health Inequalities in a European Context
33
the UK, Ireland, or the Nordic states. Other countries—such as Spain or Italy—follow a similar,
but more decentralised model. That is, the governance, responsibility, and financing of health
services may be organised at sub-national level.
• In countries with Social Health Insurance-based models, healthcare is financed largely
through employment contributions. Such model is, amongst others, present in Germany, the
Netherlands, France, or Croatia.
• Market-based national health systems place the greatest emphasis on the role of the private
sector, with high shares of out-of-pocket (OOP) health expenditure and private health insurance.
That is, the scope of state-financed health services is limited. While no European country fits
the description of this model, Greece comes closest—even though the Greek health system
also combines elements of the other two ideal types and is in the process of extensive reforms.
Note that the characteristics of health systems sometimes diverge from the wider welfare state regime:
For example, with the National Health Service (NHS), the UK has a publicly funded health system
although its welfare state regime is liberal (with relatively modest state-provision of welfare services,
as discussed above).24
Selected Country ExperiencesTo offer some further nuance on country experiences, we focus on three key elements of national
health systems—the organisation and governance of health systems; financing; and health coverage—
in selected European countries. To what extent these features may contribute to health inequalities is
discussed in detail in Section B1.
The liberalising NHS of the UK: Since devolving responsibility for organising health financing and
services in 1997 to its four constituent countries, all health systems in the UK have maintained national
health services—with market forces playing the greatest role in the English health system. Throughout
the UK (except in Northern Ireland) there is a division between healthcare (provided by the NHS) and
social care, which is funded through local government and mostly provided privately. The health system
is primarily funded through general taxation, with the remainder coming from private medical insurance
and OOP payments. In principle, the NHS provides universal access to a comprehensive package of
services that are mostly free at the point of use. However, coverage for specific services varies across
the UK. For instance, some services involve cost-sharing—e.g., in dental care or prescription charges
for pharmaceuticals.65-66 Over the last 25 years, the role of the market and private service providers has
particularly increased in the English NHS.67
Germany’s Bismarckian heritage: The German health system follows a traditional Bismarckian model
where all insured persons contribute a percentage of their income. In turn, this entitles them to access
health services—irrespective of their socioeconomic position. Since 2009, all citizens and permanent
residents have health insurance. Employees and other groups (e.g., pensioners or students) earning
less than €57,600 (2017), and their non-earning dependents have mandatory statutory health insurance
(SHI). Individuals with a gross income above the threshold or self-employed can purchase substitutive
private health insurance. One key element in the German health system is the sharing of decision-
making powers between the federal government, the federal states, and civil society organisations.
The former two traditionally delegate powers to membership-based (with mandatory participation),
self-regulated organisations of payers and providers. As of 2017, 113 competing, not-for-profit, self-
governing sickness funds provide statutory health insurance. Health expenditure per capita is relatively
high but expenditure growth since the early 2000s has been modest despite a growing number of
Health Inequalities in Europe: Setting the Stage for Progressive Policy Action
34
services provided both in hospital and ambulatory care, an indication of technical efficiency. In sum,
the German health system has a comparatively generous benefit basket, one of the highest levels of
resources internationally as well as relatively low levels of cost-sharing.68-70
Denmark and the Nordic model: The Danish health system can be characterised as fairly decentralised,
with responsibility for primary and secondary care set at local levels—regions and municipalities.
Denmark’s health system is financed through general taxation. Both in per capita terms and as a share
of GDP, Denmark spent a higher amount on healthcare than the EU average in 2015. Further, public
expenditure comprised 84 percent of total health expenditure—among the highest share in the EU.
True to the Nordic welfare family, the Danish health system provides universal access to services. All
Danish residents are entitled to publicly funded healthcare, which is predominantly free of charge at
the point of use. For irregular migrants and visitors, a voluntary, privately funded initiative also provides
access. Nonetheless, the country exhibits considerable social gradients in healthcare access and
utilisation of some services. These inequalities are particularly pronounced in the case of smoking and
obesity, which in part can be attributed to the unequal utilisation of preventive services. Further, the
rise of voluntary health insurance has increased inequalities in terms of access for health services and
potentially even procedures, such as surgery for hip and knee operations.37,71
Spain’s familial welfare regime: The Spanish National Health System (known as the Sistema Nacional de
Salud, NHS) is funded from taxes and predominantly operates through its public network of providers.
Health competences were devolved to the regional level as from the end of 2002, resulting in 17
regional health ministries with primary jurisdiction over the organisation and delivery of health services
within their territory. Health expenditure in Spain lags the EU average. Further, due to co-payments for
prescribed medicines, dental care, and optical care, OOP expenditure has increased from 20 percent
in 2009 to 24 percent in 2015—substantially greater than the 15 percent EU average. Thus, even though
the statutory health system is universal in terms of coverage and provision is free of charge at the point
of delivery—numerous exceptions endanger health equity.72-73
Eastern-European healthcare in Poland: In 2003-2004, Poland—the largest country in Central and
Eastern Europe—created the National Health Fund (Narodowy Fundusz Zdrowia), which is the sole payer
in the system and in charge of healthcare financing and contracts with public and non-public healthcare
providers. Local governments at the regional, county, and municipal levels are involved in health to a
varying degree—e.g., ensuring the availability of health services or engaging in health promotion and
prevention. The share of GDP devoted to health in Poland increased from 5.3 percent in 2000 to 6.3
percent in 2015, but remains well below the EU average of 9.9 percent. In addition, only 70 percent of
total health expenditure in 2015 was from public sources. Conversely, OOP expenditure was high—in
part due to financial shortages, lack of standards, and informal payments from households—thereby
resulting in private regressive financing. A further challenge to health equity is the unequal coverage
of the health insurance. Compulsory health insurance covers 91 percent of the population, although
automatic entitlement is extended to several other population groups (e.g., children, people with HIV
and tuberculosis, people with mental health disorders). The 9 percent of the population not covered is
mainly the result of casual or atypical work contracts.74-75
The information on welfare regimes and health systems presented suggests that there are many
common features across the healthcare landscape of Europe. Thus, welfare regimes are a useful
starting point to examine inequalities in health. At the same time, substantial differences exist both
within and across identified clusters or types of health systems.
Part A: Health Inequalities in a European Context
35

36
Health Inequalities in Europe: Setting the Stage for Progressive Policy Action

Part B: The Determinants
of Health Inequalities
37
Part B: The Determinants of Health InequalitiesIn Part B, we investigate the determinants of health inequalities in Europe in more detail. According to the
conceptual framework discussed in the Introduction (Figure 1.2), we examine the following elements:
• Section B1 reviews the performance of national health systems—a key part of social and health
policy. Specifically, we present comparative evidence on their financing and coverage, access
and utilisation of health services, and the resilience of health systems to crisis.
• Section B2 takes a broader perspective, and focuses on two realms of economic policy in the
context of health inequalities: labour market deregulation and fiscal policy.
• Section B3 investigates the social determinants of health, whose effect on health inequalities is
mediated by economic policy. While these conditions cover the entire life course of individuals,
this report emphasises the role of education, employment and work conditions, and income—
three areas of greatest importance to policymakers.
In practice, it is often difficult to attribute health inequalities to any determinant in particular since
these policies and conditions are simultaneously at play. Yet, for analytical purposes, we discuss health
systems, economic policy, and the social determinants of health inequalities separately.
B1. The Role of Health SystemsFinancing and Coverage of Health SystemsFirst, consider the financing of national health systems for healthcare provision—approximated by
total health expenditure per capita—and its relation to amenable mortality—the number of premature
deaths that could have been avoided through timely and effective healthcare. The former indicates
the actual resources invested in healthcare, and the latter is a widely used indicator to measure the
effectiveness of health systems both within and between countries.22,63 Panel A in Figure B1.1 depicts
total health expenditure per capita (adjusted for purchasing power) against total all-cause amenable
mortality.7,76 Reminiscent of the Preston Curve discussed earlier (Section A1), countries with higher total
health expenditure per capita tend to have lower levels of amenable mortality. In Eastern European
countries, amenable mortality in 2015 is above the EU average, and in these countries, an increase in
per capita health expenditure is associated with improved health outcomes. For Western European
countries with higher levels of spending, such relationship does not hold.
In this context, disaggregating amenable mortality by gender is a measure of within-country health
inequality. Across all countries, amenable all-cause mortality per 100,000 inhabitants is substantially
higher among men than women—as shown in Panel B in Figure B1.1. Yet, the extent of this gender gap
varies considerably. For instance, age-standardised mortality of men exceeds that of women by 18
percent in the Netherlands (98.0 vs. 83.4), the smallest gap in the EU, whereas the respective statistic
is 141 percent in Lithuania (497.1 vs. 206.1), the largest inequality. That is, even if there had been optimal
quality healthcare in place, the number of deaths amongst men in Lithuania per 100,000 inhabitants
Health Inequalities in Europe: Setting the Stage for Progressive Policy Action
38
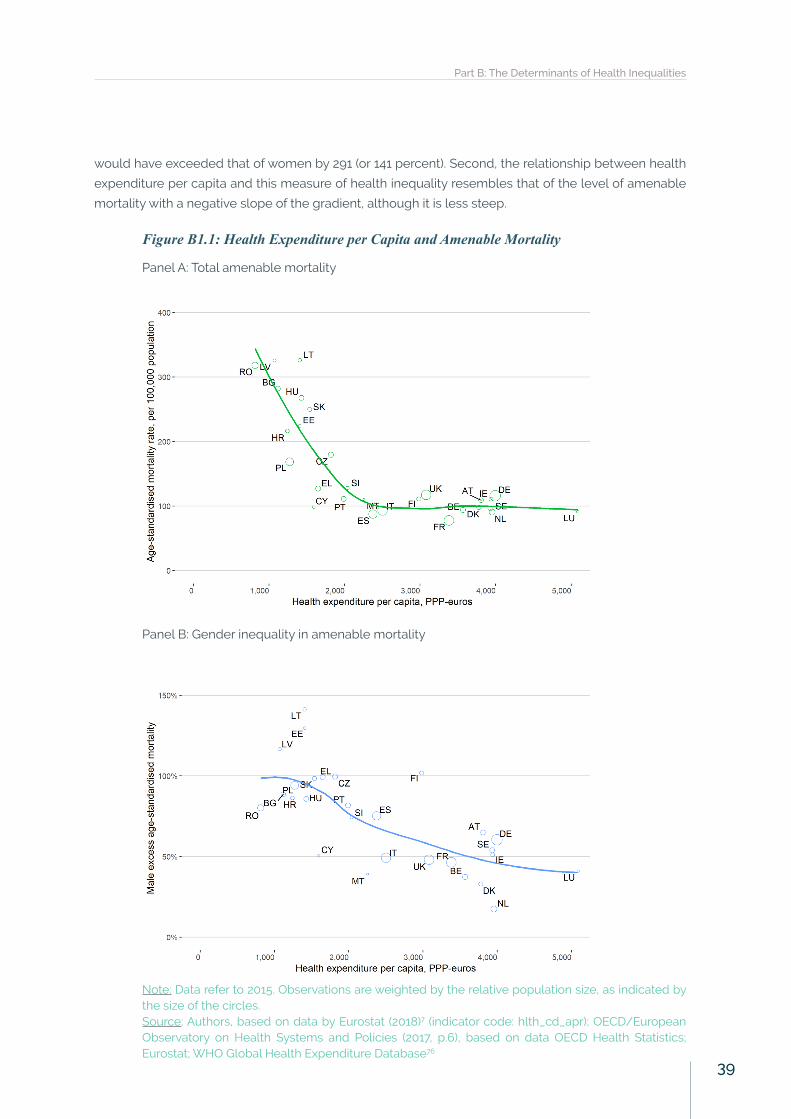
would have exceeded that of women by 291 (or 141 percent). Second, the relationship between health
expenditure per capita and this measure of health inequality resembles that of the level of amenable
mortality with a negative slope of the gradient, although it is less steep.
Figure B1.1: Health Expenditure per Capita and Amenable Mortality
Panel A: Total amenable mortality
Panel B: Gender inequality in amenable mortality
Note: Data refer to 2015. Observations are weighted by the relative population size, as indicated by the size of the circles.Source: Authors, based on data by Eurostat (2018)7 (indicator code: hlth_cd_apr); OECD/European Observatory on Health Systems and Policies (2017, p.6), based on data OECD Health Statistics; Eurostat; WHO Global Health Expenditure Database76
Part B: The Determinants of Health Inequalities
39
While a good first approximation of the effectiveness of health expenditure, the bivariate relationship
depicted omits many important variables. That is, countries with higher health expenditure per capita
may have lower amenable mortality and inequalities due to other factors, such as utilisation of health
services or the exposure to risk factors. In addition, total health expenditure per capita masks who is
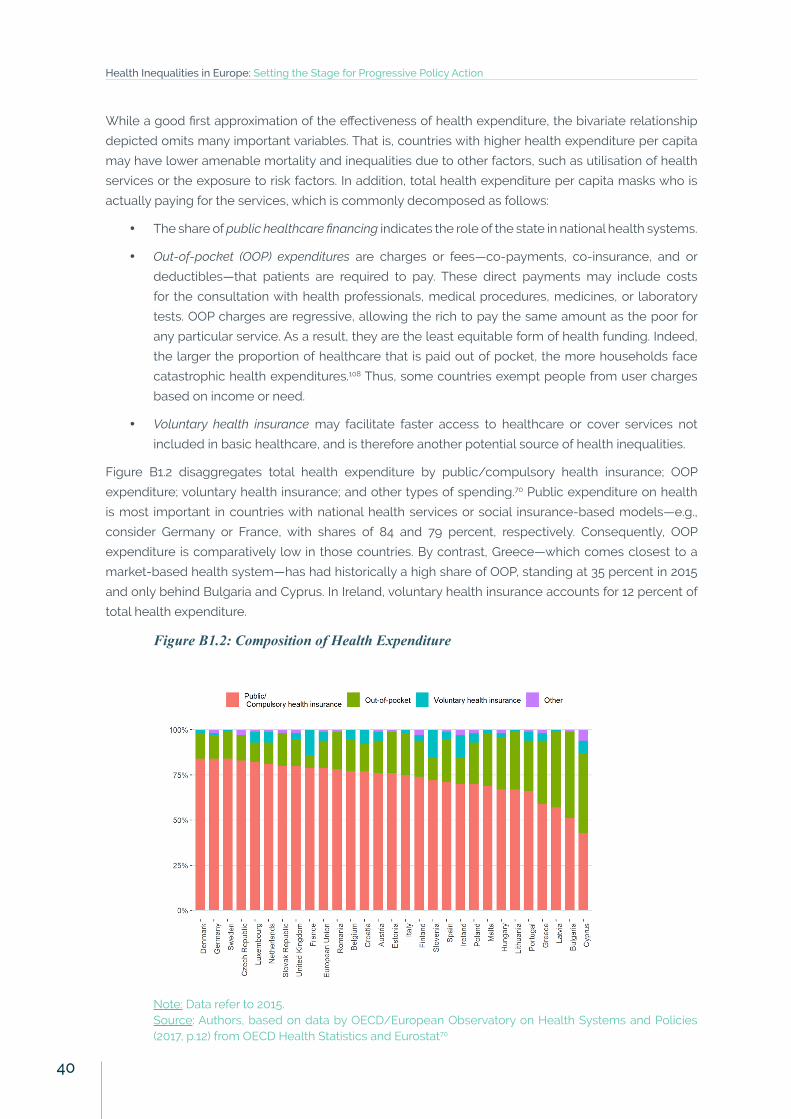
actually paying for the services, which is commonly decomposed as follows:
• The share of public healthcare financing indicates the role of the state in national health systems.
• Out-of-pocket (OOP) expenditures are charges or fees—co-payments, co-insurance, and or
deductibles—that patients are required to pay. These direct payments may include costs
for the consultation with health professionals, medical procedures, medicines, or laboratory
tests. OOP charges are regressive, allowing the rich to pay the same amount as the poor for
any particular service. As a result, they are the least equitable form of health funding. Indeed,
the larger the proportion of healthcare that is paid out of pocket, the more households face
catastrophic health expenditures.108 Thus, some countries exempt people from user charges
based on income or need.
• Voluntary health insurance may facilitate faster access to healthcare or cover services not
included in basic healthcare, and is therefore another potential source of health inequalities.
Figure B1.2 disaggregates total health expenditure by public/compulsory health insurance; OOP
expenditure; voluntary health insurance; and other types of spending.70 Public expenditure on health
is most important in countries with national health services or social insurance-based models—e.g.,
consider Germany or France, with shares of 84 and 79 percent, respectively. Consequently, OOP
expenditure is comparatively low in those countries. By contrast, Greece—which comes closest to a
market-based health system—has had historically a high share of OOP, standing at 35 percent in 2015
and only behind Bulgaria and Cyprus. In Ireland, voluntary health insurance accounts for 12 percent of
total health expenditure.
Figure B1.2: Composition of Health Expenditure
Note: Data refer to 2015.Source: Authors, based on data by OECD/European Observatory on Health Systems and Policies (2017, p.12) from OECD Health Statistics and Eurostat70
Health Inequalities in Europe: Setting the Stage for Progressive Policy Action
40
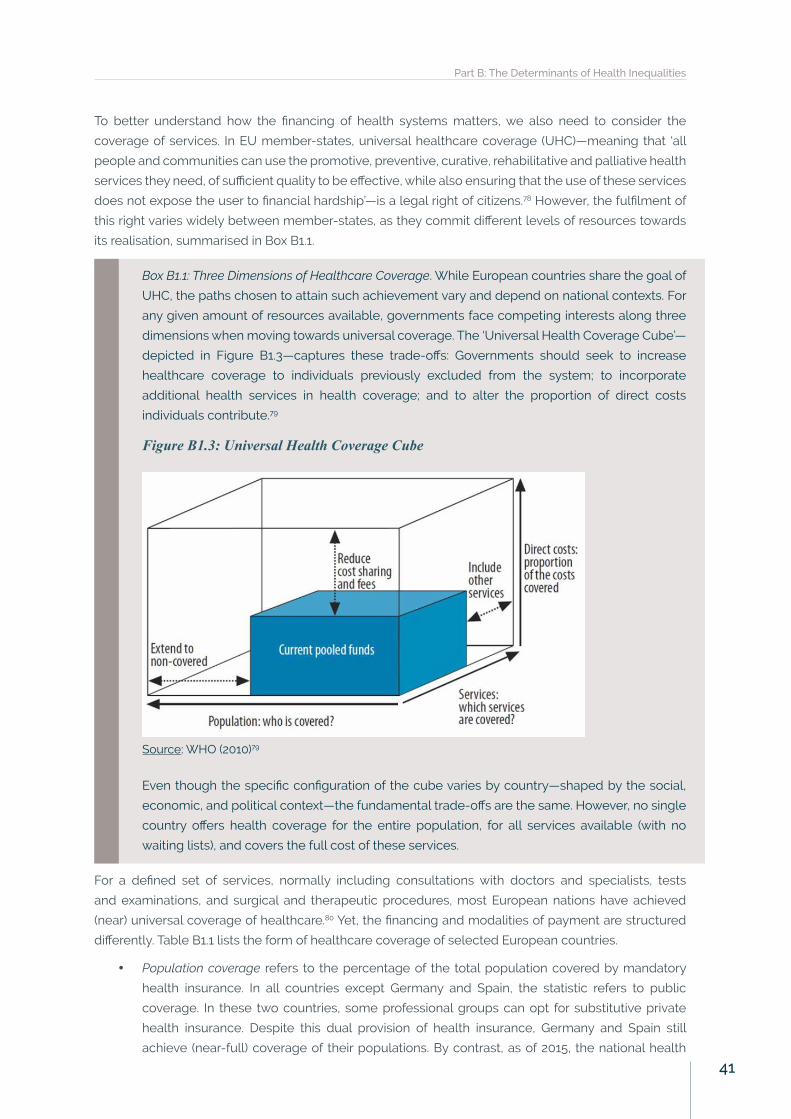
To better understand how the financing of health systems matters, we also need to consider the
coverage of services. In EU member-states, universal healthcare coverage (UHC)—meaning that ‘all
people and communities can use the promotive, preventive, curative, rehabilitative and palliative health
services they need, of sufficient quality to be effective, while also ensuring that the use of these services
does not expose the user to financial hardship’—is a legal right of citizens.78 However, the fulfilment of
this right varies widely between member-states, as they commit different levels of resources towards
its realisation, summarised in Box B1.1.
Box B1.1: Three Dimensions of Healthcare Coverage. While European countries share the goal of
UHC, the paths chosen to attain such achievement vary and depend on national contexts. For
any given amount of resources available, governments face competing interests along three
dimensions when moving towards universal coverage. The ‘Universal Health Coverage Cube’—
depicted in Figure B1.3—captures these trade-offs: Governments should seek to increase
healthcare coverage to individuals previously excluded from the system; to incorporate
additional health services in health coverage; and to alter the proportion of direct costs
individuals contribute.79
Figure B1.3: Universal Health Coverage Cube
Source: WHO (2010)79
Even though the specific configuration of the cube varies by country—shaped by the social,
economic, and political context—the fundamental trade-offs are the same. However, no single
country offers health coverage for the entire population, for all services available (with no
waiting lists), and covers the full cost of these services.
For a defined set of services, normally including consultations with doctors and specialists, tests
and examinations, and surgical and therapeutic procedures, most European nations have achieved
(near) universal coverage of healthcare.80 Yet, the financing and modalities of payment are structured
differently. Table B1.1 lists the form of healthcare coverage of selected European countries.
• Population coverage refers to the percentage of the total population covered by mandatory
health insurance. In all countries except Germany and Spain, the statistic refers to public
coverage. In these two countries, some professional groups can opt for substitutive private
health insurance. Despite this dual provision of health insurance, Germany and Spain still
achieve (near-full) coverage of their populations. By contrast, as of 2015, the national health
Part B: The Determinants of Health Inequalities
41
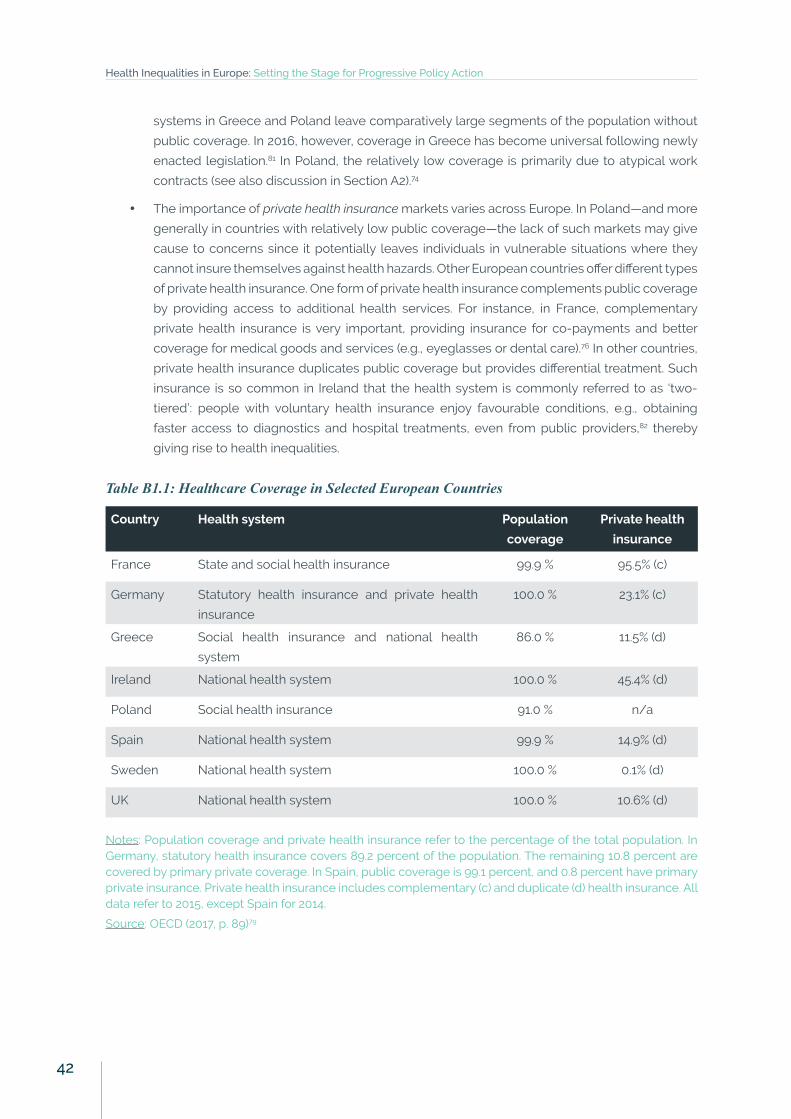
systems in Greece and Poland leave comparatively large segments of the population without
public coverage. In 2016, however, coverage in Greece has become universal following newly
enacted legislation.81 In Poland, the relatively low coverage is primarily due to atypical work
contracts (see also discussion in Section A2).74
• The importance of private health insurance markets varies across Europe. In Poland—and more
generally in countries with relatively low public coverage—the lack of such markets may give
cause to concerns since it potentially leaves individuals in vulnerable situations where they
cannot insure themselves against health hazards. Other European countries offer different types
of private health insurance. One form of private health insurance complements public coverage
by providing access to additional health services. For instance, in France, complementary
private health insurance is very important, providing insurance for co-payments and better
coverage for medical goods and services (e.g., eyeglasses or dental care).76 In other countries,
private health insurance duplicates public coverage but provides differential treatment. Such
insurance is so common in Ireland that the health system is commonly referred to as ‘two-
tiered’: people with voluntary health insurance enjoy favourable conditions, e.g., obtaining
faster access to diagnostics and hospital treatments, even from public providers,82 thereby
giving rise to health inequalities.
Table B1.1: Healthcare Coverage in Selected European Countries
Country Health system Population
coverage
Private health
insurance
France State and social health insurance 99.9 % 95.5% (c)
Germany Statutory health insurance and private health
insurance
100.0 % 23.1% (c)
Greece Social health insurance and national health
system
86.0 % 11.5% (d)
Ireland National health system 100.0 % 45.4% (d)
Poland Social health insurance 91.0 % n/a
Spain National health system 99.9 % 14.9% (d)
Sweden National health system 100.0 % 0.1% (d)
UK National health system 100.0 % 10.6% (d)
Notes: Population coverage and private health insurance refer to the percentage of the total population. In Germany, statutory health insurance covers 89.2 percent of the population. The remaining 10.8 percent are covered by primary private coverage. In Spain, public coverage is 99.1 percent, and 0.8 percent have primary private insurance. Private health insurance includes complementary (c) and duplicate (d) health insurance. All data refer to 2015, except Spain for 2014.
Source: OECD (2017, p. 89)79
Health Inequalities in Europe: Setting the Stage for Progressive Policy Action
42
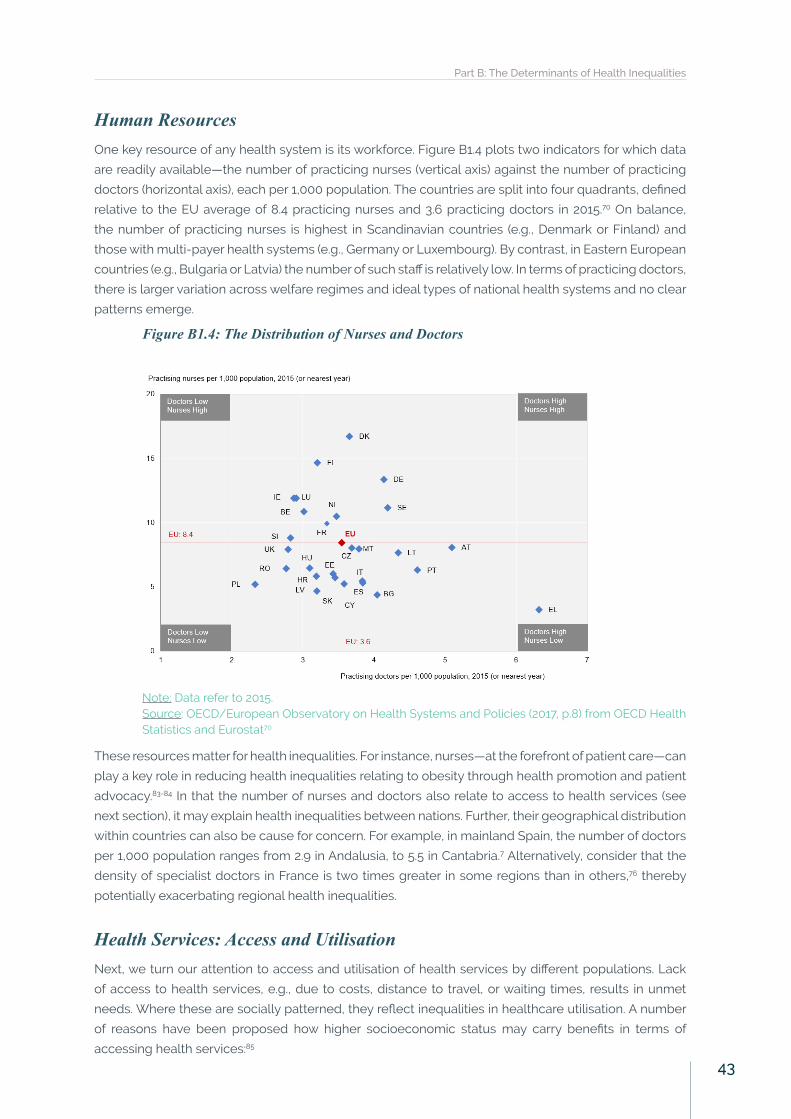
Human ResourcesOne key resource of any health system is its workforce. Figure B1.4 plots two indicators for which data
are readily available—the number of practicing nurses (vertical axis) against the number of practicing
doctors (horizontal axis), each per 1,000 population. The countries are split into four quadrants, defined
relative to the EU average of 8.4 practicing nurses and 3.6 practicing doctors in 2015.70 On balance,
the number of practicing nurses is highest in Scandinavian countries (e.g., Denmark or Finland) and
those with multi-payer health systems (e.g., Germany or Luxembourg). By contrast, in Eastern European
countries (e.g., Bulgaria or Latvia) the number of such staff is relatively low. In terms of practicing doctors,
there is larger variation across welfare regimes and ideal types of national health systems and no clear
patterns emerge.
Figure B1.4: The Distribution of Nurses and Doctors
Note: Data refer to 2015.Source: OECD/European Observatory on Health Systems and Policies (2017, p.8) from OECD Health Statistics and Eurostat70
These resources matter for health inequalities. For instance, nurses—at the forefront of patient care—can
play a key role in reducing health inequalities relating to obesity through health promotion and patient
advocacy.83-84 In that the number of nurses and doctors also relate to access to health services (see
next section), it may explain health inequalities between nations. Further, their geographical distribution
within countries can also be cause for concern. For example, in mainland Spain, the number of doctors
per 1,000 population ranges from 2.9 in Andalusia, to 5.5 in Cantabria.7 Alternatively, consider that the
density of specialist doctors in France is two times greater in some regions than in others,76 thereby
potentially exacerbating regional health inequalities.
Health Services: Access and UtilisationNext, we turn our attention to access and utilisation of health services by different populations. Lack
of access to health services, e.g., due to costs, distance to travel, or waiting times, results in unmet
needs. Where these are socially patterned, they reflect inequalities in healthcare utilisation. A number
of reasons have been proposed how higher socioeconomic status may carry benefits in terms of
accessing health services:85
Part B: The Determinants of Health Inequalities
43
• Across Europe, individuals are more likely to perceive barriers to accessing healthcare in
countries with higher shares of OOP expenditure,86 thereby illustrating the importance of
personal income and wealth.
• Since education is closely related to health literacy (see Section A1), people in higher
socioeconomic positions are better able to navigate through the health system and access
services when needed.
• Power and prestige may facilitate access to health services as health practitioners may perceive
these individuals to deserve a better treatment.87
• Social support and personal networks mean that individuals have family, acquaintances, co-
workers, or even health personnel to seek help and advice from, which facilitates navigating
through complex national health systems.85, 87
These resources are socially patterned and, in many cases, people in vulnerable situations—e.g., being
unemployed or lacking citizenship—are unable to access healthcare. Recent reforms in Spain illustrate
both how policy interventions can exacerbate or alleviate the conditions of migrants. In 2012, Spanish
legislation excluded non-registered migrants from full public coverage when eligibility criteria of the
health service changed from universal entitlement based on residency to social insurance entitlement
(although exceptions remained, e.g., for expecting mothers or emergency care).73,88 Subsequent
analyses suggest that this measure severely impacted migrant populations. Thus, it is welcome news
that the government which came to power in June 2016 announced it would rescind the Royal Decree,
reversing previous policy reforms with deleterious health effects.89 For a broader discussion on the
health risks migrant populations face, see Box B1.2. In addition to migrant populations, we consider
ethnic minorities. Yet, (cross-national) research of health inequalities and health system access by
ethnicity is in its infancy in European countries. This points towards a more general problem regarding
populations in vulnerable situations and minorities: They may be too small to be meaningfully captured
by official statistics, thereby potentially escaping the attention of scholars and policymakers. One
relatively well-documented exception are Roma populations—which we discuss in Box B1.3.
Health Inequalities in Europe: Setting the Stage for Progressive Policy Action
44
Box B1.2: Vulnerable Populations: Migrants’ Health. Migrant populations in Europe appear
disproportionately at risk of certain infectious diseases, and economic crises and subsequent
responses have tended to exacerbate such risks.90 A recent project on migrant health in Greece
finds that most migrant groups were less likely to report non-communicable diseases than
Greeks. By contrast, almost all migrant groups had been subjected to a greater extent to
ergonomic and material hazards (60 to 90 percent) than Greeks (35 to 50 percent).91 These two
observations—that migrants are initially healthier than the host country population and that
they are at higher risk of health hazards—seem to hold across Europe, and these characteristics
change with the number of years individuals live in the host country.92
Yet, difficulties in collecting data on migrant health—e.g., due to different definitions of who
constitutes a migrant, due to political sensibilities around ethnic origin, and for heterogeneity
and small sample size of migrants—still mean that information on migrant health in Europe is
incomplete.93 One exception, a recent study on depression shows that first-generation migrants
show higher levels of depression, with those born outside of Europe particularly so.94 Further
analyses indicate that this is not attributable to ethnic minority status but due to experienced
barriers to socioeconomic integration and processes of discrimination—areas in which current
national migration policies fail. Indeed, research suggests that even where national legislation
guarantees the same rights for migrants as other residents, practice differs. Obstacles to
accessing healthcare may include lack of health literacy, but also the fear of detection due
to information sharing among authorities, or discretion by healthcare staff and organisations.
Local level initiatives, often orchestrated by NGOs, may alleviate these situations.95
Box B1.3: Vulnerable Populations: Health of the Roma Population. Roma people are one of the
largest ethnic minorities in Europe, concentrated in Central Europe and the Balkans. The fact
that the health of the Roma is poorer than that of the majority population has been thoroughly
documented.96-97 More recent work still finds that the health of Roma is worse than that of
non-Roma populations in Hungary,98 Slovakia,99-100 and in Serbia.101 The worse self-reported
health is in part explained by lower levels of education (i.e., limited health literacy) and by
unhealthy behaviour (e.g., smoking and unhealthy diet). Barriers in access to health services
are particularly relevant:100 Survey data suggest that, in 2011, as much as 20 percent of Roma
respondents were not covered by medical insurance or did not know if they were covered.102
Thus, in the ‘EU Framework for National Roma Integration Strategies’ up to 2020, the EU calls on
its member-states to prepare and revise national integration strategies to effectively address
the challenges of Roma inclusion.102 This is especially important since the Roma often share
characteristics that put them in vulnerable situations along several dimensions, e.g., they may
face discrimination not only because of their ethnic origin, but also due to gender, occupational
status, or lack of language skills.103
Since populations in vulnerable situations are not always covered by public health coverage, they
need to pay for health services themselves—once they have overcome barriers such as discrimination
or insufficient health literacy. Cross-national evidence suggests that this may exacerbate inequalities
since the likelihood of reporting unmet needs and out-of-pocket payments as a share of total health
expenditure are positively related.104 In fact, unmet needs for medical care by income groups give rise to
inequalities beyond minorities—as Figure B1.5 shows. For example, the Italian National Health Service
covers all citizens and foreign residents, making the health system universal in terms of population
Part B: The Determinants of Health Inequalities
45
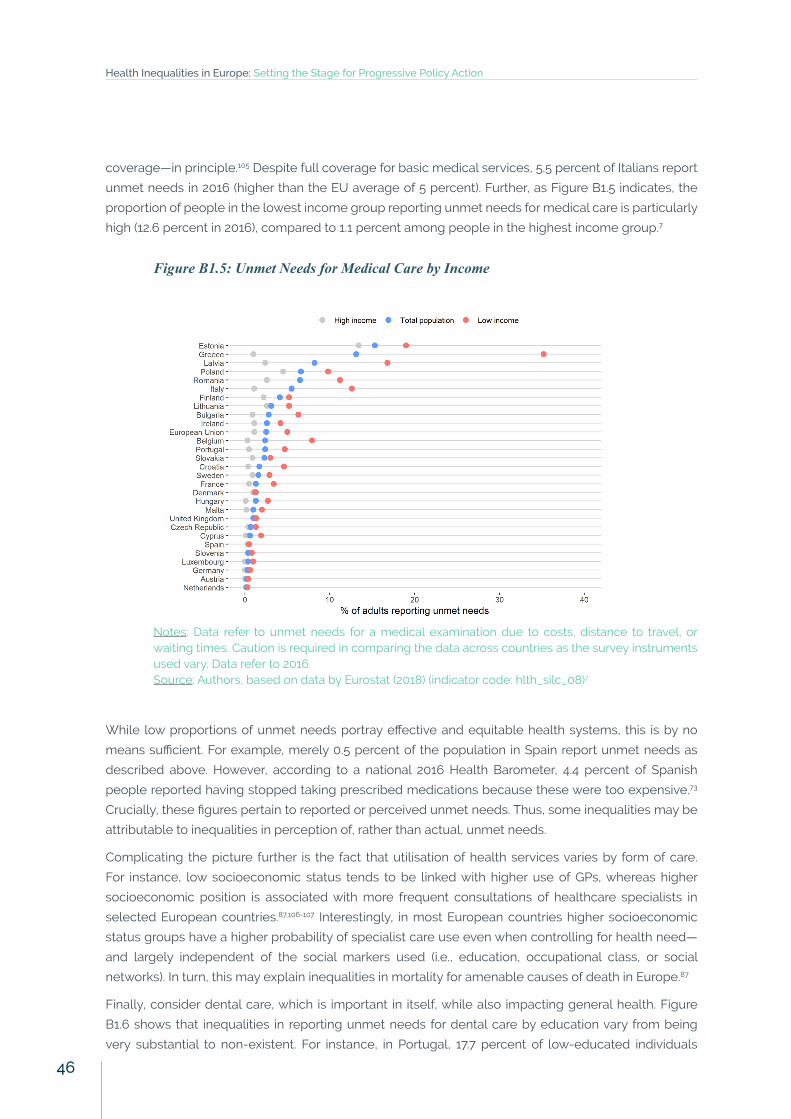
coverage—in principle.105 Despite full coverage for basic medical services, 5.5 percent of Italians report
unmet needs in 2016 (higher than the EU average of 5 percent). Further, as Figure B1.5 indicates, the
proportion of people in the lowest income group reporting unmet needs for medical care is particularly
high (12.6 percent in 2016), compared to 1.1 percent among people in the highest income group.7
Figure B1.5: Unmet Needs for Medical Care by Income
Notes: Data refer to unmet needs for a medical examination due to costs, distance to travel, or waiting times. Caution is required in comparing the data across countries as the survey instruments used vary. Data refer to 2016.Source: Authors, based on data by Eurostat (2018) (indicator code: hlth_silc_08)7
While low proportions of unmet needs portray effective and equitable health systems, this is by no
means sufficient. For example, merely 0.5 percent of the population in Spain report unmet needs as
described above. However, according to a national 2016 Health Barometer, 4.4 percent of Spanish
people reported having stopped taking prescribed medications because these were too expensive.73
Crucially, these figures pertain to reported or perceived unmet needs. Thus, some inequalities may be
attributable to inequalities in perception of, rather than actual, unmet needs.
Complicating the picture further is the fact that utilisation of health services varies by form of care.
For instance, low socioeconomic status tends to be linked with higher use of GPs, whereas higher
socioeconomic position is associated with more frequent consultations of healthcare specialists in
selected European countries.87,106-107 Interestingly, in most European countries higher socioeconomic
status groups have a higher probability of specialist care use even when controlling for health need—
and largely independent of the social markers used (i.e., education, occupational class, or social
networks). In turn, this may explain inequalities in mortality for amenable causes of death in Europe.87
Finally, consider dental care, which is important in itself, while also impacting general health. Figure
B1.6 shows that inequalities in reporting unmet needs for dental care by education vary from being
very substantial to non-existent. For instance, in Portugal, 17.7 percent of low-educated individuals
Health Inequalities in Europe: Setting the Stage for Progressive Policy Action
46
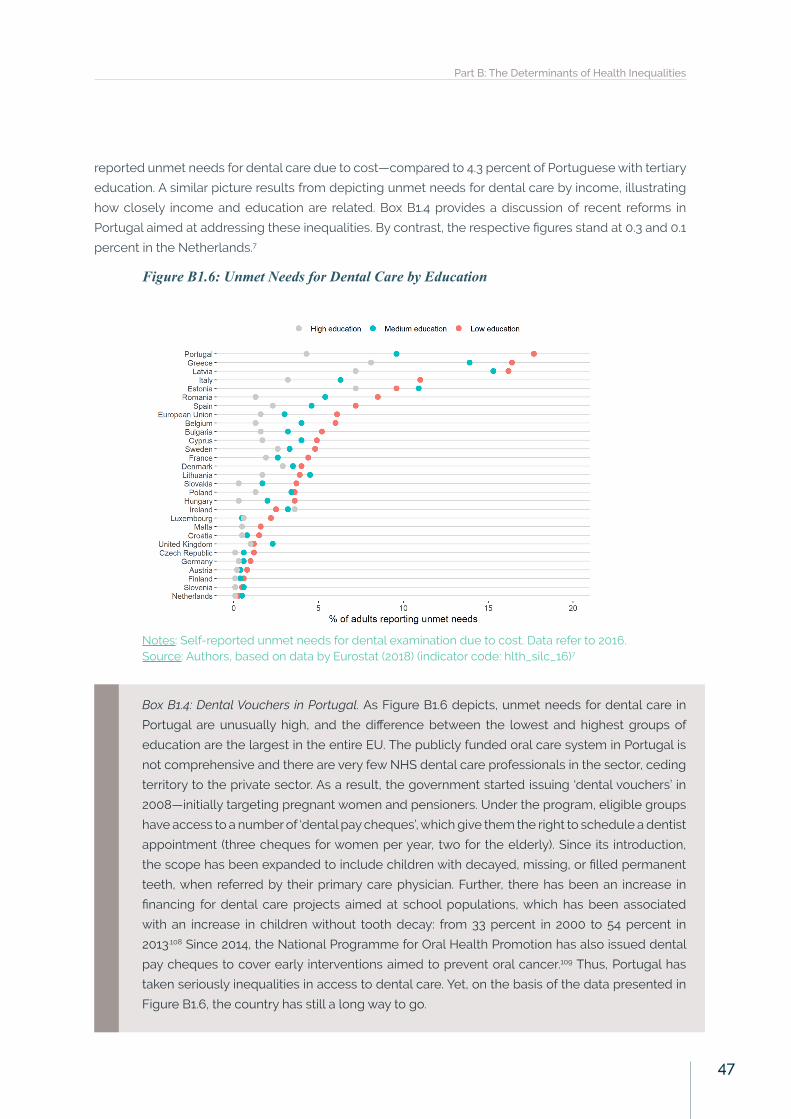
reported unmet needs for dental care due to cost—compared to 4.3 percent of Portuguese with tertiary
education. A similar picture results from depicting unmet needs for dental care by income, illustrating
how closely income and education are related. Box B1.4 provides a discussion of recent reforms in
Portugal aimed at addressing these inequalities. By contrast, the respective figures stand at 0.3 and 0.1
percent in the Netherlands.7
Figure B1.6: Unmet Needs for Dental Care by Education
Notes: Self-reported unmet needs for dental examination due to cost. Data refer to 2016.Source: Authors, based on data by Eurostat (2018) (indicator code: hlth_silc_16)7
Box B1.4: Dental Vouchers in Portugal. As Figure B1.6 depicts, unmet needs for dental care in
Portugal are unusually high, and the difference between the lowest and highest groups of
education are the largest in the entire EU. The publicly funded oral care system in Portugal is
not comprehensive and there are very few NHS dental care professionals in the sector, ceding
territory to the private sector. As a result, the government started issuing ‘dental vouchers’ in
2008—initially targeting pregnant women and pensioners. Under the program, eligible groups
have access to a number of ‘dental pay cheques’, which give them the right to schedule a dentist
appointment (three cheques for women per year, two for the elderly). Since its introduction,
the scope has been expanded to include children with decayed, missing, or filled permanent
teeth, when referred by their primary care physician. Further, there has been an increase in
financing for dental care projects aimed at school populations, which has been associated
with an increase in children without tooth decay: from 33 percent in 2000 to 54 percent in
2013.108 Since 2014, the National Programme for Oral Health Promotion has also issued dental
pay cheques to cover early interventions aimed to prevent oral cancer.109 Thus, Portugal has
taken seriously inequalities in access to dental care. Yet, on the basis of the data presented in
Figure B1.6, the country has still a long way to go.
Part B: The Determinants of Health Inequalities
47
As the case of Portugal suggests, public coverage matters in view of dental care. For instance, analyses
on individuals aged 50 years or older in 11 European countries suggest that—while controlling for
age and chewing ability—educational inequalities in the use of dental care services were higher in
countries where no public dental care cover was provided than in countries where there was some
degree of public coverage,110 thereby indicating a potential role for health systems to address health
inequalities. Further, income inequalities in foregone dental care widened significantly in 13 of 23
European countries over the period of 2008 to 2013, and decreased in only three countries. Adjusted for
countries’ macro-economic situation and severity of the economic crisis, higher dental care coverage
was significantly associated with smaller income inequalities in foregone dental care and less widening
of these inequalities.111 At the same time, oral health inequalities exist in all welfare state regimes, and
they are not smaller in the Scandinavian regime112—see also the discussion of the Nordic Public Health
Puzzle in Box A2.1.
Resilience of Health Systems in the Face of CrisisFollowing the global financial crisis of 2007/8, national health systems in Europe faced heightened
financial strain. Yet, exposure to such pressure was not uniform and countries’ policy responses and
reforms to healthcare varied. Three main types of policy responses to increased pressure on national
health systems are as follows: a) efficiency gains; b) spending cuts and coverage restrictions; or c)
mobilising additional public revenue.113-114 We discuss an example of each case in more detail, looking
at the impact on national health systems and the consequences for health inequalities. In doing so, we
draw attention to both national and international determinants of the post-crisis policy reforms—see
Box B1.5.
Box B1.5: Multilevel Determinants of Post-Crisis Policy Reforms. In the aftermath of the global
financial crisis of 2007/08, national European health systems faced heightened challenges:
As a response to the crisis, several countries reduced public health spending and enacted
‘structural reforms’ that altered eligibility, coverage, or cost of health services. Voluminous
scholarship has examined how these policies affected health systems, and most empirical
strategies have emphasised the immediate impact on service provision. Equally important,
these policy reforms affect health and health systems in the medium and long run.113 In addition,
the catalyst for reforms can be located at different levels. For instance, the EU set a precedent
when the European Commission, the European Central Bank, and the IMF (collectively known
as the Troika) mandated Greece to cap health expenditure in 2012115 and international actors
have thus become a powerful agent of market-oriented reforms.116-117 In other countries, such
as the UK, national politicians were the key actors to promote austerity in the face of the crisis.118
First, consider temporary efficiency gains in Ireland. Following the global financial crisis, the Irish
health system simultaneously faced substantial budget cuts and higher demand for its services. In a
country with no universal coverage for primary care, the use of Medical Cards—providing such basic
health services for eligible individuals—illustrates these reforms. In 2009, eligibility criteria—based on
means-tested income by age groups—were designed to limit access to Medical Cards. Nonetheless,
the number of people holding such a Card has increased by over 40 percent from 2007 to 2016.82
Despite these expenditure cuts and higher demand, the Irish health system temporarily managed to
Health Inequalities in Europe: Setting the Stage for Progressive Policy Action
48
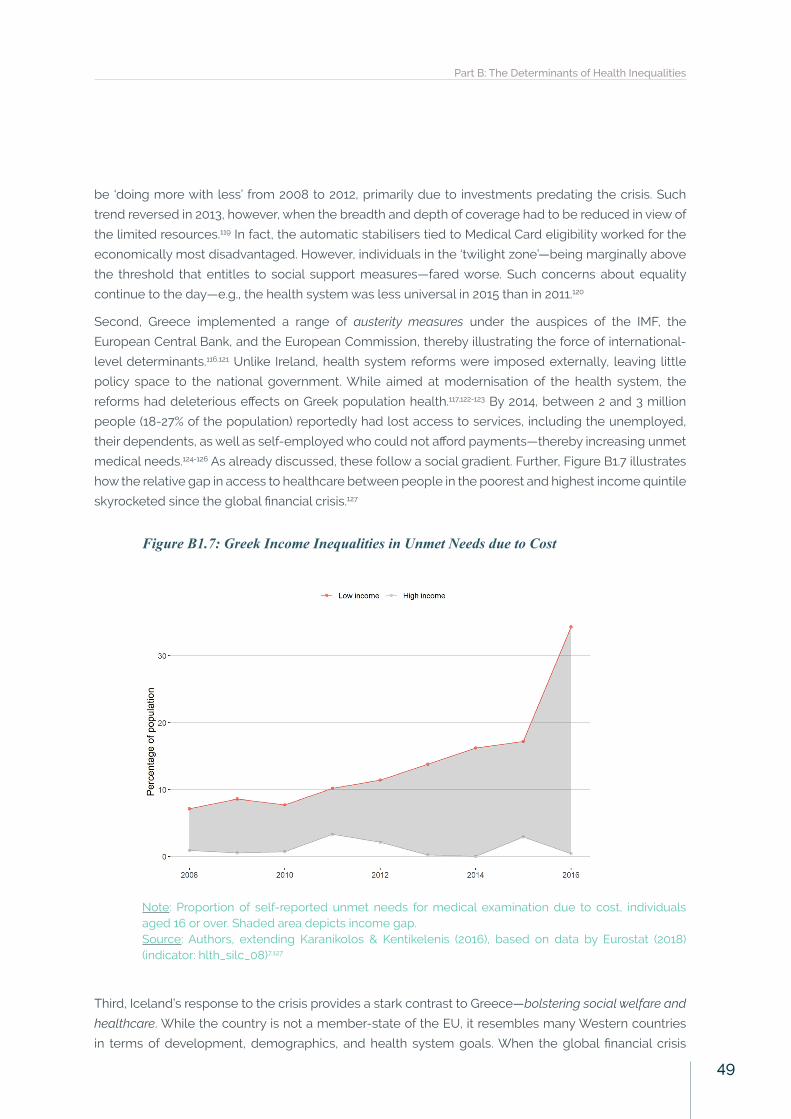
be ‘doing more with less’ from 2008 to 2012, primarily due to investments predating the crisis. Such
trend reversed in 2013, however, when the breadth and depth of coverage had to be reduced in view of
the limited resources.119 In fact, the automatic stabilisers tied to Medical Card eligibility worked for the
economically most disadvantaged. However, individuals in the ‘twilight zone’—being marginally above
the threshold that entitles to social support measures—fared worse. Such concerns about equality
continue to the day—e.g., the health system was less universal in 2015 than in 2011.120
Second, Greece implemented a range of austerity measures under the auspices of the IMF, the
European Central Bank, and the European Commission, thereby illustrating the force of international-
level determinants.116,121 Unlike Ireland, health system reforms were imposed externally, leaving little
policy space to the national government. While aimed at modernisation of the health system, the
reforms had deleterious effects on Greek population health.117,122-123 By 2014, between 2 and 3 million
people (18-27% of the population) reportedly had lost access to services, including the unemployed,
their dependents, as well as self-employed who could not afford payments—thereby increasing unmet
medical needs.124-126 As already discussed, these follow a social gradient. Further, Figure B1.7 illustrates
how the relative gap in access to healthcare between people in the poorest and highest income quintile
skyrocketed since the global financial crisis.127
Figure B1.7: Greek Income Inequalities in Unmet Needs due to Cost
Note: Proportion of self-reported unmet needs for medical examination due to cost, individuals aged 16 or over. Shaded area depicts income gap.Source: Authors, extending Karanikolos & Kentikelenis (2016), based on data by Eurostat (2018) (indicator: hlth_silc_08)7,127
Third, Iceland’s response to the crisis provides a stark contrast to Greece—bolstering social welfare and
healthcare. While the country is not a member-state of the EU, it resembles many Western countries
in terms of development, demographics, and health system goals. When the global financial crisis
Part B: The Determinants of Health Inequalities
49
exposed the unsustainable debt levels of Iceland’s largest banks, the government swiftly nationalised
them. Yet, the Icelandic population rejected to repay such debt in two referenda. Taking the electorate’s
concern seriously, the government bolstered social welfare and the national health system. In turn,
health indicators across the Icelandic population are significantly better than other crisis-struck
European countries—e.g., in terms of depression.3 Further, during the period of crisis, Icelanders
reduced their frequency of smoking, heavy drinking, and consumption of unhealthy fast food, partly
driven by changing prices and lower incomes.128-129
The case of Iceland also illustrates how individuals may adopt different behaviour as a response to the
crisis—independent of changes to health systems. Such adjustments are not always beneficial to health.
For instance, while many governments cut spending on health services, individuals faced additional
challenges due to unemployment and/or financial strain. In particular, access to private healthcare may
have become unaffordable for people experiencing dwindling incomes, potentially leading to longer
waiting times to receive treatment, or being unable to pay for examinations not covered by the public
system.130 Thus, the resilience of health systems in the face of crisis should also integrate individual-
level responses.
In sum, this section has illustrated that institutional arrangements—welfare state regimes and national
health systems—matter for health inequalities. Access and utilisation of health services varies by
socioeconomic status and by subsets of the population. In addition, policy reforms to national health
systems are consequential for inequalities in health.
Health Inequalities in Europe: Setting the Stage for Progressive Policy Action
50
B2. Economic PolicyInstitutional Complementarities and Interdependent Health EffectsNested in welfare regimes, health systems should not be regarded in isolation. As outlined in the
Introduction, the varieties of European capitalism—what we understand as the economic systems
through which societies allocate and distribute resources, and regulate economic activity—also impact
health and social policies. The interdependence of different policy areas is known as institutional
complementarity.131-132 Put differently, the performance of economic policy is conditional upon the
design of social policy, and vice versa. Thus, the different policy elements ‘fit together’ to some degree.
For instance, an ideal type of a social democratic model achieves flexibility in the labour market through
retraining of a highly-skilled and adaptive workforce, rather than through layoffs. In turn, this focus on
abilities and training of the working population requires a high level of social protection and active
labour market policies.131
Institutional complementarities imply that efforts to reform one sphere of the political economy may
yield negative economic results if unaccompanied by parallel reforms in other spheres.132 For instance,
cuts in government expenditure—so-called austerity measures—in the recent financial crisis have
put increased pressure on national health systems on two fronts. On the one hand, austerity itself is
linked to adverse health consequences (see further below), thereby increasing need for healthcare by
affected populations. On the other hand, lower public spending puts financial strain on health systems.
This illustrates how economic and social policies interact, and why the impact of reforms on both of
them should be considered.
We examine two economic policies. First, we discuss labour market policy with a particular focus on
precarious employment—an increasingly common phenomenon in Europe. Further, we look at the
role that unemployment benefits and active labour market policy can play in mitigating the adverse
consequences of insecurity due to highly flexible labour markets. Of course, labour market policies
encompass further elements such as sickness benefits or pension entitlements. By no means less
important, these are beyond the remit of this report due to the limited scope. Second, we discuss fiscal
policy, where we draw attention to the impact of austerity measures on health inequalities. At the same
time, we highlight how fiscal policy that addresses health concerns can better population health.
Unemployment and Labour Market Deregulation as Risk FactorsLabour markets are always and everywhere imperfect. For instance, people might need to work more
hours than they would like, fail to find a job they are qualified for, or adapt to a new environment when
jobs are outsourced. Labour market policy attempts to address these imperfections, and to alleviate any
adverse consequences that may arise from them. In addition, labour market policy reflects normative
and ideological forces, e.g., with regard to the role of the government.133 For instance, the labour market
is most important in countries with social health insurance-based health systems (e.g., Germany), since
the financing, eligibility, and coverage of health services is closely linked to employment contributions.
Where health systems are predominantly tax-based (e.g., Sweden), the employment relationship is less
central to the health system. Nonetheless, labour market policies can have profound consequences on
health inequalities in all countries—both positive and negative.
Part B: The Determinants of Health Inequalities
51
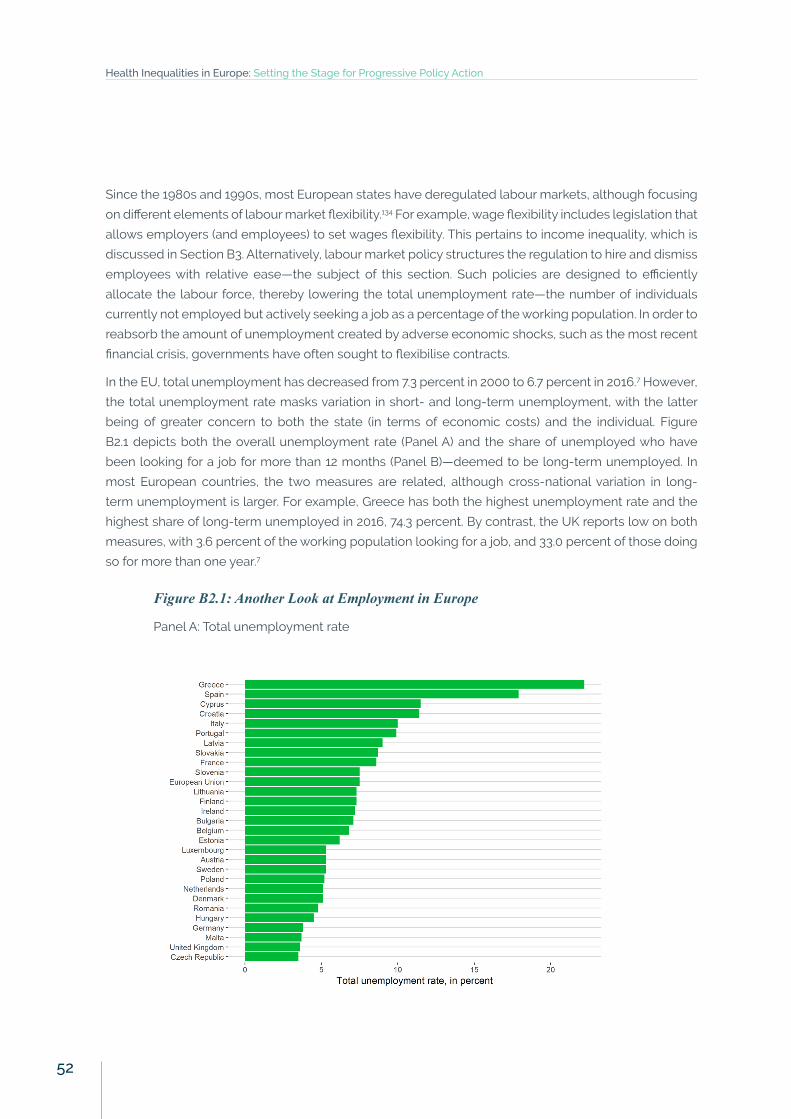
Since the 1980s and 1990s, most European states have deregulated labour markets, although focusing
on different elements of labour market flexibility.134 For example, wage flexibility includes legislation that
allows employers (and employees) to set wages flexibility. This pertains to income inequality, which is
discussed in Section B3. Alternatively, labour market policy structures the regulation to hire and dismiss
employees with relative ease—the subject of this section. Such policies are designed to efficiently
allocate the labour force, thereby lowering the total unemployment rate—the number of individuals
currently not employed but actively seeking a job as a percentage of the working population. In order to
reabsorb the amount of unemployment created by adverse economic shocks, such as the most recent
financial crisis, governments have often sought to flexibilise contracts.
In the EU, total unemployment has decreased from 7.3 percent in 2000 to 6.7 percent in 2016.7 However,
the total unemployment rate masks variation in short- and long-term unemployment, with the latter
being of greater concern to both the state (in terms of economic costs) and the individual. Figure
B2.1 depicts both the overall unemployment rate (Panel A) and the share of unemployed who have
been looking for a job for more than 12 months (Panel B)—deemed to be long-term unemployed. In
most European countries, the two measures are related, although cross-national variation in long-
term unemployment is larger. For example, Greece has both the highest unemployment rate and the
highest share of long-term unemployed in 2016, 74.3 percent. By contrast, the UK reports low on both
measures, with 3.6 percent of the working population looking for a job, and 33.0 percent of those doing
so for more than one year.7
Figure B2.1: Another Look at Employment in Europe
Panel A: Total unemployment rate
Health Inequalities in Europe: Setting the Stage for Progressive Policy Action
52
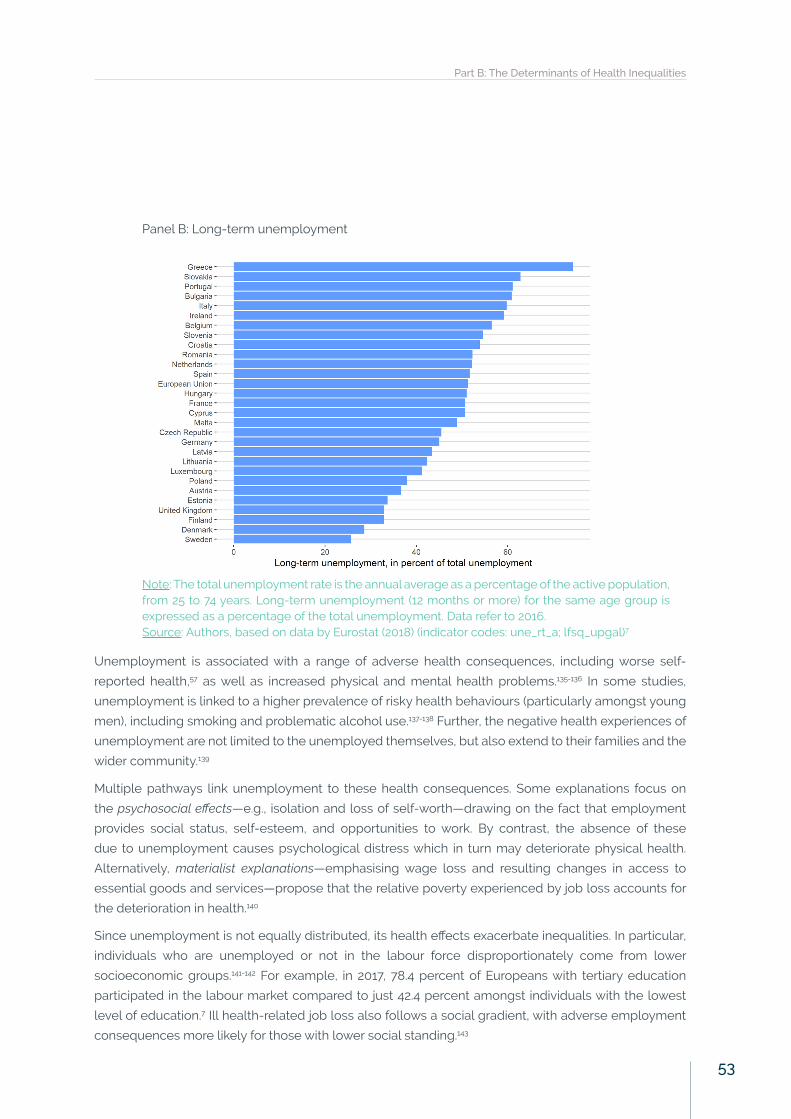
Panel B: Long-term unemployment
Note: The total unemployment rate is the annual average as a percentage of the active population, from 25 to 74 years. Long-term unemployment (12 months or more) for the same age group is expressed as a percentage of the total unemployment. Data refer to 2016.Source: Authors, based on data by Eurostat (2018) (indicator codes: une_rt_a; lfsq_upgal)7
Unemployment is associated with a range of adverse health consequences, including worse self-
reported health,57 as well as increased physical and mental health problems.135-136 In some studies,
unemployment is linked to a higher prevalence of risky health behaviours (particularly amongst young
men), including smoking and problematic alcohol use.137-138 Further, the negative health experiences of
unemployment are not limited to the unemployed themselves, but also extend to their families and the
wider community.139
Multiple pathways link unemployment to these health consequences. Some explanations focus on
the psychosocial effects—e.g., isolation and loss of self-worth—drawing on the fact that employment
provides social status, self-esteem, and opportunities to work. By contrast, the absence of these
due to unemployment causes psychological distress which in turn may deteriorate physical health.
Alternatively, materialist explanations—emphasising wage loss and resulting changes in access to
essential goods and services—propose that the relative poverty experienced by job loss accounts for
the deterioration in health.140
Since unemployment is not equally distributed, its health effects exacerbate inequalities. In particular,
individuals who are unemployed or not in the labour force disproportionately come from lower
socioeconomic groups.141-142 For example, in 2017, 78.4 percent of Europeans with tertiary education
participated in the labour market compared to just 42.4 percent amongst individuals with the lowest
level of education.7 Ill health-related job loss also follows a social gradient, with adverse employment
consequences more likely for those with lower social standing.143
Part B: The Determinants of Health Inequalities
53
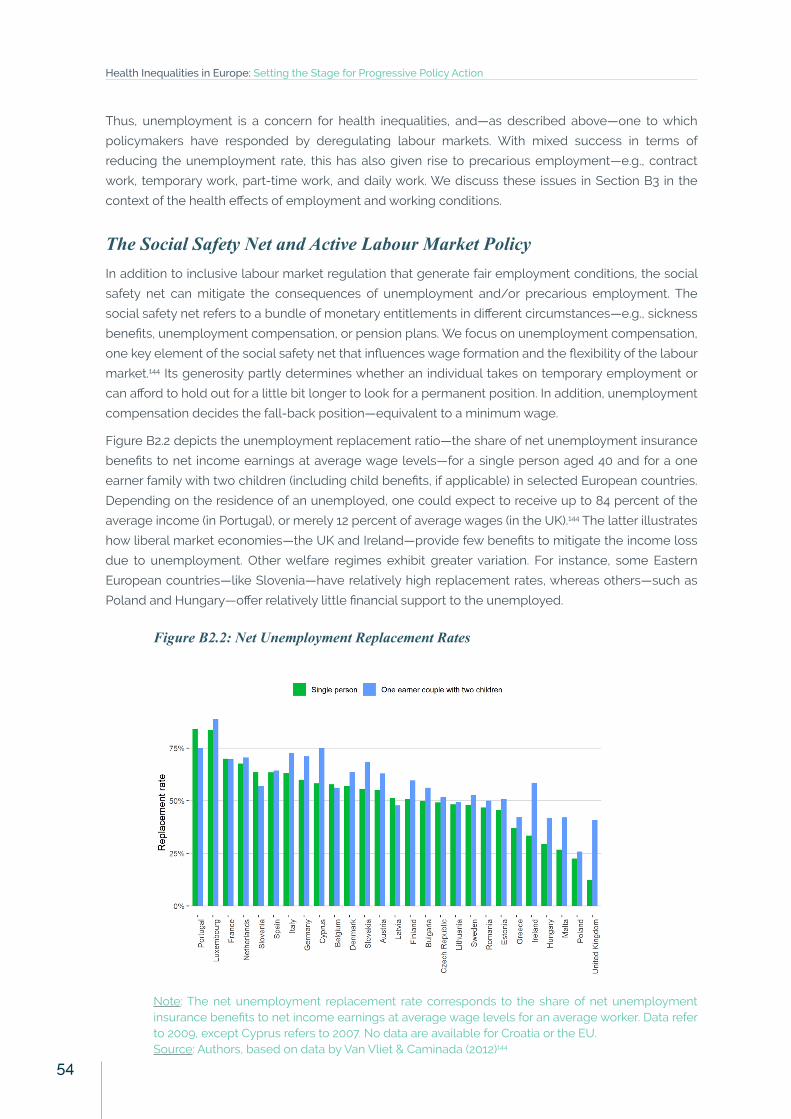
Thus, unemployment is a concern for health inequalities, and—as described above—one to which
policymakers have responded by deregulating labour markets. With mixed success in terms of
reducing the unemployment rate, this has also given rise to precarious employment—e.g., contract
work, temporary work, part-time work, and daily work. We discuss these issues in Section B3 in the
context of the health effects of employment and working conditions.
The Social Safety Net and Active Labour Market PolicyIn addition to inclusive labour market regulation that generate fair employment conditions, the social
safety net can mitigate the consequences of unemployment and/or precarious employment. The
social safety net refers to a bundle of monetary entitlements in different circumstances—e.g., sickness
benefits, unemployment compensation, or pension plans. We focus on unemployment compensation,
one key element of the social safety net that influences wage formation and the flexibility of the labour
market.144 Its generosity partly determines whether an individual takes on temporary employment or
can afford to hold out for a little bit longer to look for a permanent position. In addition, unemployment
compensation decides the fall-back position—equivalent to a minimum wage.
Figure B2.2 depicts the unemployment replacement ratio—the share of net unemployment insurance
benefits to net income earnings at average wage levels—for a single person aged 40 and for a one
earner family with two children (including child benefits, if applicable) in selected European countries.
Depending on the residence of an unemployed, one could expect to receive up to 84 percent of the
average income (in Portugal), or merely 12 percent of average wages (in the UK).144 The latter illustrates
how liberal market economies—the UK and Ireland—provide few benefits to mitigate the income loss
due to unemployment. Other welfare regimes exhibit greater variation. For instance, some Eastern
European countries—like Slovenia—have relatively high replacement rates, whereas others—such as
Poland and Hungary—offer relatively little financial support to the unemployed.
Figure B2.2: Net Unemployment Replacement Rates
Note: The net unemployment replacement rate corresponds to the share of net unemployment insurance benefits to net income earnings at average wage levels for an average worker. Data refer to 2009, except Cyprus refers to 2007. No data are available for Croatia or the EU.Source: Authors, based on data by Van Vliet & Caminada (2012)144
Health Inequalities in Europe: Setting the Stage for Progressive Policy Action
54
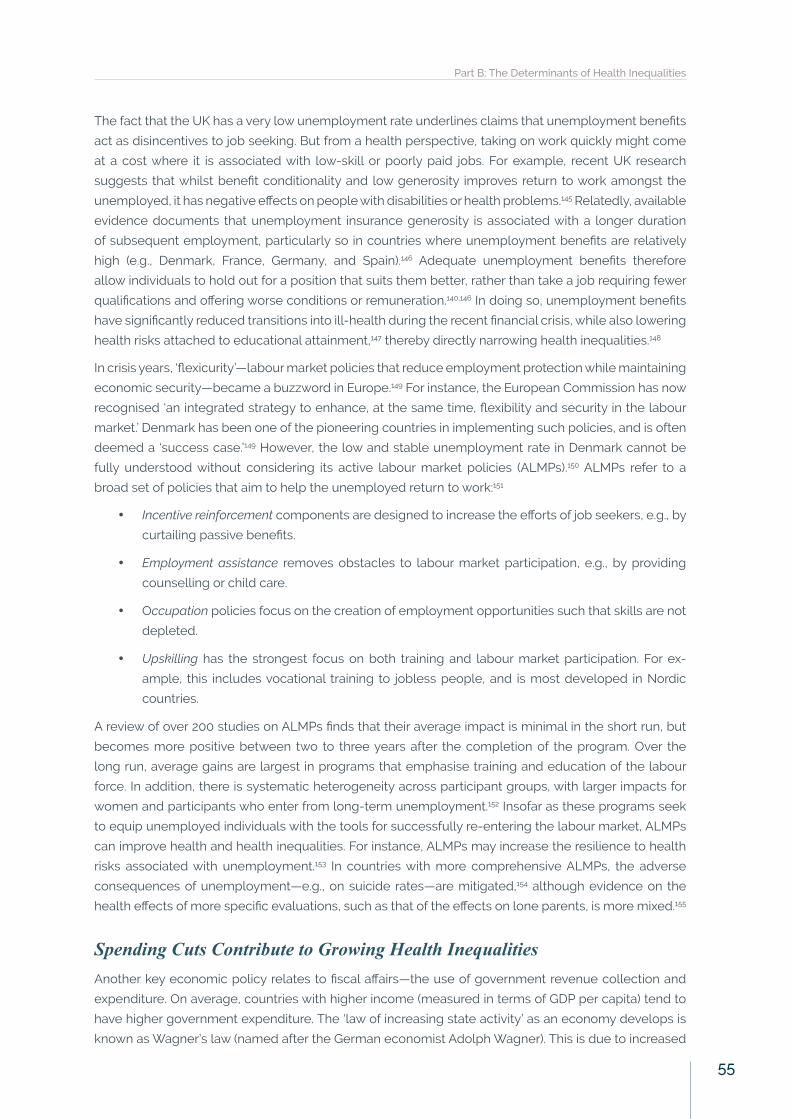
The fact that the UK has a very low unemployment rate underlines claims that unemployment benefits
act as disincentives to job seeking. But from a health perspective, taking on work quickly might come
at a cost where it is associated with low-skill or poorly paid jobs. For example, recent UK research
suggests that whilst benefit conditionality and low generosity improves return to work amongst the
unemployed, it has negative effects on people with disabilities or health problems.145 Relatedly, available
evidence documents that unemployment insurance generosity is associated with a longer duration
of subsequent employment, particularly so in countries where unemployment benefits are relatively
high (e.g., Denmark, France, Germany, and Spain).146 Adequate unemployment benefits therefore
allow individuals to hold out for a position that suits them better, rather than take a job requiring fewer
qualifications and offering worse conditions or remuneration.140,146 In doing so, unemployment benefits
have significantly reduced transitions into ill-health during the recent financial crisis, while also lowering
health risks attached to educational attainment,147 thereby directly narrowing health inequalities.148
In crisis years, ‘flexicurity’—labour market policies that reduce employment protection while maintaining
economic security—became a buzzword in Europe.149 For instance, the European Commission has now
recognised ‘an integrated strategy to enhance, at the same time, flexibility and security in the labour
market.’ Denmark has been one of the pioneering countries in implementing such policies, and is often
deemed a ‘success case.’149 However, the low and stable unemployment rate in Denmark cannot be
fully understood without considering its active labour market policies (ALMPs).150 ALMPs refer to a
broad set of policies that aim to help the unemployed return to work:151
• Incentive reinforcement components are designed to increase the efforts of job seekers, e.g., by
curtailing passive benefits.
• Employment assistance removes obstacles to labour market participation, e.g., by providing
counselling or child care.
• Occupation policies focus on the creation of employment opportunities such that skills are not
depleted.
• Upskilling has the strongest focus on both training and labour market participation. For ex-
ample, this includes vocational training to jobless people, and is most developed in Nordic
countries.
A review of over 200 studies on ALMPs finds that their average impact is minimal in the short run, but
becomes more positive between two to three years after the completion of the program. Over the
long run, average gains are largest in programs that emphasise training and education of the labour
force. In addition, there is systematic heterogeneity across participant groups, with larger impacts for
women and participants who enter from long-term unemployment.152 Insofar as these programs seek
to equip unemployed individuals with the tools for successfully re-entering the labour market, ALMPs
can improve health and health inequalities. For instance, ALMPs may increase the resilience to health
risks associated with unemployment.153 In countries with more comprehensive ALMPs, the adverse
consequences of unemployment—e.g., on suicide rates—are mitigated,154 although evidence on the
health effects of more specific evaluations, such as that of the effects on lone parents, is more mixed.155
Spending Cuts Contribute to Growing Health InequalitiesAnother key economic policy relates to fiscal affairs—the use of government revenue collection and
expenditure. On average, countries with higher income (measured in terms of GDP per capita) tend to
have higher government expenditure. The ‘law of increasing state activity’ as an economy develops is
known as Wagner’s law (named after the German economist Adolph Wagner). This is due to increased
Part B: The Determinants of Health Inequalities
55
need for regulatory and protective functions as well as higher demands for public goods such as
education and cultural services in wealthier economies. Indeed, statistical analyses also find support for
the relationship between public spending and per capita GDP—with a more than proportional increase
of government expenditure with respect to economic activity.156
While the size of states has increased over the long run across Europe, governments have deviated
from this trend in the short term. In relation to health inequalities, declines in government expenditure
are particularly relevant—especially abrupt ones in view of the global financial crisis, as extensive
spending cuts can increase health inequalities. Such ‘austerity’ measures are associated with adverse
effects on public health, especially mental health.3 Following the 2008 crisis, Greece, Italy, and Spain
imposed cuts in health and social protection budgets. These countries experienced profound adverse
health effects, in contrast to countries such as Germany, Iceland, and Sweden who opted to maintain
and strengthen social safety nets.3,157 These reforms exacerbate health inequalities, as disadvantaged
social groups tend to be affected more by the cuts.158-161
Further, austerity measures often stipulate changes to the financing structure of healthcare, as
governments reduce public health expenditure or shift towards a larger share of private financing.113,162-163
As discussed in Section B1, changes in public health spending patterns can affect the volume and quality
of services provided (e.g., number of health facilities), thereby contributing to health inequalities.164-166
As an alternative mechanism, austerity links to health outcomes through its macroeconomic effects.
For example, it is associated with higher unemployment rates and widening income inequality due to
cuts in public wages.167-170 In many cases, populations in vulnerable situations are disproportionately
exposed to these adverse outcomes.171 Finally, austerity potentially exacerbates health inequalities
not only due to economic hardship of the populations, but also due to changes in trust and social
relationships.172
Fiscal Policies that Reduce Health InequalitiesFiscal policy, if appropriately employed, can also help narrow health inequalities. For instance, recall
that unhealthy diets are a key public health concern and a risk factor which is socially graded (see
Section A1). In recent years, governments have introduced subsidies for healthy food and/or levied
taxes on unhealthy food and beverages. Indeed, analyses show that these interventions influence
dietary behaviour, with some studies suggesting that the food taxes and subsidies should amount to
a minimum of 10 to 15 percent, and preferably applied in tandem.173 These policies promise to address
health inequalities since the poor often consume less healthy food, have higher incidences of most diet
related diseases, and are more sensitive to price changes.174 Yet, such reforms face challenges from
multiple fronts. For example, in October 2011, the Danish fat tax—a tax on saturated fat in meat, dairy
(excluding milk), animal fat, and oils, as well as composed foods containing these ingredients—came
into effect. Yet, it was abolished already in January 2013—in part for lack of support by politicians during
the crisis and loss of public popularity (e.g., as retail chains increased prices by more than the amount
of the tax).175 In addition, the food industry and trade associations lobbied extensively and initiated legal
action at the EU level—another instance where European-level determinants came to the fore.
Alternatively, a recent—successful—example in the EU pertains to renewable energy. Since the early-
2000s, several EU Directives have set targets for renewable energy.176-177 As a result, numerous member-
Health Inequalities in Europe: Setting the Stage for Progressive Policy Action
56
states have implemented policies to achieve those goals, such as subsidising renewable energy—
which in turn has contributed to higher use of such energy.178-179 Econometric analyses focusing on the
five largest economies of the EU in terms of GDP—France, Germany, Italy, the UK, and Spain—show
that monetary incentives translate into higher production of renewable energy.179 These benefits have
materialised both in the short run—in the production of incentivised, renewable energy—and in the long
run—in the form of installed capacity.179 Since renewable technologies minimise environmental impacts
and produce considerably less waste than traditional methods, these reforms mitigate greenhouse gas
emissions and therefore carry important health benefits.180
Indeed, the protection of the environment and combatting climate change have important implications
for health inequalities. Once again, the adverse health consequences of climate change are distributed
unevenly, with populations in vulnerable situations most exposed.181-183 The potential impact of climate
change in cities is either unique to urban areas or exacerbated in urban areas—e.g., high vulnerability to
flood events due to the high density of the population.184 Further health risks originate in the effects of heat
waves and other extreme weather conditions, impaired functioning of ecosystems, or displacements—
e.g., low lying island and coastal populations.185 As discussed in Box B2.1, climate change has not only
been addressed by states, but also by subnational actors in transnational networks.
Box B2.1: City Networks Take Climate Action. Despite several decades of state-led negotiations,
cities have become key actors in global action on climate change. For instance, the C40 Cities
Climate Leadership Group is a network of the world’s megacities committed to addressing
climate change. This transnational municipal network consists of more than 90 of the world’s
greatest cities, representing over 650 million people and one quarter of the global economy.
These cities have a pivotal part in charting new geographies of climate governance.186 In many
cases, city dwellers are disproportionately exposed to health hazards by climate change. For
instance, the concentration of concrete and asphalt surfaces and reduction of vegetation in
urban environments exacerbates heat waves.187 To effectively address such health concerns,
cities are required to move beyond local geography and infrastructure and also consider social
and economic conditions. Research points towards the importance of institutional determinants,
such as social networks and community-based organisations, as well as knowledge and
government practices.188 The C40 network contributes towards these institutional conditions
in that it supports cities to collaborate effectively, share knowledge, and drive meaningful,
measurable, and sustainable action on climate change. Learning among C40 cities takes
place when transaction costs are low,189 something governments can contribute to, too. While
municipal governments have a critical role in climate change experimentation, they often act
alongside other actors and in a variety of forms of partnerships.190
In sum, economic policy impacts upon health inequalities in multiple, important ways. They condition
the effectiveness of health systems, but also have direct effects on health outcomes. In many instances,
governments are the main actors, but not the only ones. Other stakeholders—whether trade unions or
businesses in the case of labour market policies, or cities and NGOs in the case of fiscal policy inputs—
have a key role in shaping policymaking, and this affects the prominence of health concerns (or lack
thereof).
Part B: The Determinants of Health Inequalities
57
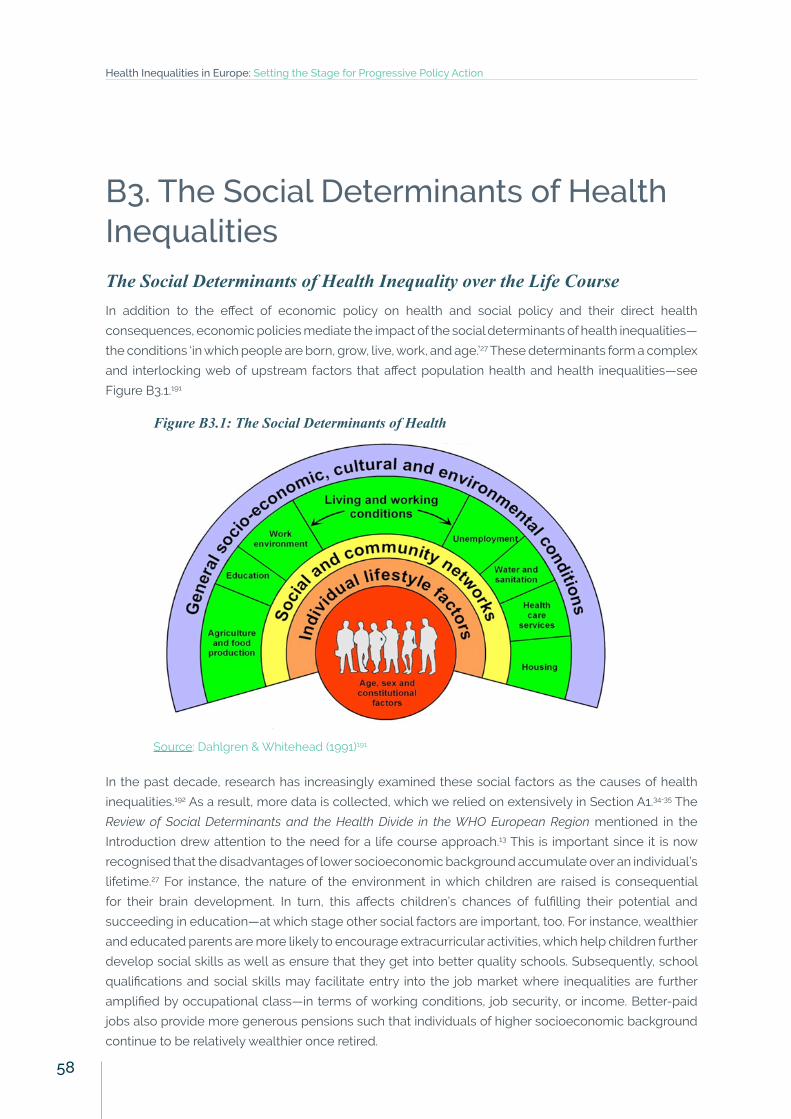
B3. The Social Determinants of Health InequalitiesThe Social Determinants of Health Inequality over the Life CourseIn addition to the effect of economic policy on health and social policy and their direct health
consequences, economic policies mediate the impact of the social determinants of health inequalities—
the conditions ‘in which people are born, grow, live, work, and age.’27 These determinants form a complex
and interlocking web of upstream factors that affect population health and health inequalities—see
Figure B3.1.191
Figure B3.1: The Social Determinants of Health
Source: Dahlgren & Whitehead (1991)191
In the past decade, research has increasingly examined these social factors as the causes of health
inequalities.192 As a result, more data is collected, which we relied on extensively in Section A1.34-35 The
Review of Social Determinants and the Health Divide in the WHO European Region mentioned in the
Introduction drew attention to the need for a life course approach.13 This is important since it is now
recognised that the disadvantages of lower socioeconomic background accumulate over an individual’s
lifetime.27 For instance, the nature of the environment in which children are raised is consequential
for their brain development. In turn, this affects children’s chances of fulfilling their potential and
succeeding in education—at which stage other social factors are important, too. For instance, wealthier
and educated parents are more likely to encourage extracurricular activities, which help children further
develop social skills as well as ensure that they get into better quality schools. Subsequently, school
qualifications and social skills may facilitate entry into the job market where inequalities are further
amplified by occupational class—in terms of working conditions, job security, or income. Better-paid
jobs also provide more generous pensions such that individuals of higher socioeconomic background
continue to be relatively wealthier once retired.
Health Inequalities in Europe: Setting the Stage for Progressive Policy Action
58
The social determinants of health inequalities are therefore clearly important at all stages in life and
the English Health Inequalities Strategy—discussed in Box B3.1—is a successful example of how to
reduce inequalities. Subsequently, this report emphasises three key areas particularly relevant during
the working age: education, work and employment conditions, and income.
Box B3.1: The English Health Inequalities Strategy. Between 1997 and 2010, the UK government
implemented a comprehensive program to reduce health inequalities in England, one of the
most ambitious strategies of its kind. Notably, it differs from other countries’ efforts, such as the
Netherlands or Finland, in that the English Strategy has been ‘more systematically developed,
better resources, more stringently implemented, and more extensively monitored.’193 In
2001, the Secretary of State for Health announced two national health inequalities targets,
namely, to narrow a) the gap in life expectancy between areas and b) the difference in infant
mortality across social classes by 10 percent by 2010 (which were translated into 12 headline
indicators). A revised Strategy from 2003 also incorporated the need to address risk factors,
such as smoking, poor diet, or physical inability, and further included guidelines pertaining
to poverty reduction or educational outcomes. Thus, the Strategy also addressed key social
determinants of health. Recent econometric analyses suggest that geographical inequalities
in life expectancy declined while the Strategy was implemented. Since it ended, inequalities
have started to increase again.194 Further, between 2001 and 2011, NHS funding in deprived
areas in England was increased relative to affluent areas—which also contributed to lower
geographical inequalities in mortality amenable to healthcare.195 In short, the English Health
Inequalities Strategy illustrates how health inequalities can be addressed through concerted
action and policy coherence.
EducationEducation is a powerful marker of social standing since it affects individuals early on in their lives, with
subsequent consequences over the life course.30 Inequalities in health by level of education have
already been discussed at length in this report (see Section A1). Data on life expectancy at age 25 by
different levels of education illustrates this further. Accordingly, men with the lowest level of education
in Austria are expected to live an additional 51.4 years, whereas those in Poland had only 42.6 years. By
contrast, their peers who have completed tertiary education enjoyed an additional 57.8 and 55.2 years,
respectively.36 In addition to these health inequalities, the underlying differences in the education of
European populations are also substantial. For instance, the proportion of individuals with low education
is almost twice as high in Austria (15.5 percent) than in Poland (8.7 percent).7 We investigate educational
attainment in the EU using the definition of levels of education following the International Standard
Classification of Education (ISCED):
• The lowest level of education includes individuals with less than primary, primary, and lower
secondary education (ISCED 2011 levels 0-2). Primary education is designed to provide students
with fundamental skills in reading, writing, and mathematics (i.e., literacy and numeracy).
Subsequently, lower secondary education aims to lay the foundation for lifelong learning and
human development. For example, lower secondary education corresponds to schooling up
until grade 10 in Germany, the first three years of secondary school in the UK, and four-year
collèges in France for pupils aged 11 to 15.
Part B: The Determinants of Health Inequalities
59
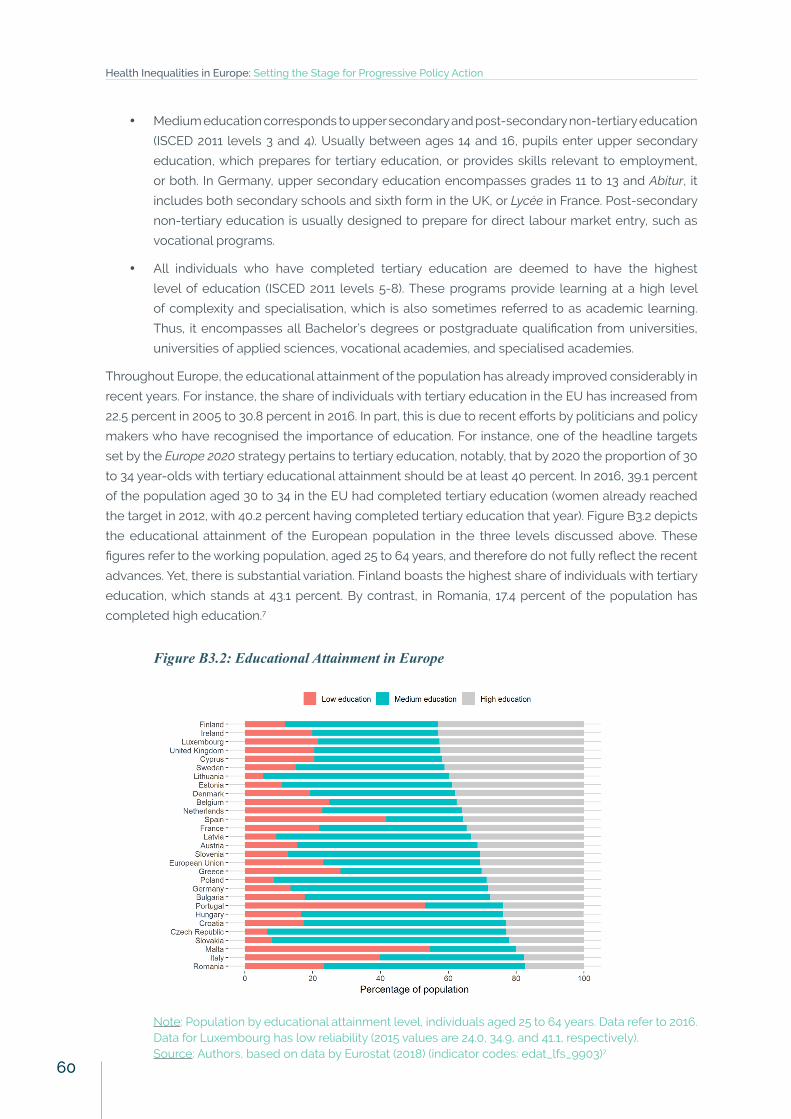
• Medium education corresponds to upper secondary and post-secondary non-tertiary education
(ISCED 2011 levels 3 and 4). Usually between ages 14 and 16, pupils enter upper secondary
education, which prepares for tertiary education, or provides skills relevant to employment,
or both. In Germany, upper secondary education encompasses grades 11 to 13 and Abitur, it
includes both secondary schools and sixth form in the UK, or Lycée in France. Post-secondary
non-tertiary education is usually designed to prepare for direct labour market entry, such as
vocational programs.
• All individuals who have completed tertiary education are deemed to have the highest
level of education (ISCED 2011 levels 5-8). These programs provide learning at a high level
of complexity and specialisation, which is also sometimes referred to as academic learning.
Thus, it encompasses all Bachelor’s degrees or postgraduate qualification from universities,
universities of applied sciences, vocational academies, and specialised academies.
Throughout Europe, the educational attainment of the population has already improved considerably in
recent years. For instance, the share of individuals with tertiary education in the EU has increased from
22.5 percent in 2005 to 30.8 percent in 2016. In part, this is due to recent efforts by politicians and policy
makers who have recognised the importance of education. For instance, one of the headline targets
set by the Europe 2020 strategy pertains to tertiary education, notably, that by 2020 the proportion of 30
to 34 year-olds with tertiary educational attainment should be at least 40 percent. In 2016, 39.1 percent
of the population aged 30 to 34 in the EU had completed tertiary education (women already reached
the target in 2012, with 40.2 percent having completed tertiary education that year). Figure B3.2 depicts
the educational attainment of the European population in the three levels discussed above. These
figures refer to the working population, aged 25 to 64 years, and therefore do not fully reflect the recent
advances. Yet, there is substantial variation. Finland boasts the highest share of individuals with tertiary
education, which stands at 43.1 percent. By contrast, in Romania, 17.4 percent of the population has
completed high education.7
Figure B3.2: Educational Attainment in Europe
Note: Population by educational attainment level, individuals aged 25 to 64 years. Data refer to 2016. Data for Luxembourg has low reliability (2015 values are 24.0, 34.9, and 41.1, respectively).Source: Authors, based on data by Eurostat (2018) (indicator codes: edat_lfs_9903)7
Health Inequalities in Europe: Setting the Stage for Progressive Policy Action
60
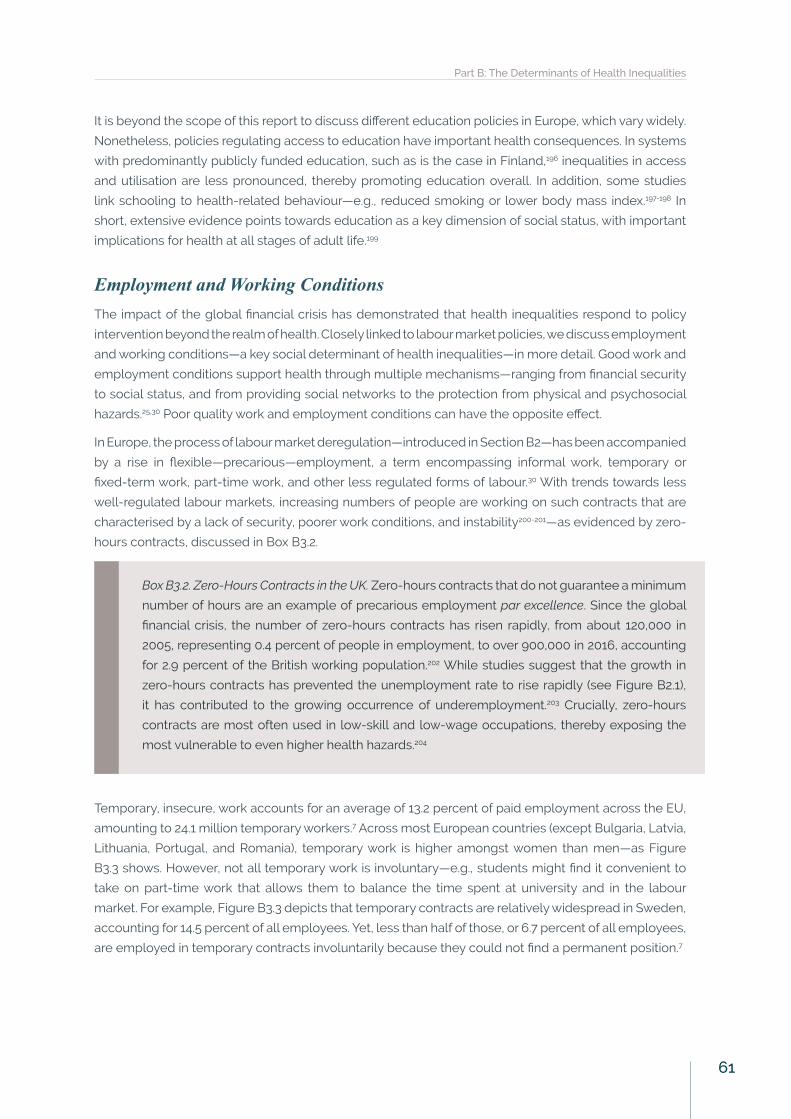
It is beyond the scope of this report to discuss different education policies in Europe, which vary widely.
Nonetheless, policies regulating access to education have important health consequences. In systems
with predominantly publicly funded education, such as is the case in Finland,196 inequalities in access
and utilisation are less pronounced, thereby promoting education overall. In addition, some studies
link schooling to health-related behaviour—e.g., reduced smoking or lower body mass index.197-198 In
short, extensive evidence points towards education as a key dimension of social status, with important
implications for health at all stages of adult life.199
Employment and Working ConditionsThe impact of the global financial crisis has demonstrated that health inequalities respond to policy
intervention beyond the realm of health. Closely linked to labour market policies, we discuss employment
and working conditions—a key social determinant of health inequalities—in more detail. Good work and
employment conditions support health through multiple mechanisms—ranging from financial security
to social status, and from providing social networks to the protection from physical and psychosocial
hazards.25,30 Poor quality work and employment conditions can have the opposite effect.
In Europe, the process of labour market deregulation—introduced in Section B2—has been accompanied
by a rise in flexible—precarious—employment, a term encompassing informal work, temporary or
fixed-term work, part-time work, and other less regulated forms of labour.30 With trends towards less
well-regulated labour markets, increasing numbers of people are working on such contracts that are
characterised by a lack of security, poorer work conditions, and instability200-201—as evidenced by zero-
hours contracts, discussed in Box B3.2.
Box B3.2. Zero-Hours Contracts in the UK. Zero-hours contracts that do not guarantee a minimum
number of hours are an example of precarious employment par excellence. Since the global
financial crisis, the number of zero-hours contracts has risen rapidly, from about 120,000 in
2005, representing 0.4 percent of people in employment, to over 900,000 in 2016, accounting
for 2.9 percent of the British working population.202 While studies suggest that the growth in
zero-hours contracts has prevented the unemployment rate to rise rapidly (see Figure B2.1),
it has contributed to the growing occurrence of underemployment.203 Crucially, zero-hours
contracts are most often used in low-skill and low-wage occupations, thereby exposing the
most vulnerable to even higher health hazards.204
Temporary, insecure, work accounts for an average of 13.2 percent of paid employment across the EU,
amounting to 24.1 million temporary workers.7 Across most European countries (except Bulgaria, Latvia,
Lithuania, Portugal, and Romania), temporary work is higher amongst women than men—as Figure
B3.3 shows. However, not all temporary work is involuntary—e.g., students might find it convenient to
take on part-time work that allows them to balance the time spent at university and in the labour
market. For example, Figure B3.3 depicts that temporary contracts are relatively widespread in Sweden,
accounting for 14.5 percent of all employees. Yet, less than half of those, or 6.7 percent of all employees,
are employed in temporary contracts involuntarily because they could not find a permanent position.7
Part B: The Determinants of Health Inequalities
61
Figure B3.3: Share of Employees with Temporary Contracts
Note: Percentage of employees aged 20 to 64 with temporary contracts. Data refer to 2016. Source: Authors, based on data by Eurostat (2018) (indicator codes: lfsi_pt_a)7
The gains to employers from such job flexibility include increased performance and productivity, lower
wages, and lower associated costs such as pensions or sickness benefits—all of which translate into
higher profits.140 However, these benefits to capital are accompanied by adverse consequences for
labour. Precarious employment is linked to lower wages, long working hours, high strain and stress, and
higher job insecurity.135,205 It therefore impacts on health and wellbeing through material, psychosocial,
and behavioural pathways.
Work insecurity and stress at work is associated with adverse effects on both physical and mental
health.19,206-208,212 Likewise, poor work quality may lead to worse mental health status.209-210 In addition,
the psychosocial work environment—autonomy at work, decisions, efforts and rewards—significantly
impact upon mental health.211 Thus, zero-hours contracts—and precarious employment more
generally—are linked to significant health risks. These effects are compounded since many workers on
atypical contracts can cycle from precarious work into unemployment, thus augmenting the negative
consequences for health.213
In addition, the adverse consequences are often gendered or vary by socioeconomic status, thereby
exacerbating health inequalities. For example, precarious work is more detrimental to women’s health
than men’s.214 In addition, poor mental health, such as depression, is more prevalent among those
in non-standard employment, i.e., part-time, temporary, and daily work. While lower socioeconomic
position and poor health behaviour account for this variation for men, worse mental health for women
in non-standard work persist after controlling for these.215 Other groups who are most vulnerable with
regard to employment security include young workers, lower-skilled individuals, and older workers,
who may face significant challenges in finding a new position in case of job loss.216
Health Inequalities in Europe: Setting the Stage for Progressive Policy Action
62
However, employment-related health varies by welfare regimes.217 For instance, precarious workers in
Nordic welfare states report equal or better health status relative to their permanent counterparts. In
other welfare regimes, precarious employment is associated with a range of adverse health outcomes,
including poor self-rated health, injuries, and mental illness.217 In terms of job insecurity, a sizeable
proportion of studies again does not find a link to adverse health outcomes in Scandinavian populations.
By contrast, in Conservative and Southern European welfare states, job insecurity is—as anticipated—
detrimental to individuals’ health.217 Research suggests that Nordic countries best manage the health
risks associated with precarious employment because of high union density and the social dialogue
with multiple stakeholders—see Box B3.3.
Box B3.3: Mitigating Health Risks of Non-Standard Employment. Finland and Sweden have been
relatively successful in accommodating the career risks of non-standard employment.216 These
two countries have a strong tradition of social dialogue, particularly high union density—the
Nordic countries are leading amongst OECD countries, with union density above 65 percent—
and collective bargaining at industry/sector level (both countries) and at national level (Finland).
The government plays a facilitating role in negotiations between social partners (which have
relatively extensive autonomy from public authorities) by setting the legal framework of
collective bargaining and passing basic labour regulations, including social policy and labour
legislation reforms. The result has been a comprehensive institutional system that tends to
diminish the differences between standard and non-standard forms of work.218
In contrast to precarious employment, job quality is strongly and positively associated with well-being.
Among its many dimensions, intrinsic job quality and job prospects have the most impact on well-being.
These include skill and autonomy, support from managers and colleagues, and—as discussed above—
perception of job security.219 Such beneficial job qualities are captured by the notion of ‘sustainable
work.’ However, the concept is relatively new and varies in the public discourse in Europe.216 Sweden, the
Netherlands, and Belgium are three countries in which sustainable work is present in the public debate.
In a second group of countries, key features are covered through other concepts such as quality of work
or decent work (e.g., in Germany, and to different extents in Poland, Lithuania, and Finland). In this group,
specific policies exist to address the inclusion of workers faced with specific barriers to employment,
such as health problems or care responsibilities, or spells of unemployment.216
Beyond the immediate health consequences of working conditions, employment provides the primary
source of income for a majority of the working-age population. Thus, income disparities are another
important determinant of health inequalities—discussed next.
Part B: The Determinants of Health Inequalities
63
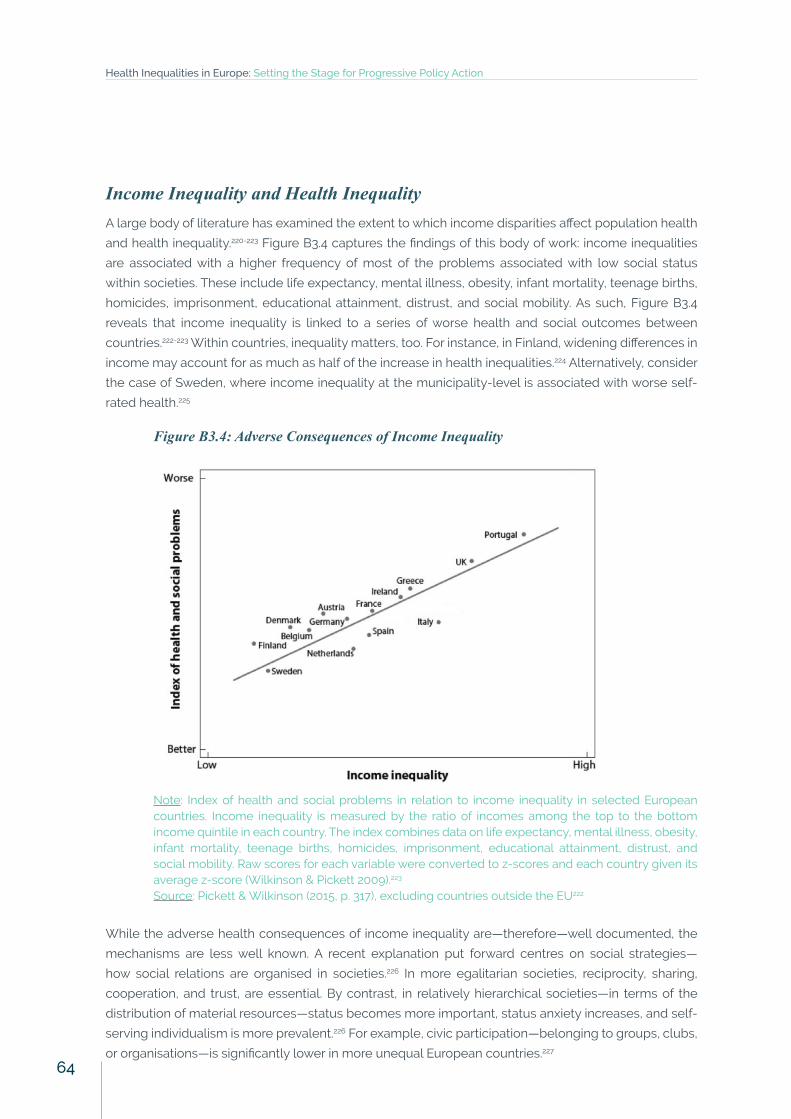
Income Inequality and Health InequalityA large body of literature has examined the extent to which income disparities affect population health
and health inequality.220-223 Figure B3.4 captures the findings of this body of work: income inequalities
are associated with a higher frequency of most of the problems associated with low social status
within societies. These include life expectancy, mental illness, obesity, infant mortality, teenage births,
homicides, imprisonment, educational attainment, distrust, and social mobility. As such, Figure B3.4
reveals that income inequality is linked to a series of worse health and social outcomes between
countries.222-223 Within countries, inequality matters, too. For instance, in Finland, widening differences in
income may account for as much as half of the increase in health inequalities.224 Alternatively, consider
the case of Sweden, where income inequality at the municipality-level is associated with worse self-
rated health.225
Figure B3.4: Adverse Consequences of Income Inequality
Note: Index of health and social problems in relation to income inequality in selected European countries. Income inequality is measured by the ratio of incomes among the top to the bottom income quintile in each country. The index combines data on life expectancy, mental illness, obesity, infant mortality, teenage births, homicides, imprisonment, educational attainment, distrust, and social mobility. Raw scores for each variable were converted to z-scores and each country given its average z-score (Wilkinson & Pickett 2009).223
Source: Pickett & Wilkinson (2015, p. 317), excluding countries outside the EU222
While the adverse health consequences of income inequality are—therefore—well documented, the
mechanisms are less well known. A recent explanation put forward centres on social strategies—
how social relations are organised in societies.226 In more egalitarian societies, reciprocity, sharing,
cooperation, and trust, are essential. By contrast, in relatively hierarchical societies—in terms of the
distribution of material resources—status becomes more important, status anxiety increases, and self-
serving individualism is more prevalent.226 For example, civic participation—belonging to groups, clubs,
or organisations—is significantly lower in more unequal European countries.227
Health Inequalities in Europe: Setting the Stage for Progressive Policy Action
64
Part C: The Impact
of Health Inequalities
65
Part C: The Impact of Health InequalitiesPart C of the report shifts the focus from the determinants of health inequalities to their welfare impact
and associated economic costs. In doing so, it establishes in more detail why health inequalities matter.
• Section C1 discusses the right to health and its instrumentality in achieving better social and
economic outcomes. It emphasises why addressing risk factors and the social determinants of
health can narrow health inequalities while producing additional economic benefits. In addition,
we link the discussion to the Sustainable Development Goals.
C1. Health Inequality, Empowerment, and the EconomyHealth Equity Empowers Individuals and SocietiesAs documented throughout this report, high levels of health enable individuals to improve their lives, and
have positive implications for social mobility and cohesion. Consequently, reducing health inequalities
matters for individual health, and also society at large.228 In particular, the report has documented
how different institutions—e.g., welfare regimes and health systems—and social determinants—e.g.,
education or occupation—influence health. Good health empowers individuals by allowing them to
make better, informed choices regarding their lifestyle and health service access and utilisation. In
contrast, ill-health may prevent individuals from reaching their full potential at school or at work, or
from fully participating in activities of family, friends, and communities. In doing so, ill-health and health
inequalities can lead to a vicious cycle: Low health leads to reduced economic opportunities—e.g., being
too ill to work or having reduced productivity because of health problems—which further deteriorates
health due to increased job insecurity. Thus, while health inequalities matter in themselves due to their
implications for the human condition, they are also associated with significant economic consequences
for individuals and society.
Economic and Welfare Costs of Health InequalitiesIn addition to the multifaceted impacts of health inequalities on individuals, ill-health and health
inequalities incur substantial costs for society. First, individuals are indispensable in the labour market,
and better health tends to improve individuals’ productivity—reflected in labour market participation
rates, working hours, and efficiency.31,229 While quantifying these links is methodologically challenging
and the relationship is relatively understudied, research suggests that health promotes economic
activity and is linked to higher GDP growth.229 Calculations for the EU indicate that increasing the health
of the bottom half of the European population in terms of social standing (approximated by education)
to the average health of the top half would improve labour productivity by 1.4 percent of GDP each
Health Inequalities in Europe: Setting the Stage for Progressive Policy Action
66
year.31 This means that within five years of these improvements, GDP would be more than 7 percent
higher.
A second type of cost encompasses the value individuals attribute to health itself. Naturally, it is
challenging to quantify the value of health and wellbeing for individuals—yet not impossible, e.g., by
looking at the wage premia for workers who perform dangerous tasks. A simple calculation reveals
that in many WHO European Region countries between 1970 and 2003, the gains associated with
improvements in life expectancy totalled between 29 to 38 percent of GDP.229 In 2015, over 250,000
excess hospitalisations were associated with socioeconomic inequalities in England,230 with an
estimated cost to the English NHS of GBP 4.8 billion per year.231 In the EU, the monetary value of health
inequality related losses is estimated to be €980 billion per year, or 9.4 percent of GDP (data refer
to 2004).31 The latter calculation is based on a scenario where the health of populations with lower
secondary education or less (approximately half of the population) would be improved to the average
health of individuals who have completed higher secondary education or above. Due to their complex
underlying assumptions, these figures contain a high degree of uncertainties, though.2
Cost of Risk FactorsHealth risk factors—such as smoking, alcohol consumption, and unhealthy diets—incur both direct and
indirect economic losses. The former pertains to the cost of healthcare services, such as hospitalisation,
ambulatory care, medicines, and so forth. The latter refers to lost productivity due to absenteeism,
unemployment, decreased output, reduced earnings potential, and related. For instance, the total cost
of smoking in the EU—public health spending on treating smoking attributable diseases and smoking-
related productivity losses—were estimated to be €7.3 billion in 2009.232 In addition, research suggests
that substantial tobacco industry lobbying at the EU was associated with policy shifts in the EU Tobacco
Products Directive legislation between 2010 and 2014—thereby reflecting additional expenses incurred
as ‘unproductive spending.’233
Alternatively, consider alcohol consumption, whose costs approximately represent 1.3 percent to 3.3
percent of the GDP.234-235 In 2017, this amounts to between €200 and €500 billion in the EU.7 In addition,
these estimates usually abstract from intangible costs, related to pain and diminished quality of life—
which are usually borne by the drinkers and their close environment.236
Finally, there is a large economic burden associated with unhealthy diets and low physical activity. In
2012, it was estimated that the obesity cost in Europe was more than €80 billion per year.237 Some of
these costs can be attributed to single diseases. For example, in 2020, the estimated cost of predicted
diabetes due to unhealthy diets and low physical activity corresponds to €883 million for France,
Germany, Italy, Spain and the UK alone. The ‘true’ costs will be higher, as unhealthy diets and low
physical activity are linked to increased prevalence of several diseases.238
2 Data refer to 2004 and to the EU-25, before the accession of Bulgaria, Romania, and Croatia.
Part C: The Impact of Health Inequalities
67
Since these risk factors follow a social gradient (see Section A1), addressing health inequalities offers a
way to disproportionately lower the economic cost while empowering individuals most in need. While
these risk factors are sometimes referred to as ‘unhealthy behaviours’ it is important to clarify that
these are by no means solely individual-level determinants. These behaviours—and quality of life more
generally—are influenced by the physical and social characteristics of people’s direct surroundings.239
Thus, in addition to the economic and individual-level benefits, combatting these risk factors promises
to improve living standards of societies at large.
Action on the Social Determinants of HealthSimilar to behavioural risk factors, the social determinants of health inequalities have socioeconomic
consequences for the economy as a whole. Thus, tackling health inequalities through the social
determinants of health is expected to yield a range of economic benefits. As above, we focus primarily
on three social determinants of health: education, employment, and income.
First, in today’s knowledge-based society education plays an ever-increasing role. Better educational
attainment increases the ‘set of knowledge, skills, competencies, and abilities embodied in individuals
and acquired’ of the labour force.240 This provides individuals with more economic opportunities
over the entire life course. At a national level, education increases labour productivity and enhances
the innovative capacity of the economy, knowledge of new technologies, products, and processes,
thereby indirectly promoting growth.241 While the precise quantitative impact of education on economic
growth is uncertain due to different classifications of schooling and measurement error,240 the effect of
investment in education on productivity growth is sizeable.242-244
Second, the value of employment for health has already been discussed at length. In the EU, individuals
with better health are more likely to be in the labour force. In turn, this is important for an economy as it
boosts economic activity, consumption and taxes, and finances the welfare state. Among employees,
it has been documented that healthy workers are more productive. Thus, by levelling the health
inequalities through action on employment and work condition, the economy stands to benefit.
Third, we discussed the adverse social consequences of excessive income inequality in Section B3.
In addition, unsustainable inequalities in the distribution of income carry sizeable economic costs. For
example, attention to income inequality can bring significant long-term gains in terms of economic
growth.245 Further, the notion of ‘trickle-down economics’—suggesting that higher incomes for the rich
trickle down to the lower strata of the population—has been largely discredited. Even research staff
from the International Monetary Fund—usually ardent advocates of free markets—admits that trickle-
down economics is a myth: ‘[I]f the income share of the top 20 percent (the rich) increases, then GDP
growth actually declines over the medium term, suggesting that the benefits do not trickle down. In
contrast, an increase in the income share of the bottom 20 percent (the poor) is associated with higher
GDP growth.’246
Health Inequalities in Europe: Setting the Stage for Progressive Policy Action
68
Reducing Health Inequalities and the Sustainable Development GoalsIn 2015, the EU adopted the Sustainable Development Goals (SDGs) which set 17 specific targets for
both high- and low-income countries to be achieved until 2030. Crucially, reducing health inequalities
resonates with the SDGs’ overarching principle of ‘leaving no one behind.’227 Ultimately, the achievement
of all SDGs may therefore entail health benefits. Yet, the following selected goals merit separate
discussion as they relate to themes discussed in earlier sections of the report:
• Goal 3: Ensure healthy lives and promote well-being for all at all ages.
• Goal 4: Ensure inclusive and equitable quality education and promote life-long learning
opportunities for all.
• Goal 5: Achieve gender equality and empower all women and girls.
• Goal 8: Promote sustained, inclusive and sustainable economic growth, full and productive
employment and decent work for all.
• Goal 10: Reduce inequality within and among countries.
According to the latest progress report by the European Commission,248 the EU made unequal progress
towards achieving the SDGs over the past five years. First, results in terms of ‘good health and well-
being’ are slightly behind schedule. The EU monitors the goals by focusing on four sub-themes. In
terms of headline indicator of healthy lives, the report finds that life expectancy has increased both over
the short and long run (5 and 15 years, respectively). By contrast, the number of Europeans reporting
good or very good health has fallen slightly since 2010. In terms of health determinants, the Commission
reports that conditions pertaining to external factors—exposure to air pollution and noise—have
improved substantially. Likewise, selected indicators on the causes of death show that deaths due to
chronic diseases, suicide rates, and people killed in accidents at work are lower than five years ago.
Finally, access to healthcare has not changed substantially as reflected in relatively stable proportions
of self-reported unmet needs by the European population (see also Figure B1.5). However, the EU’s
own assessment is relatively narrow since it only focuses on one dimension of access to healthcare.
Independent evaluations of access to public services include further considerations, such as delays in
getting appointments, waiting times, or concerns about future access.42
Second, the EU monitors ‘quality education’ in three related clusters. Numbers in basic education paint
an improved picture: At the European level, early leavers in basic education as well as young people
neither in employment nor in education/training have decreased. Performance in reading, maths,
and science among 15-year olds has not seen any considerably improvements, though. As already
discussed in terms of tertiary education, a higher share of the European population than ever before
has completed tertiary education. Yet, the employment rate of recent graduates stands at 78.2 percent,
considerably lower than the 2020 target of 82 percent (which corresponds to the pre-economic crisis
peak). Finally, achievements in adult education are below the targets set for the SDGs.248
Part C: The Impact of Health Inequalities
69
Third, progress towards achieving ‘gender equality’—which is closely linked to other SDGs—is mixed.
For instance, some statistics on education have improved since 2010, notably, the shares of early leavers
from education and training have fallen steadily for both men and women. Men are still more likely than
women to drop out of school, even though the gap has narrowed in recent years. By contrast, the gender
gap in tertiary educational attainment has diverged further in favour of women. The picture is similarly
uneven for progress on employment. While the gender employment gap has narrowed between 2005
and 2016, the proportion of working-age men in employment still exceeds that of women by 11.6 percent.
Likewise, the proportion of inactive individuals in the labour market due to caring responsibilities in
2016 is 30.7 percent of inactive women aged 20 to 64, up by 3.2 percentage points from 2011 (and in
stark contrast to 4.3 percent, the respective figure for men). Further, the gender pay gap persists—with
women earning 16.3 percent less than men (gross hourly earnings in 2015). However, women are now
more present in leadership positions—both in parliaments and senior management—relative to 2012
levels (although there is still a long way to go to parity, with shares of 28.9 and 24.6 percent in 2017,
respectively).248
Fourth, two indicators on ‘decent work and economic growth’ pertaining to decent work are particularly
relevant for health inequalities. We have already drawn attention to the rise of involuntary temporary
employment, which has been particularly pronounced in the past four years. By contrast, progress in
terms of accidents at work is positive, since the number of fatal accidents fell from 2.01 in 2009 to 1.83
in 2010 (per 100,000 persons employed aged 25 to 64).248
Finally, evidence on the SDG ‘reducing inequalities within and among countries’ is mixed. As a result
of improved incomes and living standards as well as convergence across the EU, income inequality
between countries have narrowed. However, measures on inequalities within countries show that these
have widened. For instance, the income share of the bottom two quintiles of the distribution has been
shrinking over time, from 21.5 percent in 2005 to 20.9 percent in 2015 (exacerbated by wage stagnation,
unemployment, austerity).248
While many countries have devised national strategies to achieve these goals and implemented policy
reforms, the academic literature assessing them is still in its infancy. Yet, studies from NGOs provide
some preliminary evidence of successful stories. A recent independent review of projects on the SDGs
finds that governments should select national targets and strategies through inclusive consultation
with local stakeholders.249 For instance, many local governments and local government associations
in the Netherlands are taking action on the SDGs. A good example is the city of Utrecht, which has set
itself a number of specific targets: It wants to have the lowest unemployment rate in the Netherlands
by 2018, more than triple the number of solar panels to 15,000 by 2020, and make 75 percent of its
residents aware of the SDGs by 2030. To facilitate the achievement of these goals, the city has launched
the Utrecht4GlobalGoals campaign that awards inspiring initiatives helping to achieve the SDGs. Further,
it invites residents to share SDG-related stories and promotes dialogue with SDG initiatives through a
digital information platform, HeelUtrechtU.249
Health Inequalities in Europe: Setting the Stage for Progressive Policy Action
70

Conclusion and Policy
Recommendations
71
Conclusion and Policy RecommendationsThis report assembled comprehensive evidence on health inequalities and its multiple causes in the
EU.
• Over the past decade, health at an aggregate, European-level has improved—e.g., as mea-
sured by life expectancy at birth. However, such gains are unevenly distributed across coun-
tries, exacerbating between-country health inequalities.
• Furthermore, sizeable differences in health continue to exist within countries. Self-reported
health, non-communicable diseases, and individual-level risk factors all follow a social gradi-
ent, with individuals of higher socioeconomic background often faring better than those with
lower social standing.
The extent and variation of health inequalities observed in the EU point towards their complex set
of determinants. We have discussed the role of the welfare regime and national health systems that
determine what services are provided to whom, and how they are financed. Through their impact on
access and utilisation of health services, these institutions may inhibit or widen health inequalities.
However, debates on health inequalities remain incomplete when focusing solely on social policy. The
design of social policies and their effectiveness largely depends on other institutional arrangements,
including economic policy—especially, labour market regulation and fiscal policy—and the social
determinants of health—most notably, education, the workplace, and income.
The complementarities of institutions and interconnectedness of different determinants signal that
concerted action and policy coherence is required for tackling inequalities in health—as has been
illustrated by the English Health Inequalities Strategy. Further, inclusive policies that consider the
interests and resources of a wide range of stakeholders promise to address key health concerns. This
has been evident in how Nordic countries in particular managed the risks associated with precarious
employment—e.g., taking into account the needs of labour—or in global city networks that have put
mechanisms in place to effectively exchange information and learn from each other in their fight against
climate change.
While providing evidence on the extent of health inequalities in Europe, we have also highlighted
areas in which such evidence is lacking. Box 8.1 identifies three broad clusters of blind spots that future
research should address.
Health Inequalities in Europe: Setting the Stage for Progressive Policy Action
72
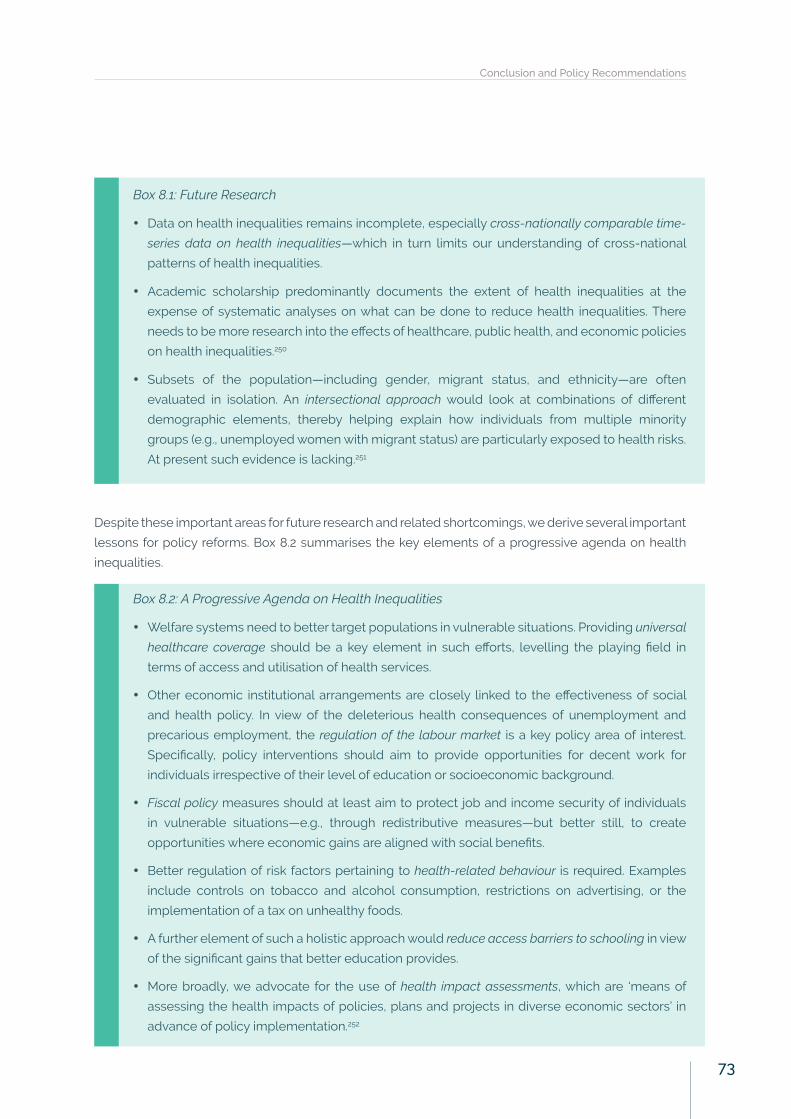
Box 8.1: Future Research
• Data on health inequalities remains incomplete, especially cross-nationally comparable time-
series data on health inequalities—which in turn limits our understanding of cross-national
patterns of health inequalities.
• Academic scholarship predominantly documents the extent of health inequalities at the
expense of systematic analyses on what can be done to reduce health inequalities. There
needs to be more research into the effects of healthcare, public health, and economic policies
on health inequalities.250
• Subsets of the population—including gender, migrant status, and ethnicity—are often
evaluated in isolation. An intersectional approach would look at combinations of different
demographic elements, thereby helping explain how individuals from multiple minority
groups (e.g., unemployed women with migrant status) are particularly exposed to health risks.
At present such evidence is lacking.251
Despite these important areas for future research and related shortcomings, we derive several important
lessons for policy reforms. Box 8.2 summarises the key elements of a progressive agenda on health
inequalities.
Box 8.2: A Progressive Agenda on Health Inequalities
• Welfare systems need to better target populations in vulnerable situations. Providing universal
healthcare coverage should be a key element in such efforts, levelling the playing field in
terms of access and utilisation of health services.
• Other economic institutional arrangements are closely linked to the effectiveness of social
and health policy. In view of the deleterious health consequences of unemployment and
precarious employment, the regulation of the labour market is a key policy area of interest.
Specifically, policy interventions should aim to provide opportunities for decent work for
individuals irrespective of their level of education or socioeconomic background.
• Fiscal policy measures should at least aim to protect job and income security of individuals
in vulnerable situations—e.g., through redistributive measures—but better still, to create
opportunities where economic gains are aligned with social benefits.
• Better regulation of risk factors pertaining to health-related behaviour is required. Examples
include controls on tobacco and alcohol consumption, restrictions on advertising, or the
implementation of a tax on unhealthy foods.
• A further element of such a holistic approach would reduce access barriers to schooling in view
of the significant gains that better education provides.
• More broadly, we advocate for the use of health impact assessments, which are ‘means of
assessing the health impacts of policies, plans and projects in diverse economic sectors’ in
advance of policy implementation.252
Conclusion and Policy Recommendations
73
The right to the highest attainable level of health is enshrined in the charter of WHO and many
international treaties. Further, countries have a moral obligation to reduce health inequalities, and they
are committed to the Sustainable Development Goals. In addition, the EU promotes good health as part
of the Europe 2020 vision, which also encompasses strategies to address health inequalities. To reach
this twin-goal of reducing health inequalities and achieving the SDGs, we echo earlier calls by the WHO
of proportionate universalism, that ‘policies are needed that are universal but are implemented at a
level and intensity of action that is proportionate to need.’13,27
Thus, if health inequalities in the EU are to be reduced, concerted action that takes due care of the
complex web of determinants of health inequalities as well as the individuals in vulnerable situations is
required. Policymakers are in a prime position to take such action—by building on academic evidence
and consulting with civil society.
Health Inequalities in Europe: Setting the Stage for Progressive Policy Action
74

Bibliography
75
Bibliography1. Schrecker, T. & Bambra, C., 2015. How Politics Makes Us Sick: Neoliberal Epidemics. London: Palgrave
Macmillan.
2. Stiglitz, J., 2016. The Euro: And Its Threat to the Future of Europe. London: Penguin UK.
3. Stuckler, D. & Basu, S., 2013. The Body Economic: Why Austerity Kills. New York: Basic Books.
4. Wolf, M., 2015. The Shifts and the Shocks: What We’ve Learned – And Have Still to Learn – From the
Financial Crisis. London: Penguin UK.
5. Castells, M. et al., 2017. Europe’s Crises. Cambridge: Polity Press
6. Funke, M., Schularick, M. & Trebesch, C., 2016. Going to Extremes: Politics after Financial Crises, 1870–
2014. European Economic Review, 88, pp.227-260.
7. Eurostat, 2018. Database (indicators as described in text). http://ec.europa.eu/eurostat/data/
database
8. Mackenbach, J.P. et al., 2016. Changes in Mortality Inequalities over Two Decades: Register Based
Study of European Countries. BMJ, 353, p.i1732. doi:10.1136/bmj.i1732
9. Brønnum-Hansen, H. & Baadsgaard, M., 2012. Widening Social Inequality in Life Expectancy in
Denmark. A Register-Based Study on Social Composition and Mortality Trends for the Danish Population.
BMC Public Health, 12, p.994. doi:10.1186/1471-2458-12-994
10. British Department of Health, 2017. Annual Report and Accounts 2016-17, Department of Health.
11. Reibling, N., Beckfield, J., Huijts, T., Schmidt-Catran, A., Thomson, K.H. & Wendt, C., 2017. Depressed
During the Depression: Has the Economic Crisis Affected Mental Health Inequalities in Europe? Findings
from the European Social Survey (2014) Special Module on the Determinants of Health. The European
Journal of Public Health, 27(suppl_1), pp.47-54.
12. Whitehead, M., 1991. The Concepts and Principles of Equity and Health. Health Promotion International,
6(3), pp.217-228.
13. WHO, 2013. Review of Social Determinants and the Health Divide in the WHO European Region.
Copenhagen: World Health Organization Regional Office for Europe.
14. European Commission, 2013. Health Inequalities in the EU: Final Report. European Commission,
doi:10.2772/34426
15. European Commission, 2018. Europe 2020—For A Healthier EU. Retrieved 5 August 2018, from https://
ec.europa.eu/health/europe_2020_en
16. European Commission, 2009. Solidarity in Health: Reducing Health Inequalities in the EU, COM(2009)
567 final. Brussels.
17. Council of the European Union, 2010. Council Conclusions on Equity and Health in All Policies: Solidarity
in Health. 3019th Employment, Social Policy, Health and Consumer Affairs Council Meeting, 8 June 2010.
Luxembourg.
Health Inequalities in Europe: Setting the Stage for Progressive Policy Action
76
18. Hall, P.A. & Taylor, R.C., 2009. Health, Social Relations and Public Policy. In: Successful Societies: How
Institutions and Culture Affect Health, edited by P.A. Hall & M. Lamont, pp.82-103. Cambridge: Cambridge
University Press.
19. Marmot, M., 2004. The Status Syndrome: How Your Social Standing Affects Your Health and Life
Expectancy. London: Bloomsbury.
20. Hertzman, C. & Siddiqi, A., 2009. Population Health and the Dynamics of Collective Development. In:
Successful Societies: How Institutions and Culture Affect Health, edited by P.A. Hall & M. Lamont, pp.23-52.
Cambridge: Cambridge University Press.
21. Hall, P.A. & Lamont, M., 2009. Successful Societies: How Institutions and Culture Affect Health.
Cambridge: Cambridge University Press.
22. Nolte, E. & McKee, M., 2011. Variations in Amenable Mortality—Trends in 16 High-Income Nations.
Health Policy, 103(1), pp.47-52.
23. Bambra, C., 2005. Cash versus Services: ‘Worlds of Welfare’ and the Decommodification of Cash
Benefits and Healthcare Services. Journal of Social Policy, 34(2), pp.195-213.
24. Bambra, C., 2005. Worlds of Welfare and the Healthcare Discrepancy. Social Policy and Society, 4(1),
pp.31-41.
25. Marmot, M. & Wilkinson, R.G., 2006. Social Determinants of Health. Oxford: Oxford University Press.
26. Esping-Andersen, G., 1990. The Three Worlds of Welfare Capitalism. London: Polity Press. Available
from http://ess.nsd.uib.no
27. Marmot, M. & Bell, R., 2012. Fair Society, Healthy Lives. Public Health, 126, pp.S4–S10.
28. European Commission, 2017. European Pillar of Social Rights. Retrieved 12 April 2018, from https://
ec.europa.eu/commission/priorities/deeper-and-fairer-economic-and-monetary-union/european-
pillar-social-rights_en
29. UN, 2000. General Comment 14: The Right to the Highest Attainable Standard of Health. Geneva: Office
of the United Nations High Commissioner for Human Rights. Available from http://www.ohchr.org/
Documents/Publications/Factsheet31.pdf
30. Commission on the Social Determinants of Health (CSDH), 2008. Closing the Gap in a Generation:
Health Equity Through Action on the Social Determinants of Health, Geneva: World Health Organization.
31. Mackenbach, J.P., Meerding, W.J. & Kunst, A.E., 2011. Economic Costs of Health Inequalities in the
European Union. Journal of Epidemiology & Community Health, 65(5), pp.412-419.
32. Sen, A., 2008. Why and How is Health a Human Right?. The Lancet, 372(9655), p.2010.
33. Mackenbach, J.P., 2006. Health Inequalities: Europe in Profile. Produced by COI for the Department
of Health. Available from www.who.int/social_determinants/resources/european_inequalities.pdf.
Bibliography
77
34. Beckfield, J., Balaj, M., McNamara, C.L., Huijts, T., Bambra, C. & Eikemo, T.A., 2017. The Health of
European Populations: Introduction to the Special Supplement on the 2014 European Social Survey (ESS)
Rotating Module on the Social Determinants of Health. European Journal of Public Health, 27(suppl_1),
pp.3-7.
35. Eikemo, T.A., Bambra, C., Huijts, T. & Fitzgerald, R., 2017. The First Pan-European Sociological Health
Inequalities Survey of the General Population: The European Social Survey Rotating Module on the
Social Determinants of Health. European Sociological Review, 33(1), pp.137-153.
36. Murtin, F. et al., 2017. Inequalities in Longevity by Education in OECD Countries: Insights from new OECD
Estimates. OECD Statistics Working Papers, 2017/02. Paris: OECD Publishing. doi:10.1787/6b64d9cf-en
37. OECD/European Observatory on Health Systems and Policies, 2017. Denmark: Country Health Profile
2017, State of Health in the EU. Paris and Brussels: OECD Publishing/European Observatory on Health
Systems and Policies. doi:10.1787/888933593475
38. Karanikolos, M., Adany, R. & McKee, M., 2017. The Epidemiological Transition in Eastern and Western
Europe: A Historic Natural Experiment. The European Journal of Public Health, 27(suppl_4), pp.4-8.
39. Jylhä, M., 2009. What is Self-Rated Health and Why Does It Predict Mortality? Towards a Unified
Conceptual Model. Social Science & Medicine, 69(3), pp.307-316.
40. Norman, P. & Bambra, C., 2007. Incapacity or Unemployment? The Utility of an Administrative Data
Source as an Updatable Indicator of Population Health. Population, Space and Place, 13(5), pp.333-352.
41. Kim, D. et al., 2011. The Contextual Effects of Social Capital on Health: A Cross-National Instrumental
Variable Analysis. Social Science & Medicine, 73(12), pp.1689-1697.
42. Eurofound, 2017. European Quality of Life Survey 2016: Quality of Life, Quality of Public Services, and
Quality of Society. Luxembourg: Publications Office of the European Union.
43. McNamara, C.L., Balaj, M., Thomson, K.H., Eikemo, T.A., Solheim, E.F. & Bambra, C., 2017. The
Socioeconomic Distribution of Non-Communicable Diseases in Europe: Findings from the European
Social Survey (2014) Special Module on the Social Determinants of Health. The European Journal of
Public Health, 27(suppl_1), pp.22-26.
44. Dalstra, J.A. et al., 2005. Socioeconomic Differences in the Prevalence of Common Chronic Diseases:
An Overview of Eight European Countries. International Journal of Epidemiology, 34(2), pp.316-326.
45. WHO, 2017. WHO Report on the Global Tobacco Epidemic 2017: Monitoring Tobacco Use and Prevention
Policies. Geneva: World Health Organization.
46. Huijts, T., et al., 2017. Educational Inequalities in Risky Health Behaviours in 21 European Countries:
Findings from the European Social Survey (2014) Special Module on the Social Determinants of Health.
The European Journal of Public Health, 27(suppl_1), pp.63-72.
47. Bellis, M.A. et al., 2016. The Alcohol Harm Paradox: Using a National Survey to Explore How Alcohol
May Disproportionately Impact Health in Deprived Individuals. BMC Public Health, 16(1), p.111, doi:10.1186/
s12889-016-2766-x
Health Inequalities in Europe: Setting the Stage for Progressive Policy Action
78
48. Bennett, I.M., Chen, J., Soroui, J.S. & White, S., 2009. The Contribution of Health Literacy to Disparities
in Self-Rated Health Status and Preventive Health Behaviors in Older Adults. The Annals of Family
Medicine, 7(3), pp.204-211.
49. WHO, 2013. Health 2020: A European Policy Framework and Strategy for the 21st Century. Geneva:
World Health Organization.
50. Sørensen, K., et al., 2015. Health Literacy in Europe: Comparative Results of the European Health
Literacy Survey (HLS-EU). The European Journal of Public Health, 25(6), pp.1053-1058.
51. Bambra, C., Netuveli, G. & Eikemo, T.A., 2010. Welfare State Regime Life Courses: The Development
of Western European Welfare State Regimes and Age-Related Patterns of Educational Inequalities in
Self-Reported Health. International Journal of Health Services, 40(3), pp.399-420.
52. Eikemo, T.A. & Bambra, C., 2008. The Welfare State: A Glossary for Public Health. Journal of
Epidemiology & Community Health, 62(1), pp.3-6.
53. Bambra, C., 2007. ‘Sifting the Wheat from the Chaff’: A Two-Dimensional Discriminant Analysis of
Welfare State Regime Theory. Social Policy & Administration, 41(1), pp.1-28.
54. Ferrera, M., 1996. The ‘Southern’ Model of Welfare in Social Europe, Journal of European Social Policy,
6, pp.17-37.
55. Bambra, C., 2011. Health Inequalities and Welfare State Regimes: Theoretical Insights on a Public
Health ‘Puzzle’. Journal of Epidemiology & Community Health, 65, pp.740-745, doi:10.1136/jech.2011.136333.
56. Eikemo, T.A., Huisman, M., Bambra, C. & Kunst, A.E., 2008. Health Inequalities According to Educational
Level in Different Welfare Regimes: A Comparison of 23 European Countries. Sociology of Health &
Illness, 30(4), pp.565-582.
57. Bambra, C. & Eikemo, T., 2008. Welfare State Regimes, Unemployment and Health: A Comparative
Study of the Relationship between Unemployment and Self-Reported Health in 23 European Countries.
Journal of Epidemiology & Community Health, 63, pp.92–98, doi:10.1136/jech.2008.077354.
58. Briguglio, M. & Bugeja, I., 2011. Exploring Malta’s Welfare Model. Bank of Valletta Review, 43, pp.12-27.
59. Popham, F., Dibben, C. & Bambra, C., 2013. Are Health Inequalities Really Not the Smallest in the
Nordic Welfare States? A Comparison of Mortality Inequality in 37 Countries. Journal of Epidemiology
and Community Health, 67, pp.412-418.
60. Leão, T., Campos-Matos, I., Bambra, C., Russo, G. & Perelman, J., 2018. Welfare States, the Great
Recession and Health: Trends in Educational Inequalities in Self-Reported Health in 26 European
Countries. PloS one, 13(2), p.e0193165.
61. Moran, M., 1999. Governing the Healthcare State. A Comparative Study of the United Kingdom, the
United States and Germany. Manchester: Manchester University Press
62. Wendt, C., 2009. Mapping European Healthcare Systems: A Comparative Analysis of Financing,
Service Provision and Access to Healthcare. Journal of European Social Policy, 19(5), pp.432-445.
63. Wendt, C., 2014. Changing Healthcare System Types. Social Policy & Administration, 48(7), pp.864-
882.
Bibliography
79
64. Wendt, C., Frisina, L. & Rothgang, H., 2009. Healthcare System Types: A Conceptual Framework for
Comparison. Social Policy & Administration, 43(1), pp.70-90.
65. Cylus, J. et al., 2015. United Kingdom: Health System Review. Health Systems in Transition, 17(5), pp.1-
125.
66. OECD/European Observatory on Health Systems and Policies, 2017. United Kingdom: Country
Health Profile 2017, State of Health in the EU. Paris and Brussels: OECD Publishing/European
Observatory on Health Systems and Policies. doi: 10.1787/9789264283589-en
67. Bambra, C., Garthwaite, K. & Hunter, D., 2014. All Things Being Equal: Does It Matter for Equity How
You Organize and Pay for Health Care? A Review of the International Evidence. International Journal of
Health Services, 44(3), pp.457-477.
68. Busse, R. & Blümel, M., 2014. Germany: Health System Review. Health Systems in Transition, 16(2),
pp.1-296.
69. Busse, R., Blümel, M., Knieps, F. & Bärnighausen, T., 2017. Statutory Health Insurance in Germany:
A Health System Shaped by 135 Years of Solidarity, Self-Governance, and Competition. The Lancet,
390(10097), pp.882-897.
70. OECD/European Observatory on Health Systems and Policies, 2017. Germany: Country Health Profile
2017, State of Health in the EU. Paris and Brussels: OECD Publishing/European Observatory on Health
Systems and Policies. doi:10.1787/9789264283398-en
71. Olejaz, M. et al., 2012. Denmark: Health System Review. Health Systems in Transition, 14(2), pp.1 - 192.
72. García-Armesto, S. et al., 2010. Spain: Health System Review. Health Systems in Transition, 12(4), pp.1-
295.
73. OECD/European Observatory on Health Systems and Policies, 2017. Spain: Country Health Profile
2017, State of Health in the EU. Paris and Brussels: OECD Publishing/European Observatory on Health
Systems and Policies. doi:10.1787/9789264283565-en
74. OECD/European Observatory on Health Systems and Policies, 2017. Poland: Country Health Profile
2017, State of Health in the EU. Paris and Brussels: OECD Publishing/European Observatory on Health
Systems and Policies. doi:10.1787/9789264283510-en
75. Sagan, A. et al., 2011. Poland Health System Review. Health Systems in Transition, 13(8), pp.1–193.
76. OECD/European Observatory on Health Systems and Policies, 2017. France: Country Health Profile
2017, State of Health in the EU. Paris and Brussels: OECD Publishing/European Observatory on Health
Systems and Policies. doi.org/10.1787/9789264283374-en
77. Xu, K. et al., 2007. Protecting Households From Catastrophic Health Spending. Health Affairs, 26(4),
pp.972-983. doi:10.1377/hlthaff.26.4.972
78. WHO, 2017. Health Financing for Universal Coverage: What is Universal Coverage? Retrieved 12
February 2018, from www.who.int/health_financing/universal_coverage_definition/en/.
79. World Health Organization, 2010. Health Systems Financing: The Path to Universal Coverage. Geneva:
World Health Organization.
Health Inequalities in Europe: Setting the Stage for Progressive Policy Action
80
80. OECD, 2017. Health Statistics. http://stats.oecd.org/index.aspx?DataSetCode=HEALTH_STAT
81. OECD/European Observatory on Health Systems and Policies, 2017. Greece: Country Health Profile
2017, State of Health in the EU. Paris and Brussels: OECD Publishing/European Observatory on Health
Systems and Policies. doi:10.1787/888933593570
82. OECD/European Observatory on Health Systems and Policies, 2017. Ireland: Country Health Profile
2017, State of Health in the EU. Paris and Brussels: OECD Publishing/European Observatory on Health
Systems and Policies. doi:10.1787/888933593608
83. Upton, J.E., 2017. Obesity and the Nurses’ Role in Reducing Health Inequalities Through Health
Promotion. Links to Health and Social Care, 2(2), pp.39-51.
84. Reutter, L. & Kushner, K.E., 2012. Health Equity Through Action on Social Determinants of Health:
Taking Up the Challenge in Nursing. Nursing Inquiry, 17(3), pp.269-280.
85. Phelan, J.C., Link, B.G., Diez-Roux, A., Kawachi, I. & Levin, B., 2004. “Fundamental Causes” of Social
Inequalities in Mortality: A Test of the Theory. Journal of Health and Social Behavior, 45(3), pp.265-285.
86. Cylus, J. & Papanicolas, I., 2015. An Analysis of Perceived Access to Healthcare in Europe: How
Universal is Universal Coverage? Health Policy, 119(9), pp.1133–1144.
87. Fjær, E.L., Stornes, P., Borisova, L.V., McNamara, C.L. & Eikemo, T.A., 2017. Subjective Perceptions of
Unmet Need for Healthcare in Europe Among Social Groups: Findings from the European Social Survey
(2014) Special Module on the Social Determinants of Health. The European Journal of Public Health,
27(suppl_1), pp.82-89.
88. Legido-Quigley, H., Urdaneta, E., Gonzalez, A., La Parra, D., Muntaner, C., Alvarez-Dardet, C., Martin-
Moreno, J.M. & McKee, M., 2013. Erosion of Universal Health Coverage in Spain. The Lancet, 382(9909),
p.1977.
89. Legido-Quigley, H., Pajin, L., Fanjul, G., Urdaneta, E. & McKee, M., 2018. Spain Shows that a Humane
Response to Migrant Health is Possible in Europe. The Lancet Public Health, 3(8), p.e358. doi:10.1016/
S2468-2667(18)30133-6.
90. Kentikelenis, A.E. et al., 2015. How Do Economic Crises Affect Migrants’ Risk of Infectious Disease? A
Systematic-Narrative Review. The European Journal of Public Health, 25(6), pp.937–944.
91. MIGHEAL, 2017. Health Inequalities Among Migrant Population. Athens: National Centre for Social
Research / Trondheim: Norwegian University of Science and Technology.
92. La Parra-Casado, D., Stornes, P. & Solheim, E.F., 2017. Self-Rated Health and Wellbeing Among the
Working-Age Immigrant Population in Western Europe: Findings from the European Social Survey
(2014) Special Module on the Social Determinants of Health. The European Journal of Public Health,
27(suppl_1), pp.40-46.
93. Rechel, B., Mladovsky, P., Ingleby, D., Mackenbach, J.P. & McKee, M., 2013. Migration and Health in an
Increasingly Diverse Europe. The Lancet, 381(9873), pp.1235-1245.
94. Levecque, K. & Van Rossem, R., 2015. Depression in Europe: Does Migrant Integration Have Mental
Health Payoffs? A Cross-National Comparison of 20 European Countries. Ethnicity & Health, 20(1), pp.49-
65.
Bibliography
81
95. European Union Agency for Fundamental Rights, 2011. Migrants in an Irregular Situation: Access
to Healthcare in 10 European Union Member States. Available from http://fra.europa.eu/en/
publication/2012/migrants-irregular-situation-access-healthcare-10-european-union-member-states
96. Hajioff, S. & McKee, M., 2000. The Health of the Roma People: A Review of the Published Literature.
Journal of Epidemiology & Community Health, 54(11), pp.864-869.
97. Sepkowitz, K.A., 2006. Health of the World’s Roma Population. The Lancet, 367(9524), pp.1707-1708.
98. Vokó, Z., Csépe, P., Németh, R., Kósa, K., Kósa, Z., Széles, G. & Ádány, R., 2009. Does Socioeconomic
Status Fully Mediate the Effect of Ethnicity on the Health of Roma People in Hungary?. Journal of
Epidemiology & Community Health, 63(6), pp.455-460.
99. Kolarcik, P., Geckova, A.M., Orosova, O., Van Dijk, J.P. & Reijneveld, S.A., 2009. To What Extent Does
Socioeconomic Status Explain Differences in Health Between Roma and Non-Roma Adolescents in
Slovakia?. Social Science & Medicine, 68(7), pp.1279-1284.
100. Jarcuska, P., Bobakova, D., Uhrin, J., Bobak, L., Babinska, I., Kolarcik, P., Veselska, Z. & Geckova, A.M.,
2013. Are Barriers in Accessing Health Services in the Roma Population Associated with Worse Health
Status Among Roma?. International Journal of Public Health, 58(3), pp.427-434.
101. Janevic, T., Jankovic, J. & Bradley, E., 2012. Socioeconomic Position, Gender, and Inequalities in
Self-Rated Health between Roma and Non-Roma in Serbia. International Journal of Public Health, 57(1),
pp.49-55.
102. European Union, 2014. Report on the Health Status of the Roma Population in the EU and Monitoring
Data Collection in the Area of Roma Health in the Member States. Available from https://ec.europa.eu/
health//sites/health/files/social_determinants/docs/2014_roma_health_report_en.pdf
103. European Union Agency for Fundamental Rights, 2013. Inequalities and Multiple Discrimination
in Access to and Quality of Healthcare. Available from http://fra.europa.eu/en/publication/2013/
inequalities-discrimination-healthcare
104. Chaupain-Guillot, S. & Guillot, O., 2015. Health System Characteristics and Unmet Care Needs in
Europe: An Analysis Based on EU-SILC Data. The European Journal of Health Economics, 16(7), pp.781-
796.
105. OECD/European Observatory on Health Systems and Policies, 2017. Italy: Country Health Profile
2017, State of Health in the EU. Paris and Brussels: OECD Publishing/European Observatory on Health
Systems and Policies. doi:10.1787/888933593627
106. Devaux, M., 2015. Income-Related Inequalities and Inequities in Healthcare Services Utilisation in
18 Selected OECD Countries. The European Journal of Health Economics, 16(1), pp.21-33.
107. Stirbu, I., Kunst, A.E., Mielck, A. & Mackenbach, J.P., 2011. Inequalities in Utilisation of General
Practitioner and Specialist Services in 9 European Countries. BMC Health Services Research, 11(1), p.288.
108. DGS, 2015. A Saúde dos Portugueses—Perspetiva 2015 [The Health of the Portuguese—Perspective
2015]. Lisbon: Directorate-General of Health.
109. Simões, J., Augusto, G.F., Fronteira, I. & Hernández-Quevedo, C., 2017. Portugal: Health System
Review. Health Systems in Transition, 19(2), pp.1-184.
Health Inequalities in Europe: Setting the Stage for Progressive Policy Action
82
110. Palència, L., Espelt, A., Cornejo‐Ovalle, M. & Borrell, C., 2014. Socioeconomic Inequalities in the Use
of Dental Care Services in Europe: What is the Role of Public Coverage?. Community Dentistry and Oral
Epidemiology, 42(2), pp.97-105.
111. Elstad, J.I., 2017. Dental Care Coverage and Income-Related Inequalities in Foregone Dental Care
in Europe During the Great Recession. Community Dentistry and Oral Epidemiology, 45(4), pp.296-302.
112. Guarnizo-Herreño, C.C., Watt, R.G., Pikhart, H., Sheiham, A. & Tsakos, G., 2013. Socioeconomic
Inequalities in Oral Health in Different European Welfare State Regimes. Journal of Epidemiology &
Community Health, pp.jech-2013.
113. Mladovsky, P., Srivastava, D., Cylus, J., Karanikolos, M., Evetovits, T., Thomson, S. & McKee, M., 2012.
Health Policy Responses to the Financial Crisis in Europe. Copenhagen: WHO Regional Office for Europe.
114. Thomson, S. et al., 2015. Economic Crisis, Health Systems and Health in Europe: Impact and Implications
for Policy. Maidenhead: WHO Regional Office for Europe.
115. Fahy, N., 2012. Who is Shaping the Future of European Health Systems? BMJ; 344, p.e1712.
116. Babb, S.L. & Kentikelenis, A.E., 2018. International Financial Institutions as Agents of Neoliberalism. In
The SAGE Handbook of Neoliberalism, edited by D. Cahill, M. Cooper, M. Konings, & D. Primrose, pp.16-27.
Thousand Oaks: SAGE Publications.
117. Kentikelenis, A.E., 2017. Structural Adjustment and Health: A Conceptual Framework and Evidence
on Pathways. Social Science & Medicine, 187, pp.296-305.
118. Schrecker, T., 2016. Globalization, Austerity and Health Equity Politics: Taming the Inequality
Machine, and Why It Matters. Critical Public Health, 26(1), pp.4-13.
119. Burke, S., Thomas, S., Barry, S. & Keegan, C., 2014. Indicators of Health System Coverage and Activity
in Ireland During the Economic Crisis 2008-2014—From ‘More with Less’ to ‘Less with Less’. Health Policy,
117(3), pp.275-278.
120. Burke, S.A., Normand, C., Barry, S. & Thomas, S., 2016. From Universal Health Insurance to Universal
Healthcare? The Shifting Health Policy Landscape in Ireland Since the Economic Crisis. Health Policy,
120(3), pp.235-240.
121. Kentikelenis, A.E., 2015. Bailouts, Austerity and the Erosion of Health Coverage in Southern Europe
and Ireland. European Journal of Public Health, 25(3), pp.365-66.
122. Economou, C., Kaitelidou, D., Kentikelenis, A.E., Sissouras, A. & Maresso, A., 2014. The Impact of
the Financial Crisis on Health and the Health System in Greece. In Economic Crisis, Health Systems
and Health in Europe: Country Experience, edited by A. Maresso et al., pp. 103-42. Copenhagen: WHO/
European Observatory on Health Systems and Policies.
123 Kentikelenis, A.E., 2018. The Social Aftermath of Economic Disaster: Karl Polanyi, Countermovements
in Action, and the Greek Crisis. Socio-Economic Review, 16(1), pp.39-59.
124. Kentikelenis, A. E., M. Karanikolos, A. Reeves, M. McKee, & D. Stuckler. 2014. Austerity and Health in
Greece – Authors’ Reply. The Lancet, 383(9928), pp.1544-45.
125. Kentikelenis, A.E. et al., 2011. Health Effects of Financial Crisis: Omens of a Greek Tragedy. The Lancet,
378(9801), pp.1457-1458.
Bibliography
83
126. Kentikelenis, A.E. et al., 2014. Greece’s Health Crisis: From Austerity to Denialism. The Lancet,
383(9918), pp.748-753.
127. Karanikolos, M. & Kentikelenis, A.E., 2016. Health Inequalities After Austerity in Greece. International
Journal for Equity in Health, 15(83). doi:0.1186/s12939-016-0374-0
128. Ásgeirsdóttir, T.L. et al., 2014. Was the Economic Crisis of 2008 Good for Icelanders? Impact on
Health Behaviors. Economics & Human Biology, 13, pp.1-19.
129. McClure, C.B. et al., 2012. Economic Crisis and Smoking Behaviour: Prospective Cohort Study in
Iceland. BMJ open, 2(5), p.e001386.
130. Eurofound, 2014. Access to Healthcare in Times of Crisis. Luxembourg: Publications Office of the
European Union.
131. Amable, B., 2016. Institutional Complementarities in the Dynamic Comparative Analysis of Capitalism.
Journal of Institutional Economics, 12(1), pp.79-103.
132. Hall, P.A. & Gingerich, D.W., 2009. Varieties of Capitalism and Institutional Complementarities in the
Political Economy: An Empirical Analysis. British Journal of Political Science, 39(3), pp.449-482.
133. Koster, F. & van Vliet, O., 2014. Labour Market Institutions in Europe: Differences, Developments,
Consequences and Reforms. In: Let’s Get to Work! The Future of Labour in Europe. Vol. 1., edited by M.
Beblavý, I. Maselli & M. Veselková, pp. 185-206. Brussels: Centre for European Policy Studies. Available
from https://ssrn.com/abstract=2473122
134. Barbieri, P., 2009. Flexible Employment and Inequality in Europe. European Sociological Review,
25(6), pp.621-628.
135. Muntaner, C., Solar, O., Vanroelen, C., Martínez, J.M., Vergara, M., Santana, V., Castedo, A., Kim, I.H.,
Benach, J. & EMCONET Network, 2010. Unemployment, Informal Work, Precarious Employment, Child
Labor, Slavery, and Health Inequalities: Pathways and Mechanisms. International Journal of Health
Services, 40(2), pp.281-295.
136. Bartley, M., Ferrie, J. & Montgomery, S., 2006. Health and Labour Market Disadvantage:
Unemployment, Non-Employment, and Job Insecurity. In Social Determinants of Health, edited by M.
Marmot & R.G. Wilkinson, pp.78-96, Oxford: Oxford University Press.
137. Montgomery, S., Cook, D.G., Bartley, M. & Wadsworth, M.E., 1999. Unemployment, Cigarette Smoking,
Alcohol Consumption and Body Weight in Young British Men. European Journal of Public Health, 8,
pp.21-27
138. Luoto, R., Poikolainen, K. & Uutela, A., 1998. Unemployment, Sociodemographic Background and
Consumption of Alcohol Before and During the Economic Recession of the 1990s in Finland. International
Journal of Epidemiology, 27, pp.623-629.
139. Moser, K.A., Fox, A.J. & Jones, D.R., 1984. Unemployment and Mortality in the OPCS Longitudinal
Study. The Lancet, 324, pp.1324-1329.
140. Bambra, C., 2011. Work, Worklessness and the Political Economy of Health. Oxford: Oxford University
Press.
Health Inequalities in Europe: Setting the Stage for Progressive Policy Action
84
141. Popham, F. & Bambra, C., 2010. Evidence from the 2001 English Census on the Contribution of
Employment Status to the Social Gradient in Self-Rated Health. Journal of Epidemiology and Community
Health, 64, pp.277-80.
142. Rodriguez, E., 2001. Keeping the Unemployed Healthy: The Effect of Means-Tested and Entitlement
Benefits in Britain, Germany and the United States. American Journal of Public Health, 91, pp.1403-11.
143. Bartley, M. & Owen C., 1996. Relation Between Socioeconomic Status, Employment, and Health
During Economic Change, 1973-93. BMJ, 313, pp.445-449.
144. Van Vliet, O. & Caminada, K., 2012. Unemployment Replacement Rates Dataset Among 34 Welfare
States, 1971-2009: An Update, Extension and Modification of the Scruggs’ Welfare State Entitlements Data
Set. NEUJOBS Special Report No. 2. doi:10.2139/ssrn.1991214
145. National Audit Office, 2016. Benefit Sanctions. London: HMSO.
146. Tatsiramos, K., 2009. Unemployment Insurance in Europe: Unemployment Duration and Subsequent
Employment Stability. Journal of the European Economic Association, 7(6), pp.1225-1260.
147. Ferrarini, T., Nelson, K. & Sjöberg, O., 2014. Unemployment Insurance and Deteriorating Self-
Rated Health in 23 European Countries. Journal of Epidemiology and Community Health, pp.jech-2013.
doi:10.1136/jech-2013203721
148. Renahy, E., Mitchell, C., Molnar, A., Muntaner, C., Ng, E., Ali, F. & O’Campo, P., 2018. Connections
Between Unemployment Insurance, Poverty and Health: A Systematic Review. The European Journal of
Public Health, 28(2), pp.269-275.
149. Viebrock, E. & Clasen, J., 2009. Flexicurity and Welfare Reform: A Review. Socio-Economic Review,
7(2), pp.305-331.
150. Andersen, T.M. & Svarer, M., 2007. Flexicurity—Labour Market Performance in Denmark. CESifo
Economic Studies, 53(3), pp.389-429.
151. Bonoli, G., 2010. The Political Economy of Active Labor-Market Policy. Politics & Society, 38(4),
pp.435-457.
152. Card, D., Kluve, J. & Weber, A., 2015. What Works? A Meta Analysis of Recent Active Labor Market
Program Evaluations. Journal of the European Economic Association. doi:10.1093/jeea/jvx028
153. Coutts, A.P., Stuckler, D. & Cann, D.J., 2014. The Health and Wellbeing Effects of Active Labor Market
Programs. Wellbeing, pp.1-18. doi:10.1002/9781118539415.wbwell048
154. Stuckler, D., Basu, S., Suhrcke, M., Coutts, A. & McKee, M., 2009. The Public Health Effect of Economic
Crises and Alternative Policy Responses in Europe: An Empirical Analysis. The Lancet, 374(9686), pp.315-
323.
155. Gibson, M. et al., 2018. Welfare to Work Interventions and their Effects on the Health and Well-Being
of Lone Parents and their Children [Review]. Cochrane Database of Systematic Reviews, 5. CD009820
156. Lamartina, S. & Zaghini, A., 2011. Increasing Public Expenditure: Wagner’s Law in OECD Countries.
German Economic Review, 12(2), pp.149-164.
Bibliography
85
157. Helliwell, J. F., Huang, H. & Wang, S., 2017. The Social Foundations of World Happiness. World
Happiness Report 2017, 8.
158. Bambra, C., 2016. Health Divides: Where You Live Can Kill You. Bristol: Policy Press.
159. Copeland, A., Bambra, C., Nylen, L., Kasim, A.S., Riva, M., Curtis, S., & Burstrom, B., 2015. All In It
Together? The Effects of Recession on Population Health and Health Inequalities in England and
Sweden, 1991 to 2010. International Journal of Health Services, 45(45), pp.3-24.
160. Niedzwiedz, C.L., Mitchell, R.J. Shortt, N.K. & Pearce, J.R., 2016. Social Protection Spending and
Inequalities in Depressive Symptoms across Europe. Social Psychiatry and Psychiatric Epidemiology,
51(7), pp.1005-1014.
161. Karanikolos, M., Mladovsky, P., Cylus, J., Thomson, S., Basu, S., Stuckler, D., Mackenbach, J.P. &
McKee, M., 2013. Financial Crisis, Austerity, and Health in Europe. The Lancet, 381(9874), pp.1323-1331.
162. Reeves, A., McKee, M., Basu, S. & Stuckler, D., 2013. The Political Economy of Austerity and
Healthcare: Cross-National Analysis of Expenditure Changes in 27 European Nations. Health Policy, 115,
pp.1995-2011.
163. Sridhar, D. & Woods, N., 2010. Are There Simple Conclusions on How to Channel Health Funding?
The Lancet, 375, pp.1326-1328.
164. Thomas, S., Burke, S. & Barry, S., 2014. The Irish Health-Care System and Austerity: Sharing the Pain.
The Lancet, 383(9928), pp.1545-1546.
165. Reeves, A., McKee, M. & Stuckler, D., 2015. The Attack on Universal Health Coverage in Europe:
Recession, Austerity and Unmet Needs. The European Journal of Public Health, 25(3), pp.364-365.
166. Stuckler, D. & Basu, S., 2009. The International Monetary Fund’s Effects on Global Health: Before
and After the 2008 Financial Crisis. International Journal of Health Services, 39(4), pp.771-781.
167. Agnello, L. & Sousa, R.M., 2014. How Does Fiscal Consolidation Impact on Income Inequality? Review
of Income and Wealth, 60(4), pp.702-726.
168. Ball, L., Furceri, D., Leigh, D. & Loungani, P., 2013. The Distributional Effects of Fiscal Austerity. UN-
DESA Working Paper, 129. New York: United Nations.
169. Mulas-Granados, C., 2005. Fiscal Adjustments and the Short-Term Trade-Off between Economic
Growth and Equality. Hacienda Pública Española/Revista de Economia Pública, 172 (1), pp.61-92.
170. Schaltegger, C.A. & Weder, M., 2014. Austerity, Inequality and Politics. European Journal of Political
Economy, 35, pp.1-22.
171. Eurofound, 2017. Sixth European Working Conditions Survey—Overview Report (2017 Update).
Luxembourg: Publications Office of the European Union.
172. Van der Wel, K.A., Saltkjel, T., Chen, W.H., Dahl, E. & Halvorsen, K., 2018. European Health Inequality
through the ‘Great Recession’: Social Policy Matters. Sociology of Health & Illness, 40(4), pp.750-768.
173. Niebylski, M.L., Redburn, K.A., Duhaney, T. & Campbell, N.R., 2015. Healthy Food Subsidies and
Unhealthy Food Taxation: A Systematic Review of the Evidence. Nutrition, 31(6), pp.787-795.
Health Inequalities in Europe: Setting the Stage for Progressive Policy Action
86
174. Mytton, O.T., Clarke, D. & Rayner, M., 2012. Taxing Unhealthy Food and Drinks to Improve Health. BMJ:
British Medical Journal (Online), 344. doi:10.1136/bmj.e2931
175. Bødker, M., Pisinger, C., Toft, U. & Jørgensen, T., 2015. The Rise and Fall of the World’s First Fat Tax.
Health Policy, 119(6), pp.737-742.
176. European Union, 2001. Directive 2001/77/EC on the Promotion of Electricity Produced from
Renewable Energy Sources in the Internal Electricity Market. Brussels: European Commission.
177. European Union, 2009. Directive 2009/28/EC on the Promotion of the Use of Energy from Renewable
Sources and Amending and Subsequently Repealing Directives 2001/77/EC and 2003/30/EC. Brussels:
European Commission.
178. Marques, A.C. & Fuinhas, J.A., 2012. Are Public Policies Towards Renewables Successful? Evidence
from European Countries. Renewable Energy, 44, pp.109-118.
179. Nicolini, M. & Tavoni, M., 2017. Are Renewable Energy Subsidies Effective? Evidence from Europe.
Renewable and Sustainable Energy Reviews, 74, pp.412-423.
180. Panwar, N.L., Kaushik, S.C. & Kothari, S., 2011. Role of Renewable Energy Sources in Environmental
Protection: A Review. Renewable and Sustainable Energy Reviews, 15(3), pp.1513-1524.
181. Morello-Frosch, R., Zuk, M., Jerrett, M., Shamasunder, B. & Kyle, A.D., 2011. Understanding the
Cumulative Impacts of Inequalities in Environmental Health: Implications for Policy. Health Affairs, 30(5),
pp.879-887.
182. McMichael, A.J., Woodruff, R.E. & Hales, S., 2006. Climate Change and Human Health: Present and
Future Risks. The Lancet, 367(9513), pp.859-869.
183. Patz, J.A., Campbell-Lendrum, D., Holloway, T. & Foley, J.A., 2005. Impact of Regional Climate
Change on Human Health. Nature, 438(7066), pp.310-317.
184. Hunt, A. & Watkiss, P., 2011. Climate Change Impacts and Adaptation in Cities: A Review of the
Literature. Climatic Change, 104(1), pp.13-49.
185. McMichael, A.J., Butler, C.D. & Dixon, J., 2015. Climate Change, Food Systems and Population Health
Risks in their Eco-Social Context. Public Health, 129(10), pp.1361-1368.
186. Acuto, M., 2013. The New Climate Leaders?. Review of International Studies, 39(4), pp.835-857.
187. Barata, M., Ligeti, E., De Simone, G., Dickinson, T., Jack, D., Penney, J., Rahman, M. & Zimmerman, R.,
2011. Climate Change and Human Health in Cities. In: Climate Change and Cities: First Assessment Report
of the Urban Climate Change Research Network, pp.179-213.
188. Lankao, P.R. & Tribbia, J.L., 2009. Assessing Patterns of Vulnerability, Adaptive Capacity and Resilience
Across Urban Centres. World Bank 5th Urban Symposium on Climate Change, Marseille.
189. Lee, T. & Van de Meene, S., 2012. Who Teaches and Who Learns? Policy Learning through the C40
Cities Climate Network. Policy Sciences, 45(3), pp.199-220.
190. Broto, V.C. & Bulkeley, H., 2013. A Survey of Urban Climate Change Experiments in 100 Cities. Global
Environmental Change, 23(1), pp.92-102.
Bibliography
87
191. Dahlgren, G. & Whitehead, M., 1991. Policies and Strategies to Promote Social Equity in Health.
Stockholm: Institute for Future Studies.
192. Marmot, M., 2005. Social Determinants of Health Inequalities. The Lancet, 365(9464), pp.1099-1104.
193. Mackenbach, J.P., 2011. Can we Reduce Health Inequalities? An Analysis of the English Strategy
(1997–2010). Journal of Epidemiology & Community Health, 65(7), pp.568-575.
194. Barr, B., Higgerson, J. & Whitehead, M., 2017. Investigating the Impact of the English Health
Inequalities Strategy: Time Trend Analysis. BMJ, 358, p.j3310.
195. Barr, B., Bambra, C. & Whitehead, M., 2014. The Impact of NHS Resource Allocation Policy on Health
Inequalities in England 2001-11: Longitudinal Ecological Study. BMJ, 348, p.g3231.
196. Finnish National Agency for Education (OPH), 2017. Education Policy. Retrieved 26 February 2018,
from https://www.oph.fi/english/education_system_education_policy
197. Amin, V., Behrman, J.R. & Spector, T.D., 2013. Does More Schooling Improve Health Outcomes and
Health Related Behaviors? Evidence from UK Twins. Economics of Education Review, 35, pp.134-148.
198. Jürges, H., Reinhold, S. & Salm, M., 2011. Does Schooling Affect Health Behavior? Evidence from the
Educational Expansion in Western Germany. Economics of Education Review, 30(5), pp.862-872.
199. Mirowsky, J. & Ross, C.E., 2003. Education, Social Status, and Health. New York: Routledge.
200. Benach, J. & Muntaner, C., 2007. Precarious Employment and Health: Developing a Research
Agenda. Journal of Epidemiology and Community Health, 61, pp.276-277.
201. Hadden, W., Muntaner, C., Benach, J., Gimeno, D. & Benavides, F.G., 2007. A Glossary for the Social
Epidemiology of Work Organization: Part 3. Terms from the Sociology of Labour Markets. Journal of
Epidemiology and Community Health, 61, pp.6-8.
202. ONS, 2017. Labour Force Survey: Zero-Hours Contracts Data Tables. Retrieved 22
March 2018, from https://www.ons.gov.uk/employmentandlabourmarket/peopleinwork/
earningsandworkinghours/datasets/zerohourssummarydatatables.
203. Bell, D.N. & Blanchflower, D.G., 2013. Underemployment in the UK Revisited. National Institute
Economic Review, 224(1), pp.F8-F22.
204. Lavery, S., 2014. The Politics of Precarious Employment in Europe: Zero Hour Contracts and The
Commodification of Work. Precarious Employment in Europe, FEPS Young Economics Network Working
Paper, Brussels, pp.6-16.
205. Quinlan, M., Mayhew, C. & Bohle, P., 2001. The Global Expansion of Precarious Employment, Work
Disorganisation, and Consequences for Occupational Health: A Review of Recent Research. International
Journal of Health Services, 31, pp.335-414.
206. Ferrie, J.E., Shipley, M.J., Stansfeld, S.A. & Marmot, M., 2002. Effects of Chronic Job Insecurity and
Change in Job Security on Self-Reported Health, Minor Psychiatric Morbidity, Physiological Measures,
and Health-Related Behaviours in British Civil Servants: The Whitehall II Study. Journal of Epidemiology
and Community Health, 56, pp.450-454.
Health Inequalities in Europe: Setting the Stage for Progressive Policy Action
88
207. Kivimäki, M. et al., 2006. Work Stress in the Etiology of Coronary Heart Disease—A Meta-Analysis.
Scandinavian Journal of Work, Environment & Health, 32(6), pp.431-442.
208. Sverke, M., Hellgren, J. & Näswall, K., 2002. No Security: A Meta-Analysis and Review of Job
Insecurity and its Consequences. Journal of Occupational Health Psychology, 7(3), pp.242-264.
209. Bartley, M., 2005. Job Insecurity and Its Effect on Health. Journal of Epidemiology and Community
Health, 59, pp.718-719.
210. Muntaner, C., Anthony, J.C., Crum, R.M. & Eaton, W.W., 1995. Psychosocial Dimensions of Work and
the Risk of Drug Dependence among Adults. American Journal of Epidemiology, 142(2), pp.183–190.
211. Stansfeld, S. & Candy, B., 2006. Psychosocial Work Environment and Mental Health: A Meta-Analytic
Review. Scandinavian Journal of Work, Environment & Health, 32(6), pp.443–462.
212. Kim, T.J. & Von dem Knesebeck, O., 2015. Is an Insecure Job Better for Health than Having No Job at
All? A Systematic Review of Studies Investigating the Health-Related Risks of Both Job Insecurity and
Unemployment. BMC Public Health, 15(1), p.985. doi:10.1186/s12889-015-2313-1
213. Furlong, A. & Cartmel, F., 2004. Vulnerable Young Men in Fragile Labour Markets: Employment,
Unemployment and the Search for Long-Term Security. York: Joseph Rowntree Foundation.
214. Menéndez, M. et al., 2007. Is Precarious Employment More Damaging to Women‘s Health than
Men’s? Social Science & Medicine, 64(4), pp.776-781.
215. Kim, I.H. et al., 2006. The Relationship between Nonstandard Working and Mental Health in a
Representative Sample of the South Korean Population. Social Science & Medicine, 63(3), pp.566-574.
216. Eurofound, 2016. Sustainable Work Throughout the Life Course: National Policies and Strategies.
Luxembourg: Publications Office of the European Union.
217. Kim, I.H., Muntaner, C., Shahidi, F.V., Vives, A., Vanroelen, C. & Benach, J., 2012. Welfare States, Flexible
Employment, and Health: A Critical Review. Health Policy, 104(2), pp.99-127.
218. Häusermann, S. & Schwander, H., 2010. Explaining Welfare Preferences in Dualized Societies. In 17th
Conference of Europeanists, pp. 1-33.
219. Eurofound, 2012. Health and Well-Being at Work: A Report Based on the Fifth European Working
Conditions Survey. Luxembourg: Publications Office of the European Union.
220. Beckfield, J., 2004. Does Income Inequality Harm Health? New Cross-National Evidence. Journal of
Health and Social Behavior, 45(3), pp.231-248.
221. Hu, Y., van Lenthe, F.J. & Mackenbach, J.P., 2015. Income Inequality, Life Expectancy and Cause-
Specific Mortality in 43 European Countries, 1987–2008: A Fixed Effects Study. European Journal of
Epidemiology, 30(8), pp.615–625.
222. Pickett, K.E. & Wilkinson, R.G., 2015. Income Inequality and Health: A Causal Review. Social Science
& Medicine, 128, pp.316-326.
223. Wilkinson, R.G. & Pickett, K.E., 2009. The Spirit Level: Why More Equal Societies Almost Always Do
Better. London: Allen Lane.
Bibliography
89
224. Aittomaki, A., Martikainen, P., Rahkonen, O. & Lahelma, E., 2014. Household Income and Health
Problems During a Period of Labour-Market Change and Widening Income Inequalities—A Study
Among the Finnish Population Between 1987 and 2007. Social Science & Medicine, 100, pp. 84-92.
225. Rostila, M., Kölegård, M.L. & Fritzell, J., 2012. Income Inequality and Self-Rated Health in Stockholm,
Sweden: A Test of the ‘Income Inequality Hypothesis’ on Two Levels of Aggregation. Social Science &
Medicine, 74(7), pp.1091-1098.
226. Wilkinson, R.G. & Pickett, K.E., 2017. The Enemy Between Us: The Psychological and Social Costs of
Inequality. European Journal of Social Psychology, 47(1), pp.11-24.
227. Lancee, B. & Van de Werfhorst, H.G., 2012. Income inequality and participation: A comparison of 24
European countries. Social Science Research, 41(5), pp.1166-1178.
228. Marmot, M. & Commission on Social Determinants of Health, 2007. Achieving Health Equity: From
Root Causes to Fair Outcomes. The Lancet, 370(9593), pp.1153-1163.
229. Suhrcke, M., Sauto Arce, R., McKee, M. & Rocco, L., 2008. The Economic Costs of Ill Health in
the European Region. Copenhagen: WHO Europe. http://www.euro.who.int/__data/assets/pdf_
file/0004/83443/E93695.pdf.
230. Cookson, R., Asaria, M., Ali, S., Shaw, R., Doran T. & Goldblatt, P., 2018. Health Equity Monitoring for
Healthcare Quality Assurance. Social Science & Medicine, 198, pp.148-56.
231. Asaria, M., Doran, T. & Cookson, R., 2016. The Costs of Inequality: Whole-Population Modelling Study
of Lifetime Inpatient Hospital Costs in the English National Health Service by Level of Neighbourhood
Deprivation. Journal of Epidemiology and Community Health, 70(10), pp.990-996.
232. GHK, 2012. A Study on Liability and the Health Costs of Smoking. DG SANCO. London: GHK.
233. Costa, H., Gilmore, A.B., Peeters, S., McKee, M. & Stuckler, D., 2014. Quantifying the Influence of
the Tobacco Industry on EU Governance: Automated Content Analysis of the EU Tobacco Products
Directive. Tobacco Control, 23(6), pp.473-478.
234. Rehm, J., Mathers, C., Popova, S., Thavorncharoensap, M., Teerawattananon, Y. & Patra, J., 2009.
Global Burden of Disease and Injury and Economic Cost Attributable to Alcohol Use and Alcohol Use
Disorders. The Lancet, 373, pp.2223-2233.
235. WHO, 2011. The Global Status Report on Alcohol and Health, 2011. Geneva: World Health Organization.
236. WHO, 2014. Global Status Report on Alcohol and Health, 2014. Geneva: World Health Organization.
237. Hunt, A. & Ferguson, J., 2014. Health Costs in the European Union: How Much is Related to EDCS.
Brussels: The Health and Environmental Alliance.
238. Candari, C.J., Cylus, J. & Nolte, E., 2017. Assessing the Economic Costs of Unhealthy Diets and
Low Physical Activity: An Evidence Review and Proposed Framework. Health Policy Series. Copenhagen:
WHO Regional Office for Europe.
239. Eurofound, 2018. Local Area Aspects of Quality of Life: An Illustrated Framework. Working Paper.
Available from https://www.eurofound.europa.eu/sites/default/files/wpef18008.pdf
Health Inequalities in Europe: Setting the Stage for Progressive Policy Action
90
240. Benos, N. & Zotou, S., 2014. Education and Economic Growth: A Meta-Regression Analysis. World
Development, 64, pp.669-689.
241. Hanushek, E.A. & Woessmann, L., 2008. The Role of Cognitive Skills in Economic Development.
Journal of Economic Literature, 46(3), pp.607-668.
242. De La Fuente, A., 2011. Human Capital and Productivity. Nordic Economic Policy Review, 2(2), pp.103-
132.
243. De La Fuente, A. & Doménech, R., 2006. Human Capital in Growth Regressions: How Much Difference
Does Data Quality Make?. Journal of the European Economic Association, 4(1), pp.1-36.
244. Hanushek, E.A. & Woessmann, L., 2011. How Much Do Educational Outcomes Matter in OECD
Countries?. Economic Policy, 26(67), pp.427-491.
245. Berg, A.G. & Ostry, J.D., 2011. Inequality and Unsustainable Growth: Two Sides of the Same Coin? IMF
Discussion Note. Washington, DC: International Monetary Fund.
246. Dabla-Norris, M.E., Kochhar, M.K., Suphaphiphat, M.N., Ricka, M.F. & Tsounta, E., 2015. Causes
and Consequences of Income Inequality: A Global Perspective. IMF Staff Discussion Note SDN/15/13.
Washington, DC: International Monetary Fund.
247. Marmot, M. & Bell, R., 2018. The Sustainable Development Goals and Health Equity. Epidemiology,
29(1), pp.5-7.
248. European Union, 2017. Sustainable Development in the European Union—Monitoring Report on
Progress Towards the SDGs in an EU Context: 2017 Edition. Luxembourg: Publications Office of the
European Union. doi:10.2785/237722
249. Kindornay, S., 2018. Progressing National SDGs Implementation: An Independent Assessment of
the Voluntary National Review Reports submitted to the United Nations High-level Political Forum on
Sustainable Development. Ottawa: Canadian Council for International Co-operation.
250. Thomson, K., Hillier-Brown, F., Todd, A., McNamara, C., Huijts, T. & Bambra, C., 2018. The Effects
of Public Health Policies on Health Inequalities in High-Income Countries: An Umbrella Review. BMC
Public Health, 18(1), p.869. doi:10.1186/s12889-018-5677-1
251. Gkiouleka, A., Huijts, T., Beckfield, J. & Bambra, C., 2018. Understanding the Micro and Macro Politics
of Health: Inequalities, Intersectionality & Institutions—A Research Agenda. Social Science & Medicine,
200, pp.92-98.
252. WHO, 2018. Health Impact Assessments. Retrieved 3 March 2018, from http://www.euro.who.int/
en/health-topics/environment-and-health/health-impact-assessment.
Bibliography
91

92
Health Inequalities in Europe: Setting the Stage for Progressive Policy Action

FEPS (Foundation for European Progressive Studies) works in closecollaboration with social democratic organisations, and in particularnational foundations and think tanks across Europe, to tackle thechallenges that Europe faces today.
TASC (Think tank for Action on Social Change) is an independentprogressive think-tank whose core focus is addressing inequality andsustaining democracy.
Design: www.neatdesign.ie
While the health of Europeans has improved over recent years, differences by gender, birthplace, and/or socioeconomic background persist. This report maps the extent of such health inequalities, its determinants, and costs to society. The findings indicate that differences in health between and within countries are attributable not only to social and health policies, but also depend on economic policy and the social determinants of health. Thus, holistic policy interventions are required to tackle health inequalities.