Health in the European Unionec.europa.eu/health/ph_publication/eb_health_en.pdf · Report Special...
125
Report Special Eurobarometer Health in the European Union Fieldwork October - November 2006 Publication September 2007 Special Eurobarometer 272e / Wave 66.2 – TNS Opinion & Social This survey was requested by Directorate General SANCO and coordinated by Directorate General COMMUNICATION This document does not represent the point of view of the European Commission. The interpretations and opinions contained in it are solely those of the authors. European Commission
Transcript of Health in the European Unionec.europa.eu/health/ph_publication/eb_health_en.pdf · Report Special...

Report
Special Eurobarometer
Health in the European Union Fieldwork October - November 2006
Publication September 2007
Spe
cial
Eur
obar
omet
er 2
72e
/ Wav
e 66
.2 –
TN
S O
pini
on &
Soc
ial
This survey was requested by Directorate General SANCO and coordinated by Directorate General COMMUNICATION
This document does not represent the point of view of the European Commission. The interpretations and opinions contained in it are solely those of the authors.
European Commission
Special EUROBAROMETER 272 “HEALTH IN THE EUROPEAN UNION”
INTRODUCTION This report addresses several aspects of the health of European Citizens. As part of the European Commission’s Health Strategy, a Public Health Programme1 was adopted for the period 2003-2007. Amongst other objectives, this aims to improve information and knowledge for the development of public health monitoring. This forms the background to the survey results presented here on 'Health in General of European citizens', commissioned by the European Commission’s Health and Consumer Protection Directorate General. This is not the first survey in recent years to deal with such issues, and this report builds upon and offers comparison to reports published in 2006 and 20032. This survey was carried by TNS Opinion & Social, interviewing citizens in the 25 member States, the 2 Accession countries and Croatia between the 6th of September and the 10th of October. The methodology used is that of Eurobarometer surveys as carried out by the Directorate General for Communication (Unit for Public Opinion and Media Monitoring). A technical note on the manner in which interviews were conducted by the Institutes within the TNS Opinion & Social network is appended as an annex to this report. This note indicates the interview methods and the confidence intervals. This report examines the following themes in turn: • The overall state of Europeans’ health, and long-term illness • The effects of some health problems on daily life • The proportion of Europeans taking health preventive measures (check-ups, scans and tests) • Specific health issues - Namely blood pressure, cholesterol and Hormone Replacement Therapy for women. For each of these points, we analyse the results in terms of the European average, before then considering the breakdown of results by country and by socio-demographic variables where relevant3. In addition to this, we have systematically cross-analysed the responses to all the questions with additional classification variables, specifically: • Question 39 – respondents’ self-assessed general health • Question 40 – on whether respondents have a long-term health problem • Question 41 – on limits to daily activity caused by health problems 1 Decision No 1786/2002/EC of the European Parliament and of the Council of 23 September 2002 adopting a programme of Community action in the field of public health (2003-2008) http://eur-lex.europa.eu/LexUriServ/site/en/oj/2002/l_271/l_27120021009en00010011.pdf2 Health and Food, Special Eurobarometer 246 (November 2006), http://ec.europa.eu/public_opinion/archives/ebs/ebs_246_en.pdf Health, Alcohol and Food Safety, Special Eurobarometer 186 (December 2003) http://ec.europa.eu/public_opinion/archives/ebs/ebs_186_en.pdf3 Tables for all questions can be found in the annexes. The totals indicated may show a one point difference with the sum of the individual units. It should also be noted that the total of the percentages in the tables of this report may exceed 100% when the respondent has the possibility to give several answers to the same question.
- 1 -

Special EUROBAROMETER 272 “HEALTH IN THE EUROPEAN UNION”
Eurostat and DG Health and Consumer Protection are developing the European Health Survey System (EHSS)4 for the purpose of implementing and enhancing modules for health surveys. For DG Health and Consumer Protection this the most important tool for the collection of data forming the basis of the European Community Health Indicators (ECHI)5 defined in the Community Public Health Programme. The European Health Survey System (EHSS) is defined as a combination of existing international or national survey instruments with appropriately designed common questions modules. It comprises a Core European Health Interview Survey, managed by the Community Statistical Programme and a feasibility study for a European Health Examination Survey6 is also a part of the system managed by the Public Health Programme. The full implementation of all the components of the EHSS is a costly and technically complex operation needing a long time for implementation at national and European level. The demand and the political requirements for data on the most part of the indicators included in the short list of the ECHI needs a transitional strategy of survey sources to respond to this demand. The present Eurobarometer should be understood then as a transitional answer to some needs of health information.
4 http://ec.europa.eu/health/ph_information/dissemination/reporting/ehss_en.htm 5 http://ec.europa.eu/health/ph_information/dissemination/echi/echi_en.htm 6 http://ec.europa.eu/health/ph_projects/2005/action1/action1_2005_7_en.htm
- 2 -
Special EUROBAROMETER 272 “HEALTH IN THE EUROPEAN UNION”
I. HEALTH IN THE EUROPEAN UNION
1. The health of Europeans: an overview This section provides an overview of the self-perceived health status of EU citizens. We first examine how respondents perceive the condition of their own health, before then looking in more detail at the problem of long-term illness and the incidence of particular health problems. The survey instruments used are the Minimum European Health Module and the questions on chronic conditions and activity restrictions as defined in the Community Statistical Programme. 1.1 Self-perceived general health
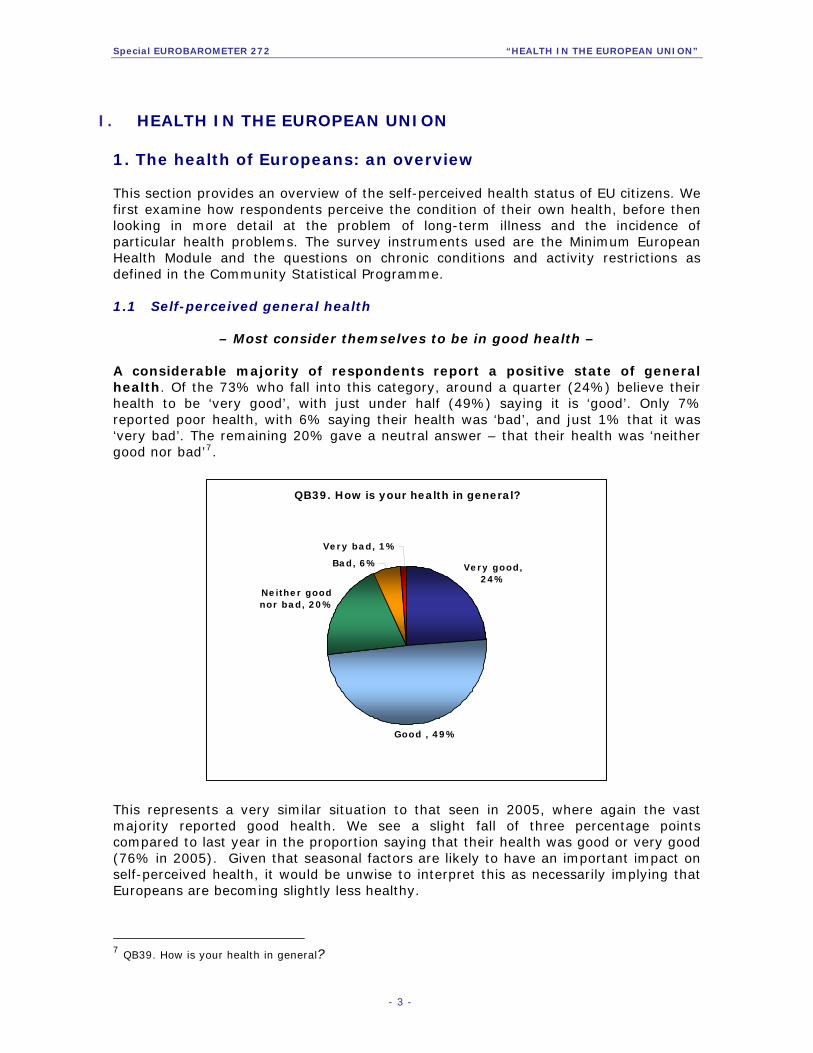
– Most consider themselves to be in good health – A considerable majority of respondents report a positive state of general health. Of the 73% who fall into this category, around a quarter (24%) believe their health to be ‘very good’, with just under half (49%) saying it is ‘good’. Only 7% reported poor health, with 6% saying their health was ‘bad’, and just 1% that it was ‘very bad’. The remaining 20% gave a neutral answer – that their health was ‘neither good nor bad’7.
QB39. How is your health in general?
Very good, 24%
Good , 49%
Bad, 6%
Very bad, 1%
Neither good nor bad, 20%
This represents a very similar situation to that seen in 2005, where again the vast majority reported good health. We see a slight fall of three percentage points compared to last year in the proportion saying that their health was good or very good (76% in 2005). Given that seasonal factors are likely to have an important impact on self-perceived health, it would be unwise to interpret this as necessarily implying that Europeans are becoming slightly less healthy.
7 QB39. How is your health in general?
- 3 -

Special EUROBAROMETER 272 “HEALTH IN THE EUROPEAN UNION”
- 4 -

Special EUROBAROMETER 272 “HEALTH IN THE EUROPEAN UNION”
Self-perceived health is slightly lower in the 10 new Member States, where on average 61% describe a positive state of health compared to 76% in the 15 older Member States. This is reflected in results for individual countries, with Latvia (50%) and Estonia (51%) having the lowest proportion of respondents answering that their health is good or very good. In the two Accession countries and Croatia we also see below average levels of good health (ranging from 60% to 64%). By contrast, at least 8 out of every 10 say they enjoy positive health in Ireland (89%), Denmark, the Netherlands (both 82%), Belgium (81%), Luxembourg and Sweden (both 80%).
– Age and education are important factors in self-assessed health – Looking at results by demographic and social factors we see that - as would be expected - age is an important factor, with 91% of those in the 15-24 age group saying their state of health is good, compared to 52% of those aged 55 and above.
Self-assessed health: Analysis by demographics
How is your health in general?
[NB: ‘Good’ and ‘Very good’ responses aggregated to form ‘Good’ ‘Bad’ and ‘Very bad’ aggregated to form ‘Bad’]
Good Neither
good nor bad
Bad
EU25 73% 20% 7% Sex Male 75% 19% 6% Female 71% 21% 8% Age 15-24 91% 8% 1% 25-39 87% 11% 2% 40-54 75% 19% 6% 55 + 52% 33% 15% Education (End of) 15 55% 31% 14% 16-19 76% 18% 6% 20+ 80% 16% 4% Still Studying 91% 8% 1% Household composition 1 59% 28% 13% 2 68% 24% 8% 3 81% 15% 4% 4+ 83% 14% 3% Respondent occupation scale Self- employed 82% 15% 3% Managers 85% 13% 2% Other white collars 86% 12% 2% Manual workers 82% 15% 3% House persons 68% 23% 9% Unemployed 72% 22% 6% Retired 46% 36% 18% Students 91% 8% 1%
- 5 -
Special EUROBAROMETER 272 “HEALTH IN THE EUROPEAN UNION”
Education also plays an important role, with 55% of those who ended their education at 15 saying they are in good health – 25 percentage points below the proportion of those studying to 20 and above who gave this answer (80%). This is likely to be linked not only to education (and consequent knowledge of good dietary practice etc.) but also to the higher level of income that this group enjoys. We also see that a slightly higher proportion of men than women report a good state of health (75% vs. 71%). Those who live in households of three (81% in good health) or four (83%) people say they have better health than those in two (68%) and, especially, one-person (59%) households. Here a variety of factors may be of relevance, ranging from income levels to the fact that many of the older age group are likely to be living in one and two person households. Finally, with regards to occupation, it can be seen that a lower than average proportion of house persons (68%) say their current health is good. The occupational groups who report the best levels of health are managers (85%) and other white collar workers (86%). Again, this is most likely linked to income. 1.2 Long-term health 1.2.1 Chronic illness – In 2006, more people say they are experiencing long-term health difficulties
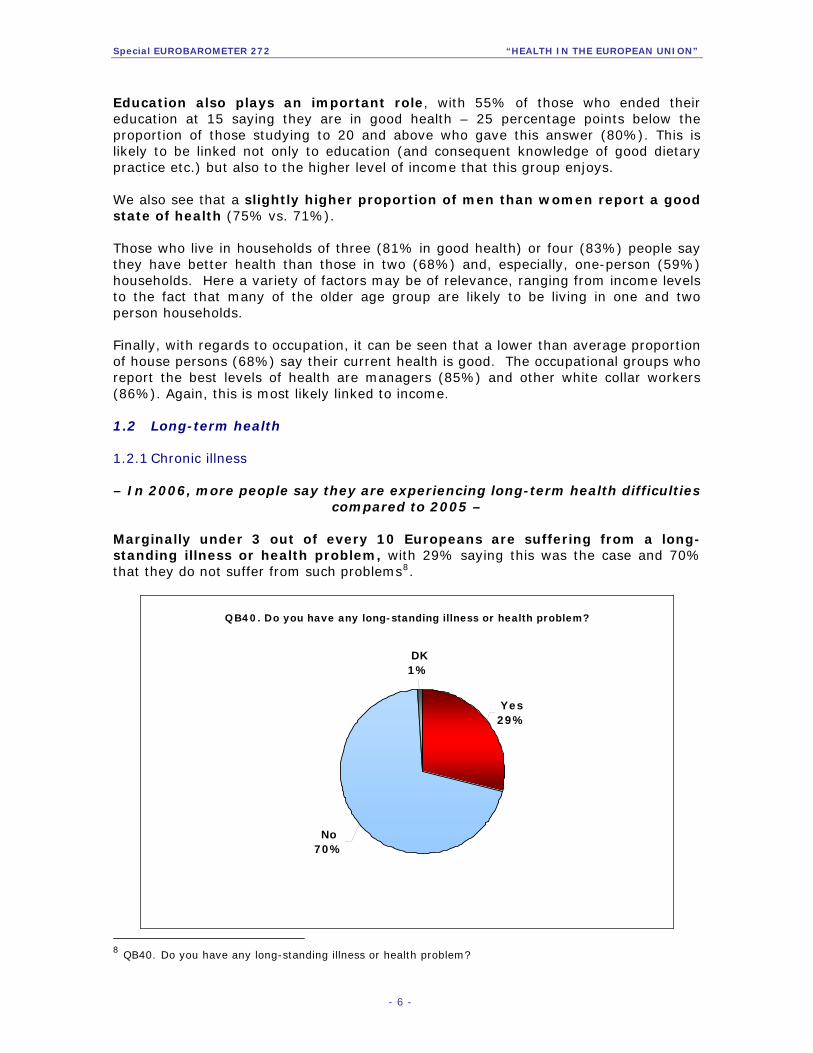
compared to 2005 – Marginally under 3 out of every 10 Europeans are suffering from a long-standing illness or health problem, with 29% saying this was the case and 70% that they do not suffer from such problems8.
QB40. Do you have any long-standing illness or health problem?
No70%
DK1%
Yes29%
8 QB40. Do you have any long-standing illness or health problem?
- 6 -

Special EUROBAROMETER 272 “HEALTH IN THE EUROPEAN UNION”
Compared to the 2005 survey this marks an increase by five percentage points (from 24%) in the proportion of Europeans who say that they are experiencing these difficulties. Whether this is due to an actual increase in the incidence of long-standing health problems or due to an increase in the number of diagnoses being made is unclear.
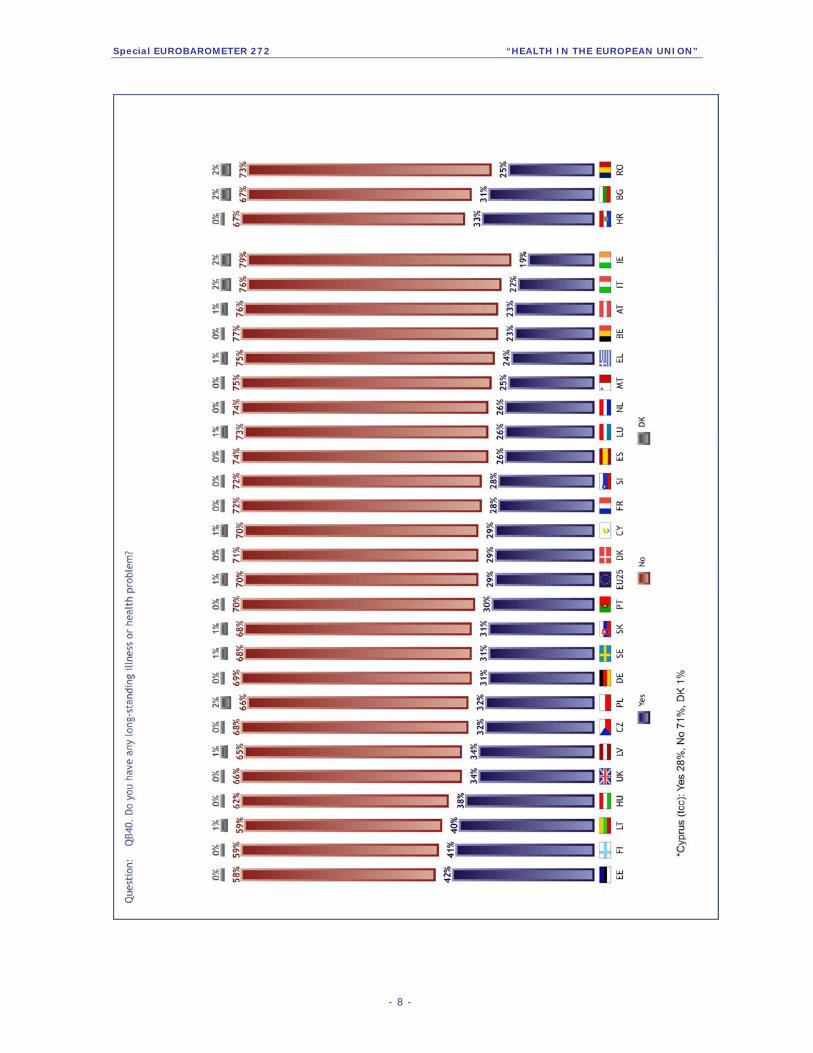
– The North/South divide is narrowing – The report for the 2005 Eurobarometer survey on health in the EU noted a distinction between Northern and Southern Europe on this matter, with more respondents in the Nordic and Baltic countries reporting long-term problems than those in the Mediterranean countries9. One year on this gap is less evident, for example with Denmark (29%) and Sweden (31%) recording proportions of long-term ill close to countries such as Cyprus (29%) and France (28%). That this North/South divide is closing can be seen from the chart below. In all Mediterranean countries, we have seen an increase in the percentage of long-term ill compared to 2005. By contrast there has only been a significant increase in the corresponding figure for one Baltic country (Estonia) and none of the Nordic countries. There have also been significant decreases in the proportion of long-term ill in Denmark (-7 percentage points), Sweden and Lithuania (both -4 percentage points).
Regional Chronic Illness: Selected countries
Do you have any long-standing illness or health problem?
[% answering ‘yes’]
2005 2006 Increase/Decrease
(% points) EU 25 24% 29% +5 Nordic Denmark 36% 29% -7 Sweden 35% 31% -4 Finland 40% 41% +1 Baltic Estonia 36% 42% +6 Latvia 33% 34% +1 Lithuania 44% 40% -4 Mediterranean Greece 17% 24% +7 Spain 20% 26% +6 France 23% 28% +5 Italy 17% 22% +5 Cyprus 21% 29% +8 Malta 23% 25% +2
Full results by country are shown on the following page.
9 Health and Food, Special Eurobarometer 246 (November 2006), p.8. http://ec.europa.eu/public_opinion/archives/ebs/ebs_246_en.pdf
- 7 -
Special EUROBAROMETER 272 “HEALTH IN THE EUROPEAN UNION”
- 8 -

Special EUROBAROMETER 272 “HEALTH IN THE EUROPEAN UNION”
– Similar demographic influences on long-term ill-health as for general state of health –
Concerning long-term health difficulties we see similar social and demographic patterns to those we have seen for self-evaluated health in general: Men give a slightly more positive evaluation than women (26% long-term ill vs. 31% of women); the young are, unsurprisingly, healthier (11% of 15-24 are long term ill vs. 50% of 55+); fewer of the more educated have such problems (24% of those studying to 20 and beyond vs. 44% of those ending education at 15).
Chronic Illness : Analysis by demographics and self-assessed general health
Do you have any long-standing illness or health problem?
[‘Don’t know’ responses not shown. At EU level these amount to 1%]
Yes No EU25 29% 70% Sex Male 26% 73% Female 31% 68% Age 15-24 11% 88% 25-39 15% 85% 40-54 26% 73% 55 + 50% 49% Education (End of) 15 44% 55% 16-19 26% 73% 20+ 24% 75% Still Studying 11% 88% Health in general Good 14% 85% Bad 94% 5% Neither good nor bad 60% 39%
As would be expected, when we examine the group who say their health is ‘bad’ or ‘very bad’ we see that a notably higher proportion say they have a long-term problem (94%).
- 9 -

Special EUROBAROMETER 272 “HEALTH IN THE EUROPEAN UNION”
1.2.2 Treatment for chronic health problems
– One in four of the EU population currently receives medical long-term treatment –
Exactly a quarter of the surveyed population are currently undergoing a long-term medical treatment10. This is very much in line with the 26% who gave the same answer in a 2003 survey11.
QB43. Are you undergoing a medical long-term treatment?
Yes25%
DK\ Refusal1%
No74%
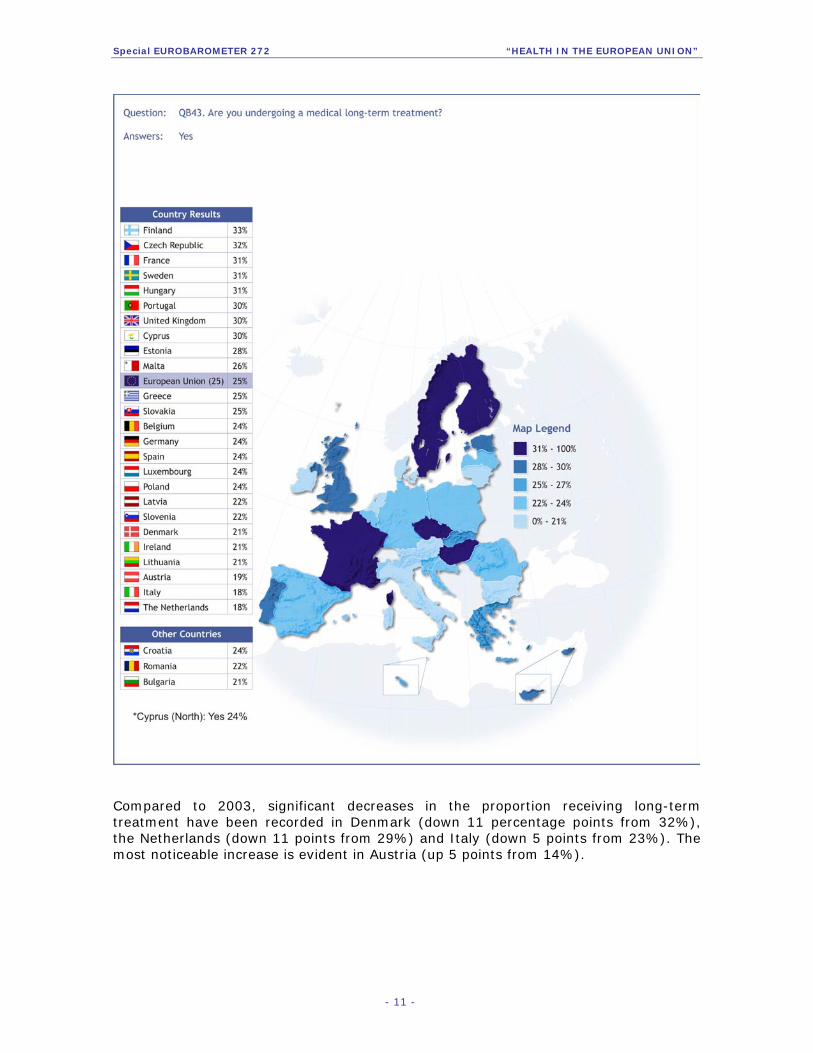
The highest proportions of people undergoing long-term treatment are found in Finland (33%), the Czech Republic (32%), Sweden and Hungary (both 31%). Conversely, only 18% of respondents from the Netherlands and Italy and 19% in Austria fall into this category. Full results are shown on the following page.
10 QB43. Are you undergoing a medical long-term treatment? 11 Health, Alcohol and Food Safety, Special Eurobarometer 186 (December 2003), p.6. The question was asked in a slightly different form in this survey: Are you undergoing a long-term treatment?
- 10 -
Special EUROBAROMETER 272 “HEALTH IN THE EUROPEAN UNION”
Compared to 2003, significant decreases in the proportion receiving long-term treatment have been recorded in Denmark (down 11 percentage points from 32%), the Netherlands (down 11 points from 29%) and Italy (down 5 points from 23%). The most noticeable increase is evident in Austria (up 5 points from 14%).
- 11 -
Special EUROBAROMETER 272 “HEALTH IN THE EUROPEAN UNION”
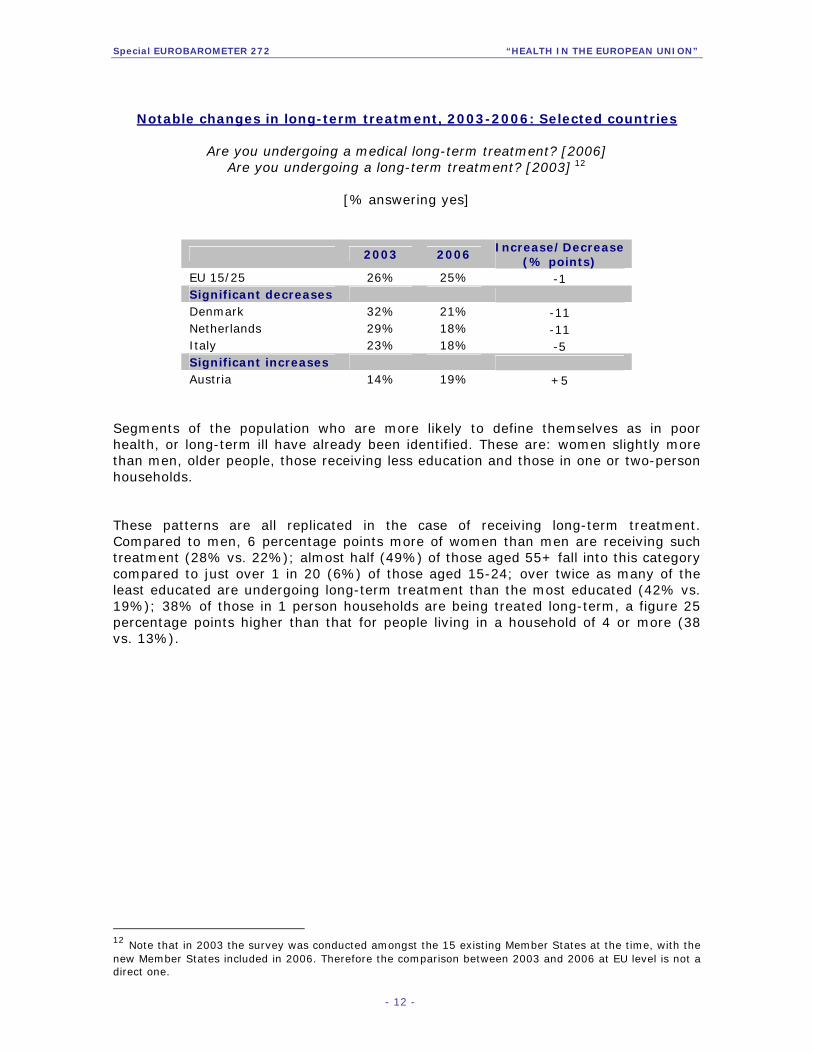
Notable changes in long-term treatment, 2003-2006: Selected countries
Are you undergoing a medical long-term treatment? [2006]
Are you undergoing a long-term treatment? [2003] 12
[% answering yes]
2003 2006 Increase/Decrease
(% points) EU 15/25 26% 25% -1 Significant decreases Denmark 32% 21% -11 Netherlands 29% 18% -11 Italy 23% 18% -5 Significant increases Austria 14% 19% +5
Segments of the population who are more likely to define themselves as in poor health, or long-term ill have already been identified. These are: women slightly more than men, older people, those receiving less education and those in one or two-person households. These patterns are all replicated in the case of receiving long-term treatment. Compared to men, 6 percentage points more of women than men are receiving such treatment (28% vs. 22%); almost half (49%) of those aged 55+ fall into this category compared to just over 1 in 20 (6%) of those aged 15-24; over twice as many of the least educated are undergoing long-term treatment than the most educated (42% vs. 19%); 38% of those in 1 person households are being treated long-term, a figure 25 percentage points higher than that for people living in a household of 4 or more (38 vs. 13%).
12 Note that in 2003 the survey was conducted amongst the 15 existing Member States at the time, with the new Member States included in 2006. Therefore the comparison between 2003 and 2006 at EU level is not a direct one.
- 12 -

Special EUROBAROMETER 272 “HEALTH IN THE EUROPEAN UNION”
Long-term treatment: Analysis by demographics
Are you undergoing a medical long-term treatment?
[‘Don’t know’ responses not shown. At EU level these amount to 1%]
Yes No EU25 25% 74% Sex Male 22% 78% Female 28% 71% Age 15-24 6% 93% 25-39 10% 89% 40-54 21% 78% 55 + 49% 51% Education (End of) 15 42% 58% 16-19 22% 77% 20+ 19% 80% Still Studying 6% 93% Household composition 1 38% 61% 2 33% 66% 3 18% 81% 4+ 13% 86%
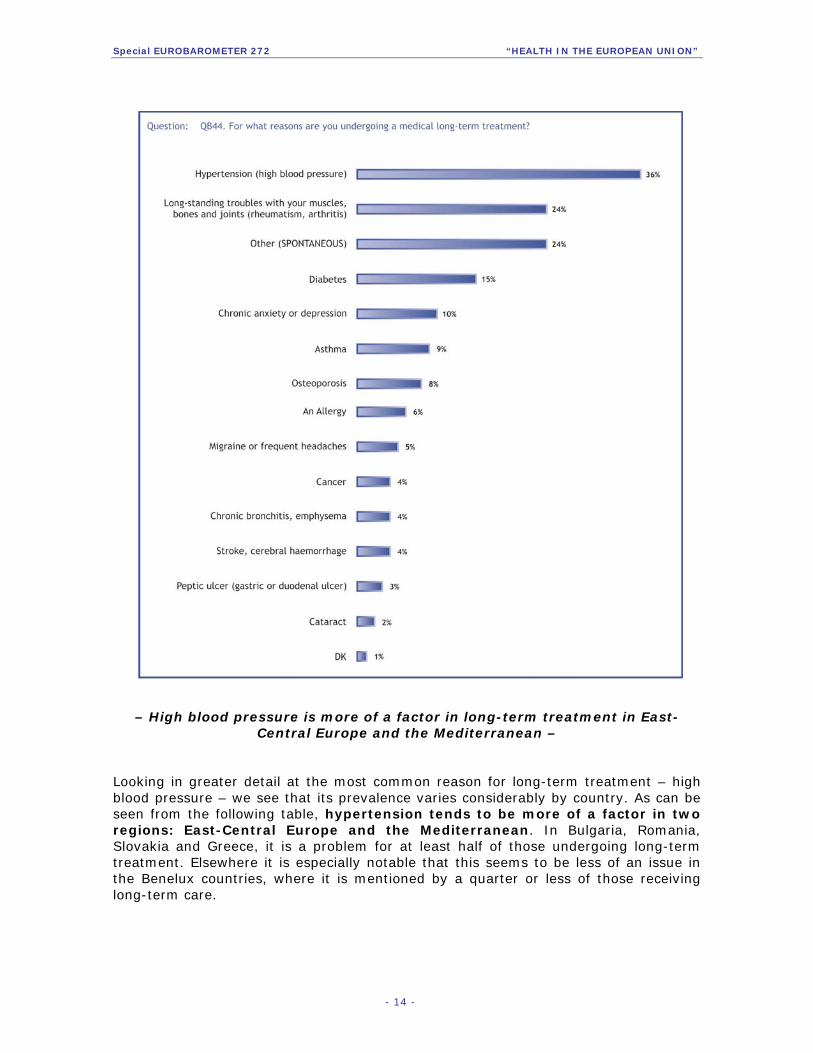
These overall patterns differ somewhat when we examine in more detail the specific medical reasons for long-term treatment. –Over a third of those receiving long-term treatment do so due to high blood
pressure – The most common reason for respondents to be receiving long-term medical treatment is high blood pressure (Hypertension). Over a third (36%) of respondents who are currently receiving long-term medical attention mentioned this as forming part of the basis or the sole reason for such care13. This is followed by muscle, bone and joint problems, which were mentioned by 24% of those undergoing long-term treatment. Diabetes was cited by 15%, with mental health troubles in the form of chronic anxiety and depression a factor for 10%. Other named problems were mentioned by less than 10%, although just under a quarter (24%) said that they had a problem other than those included in the list presented to them. The following chart shows in detail the exact reasons underpinning long-term illness amongst EU citizens.
13 QB43. Are you undergoing a medical long-term treatment?
- 13 -
Special EUROBAROMETER 272 “HEALTH IN THE EUROPEAN UNION”
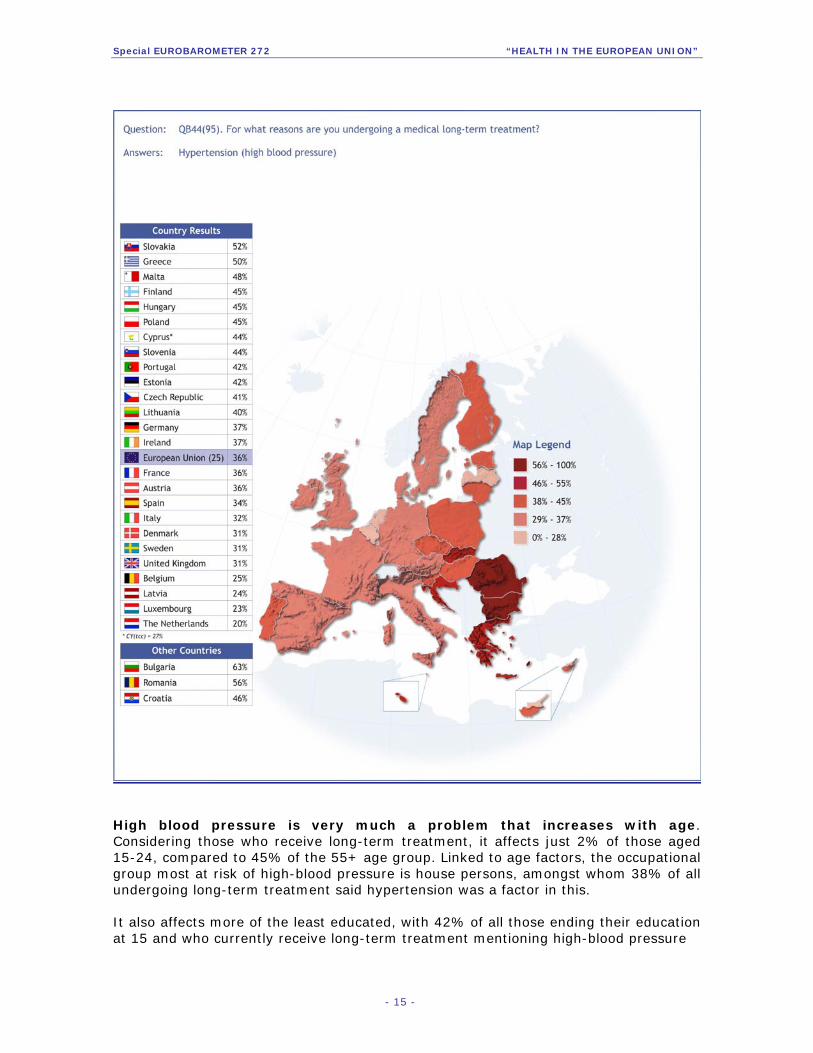
– High blood pressure is more of a factor in long-term treatment in East-Central Europe and the Mediterranean –
Looking in greater detail at the most common reason for long-term treatment – high blood pressure – we see that its prevalence varies considerably by country. As can be seen from the following table, hypertension tends to be more of a factor in two regions: East-Central Europe and the Mediterranean. In Bulgaria, Romania, Slovakia and Greece, it is a problem for at least half of those undergoing long-term treatment. Elsewhere it is especially notable that this seems to be less of an issue in the Benelux countries, where it is mentioned by a quarter or less of those receiving long-term care.
- 14 -
Special EUROBAROMETER 272 “HEALTH IN THE EUROPEAN UNION”
High blood pressure is very much a problem that increases with age. Considering those who receive long-term treatment, it affects just 2% of those aged 15-24, compared to 45% of the 55+ age group. Linked to age factors, the occupational group most at risk of high-blood pressure is house persons, amongst whom 38% of all undergoing long-term treatment said hypertension was a factor in this. It also affects more of the least educated, with 42% of all those ending their education at 15 and who currently receive long-term treatment mentioning high-blood pressure
- 15 -

Special EUROBAROMETER 272 “HEALTH IN THE EUROPEAN UNION”
Hypertension: Analysis by demographic groups
For what reasons are you undergoing a medical long-term treatment?
[Base: All receiving long-term treatment] [% mentioning hypertension]
EU25 36% Sex Male 35% Female 37% Age 15-24 2% 25-39 11% 40-54 27% 55 + 45% Education (End of) 15 42% 16-19 33% 20+ 32% Still Studying 3% Respondent occupation scale Self- employed 29% Managers 27% Other white collars 25% Manual workers 26% House persons 38% Unemployed 24% Retired 44% Students 3%
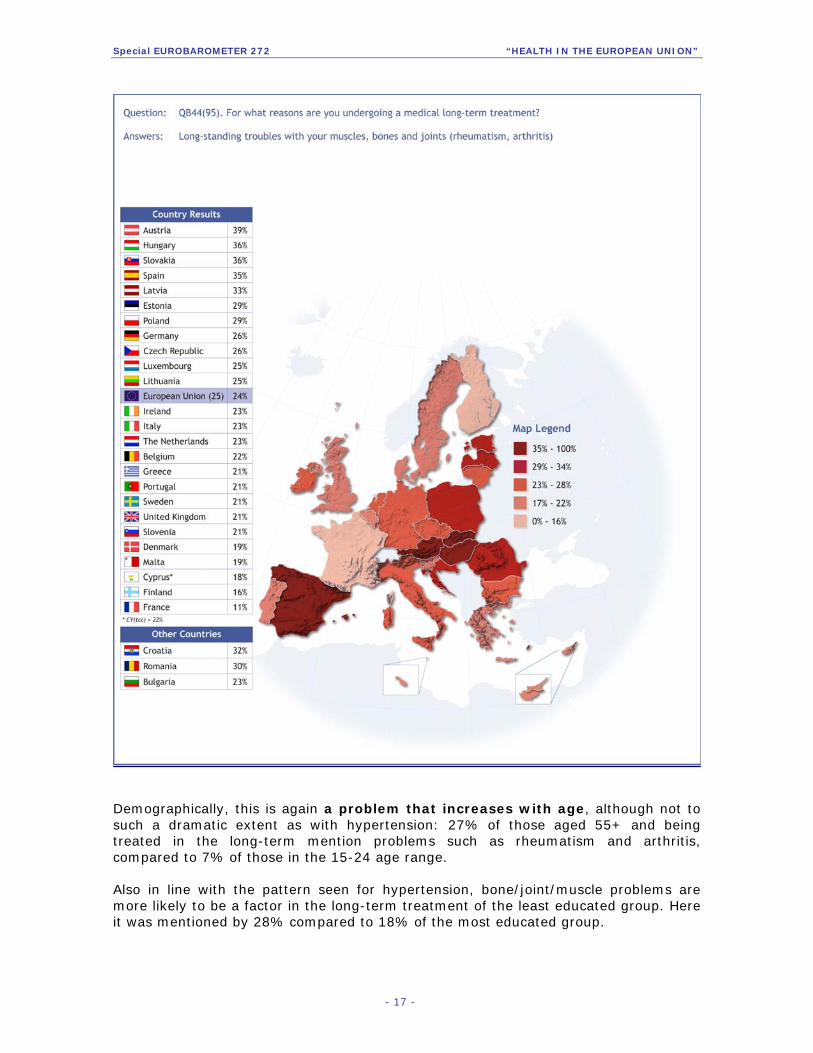
–Muscle, bone and joint problems are more of a basis for long-term treatment
in East-Central Europe – Looking at the second most common complaint underlying long-term treatment – muscle, joint and bone problems – we again see a geographical pattern. Such problems are more likely than average to be cited by respondents in many East-Central European countries, and this is particularly the case in Austria, where it was mentioned by 39% of those receiving long-term treatment. Two of the Baltic states, Latvia and Estonia, also show figures significantly above average (33% and 29% respectively). In France this appears to be much less of a problem, being mentioned by only 11% of those who are receiving long-term care here.
- 16 -
Special EUROBAROMETER 272 “HEALTH IN THE EUROPEAN UNION”
Demographically, this is again a problem that increases with age, although not to such a dramatic extent as with hypertension: 27% of those aged 55+ and being treated in the long-term mention problems such as rheumatism and arthritis, compared to 7% of those in the 15-24 age range. Also in line with the pattern seen for hypertension, bone/joint/muscle problems are more likely to be a factor in the long-term treatment of the least educated group. Here it was mentioned by 28% compared to 18% of the most educated group.
- 17 -

Special EUROBAROMETER 272 “HEALTH IN THE EUROPEAN UNION”
Muscle, bone and joint problems: Analysis by demographic groups
For what reasons are you undergoing a medical long-term treatment?
[Base: All receiving long-term treatment] [% mentioning muscle, bone and joint problems]
EU25 24% Sex Male 17% Female 28% Age 15-24 7% 25-39 17% 40-54 21% 55 + 27% Education (End of) 15 28% 16-19 21% 20+ 18% Still Studying 8% Respondent occupation scale
Self- employed 19% Managers 10% Other white collars 14% Manual workers 20% House persons 32% Unemployed 20% Retired 27% Students 8%
In addition it should be noted that these problems look to afflict women more than men: 28% of women receiving long-term care mentioned bone/joint/muscle problems compared to 17% of men. Finally, amongst economically active occupation groups, such troubles are twice as likely to be a cause for the long-term treatment of manual workers than managers (20% vs. 10%).
– Varying demographic trends for medical conditions by age and gender – Other particular demographic trends that relate to specific problems can be summarised as follows: • Diabetes becomes more of a problem with age, and is a reason for treatment for 19% of the 55+ age group who receive long-term care, compared to 3% of the 15-24 age group. It is twice as likely to be a reason for the least educated to be undergoing long-term treatment as for the most educated (20% vs. 9%). • The most common reasons for the youngest age group to be receiving long-term treatment are asthma (37%) and allergies (27%). Both of these problems appear to decrease considerably with age, being mentioned by only 7% and 3% respectively of the 55+ age group receiving treatment. This could be because such problems are better detected amongst the young, or it may be that those who were born more recently are more susceptible than older respondents. • Women are more likely than men to be in receipt of long-term treatment for chronic anxiety or depression (12% of female long-term treated vs. 7% of male).
- 18 -

Special EUROBAROMETER 272 “HEALTH IN THE EUROPEAN UNION”
• 12% of the female long-term treatment group mention osteoporosis. The figure drops to 2% of the male group. Of the 891 respondents aged between 15 and 39 who receive long-term medical attention, only 2 mentioned osteoporosis – an incidence rate of less than 1%. Of the corresponding group aged 55 and above, this rises to 11%. 1.3 Incidence of individual health problems Related to the above analysis of reasons for current long-term treatment, this survey ascertained available figures for the incidence of the same health problems. These tell us the proportion of the population who currently suffer from the problem, or have done at any time in their life.
– Muscle, bone and joint problems experienced by over a fifth in the EU –
Here we see that just over one-fifth (22%) of the population currently has, or has experienced long-term muscle, bone and joint problems such as rheumatism and arthritis. Just under this proportion (19%) have experienced high blood pressure at some point, with allergies (17%) and migraine/frequent headaches (16%) also featuring prominently14.
14 QB42. Do you have or have you ever had any of the following health problems?
- 19 -

Special EUROBAROMETER 272 “HEALTH IN THE EUROPEAN UNION”
– Considerable variation in geographical spread of conditions – The following represent instances where certain countries diverge considerably from the EU norm: • Allergies are particularly prominent among Swedish respondents, of whom over a third (34%) have experienced these at some point. Apart from Malta, all Mediterranean countries have a below average proportion of allergy sufferers (see map below) • Over a quarter (28%) of Bulgarians say they have experienced high blood pressure, with Lithuanians (27%), Hungarians (27%) and Slovakians (25%) not far behind in this regard. • Muscle, bone and joint problems are most prevalent in Hungary (33%), closely followed by Belgium (31%). Three countries form a distinct grouping where we see very low levels of this kind of problem: Greece (12%), Cyprus (13%) and Ireland 10%). (
• French respondents are twice as likely as the EU average to say they have experienced chronic anxiety or depression at some point in their lives (18% vs. 9%). This is also mentioned by 15% of Estonians, but only 3% of Austrians and Slovenians.
- 20 -

Special EUROBAROMETER 272 “HEALTH IN THE EUROPEAN UNION”
– Higher incidence of many health conditions amongst women –
Analysing these results by gender15, we see that there are several types of problem that have a higher reported incidence amongst women than amongst men. These are: long-term muscle/bone/joint problems (26% vs. 18%), migraines or frequent headaches (22% vs. 11%), allergies (20% vs. 14%), chronic anxiety and depression (12% vs. 6%) and osteoporosis (8% vs. 2%). In the cases of chronic anxiety/depression and migraines/headaches, women are exactly twice as likely to say they have or are suffering from these conditions, and they are four times as likely to report suffering from osteoporosis.
15 Regarding other demographic factors, it is difficult to analyse links between these and the incidence of health problems due to fact that respondents are asked if they have ever suffered from a particular problem. Thus, for example, the oldest age group will figure prominently due to the basic fact that they have lived longer and therefore had a greater number of years in which to experience health problems. Other categories, such as education are linked to age and are therefore also problematic: for example the sub-group of those educated to 20 and above excludes 15-19 year olds. An indication of the exact link between demographics and individual health problems is provided in section 1.2.2 which analyses the question: For what reasons are you undergoing a medical long-term treatment?
- 21 -

Special EUROBAROMETER 272 “HEALTH IN THE EUROPEAN UNION”
2. Health and daily life This section examines the effects of health problems on the day-to-day lives of EU citizens. We first look at the impact of poor health as whole, before then turning to the incidence of restricted activity due to muscle, joint and back pain, as well as the impact of chronic pain. 2.1 Activity restriction due to health problems
– Around 3 in 10 experience long-term disruption of activities due to health difficulties –
Just under 3 out of every 10 Europeans (29%) say that, to some extent, they have been limited in daily activities due to a health problem over the half year before they were interviewed16. Breaking this down, 22% say that they have been ‘somewhat limited’, whilst 7% say that they have been ‘severely limited’. This is a very similar picture to that seen in 2005, when 28% said they had experienced limits to ‘normal’ day-to-day functioning17.
QB41 Over the past 6 months, to what extent, if at all, have you been limited in activities people normally do, because of a health problem?
Would you say you have been…?
DK1%
Severely limited
7%
Not limited at all
70%
Somewhat limited22%
Examining results by country, a pattern is discernable whereby more respondents in the Baltic and East-Central European states say that, due to health difficulties they have problems with maintaining normal activity. For example, we see that in Estonia and Latvia, 9 percentage points more of respondents compared to the EU average say they experience such difficulties, with this difference rising to 10 percentage points in Hungary (39%). The exception to this pattern is Romania (23%, with 7% saying they ‘don’t know’), where we see below average results. 16 QB41. Over the past 6 months, to what extent, if at all, have you been limited in activities people normally do, because of a health problem? Would you say you have been...? 17 Health and Food, Special Eurobarometer 246 (November 2006), p.8. http://ec.europa.eu/public_opinion/archives/ebs/ebs_246_en.pdf
- 22 -

Special EUROBAROMETER 272 “HEALTH IN THE EUROPEAN UNION”
In contrast to this we see different results in many of the Mediterranean countries, particularly Greece where less than one in five (18%) say they have problems with daily activity due to health. It should be noted, however, that the lowest figures of all are recorded outside this region, namely in Ireland (16%; 2% severely limited, 14% somewhat limited)
As would logically be expected, demographic analysis here highlights the factors which we have already seen are linked with general health levels: Age, education, household composition and, to a slight extent, gender.
- 23 -
Special EUROBAROMETER 272 “HEALTH IN THE EUROPEAN UNION”
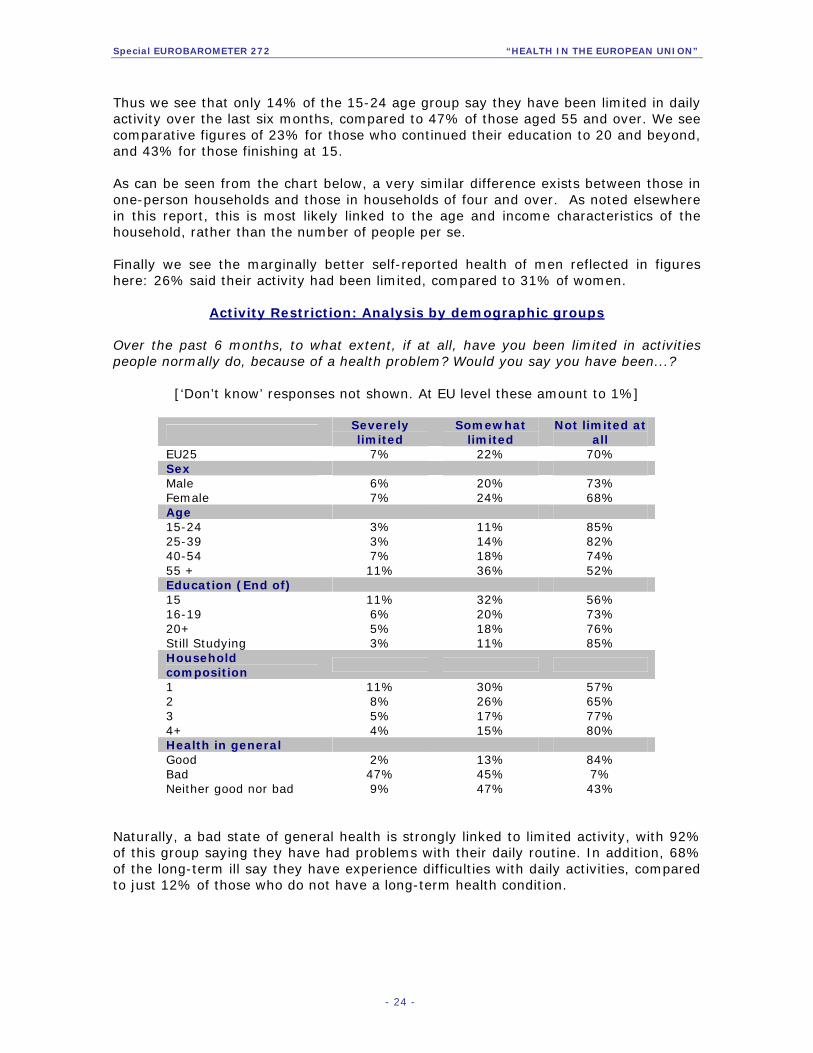
Thus we see that only 14% of the 15-24 age group say they have been limited in daily activity over the last six months, compared to 47% of those aged 55 and over. We see comparative figures of 23% for those who continued their education to 20 and beyond, and 43% for those finishing at 15. As can be seen from the chart below, a very similar difference exists between those in one-person households and those in households of four and over. As noted elsewhere in this report, this is most likely linked to the age and income characteristics of the household, rather than the number of people per se. Finally we see the marginally better self-reported health of men reflected in figures here: 26% said their activity had been limited, compared to 31% of women.
Activity Restriction: Analysis by demographic groups Over the past 6 months, to what extent, if at all, have you been limited in activities people normally do, because of a health problem? Would you say you have been...?
[‘Don’t know’ responses not shown. At EU level these amount to 1%]
Severely limited
Somewhat limited
Not limited at all
EU25 7% 22% 70% Sex Male 6% 20% 73% Female 7% 24% 68% Age 15-24 3% 11% 85% 25-39 3% 14% 82% 40-54 7% 18% 74% 55 + 11% 36% 52% Education (End of) 15 11% 32% 56% 16-19 6% 20% 73% 20+ 5% 18% 76% Still Studying 3% 11% 85% Household composition
1 11% 30% 57% 2 8% 26% 65% 3 5% 17% 77% 4+ 4% 15% 80% Health in general Good 2% 13% 84% Bad 47% 45% 7% Neither good nor bad 9% 47% 43%
Naturally, a bad state of general health is strongly linked to limited activity, with 92% of this group saying they have had problems with their daily routine. In addition, 68% of the long-term ill say they have experience difficulties with daily activities, compared to just 12% of those who do not have a long-term health condition.
- 24 -

Special EUROBAROMETER 272 “HEALTH IN THE EUROPEAN UNION”
2.2 Activity restriction due to musculoskeletal pain Respondents were asked two questions relating to whether their daily lives are, or have been, affected by muscle, joint and back pain. The survey instrument used was defined by the EU Project 'Indicators for Monitoring Musculoskeletal Conditions'18 under the Public Health Programme. One question (45a), measures the incidence of these problems by asking respondents whether they had experienced such problems in the week leading up to their interview19. The second question (45b) examines how many have been affected by chronic pain, lasting for a period of at least 3 months20. – Around one third experienced pain affecting daily life in the week leading up
to their interview – Just under a third (32%) of all respondents say that in the week preceding their interview they experienced muscle, joint, neck or back pain which affected their daily activities.
QB45a. In the last week, have you had any pain affecting your muscles, joints, neck or back which has affected your ability to carry out the
activities of daily living?
No67%
Yes32%
DK1%
Countries reporting particularly high levels of reduced activities due to pain are Croatia (46%) and Finland (44%). At the lower end of the ranking, only 18% of Irish and 21% of Portuguese mentioned this problem.
18 http://ec.europa.eu/health/ph_projects/2000/monitoring/monitoring_project_2000_full_en.htm#1. 19 QB45a. In the last week, have you had any pain affecting your muscles, joints, neck or back which has affected your ability to carry out the activities of daily living? (IF YES) Please tell me which part of the body did you have such pain. 20 QB45b. And have you ever had any pain affecting your muscles, joints, neck or back which has affected your ability to carry out the activities of daily living that lasted for 3 months or more? (IF YES) Please tell me which part of the body did you have such pain.
- 25 -

Special EUROBAROMETER 272 “HEALTH IN THE EUROPEAN UNION”
- 26 -
Special EUROBAROMETER 272 “HEALTH IN THE EUROPEAN UNION”
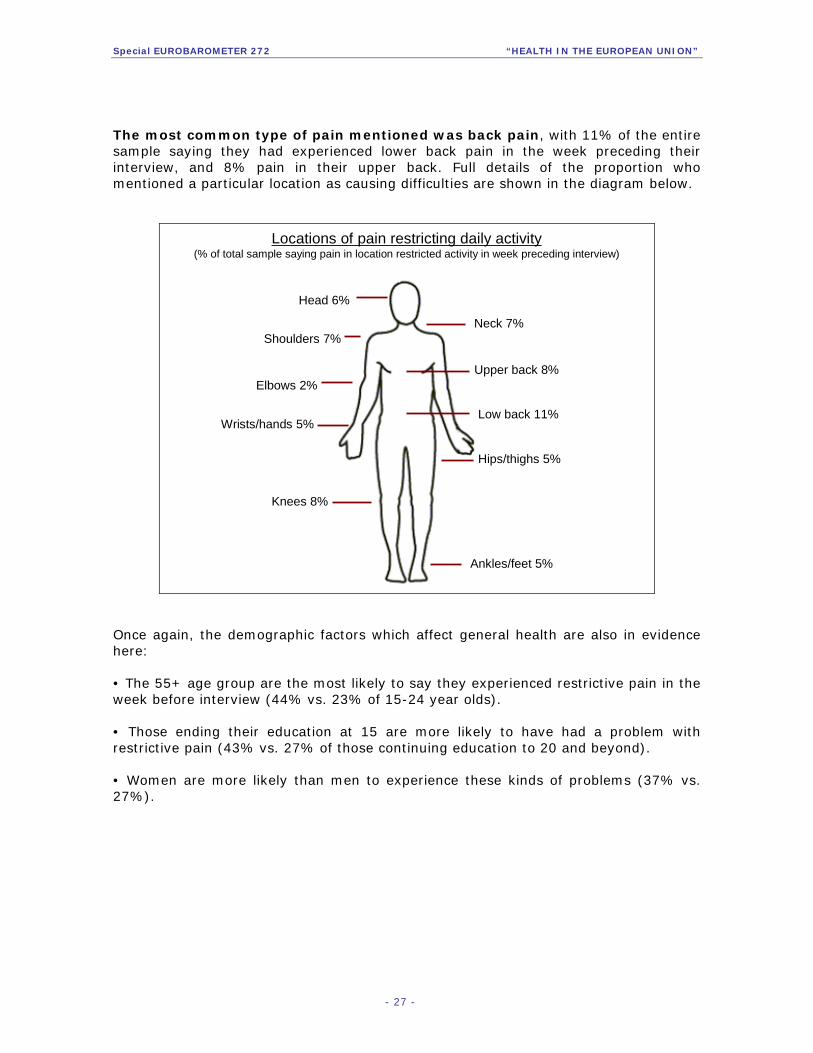
The most common type of pain mentioned was back pain, with 11% of the entire sample saying they had experienced lower back pain in the week preceding their interview, and 8% pain in their upper back. Full details of the proportion who mentioned a particular location as causing difficulties are shown in the diagram below.
Locations of pain restricting daily activity(% of total sample saying pain in location restricted activity in week preceding interview)
Head 6%
Neck 7%Shoulders 7%
Upper back 8%Elbows 2%
Wrists/hands 5%Low back 11%
Hips/thighs 5%
Knees 8%
Ankles/feet 5%
Once again, the demographic factors which affect general health are also in evidence here: • The 55+ age group are the most likely to say they experienced restrictive pain in the week before interview (44% vs. 23% of 15-24 year olds). • Those ending their education at 15 are more likely to have had a problem with restrictive pain (43% vs. 27% of those continuing education to 20 and beyond). • Women are more likely than men to experience these kinds of problems (37% vs. 27%).
- 27 -

Special EUROBAROMETER 272 “HEALTH IN THE EUROPEAN UNION”
Restricted activity due to pain: Analysis by demographic groups
In the last week, have you had any pain affecting your muscles, joints, neck or back which has affected your ability to carry out the activities of daily living? [‘Don’t know’ responses not shown. At EU level these amount to 1%]
Yes No EU25 32% 67% Sex Male 27% 72% Female 37% 62% Age 15-24 23% 77% 25-39 24% 76% 40-54 31% 68% 55 + 44% 55% Education (End of)
15 43% 57% 16-19 31% 68% 20+ 27% 72% Still Studying 20% 79%
– One in four have experienced chronic pain of a magnitude sufficient to
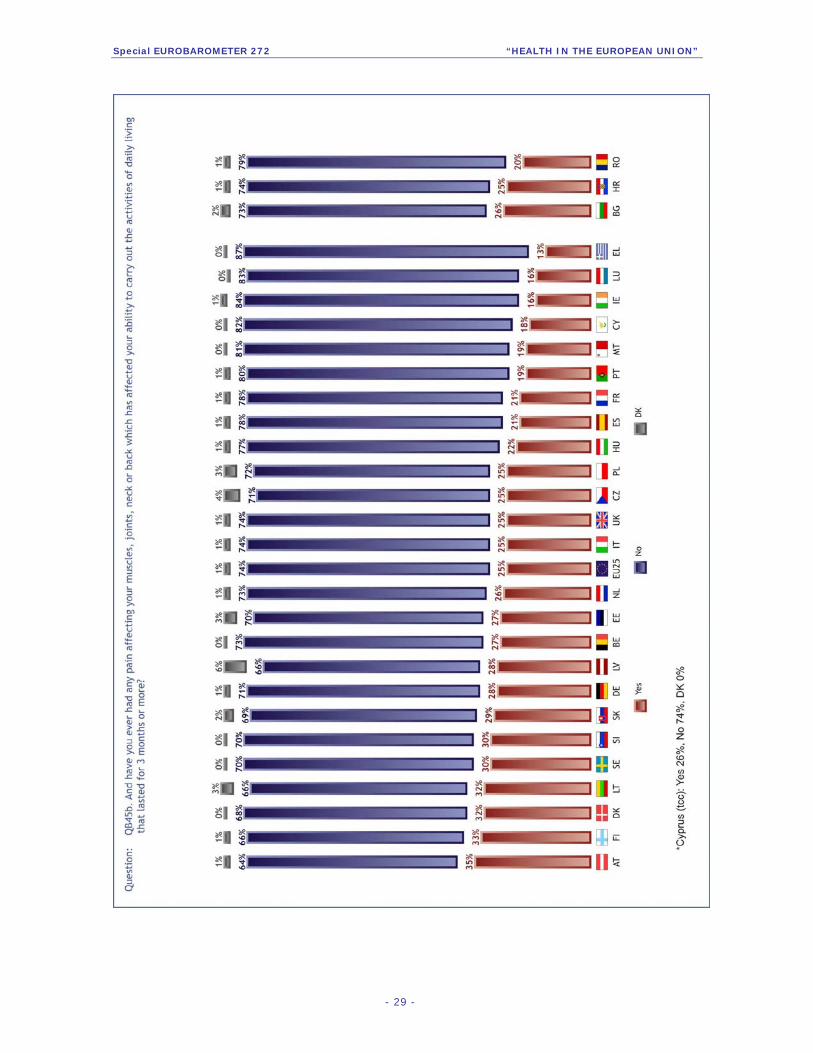
restrict daily activities – Exactly a quarter of all EU respondents say that at some point in their life they have experienced chronic restrictive pain.
QB45b And have you ever had any pain affecting your muscles, joints, neck or back which has affected your ability to carry out the activities of
daily living that lasted for 3 months or more?
DK1%
Yes25%
No74%
Finnish respondents (33%) again show greater than average levels of pain, although the highest levels are found amongst Austrians (35%). Low figures for chronic restrictive pain are evident amongst Irish and Luxembourger respondents (both 16%). Even lower levels are reported by Greek (13%) respondents.
- 28 -
Special EUROBAROMETER 272 “HEALTH IN THE EUROPEAN UNION”
- 29 -

Special EUROBAROMETER 272 “HEALTH IN THE EUROPEAN UNION”
We have already seen that the most common location in the body for respondents to have problems with pain is the back. Results for this question show that almost 1 in 10 (9%) of all respondents have experienced chronic lower back pain at some point in their lives, whilst 6% say this has been a problem with their upper back.
Locations of chronic pain restricting daily activity(% of total sample saying they have experienced pain in location for 3 months or longer)
Head 4%
Neck 5%Shoulders 5%
Upper back 6%Elbows 2%
Wrists/hands 3%Low back 9%
Hips/thighs 5%
Knees 6%
Ankles/feet 3%
As was noted in section 1.3, demographic analysis of a question such as this - asking respondents if they have ever suffered from certain problems - is of limited use compared to one which asks about the same problem in a particular moment in time21. It can, however, be observed that the problem of chronic pain, as with many other health problems, is reported more by women than by men (28% vs. 22%).
21 See footnote above, p.20.
- 30 -
Special EUROBAROMETER 272 “HEALTH IN THE EUROPEAN UNION”
3. Check-Ups In this chapter we examine public habits regarding health check-ups. In order to diagnose and treat medical problems it is essential that citizens are examined at regular intervals. Consequently we pay particular attention to the number of respondents who have been for certain tests over the last year. This is also examined in greater detail to see where the impetus for the tests originates: whether this on the initiative of patients themselves, their doctors, or as part of a wider screening programme. 3.1 General health: sight, hearing and dental check-ups We first examine what may be regarded as general health check-ups. These are examinations and tests that relate to sight and hearing, as well as dental health.
–The majority of EU citizens receive an annual dental check-up; eye and hearing tests are less common –
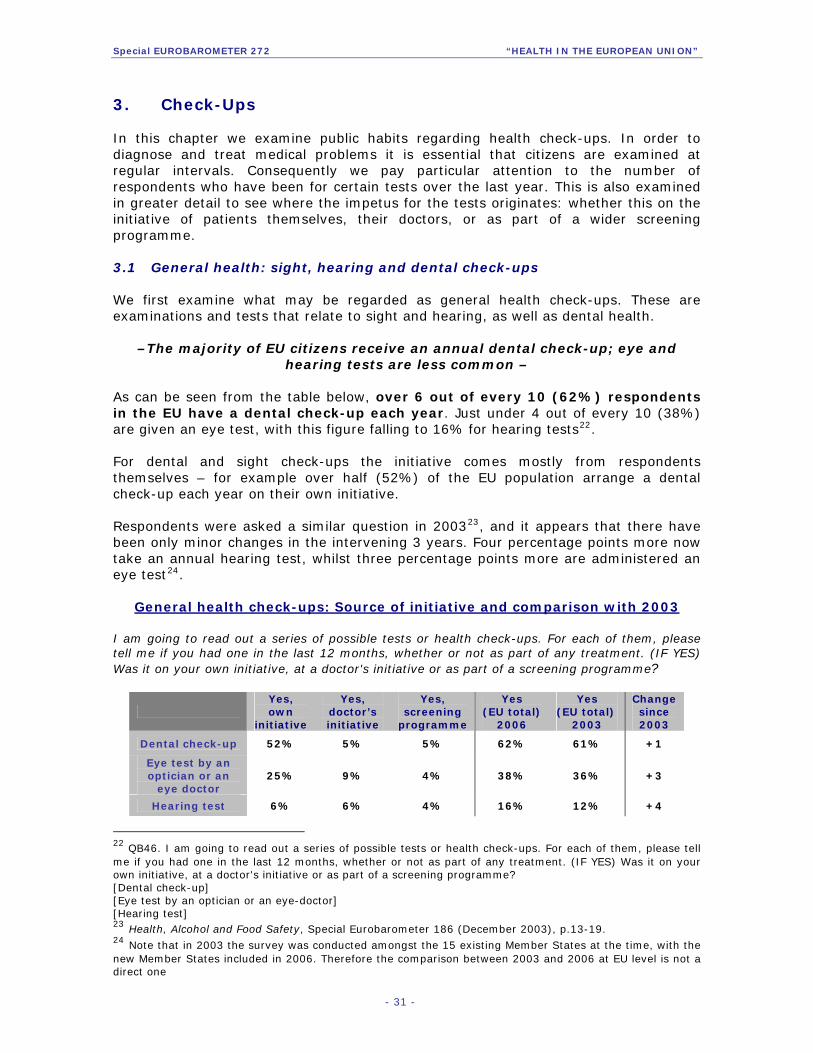
As can be seen from the table below, over 6 out of every 10 (62%) respondents in the EU have a dental check-up each year. Just under 4 out of every 10 (38%) are given an eye test, with this figure falling to 16% for hearing tests22. For dental and sight check-ups the initiative comes mostly from respondents themselves – for example over half (52%) of the EU population arrange a dental check-up each year on their own initiative. Respondents were asked a similar question in 200323, and it appears that there have been only minor changes in the intervening 3 years. Four percentage points more now take an annual hearing test, whilst three percentage points more are administered an eye test24.
General health check-ups: Source of initiative and comparison with 2003 I am going to read out a series of possible tests or health check-ups. For each of them, please tell me if you had one in the last 12 months, whether or not as part of any treatment. (IF YES) Was it on your own initiative, at a doctor's initiative or as part of a screening programme?
Yes, own
initiative
Yes, doctor’s initiative
Yes, screening
programme
Yes (EU total)
2006
Yes (EU total)
2003
Change since 2003
Dental check-up 52% 5% 5% 62% 61% +1
Eye test by an optician or an
eye doctor 25% 9% 4% 38% 36% +3
Hearing test 6% 6% 4% 16% 12% +4
22 QB46. I am going to read out a series of possible tests or health check-ups. For each of them, please tell me if you had one in the last 12 months, whether or not as part of any treatment. (IF YES) Was it on your own initiative, at a doctor's initiative or as part of a screening programme? [Dental check-up] [Eye test by an optician or an eye-doctor] [Hearing test] 23 Health, Alcohol and Food Safety, Special Eurobarometer 186 (December 2003), p.13-19. 24 Note that in 2003 the survey was conducted amongst the 15 existing Member States at the time, with the new Member States included in 2006. Therefore the comparison between 2003 and 2006 at EU level is not a direct one
- 31 -

Special EUROBAROMETER 272 “HEALTH IN THE EUROPEAN UNION”
– Notable variation is seen between countries – Examining the 2006 results by country, we see a considerable degree of variation, with the major differences described below25: • Dental check-ups are most common in the Netherlands and Slovakia. In both these countries, 82% of the population were given a check-up in the last year. Over three-quarters of the population take an annual dental check-up in Luxembourg (81%), Denmark, Germany (both 78%) and Sweden (76%). • It would appear that a particularly comprehensive dental screening programme exists in Sweden. Here 34% of the population received a dental check-up on this basis. Relatively high figures are also recorded in the Czech Republic and Slovakia (both 26%). • Only 36% of Spaniards and of Romanians had a dental check-up over the last year. • Eye tests are most common in Luxembourg (58%). Only here and in the Turkish Cypriot Community (51%) do over half of the population undertake an annual test. • The lowest figures for eye tests were recorded in the two Acceding countries. In both Bulgaria and Romania, only 22% of the population receive these annually. • A minority of citizens in all countries receive annual hearing tests. Only in Luxembourg (27%) and Latvia (25%) do at least a quarter take such tests.
– Dental check-ups received more by women and the most educated, due to greater personal initiative –
Looking in more detail at annual dental check-ups, we see that certain social and demographic groups are more likely to be checked. Firstly, more women than men receive checks every year (64% vs. 59%). Secondly, those aged 55+ are less likely than all other age groups to be checked (52% vs. 65-67% for other age groups). Thirdly, a higher proportion of the more educated receive tests (71% of those with the highest education levels vs. 47% with the lowest).
25 For full results in each country, please refer to the table for QB46 contained in the annexes
- 32 -

Special EUROBAROMETER 272 “HEALTH IN THE EUROPEAN UNION”
Dental check-ups: Analysis by demographics I am going to read out a series of possible tests or health check-ups. For each of them, please tell me if you had one in the last 12 months, whether or not as part of any treatment. (IF YES) Was it on your own initiative, at a doctor's initiative or as part of a screening programme?
Yes Yes, own initiative
Yes, doctor’s initiative
Yes, screening
programme EU25 62% 52% 5% 5% Sex Male 59% 49% 5% 5% Female 64% 54% 5% 5% Age 15-24 66% 51% 7% 8% 25-39 65% 56% 4% 5% 40-54 67% 58% 4% 5% 55 + 52% 43% 5% 4% Education (End of) 15 47% 38% 6% 3% 16-19 65% 55% 4% 6% 20+ 71% 61% 5% 5% Still Studying 71% 53% 9% 9%
For all three demographic categories, these differences arise mainly due to check-ups initiated by the respondents themselves. The proportion being tested as part of a screening programme, or at the behest of their doctor, remains more or less constant amongst social groups whilst we see more variance in check-ups initiated by the respondent. For example, over 6 in 10 (61%) of the most educated had a test on their own initiative, compared to under 4 in 10 (38%) of the least educated.
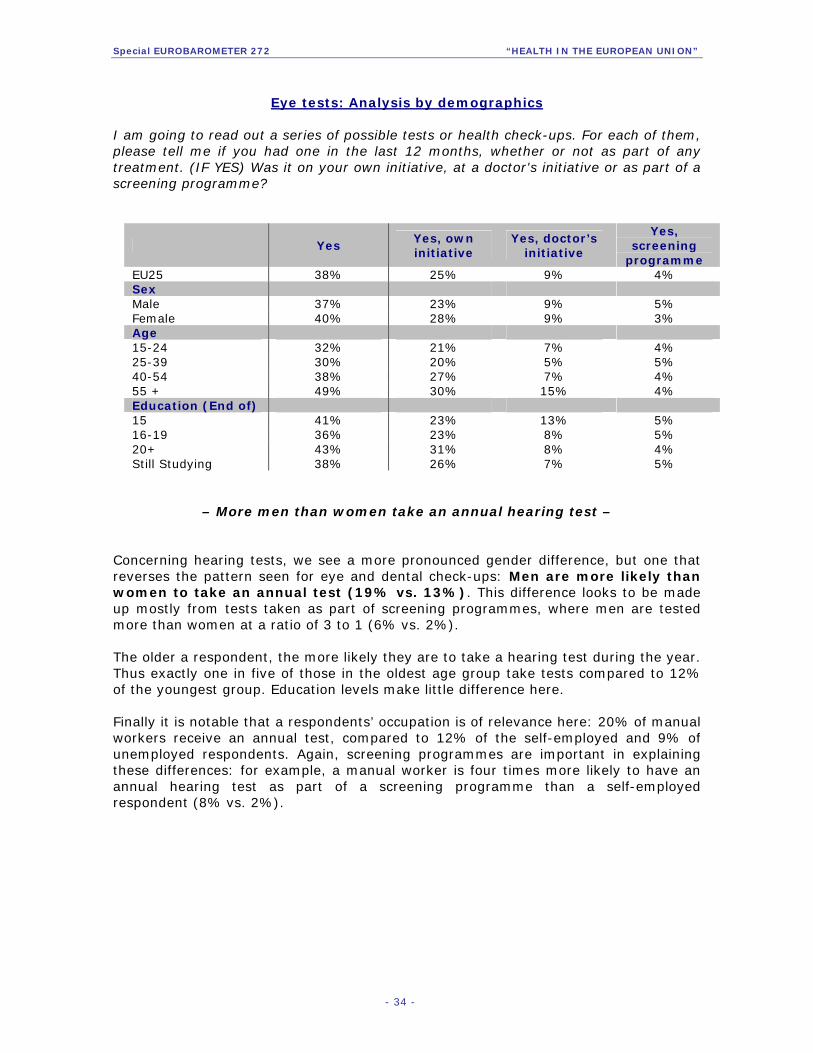
– Older respondents more likely to take an eye test – In contrast to dental check-ups, respondents aged 55 and above are more likely than other age groups to take an annual eye test (49% vs. 32-38% for other age groups). We also see less variance by education levels although those who finished their education between 16 and 19 are less likely than both more and less educated groups to take an annual eye test. With a three percentage points difference between the genders, women are marginally more likely than men to take a yearly eye test (40% vs. 37%).
- 33 -
Special EUROBAROMETER 272 “HEALTH IN THE EUROPEAN UNION”
Eye tests: Analysis by demographics I am going to read out a series of possible tests or health check-ups. For each of them, please tell me if you had one in the last 12 months, whether or not as part of any treatment. (IF YES) Was it on your own initiative, at a doctor's initiative or as part of a screening programme?
Yes Yes, own initiative
Yes, doctor’s initiative
Yes, screening
programme EU25 38% 25% 9% 4% Sex Male 37% 23% 9% 5% Female 40% 28% 9% 3% Age 15-24 32% 21% 7% 4% 25-39 30% 20% 5% 5% 40-54 38% 27% 7% 4% 55 + 49% 30% 15% 4% Education (End of) 15 41% 23% 13% 5% 16-19 36% 23% 8% 5% 20+ 43% 31% 8% 4% Still Studying 38% 26% 7% 5%
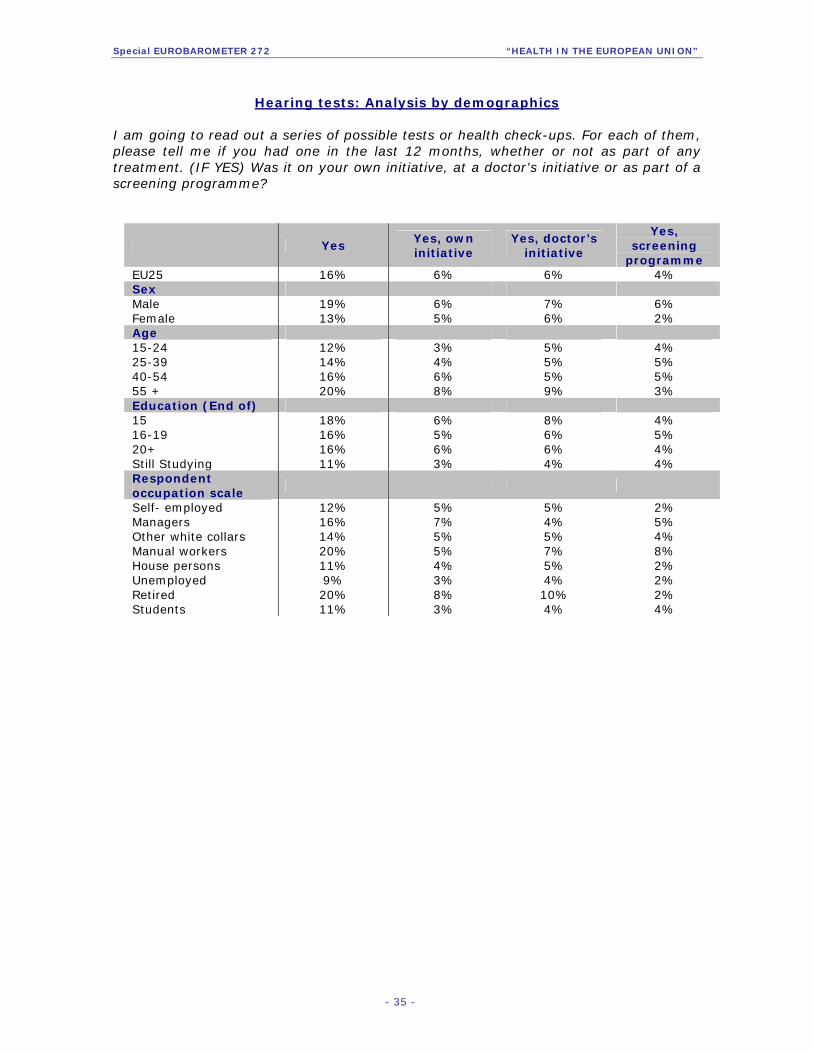
– More men than women take an annual hearing test – Concerning hearing tests, we see a more pronounced gender difference, but one that reverses the pattern seen for eye and dental check-ups: Men are more likely than women to take an annual test (19% vs. 13%). This difference looks to be made up mostly from tests taken as part of screening programmes, where men are tested more than women at a ratio of 3 to 1 (6% vs. 2%). The older a respondent, the more likely they are to take a hearing test during the year. Thus exactly one in five of those in the oldest age group take tests compared to 12% of the youngest group. Education levels make little difference here. Finally it is notable that a respondents’ occupation is of relevance here: 20% of manual workers receive an annual test, compared to 12% of the self-employed and 9% of unemployed respondents. Again, screening programmes are important in explaining these differences: for example, a manual worker is four times more likely to have an annual hearing test as part of a screening programme than a self-employed respondent (8% vs. 2%).
- 34 -
Special EUROBAROMETER 272 “HEALTH IN THE EUROPEAN UNION”
Hearing tests: Analysis by demographics I am going to read out a series of possible tests or health check-ups. For each of them, please tell me if you had one in the last 12 months, whether or not as part of any treatment. (IF YES) Was it on your own initiative, at a doctor's initiative or as part of a screening programme?
Yes Yes, own initiative
Yes, doctor’s initiative
Yes, screening
programme EU25 16% 6% 6% 4% Sex Male 19% 6% 7% 6% Female 13% 5% 6% 2% Age 15-24 12% 3% 5% 4% 25-39 14% 4% 5% 5% 40-54 16% 6% 5% 5% 55 + 20% 8% 9% 3% Education (End of) 15 18% 6% 8% 4% 16-19 16% 5% 6% 5% 20+ 16% 6% 6% 4% Still Studying 11% 3% 4% 4% Respondent occupation scale
Self- employed 12% 5% 5% 2% Managers 16% 7% 4% 5% Other white collars 14% 5% 5% 4% Manual workers 20% 5% 7% 8% House persons 11% 4% 5% 2% Unemployed 9% 3% 4% 2% Retired 20% 8% 10% 2% Students 11% 3% 4% 4%
- 35 -

Special EUROBAROMETER 272 “HEALTH IN THE EUROPEAN UNION”
3.2 Other tests: Scans, heart and cancer tests Here we analyse data on more specific health tests and checks: Namely scans, heart check-ups and cancer tests. With regards to the latter, female respondents were also asked - in a separate question - about some examinations that check for signs of cancer, such as pap smear tests. These are dealt with separately, alongside other tests specific to women, in the section following this one. Male respondents were also asked about one test specific to them only (Prostate Specific Antigen test). Results from this are included in this section.
– Almost four in ten have an X-ray, ultrasound or other scan each year –
As demonstrated by the table below, 38% of respondents had an X-ray, ultrasound, or other scan over the previous year. Just over a quarter (27%) had a heart check-up26.
Cancer tests, heart check-ups and scans: Source of initiative and comparison with 2003
I am going to read out a series of possible tests or health check-ups. For each of them, please tell me if you had one in the last 12 months, whether or not as part of any treatment. (IF YES) Was it on your own initiative, at a doctor's initiative or as part of a screening programme?
Yes, own initiative
Yes, doctor’s initiative
Yes, screening
programme
Yes (EU total)
2006
Yes (EU total)
2003
Change since 2003
X-ray, ultrasound or other scan
11% 23% 4% 38% 33% +5
Heart check-up 7% 16% 4% 27% 24% +3
Prostate Specific Antigen (PSA) Test
4% 7% 2% 13% - -
Other test for cancer 4% 5% 3% 12% - -
Colorectal cancer testing (FOBT)
3% 4% 1% 8% - -
Regarding cancer testing, 13% of men took a Prostate Specific Antigen test27, whilst 8% of the whole sample underwent Colorectal cancer testing28. A further 12% said they had a cancer test that was not covered by these two categories. A low proportion of all these tests were as part of a screening programme. The initiative of a respondent’s doctor was more often the impetus for testing, in particular regarding X-rays, ultrasound and other scans. Here almost a quarter (23%)
26 QB46. I am going to read out a series of possible tests or health check-ups. For each of them, please tell me if you had one in the last 12 months, whether or not as part of any treatment. (IF YES) Was it on your own initiative, at a doctor's initiative or as part of a screening programme? [X-ray, ultrasound, or other scan] [Heart check-up] [Colorectal cancer testing (FOBT)] [Prostate Specific Antigen (PSA) TEST)] [men only] [Other test for cancer] 27 Prostate specific antigen (PSA) is a protein produced by the cells of the prostate gland. Elevated levels of this revealed in blood tests are associated with Prostate Cancer. 28 Colorectal cancer is sometimes also called Bowel cancer or Colon cancer. The test referred to in the questionnaire is a Fecal Occult Blood Test (FOBT), which tests for blood in the stool.
- 36 -
Special EUROBAROMETER 272 “HEALTH IN THE EUROPEAN UNION”
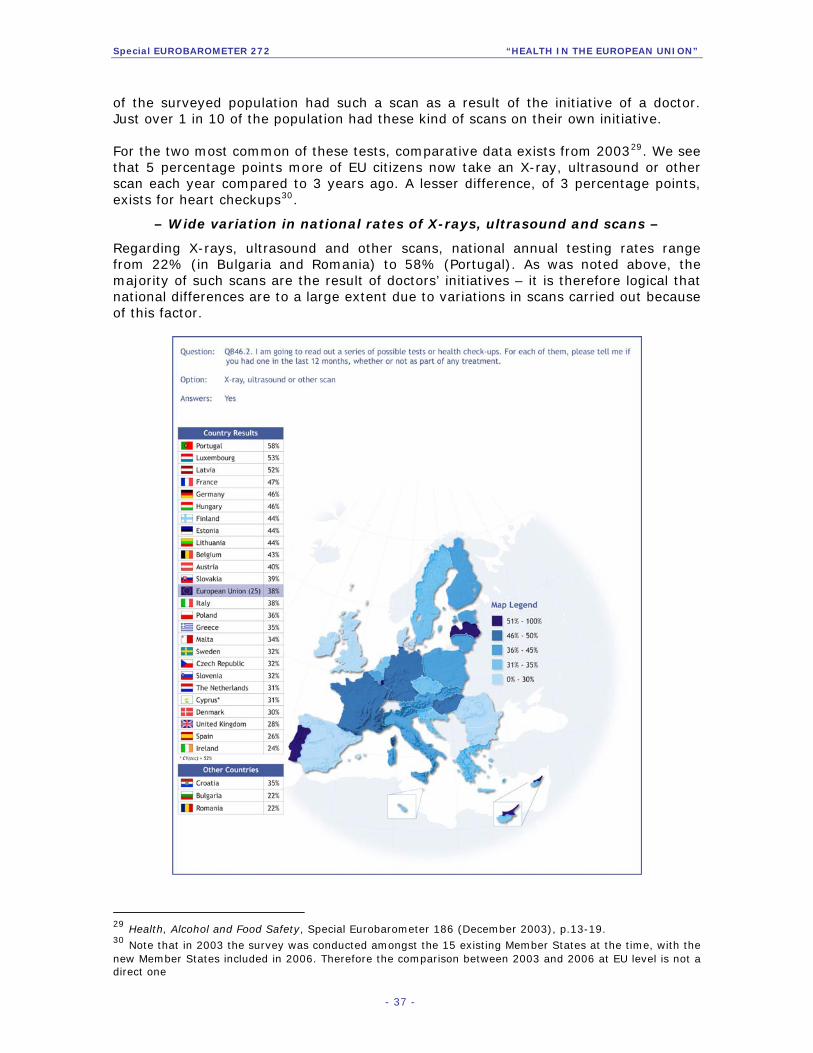
of the surveyed population had such a scan as a result of the initiative of a doctor. Just over 1 in 10 of the population had these kind of scans on their own initiative. For the two most common of these tests, comparative data exists from 200329. We see that 5 percentage points more of EU citizens now take an X-ray, ultrasound or other scan each year compared to 3 years ago. A lesser difference, of 3 percentage points, exists for heart checkups30.
– Wide variation in national rates of X-rays, ultrasound and scans – Regarding X-rays, ultrasound and other scans, national annual testing rates range from 22% (in Bulgaria and Romania) to 58% (Portugal). As was noted above, the majority of such scans are the result of doctors’ initiatives – it is therefore logical that national differences are to a large extent due to variations in scans carried out because of this factor.
29 Health, Alcohol and Food Safety, Special Eurobarometer 186 (December 2003), p.13-19. 30 Note that in 2003 the survey was conducted amongst the 15 existing Member States at the time, with the new Member States included in 2006. Therefore the comparison between 2003 and 2006 at EU level is not a direct one
- 37 -
Special EUROBAROMETER 272 “HEALTH IN THE EUROPEAN UNION”
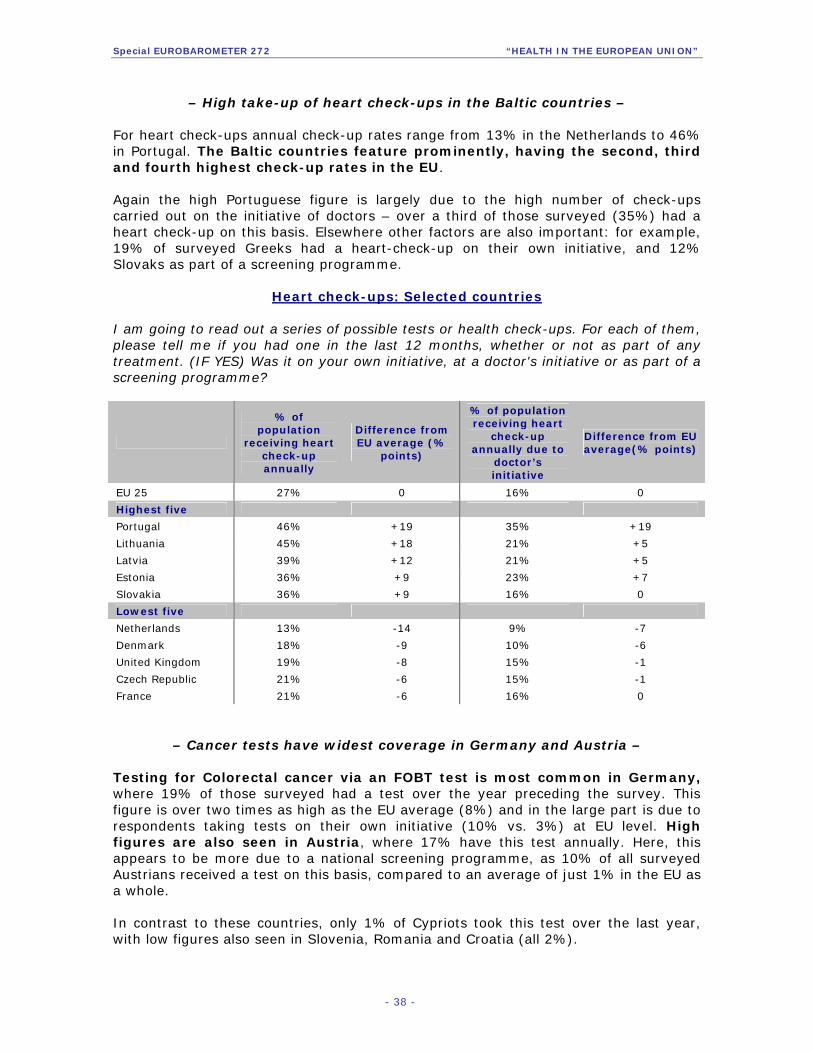
– High take-up of heart check-ups in the Baltic countries – For heart check-ups annual check-up rates range from 13% in the Netherlands to 46% in Portugal. The Baltic countries feature prominently, having the second, third and fourth highest check-up rates in the EU. Again the high Portuguese figure is largely due to the high number of check-ups carried out on the initiative of doctors – over a third of those surveyed (35%) had a heart check-up on this basis. Elsewhere other factors are also important: for example, 19% of surveyed Greeks had a heart-check-up on their own initiative, and 12% Slovaks as part of a screening programme.
Heart check-ups: Selected countries I am going to read out a series of possible tests or health check-ups. For each of them, please tell me if you had one in the last 12 months, whether or not as part of any treatment. (IF YES) Was it on your own initiative, at a doctor's initiative or as part of a screening programme?
% of population
receiving heart check-up annually
Difference from EU average (%
points)
% of population receiving heart
check-up annually due to
doctor’s initiative
Difference from EU average(% points)
EU 25 27% 0 16% 0
Highest five
Portugal 46% +19 35% +19
Lithuania 45% +18 21% +5
Latvia 39% +12 21% +5
Estonia 36% +9 23% +7
Slovakia 36% +9 16% 0
Lowest five
Netherlands 13% -14 9% -7
Denmark 18% -9 10% -6
United Kingdom 19% -8 15% -1
Czech Republic 21% -6 15% -1
France 21% -6 16% 0
– Cancer tests have widest coverage in Germany and Austria – Testing for Colorectal cancer via an FOBT test is most common in Germany, where 19% of those surveyed had a test over the year preceding the survey. This figure is over two times as high as the EU average (8%) and in the large part is due to respondents taking tests on their own initiative (10% vs. 3%) at EU level. High figures are also seen in Austria, where 17% have this test annually. Here, this appears to be more due to a national screening programme, as 10% of all surveyed Austrians received a test on this basis, compared to an average of just 1% in the EU as a whole. In contrast to these countries, only 1% of Cypriots took this test over the last year, with low figures also seen in Slovenia, Romania and Croatia (all 2%).
- 38 -
Special EUROBAROMETER 272 “HEALTH IN THE EUROPEAN UNION”
Austrian screening is again evident in the results for Prostate Specific Antigen Tests. Here 12% of all males surveyed said they had received this test as part of a screening programme, a figure six times higher than the EU rate of 2%. Overall, 28% of Austrian men take this test annually, compared to 13% at EU level. High figures are once more evident amongst German men (21%), although only 2% had this as part of a screening programme. The lowest figures are seen in Bulgaria and Romania (3%), as well as Estonia (4%). Finally, other cancer tests are also most common in Germany (24%) and Austria (20%). The former figure is twice as high as that in the EU as a whole (12%). Low figures are again seen in the two acceding countries (Romania 2%, Bulgaria 5%) and Croatia (3%).
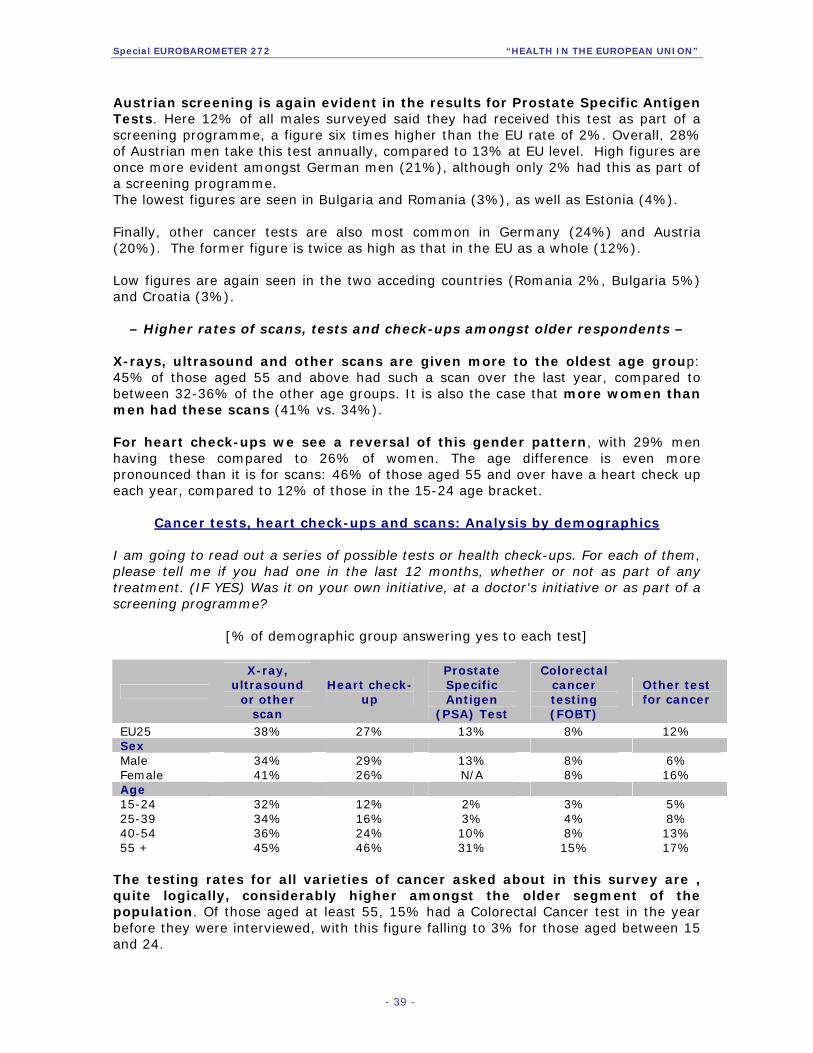
– Higher rates of scans, tests and check-ups amongst older respondents – X-rays, ultrasound and other scans are given more to the oldest age group: 45% of those aged 55 and above had such a scan over the last year, compared to between 32-36% of the other age groups. It is also the case that more women than men had these scans (41% vs. 34%). For heart check-ups we see a reversal of this gender pattern, with 29% men having these compared to 26% of women. The age difference is even more pronounced than it is for scans: 46% of those aged 55 and over have a heart check up each year, compared to 12% of those in the 15-24 age bracket.
Cancer tests, heart check-ups and scans: Analysis by demographics I am going to read out a series of possible tests or health check-ups. For each of them, please tell me if you had one in the last 12 months, whether or not as part of any treatment. (IF YES) Was it on your own initiative, at a doctor's initiative or as part of a screening programme?
[% of demographic group answering yes to each test]
X-ray, ultrasound
or other scan
Heart check-up
Prostate Specific Antigen
(PSA) Test
Colorectal cancer testing (FOBT)
Other test for cancer
EU25 38% 27% 13% 8% 12% Sex Male 34% 29% 13% 8% 6% Female 41% 26% N/A 8% 16% Age 15-24 32% 12% 2% 3% 5% 25-39 34% 16% 3% 4% 8% 40-54 36% 24% 10% 8% 13% 55 + 45% 46% 31% 15% 17%
The testing rates for all varieties of cancer asked about in this survey are , quite logically, considerably higher amongst the older segment of the population. Of those aged at least 55, 15% had a Colorectal Cancer test in the year before they were interviewed, with this figure falling to 3% for those aged between 15 and 24.
- 39 -
Special EUROBAROMETER 272 “HEALTH IN THE EUROPEAN UNION”
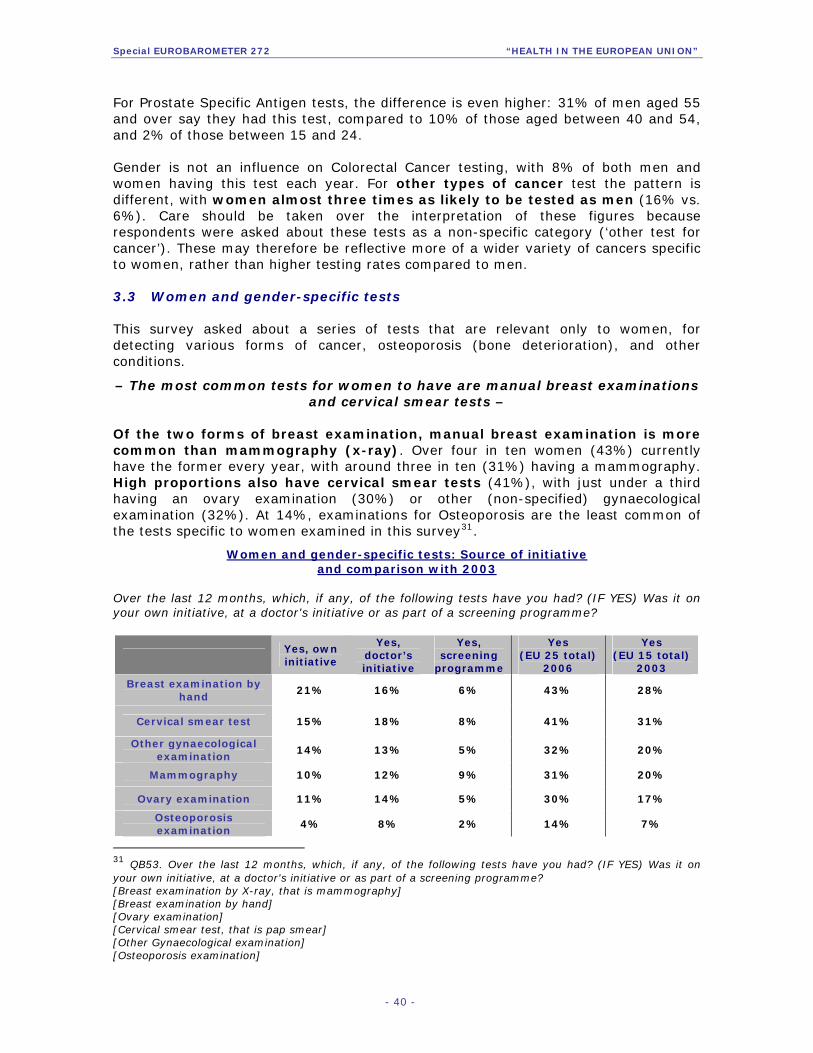
For Prostate Specific Antigen tests, the difference is even higher: 31% of men aged 55 and over say they had this test, compared to 10% of those aged between 40 and 54, and 2% of those between 15 and 24. Gender is not an influence on Colorectal Cancer testing, with 8% of both men and women having this test each year. For other types of cancer test the pattern is different, with women almost three times as likely to be tested as men (16% vs. 6%). Care should be taken over the interpretation of these figures because respondents were asked about these tests as a non-specific category (‘other test for cancer’). These may therefore be reflective more of a wider variety of cancers specific to women, rather than higher testing rates compared to men. 3.3 Women and gender-specific tests This survey asked about a series of tests that are relevant only to women, for detecting various forms of cancer, osteoporosis (bone deterioration), and other conditions. – The most common tests for women to have are manual breast examinations
and cervical smear tests – Of the two forms of breast examination, manual breast examination is more common than mammography (x-ray). Over four in ten women (43%) currently have the former every year, with around three in ten (31%) having a mammography. High proportions also have cervical smear tests (41%), with just under a third having an ovary examination (30%) or other (non-specified) gynaecological examination (32%). At 14%, examinations for Osteoporosis are the least common of the tests specific to women examined in this survey31.
Women and gender-specific tests: Source of initiative and comparison with 2003
Over the last 12 months, which, if any, of the following tests have you had? (IF YES) Was it on your own initiative, at a doctor's initiative or as part of a screening programme?
Yes, own initiative
Yes, doctor’s initiative
Yes, screening
programme
Yes (EU 25 total)
2006
Yes (EU 15 total)
2003 Breast examination by
hand 21% 16% 6% 43% 28%
Cervical smear test 15% 18% 8% 41% 31%
Other gynaecological examination
14% 13% 5% 32% 20%
Mammography 10% 12% 9% 31% 20%
Ovary examination 11% 14% 5% 30% 17%
Osteoporosis examination
4% 8% 2% 14% 7%
31 QB53. Over the last 12 months, which, if any, of the following tests have you had? (IF YES) Was it on your own initiative, at a doctor's initiative or as part of a screening programme? [Breast examination by X-ray, that is mammography] [Breast examination by hand] [Ovary examination] [Cervical smear test, that is pap smear] [Other Gynaecological examination] [Osteoporosis examination]
- 40 -
Special EUROBAROMETER 272 “HEALTH IN THE EUROPEAN UNION”
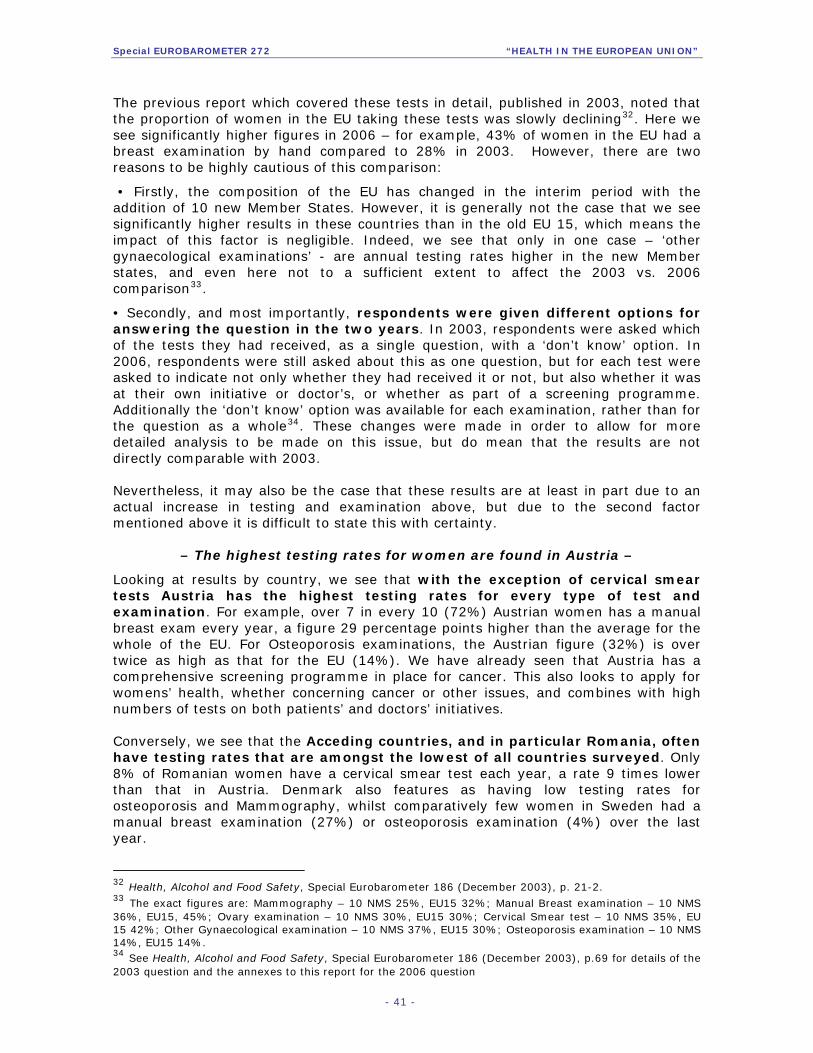
The previous report which covered these tests in detail, published in 2003, noted that the proportion of women in the EU taking these tests was slowly declining32. Here we see significantly higher figures in 2006 – for example, 43% of women in the EU had a breast examination by hand compared to 28% in 2003. However, there are two reasons to be highly cautious of this comparison: • Firstly, the composition of the EU has changed in the interim period with the addition of 10 new Member States. However, it is generally not the case that we see significantly higher results in these countries than in the old EU 15, which means the impact of this factor is negligible. Indeed, we see that only in one case – ‘other gynaecological examinations’ - are annual testing rates higher in the new Member states, and even here not to a sufficient extent to affect the 2003 vs. 2006 comparison33. • Secondly, and most importantly, respondents were given different options for answering the question in the two years. In 2003, respondents were asked which of the tests they had received, as a single question, with a ‘don’t know’ option. In 2006, respondents were still asked about this as one question, but for each test were asked to indicate not only whether they had received it or not, but also whether it was at their own initiative or doctor’s, or whether as part of a screening programme. Additionally the ‘don’t know’ option was available for each examination, rather than for the question as a whole34. These changes were made in order to allow for more detailed analysis to be made on this issue, but do mean that the results are not directly comparable with 2003. Nevertheless, it may also be the case that these results are at least in part due to an actual increase in testing and examination above, but due to the second factor mentioned above it is difficult to state this with certainty.
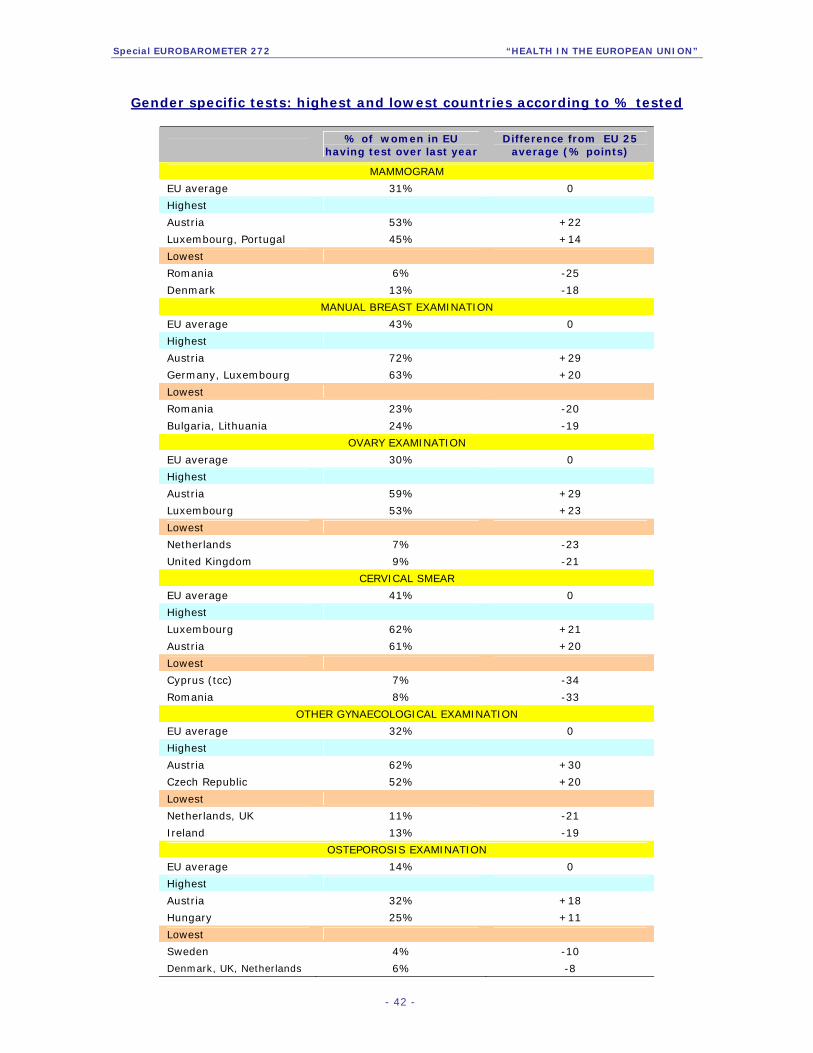
– The highest testing rates for women are found in Austria – Looking at results by country, we see that with the exception of cervical smear tests Austria has the highest testing rates for every type of test and examination. For example, over 7 in every 10 (72%) Austrian women has a manual breast exam every year, a figure 29 percentage points higher than the average for the whole of the EU. For Osteoporosis examinations, the Austrian figure (32%) is over twice as high as that for the EU (14%). We have already seen that Austria has a comprehensive screening programme in place for cancer. This also looks to apply for womens’ health, whether concerning cancer or other issues, and combines with high numbers of tests on both patients’ and doctors’ initiatives. Conversely, we see that the Acceding countries, and in particular Romania, often have testing rates that are amongst the lowest of all countries surveyed. Only 8% of Romanian women have a cervical smear test each year, a rate 9 times lower than that in Austria. Denmark also features as having low testing rates for osteoporosis and Mammography, whilst comparatively few women in Sweden had a manual breast examination (27%) or osteoporosis examination (4%) over the last year.
32 Health, Alcohol and Food Safety, Special Eurobarometer 186 (December 2003), p. 21-2. 33 The exact figures are: Mammography – 10 NMS 25%, EU15 32%; Manual Breast examination – 10 NMS 36%, EU15, 45%; Ovary examination – 10 NMS 30%, EU15 30%; Cervical Smear test – 10 NMS 35%, EU 15 42%; Other Gynaecological examination – 10 NMS 37%, EU15 30%; Osteoporosis examination – 10 NMS 14%, EU15 14%. 34 See Health, Alcohol and Food Safety, Special Eurobarometer 186 (December 2003), p.69 for details of the 2003 question and the annexes to this report for the 2006 question
- 41 -
Special EUROBAROMETER 272 “HEALTH IN THE EUROPEAN UNION”
Gender specific tests: highest and lowest countries according to % tested
% of women in EU
having test over last year Difference from EU 25
average (% points)
MAMMOGRAM
EU average 31% 0
Highest
Austria 53% +22
Luxembourg, Portugal 45% +14
Lowest
Romania 6% -25
Denmark 13% -18
MANUAL BREAST EXAMINATION
EU average 43% 0
Highest
Austria 72% +29
Germany, Luxembourg 63% +20
Lowest
Romania 23% -20
Bulgaria, Lithuania 24% -19
OVARY EXAMINATION
EU average 30% 0
Highest
Austria 59% +29
Luxembourg 53% +23
Lowest
Netherlands 7% -23
United Kingdom 9% -21
CERVICAL SMEAR
EU average 41% 0
Highest
Luxembourg 62% +21
Austria 61% +20
Lowest
Cyprus (tcc) 7% -34
Romania 8% -33
OTHER GYNAECOLOGICAL EXAMINATION
EU average 32% 0
Highest
Austria 62% +30
Czech Republic 52% +20
Lowest Netherlands, UK 11% -21
Ireland 13% -19
OSTEPOROSIS EXAMINATION
EU average 14% 0
Highest
Austria 32% +18
Hungary 25% +11
Lowest
Sweden 4% -10
Denmark, UK, Netherlands 6% -8
- 42 -

Special EUROBAROMETER 272 “HEALTH IN THE EUROPEAN UNION”
In terms of social and demographic factors, three key patterns emerge concerning tests specifically for women: • With regards to age, the most intensive years for testing are between 25 and 54. Before this period, fewer women have tests each year than at any other time in their lives. After 54, we see a slight tailing off of testing. Within the framework of this general pattern there are variations:
- For mammograms, the major intensification of testing happens slightly later than for other tests, during the age period 40-54, where it more than doubles compared to the 25-39 period (44% vs. 18%).
- For ovary examinations, the proportional decrease in testing after the 40-54
period is, unsurprisingly, higher than for other tests: 40% of women in this age range of such examinations, compared to 23% of those aged 55 and above.
- Osteoporosis is the biggest exception to the rule. Here, rather than a
decrease in testing amongst women aged 55 and over, testing doubles amongst this age group compared to those aged 40-54 (26% vs. 13%)35. • For four of the examinations, testing increases with levels of education. The two exceptions are:
- Mammography, where education levels have little impact. - Osteoporosis, where the pattern is reversed, and the least educated are
more likely to receive a test (22% vs. 11% of those educated to 20+). This is most likely due to the concentration of testing amongst women aged over 55 and the fact that fewer of this group were educated beyond 15 than younger age groups.
• Testing levels are consistently lower amongst unemployed women than amongst their employed counterparts. It is unclear whether this is due primarily to lower education levels, lower income, or both.
35 The reason testing is concentrated amongst the older age group is the link between hormonal changes that occur during menopause and Osteoporosis.
- 43 -

Special EUROBAROMETER 272 “HEALTH IN THE EUROPEAN UNION”
4. Specific Health Problems In this final chapter we look at three important health issues. Firstly, high blood pressure which – as we have seen – is the most common reason for EU citizens to be undergoing long-term medical treatment. Blood pressure is closely linked to heart health, as is cholesterol, the second issue we investigate here. For both matters we first look at how frequently Europeans have these monitored, before then examining how many respondents have made lifestyle changes to increase their health in this area. After this the focus is on Hormone Replacement Therapy (HRT) for women going through the menopause. Here we look at how well informed European women are on this treatment, before then examining the incidence of women on HRT. 4.1 Blood pressure 4.1.1 Check-ups
– More citizens receive blood pressure tests each year than 3 years ago– Nearly 6 out of every 10 (59%) EU citizens had their blood pressure measured in the year preceding this survey. This figure is made up of 20% who had this on their own initiative, 32% at the initiative of a doctor and 7% as part of a screening programme36.
QB 46.7. Blood pressure tests: % having over last 12 months, by source of initiative
No41%
Yes, doctor’s initiative
32%Yes, screening programme
7%
Yes, own initiative
20%
36 QB46. I am going to read out a series of possible tests or health check-ups. For each of them, please tell me if you had one in the last 12 months, whether or not as part of any treatment. (IF YES) Was it on your own initiative, at a doctor's initiative or as part of a screening programme? [Blood pressure test]
- 44 -

Special EUROBAROMETER 272 “HEALTH IN THE EUROPEAN UNION”
Encouragingly, this is an increase of 9 percentage points from figures reported in 2003, when exactly half of EU citizens had this test. Given that the figure for the 10 new Member states (61%) as almost the same as the older 15 Member states (58%), this increase therefore represents a real increase in the number of people tested rather than higher testing rates in the 10 new Member states. This increase is made up primarily of more tests carried out on doctors’ initiatives (up 5 percentage points from 27% in 2003), supplemented by a slight increase in testing initiated by patients (up 3 percentage points from 17%). The highest testing rates are seen in Luxembourg, where 80% of the population had a blood pressure test followed by Estonia (72%) and Portugal (71%). The lowest rates are evident in Ireland, although even here a figure approaching half of those surveyed (46%) had been tested.
- 45 -
Special EUROBAROMETER 272 “HEALTH IN THE EUROPEAN UNION”
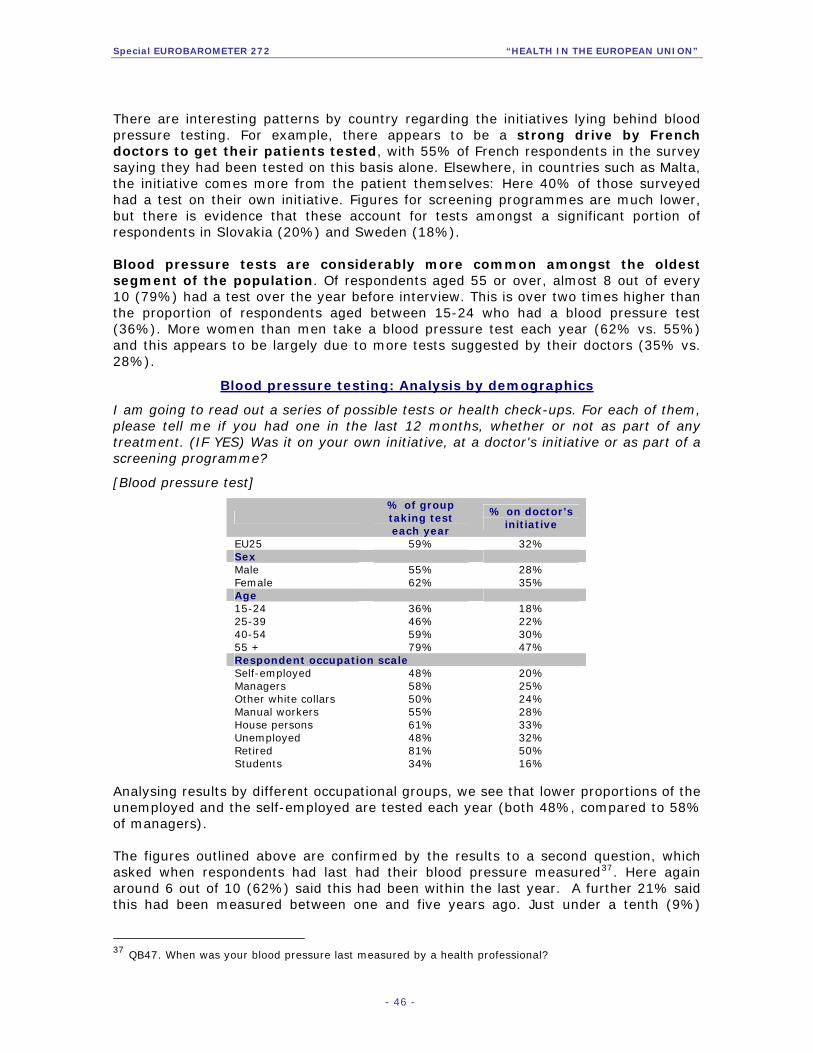
There are interesting patterns by country regarding the initiatives lying behind blood pressure testing. For example, there appears to be a strong drive by French doctors to get their patients tested, with 55% of French respondents in the survey saying they had been tested on this basis alone. Elsewhere, in countries such as Malta, the initiative comes more from the patient themselves: Here 40% of those surveyed had a test on their own initiative. Figures for screening programmes are much lower, but there is evidence that these account for tests amongst a significant portion of respondents in Slovakia (20%) and Sweden (18%). Blood pressure tests are considerably more common amongst the oldest segment of the population. Of respondents aged 55 or over, almost 8 out of every 10 (79%) had a test over the year before interview. This is over two times higher than the proportion of respondents aged between 15-24 who had a blood pressure test (36%). More women than men take a blood pressure test each year (62% vs. 55%) and this appears to be largely due to more tests suggested by their doctors (35% vs. 28%).
Blood pressure testing: Analysis by demographics I am going to read out a series of possible tests or health check-ups. For each of them, please tell me if you had one in the last 12 months, whether or not as part of any treatment. (IF YES) Was it on your own initiative, at a doctor's initiative or as part of a screening programme? [Blood pressure test]
% of group taking test each year
% on doctor’s initiative
EU25 59% 32% Sex Male 55% 28% Female 62% 35% Age 15-24 36% 18% 25-39 46% 22% 40-54 59% 30% 55 + 79% 47% Respondent occupation scale Self-employed 48% 20% Managers 58% 25% Other white collars 50% 24% Manual workers 55% 28% House persons 61% 33% Unemployed 48% 32% Retired 81% 50% Students 34% 16%
Analysing results by different occupational groups, we see that lower proportions of the unemployed and the self-employed are tested each year (both 48%, compared to 58% of managers). The figures outlined above are confirmed by the results to a second question, which asked when respondents had last had their blood pressure measured37. Here again around 6 out of 10 (62%) said this had been within the last year. A further 21% said this had been measured between one and five years ago. Just under a tenth (9%)
37 QB47. When was your blood pressure last measured by a health professional?
- 46 -

Special EUROBAROMETER 272 “HEALTH IN THE EUROPEAN UNION”
have either never had their blood pressure measured, or have not done so within the last five years.
QB47. When was your blood pressure last measured by a health professional?
DK\ Do not remember
8%
1 – 5 years ago 21%
Not within the past 5 years or
never9%
Within the past 12 months
62%
As would be logically expected, findings by individual country largely reflect those described above. Thus 77% of Portuguese say they have had the blood pressure measured within the last 12 months, alongside 80% of Luxembourgers. Less comprehensive measurement is again evident in Ireland, where 51% of those surveyed said had been tested in the previous year. Similar figures are seen in Spain (also 51%) and the Netherlands (50%). 4.1.2 Lifestyle changes Combating hypertension involves two key elements. Firstly, substantial testing is required in order to identify patients at risk. We have seen that a considerable proportion of citizens are tested each year, and that in recent years this number has been rising. The second element is measures that can be taken once testing reveals a problem with high blood pressure. One of these is treatment with antihypertensives – drugs which lower blood pressure. To this end patients can also take important measures themselves, in particular by making dietary changes and taking regular exercise. Here it was found that 12% of all respondents have recently changed their lifestyle in order to lower their blood pressure38. It is, however, particularly relevant to look in more detail at respondents who have a known problem with high-blood pressure.
38 QB48. Have you recently changed your way of life in order to lower your blood pressure?
- 47 -
Special EUROBAROMETER 272 “HEALTH IN THE EUROPEAN UNION”
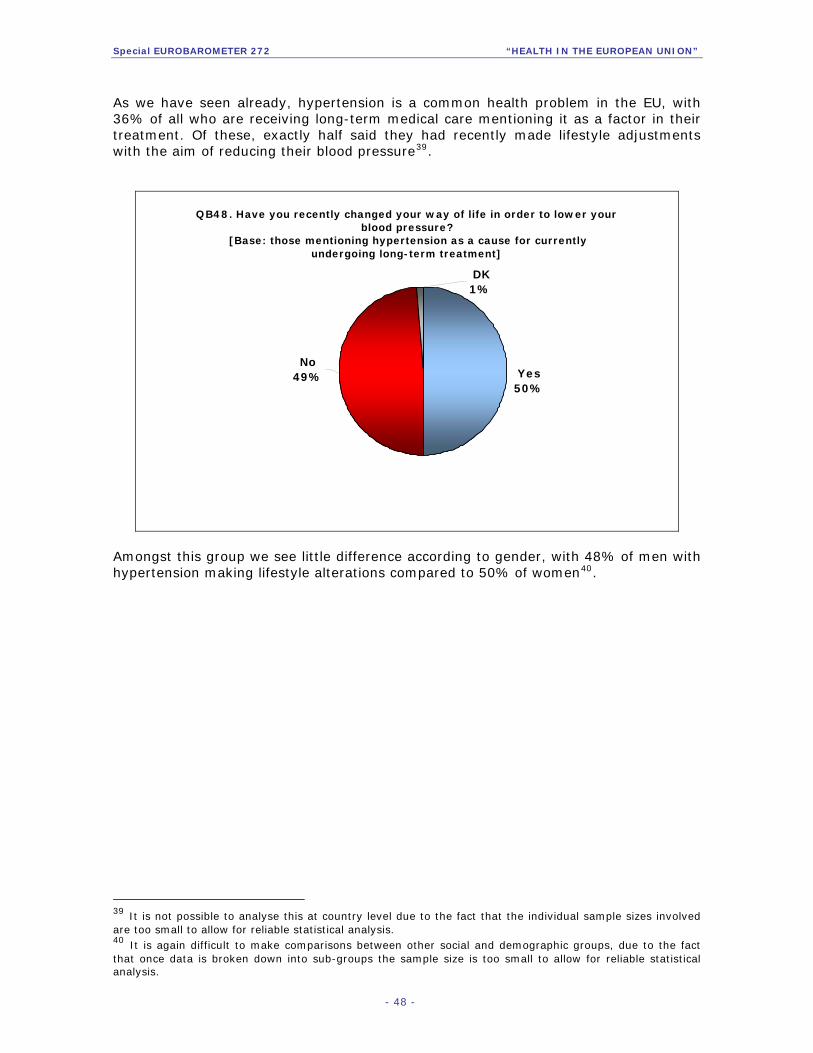
As we have seen already, hypertension is a common health problem in the EU, with 36% of all who are receiving long-term medical care mentioning it as a factor in their treatment. Of these, exactly half said they had recently made lifestyle adjustments with the aim of reducing their blood pressure39.
QB48. Have you recently changed your way of life in order to lower your blood pressure?
[Base: those mentioning hypertension as a cause for currently undergoing long-term treatment]
Yes50%
DK1%
No49%
Amongst this group we see little difference according to gender, with 48% of men with hypertension making lifestyle alterations compared to 50% of women40. 39 It is not possible to analyse this at country level due to the fact that the individual sample sizes involved are too small to allow for reliable statistical analysis. 40 It is again difficult to make comparisons between other social and demographic groups, due to the fact that once data is broken down into sub-groups the sample size is too small to allow for reliable statistical analysis.
- 48 -
Special EUROBAROMETER 272 “HEALTH IN THE EUROPEAN UNION”
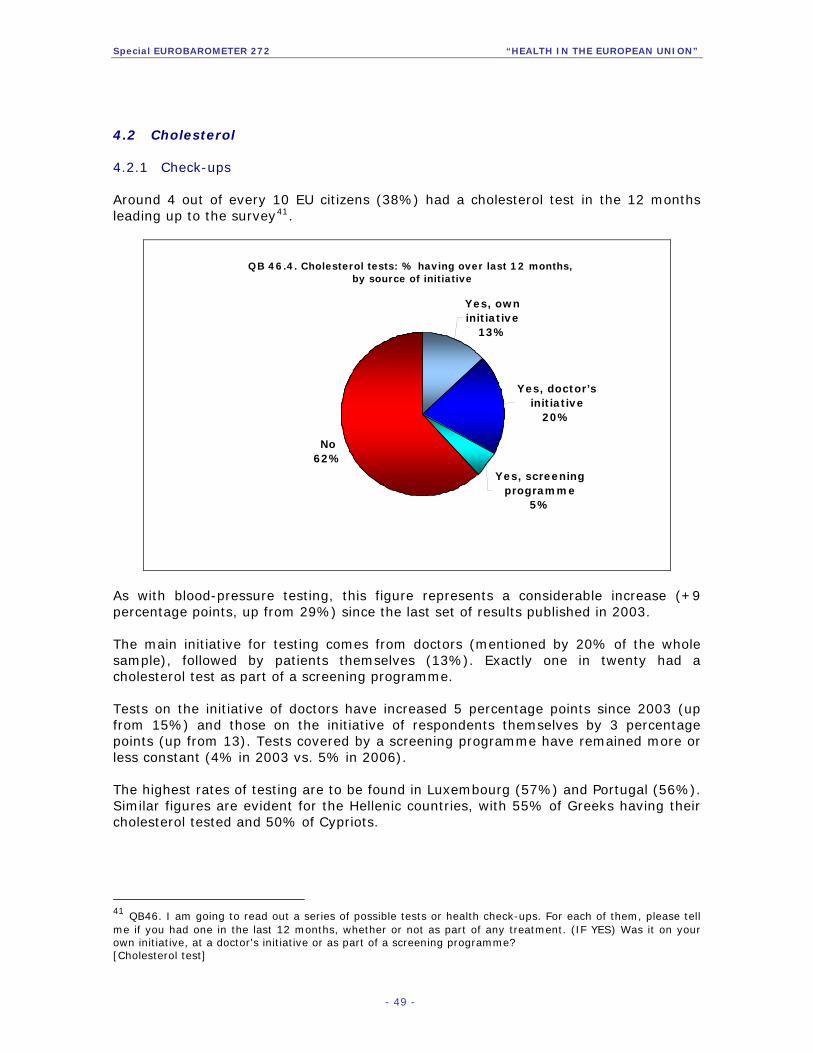
4.2 Cholesterol 4.2.1 Check-ups Around 4 out of every 10 EU citizens (38%) had a cholesterol test in the 12 months leading up to the survey41.
QB 46.4. Cholesterol tests: % having over last 12 months, by source of initiative
No62%
Yes, own initiative
13%
Yes, screening programme
5%
Yes, doctor’s initiative
20%
As with blood-pressure testing, this figure represents a considerable increase (+9 percentage points, up from 29%) since the last set of results published in 2003. The main initiative for testing comes from doctors (mentioned by 20% of the whole sample), followed by patients themselves (13%). Exactly one in twenty had a cholesterol test as part of a screening programme. Tests on the initiative of doctors have increased 5 percentage points since 2003 (up from 15%) and those on the initiative of respondents themselves by 3 percentage points (up from 13). Tests covered by a screening programme have remained more or less constant (4% in 2003 vs. 5% in 2006). The highest rates of testing are to be found in Luxembourg (57%) and Portugal (56%). Similar figures are evident for the Hellenic countries, with 55% of Greeks having their cholesterol tested and 50% of Cypriots.
41 QB46. I am going to read out a series of possible tests or health check-ups. For each of them, please tell me if you had one in the last 12 months, whether or not as part of any treatment. (IF YES) Was it on your own initiative, at a doctor's initiative or as part of a screening programme? [Cholesterol test]
- 49 -
Special EUROBAROMETER 272 “HEALTH IN THE EUROPEAN UNION”
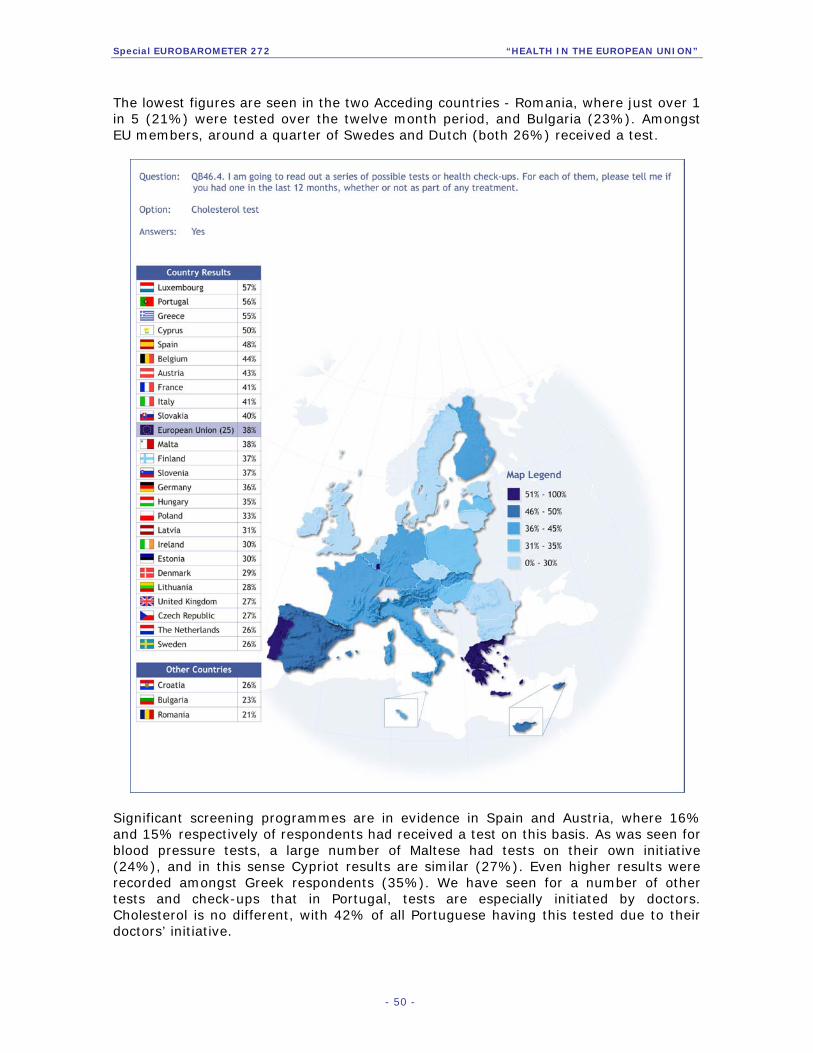
The lowest figures are seen in the two Acceding countries - Romania, where just over 1 in 5 (21%) were tested over the twelve month period, and Bulgaria (23%). Amongst EU members, around a quarter of Swedes and Dutch (both 26%) received a test.
Significant screening programmes are in evidence in Spain and Austria, where 16% and 15% respectively of respondents had received a test on this basis. As was seen for blood pressure tests, a large number of Maltese had tests on their own initiative (24%), and in this sense Cypriot results are similar (27%). Even higher results were recorded amongst Greek respondents (35%). We have seen for a number of other tests and check-ups that in Portugal, tests are especially initiated by doctors. Cholesterol is no different, with 42% of all Portuguese having this tested due to their doctors’ initiative.
- 50 -

Special EUROBAROMETER 272 “HEALTH IN THE EUROPEAN UNION”
As is the case for blood pressure testing, we see a significantly higher level of cholesterol testing amongst the older segment of the population. Six times as many of those aged 55 and above took a cholesterol test over the 12 months period, when compared to respondents aged between 15 and 24 (60% vs. 10%). Again we see a difference by gender with more women than men tested (39% vs. 35%).
Cholesterol testing: Analysis by demographics I am going to read out a series of possible tests or health check-ups. For each of them, please tell me if you had one in the last 12 months, whether or not as part of any treatment. (IF YES) Was it on your own initiative, at a doctor's initiative or as part of a screening programme? [Cholesterol test]
% of group receiving
cholesterol test
EU25 38% Sex Male 35%
Female 39% Age
15-24 10% 25-39 23% 40-54 39% 55 + 60%
Respondent occupation scale Self- employed 34%
Managers 35% Other white collars 31%
Manual workers 30% House persons 45% Unemployed 24%
Retired 60% Students 11%
In terms of occupational groupings, a low proportion of just under a quarter of the unemployed (24%) received a test. The self-employed recorded similar figures to the unemployed for blood pressure tests. Here, however, 34% of the self-employed took a cholesterol test, a figure much more on a par with managerial respondents (35%). Further detail is provided by the question asking when respondents had last had their cholesterol levels measured. Here – as would be expected from results to the question analysed above – around 4 in 10 (39%) said these had been measured within the 12 months before interview42.
42 QB49. When was your blood cholesterol last measured by a health professional?
- 51 -

Special EUROBAROMETER 272 “HEALTH IN THE EUROPEAN UNION”
QB49. When was your blood cholesterol last measured by a health professional?
DK\ Do not remember
12%
Within the past 12 months
39%Not within the past 5 years or
never27%
1 – 5 years ago 22%
A further 22% said the last measurement was between 1 and 5 years ago, whilst over a quarter (27%) said they had either never had their cholesterol measured, or had not done so within the last 5 years. In certain countries this figure rises to concerning levels. For example, over half of all Dutch respondents (56%) said that they had never had their blood cholesterol measured, or had not done this within the previous 5 years. High figures are also seen in Denmark (50%) and the UK (44%). 4.2.2 Lifestyle changes A small minority of all respondents say they have recently changed their lifestyle in order to lower their blood cholesterol. This figure (13%43) was very close to that seen for the proportion of respondents who have made changes with a view to reducing their blood pressure (12%).
43 QB50. Have you recently changed your way of life in order to lower your blood cholesterol?
- 52 -

Special EUROBAROMETER 272 “HEALTH IN THE EUROPEAN UNION”
QB50. Have you recently changed your way of life in order to lower your blood cholesterol?
[Base: All respondents]
Yes13%
DK2%
No85%
Unfortunately there is no means of isolating respondents who have problems with cholesterol from the survey data. This means we are unable to analyse lifestyle changes amongst the group who have most need to make these changes. We proceed with an analysis based on the total sample – that is to say, including respondents who have healthy cholesterol levels as well as those who are unaware that they have high cholesterol. On a country level we see that Malta is the country where the highest proportion of respondents have made recent changes in order to lower cholesterol, at a level almost twice as high compared to the EU in general (25% vs. 13%). In terms of demographics, considerably higher numbers of older respondents have recently adopted measures to lower their cholesterol than their younger counterparts (24% of the 55+ age group vs. 2% of the 15-24 age group). This is unsurprising given that blood cholesterol increases with age44.
44 British Heart Foundation: Coronary Heart Disease Statistics: Factsheet. (2004). Accessible at http://www.bhf.org.uk/publications/uploaded/fact_sheet2.pdf
- 53 -

Special EUROBAROMETER 272 “HEALTH IN THE EUROPEAN UNION”
4.3 Hormone Replacement Therapy Hormone Replacement Therapy (HRT) is a treatment containing one or more female hormones. It replenishes diminishing oestrogen hormone levels, and is used mostly as relief for symptoms of the menopause. Here we examine two aspects of this treatment: Firstly, knowledge levels amongst all women concerning HRT and secondly, the proportion of women aged over 50 who are currently on HRT. 4.3.1 Levels of knowledge on Hormone Replacement Therapy The majority of women (58%) in the EU say that they feel they are not well informed about HRT. This comprises of 30% who say they feel ‘not very well informed’ and 28% who say they think they are ‘not at all well informed’. Around 4 in 10 (39%) say that they feel they are informed on this subject, with 29% thinking they are ‘fairly well informed’ and 10% ‘very well informed’45.
QB51 How informed do you feel about hormone replacement therapy (HRT) for women going through the menopause?
Informed39%
Not informed58%
DK3%
In the last report published on this issue in 2003, 42% said they were informed on HRT. However, because the question was worded in a different way it is difficult to make a direct comparison with the recent set of results46.
45 QB51. How informed do you feel about hormone replacement therapy (HRT) for women going through the
menopause? 46 pp. 19-20 Health, Alcohol and Food Safety, Special Eurobarometer 186 (December 2003). The question was formulated thus: Do you feel very well informed, fairly well informed, not very well informed or not at all well informed about hormone replacement therapy (HRT) for women going through the menopause?
- 54 -

Special EUROBAROMETER 272 “HEALTH IN THE EUROPEAN UNION”
Women in Finland (58%), Belgium (54%) and Luxembourg (52%) have the highest levels of self-perceived knowledge in the EU. The lowest levels are found in Spain (18%) and Estonia (23%).
Given that HRT is for women going through the menopause, we would expect to see a strong variation in results when it is analysed according to the age of respondents. This certainly proves to be the case, with a particularly large jump in knowledge between the 25-39 and 40-54 age groups (29% vs. 49%).
- 55 -

Special EUROBAROMETER 272 “HEALTH IN THE EUROPEAN UNION”
Knowledge of HRT: Analysis by womens’ age and education
How informed do you feel about hormone replacement therapy (HRT) for women going through the menopause?
[Informed = ‘very well informed + ‘fairly well informed’. Not informed = ‘not very well
informed’ + ‘not at all informed’]
Informed Not
informed DK
EU25 39% 58% 3% Age 15-24 17% 77% 6% 25-39 29% 68% 3% 40-54 49% 50% 1% 55 + 47% 49% 4% Education (End of)
15 36% 61% 3% 16-19 41% 56% 3% 20+ 50% 48% 2% Still Studying 16% 78% 6%
A second factor is education levels, with higher knowledge of HRT linked to the extent of a respondent’s education. Thus exactly half of those educated to 20 and above say they are informed on HRT compared to 36% of those educated up to 15. 4.3.2 Incidence of treatment by HRT Of all women surveyed who were over the age of 50 at the time of interview, 6% are on HRT47.
QB52 Are you on hormone replacement therapy?[Base: all women 50 years and over]
Yes6%
DK\ Refusal2%
No92%
47 QB52. Are you on hormone replacement therapy? [To women older than 50]
- 56 -

Special EUROBAROMETER 272 “HEALTH IN THE EUROPEAN UNION”
This indicates a considerable decrease in the rate of treatment by HRT in recent years, as the corresponding figure for 2003 was exactly twice as high, at 12%. Due to the small sample sizes involved in some countries, we do not present full analysis by countries here. However, it is noted that in the country where knowledge of HRT is at its highest – Finland – we also see the highest rate of treatment, at 20% of all women aged over 50. HRT is given more to women aged between 50 and 54 than it is to those aged 55 and over: 13% of the former group were receiving HRT, compared to 5% of the latter.
HRT treatment rates amongst women aged over 50: Age and Education
Are you on hormone replacement therapy?
% on HRT EU25 6% Age 15-24 - 25-39 - 40-54 13% 55 + 5% Education (End of) 15 4% 16-19 8% 20+ 10%
There is also a link between education levels and HRT. Of women aged 50 and over, those who continued their education for the longest period of time are over twice as likely to be on HRT as their counterparts who ended finished education at 15 (10% vs. 4%). This is possibly related to the income levels of these respondents and the effect this has on access to health care.
- 57 -

Special EUROBAROMETER 272 “HEALTH IN THE EUROPEAN UNION”
CONCLUSION A sizeable majority of EU citizens consider themselves to be in good health. In fact, less than one in ten (7%) say that their health is bad or very bad. However, within this figure we do see some evidence of health inequalities, with twice as many of the least educated group (14%) saying they have bad health. Around 3 in every 10 Europeans (29%) have a long-standing illness or health problem, an increase from the 24% who gave the same answer in 2005. In particular we saw increases in this figure in many of the Mediterranean countries. However, the trend is not upwards in all countries, and in particular there is evidence of a decrease in the proportion of long-term ill in the Nordic countries (for example, a fall of -7 percentage points in Denmark). An identical figure of just under 3 in 10 (29%) say that they have recently experienced limits to their daily activities due to a long-term health problem. Here again there is a geographical pattern to results, with respondents in the Baltic and some East-Central European states more likely, and those in the Mediterranean region less likely, to say they have such problems. Interviewees were also asked about the effect muscle, bone and joint pain has on their day-to-day lives. Here it was found that 32% said they had experienced limitations on their daily activities due to such pain in the week preceding their interview. A further 25% have, at some point, had these problems lasting for a duration of at least 3 months. In both instances, the most common location for pain is in the back. Regarding general health check-ups, over 6 out of every 10 (62%) respondents have a dental examination each year, with lower proportions having eye (38%) and hearing (16%) checks. For other, more specific tests, we see that a high percentage take an X-ray, ultrasound or other scan each year. This has risen by five percentage points since 2003 (38% vs. 33%), with the impetus for this rise coming from more referrals by doctors. Variable rates were seen by country for Cancer testing rates, with a relatively large proportion of Austrians taking these tests, mostly as part of a national screening programme. The issue of womens’ health was examined in particular detail. Here there are encouraging signs of a high take-up rate for testing, for example with 43% of all women taking a manual breast examination in the year leading up to fieldwork. Again, it is notable that testing rates were especially high in Austria. However, health inequalities are once more in evidence, with most examinations more frequent amongst higher educated women and those in employment. A further finding in this area is that the proportion of women aged 50 and over who are on Hormone Replacement Therapy looks to be declining (6% compared to 12% reported in 2003). This survey addressed two further key health issues: Cholesterol and blood pressure. Blood pressure is a major factor in treatment for long-term health problems, with over a third (36%) of respondents who receive such treatment mentioning hypertension as a factor in their condition.
- 58 -

Special EUROBAROMETER 272 “HEALTH IN THE EUROPEAN UNION”
Encouragingly, nearly 6 out of every 10 (59%) Europeans have their blood pressure measured each year, an increase of 9 percentage points from figures reported in 2003. A similar increase can be seen for cholesterol tests, where 38% have these each year, compared to the 29% reported in 2003. Testing and detection is only one side of the equation however, and once high blood pressure is uncovered, lifestyle changes on the part of the patient are essential. Here it is seen that of those for whom hypertension is a factor in long-term treatment, exactly half say they have recently modified their lifestyle in order to lower their blood pressure.
- 59 -

ANNEXES

TECHNICAL SPECIFICATIONS

SPECIAL EUROBAROMETER N°272 “Health Risks”
TECHNICAL SPECIFICATIONS
Between the 6th of October and the 8th of November 2006, TNS Opinion & Social, a consortium created between Taylor Nelson Sofres and EOS Gallup Europe, carried out wave 66.2 of the EUROBAROMETER, on request of the EUROPEAN COMMISSION, Directorate General Communication, “Public Opinion and Media Monitoring”. The Special Eurobarometer N°272 is part of EUROBAROMETER 66.2 and covers the population of the respective nationalities of the European Union Member States, resident in each of the Member States and aged 15 years and over. The Special Eurobarometer N°272 has also been conducted in the two acceding countries (Bulgaria and Romania) and in one of the two candidate countries (Croatia) and in the Turkish Cypriot Community. In these countries, the survey covers the national population of citizens of the respective nationalities and the population of citizens of all the European Union Member States that are residents in those countries and have a sufficient command of one of the respective national language(s) to answer the questionnaire. The basic sample design applied in all states is a multi-stage, random (probability) one. In each country, a number of sampling points was drawn with probability proportional to population size (for a total coverage of the country) and to population density. In order to do so, the sampling points were drawn systematically from each of the "administrative regional units", after stratification by individual unit and type of area. They thus represent the whole territory of the countries surveyed according to the EUROSTAT NUTS II (or equivalent) and according to the distribution of the resident population of the respective nationalities in terms of metropolitan, urban and rural areas. In each of the selected sampling points, a starting address was drawn, at random. Further addresses (every Nth address) were selected by standard "random route" procedures, from the initial address. In each household, the respondent was drawn, at random (following the "closest birthday rule"). All interviews were conducted face-to-face in people's homes and in the appropriate national language. As far as the data capture is concerned, CAPI (Computer Assisted Personal Interview) was used in those countries where this technique was available.
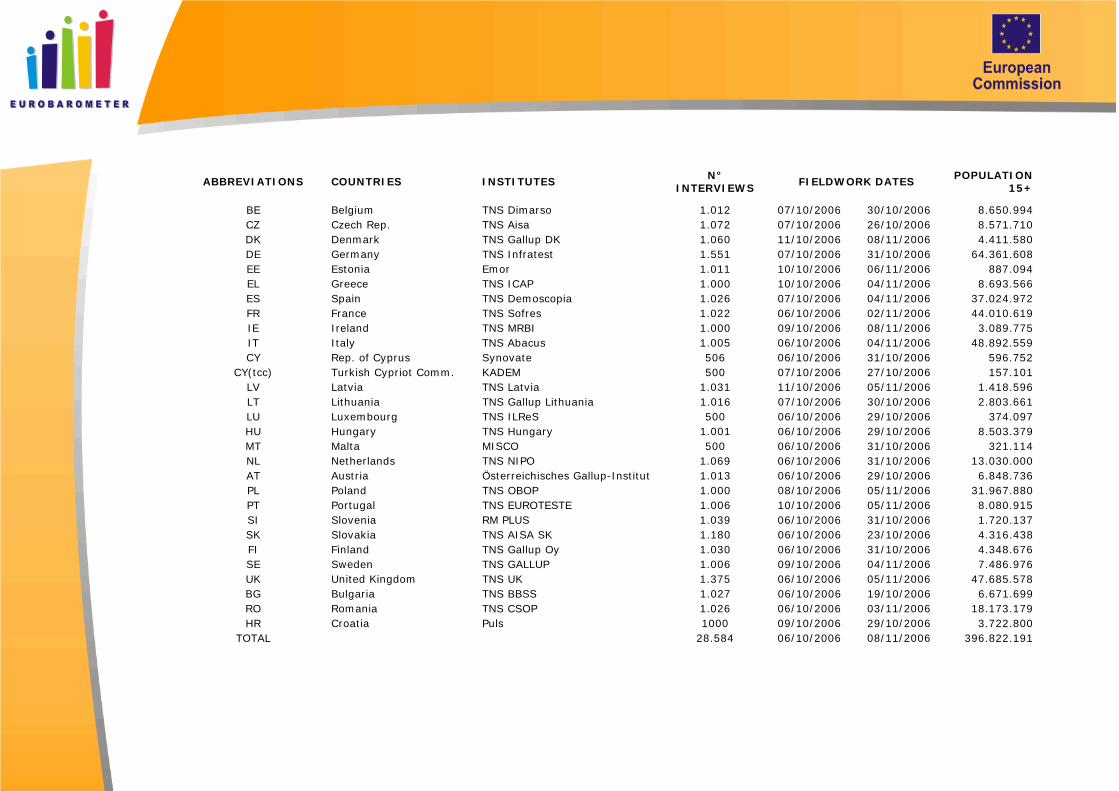
COUNTRIES INSTITUTES N° INTERVIEWS
FIELDWORK DATES POPULATION15+
ABBREVIATIONS
BE Belgium TNS Dimarso 1.012 07/10/2006 30/10/2006 8.650.994 CZ Czech Rep. TNS Aisa 1.072 07/10/2006 26/10/2006 8.571.710 DK Denmark TNS Gallup DK 1.060 11/10/2006 08/11/2006 4.411.580 DE Germany TNS Infratest 1.551 07/10/2006 31/10/2006 64.361.608 EE Estonia Emor 1.011 10/10/2006 06/11/2006 887.094 EL Greece TNS ICAP 1.000 10/10/2006 04/11/2006 8.693.566 ES Spain TNS Demoscopia 1.026 07/10/2006 04/11/2006 37.024.972 FR France TNS Sofres 1.022 06/10/2006 02/11/2006 44.010.619 IE Ireland TNS MRBI 1.000 09/10/2006 08/11/2006 3.089.775 IT Italy TNS Abacus 1.005 06/10/2006 04/11/2006 48.892.559 CY Rep. of Cyprus Synovate 506 06/10/2006 31/10/2006 596.752
CY(tcc) Turkish Cypriot Comm. KADEM 500 07/10/2006 27/10/2006 157.101 LV Latvia TNS Latvia 1.031 11/10/2006 05/11/2006 1.418.596 LT Lithuania TNS Gallup Lithuania 1.016 07/10/2006 30/10/2006 2.803.661 LU Luxembourg TNS ILReS 500 06/10/2006 29/10/2006 374.097 HU Hungary TNS Hungary 1.001 06/10/2006 29/10/2006 8.503.379 MT Malta MISCO 500 06/10/2006 31/10/2006 321.114 NL Netherlands TNS NIPO 1.069 06/10/2006 31/10/2006 13.030.000 AT Austria Österreichisches Gallup-Institut 1.013 06/10/2006 29/10/2006 6.848.736 PL Poland TNS OBOP 1.000 08/10/2006 05/11/2006 31.967.880 PT Portugal TNS EUROTESTE 1.006 10/10/2006 05/11/2006 8.080.915 SI Slovenia RM PLUS 1.039 06/10/2006 31/10/2006 1.720.137 SK Slovakia TNS AISA SK 1.180 06/10/2006 23/10/2006 4.316.438 FI Finland TNS Gallup Oy 1.030 06/10/2006 31/10/2006 4.348.676 SE Sweden TNS GALLUP 1.006 09/10/2006 04/11/2006 7.486.976 UK United Kingdom TNS UK 1.375 06/10/2006 05/11/2006 47.685.578 BG Bulgaria TNS BBSS 1.027 06/10/2006 19/10/2006 6.671.699 RO Romania TNS CSOP 1.026 06/10/2006 03/11/2006 18.173.179 HR Croatia Puls 1000 09/10/2006 29/10/2006 3.722.800
TOTAL 28.584 06/10/2006 08/11/2006 396.822.191
For each country a comparison between the sample and the universe was carried out. The Universe description was derived from Eurostat population data or from national statistics offices. For all countries surveyed, a national weighting procedure, using marginal and intercellular weighting, was carried out based on this Universe description. In all countries, gender, age, region and size of locality were introduced in the iteration procedure. For international weighting (i.e. EU averages), TNS Opinion & Social applies the official population figures as provided by EUROSTAT or national statistic offices. The total population figures for input in this post-weighting procedure are listed above. Readers are reminded that survey results are estimations, the accuracy of which, everything being equal, rests upon the sample size and upon the observed percentage. With samples of about 1,000 interviews, the real percentages vary within the following confidence limits:
Observed percentages 10% or 90% 20% or 80% 30% or 70% 40% or 60% 50%
Confidence limits ± 1.9 points ± 2.5 points ± 2.7 points ± 3.0 points ± 3.1 points

QUESTIONNAIRE

QB39 QB39
(390) (390)1 12 23 34 45 56 6
QB40 QB40
(391) (391)1 12 23 3
QB41 QB41
(392) (392)1 12 23 34 4
Pas du tout limité(e)NSP
EB64.3 QD31
Au cours des 6 derniers mois, dans quelle mesure avez-vous été empêché(e) d’exercer des activités que les personnes font normalement, en raison d’un problème de santé ? Diriez-vous que vous avez été … ?
(LIRE – UNE SEULE REPONSE)
Grandement limité(e)Relativement limité(e)
NonNSP
NEW
Souffrez-vous d’une maladie ou d’un problème de santé de longue durée ?
Oui
MauvaisTrès mauvaisNSP
NEW
(MONTRER CARTE – LIRE – UNE SEULE REPONSE)
Très bonBonNi bon, ni mauvais
Passons maintenant à d'autres questions
Quel est votre état de santé général ?
Not limited at all DK
EB64.3 QD31
Over the past 6 months, to what extent, if at all, have you been limited in activities people normally do, because of a health problem? Would you say you have been…?
(READ OUT – ONE ANSWER ONLY)
Severely limitedSomewhat limited
NoDK
NEW
Do you have any long-standing illness or health problem?
Yes
BadVery badDK
NEW
(SHOW CARD – READ OUT – ONE ANSWER ONLY)
Very goodGood Neither good nor bad
Let's move on to other questions.
How is your health in general?
EB662MasterIN_v7 37/52 09/11/2006

QB42 QB42
(393) 1 (393) 1(394) 2 (394) 2(395) 3 (395) 3(396) 4 (396) 4
(397)
5
(397)
5
(398) 6 (398) 6(399) 7 (399) 7
(400)8
(400)8
(401) 9 (401) 9(402) 10 (402) 10(403) 11 (403) 11
(404)12
(404)12
(405) 13 (405) 13
QB43 QB43
(406) (406)1 12 23 3
OuiNonNSP\ Refus
EB59.0 Q21a TREND SLIGHTLY MODIFIED
EB59.0 Q19 TREND MODIFIED
Suivez-vous un traitement médical de longue durée ? (M)
De l’anxiété chronique ou une dépression (N) 1 2 3
Un ulcère à l’estomac (gastrique ou duodénal) (N) 1 2 3Une attaque ou hémorragie cérébrale (N) 1 2 3L’ostéoporose (N) 1 2 3Des bronchites chroniques, de l’emphysème (N) 1 2 3
Des migraines ou des maux de tête fréquents (N) 1 2 3La cataracte (N) 1 2 3Le cancer 1 2 3
Des troubles musculaires, osseux ou des articulations de longue durée (rhumatismes, arthrites)
1 2 3De l’hypertension (tension artérielle élevée) 1 2 3De l’asthme 1 2 3Une allergie 1 2 3Le diabète 1 2 3
Avez-vous ou avez-vous eu une des maladies suivantes ? (M)
(UNE REPONSE PAR LIGNE)
(LIRE) Oui Non NSP
YesNoDK\ Refusal
EB59.0 Q21a TREND SLIGHTLY MODIFIED
EB59.0 Q19 TREND MODIFIED
Are you undergoing a medical long-term treatment? (M)
Chronic anxiety or depression (N) 1 2 3
Peptic ulcer (gastric or duodenal ulcer) (N) 1 2 3Stroke, cerebral haemorrhage (N) 1 2 3Osteoporosis (N) 1 2 3Chronic bronchitis, emphysema (N) 1 2 3
Migraine or frequent headaches (N) 1 2 3Cataract (N) 1 2 3Cancer 1 2 3
Long-standing troubles with your muscles, bones and joints (rheumatism, arthritis)
1 2 3Hypertension (high blood pressure) 1 2 3Asthma 1 2 3An Allergy 1 2 3Diabetes 1 2 3
Do you have or have you ever had any of the following health problems?
(ONE ANSWER PER LINE)
(READ OUT) Yes No DK
EB662MasterIN_v7 38/52 09/11/2006

QB44 QB44
(407-421) (407-421)1, 1,2, 2,3, 3,4, 4,
5, 5,6, 6,7, 7,8, 8,9, 9,
10, 10,11, 11,12, 12,13, 13,14, 14,15, 15,
De l’anxiété chronique ou une dépression (N)Autre (SPONTANE)NSP
EB59.0 Q21b TREND MODIFIED
Des bronchites chroniques, de l’emphysème (N)L’ostéoporose (N)Une attaque ou hémorragie cérébrale (N)Un ulcère à l’estomac (gastrique ou duodénal) (N)
Des troubles musculaires, osseux ou des articulations de longue durée (rhumatismes, arthrites)Le cancerLa cataracte (N)Des migraines ou des maux de tête fréquents (N)
Le diabèteUne allergieDe l’asthmeDe l’hypertension (tension artérielle élevée)
POSER QB44 SI "OUI", CODE 1 en QB43 - LES AUTRES ALLER EN QB45a
Pour quelles raisons suivez-vous un traitement médical de longue durée ? (M)
(MONTRER CARTE – LIRE – PLUSIEURS REPONSES POSSIBLES)
Chronic anxiety or depression (N)Other (SPONTANEOUS)DK
EB59.0 Q21b TREND MODIFIED
Chronic bronchitis, emphysema (N)Osteoporosis (N)Stroke, cerebral haemorrhage (N)Peptic ulcer (gastric or duodenal ulcer) (N)
Long-standing troubles with your muscles, bones and joints (rheumatism, arthritis)CancerCataract (N)Migraine or frequent headaches (N)
DiabetesAn AllergyAsthmaHypertension (high blood pressure)
ASK QB44 IF "YES", CODE 1 in QB43 - OTHERS GO TO QB45a
For what reasons are you undergoing a medical long-term treatment? (M)
(SHOW CARD – READ OUT – MULTIPLE ANSWERS POSSIBLE)
EB662MasterIN_v7 39/52 09/11/2006

QB45a QB45a
(422-434) (422-434)1, 1,2, 2,3, 3,4, 4,5, 5,6, 6,7, 7,8, 8,9, 9,
10, 10,11, 11,12, 12,13, 13,NSP
NEW
Oui, aux hanches ou aux cuissesOui, aux genouxOui, aux chevilles ou aux piedsOui, ailleurs (SPONTANE)
Oui, dans le haut du dosOui, dans les coudesOui, aux poignets ou aux mainsOui, dans le bas du dos
NonOui, à la têteOui, au couOui, aux épaules
A TOUS
Au cours de la semaine écoulée, avez-vous souffert de douleurs aux muscles, aux articulations, au cou ou au dos, vous empêchant d’effectuer normalement vos tâches quotidiennes ? (SI OUI) Pourriez-vous m’indiquer où vous aviez mal ?
(MONTRER CARTE – LIRE – PLUSIEURS REPONSES POSSIBLES)
DK
NEW
Yes, your hips or thighsYes, your kneesYes, your ankles or feetYes, others (SPONTANEOUS)
Yes, your upper backYes, your elbowsYes, your wrists or handsYes, your low back
NoYes, your headYes, your neckYes, your shoulders
ASK ALL
In the last week, have you had any pain affecting your muscles, joints, neck or back which has affected your ability to carry out the activities of daily living? (IF YES) Please tell me which part of the body did you have such pain.
(SHOW CARD – READ OUT – MULTIPLE ANSWERS POSSIBLE)
EB662MasterIN_v7 40/52 09/11/2006
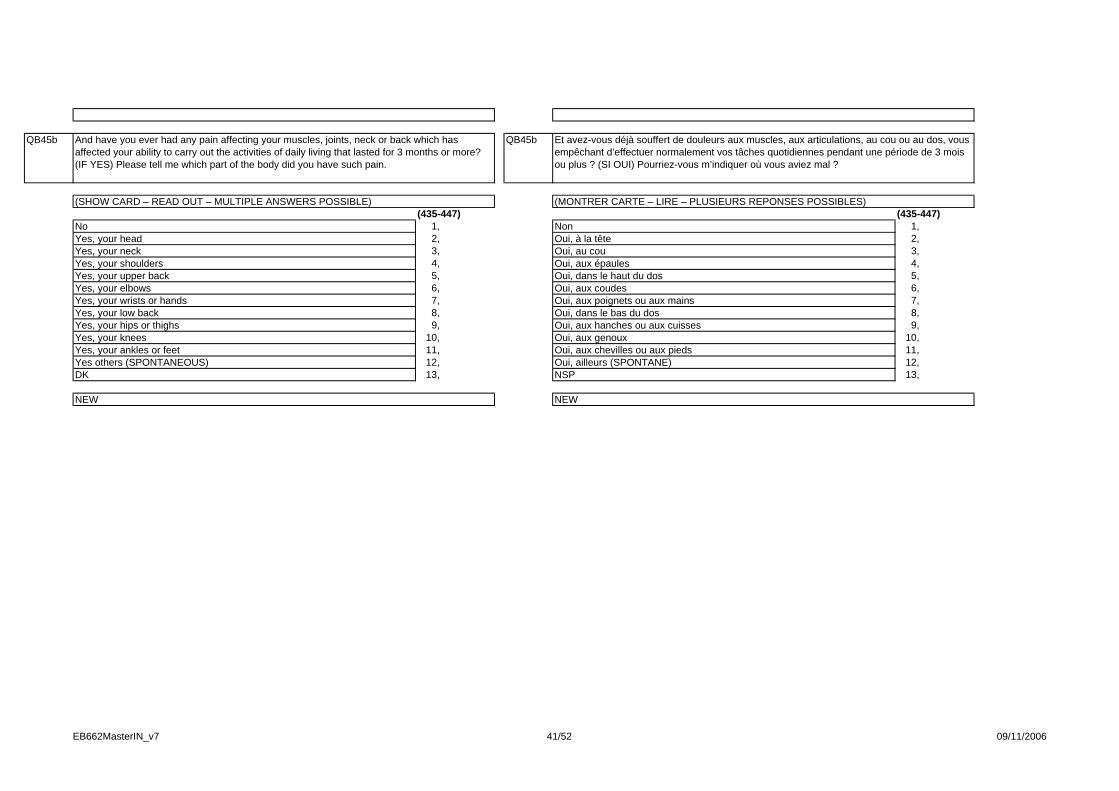
QB45b QB45b
(435-447) (435-447)1, 1,2, 2,3, 3,4, 4,5, 5,6, 6,7, 7,8, 8,9, 9,
10, 10,11, 11,12, 12,13, 13,
Oui, ailleurs (SPONTANE)NSP
NEW
Oui, dans le bas du dosOui, aux hanches ou aux cuissesOui, aux genouxOui, aux chevilles ou aux pieds
Oui, aux épaulesOui, dans le haut du dosOui, aux coudesOui, aux poignets ou aux mains
(MONTRER CARTE – LIRE – PLUSIEURS REPONSES POSSIBLES)
NonOui, à la têteOui, au cou
Et avez-vous déjà souffert de douleurs aux muscles, aux articulations, au cou ou au dos, vous empêchant d’effectuer normalement vos tâches quotidiennes pendant une période de 3 mois ou plus ? (SI OUI) Pourriez-vous m’indiquer où vous aviez mal ?
Yes others (SPONTANEOUS)DK
NEW
Yes, your low backYes, your hips or thighsYes, your kneesYes, your ankles or feet
Yes, your shouldersYes, your upper backYes, your elbowsYes, your wrists or hands
(SHOW CARD – READ OUT – MULTIPLE ANSWERS POSSIBLE)
NoYes, your headYes, your neck
And have you ever had any pain affecting your muscles, joints, neck or back which has affected your ability to carry out the activities of daily living that lasted for 3 months or more? (IF YES) Please tell me which part of the body did you have such pain.
EB662MasterIN_v7 41/52 09/11/2006
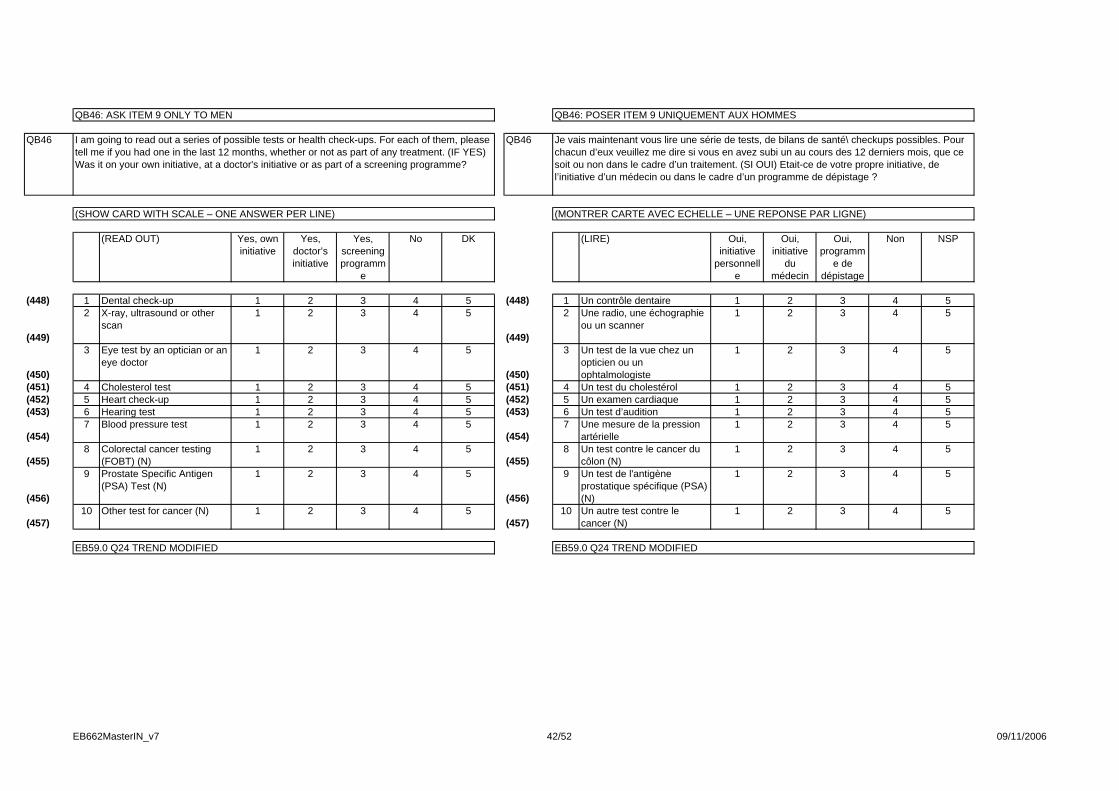
QB46 QB46
(448) 1 (448) 1
(449)
2
(449)
2
(450)
3
(450)
3
(451) 4 (451) 4(452) 5 (452) 5(453) 6 (453) 6
(454)7
(454)7
(455)8
(455)8
(456)
9
(456)
9
(457)10
(457)10
EB59.0 Q24 TREND MODIFIED
4 5
Un autre test contre le cancer (N)
1 2 3 4 5
Un test de l'antigène prostatique spécifique (PSA) (N)
1 2 3
4 5
Un test contre le cancer du côlon (N)
1 2 3 4 5
Une mesure de la pression artérielle
1 2 3
4 5Un test d’audition 1 2 3 4 5Un examen cardiaque 1 2 3
4 5
Un test du cholestérol 1 2 3 4 5
Un test de la vue chez un opticien ou un ophtalmologiste
1 2 3
4 5Une radio, une échographie ou un scanner
1 2 3 4 5Un contrôle dentaire 1 2 3
Je vais maintenant vous lire une série de tests, de bilans de santé\ checkups possibles. Pour chacun d’eux veuillez me dire si vous en avez subi un au cours des 12 derniers mois, que ce soit ou non dans le cadre d’un traitement. (SI OUI) Etait-ce de votre propre initiative, de l’initiative d’un médecin ou dans le cadre d’un programme de dépistage ?
(MONTRER CARTE AVEC ECHELLE – UNE REPONSE PAR LIGNE)
(LIRE) Oui, initiative
personnelle
Oui, initiative
du médecin
Oui, programm
e de dépistage
Non NSP
QB46: POSER ITEM 9 UNIQUEMENT AUX HOMMES
EB59.0 Q24 TREND MODIFIED
4 5
Other test for cancer (N) 1 2 3 4 5
Prostate Specific Antigen (PSA) Test (N)
1 2 3
4 5
Colorectal cancer testing (FOBT) (N)
1 2 3 4 5
Blood pressure test 1 2 3
4 5Hearing test 1 2 3 4 5Heart check-up 1 2 3
4 5
Cholesterol test 1 2 3 4 5
Eye test by an optician or an eye doctor
1 2 3
4 5X-ray, ultrasound or other scan
1 2 3 4 5Dental check-up 1 2 3
I am going to read out a series of possible tests or health check-ups. For each of them, please tell me if you had one in the last 12 months, whether or not as part of any treatment. (IF YES) Was it on your own initiative, at a doctor's initiative or as part of a screening programme?
(SHOW CARD WITH SCALE – ONE ANSWER PER LINE)
(READ OUT) Yes, own initiative
Yes, doctor’s initiative
Yes, screening programm
e
No DK
QB46: ASK ITEM 9 ONLY TO MEN
EB662MasterIN_v7 42/52 09/11/2006

QB47 QB47
(458) (458)1 12 23 34 4
QB48 QB48
(459) (459)1 12 23 3
QB49 QB49
(460) (460)1 12 23 34 4
Il y a 1-5 ansPas au cours des 5 dernières années ou jamaisNSP\ Ne se souvient plus
NEW
Quand est-ce que votre cholestérol a été testé pour la dernière fois par une personne du corps médical ?
(LIRE – UNE SEULE REPONSE)
Au cours des 12 derniers mois
OuiNonNSP
NEW
NEW
Avez-vous récemment changé votre mode de vie pour faire baisser votre pression artérielle ?
Au cours des 12 derniers moisIl y a 1-5 ansPas au cours des 5 dernières années ou jamaisNSP\ Ne se souvient plus
Quand est-ce que votre pression artérielle a été mesurée pour la dernière fois par une personne du corps médical ?
(LIRE – UNE SEULE REPONSE)
1 – 5 years ago Not within the past 5 years or neverDK\ Do not remember
NEW
When was your blood cholesterol last measured by a health professional?
(READ OUT – ONE ANSWER ONLY)
Within the past 12 months
YesNoDK
NEW
NEW
Have you recently changed your way of life in order to lower your blood pressure?
Within the past 12 months1 – 5 years ago Not within the past 5 years or neverDK\ Do not remember
When was your blood pressure last measured by a health professional?
(READ OUT – ONE ANSWER ONLY)
EB662MasterIN_v7 43/52 09/11/2006

QB50 QB50
(461) (461)1 12 23 3
QB51 QB51
(462) (462)1 12 23 34 45 5
QB52 QB52
(463) (463)1 12 23 3
EB59.0 Q26
OuiNonNSP\ Refus
EB59.0 Q25 TREND SLIGHTLY MODIFIED
POSER QB52 AUX FEMMES DE PLUS DE 50 ANS - LES AUTRES ALLER EN QB53
Suivez-vous actuellement un traitement hormonal pour la ménopause ?
Bien informéePas bien informéePas du tout bien informéeNSP
Dans quelle mesure vous sentez-vous informée à propos du traitement hormonal pour les femmes durant la ménopause ? (M)
(MONTRER CARTE – LIRE – UNE SEULE REPONSE)
Très bien informée
NonNSP
NEW
POSER QB51 A QB53 AUX FEMMES, CODE 2 en D10 - LES HOMMES ALLER AUX DEMOGRAPHIQUES
Avez-vous récemment changé votre mode de vie pour faire baisser votre cholestérol ?
Oui
EB59.0 Q26
YesNoDK\ Refusal
EB59.0 Q25 TREND SLIGHTLY MODIFIED
ASK QB52 TO WOMEN OLDER THAN 50 YEARS OLD - OTHERS GO TO QB53
Are you on hormone replacement therapy?
Fairly well informedNot very well informed Not at all well informedDK
How informed do you feel about hormone replacement therapy (HRT) for women going through the menopause? (M)
(SHOW CARD – READ OUT – ONE ANSWER ONLY)
Very well informed
NoDK
NEW
ASK QB51 TO QB53 TO WOMEN, CODE 2 in D10 - MEN GO TO DEMOGRAPHICS
Have you recently changed your way of life in order to lower your blood cholesterol?
Yes
EB662MasterIN_v7 44/52 09/11/2006
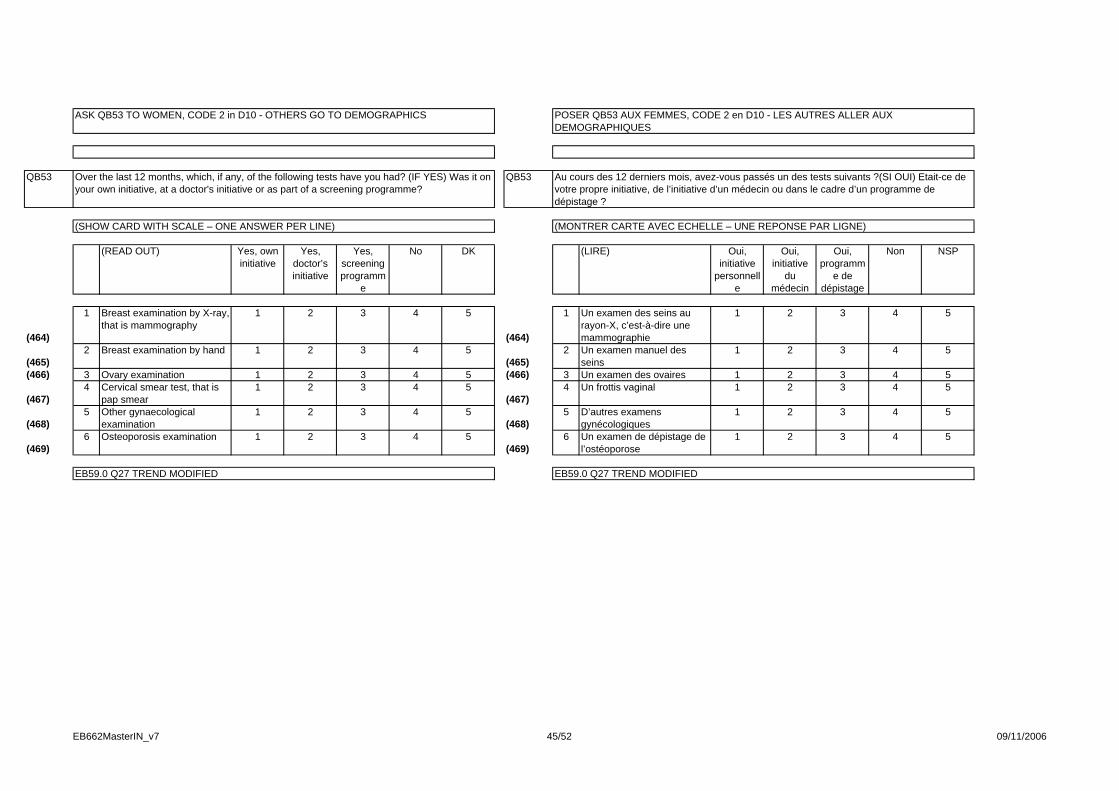
QB53 QB53
(464)
1
(464)
1
(465)2
(465)2
(466) 3 (466) 3
(467)4
(467)4
(468)5
(468)5
(469)6
(469)6
EB59.0 Q27 TREND MODIFIED
4 5
Un examen de dépistage de l’ostéoporose
1 2 3 4 5
D’autres examens gynécologiques
1 2 3
4 5Un frottis vaginal 1 2 3 4 5Un examen des ovaires 1 2 3
4 5
Un examen manuel des seins
1 2 3 4 5
Un examen des seins au rayon-X, c’est-à-dire une mammographie
1 2 3
(MONTRER CARTE AVEC ECHELLE – UNE REPONSE PAR LIGNE)
(LIRE) Oui, initiative
personnelle
Oui, initiative
du médecin
Oui, programm
e de dépistage
Non NSP
POSER QB53 AUX FEMMES, CODE 2 en D10 - LES AUTRES ALLER AUX DEMOGRAPHIQUES
Au cours des 12 derniers mois, avez-vous passés un des tests suivants ?(SI OUI) Etait-ce de votre propre initiative, de l’initiative d’un médecin ou dans le cadre d’un programme de dépistage ?
EB59.0 Q27 TREND MODIFIED
4 5
Osteoporosis examination 1 2 3 4 5
Other gynaecological examination
1 2 3
4 5Cervical smear test, that is pap smear
1 2 3 4 5Ovary examination 1 2 3
4 5
Breast examination by hand 1 2 3 4 5
Breast examination by X-ray, that is mammography
1 2 3
(SHOW CARD WITH SCALE – ONE ANSWER PER LINE)
(READ OUT) Yes, own initiative
Yes, doctor’s initiative
Yes, screening programm
e
No DK
ASK QB53 TO WOMEN, CODE 2 in D10 - OTHERS GO TO DEMOGRAPHICS
Over the last 12 months, which, if any, of the following tests have you had? (IF YES) Was it on your own initiative, at a doctor's initiative or as part of a screening programme?
EB662MasterIN_v7 45/52 09/11/2006

D1 D1
(470-471) (470-471)
1 2 3 4 5 6 7 8 9 10 1 2 3 4 5 6 7 8 9 10
11 11
12 12
D7 D7
(472-473) (472-473)1 12 23 34 4
5 56 67 78 89 9
10 10
D8 D8
(474-475) (474-475)(ENQ. : SI "ETUDIE ENCORE", CODER ‘00’)
EB66.1 D8
Autre (SPONTANE)Refus (SPONTANE)
EB66.1 D7
A quel âge avez-vous arrêté vos études à temps complet ?
Célibataire ayant déjà vécu en couple dans le passé mais actuellement seul(e)Divorcé(e)Séparé(e)Veuf\Veuve
Marié(e)Remarié(e)Célibataire vivant actuellement en couple Célibataire n'ayant jamais vécu en couple
EB66.1 D1
PAS DE QUESTIONS D2 A D6
Pouvez-vous m'indiquer la lettre qui correspond le mieux à votre situation actuelle ?
(MONTRER CARTE - LIRE - UNE SEULE REPONSE)
Gauche Droite
Refus
NSP
DEMOGRAPHIQUES
A propos de politique, les gens parlent de "droite" et de "gauche". Vous-même, voudriez-vous situer votre position sur cette échelle ?
(MONTRER CARTE) - (ENQ. : NE RIEN SUGGERER. SI LA PERSONNE HESITE, INSISTER)
(INT.: IF "STILL STUDYING", CODE ‘00’)
EB66.1 D8
Other (SPONTANEOUS)Refusal (SPONTANEOUS)
EB66.1 D7
How old were you when you stopped full-time education?
Unmarried, having previously lived with a partner, but now on my own
DivorcedSeparatedWidowed
MarriedRemarriedUnmarried, currently living with partnerUnmarried, having never lived with a partner
EB66.1 D1
NO QUESTIONS D2 TO D6
Could you give me the letter which corresponds best to your own current situation?
(SHOW CARD - READ OUT - ONE ANSWER ONLY)
Left Right
Refusal
DK
DEMOGRAPHICS
In political matters people talk of "the left" and "the right".How would you place your views on this scale?
(SHOW CARD) - (INT.: DO NOT PROMPT - IF CONTACT HESITATES, TRY AGAIN)
EB662MasterIN_v7 46/52 09/11/2006
D25 D25
(476) (476)1 12 23 34 4
D40a D40a
(477-478) (477-478)
D40b D40b
(479-480) (479-480)
EB66.1 D40b
(ENQ. : LIRE - NOTER EN CLAIR)
EB66.1 D40a
Pouvez-vous me dire combien d’enfants de moins de 10 ans vivent dans votre foyer ?
ENQ. : LIRE - NOTER EN CLAIR)
NSP
EB66.1 D25
PAS DE QUESTIONS D26 A D39
Pouvez-vous me dire combien de personnes âgées de 15 ans et plus vivent dans votre foyer, y compris vous-même ?
(LIRE)
Dans une commune ruraleDans une ville petite ou moyenneDans une grande ville
PAS DE QUESTIONS D12 A D14
D15a&b POSEES AVANT QB
PAS DE QUESTIONS D16 A D24
Diriez-vous que vous vivez … ?
PAS DE QUESTION D9
D10 ET D11 POSEE AVANT QB
EB66.1 D40b
INT.: READ OUT - WRITE DOWN)
EB66.1 D40a
Could you tell me how many children less than 10 years old live in your household?
INT.: READ OUT - WRITE DOWN)
DK
EB66.1 D25
NO QUESTIONS D26 TO D39
Could you tell me how many people aged 15 years or more live in your household, yourself included?
(READ OUT)
Rural area or villageSmall or middle sized townLarge town
NO QUESTION D12 TO D14
D15a&b ASKED BEFOR QB
NO QUESTIONS D16 TO D24
Would you say you live in a...?
NO QUESTION D9
D10 AND D11 ASKED BEFORE QB
EB662MasterIN_v7 47/52 09/11/2006

D40c D40c
(481-482) (481-482)
D41 D41
(483) (483)1 12 23 34 45 56 6
D42 D42
(484) (484)1 1
2 2
3 3
4 45 56 6
Votre père et votre mère sont nés en dehors de l’Union européenneNSP \ Refus (SPONTANE)
EB65.4 D42
Votre mère et votre père sont nés en (NOTRE PAYS)L’un de vos parents est né en (NOTRE PAYS) et l’autre est né dans un autre Etat membre de l’Union européenneVotre mère et votre père sont nés dans un autre Etat membre de l’Union européenneUn de vos parents est né en (NOTRE PAYS) et l’autre est né en dehors de l’Union européenne
EB66.1 D41
NE PAS POSER D42 item 5 en BG et RO
Laquelle de ces propositions correspond à votre situation ?
(MONTRER CATRE - LIRE - UNE SEULE REPONSE)
En Europe, mais pas dans un Etat membre de l’Union européenneEn Asie, en Afrique ou en Amérique latineEn Amérique du Nord, au Japon ou en OcéanieRefus (SPONTANE)
Vous-même, êtes-vous né(e) ?
(MONTRER CATRE - LIRE - UNE SEULE REPONSE)
En (NOTRE PAYS)Dans un autre Etat membre de l’Union européenne
Pouvez-vous me dire combien d’enfants de 10 à 14 ans vivent dans votre foyer ?
ENQ. : LIRE - NOTER EN CLAIR)
EB66.1 D40c
Your mother and your father were born outside the European UnionDK\Refusal (SPONTANEOUS)
EB65.4 D42
Your mother and your father were born in (OUR COUNTRY)One of your parents was born in (OUR COUNTRY) and the other was born in another Member State of the European UnionYour mother and your father were born in another Member State of the European UnionOne of your parents was born in (OUR COUNTRY) and the other was born outside of the European Union
EB66.1 D41
DO NOT ASK D42 item 5 in BG and RO
Which of these proposals corresponds to your situation?
(SHOW CARD - READ OUT - ONE ANSWER ONLY)
In Europe, but not in a Member Country of the European UnionIn Asia, in Africa or in Latin AmericaIn Northern America, in Japan or in OceaniaRefusal (SPONTANEOUS)
You personally, were you born…?
(SHOW CARD - READ OUT - ONE ANSWER ONLY)
In (OUR COUNTRY)In another Member Country of the European Union
Could you tell me how many children aged 10 to 14 years old live in your household?
INT.: READ OUT - WRITE DOWN)
EB66.1 D40c
EB662MasterIN_v7 48/52 09/11/2006

D43a D43a
D43b D43b(485) (486) (485) (486)
D46 D46
(487-496) (487-496)1, 1,2, 2,3, 3,4, 4,5, 5,6, 6,7, 7,8, 8,9, 9,
10, 10,NSP
EB66.1 D46
Une voitureUn appartement \ Une maison que vous avez fini de payerUn appartement \ Une maison que vous êtes en train de payerAucun (SPONTANE)
Un lecteur DVDUn lecteur CD audioUn ordinateurUne connexion Internet à la maison
Parmi les biens suivants, lesquels possédez-vous ?
(MONTRER CARTE - LIRE - PLUSIEURS REPONSES POSSIBLES)
Une télévision
Non 2 2
EB66.1 D43a D43b
Fixe MobileOui 1 1
Possédez-vous un téléphone mobile\ GSM\ portable personnel ?
D43a D43b
Possédez-vous un téléphone fixe dans votre foyer ?
DK
EB66.1 D46
A carAn apartment \ a house which you have finished paying forAn apartment \ a house which you are paying forNone (SPONTANEOUS)
DVD playerMusic CD playerComputerAn Internet connection at home
Which of the following goods do you have?
(SHOW CARD - READ OUT - SEVERAL ANSWERS POSSIBLE)
Television
No 2 2
EB66.1 D43a D43b
Fixed MobileYes 1 1
Do you own a personal mobile telephone?
D43a D43b
Do you own a fixed telephone in your household?
EB662MasterIN_v7 49/52 09/11/2006

P1 P1(497-498) (499-500) (497-498) (499-500)
P2 P2
(501-502) (503-504) (501-502) (503-504)
P3 P3(505-507) (505-507)
P4 P4(508) (508)
1 12 23 34 4
P5 P5(509) (509)
1 12 23 34 4
MoyenneMédiocre
EB66.1 P5
EB66.1 P4
Coopération du répondant
ExcellenteBonne
Deux (l'enquêteur et le répondant)TroisQuatreCinq et plus
DUREE DE L'INTERVIEW EN MINUTES
MINUTES
EB66.1 P3
Nombre de personnes présentes pendant l'interview, l'enquêteur inclus.
(ENQ. : DE 0 A 23 HEURE)
HEURE MINUTES
EB66.1 P2
JOUR MOIS
EB66.1 P1
HEURE DU DEBUT DE L'INTERVIEW
PROTOCOLE D'INTERVIEW
DATE DE L'INTERVIEW
AverageBad
EB66.1 P5
EB66.1 P4
Respondent cooperation
ExcellentFair
Two (interviewer and respondent)ThreeFourFive or more
NUMBER OF MINUTES THE INTERVIEW LASTED
MINUTES
EB66.1 P3
Number of persons present during the interview, including interviewer
(INT.:USE 24 HOUR CLOCK)
HOUR MINUTES
EB66.1 P2
DAY MONTH
EB66.1 P1
TIME OF THE BEGINNING OF THE INTERVIEW
INTERVIEW PROTOCOLE
DATE OF INTERVIEW
EB662MasterIN_v7 50/52 09/11/2006
P6 P6
(510-511) (510-511)
P7 P7
(512-513) (512-513)
P8 P8(514-521) (514-521)
P9 P9(522-529) (522-529)
P10 P10(530-537) (530-537)
P11 P11(538-545) (538-545)
EB66.1 P11
EB66.1 P9
N° enquêteur
EB66.1 P10
Facteur de pondération
EB66.1 P7
Code postal
EB66.1 P8
N° point de chute
(CODES LOCAUX)
EB66.1 P6
Région
(CODES LOCAUX)
Catégorie d'habitat
EB66.1 P11
EB66.1 P9
Interviewer number
EB66.1 P10
Weighting factor
EB66.1 P7
Postal code
EB66.1 P8
Sample point number
(LOCAL CODES)
EB66.1 P6
Region
(LOCAL CODES)
Size of locality
EB662MasterIN_v7 51/52 09/11/2006

P13 P13(546) (546)
1 12 23 3
Langue 2Langue 3
EB66.1 P13
POSER UNIQUEMENT en LU, BE, ES, FI, EE, LV et MT
Langue de l'interview
Langue 1Language 2Language 3
EB66.1 P13
ASK ONLY in LU, BE, ES, FI, EE, LV and MT
Language of interview
Language 1
EB662MasterIN_v7 52/52 09/11/2006

TABLES
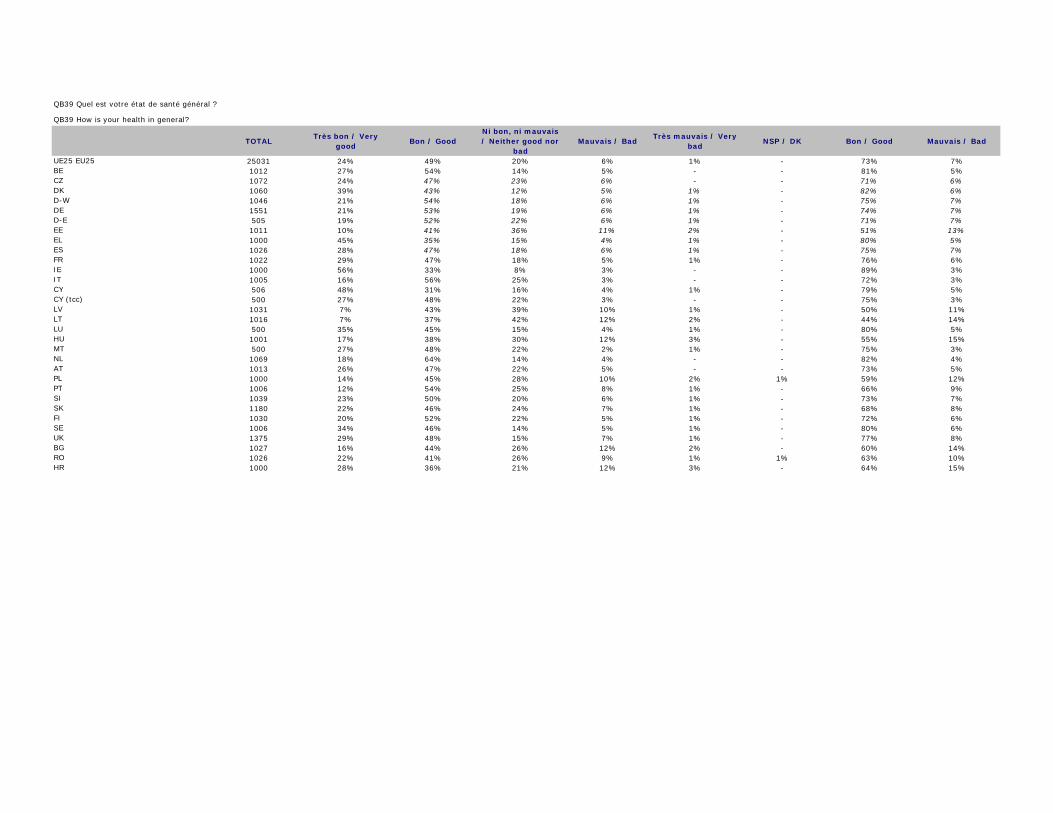
TOTALTrès bon / Very
goodBon / Good
Ni bon, ni mauvais / Neither good nor
badMauvais / Bad
Très mauvais / Very bad
NSP / DK Bon / Good Mauvais / Bad
UE25 EU25 25031 24% 49% 20% 6% 1% - 73% 7%BE 1012 27% 54% 14% 5% - - 81% 5%CZ 1072 24% 47% 23% 6% - - 71% 6%DK 1060 39% 43% 12% 5% 1% - 82% 6%D-W 1046 21% 54% 18% 6% 1% - 75% 7%DE 1551 21% 53% 19% 6% 1% - 74% 7%D-E 505 19% 52% 22% 6% 1% - 71% 7%EE 1011 10% 41% 36% 11% 2% - 51% 13%EL 1000 45% 35% 15% 4% 1% - 80% 5%ES 1026 28% 47% 18% 6% 1% - 75% 7%FR 1022 29% 47% 18% 5% 1% - 76% 6%IE 1000 56% 33% 8% 3% - - 89% 3%IT 1005 16% 56% 25% 3% - - 72% 3%CY 506 48% 31% 16% 4% 1% - 79% 5%CY (tcc) 500 27% 48% 22% 3% - - 75% 3%LV 1031 7% 43% 39% 10% 1% - 50% 11%LT 1016 7% 37% 42% 12% 2% - 44% 14%LU 500 35% 45% 15% 4% 1% - 80% 5%HU 1001 17% 38% 30% 12% 3% - 55% 15%MT 500 27% 48% 22% 2% 1% - 75% 3%NL 1069 18% 64% 14% 4% - - 82% 4%AT 1013 26% 47% 22% 5% - - 73% 5%PL 1000 14% 45% 28% 10% 2% 1% 59% 12%PT 1006 12% 54% 25% 8% 1% - 66% 9%SI 1039 23% 50% 20% 6% 1% - 73% 7%SK 1180 22% 46% 24% 7% 1% - 68% 8%FI 1030 20% 52% 22% 5% 1% - 72% 6%SE 1006 34% 46% 14% 5% 1% - 80% 6%UK 1375 29% 48% 15% 7% 1% - 77% 8%BG 1027 16% 44% 26% 12% 2% - 60% 14%RO 1026 22% 41% 26% 9% 1% 1% 63% 10%HR 1000 28% 36% 21% 12% 3% - 64% 15%
QB39 Quel est votre état de santé général ?
QB39 How is your health in general?
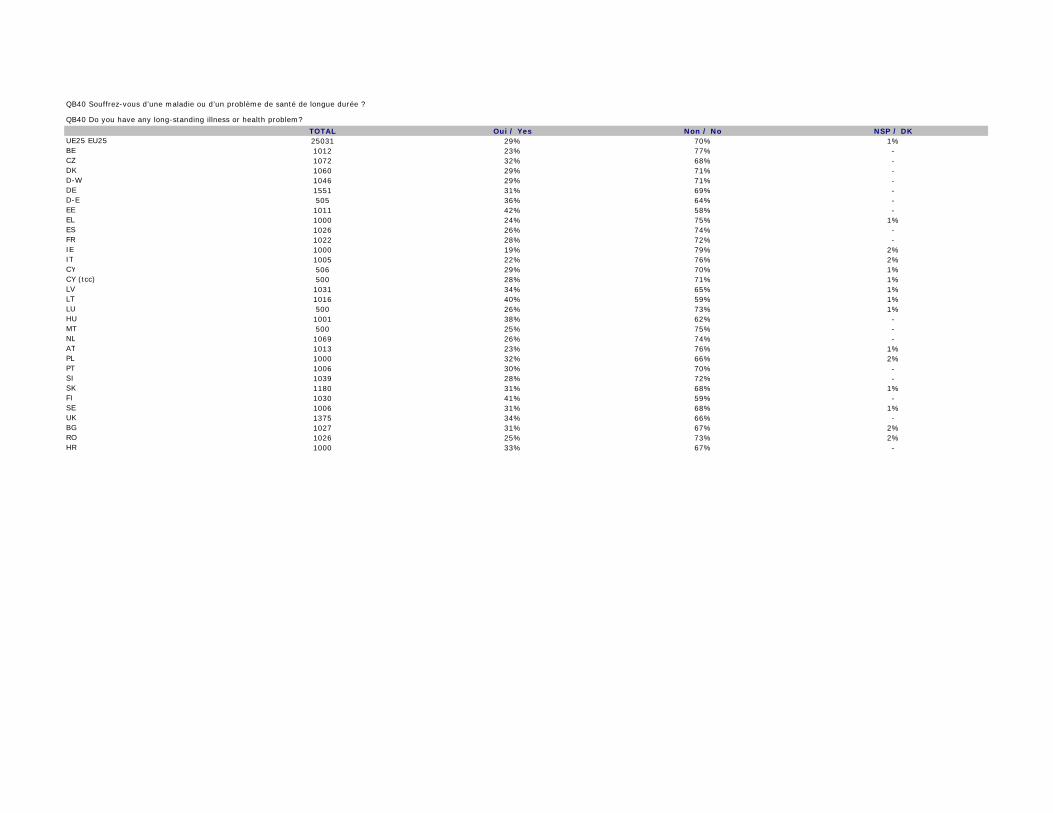
TOTAL Oui / Yes Non / No NSP / DKUE25 EU25 25031 29% 70% 1%BE 1012 23% 77% - CZ 1072 32% 68% - DK 1060 29% 71% - D-W 1046 29% 71% - DE 1551 31% 69% - D-E 505 36% 64% - EE 1011 42% 58% - EL 1000 24% 75% 1%ES 1026 26% 74% - FR 1022 28% 72% - IE 1000 19% 79% 2%IT 1005 22% 76% 2%CY 506 29% 70% 1%CY (tcc) 500 28% 71% 1%LV 1031 34% 65% 1%LT 1016 40% 59% 1%LU 500 26% 73% 1%HU 1001 38% 62% - MT 500 25% 75% - NL 1069 26% 74% - AT 1013 23% 76% 1%PL 1000 32% 66% 2%PT 1006 30% 70% - SI 1039 28% 72% - SK 1180 31% 68% 1%FI 1030 41% 59% - SE 1006 31% 68% 1%UK 1375 34% 66% - BG 1027 31% 67% 2%RO 1026 25% 73% 2%HR 1000 33% 67% -
QB40 Souffrez-vous d’une maladie ou d’un problème de santé de longue durée ?
QB40 Do you have any long-standing illness or health problem?

TOTALGrandement limité(e) / Severely
limitedRelativement limité(e) / Somewhat
limitedPas du tout limité(e) / Not limited
at all NSP / DK
UE25 EU25 25031 7% 22% 70% 1%BE 1012 7% 18% 75% - CZ 1072 4% 29% 66% 1%DK 1060 7% 25% 66% 2%D-W 1046 7% 22% 70% 1%DE 1551 7% 22% 70% 1%D-E 505 7% 24% 68% 1%EE 1011 8% 30% 61% 1%EL 1000 5% 13% 82% - ES 1026 4% 19% 76% 1%FR 1022 10% 15% 75% - IE 1000 2% 14% 76% 8%IT 1005 5% 24% 68% 3%CY 506 7% 16% 76% 1%CY (tcc) 500 6% 17% 76% 1%LV 1031 8% 30% 61% 1%LT 1016 10% 25% 64% 1%LU 500 6% 14% 77% 3%HU 1001 11% 28% 60% 1%MT 500 4% 19% 76% 1%NL 1069 6% 25% 68% 1%AT 1013 3% 30% 67% - PL 1000 7% 27% 63% 3%PT 1006 5% 18% 75% 2%SI 1039 5% 25% 70% - SK 1180 7% 27% 65% 1%FI 1030 7% 26% 67% - SE 1006 10% 20% 70% - UK 1375 7% 21% 71% 1%BG 1027 3% 28% 67% 2%RO 1026 5% 18% 70% 7%HR 1000 9% 20% 64% 7%
QB41 Au cours des 6 derniers mois, dans quelle mesure avez-vous été empêché(e) d’exercer des activités que les personnes font normalement, en raison d’un problème de santé ? Diriez-vous que vous avez été … ?
QB41 Over the past 6 months, to what extent, if at all, have you been limited in activities people normally do, because of a health problem? Would you say you have been…?

TOTAL Oui / Yes Non / No NSP / DKUE25 EU25 25031 6% 93% 1%BE 1012 5% 95% - CZ 1072 8% 92% - DK 1060 6% 94% - D-W 1046 6% 94% - DE 1551 6% 93% 1%D-E 505 8% 91% 1%EE 1011 4% 96% - EL 1000 6% 94% - ES 1026 6% 94% - FR 1022 5% 94% 1%IE 1000 3% 96% 1%IT 1005 5% 92% 3%CY 506 7% 93% - CY (tcc) 500 12% 88% - LV 1031 3% 96% 1%LT 1016 4% 96% - LU 500 5% 95% - HU 1001 7% 92% 1%MT 500 6% 93% 1%NL 1069 5% 95% - AT 1013 7% 92% 1%PL 1000 5% 93% 2%PT 1006 8% 91% 1%SI 1039 6% 94% - SK 1180 5% 94% 1%FI 1030 7% 93% - SE 1006 4% 96% - UK 1375 6% 94% - BG 1027 4% 94% 2%RO 1026 4% 95% 1%HR 1000 6% 93% 1%
Diabetes
QB42.1 Avez-vous ou avez-vous eu une des maladies suivantes ?
QB42.1 Do you have or have you ever had any of the following health problems?
Le diabète

TOTAL Oui / Yes Non / No NSP / DKUE25 EU25 25031 17% 82% 1%BE 1012 24% 75% 1%CZ 1072 18% 82% - DK 1060 27% 73% - D-W 1046 16% 84% - DE 1551 17% 83% - D-E 505 19% 81% - EE 1011 22% 77% 1%EL 1000 8% 92% - ES 1026 7% 93% - FR 1022 24% 76% - IE 1000 7% 92% 1%IT 1005 12% 86% 2%CY 506 16% 84% - CY (tcc) 500 15% 84% 1%LV 1031 14% 85% 1%LT 1016 15% 85% - LU 500 21% 78% 1%HU 1001 14% 86% - MT 500 18% 82% - NL 1069 31% 69% - AT 1013 16% 83% 1%PL 1000 13% 85% 2%PT 1006 15% 84% 1%SI 1039 19% 81% - SK 1180 18% 81% 1%FI 1030 23% 77% - SE 1006 34% 66% - UK 1375 23% 76% 1%BG 1027 8% 90% 2%RO 1026 16% 82% 2%HR 1000 15% 84% 1%
An Allergy
QB42.2 Avez-vous ou avez-vous eu une des maladies suivantes ?
QB42.2 Do you have or have you ever had any of the following health problems?
Une allergie

TOTAL Oui / Yes Non / No NSP / DKUE25 EU25 25031 7% 92% 1%BE 1012 8% 92% - CZ 1072 5% 95% - DK 1060 11% 89% - D-W 1046 4% 95% 1%DE 1551 5% 95% - D-E 505 6% 94% - EE 1011 5% 95% - EL 1000 4% 96% - ES 1026 3% 97% - FR 1022 11% 89% - IE 1000 7% 92% 1%IT 1005 5% 94% 1%CY 506 5% 95% - CY (tcc) 500 7% 93% - LV 1031 3% 96% 1%LT 1016 3% 97% - LU 500 10% 90% - HU 1001 6% 94% - MT 500 9% 91% - NL 1069 9% 91% - AT 1013 6% 94% - PL 1000 5% 93% 2%PT 1006 8% 91% 1%SI 1039 7% 93% - SK 1180 4% 95% 1%FI 1030 8% 92% - SE 1006 11% 89% - UK 1375 16% 84% - BG 1027 3% 95% 2%RO 1026 3% 95% 2%HR 1000 4% 95% 1%
Asthma
QB42.3 Avez-vous ou avez-vous eu une des maladies suivantes ?
QB42.3 Do you have or have you ever had any of the following health problems?
De l’asthme
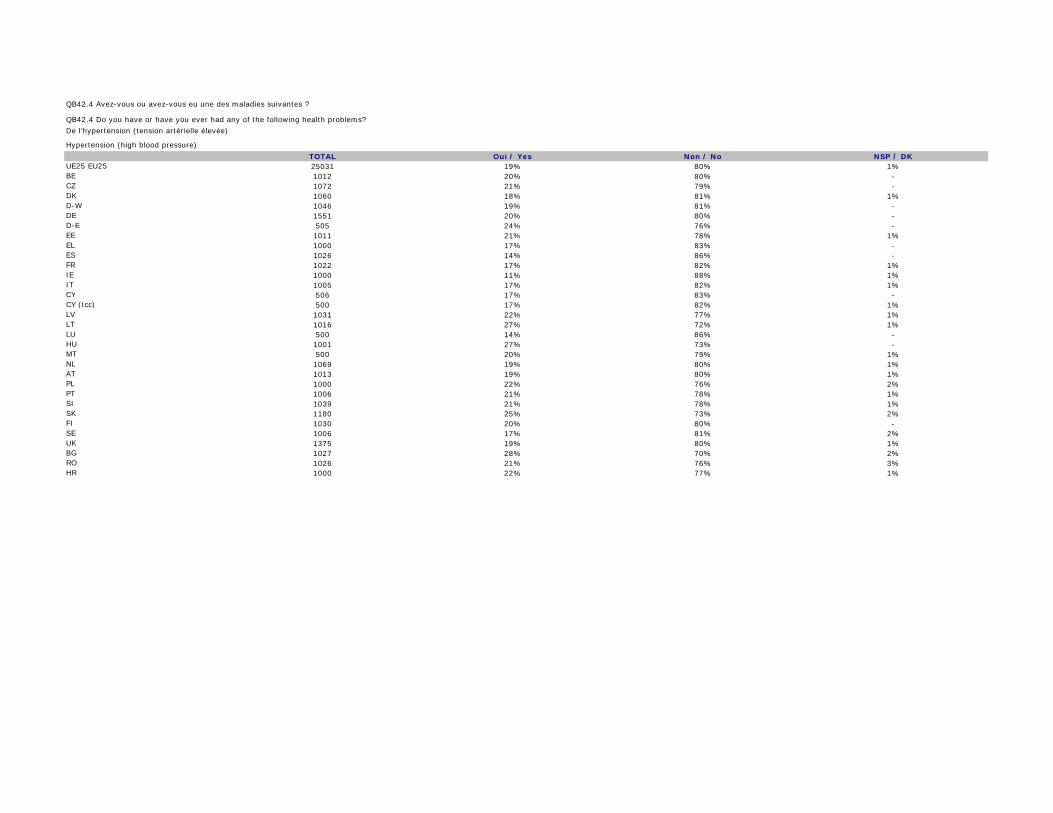
TOTAL Oui / Yes Non / No NSP / DKUE25 EU25 25031 19% 80% 1%BE 1012 20% 80% - CZ 1072 21% 79% - DK 1060 18% 81% 1%D-W 1046 19% 81% - DE 1551 20% 80% - D-E 505 24% 76% - EE 1011 21% 78% 1%EL 1000 17% 83% - ES 1026 14% 86% - FR 1022 17% 82% 1%IE 1000 11% 88% 1%IT 1005 17% 82% 1%CY 506 17% 83% - CY (tcc) 500 17% 82% 1%LV 1031 22% 77% 1%LT 1016 27% 72% 1%LU 500 14% 86% - HU 1001 27% 73% - MT 500 20% 79% 1%NL 1069 19% 80% 1%AT 1013 19% 80% 1%PL 1000 22% 76% 2%PT 1006 21% 78% 1%SI 1039 21% 78% 1%SK 1180 25% 73% 2%FI 1030 20% 80% - SE 1006 17% 81% 2%UK 1375 19% 80% 1%BG 1027 28% 70% 2%RO 1026 21% 76% 3%HR 1000 22% 77% 1%
Hypertension (high blood pressure)
QB42.4 Avez-vous ou avez-vous eu une des maladies suivantes ?
QB42.4 Do you have or have you ever had any of the following health problems?
De l’hypertension (tension artérielle élevée)
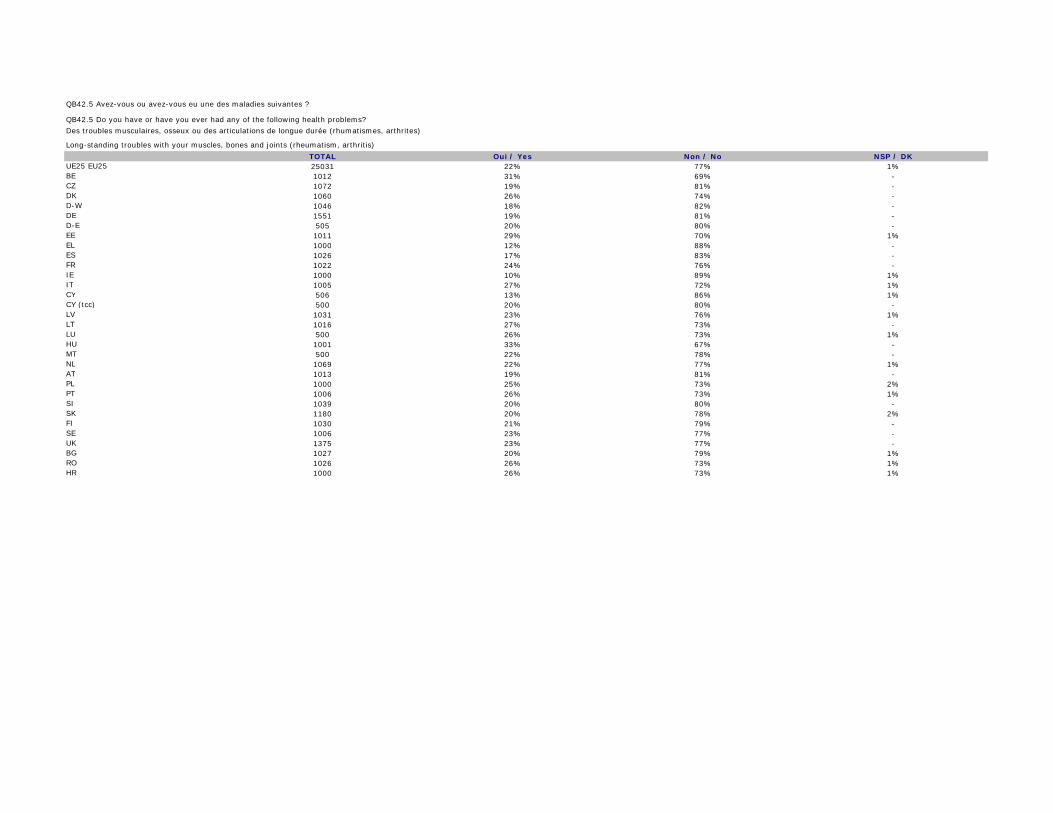
TOTAL Oui / Yes Non / No NSP / DKUE25 EU25 25031 22% 77% 1%BE 1012 31% 69% - CZ 1072 19% 81% - DK 1060 26% 74% - D-W 1046 18% 82% - DE 1551 19% 81% - D-E 505 20% 80% - EE 1011 29% 70% 1%EL 1000 12% 88% - ES 1026 17% 83% - FR 1022 24% 76% - IE 1000 10% 89% 1%IT 1005 27% 72% 1%CY 506 13% 86% 1%CY (tcc) 500 20% 80% - LV 1031 23% 76% 1%LT 1016 27% 73% - LU 500 26% 73% 1%HU 1001 33% 67% - MT 500 22% 78% - NL 1069 22% 77% 1%AT 1013 19% 81% - PL 1000 25% 73% 2%PT 1006 26% 73% 1%SI 1039 20% 80% - SK 1180 20% 78% 2%FI 1030 21% 79% - SE 1006 23% 77% - UK 1375 23% 77% - BG 1027 20% 79% 1%RO 1026 26% 73% 1%HR 1000 26% 73% 1%
Long-standing troubles with your muscles, bones and joints (rheumatism, arthritis)
QB42.5 Avez-vous ou avez-vous eu une des maladies suivantes ?
QB42.5 Do you have or have you ever had any of the following health problems?
Des troubles musculaires, osseux ou des articulations de longue durée (rhumatismes, arthrites)
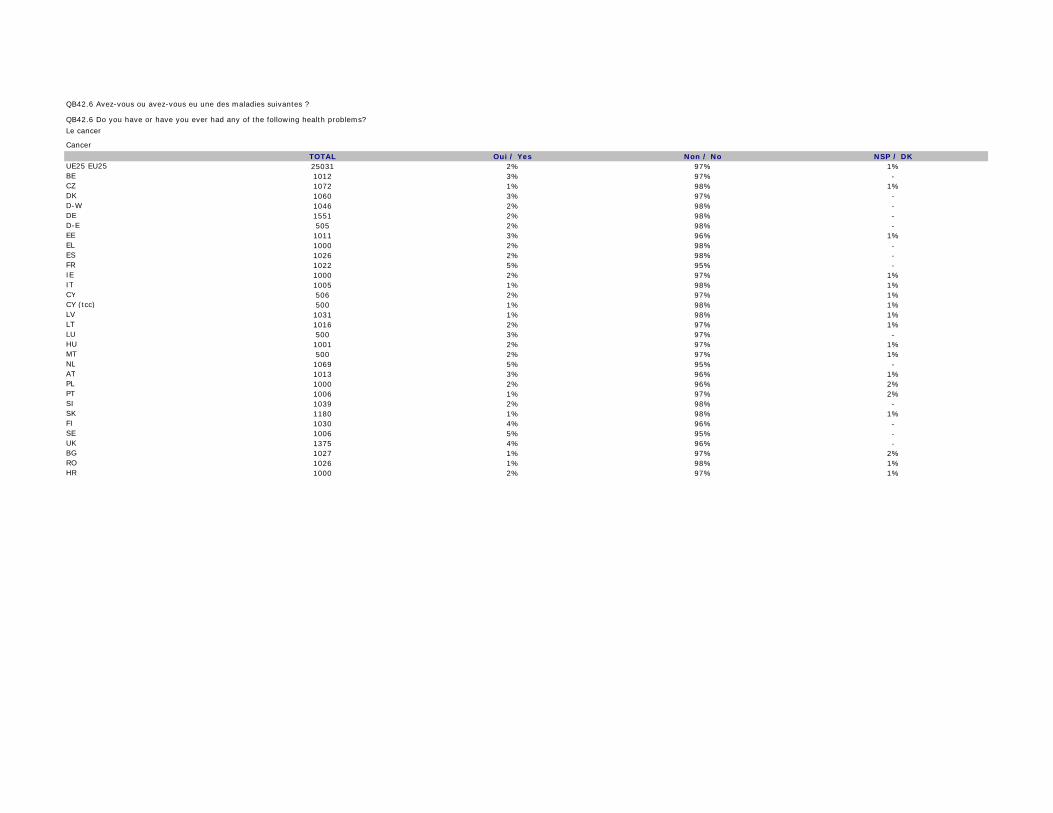
TOTAL Oui / Yes Non / No NSP / DKUE25 EU25 25031 2% 97% 1%BE 1012 3% 97% - CZ 1072 1% 98% 1%DK 1060 3% 97% - D-W 1046 2% 98% - DE 1551 2% 98% - D-E 505 2% 98% - EE 1011 3% 96% 1%EL 1000 2% 98% - ES 1026 2% 98% - FR 1022 5% 95% - IE 1000 2% 97% 1%IT 1005 1% 98% 1%CY 506 2% 97% 1%CY (tcc) 500 1% 98% 1%LV 1031 1% 98% 1%LT 1016 2% 97% 1%LU 500 3% 97% - HU 1001 2% 97% 1%MT 500 2% 97% 1%NL 1069 5% 95% - AT 1013 3% 96% 1%PL 1000 2% 96% 2%PT 1006 1% 97% 2%SI 1039 2% 98% - SK 1180 1% 98% 1%FI 1030 4% 96% - SE 1006 5% 95% - UK 1375 4% 96% - BG 1027 1% 97% 2%RO 1026 1% 98% 1%HR 1000 2% 97% 1%
Cancer
QB42.6 Avez-vous ou avez-vous eu une des maladies suivantes ?
QB42.6 Do you have or have you ever had any of the following health problems?
Le cancer

TOTAL Oui / Yes Non / No NSP / DKUE25 EU25 25031 4% 95% 1%BE 1012 4% 96% - CZ 1072 3% 97% - DK 1060 4% 96% - D-W 1046 3% 97% - DE 1551 3% 97% - D-E 505 3% 96% 1%EE 1011 4% 95% 1%EL 1000 4% 96% - ES 1026 2% 98% - FR 1022 6% 94% - IE 1000 1% 98% 1%IT 1005 3% 96% 1%CY 506 5% 95% - CY (tcc) 500 6% 94% - LV 1031 2% 97% 1%LT 1016 3% 96% 1%LU 500 4% 96% - HU 1001 4% 95% 1%MT 500 5% 95% - NL 1069 5% 94% 1%AT 1013 4% 95% 1%PL 1000 4% 94% 2%PT 1006 4% 95% 1%SI 1039 4% 96% - SK 1180 3% 96% 1%FI 1030 4% 96% - SE 1006 5% 95% - UK 1375 7% 93% - BG 1027 4% 94% 2%RO 1026 3% 96% 1%HR 1000 3% 96% 1%
Cataract
QB42.7 Avez-vous ou avez-vous eu une des maladies suivantes ?
QB42.7 Do you have or have you ever had any of the following health problems?
La cataracte

TOTAL Oui / Yes Non / No NSP / DKUE25 EU25 25031 16% 83% 1%BE 1012 22% 78% - CZ 1072 17% 83% - DK 1060 18% 82% - D-W 1046 11% 89% - DE 1551 12% 88% - D-E 505 15% 85% - EE 1011 19% 81% - EL 1000 9% 91% - ES 1026 5% 95% - FR 1022 21% 79% - IE 1000 7% 92% 1%IT 1005 18% 81% 1%CY 506 18% 82% - CY (tcc) 500 20% 80% - LV 1031 17% 83% - LT 1016 22% 78% - LU 500 19% 81% - HU 1001 15% 85% - MT 500 12% 88% - NL 1069 19% 80% 1%AT 1013 15% 85% - PL 1000 20% 78% 2%PT 1006 19% 81% - SI 1039 12% 88% - SK 1180 19% 80% 1%FI 1030 16% 84% - SE 1006 21% 79% - UK 1375 23% 77% - BG 1027 13% 86% 1%RO 1026 21% 78% 1%HR 1000 14% 85% 1%
Migraine or frequent headaches
QB42.8 Avez-vous ou avez-vous eu une des maladies suivantes ?
QB42.8 Do you have or have you ever had any of the following health problems?
Des migraines ou des maux de tête fréquents

TOTAL Oui / Yes Non / No NSP / DKUE25 EU25 25031 5% 95% - BE 1012 11% 89% - CZ 1072 5% 95% - DK 1060 5% 95% - D-W 1046 4% 96% - DE 1551 4% 96% - D-E 505 5% 95% - EE 1011 6% 93% 1%EL 1000 3% 97% - ES 1026 2% 98% - FR 1022 8% 92% - IE 1000 2% 97% 1%IT 1005 4% 95% 1%CY 506 3% 97% - CY (tcc) 500 4% 96% - LV 1031 7% 92% 1%LT 1016 10% 90% - LU 500 6% 94% - HU 1001 6% 94% - MT 500 4% 96% - NL 1069 6% 94% - AT 1013 4% 96% - PL 1000 4% 94% 2%PT 1006 6% 93% 1%SI 1039 4% 96% - SK 1180 9% 90% 1%FI 1030 3% 97% - SE 1006 2% 97% 1%UK 1375 6% 94% - BG 1027 5% 93% 2%RO 1026 6% 93% 1%HR 1000 6% 93% 1%
Chronic bronchitis, emphysema
QB42.9 Avez-vous ou avez-vous eu une des maladies suivantes ?
QB42.9 Do you have or have you ever had any of the following health problems?
Des bronchites chroniques, de l’emphysème

TOTAL Oui / Yes Non / No NSP / DKUE25 EU25 25031 5% 94% 1%BE 1012 5% 95% - CZ 1072 6% 93% 1%DK 1060 2% 97% 1%D-W 1046 4% 95% 1%DE 1551 4% 95% 1%D-E 505 4% 95% 1%EE 1011 5% 93% 2%EL 1000 6% 94% - ES 1026 4% 95% 1%FR 1022 3% 95% 2%IE 1000 3% 96% 1%IT 1005 7% 91% 2%CY 506 5% 93% 2%CY (tcc) 500 6% 93% 1%LV 1031 4% 94% 2%LT 1016 7% 91% 2%LU 500 3% 96% 1%HU 1001 9% 89% 2%MT 500 3% 96% 1%NL 1069 5% 92% 3%AT 1013 4% 94% 2%PL 1000 5% 92% 3%PT 1006 9% 89% 2%SI 1039 5% 94% 1%SK 1180 8% 89% 3%FI 1030 3% 97% - SE 1006 2% 97% 1%UK 1375 4% 96% - BG 1027 8% 89% 3%RO 1026 5% 93% 2%HR 1000 7% 91% 2%
Osteoporosis
QB42.10 Avez-vous ou avez-vous eu une des maladies suivantes ?
QB42.10 Do you have or have you ever had any of the following health problems?
L’ostéoporose

TOTAL Oui / Yes Non / No NSP / DKUE25 EU25 25031 2% 98% - BE 1012 2% 98% - CZ 1072 1% 99% - DK 1060 3% 97% - D-W 1046 3% 97% - DE 1551 3% 97% - D-E 505 2% 98% - EE 1011 3% 97% - EL 1000 1% 99% - ES 1026 - 99% 1%FR 1022 2% 98% - IE 1000 1% 98% 1%IT 1005 3% 96% 1%CY 506 1% 99% - CY (tcc) 500 1% 99% - LV 1031 2% 97% 1%LT 1016 2% 98% - LU 500 2% 98% - HU 1001 5% 95% - MT 500 1% 99% - NL 1069 2% 98% - AT 1013 1% 99% - PL 1000 1% 97% 2%PT 1006 2% 97% 1%SI 1039 2% 98% - SK 1180 2% 97% 1%FI 1030 2% 98% - SE 1006 2% 98% - UK 1375 3% 97% - BG 1027 5% 93% 2%RO 1026 1% 98% 1%HR 1000 1% 98% 1%
Stroke, cerebral haemorrhage
QB42.11 Avez-vous ou avez-vous eu une des maladies suivantes ?
QB42.11 Do you have or have you ever had any of the following health problems?
Une attaque ou hémorragie cérébrale
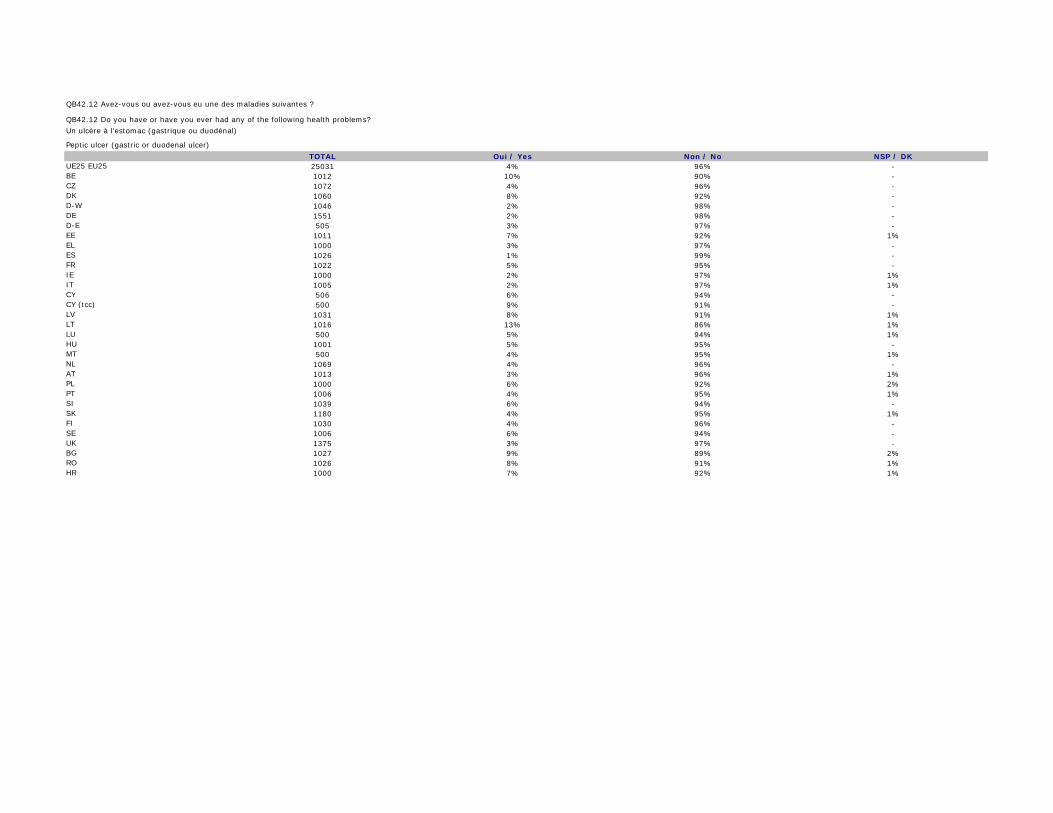
TOTAL Oui / Yes Non / No NSP / DKUE25 EU25 25031 4% 96% - BE 1012 10% 90% - CZ 1072 4% 96% - DK 1060 8% 92% - D-W 1046 2% 98% - DE 1551 2% 98% - D-E 505 3% 97% - EE 1011 7% 92% 1%EL 1000 3% 97% - ES 1026 1% 99% - FR 1022 5% 95% - IE 1000 2% 97% 1%IT 1005 2% 97% 1%CY 506 6% 94% - CY (tcc) 500 9% 91% - LV 1031 8% 91% 1%LT 1016 13% 86% 1%LU 500 5% 94% 1%HU 1001 5% 95% - MT 500 4% 95% 1%NL 1069 4% 96% - AT 1013 3% 96% 1%PL 1000 6% 92% 2%PT 1006 4% 95% 1%SI 1039 6% 94% - SK 1180 4% 95% 1%FI 1030 4% 96% - SE 1006 6% 94% - UK 1375 3% 97% - BG 1027 9% 89% 2%RO 1026 8% 91% 1%HR 1000 7% 92% 1%
Peptic ulcer (gastric or duodenal ulcer)
QB42.12 Avez-vous ou avez-vous eu une des maladies suivantes ?
QB42.12 Do you have or have you ever had any of the following health problems?
Un ulcère à l’estomac (gastrique ou duodénal)
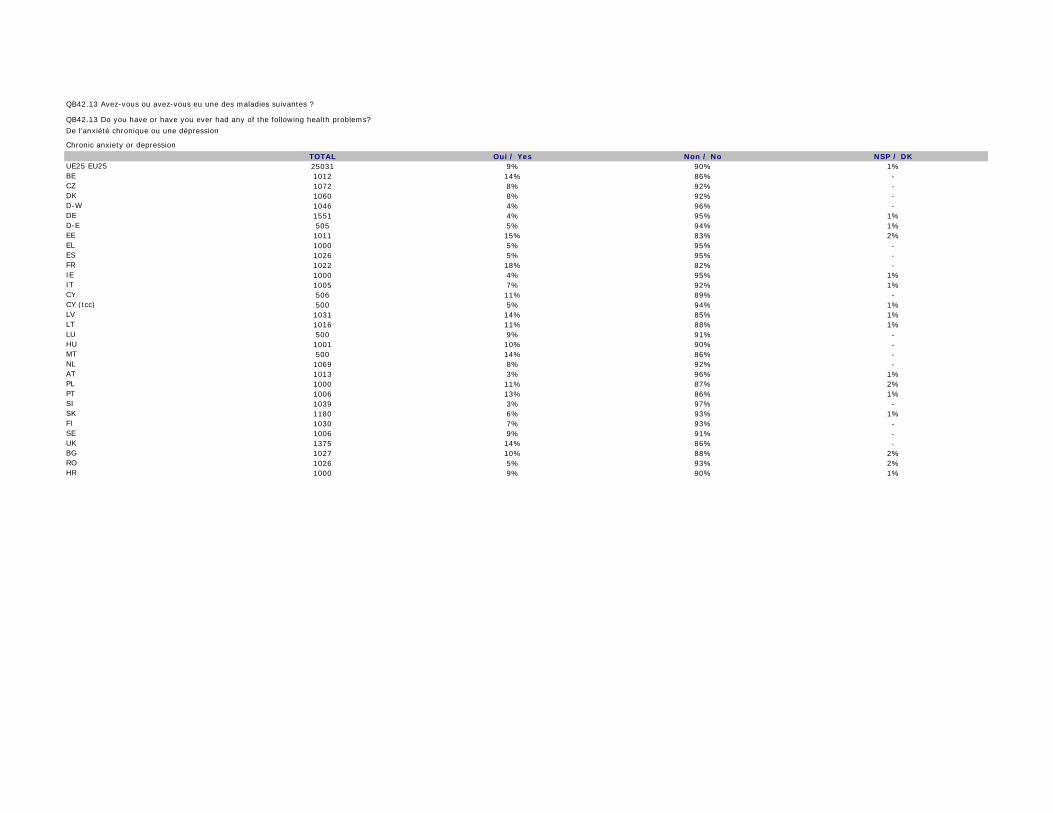
TOTAL Oui / Yes Non / No NSP / DKUE25 EU25 25031 9% 90% 1%BE 1012 14% 86% - CZ 1072 8% 92% - DK 1060 8% 92% - D-W 1046 4% 96% - DE 1551 4% 95% 1%D-E 505 5% 94% 1%EE 1011 15% 83% 2%EL 1000 5% 95% - ES 1026 5% 95% - FR 1022 18% 82% - IE 1000 4% 95% 1%IT 1005 7% 92% 1%CY 506 11% 89% - CY (tcc) 500 5% 94% 1%LV 1031 14% 85% 1%LT 1016 11% 88% 1%LU 500 9% 91% - HU 1001 10% 90% - MT 500 14% 86% - NL 1069 8% 92% - AT 1013 3% 96% 1%PL 1000 11% 87% 2%PT 1006 13% 86% 1%SI 1039 3% 97% - SK 1180 6% 93% 1%FI 1030 7% 93% - SE 1006 9% 91% - UK 1375 14% 86% - BG 1027 10% 88% 2%RO 1026 5% 93% 2%HR 1000 9% 90% 1%
Chronic anxiety or depression
QB42.13 Avez-vous ou avez-vous eu une des maladies suivantes ?
QB42.13 Do you have or have you ever had any of the following health problems?
De l’anxiété chronique ou une dépression
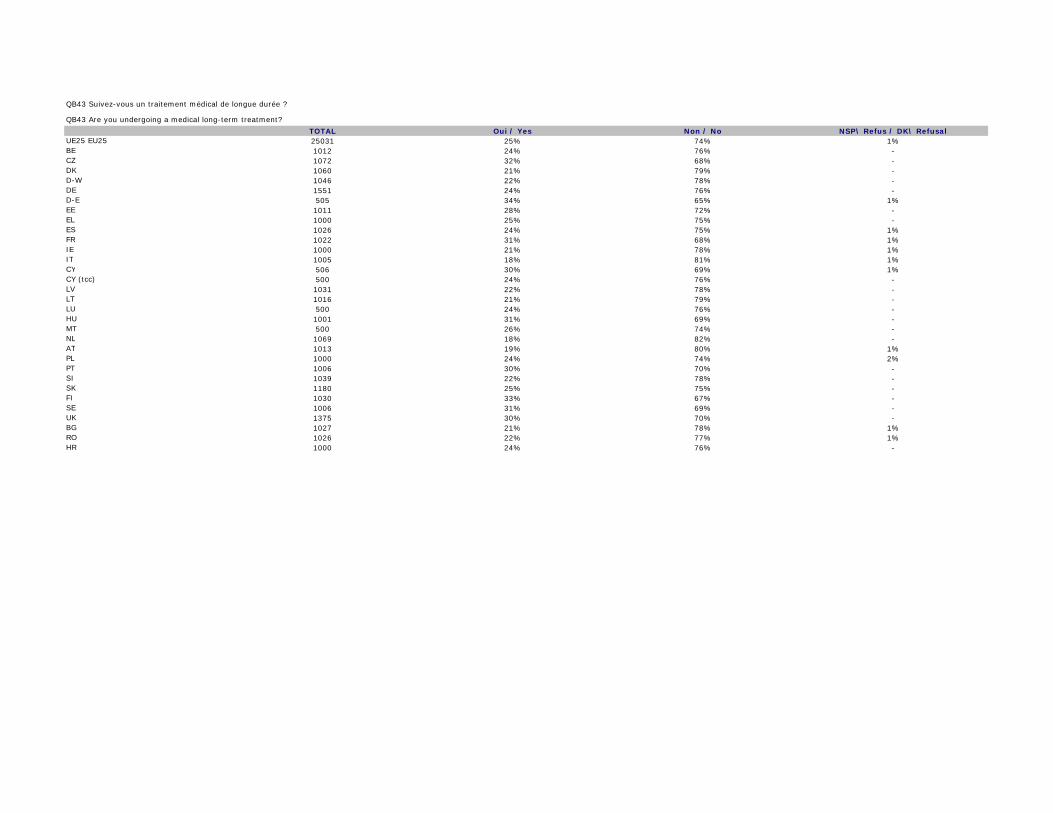
TOTAL Oui / Yes Non / No NSP\ Refus / DK\ RefusalUE25 EU25 25031 25% 74% 1%BE 1012 24% 76% - CZ 1072 32% 68% - DK 1060 21% 79% - D-W 1046 22% 78% - DE 1551 24% 76% - D-E 505 34% 65% 1%EE 1011 28% 72% - EL 1000 25% 75% - ES 1026 24% 75% 1%FR 1022 31% 68% 1%IE 1000 21% 78% 1%IT 1005 18% 81% 1%CY 506 30% 69% 1%CY (tcc) 500 24% 76% - LV 1031 22% 78% - LT 1016 21% 79% - LU 500 24% 76% - HU 1001 31% 69% - MT 500 26% 74% - NL 1069 18% 82% - AT 1013 19% 80% 1%PL 1000 24% 74% 2%PT 1006 30% 70% - SI 1039 22% 78% - SK 1180 25% 75% - FI 1030 33% 67% - SE 1006 31% 69% - UK 1375 30% 70% - BG 1027 21% 78% 1%RO 1026 22% 77% 1%HR 1000 24% 76% -
QB43 Suivez-vous un traitement médical de longue durée ?
QB43 Are you undergoing a medical long-term treatment?
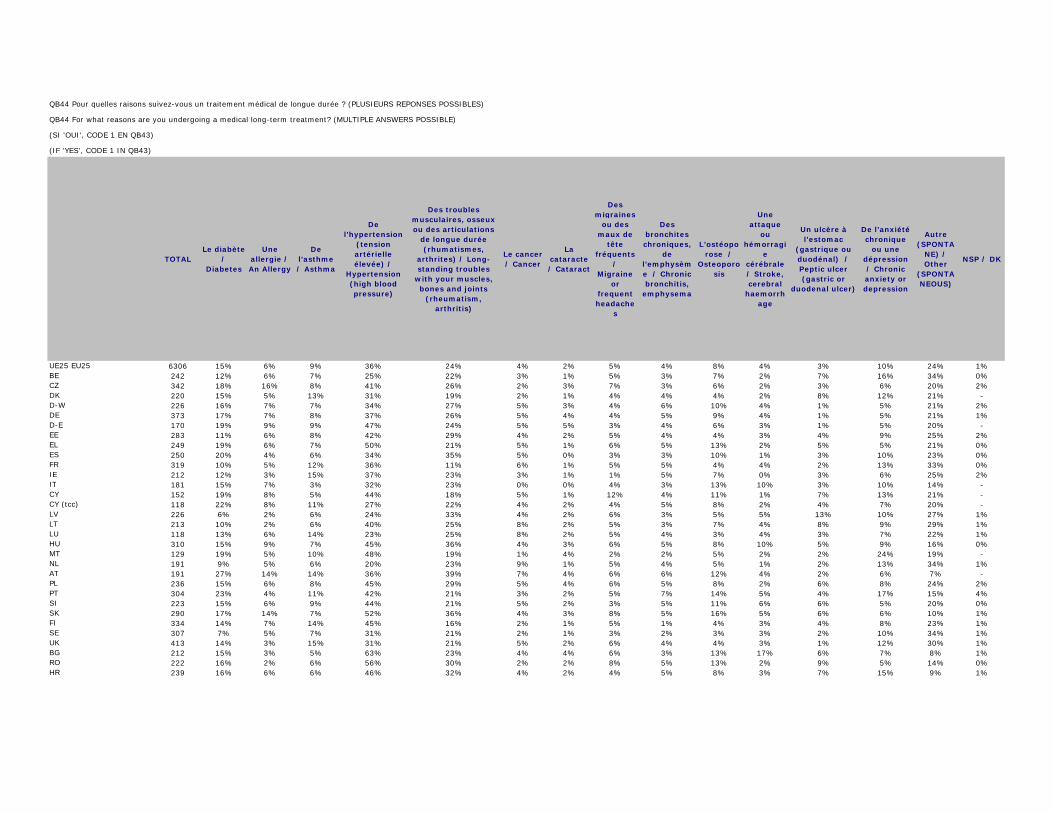
TOTALLe diabète
/ Diabetes
Une allergie / An Allergy
De l’asthme / Asthma
De l’hypertension
(tension artérielle élevée) /
Hypertension (high blood pressure)
Des troubles musculaires, osseux ou des articulations
de longue durée (rhumatismes,
arthrites) / Long-standing troubles
with your muscles, bones and joints
(rheumatism, arthritis)
Le cancer / Cancer
La cataracte / Cataract
Des migraines
ou des maux de
tête fréquents
/ Migraine
or frequent headache
s
Des bronchites chroniques,
de l’emphysème / Chronic bronchitis,
emphysema
L’ostéoporose /
Osteoporosis
Une attaque
ou hémorragi
e cérébrale / Stroke, cerebral
haemorrhage
Un ulcère à l’estomac
(gastrique ou duodénal) / Peptic ulcer (gastric or
duodenal ulcer)
De l’anxiété chronique
ou une dépression / Chronic anxiety or depression
Autre (SPONTA
NE) / Other
(SPONTANEOUS)
NSP / DK
UE25 EU25 6306 15% 6% 9% 36% 24% 4% 2% 5% 4% 8% 4% 3% 10% 24% 1%BE 242 12% 6% 7% 25% 22% 3% 1% 5% 3% 7% 2% 7% 16% 34% 0%CZ 342 18% 16% 8% 41% 26% 2% 3% 7% 3% 6% 2% 3% 6% 20% 2%DK 220 15% 5% 13% 31% 19% 2% 1% 4% 4% 4% 2% 8% 12% 21% - D-W 226 16% 7% 7% 34% 27% 5% 3% 4% 6% 10% 4% 1% 5% 21% 2%DE 373 17% 7% 8% 37% 26% 5% 4% 4% 5% 9% 4% 1% 5% 21% 1%D-E 170 19% 9% 9% 47% 24% 5% 5% 3% 4% 6% 3% 1% 5% 20% - EE 283 11% 6% 8% 42% 29% 4% 2% 5% 4% 4% 3% 4% 9% 25% 2%EL 249 19% 6% 7% 50% 21% 5% 1% 6% 5% 13% 2% 5% 5% 21% 0%ES 250 20% 4% 6% 34% 35% 5% 0% 3% 3% 10% 1% 3% 10% 23% 0%FR 319 10% 5% 12% 36% 11% 6% 1% 5% 5% 4% 4% 2% 13% 33% 0%IE 212 12% 3% 15% 37% 23% 3% 1% 1% 5% 7% 0% 3% 6% 25% 2%IT 181 15% 7% 3% 32% 23% 0% 0% 4% 3% 13% 10% 3% 10% 14% - CY 152 19% 8% 5% 44% 18% 5% 1% 12% 4% 11% 1% 7% 13% 21% - CY (tcc) 118 22% 8% 11% 27% 22% 4% 2% 4% 5% 8% 2% 4% 7% 20% - LV 226 6% 2% 6% 24% 33% 4% 2% 6% 3% 5% 5% 13% 10% 27% 1%LT 213 10% 2% 6% 40% 25% 8% 2% 5% 3% 7% 4% 8% 9% 29% 1%LU 118 13% 6% 14% 23% 25% 8% 2% 5% 4% 3% 4% 3% 7% 22% 1%HU 310 15% 9% 7% 45% 36% 4% 3% 6% 5% 8% 10% 5% 9% 16% 0%MT 129 19% 5% 10% 48% 19% 1% 4% 2% 2% 5% 2% 2% 24% 19% - NL 191 9% 5% 6% 20% 23% 9% 1% 5% 4% 5% 1% 2% 13% 34% 1%AT 191 27% 14% 14% 36% 39% 7% 4% 6% 6% 12% 4% 2% 6% 7% - PL 236 15% 6% 8% 45% 29% 5% 4% 6% 5% 8% 2% 6% 8% 24% 2%PT 304 23% 4% 11% 42% 21% 3% 2% 5% 7% 14% 5% 4% 17% 15% 4%SI 223 15% 6% 9% 44% 21% 5% 2% 3% 5% 11% 6% 6% 5% 20% 0%SK 290 17% 14% 7% 52% 36% 4% 3% 8% 5% 16% 5% 6% 6% 10% 1%FI 334 14% 7% 14% 45% 16% 2% 1% 5% 1% 4% 3% 4% 8% 23% 1%SE 307 7% 5% 7% 31% 21% 2% 1% 3% 2% 3% 3% 2% 10% 34% 1%UK 413 14% 3% 15% 31% 21% 5% 2% 6% 4% 4% 3% 1% 12% 30% 1%BG 212 15% 3% 5% 63% 23% 4% 4% 6% 3% 13% 17% 6% 7% 8% 1%RO 222 16% 2% 6% 56% 30% 2% 2% 8% 5% 13% 2% 9% 5% 14% 0%HR 239 16% 6% 6% 46% 32% 4% 2% 4% 5% 8% 3% 7% 15% 9% 1%
(SI 'OUI', CODE 1 EN QB43)
(IF 'YES', CODE 1 IN QB43)
QB44 Pour quelles raisons suivez-vous un traitement médical de longue durée ? (PLUSIEURS REPONSES POSSIBLES)
QB44 For what reasons are you undergoing a medical long-term treatment? (MULTIPLE ANSWERS POSSIBLE)

TOTAL Non / NoOui, à la
tête / Yes, your head
Oui, au cou / Yes, your
neck
Oui, aux épaules / Yes, your shoulders
Oui, dans le haut du dos / Yes, your upper back
Oui, dans les coudes / Yes, your
elbows
Oui, aux poignets ou aux mains / Yes, your wrists or
hands
Oui, dans le bas du dos / Yes, your low back
Oui, aux hanches ou aux cuisses / Yes, your
hips or thighs
Oui, aux genoux / Yes, your
knees
Oui, aux chevilles ou aux pieds / Yes, your ankles or
feet
Oui, ailleurs
(SPONTANE) / Yes, others
(SPONTANEOUS)
NSP / DK Oui / Yes
UE25 EU25 25031 67% 6% 7% 7% 8% 2% 5% 11% 5% 8% 5% 1% 1% 32%BE 1012 68% 6% 8% 8% 6% 4% 6% 14% 5% 8% 5% 1% 0% 32%CZ 1072 59% 9% 7% 4% 9% 2% 5% 10% 8% 9% 5% 0% 2% 38%DK 1060 64% 6% 12% 13% 8% 3% 7% 13% 7% 9% 6% 1% - 36%D-W 1046 64% 4% 4% 8% 11% 2% 4% 13% 5% 8% 5% 1% 1% 35%DE 1551 63% 4% 4% 9% 12% 2% 4% 13% 5% 9% 5% 1% 1% 35%D-E 505 62% 6% 3% 11% 14% 2% 4% 12% 7% 12% 5% 1% 0% 38%EE 1011 59% 7% 11% 10% 10% 3% 7% 16% 7% 11% 4% 1% 2% 39%EL 1000 73% 8% 7% 4% 6% 2% 4% 11% 4% 6% 4% 0% 0% 27%ES 1026 76% 4% 7% 5% 9% 1% 3% 8% 3% 8% 4% 1% 0% 24%FR 1022 69% 5% 5% 6% 6% 2% 3% 14% 6% 7% 4% 1% 1% 30%IE 1000 81% 2% 4% 4% 3% 1% 4% 6% 3% 5% 2% 0% 1% 18%IT 1005 65% 10% 12% 9% 7% 2% 6% 8% 3% 5% 3% 1% 1% 34%CY 506 77% 7% 6% 4% 5% 1% 4% 10% 3% 9% 4% 1% - 23%CY (tcc) 500 55% 21% 18% 10% 4% 2% 3% 6% 2% 6% 6% - - 45%LV 1031 57% 8% 6% 6% 7% 3% 6% 15% 7% 8% 5% 1% 4% 39%LT 1016 56% 14% 5% 5% 8% 2% 4% 15% 8% 12% 6% 1% 2% 42%LU 500 71% 6% 6% 6% 9% 1% 4% 8% 3% 5% 3% 1% 1% 29%HU 1001 61% 3% 9% 11% 8% 3% 6% 10% 12% 13% 8% 2% 1% 38%MT 500 76% 2% 5% 4% 7% 2% 2% 8% 3% 4% 5% - 0% 24%NL 1069 68% 4% 8% 9% 6% 2% 3% 14% 6% 6% 4% 2% 1% 32%AT 1013 60% 10% 10% 7% 9% 2% 6% 10% 7% 9% 4% 1% 0% 40%PL 1000 59% 13% 6% 8% 11% 3% 5% 11% 8% 11% 7% 2% 2% 39%PT 1006 77% 4% 4% 4% 7% 1% 2% 7% 5% 7% 2% 1% 1% 21%SI 1039 60% 9% 8% 7% 10% 3% 7% 15% 9% 9% 6% 2% 0% 40%SK 1180 59% 12% 8% 7% 18% 3% 5% 17% 5% 11% 5% 1% 1% 40%FI 1030 56% 8% 15% 12% 9% 3% 8% 14% 7% 8% 8% 1% 1% 44%SE 1006 71% 5% 9% 9% 6% 3% 7% 10% 7% 6% 5% 1% 0% 29%UK 1375 73% 3% 7% 7% 4% 2% 5% 13% 6% 8% 7% 1% 1% 27%BG 1027 63% 11% 8% 8% 10% 4% 4% 8% 6% 13% 7% 2% 1% 36%RO 1026 65% 12% 6% 6% 11% 2% 9% 10% 6% 9% 11% 1% 1% 34%HR 1000 53% 8% 14% 11% 13% 3% 9% 17% 5% 12% 6% 1% 0% 46%
QB45a Au cours de la semaine écoulée, avez-vous souffert de douleurs aux muscles, aux articulations, au cou ou au dos, vous empêchant d’effectuer normalement vos tâches quotidiennes ? (SI OUI) Pourriez-vous m’indiquer où vous aviez mal ? (PLUSIEURSREPONSES POSSIBLES)QB45a In the last week, have you had any pain affecting your muscles, joints, neck or back which has affected your ability to carry out the activities of daily living? (IF YES) Please tell me which part of the body did you have such pain. (MULTIPLE ANSWERSPOSSIBLE)
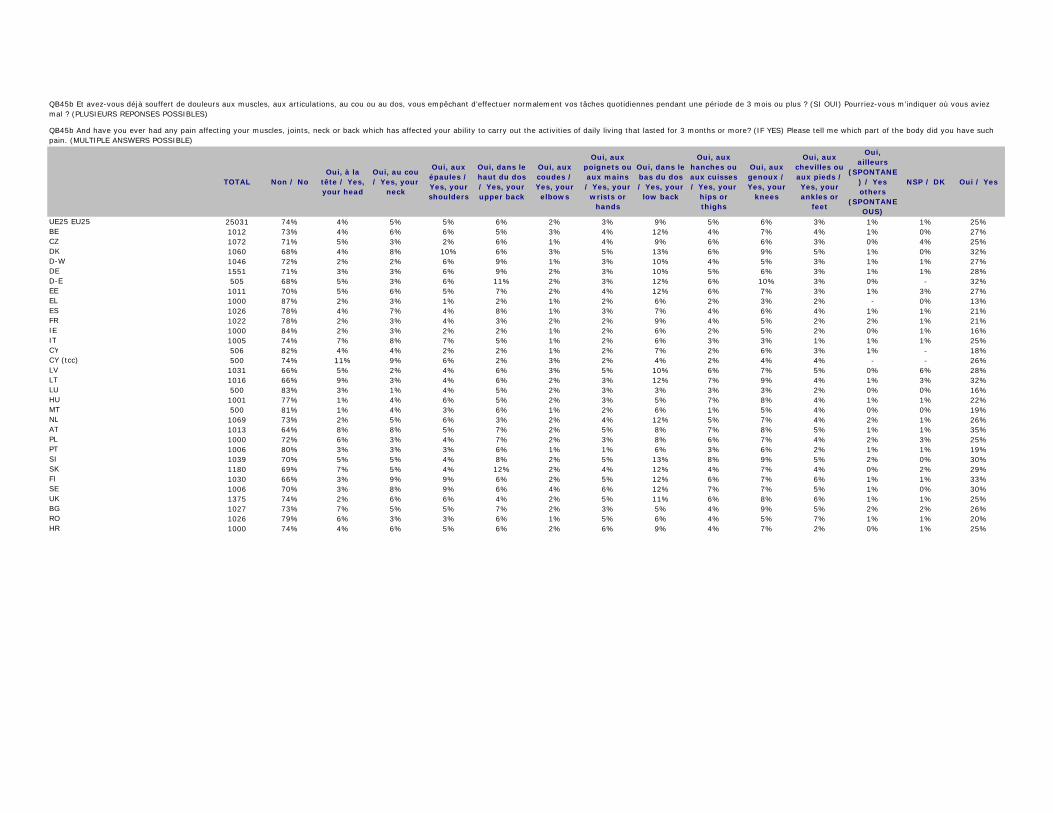
TOTAL Non / NoOui, à la
tête / Yes, your head
Oui, au cou / Yes, your
neck
Oui, aux épaules / Yes, your shoulders
Oui, dans le haut du dos / Yes, your upper back
Oui, aux coudes / Yes, your elbows
Oui, aux poignets ou aux mains / Yes, your wrists or
hands
Oui, dans le bas du dos / Yes, your low back
Oui, aux hanches ou aux cuisses / Yes, your
hips or thighs
Oui, aux genoux / Yes, your
knees
Oui, aux chevilles ou aux pieds / Yes, your ankles or
feet
Oui, ailleurs
(SPONTANE) / Yes others
(SPONTANEOUS)
NSP / DK Oui / Yes
UE25 EU25 25031 74% 4% 5% 5% 6% 2% 3% 9% 5% 6% 3% 1% 1% 25%BE 1012 73% 4% 6% 6% 5% 3% 4% 12% 4% 7% 4% 1% 0% 27%CZ 1072 71% 5% 3% 2% 6% 1% 4% 9% 6% 6% 3% 0% 4% 25%DK 1060 68% 4% 8% 10% 6% 3% 5% 13% 6% 9% 5% 1% 0% 32%D-W 1046 72% 2% 2% 6% 9% 1% 3% 10% 4% 5% 3% 1% 1% 27%DE 1551 71% 3% 3% 6% 9% 2% 3% 10% 5% 6% 3% 1% 1% 28%D-E 505 68% 5% 3% 6% 11% 2% 3% 12% 6% 10% 3% 0% - 32%EE 1011 70% 5% 6% 5% 7% 2% 4% 12% 6% 7% 3% 1% 3% 27%EL 1000 87% 2% 3% 1% 2% 1% 2% 6% 2% 3% 2% - 0% 13%ES 1026 78% 4% 7% 4% 8% 1% 3% 7% 4% 6% 4% 1% 1% 21%FR 1022 78% 2% 3% 4% 3% 2% 2% 9% 4% 5% 2% 2% 1% 21%IE 1000 84% 2% 3% 2% 2% 1% 2% 6% 2% 5% 2% 0% 1% 16%IT 1005 74% 7% 8% 7% 5% 1% 2% 6% 3% 3% 1% 1% 1% 25%CY 506 82% 4% 4% 2% 2% 1% 2% 7% 2% 6% 3% 1% - 18%CY (tcc) 500 74% 11% 9% 6% 2% 3% 2% 4% 2% 4% 4% - - 26%LV 1031 66% 5% 2% 4% 6% 3% 5% 10% 6% 7% 5% 0% 6% 28%LT 1016 66% 9% 3% 4% 6% 2% 3% 12% 7% 9% 4% 1% 3% 32%LU 500 83% 3% 1% 4% 5% 2% 3% 3% 3% 3% 2% 0% 0% 16%HU 1001 77% 1% 4% 6% 5% 2% 3% 5% 7% 8% 4% 1% 1% 22%MT 500 81% 1% 4% 3% 6% 1% 2% 6% 1% 5% 4% 0% 0% 19%NL 1069 73% 2% 5% 6% 3% 2% 4% 12% 5% 7% 4% 2% 1% 26%AT 1013 64% 8% 8% 5% 7% 2% 5% 8% 7% 8% 5% 1% 1% 35%PL 1000 72% 6% 3% 4% 7% 2% 3% 8% 6% 7% 4% 2% 3% 25%PT 1006 80% 3% 3% 3% 6% 1% 1% 6% 3% 6% 2% 1% 1% 19%SI 1039 70% 5% 5% 4% 8% 2% 5% 13% 8% 9% 5% 2% 0% 30%SK 1180 69% 7% 5% 4% 12% 2% 4% 12% 4% 7% 4% 0% 2% 29%FI 1030 66% 3% 9% 9% 6% 2% 5% 12% 6% 7% 6% 1% 1% 33%SE 1006 70% 3% 8% 9% 6% 4% 6% 12% 7% 7% 5% 1% 0% 30%UK 1375 74% 2% 6% 6% 4% 2% 5% 11% 6% 8% 6% 1% 1% 25%BG 1027 73% 7% 5% 5% 7% 2% 3% 5% 4% 9% 5% 2% 2% 26%RO 1026 79% 6% 3% 3% 6% 1% 5% 6% 4% 5% 7% 1% 1% 20%HR 1000 74% 4% 6% 5% 6% 2% 6% 9% 4% 7% 2% 0% 1% 25%
QB45b Et avez-vous déjà souffert de douleurs aux muscles, aux articulations, au cou ou au dos, vous empêchant d’effectuer normalement vos tâches quotidiennes pendant une période de 3 mois ou plus ? (SI OUI) Pourriez-vous m’indiquer où vous aviez mal ? (PLUSIEURS REPONSES POSSIBLES)
QB45b And have you ever had any pain affecting your muscles, joints, neck or back which has affected your ability to carry out the activities of daily living that lasted for 3 months or more? (IF YES) Please tell me which part of the body did you have such pain. (MULTIPLE ANSWERS POSSIBLE)
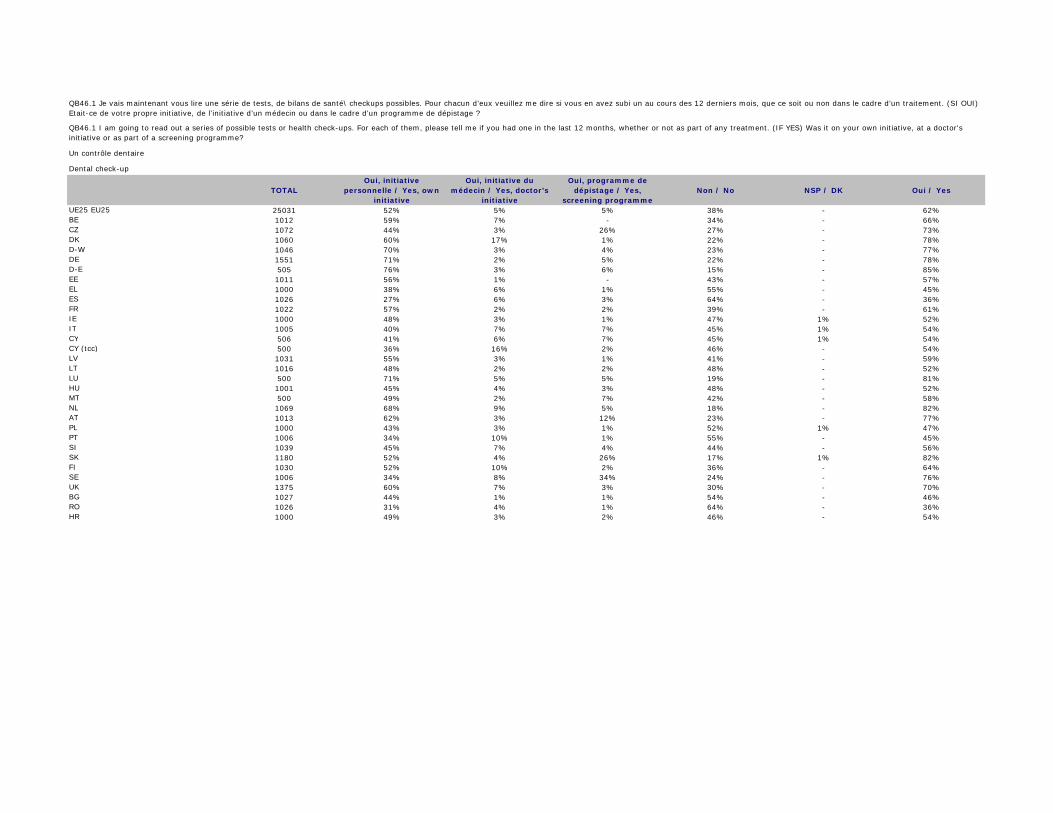
TOTALOui, initiative
personnelle / Yes, own initiative
Oui, initiative du médecin / Yes, doctor’s
initiative
Oui, programme de dépistage / Yes,
screening programmeNon / No NSP / DK Oui / Yes
UE25 EU25 25031 52% 5% 5% 38% - 62%BE 1012 59% 7% - 34% - 66%CZ 1072 44% 3% 26% 27% - 73%DK 1060 60% 17% 1% 22% - 78%D-W 1046 70% 3% 4% 23% - 77%DE 1551 71% 2% 5% 22% - 78%D-E 505 76% 3% 6% 15% - 85%EE 1011 56% 1% - 43% - 57%EL 1000 38% 6% 1% 55% - 45%ES 1026 27% 6% 3% 64% - 36%FR 1022 57% 2% 2% 39% - 61%IE 1000 48% 3% 1% 47% 1% 52%IT 1005 40% 7% 7% 45% 1% 54%CY 506 41% 6% 7% 45% 1% 54%CY (tcc) 500 36% 16% 2% 46% - 54%LV 1031 55% 3% 1% 41% - 59%LT 1016 48% 2% 2% 48% - 52%LU 500 71% 5% 5% 19% - 81%HU 1001 45% 4% 3% 48% - 52%MT 500 49% 2% 7% 42% - 58%NL 1069 68% 9% 5% 18% - 82%AT 1013 62% 3% 12% 23% - 77%PL 1000 43% 3% 1% 52% 1% 47%PT 1006 34% 10% 1% 55% - 45%SI 1039 45% 7% 4% 44% - 56%SK 1180 52% 4% 26% 17% 1% 82%FI 1030 52% 10% 2% 36% - 64%SE 1006 34% 8% 34% 24% - 76%UK 1375 60% 7% 3% 30% - 70%BG 1027 44% 1% 1% 54% - 46%RO 1026 31% 4% 1% 64% - 36%HR 1000 49% 3% 2% 46% - 54%
Dental check-up
QB46.1 Je vais maintenant vous lire une série de tests, de bilans de santé\ checkups possibles. Pour chacun d’eux veuillez me dire si vous en avez subi un au cours des 12 derniers mois, que ce soit ou non dans le cadre d’un traitement. (SI OUI) Etait-ce de votre propre initiative, de l’initiative d’un médecin ou dans le cadre d’un programme de dépistage ?
QB46.1 I am going to read out a series of possible tests or health check-ups. For each of them, please tell me if you had one in the last 12 months, whether or not as part of any treatment. (IF YES) Was it on your own initiative, at a doctor's initiative or as part of a screening programme?
Un contrôle dentaire

TOTALOui, initiative
personnelle / Yes, own initiative
Oui, initiative du médecin / Yes, doctor’s
initiative
Oui, programme de dépistage / Yes,
screening programmeNon / No NSP / DK Oui / Yes
UE25 EU25 25031 11% 23% 4% 62% - 38%BE 1012 11% 30% 2% 57% - 43%CZ 1072 5% 22% 5% 68% - 32%DK 1060 6% 21% 3% 70% - 30%D-W 1046 20% 22% 3% 55% - 45%DE 1551 19% 24% 3% 54% - 46%D-E 505 17% 29% 3% 51% - 49%EE 1011 16% 26% 2% 56% - 44%EL 1000 18% 16% 1% 65% - 35%ES 1026 4% 13% 9% 74% - 26%FR 1022 9% 36% 2% 53% - 47%IE 1000 7% 15% 2% 75% 1% 24%IT 1005 11% 22% 5% 61% 1% 38%CY 506 10% 18% 3% 68% 1% 31%CY (tcc) 500 18% 30% 4% 48% - 52%LV 1031 20% 24% 8% 48% - 52%LT 1016 14% 20% 10% 56% - 44%LU 500 21% 31% 1% 47% - 53%HU 1001 13% 24% 9% 54% - 46%MT 500 13% 19% 2% 66% - 34%NL 1069 6% 23% 2% 69% - 31%AT 1013 12% 18% 10% 59% 1% 40%PL 1000 11% 22% 3% 63% 1% 36%PT 1006 10% 46% 2% 41% 1% 58%SI 1039 6% 24% 2% 68% - 32%SK 1180 9% 20% 10% 60% 1% 39%FI 1030 15% 25% 4% 56% - 44%SE 1006 7% 18% 7% 68% - 32%UK 1375 5% 21% 2% 72% - 28%BG 1027 9% 11% 2% 78% - 22%RO 1026 7% 11% 4% 77% 1% 22%HR 1000 10% 21% 4% 65% - 35%
X-ray, ultrasound or other scan
QB46.2 Je vais maintenant vous lire une série de tests, de bilans de santé\ checkups possibles. Pour chacun d’eux veuillez me dire si vous en avez subi un au cours des 12 derniers mois, que ce soit ou non dans le cadre d’un traitement. (SI OUI) Etait-ce de votre propre initiative, de l’initiative d’un médecin ou dans le cadre d’un programme de dépistage ?
QB46.2 I am going to read out a series of possible tests or health check-ups. For each of them, please tell me if you had one in the last 12 months, whether or not as part of any treatment. (IF YES) Was it on your own initiative, at a doctor's initiative or as part of a screening programme?
Une radio, une échographie ou un scanner
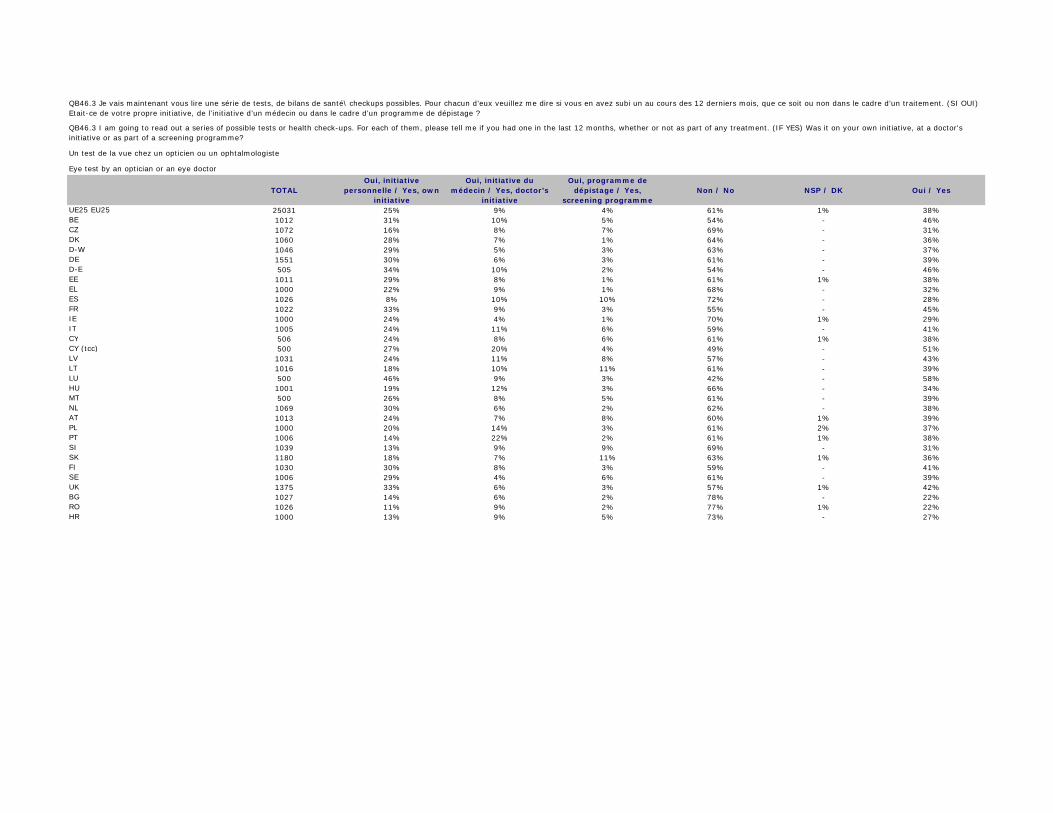
TOTALOui, initiative
personnelle / Yes, own initiative
Oui, initiative du médecin / Yes, doctor’s
initiative
Oui, programme de dépistage / Yes,
screening programmeNon / No NSP / DK Oui / Yes
UE25 EU25 25031 25% 9% 4% 61% 1% 38%BE 1012 31% 10% 5% 54% - 46%CZ 1072 16% 8% 7% 69% - 31%DK 1060 28% 7% 1% 64% - 36%D-W 1046 29% 5% 3% 63% - 37%DE 1551 30% 6% 3% 61% - 39%D-E 505 34% 10% 2% 54% - 46%EE 1011 29% 8% 1% 61% 1% 38%EL 1000 22% 9% 1% 68% - 32%ES 1026 8% 10% 10% 72% - 28%FR 1022 33% 9% 3% 55% - 45%IE 1000 24% 4% 1% 70% 1% 29%IT 1005 24% 11% 6% 59% - 41%CY 506 24% 8% 6% 61% 1% 38%CY (tcc) 500 27% 20% 4% 49% - 51%LV 1031 24% 11% 8% 57% - 43%LT 1016 18% 10% 11% 61% - 39%LU 500 46% 9% 3% 42% - 58%HU 1001 19% 12% 3% 66% - 34%MT 500 26% 8% 5% 61% - 39%NL 1069 30% 6% 2% 62% - 38%AT 1013 24% 7% 8% 60% 1% 39%PL 1000 20% 14% 3% 61% 2% 37%PT 1006 14% 22% 2% 61% 1% 38%SI 1039 13% 9% 9% 69% - 31%SK 1180 18% 7% 11% 63% 1% 36%FI 1030 30% 8% 3% 59% - 41%SE 1006 29% 4% 6% 61% - 39%UK 1375 33% 6% 3% 57% 1% 42%BG 1027 14% 6% 2% 78% - 22%RO 1026 11% 9% 2% 77% 1% 22%HR 1000 13% 9% 5% 73% - 27%
Eye test by an optician or an eye doctor
QB46.3 Je vais maintenant vous lire une série de tests, de bilans de santé\ checkups possibles. Pour chacun d’eux veuillez me dire si vous en avez subi un au cours des 12 derniers mois, que ce soit ou non dans le cadre d’un traitement. (SI OUI) Etait-ce de votre propre initiative, de l’initiative d’un médecin ou dans le cadre d’un programme de dépistage ?
QB46.3 I am going to read out a series of possible tests or health check-ups. For each of them, please tell me if you had one in the last 12 months, whether or not as part of any treatment. (IF YES) Was it on your own initiative, at a doctor's initiative or as part of a screening programme?
Un test de la vue chez un opticien ou un ophtalmologiste

TOTALOui, initiative
personnelle / Yes, own initiative
Oui, initiative du médecin / Yes, doctor’s
initiative
Oui, programme de dépistage / Yes,
screening programmeNon / No NSP / DK Oui / Yes
UE25 EU25 25031 13% 20% 5% 62% - 38%BE 1012 20% 22% 2% 56% - 44%CZ 1072 4% 18% 5% 73% - 27%DK 1060 11% 14% 4% 71% - 29%D-W 1046 20% 14% 3% 62% 1% 37%DE 1551 18% 14% 4% 63% 1% 36%D-E 505 12% 15% 8% 64% 1% 35%EE 1011 12% 16% 2% 69% 1% 30%EL 1000 35% 18% 2% 45% - 55%ES 1026 8% 24% 16% 52% - 48%FR 1022 9% 30% 2% 59% - 41%IE 1000 16% 12% 2% 69% 1% 30%IT 1005 17% 20% 4% 58% 1% 41%CY 506 27% 15% 8% 49% 1% 50%CY (tcc) 500 19% 19% 5% 57% - 43%LV 1031 12% 15% 4% 68% 1% 31%LT 1016 9% 13% 6% 71% 1% 28%LU 500 30% 25% 2% 43% - 57%HU 1001 11% 21% 3% 65% - 35%MT 500 24% 10% 4% 62% - 38%NL 1069 11% 13% 2% 74% - 26%AT 1013 12% 16% 15% 56% 1% 43%PL 1000 12% 19% 2% 66% 1% 33%PT 1006 12% 42% 2% 43% 1% 56%SI 1039 7% 20% 10% 63% - 37%SK 1180 10% 16% 14% 59% 1% 40%FI 1030 15% 19% 3% 62% 1% 37%SE 1006 7% 8% 11% 72% 2% 26%UK 1375 7% 18% 2% 72% 1% 27%BG 1027 8% 13% 2% 76% 1% 23%RO 1026 7% 12% 2% 78% 1% 21%HR 1000 8% 14% 4% 73% 1% 26%
Cholesterol test
QB46.4 Je vais maintenant vous lire une série de tests, de bilans de santé\ checkups possibles. Pour chacun d’eux veuillez me dire si vous en avez subi un au cours des 12 derniers mois, que ce soit ou non dans le cadre d’un traitement. (SI OUI) Etait-ce de votre propre initiative, de l’initiative d’un médecin ou dans le cadre d’un programme de dépistage ?
QB46.4 I am going to read out a series of possible tests or health check-ups. For each of them, please tell me if you had one in the last 12 months, whether or not as part of any treatment. (IF YES) Was it on your own initiative, at a doctor's initiative or as part of a screening programme?
Un test du cholestérol
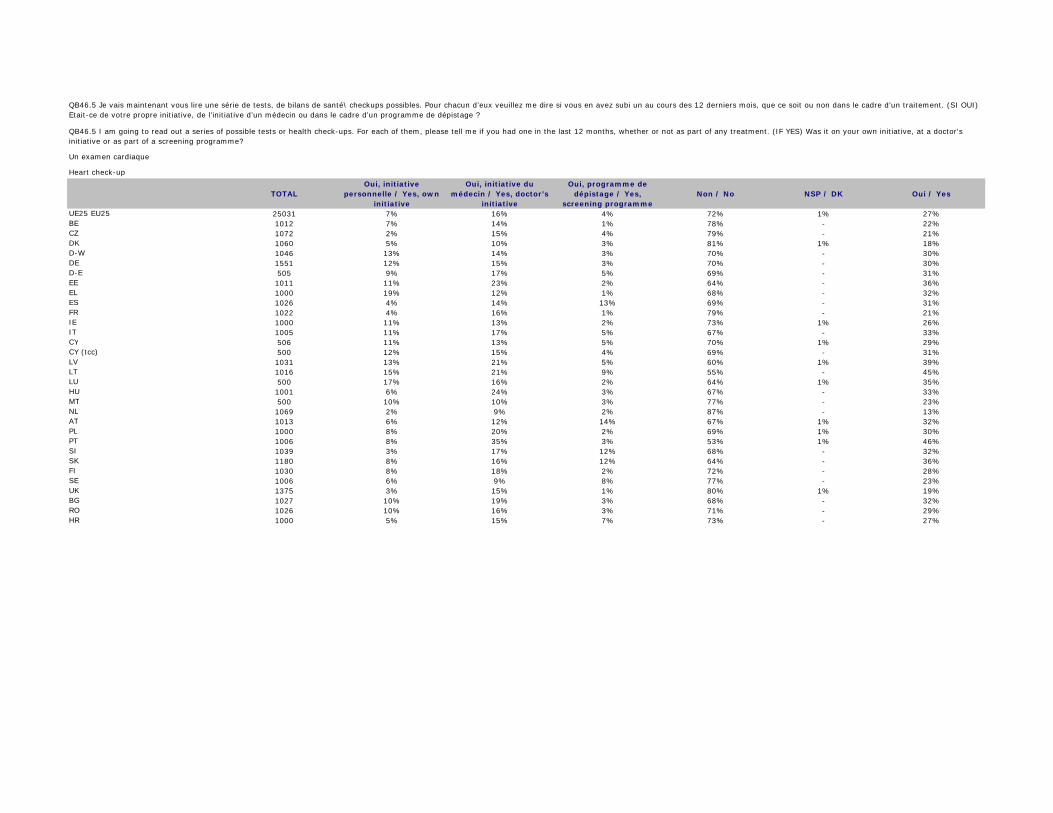
TOTALOui, initiative
personnelle / Yes, own initiative
Oui, initiative du médecin / Yes, doctor’s
initiative
Oui, programme de dépistage / Yes,
screening programmeNon / No NSP / DK Oui / Yes
UE25 EU25 25031 7% 16% 4% 72% 1% 27%BE 1012 7% 14% 1% 78% - 22%CZ 1072 2% 15% 4% 79% - 21%DK 1060 5% 10% 3% 81% 1% 18%D-W 1046 13% 14% 3% 70% - 30%DE 1551 12% 15% 3% 70% - 30%D-E 505 9% 17% 5% 69% - 31%EE 1011 11% 23% 2% 64% - 36%EL 1000 19% 12% 1% 68% - 32%ES 1026 4% 14% 13% 69% - 31%FR 1022 4% 16% 1% 79% - 21%IE 1000 11% 13% 2% 73% 1% 26%IT 1005 11% 17% 5% 67% - 33%CY 506 11% 13% 5% 70% 1% 29%CY (tcc) 500 12% 15% 4% 69% - 31%LV 1031 13% 21% 5% 60% 1% 39%LT 1016 15% 21% 9% 55% - 45%LU 500 17% 16% 2% 64% 1% 35%HU 1001 6% 24% 3% 67% - 33%MT 500 10% 10% 3% 77% - 23%NL 1069 2% 9% 2% 87% - 13%AT 1013 6% 12% 14% 67% 1% 32%PL 1000 8% 20% 2% 69% 1% 30%PT 1006 8% 35% 3% 53% 1% 46%SI 1039 3% 17% 12% 68% - 32%SK 1180 8% 16% 12% 64% - 36%FI 1030 8% 18% 2% 72% - 28%SE 1006 6% 9% 8% 77% - 23%UK 1375 3% 15% 1% 80% 1% 19%BG 1027 10% 19% 3% 68% - 32%RO 1026 10% 16% 3% 71% - 29%HR 1000 5% 15% 7% 73% - 27%
Heart check-up
QB46.5 Je vais maintenant vous lire une série de tests, de bilans de santé\ checkups possibles. Pour chacun d’eux veuillez me dire si vous en avez subi un au cours des 12 derniers mois, que ce soit ou non dans le cadre d’un traitement. (SI OUI) Etait-ce de votre propre initiative, de l’initiative d’un médecin ou dans le cadre d’un programme de dépistage ?
QB46.5 I am going to read out a series of possible tests or health check-ups. For each of them, please tell me if you had one in the last 12 months, whether or not as part of any treatment. (IF YES) Was it on your own initiative, at a doctor's initiative or as part of a screening programme?
Un examen cardiaque

TOTALOui, initiative
personnelle / Yes, own initiative
Oui, initiative du médecin / Yes, doctor’s
initiative
Oui, programme de dépistage / Yes,
screening programmeNon / No NSP / DK Oui / Yes
UE25 EU25 25031 6% 6% 4% 84% - 16%BE 1012 7% 9% 5% 79% - 21%CZ 1072 2% 4% 3% 91% - 9%DK 1060 6% 4% 2% 88% - 12%D-W 1046 9% 5% 3% 83% - 17%DE 1551 10% 5% 3% 82% - 18%D-E 505 11% 6% 4% 79% - 21%EE 1011 8% 8% 2% 82% - 18%EL 1000 8% 4% 1% 87% - 13%ES 1026 3% 7% 9% 81% - 19%FR 1022 5% 10% 5% 80% - 20%IE 1000 3% 3% 2% 91% 1% 8%IT 1005 6% 6% 4% 83% 1% 16%CY 506 6% 3% 1% 89% 1% 10%CY (tcc) 500 7% 6% 4% 83% - 17%LV 1031 8% 11% 6% 75% - 25%LT 1016 5% 7% 9% 79% - 21%LU 500 18% 6% 3% 72% 1% 27%HU 1001 5% 8% 4% 83% - 17%MT 500 5% 2% 1% 92% - 8%NL 1069 5% 3% 2% 90% - 10%AT 1013 8% 6% 7% 78% 1% 21%PL 1000 4% 7% 3% 85% 1% 14%PT 1006 5% 13% 2% 79% 1% 20%SI 1039 2% 5% 13% 80% - 20%SK 1180 4% 5% 8% 82% 1% 17%FI 1030 8% 9% 4% 78% 1% 21%SE 1006 5% 2% 8% 85% - 15%UK 1375 3% 4% 2% 91% - 9%BG 1027 3% 4% 2% 90% 1% 9%RO 1026 3% 4% 2% 90% 1% 9%HR 1000 1% 3% 7% 88% 1% 11%
Hearing test
QB46.6 Je vais maintenant vous lire une série de tests, de bilans de santé\ checkups possibles. Pour chacun d’eux veuillez me dire si vous en avez subi un au cours des 12 derniers mois, que ce soit ou non dans le cadre d’un traitement. (SI OUI) Etait-ce de votre propre initiative, de l’initiative d’un médecin ou dans le cadre d’un programme de dépistage ?
QB46.6 I am going to read out a series of possible tests or health check-ups. For each of them, please tell me if you had one in the last 12 months, whether or not as part of any treatment. (IF YES) Was it on your own initiative, at a doctor's initiative or as part of a screening programme?
Un test d’audition

TOTALOui, initiative
personnelle / Yes, own initiative
Oui, initiative du médecin / Yes, doctor’s
initiative
Oui, programme de dépistage / Yes,
screening programmeNon / No NSP / DK Oui / Yes
UE25 EU25 25031 20% 32% 7% 41% - 59%BE 1012 23% 42% 5% 30% - 70%CZ 1072 10% 34% 13% 43% - 57%DK 1060 15% 27% 6% 52% - 48%D-W 1046 32% 27% 4% 37% - 63%DE 1551 31% 28% 5% 36% - 64%D-E 505 26% 34% 8% 32% - 68%EE 1011 35% 34% 3% 28% - 72%EL 1000 41% 17% 2% 40% - 60%ES 1026 10% 22% 17% 51% - 49%FR 1022 8% 55% 4% 33% - 67%IE 1000 21% 23% 2% 53% 1% 46%IT 1005 25% 21% 6% 47% 1% 52%CY 506 29% 20% 6% 44% 1% 55%CY (tcc) 500 34% 15% 4% 47% - 53%LV 1031 27% 28% 8% 37% - 63%LT 1016 28% 24% 11% 37% - 63%LU 500 40% 38% 2% 20% - 80%HU 1001 25% 36% 6% 33% - 67%MT 500 40% 17% 7% 35% 1% 64%NL 1069 20% 27% 5% 48% - 52%AT 1013 19% 22% 15% 43% 1% 56%PL 1000 29% 26% 4% 40% 1% 59%PT 1006 22% 47% 2% 28% 1% 71%SI 1039 16% 32% 14% 38% - 62%SK 1180 22% 26% 20% 31% 1% 68%FI 1030 37% 25% 5% 33% - 67%SE 1006 17% 20% 18% 44% 1% 55%UK 1375 10% 42% 4% 43% 1% 56%BG 1027 31% 22% 2% 45% - 55%RO 1026 25% 19% 4% 51% 1% 48%HR 1000 24% 24% 8% 43% 1% 56%
Blood pressure test
QB46.7 Je vais maintenant vous lire une série de tests, de bilans de santé\ checkups possibles. Pour chacun d’eux veuillez me dire si vous en avez subi un au cours des 12 derniers mois, que ce soit ou non dans le cadre d’un traitement. (SI OUI) Etait-ce de votre propre initiative, de l’initiative d’un médecin ou dans le cadre d’un programme de dépistage ?
QB46.7 I am going to read out a series of possible tests or health check-ups. For each of them, please tell me if you had one in the last 12 months, whether or not as part of any treatment. (IF YES) Was it on your own initiative, at a doctor's initiative or as part of a screening programme?
Une mesure de la pression artérielle

TOTALOui, initiative
personnelle / Yes, own initiative
Oui, initiative du médecin / Yes, doctor’s
initiative
Oui, programme de dépistage / Yes,
screening programmeNon / No NSP / DK Oui / Yes
UE25 EU25 25031 3% 4% 1% 91% 1% 8%BE 1012 2% 4% 1% 93% - 7%CZ 1072 - 4% 2% 94% - 6%DK 1060 1% 3% 2% 94% - 6%D-W 1046 10% 7% 2% 80% 1% 19%DE 1551 10% 7% 2% 81% - 19%D-E 505 7% 7% 3% 83% - 17%EE 1011 1% 2% - 97% - 3%EL 1000 3% 2% - 94% 1% 5%ES 1026 1% 3% 1% 94% 1% 5%FR 1022 1% 4% 2% 93% - 7%IE 1000 3% 3% 1% 91% 2% 7%IT 1005 2% 4% 2% 91% 1% 8%CY 506 1% - - 97% 2% 1%CY (tcc) 500 5% 3% 3% 89% - 11%LV 1031 3% 8% 1% 87% 1% 12%LT 1016 1% 2% 1% 96% - 4%LU 500 6% 5% 2% 86% 1% 13%HU 1001 1% 2% 1% 96% - 4%MT 500 1% 2% 1% 96% - 4%NL 1069 2% 2% - 96% - 4%AT 1013 3% 4% 10% 81% 2% 17%PL 1000 1% 3% - 95% 1% 4%PT 1006 2% 5% 1% 88% 4% 8%SI 1039 - 1% 1% 98% - 2%SK 1180 1% 3% 2% 93% 1% 6%FI 1030 2% 2% 2% 94% - 6%SE 1006 1% 1% 1% 97% - 3%UK 1375 - 3% 1% 95% 1% 4%BG 1027 2% 1% 1% 96% - 4%RO 1026 1% - 1% 97% 1% 2%HR 1000 - 1% 1% 96% 2% 2%
Colorectal cancer testing (FOBT)
QB46.8 Je vais maintenant vous lire une série de tests, de bilans de santé\ checkups possibles. Pour chacun d’eux veuillez me dire si vous en avez subi un au cours des 12 derniers mois, que ce soit ou non dans le cadre d’un traitement. (SI OUI) Etait-ce de votre propre initiative, de l’initiative d’un médecin ou dans le cadre d’un programme de dépistage ?
QB46.8 I am going to read out a series of possible tests or health check-ups. For each of them, please tell me if you had one in the last 12 months, whether or not as part of any treatment. (IF YES) Was it on your own initiative, at a doctor's initiative or as part of a screening programme?
Un test contre le cancer du côlon

TOTALOui, initiative
personnelle / Yes, own initiative
Oui, initiative du médecin / Yes, doctor’s
initiative
Oui, programme de dépistage / Yes,
screening programmeNon / No NSP / DK Oui / Yes
UE25 EU25 12048 4% 7% 2% 86% 1% 13%BE 491 9% 8% 1% 82% - 18%CZ 517 1% 3% 2% 94% - 6%DK 520 1% 2% 2% 95% - 5%D-W 503 13% 7% 2% 77% 1% 22%DE 747 12% 7% 2% 78% 1% 21%D-E 245 9% 4% 2% 84% 1% 15%EE 444 2% 2% - 96% - 4%EL 490 5% 4% 1% 89% 1% 10%ES 501 1% 6% 3% 89% 1% 10%FR 488 2% 12% 1% 84% 1% 15%IE 493 8% 6% 1% 83% 2% 15%IT 482 4% 9% 2% 84% 1% 15%CY 244 8% 5% 1% 85% 1% 14%CY (tcc) 252 7% 4% 2% 87% - 13%LV 476 2% 8% 2% 85% 3% 12%LT 464 3% 6% 1% 89% 1% 10%LU 244 9% 7% 2% 81% 1% 18%HU 469 4% 4% 1% 90% 1% 9%MT 246 4% 3% 3% 90% - 10%NL 527 5% 4% - 91% - 9%AT 487 7% 9% 12% 70% 2% 28%PL 478 2% 4% - 92% 2% 6%PT 480 4% 13% 1% 79% 3% 18%SI 505 3% 4% 1% 92% - 8%SK 566 1% 4% 2% 92% 1% 7%FI 500 7% 5% 2% 86% - 14%SE 495 6% 4% 3% 87% - 13%UK 660 2% 5% 1% 91% 1% 8%BG 493 1% 1% 1% 96% 1% 3%RO 496 1% 1% 1% 96% 1% 3%HR 475 - 4% 1% 93% 2% 5%
Prostate Specific Antigen (PSA) Test
('AUX HOMMES')
('TO MALES')
QB46.9 Je vais maintenant vous lire une série de tests, de bilans de santé\ checkups possibles. Pour chacun d’eux veuillez me dire si vous en avez subi un au cours des 12 derniers mois, que ce soit ou non dans le cadre d’un traitement. (SI OUI) Etait-ce de votre propre initiative, de l’initiative d’un médecin ou dans le cadre d’un programme de dépistage ?
QB46.9 I am going to read out a series of possible tests or health check-ups. For each of them, please tell me if you had one in the last 12 months, whether or not as part of any treatment. (IF YES) Was it on your own initiative, at a doctor's initiative or as part of a screening programme?
Un test de l'antigène prostatique spécifique (PSA)
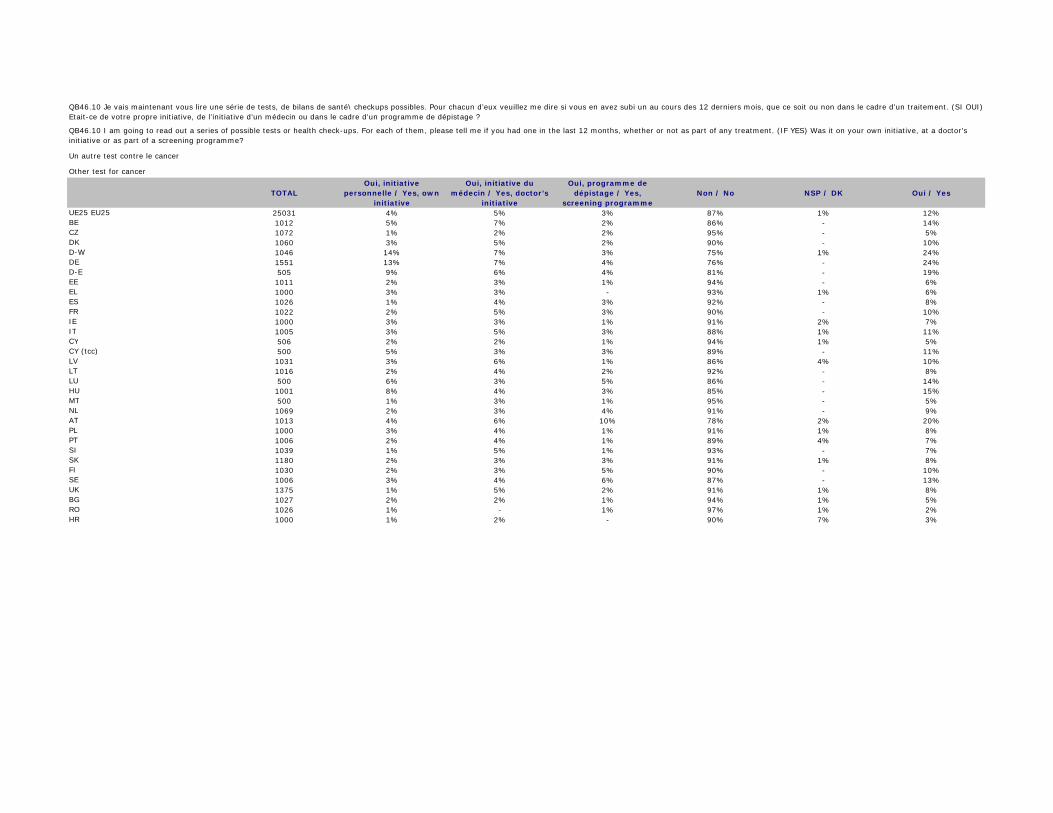
TOTALOui, initiative
personnelle / Yes, own initiative
Oui, initiative du médecin / Yes, doctor’s
initiative
Oui, programme de dépistage / Yes,
screening programmeNon / No NSP / DK Oui / Yes
UE25 EU25 25031 4% 5% 3% 87% 1% 12%BE 1012 5% 7% 2% 86% - 14%CZ 1072 1% 2% 2% 95% - 5%DK 1060 3% 5% 2% 90% - 10%D-W 1046 14% 7% 3% 75% 1% 24%DE 1551 13% 7% 4% 76% - 24%D-E 505 9% 6% 4% 81% - 19%EE 1011 2% 3% 1% 94% - 6%EL 1000 3% 3% - 93% 1% 6%ES 1026 1% 4% 3% 92% - 8%FR 1022 2% 5% 3% 90% - 10%IE 1000 3% 3% 1% 91% 2% 7%IT 1005 3% 5% 3% 88% 1% 11%CY 506 2% 2% 1% 94% 1% 5%CY (tcc) 500 5% 3% 3% 89% - 11%LV 1031 3% 6% 1% 86% 4% 10%LT 1016 2% 4% 2% 92% - 8%LU 500 6% 3% 5% 86% - 14%HU 1001 8% 4% 3% 85% - 15%MT 500 1% 3% 1% 95% - 5%NL 1069 2% 3% 4% 91% - 9%AT 1013 4% 6% 10% 78% 2% 20%PL 1000 3% 4% 1% 91% 1% 8%PT 1006 2% 4% 1% 89% 4% 7%SI 1039 1% 5% 1% 93% - 7%SK 1180 2% 3% 3% 91% 1% 8%FI 1030 2% 3% 5% 90% - 10%SE 1006 3% 4% 6% 87% - 13%UK 1375 1% 5% 2% 91% 1% 8%BG 1027 2% 2% 1% 94% 1% 5%RO 1026 1% - 1% 97% 1% 2%HR 1000 1% 2% - 90% 7% 3%
Other test for cancer
QB46.10 Je vais maintenant vous lire une série de tests, de bilans de santé\ checkups possibles. Pour chacun d’eux veuillez me dire si vous en avez subi un au cours des 12 derniers mois, que ce soit ou non dans le cadre d’un traitement. (SI OUI) Etait-ce de votre propre initiative, de l’initiative d’un médecin ou dans le cadre d’un programme de dépistage ?
QB46.10 I am going to read out a series of possible tests or health check-ups. For each of them, please tell me if you had one in the last 12 months, whether or not as part of any treatment. (IF YES) Was it on your own initiative, at a doctor's initiative or as part of a screening programme?
Un autre test contre le cancer

TOTALAu cours des 12 derniers mois /
Within the past 12 monthsIl y a 1-5 ans / 1 – 5 years ago
Pas au cours des 5 dernières années ou jamais / Not within the past 5
years or never
NSP\ Ne se souvient plus / DK\ Do not remember
UE25 EU25 25031 62% 21% 9% 8%BE 1012 74% 18% 6% 2%CZ 1072 60% 29% 8% 3%DK 1060 54% 29% 14% 3%D-W 1046 67% 20% 6% 7%DE 1551 68% 20% 6% 6%D-E 505 72% 20% 5% 3%EE 1011 71% 22% 4% 3%EL 1000 62% 19% 15% 4%ES 1026 51% 25% 13% 11%FR 1022 81% 13% 5% 1%IE 1000 51% 22% 13% 14%IT 1005 54% 18% 9% 19%CY 506 64% 18% 9% 9%CY (tcc) 500 64% 9% 13% 14%LV 1031 66% 24% 8% 2%LT 1016 68% 19% 6% 7%LU 500 80% 11% 5% 4%HU 1001 73% 18% 3% 6%MT 500 67% 19% 11% 3%NL 1069 50% 29% 19% 2%AT 1013 56% 23% 9% 12%PL 1000 53% 24% 9% 14%PT 1006 77% 13% 4% 6%SI 1039 64% 28% 4% 4%SK 1180 69% 23% 5% 3%FI 1030 62% 31% 5% 2%SE 1006 57% 31% 9% 3%UK 1375 63% 23% 12% 2%BG 1027 61% 17% 13% 9%RO 1026 54% 21% 9% 16%HR 1000 60% 24% 9% 7%
QB47 Quand est-ce que votre pression artérielle a été mesurée pour la dernière fois par une personne du corps médical ?
QB47 When was your blood pressure last measured by a health professional?
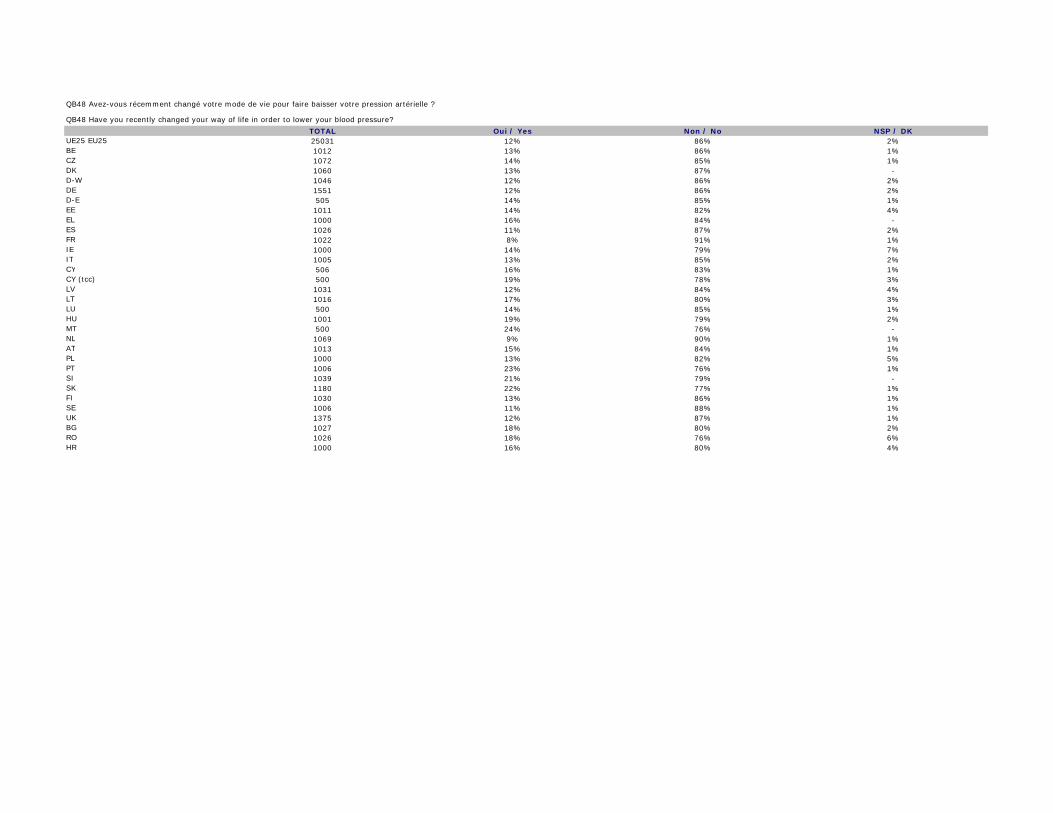
TOTAL Oui / Yes Non / No NSP / DKUE25 EU25 25031 12% 86% 2%BE 1012 13% 86% 1%CZ 1072 14% 85% 1%DK 1060 13% 87% - D-W 1046 12% 86% 2%DE 1551 12% 86% 2%D-E 505 14% 85% 1%EE 1011 14% 82% 4%EL 1000 16% 84% - ES 1026 11% 87% 2%FR 1022 8% 91% 1%IE 1000 14% 79% 7%IT 1005 13% 85% 2%CY 506 16% 83% 1%CY (tcc) 500 19% 78% 3%LV 1031 12% 84% 4%LT 1016 17% 80% 3%LU 500 14% 85% 1%HU 1001 19% 79% 2%MT 500 24% 76% - NL 1069 9% 90% 1%AT 1013 15% 84% 1%PL 1000 13% 82% 5%PT 1006 23% 76% 1%SI 1039 21% 79% - SK 1180 22% 77% 1%FI 1030 13% 86% 1%SE 1006 11% 88% 1%UK 1375 12% 87% 1%BG 1027 18% 80% 2%RO 1026 18% 76% 6%HR 1000 16% 80% 4%
QB48 Avez-vous récemment changé votre mode de vie pour faire baisser votre pression artérielle ?
QB48 Have you recently changed your way of life in order to lower your blood pressure?

TOTALAu cours des 12 derniers mois /
Within the past 12 monthsIl y a 1-5 ans / 1 – 5 years ago
Pas au cours des 5 dernières années ou jamais / Not within the past 5
years or never
NSP\ Ne se souvient plus / DK\ Do not remember
UE25 EU25 25031 39% 22% 27% 12%BE 1012 48% 18% 28% 6%CZ 1072 29% 25% 32% 14%DK 1060 29% 14% 50% 7%D-W 1046 42% 24% 22% 12%DE 1551 40% 23% 24% 13%D-E 505 36% 19% 30% 15%EE 1011 33% 22% 28% 17%EL 1000 55% 20% 22% 3%ES 1026 47% 26% 15% 12%FR 1022 45% 23% 29% 3%IE 1000 34% 19% 26% 21%IT 1005 41% 23% 17% 19%CY 506 52% 19% 16% 13%CY (tcc) 500 43% 9% 24% 24%LV 1031 30% 17% 45% 8%LT 1016 32% 15% 28% 25%LU 500 61% 15% 14% 10%HU 1001 38% 20% 20% 22%MT 500 39% 16% 40% 5%NL 1069 25% 16% 56% 3%AT 1013 43% 23% 17% 17%PL 1000 28% 22% 26% 24%PT 1006 61% 16% 8% 15%SI 1039 40% 26% 23% 11%SK 1180 42% 26% 24% 8%FI 1030 38% 30% 23% 9%SE 1006 27% 23% 38% 12%UK 1375 33% 17% 44% 6%BG 1027 27% 13% 37% 23%RO 1026 23% 22% 22% 33%HR 1000 33% 26% 27% 14%
QB49 Quand est-ce que votre cholestérol a été testé pour la dernière fois par une personne du corps médical ?
QB49 When was your blood cholesterol last measured by a health professional?

TOTAL Oui / Yes Non / No NSP / DKUE25 EU25 25031 13% 85% 2%BE 1012 18% 81% 1%CZ 1072 15% 84% 1%DK 1060 11% 88% 1%D-W 1046 13% 85% 2%DE 1551 13% 85% 2%D-E 505 15% 84% 1%EE 1011 12% 81% 7%EL 1000 14% 85% 1%ES 1026 10% 89% 1%FR 1022 11% 88% 1%IE 1000 16% 77% 7%IT 1005 13% 85% 2%CY 506 19% 79% 2%CY (tcc) 500 18% 78% 4%LV 1031 10% 84% 6%LT 1016 14% 81% 5%LU 500 14% 84% 2%HU 1001 14% 82% 4%MT 500 25% 75% - NL 1069 10% 88% 2%AT 1013 13% 85% 2%PL 1000 12% 83% 5%PT 1006 19% 79% 2%SI 1039 17% 82% 1%SK 1180 20% 78% 2%FI 1030 17% 82% 1%SE 1006 12% 87% 1%UK 1375 12% 87% 1%BG 1027 12% 83% 5%RO 1026 12% 80% 8%HR 1000 14% 82% 4%
QB50 Avez-vous récemment changé votre mode de vie pour faire baisser votre cholestérol ?
QB50 Have you recently changed your way of life in order to lower your blood cholesterol?
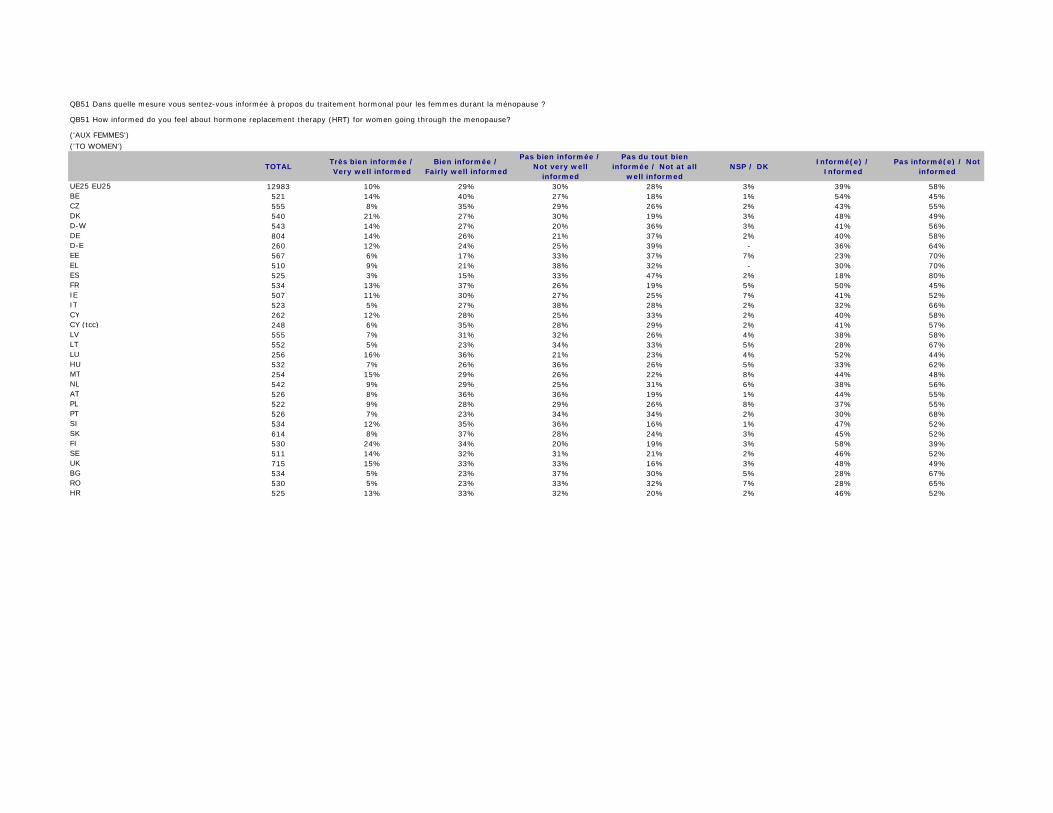
TOTALTrès bien informée / Very well informed
Bien informée / Fairly well informed
Pas bien informée / Not very well
informed
Pas du tout bien informée / Not at all
well informedNSP / DK
Informé(e) / Informed
Pas informé(e) / Not informed
UE25 EU25 12983 10% 29% 30% 28% 3% 39% 58%BE 521 14% 40% 27% 18% 1% 54% 45%CZ 555 8% 35% 29% 26% 2% 43% 55%DK 540 21% 27% 30% 19% 3% 48% 49%D-W 543 14% 27% 20% 36% 3% 41% 56%DE 804 14% 26% 21% 37% 2% 40% 58%D-E 260 12% 24% 25% 39% - 36% 64%EE 567 6% 17% 33% 37% 7% 23% 70%EL 510 9% 21% 38% 32% - 30% 70%ES 525 3% 15% 33% 47% 2% 18% 80%FR 534 13% 37% 26% 19% 5% 50% 45%IE 507 11% 30% 27% 25% 7% 41% 52%IT 523 5% 27% 38% 28% 2% 32% 66%CY 262 12% 28% 25% 33% 2% 40% 58%CY (tcc) 248 6% 35% 28% 29% 2% 41% 57%LV 555 7% 31% 32% 26% 4% 38% 58%LT 552 5% 23% 34% 33% 5% 28% 67%LU 256 16% 36% 21% 23% 4% 52% 44%HU 532 7% 26% 36% 26% 5% 33% 62%MT 254 15% 29% 26% 22% 8% 44% 48%NL 542 9% 29% 25% 31% 6% 38% 56%AT 526 8% 36% 36% 19% 1% 44% 55%PL 522 9% 28% 29% 26% 8% 37% 55%PT 526 7% 23% 34% 34% 2% 30% 68%SI 534 12% 35% 36% 16% 1% 47% 52%SK 614 8% 37% 28% 24% 3% 45% 52%FI 530 24% 34% 20% 19% 3% 58% 39%SE 511 14% 32% 31% 21% 2% 46% 52%UK 715 15% 33% 33% 16% 3% 48% 49%BG 534 5% 23% 37% 30% 5% 28% 67%RO 530 5% 23% 33% 32% 7% 28% 65%HR 525 13% 33% 32% 20% 2% 46% 52%
('AUX FEMMES')
('TO WOMEN')
QB51 Dans quelle mesure vous sentez-vous informée à propos du traitement hormonal pour les femmes durant la ménopause ?
QB51 How informed do you feel about hormone replacement therapy (HRT) for women going through the menopause?

TOTAL Oui / Yes Non / No NSP\ Refus / DK\ RefusalUE25 EU25 5367 6% 92% 2%BE 223 13% 86% 1%CZ 220 7% 91% 2%DK 235 6% 93% 1%D-W 234 8% 90% 2%DE 353 7% 91% 2%D-E 123 5% 94% 1%EE 247 3% 95% 2%EL 207 3% 95% 2%ES 210 3% 93% 4%FR 208 10% 90% - IE 162 11% 88% 1%IT 227 2% 95% 3%CY 93 5% 94% 1%CY (tcc) 74 9% 90% 1%LV 189 8% 90% 2%LT 227 4% 96% - LU 97 13% 87% - HU 235 2% 95% 3%MT 108 8% 90% 2%NL 207 2% 98% - AT 226 5% 94% 1%PL 207 8% 90% 2%PT 221 9% 89% 2%SI 235 12% 87% 1%SK 220 10% 89% 1%FI 245 20% 77% 3%SE 239 15% 84% 1%UK 286 6% 94% - BG 237 2% 94% 4%RO 214 4% 90% 6%HR 230 9% 91% -
('AUX FEMMES DE PLUS DE 50 ANS')('TO WOMEN OLDER THAN 50 YEARS OLD')
QB52 Suivez-vous actuellement un traitement hormonal pour la ménopause ?
QB52 Are you on hormone replacement therapy?

TOTALOui, initiative
personnelle / Yes, own initiative
Oui, initiative du médecin / Yes, doctor’s
initiative
Oui, programme de dépistage / Yes,
screening programmeNon / No NSP / DK Oui / Yes
UE25 EU25 12983 10% 12% 9% 68% 1% 31%BE 521 13% 16% 7% 64% - 36%CZ 555 6% 12% 9% 73% - 27%DK 540 6% 4% 3% 86% 1% 13%D-W 543 22% 6% 3% 68% 1% 31%DE 804 21% 8% 4% 67% - 33%D-E 260 16% 13% 7% 64% - 36%EE 567 7% 7% 6% 79% 1% 20%EL 510 13% 15% 1% 71% - 29%ES 525 5% 15% 10% 70% - 30%FR 534 6% 18% 11% 65% - 35%IE 507 9% 8% 4% 75% 4% 21%IT 523 13% 15% 14% 58% - 42%CY 262 10% 7% 7% 76% - 24%CY (tcc) 248 12% 12% 5% 71% - 29%LV 555 14% 15% 3% 68% - 32%LT 552 6% 8% 2% 84% - 16%LU 256 15% 16% 14% 55% - 45%HU 532 16% 15% 7% 61% 1% 38%MT 254 12% 5% 3% 80% - 20%NL 542 3% 6% 16% 74% 1% 25%AT 526 17% 19% 17% 46% 1% 53%PL 522 12% 8% 2% 76% 2% 22%PT 526 8% 34% 3% 54% 1% 45%SI 534 7% 13% - 80% - 20%SK 614 9% 15% 12% 63% 1% 36%FI 530 7% 7% 16% 69% 1% 30%SE 511 4% 5% 25% 65% 1% 34%UK 715 3% 7% 8% 81% 1% 18%BG 534 6% 9% 2% 78% 5% 17%RO 530 3% 3% - 86% 8% 6%HR 525 12% 9% 4% 74% 1% 25%
Breast examination by X-ray, that is mammography
('AUX FEMMES')
('TO WOMEN')
QB53.1 Au cours des 12 derniers mois, avez-vous passé un des tests suivants ? (SI OUI) Etait-ce de votre propre initiative, de l’initiative d’un médecin ou dans le cadre d’un programme de dépistage ?
QB53.1 Over the last 12 months, which, if any, of the following tests have you had? (IF YES) Was it on your own initiative, at a doctor's initiative or as part of a screening programme?
Un examen des seins au rayon-X, c’est-à-dire une mammographie

TOTALOui, initiative
personnelle / Yes, own initiative
Oui, initiative du médecin / Yes, doctor’s
initiative
Oui, programme de dépistage / Yes,
screening programmeNon / No NSP / DK Oui / Yes
UE25 EU25 12983 21% 16% 6% 56% 1% 43%BE 521 29% 18% 5% 48% - 52%CZ 555 8% 12% 12% 68% - 32%DK 540 16% 7% 3% 73% 1% 26%D-W 543 40% 15% 6% 38% 1% 61%DE 804 38% 17% 8% 37% - 63%D-E 260 27% 24% 16% 33% - 67%EE 567 10% 7% 2% 81% - 19%EL 510 27% 10% 1% 62% - 38%ES 525 10% 16% 10% 64% - 36%FR 534 9% 37% 7% 47% - 53%IE 507 29% 6% 2% 59% 4% 37%IT 523 16% 13% 11% 60% - 40%CY 262 29% 9% 5% 57% - 43%CY (tcc) 248 18% 10% 1% 71% - 29%LV 555 20% 26% 6% 48% - 52%LT 552 10% 13% 1% 75% 1% 24%LU 256 24% 26% 13% 37% - 63%HU 532 22% 15% 6% 56% 1% 43%MT 254 42% 7% 1% 50% - 50%NL 542 25% 5% 3% 66% 1% 33%AT 526 29% 25% 18% 26% 2% 72%PL 522 20% 10% 2% 65% 3% 32%PT 526 23% 23% - 52% 2% 46%SI 534 17% 17% 3% 63% - 37%SK 614 19% 18% 18% 44% 1% 55%FI 530 26% 13% 5% 55% 1% 44%SE 511 19% 3% 5% 72% 1% 27%UK 715 24% 6% 3% 66% 1% 33%BG 534 14% 8% 2% 71% 5% 24%RO 530 21% 1% 1% 69% 8% 23%HR 525 20% 8% 4% 67% 1% 32%
Breast examination by hand
('AUX FEMMES')
('TO WOMEN')
QB53.2 Au cours des 12 derniers mois, avez-vous passé un des tests suivants ? (SI OUI) Etait-ce de votre propre initiative, de l’initiative d’un médecin ou dans le cadre d’un programme de dépistage ?
QB53.2 Over the last 12 months, which, if any, of the following tests have you had? (IF YES) Was it on your own initiative, at a doctor's initiative or as part of a screening programme?
Un examen manuel des seins

TOTALOui, initiative
personnelle / Yes, own initiative
Oui, initiative du médecin / Yes, doctor’s
initiative
Oui, programme de dépistage / Yes,
screening programmeNon / No NSP / DK Oui / Yes
UE25 EU25 12983 11% 14% 5% 69% 1% 30%BE 521 14% 20% 3% 63% - 37%CZ 555 8% 9% 19% 63% 1% 36%DK 540 4% 10% 4% 81% 1% 18%D-W 543 26% 14% 7% 52% 1% 47%DE 804 25% 15% 9% 50% 1% 49%D-E 260 24% 17% 15% 44% - 56%EE 567 11% 9% - 80% - 20%EL 510 17% 10% 1% 72% - 28%ES 525 7% 17% 8% 68% - 32%FR 534 5% 26% 1% 68% - 32%IE 507 3% 7% 1% 85% 4% 11%IT 523 9% 14% 8% 68% 1% 31%CY 262 9% 8% 3% 79% 1% 20%CY (tcc) 248 6% 12% 3% 79% - 21%LV 555 17% 26% 6% 50% 1% 49%LT 552 7% 9% 2% 82% - 18%LU 256 23% 20% 10% 47% - 53%HU 532 19% 10% 6% 63% 2% 35%MT 254 12% 5% 1% 82% - 18%NL 542 2% 4% 1% 92% 1% 7%AT 526 17% 23% 19% 38% 3% 59%PL 522 15% 10% - 73% 2% 25%PT 526 6% 29% 1% 63% 1% 36%SI 534 10% 19% 2% 69% - 31%SK 614 12% 18% 16% 53% 1% 46%FI 530 7% 14% 3% 75% 1% 24%SE 511 4% 5% 5% 85% 1% 14%UK 715 2% 6% 1% 90% 1% 9%BG 534 12% 6% 1% 75% 6% 19%RO 530 6% 6% - 80% 8% 12%HR 525 19% 12% 5% 63% 1% 36%
Ovary examination
('AUX FEMMES')
('TO WOMEN')
QB53.3 Au cours des 12 derniers mois, avez-vous passé un des tests suivants ? (SI OUI) Etait-ce de votre propre initiative, de l’initiative d’un médecin ou dans le cadre d’un programme de dépistage ?
QB53.3 Over the last 12 months, which, if any, of the following tests have you had? (IF YES) Was it on your own initiative, at a doctor's initiative or as part of a screening programme?
Un examen des ovaires
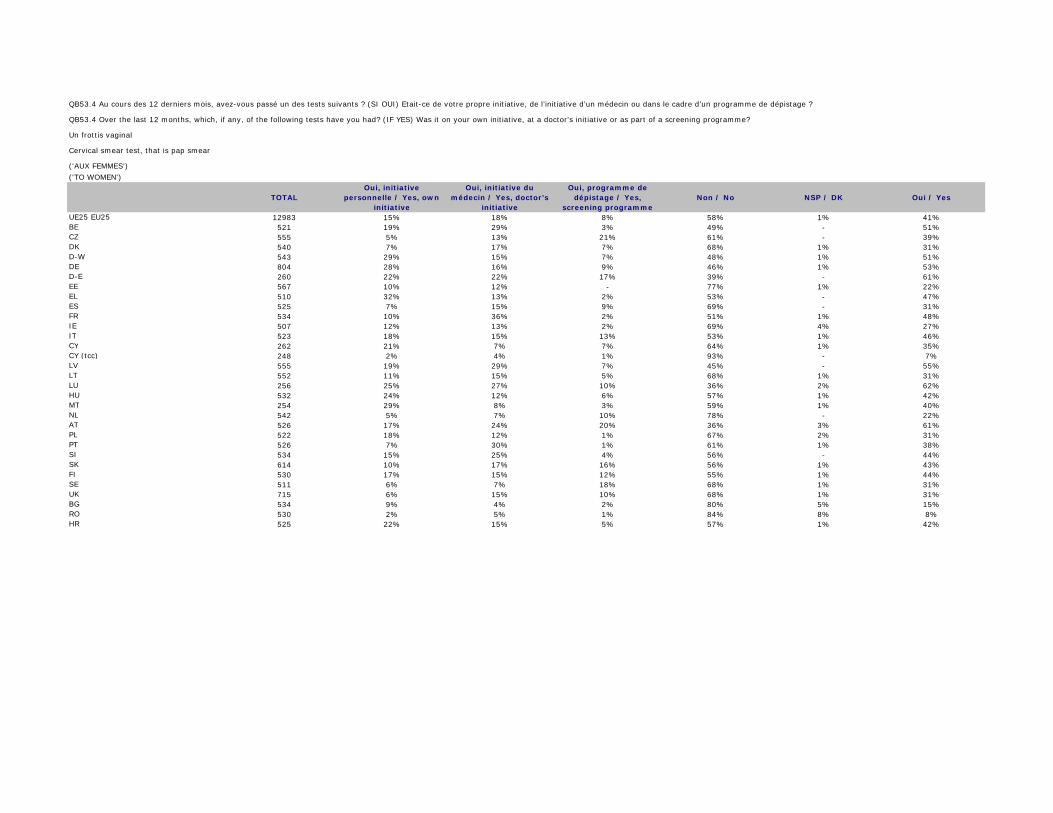
TOTALOui, initiative
personnelle / Yes, own initiative
Oui, initiative du médecin / Yes, doctor’s
initiative
Oui, programme de dépistage / Yes,
screening programmeNon / No NSP / DK Oui / Yes
UE25 EU25 12983 15% 18% 8% 58% 1% 41%BE 521 19% 29% 3% 49% - 51%CZ 555 5% 13% 21% 61% - 39%DK 540 7% 17% 7% 68% 1% 31%D-W 543 29% 15% 7% 48% 1% 51%DE 804 28% 16% 9% 46% 1% 53%D-E 260 22% 22% 17% 39% - 61%EE 567 10% 12% - 77% 1% 22%EL 510 32% 13% 2% 53% - 47%ES 525 7% 15% 9% 69% - 31%FR 534 10% 36% 2% 51% 1% 48%IE 507 12% 13% 2% 69% 4% 27%IT 523 18% 15% 13% 53% 1% 46%CY 262 21% 7% 7% 64% 1% 35%CY (tcc) 248 2% 4% 1% 93% - 7%LV 555 19% 29% 7% 45% - 55%LT 552 11% 15% 5% 68% 1% 31%LU 256 25% 27% 10% 36% 2% 62%HU 532 24% 12% 6% 57% 1% 42%MT 254 29% 8% 3% 59% 1% 40%NL 542 5% 7% 10% 78% - 22%AT 526 17% 24% 20% 36% 3% 61%PL 522 18% 12% 1% 67% 2% 31%PT 526 7% 30% 1% 61% 1% 38%SI 534 15% 25% 4% 56% - 44%SK 614 10% 17% 16% 56% 1% 43%FI 530 17% 15% 12% 55% 1% 44%SE 511 6% 7% 18% 68% 1% 31%UK 715 6% 15% 10% 68% 1% 31%BG 534 9% 4% 2% 80% 5% 15%RO 530 2% 5% 1% 84% 8% 8%HR 525 22% 15% 5% 57% 1% 42%
Cervical smear test, that is pap smear
('AUX FEMMES')
('TO WOMEN')
QB53.4 Au cours des 12 derniers mois, avez-vous passé un des tests suivants ? (SI OUI) Etait-ce de votre propre initiative, de l’initiative d’un médecin ou dans le cadre d’un programme de dépistage ?
QB53.4 Over the last 12 months, which, if any, of the following tests have you had? (IF YES) Was it on your own initiative, at a doctor's initiative or as part of a screening programme?
Un frottis vaginal

TOTALOui, initiative
personnelle / Yes, own initiative
Oui, initiative du médecin / Yes, doctor’s
initiative
Oui, programme de dépistage / Yes,
screening programmeNon / No NSP / DK Oui / Yes
UE25 EU25 12983 14% 13% 5% 67% 1% 32%BE 521 12% 17% 2% 69% - 31%CZ 555 15% 12% 25% 47% 1% 52%DK 540 10% 13% 3% 73% 1% 26%D-W 543 26% 13% 6% 54% 1% 45%DE 804 27% 13% 7% 52% 1% 47%D-E 260 27% 15% 12% 45% 1% 54%EE 567 29% 13% - 58% - 42%EL 510 21% 11% 1% 67% - 33%ES 525 7% 16% 8% 69% - 31%FR 534 7% 18% - 75% - 25%IE 507 4% 8% 1% 83% 4% 13%IT 523 14% 12% 9% 65% - 35%CY 262 7% 5% 3% 84% 1% 15%CY (tcc) 248 8% 12% 2% 78% - 22%LV 555 19% 24% 5% 51% 1% 48%LT 552 14% 12% 4% 70% - 30%LU 256 23% 19% 9% 48% 1% 51%HU 532 27% 12% 6% 55% - 45%MT 254 13% 5% 3% 79% - 21%NL 542 3% 7% 1% 89% - 11%AT 526 19% 23% 20% 35% 3% 62%PL 522 20% 11% 1% 66% 2% 32%PT 526 6% 27% 1% 65% 1% 34%SI 534 15% 24% 5% 56% - 44%SK 614 15% 15% 18% 51% 1% 48%FI 530 24% 13% 4% 58% 1% 41%SE 511 12% 6% 9% 72% 1% 27%UK 715 2% 9% - 88% 1% 11%BG 534 12% 7% 2% 74% 5% 21%RO 530 13% 8% - 71% 8% 21%HR 525 20% 12% 4% 63% 1% 36%
Other gynaecological examination
('AUX FEMMES')
('TO WOMEN')
QB53.5 Au cours des 12 derniers mois, avez-vous passé un des tests suivants ? (SI OUI) Etait-ce de votre propre initiative, de l’initiative d’un médecin ou dans le cadre d’un programme de dépistage ?
QB53.5 Over the last 12 months, which, if any, of the following tests have you had? (IF YES) Was it on your own initiative, at a doctor's initiative or as part of a screening programme?
D’autres examens gynécologiques

TOTALOui, initiative
personnelle / Yes, own initiative
Oui, initiative du médecin / Yes, doctor’s
initiative
Oui, programme de dépistage / Yes,
screening programmeNon / No NSP / DK Oui / Yes
UE25 EU25 12983 4% 8% 2% 85% 1% 14%BE 521 4% 10% 3% 83% - 17%CZ 555 2% 7% 3% 88% - 12%DK 540 1% 4% 1% 93% 1% 6%D-W 543 9% 9% 2% 79% 1% 20%DE 804 8% 9% 2% 81% - 19%D-E 260 3% 6% 3% 88% - 12%EE 567 5% 3% - 91% 1% 8%EL 510 10% 8% - 82% - 18%ES 525 2% 9% 3% 85% 1% 14%FR 534 3% 6% - 91% - 9%IE 507 4% 4% 1% 86% 5% 9%IT 523 5% 14% 5% 75% 1% 24%CY 262 7% 5% 2% 85% 1% 14%CY (tcc) 248 4% 13% 3% 80% - 20%LV 555 5% 8% 1% 85% 1% 14%LT 552 4% 3% - 92% 1% 7%LU 256 6% 8% 3% 82% 1% 17%HU 532 8% 13% 4% 75% - 25%MT 254 4% 5% 1% 88% 2% 10%NL 542 2% 4% - 93% 1% 6%AT 526 7% 17% 8% 66% 2% 32%PL 522 7% 5% 1% 85% 2% 13%PT 526 3% 14% 1% 79% 3% 18%SI 534 4% 8% 2% 86% - 14%SK 614 4% 9% 7% 77% 3% 20%FI 530 3% 4% 2% 90% 1% 9%SE 511 1% 3% - 96% - 4%UK 715 1% 5% - 94% - 6%BG 534 5% 6% 2% 82% 5% 13%RO 530 3% 5% - 84% 8% 8%HR 525 6% 7% 2% 84% 1% 15%
Osteoporosis examination
('AUX FEMMES')
('TO WOMEN')
QB53.6 Au cours des 12 derniers mois, avez-vous passé un des tests suivants ? (SI OUI) Etait-ce de votre propre initiative, de l’initiative d’un médecin ou dans le cadre d’un programme de dépistage ?
QB53.6 Over the last 12 months, which, if any, of the following tests have you had? (IF YES) Was it on your own initiative, at a doctor's initiative or as part of a screening programme?
Un examen de dépistage de l’ostéoporose