HEALTH IMPACT ASSESSMENT - chc-inc.org
40
ROBERT BAIRD, MPL Street Vendor Legalization and Student Nutrition in South Los Angeles: AUGUST 31, 2015 HEALTH IMPACT ASSESSMENT
Transcript of HEALTH IMPACT ASSESSMENT - chc-inc.org

ROBERT BA I RD , MP L
Street Vendor Legalization and Student Nutrition in South Los Angeles:
AUGUST 31, 2015
HEALTH IMPACT ASSESSMENT

Acknowledgements
AuthorRobert Baird, MPL, Policy Analyst
Steering Committee ParticipantsBrian Cole, UCLA Fielding School of Public HealthRudy Espinoza, Leadership for Urban Renewal NetworkJanet Favela, East Los Angeles Community CorporationDellis Frank, Los Angeles Unified School DistrictGregg Kettles, attorneyMatthew Sharp, California Food Policy AdvocatesJacqueline Taylor, LA County Department of Public HealthMark Vallianatos, Urban and Environmental Policy Institute
REACH Staff/Partner ContributionsGwendolyn Flynn, Nutrition Resources Policy Director, Community Health CouncilsGabriel Stover, Director of Research and Evaluation, Community Health CouncilsDavid Sloane, Professor, USC Sol Price School of Public PolicyRuth Bell, LA County Department of Public HealthTahirah Farris, USC Sol Price School of Public PolicyRobert Akil Bell, Community Health CouncilsZeke Chen, Intern, Community Health CouncilsQianyao Duan, Intern, Community Health Councils Hector Gutierrez, Community Health CouncilsJaime Martinez, Community Health CouncilsJoseph Martinez, Community Health CouncilsTiffany McDaniel, Community Health CouncilsBreanna Morrison, Community Health CouncilsLyndsey Nolan, Intern, Community Health CouncilsJonathan Rivas, Intern, Community Health CouncilsAndres Rivera, Community Health CouncilsSadio Woods, Community Health Councils
REACH Partners in Health Partners in Health is a 3-year project to develop and implement replicable and scalable policy, systems and environmental changes that reduce disparities in obesity and hypertension for African-American and Latino residents in South Los Angeles. The project’s core collaborators are Community Health Councils, the Los Angeles County Department of Public Health, Los Angeles Unified School District and the University of Southern California. Project initiatives are funded by a Racial and Ethnic Approaches to Community Health (REACH) Demonstration Grant awarded by the Centers for Disease Control and Prevention.
Community Health Councils (CHC) is a non-profit, community-based health education and policy organization. Established in 1992, our mission is to promote social justice and achieve equity in community and environmental resources to improve the health of underserved populations.
3731 Stocker Street, Suite 201 Los Angeles, CA 90008 Tel. 323.295.9372 | Fax 323.295.9467 | [email protected]
Field AssessorsStacy FarfanStephanie HedtTania MercadoJennifer MooreDenise PayanCindy QuijivixAlison SpindlerJessica Wackenhut

Page ︱ 1
Street Vendor and Student Nutrition HIA
Report Structure
Executive Summary ........................................................................................................................2Section 1: Introduction ....................................................................................................................4Section 2: Background ....................................................................................................................7Summarizes chronic disease and food access indicators in South Los Angeles. Reviews research connecting dietary impacts and nutrition behaviors with food resource environments; Describes the regulatory and enforcement conditions encountered by street vendors and the evolution of reform efforts.
Student Health Outcomes Related to Street Vending .............................................................7Student Nutrition Environments in South Los Angeles ..............................................................8Street Vending Regulatory Environment ...............................................................................10Street Vendor Legalization Campaign ...............................................................................10
Section 3: Methods .......................................................................................................................11Describes the structure of the analysis, including environmental and regulatory variables for consideration. Provides detail on the study sample construction and primary data collection.
Research Framework ......................................................................................................11School Comparisons ......................................................................................................12Field Observations ........................................................................................................14Student Surveys .............................................................................................................16
Section 4: Results .........................................................................................................................17Summarizes and interprets data obtained from field observations and student surveys.
Street Vendor Presence Near Schools ...............................................................................17Student Nutrition Behaviors in Relation to Street Vending ....................................................19Bicycle/Pedestrian Presence in Relation to Street Vending ...................................................21
Section 5: Discussion ....................................................................................................................25Summarizes resource constraints of the assessment and opportunities for further inquiry. Reviews overall findings from the analysis and discusses considerations for future policy interventions.
Limitations .....................................................................................................................25Conclusions ..................................................................................................................25
Appendix 1: Field Observation Grid .............................................................................................28Appendix 2: Student Survey .........................................................................................................31Appendix 3: Additional Data ........................................................................................................36Appendix 4: City Council Motion (CF 13-1493) ..............................................................................37Appendix 5: Proposed Sidewalk Vending Ordinance .....................................................................38
This assessment employed a comparison of schools located in similar socioeconomic environments, but in jurisdictions with contrasting regulations for street food vendors, to determine differences in street vendor presence near schools and student nutrition behaviors. It also considers whether the presence of street food vendors correlates with differences in pedestrian and bicycle safety near schools. Results begin to quantify the role of street vendors within the wider food resource environment. In accordance with the proposed legislation to legalize sidewalk vending, only vendors selling food and beverages from conveyances (i.e. carts, containers) that are pushed, carried or pedaled into the pedestrian realm were included in the assessment. The proceeding description of the assessment is organized to include the following information:

Executive SummaryThe food environments encoun-tered by South Los Angeles students continue to undermine their chances for a healthy fu-ture. Much of their community meets the federal designation of a food desert, and fast food comprises a far greater propor-tion of restaurants where they live compared to other places. Unsurprisingly, children in South Los Angeles consume more fast food and sugar-sweetened beverages and less fruits and vegetables than other children, and have the highest childhood obesity rate in Los Angeles County.
The food landscape these stu-dents navigate is multifaceted and includes convenience stores, food and ice cream trucks, and many channels of formal and informal exchange on campuses and in house-holds. Only in recent years has food provided in schools become a healthier alternative to the surrounding retail food environment. However, close-range competition with outlets selling calorie-dense meals, low-nutrient snacks and sugary beverages is undercutting stu-dent demand for more nutritious lunchroom meals and limiting their success.
Sidewalk vending is common in the food environments surround-ing schools, and is an informal enterprise providing stabilized income and business incubation for many low-income house-holds. Vendors have struggled for years against business and
resident opposition to gain a legally regulated status in Los Angeles, and a City Council vote to permit sidewalk vending could occur in 2015. A wide variety of items (including pre-pared drinks and homemade meals) are sold by vendors, but the most common sales to students and caretakers in afterschool hours are the cheap and convenient packaged snacks that drive caloric overconsumption.
This assessment considers how legalized sidewalk vending in South Los Angeles could change vendor activity near schools and the nutrition be-haviors of students, as well as other environmental changes in the public realm adjacent to schools. Utilizing field observa-tion and student surveys, the as-sessment compared schools in similar socioeconomic environ-ments, but in jurisdictions with contrasting sidewalk vending regulations.
Despite more comprehen-sive prohibitions of sidewalk vending, schools in South Los Angeles were as likely to have vendors operating in their proximity as schools in more permissible regulatory environ-ments. Cultural and economic characteristics of surrounding neighborhoods showed some correlation to vendor presence, but were not consistent between all the schools observed. Results point to the enforcement chal-lenges of citywide vendor pro-hibitions and suggest that a full
HEALTH IMPACT
ASSESSMENT
RECOMMENDATIONS
�� Continue to prohibit sidewalk and mobile food vending within 500 feet of school campuses. Adopt an exemption for vendors selling defined healthy snack and beverage items.
�� Promote healthy street vending by offering regulatory incentives and the support of microenterprise and vendor incubation programs.
�� Prioritize enforcement resources of sidewalk and mobile vending regulations to the peripheries of school campuses.
�� Improve support for healthy food interventions in South LA, including Market Match incentive programs, Neighborhood Market conversions, Grocery Retail development efforts, Healthy Restaurant and Healthy Market recognition programs, Healthy Food Zone adoption, and Healthy Kids Zone adoption.
2 ︱ Page

Page ︱ 3
or partial legalization of sidewalk vending would not likely increase vendor presence near schools.
A significant portion of students reported at least occasional snack and beverage purchases from vendors, at rates comparable with food and ice cream trucks. The patronage rates were signifi-cantly less, however, than fast food restaurants and corner stores, while households were the most frequent source of snacks and beverages. Patronage trends also indicate an inverse rela-tionship between sidewalk vendor purchases and
both school lunch participation and household snacks and beverages. These results begin to quantify the role of sidewalk vendors within a wider food landscape.
Efforts to improve nutrition within schools will remain stunted if the counterproductive food envi-ronment around schools is not addressed. Recom-mendations in this assessment include limiting un-healthy food near schools through regulation and enforcement, in combination with regulatory and programmatic support for healthy food outlets.

4 ︱ Page
HIA is a systematic process that uses an array of data sources and analytic methods and considers input from stakeholders to determine the potential effects of a proposed policy, plan, program, or project on the health of a population and the distribution of those effects within the population. HIA provides recommendations on monitoring and managing those effects.
National Research Council
1 Online HIA repositories are maintained by a number of organizations, including Human Impact Partners: www.humanimpact.org/projects/past-projects/
Los Angeles is considering a proposal to legalize sidewalk food vending, following efforts in recent years to organize low-income street vendors against criminalization and barriers to microenterprise. Another ongoing advocacy effort has generated increas-ing pressure to improve the nutritional quality of meals on public school campuses. As ad-ministrators struggle to market healthier meals to students, the counterproductive presence of poor nutrition environments sur-rounding campuses, which in-cludes street vendors, has come into sharper focus. To highlight the health considerations of this policy reform and inform dia-logue regarding new regulatory structures, Community Health Councils (CHC) conducted an assessment of the potential nu-trition-related impacts on school-age youth in South LA resulting from legalized sidewalk food vending.
HIA Purposes and Content
Health Impact Assessments (HIA) are an increasingly common way for stakeholder groups, advocacy organiza-tions and public agencies to examine the potential health outcomes of policy changes and development proposals on the health of vulnerable popu-lations. By connecting health disparities (based largely on
race and income, among other factors) to the physical and economic conditions of margin-alized communities, the modern environmental justice movement has generated a sustained scrutiny of local planning and decision-making processes in recent decades, where it had hardly existed before. As stake-holder groups have sought to construct persua-sive arguments, refute unsubstan-tiated rationales and misinforma-tion, and wield influence within the develop-ment and policy arena, they have replicated and innovated HIA formats with the flexibility needed to respond to the particular time and analytical demands of spe-cific proposals.
The range of topics that HIA address is broadening as awareness grows of the regulato-ry and placed-based factors that lead to health disparities. HIA are often introduced into decision-making processes regarding transit investments, infrastructure projects, hous-
ing development, sports and entertainment venues, drilling and mining permits, land use updates and zoning revisions, redevelopment initiatives, cam-pus plans, tax proposals, edu-cation reforms, and regulatory reforms.1 Some HIA seek to measure, to the extent possi-
ble, the projected impact of a proposal using data sources, health metrics and geospatial analysis, while other HIA (often in time- or resource-constrained
Section 1 Introduction
Page ︱ 5
situations) provide a more generalized discourse of the interests and vulnerabilities of relevant populations concerning a proposal, using primary and secondary sources. HIA with different ranges of analytical depth can be effective in shift-ing attention towards potential health and socioeconomic im-pacts that may be overlooked or ignored by conventional analysis and planning processes.
HIA focus on a specific pro-posal that is or may soon be considered for adoption or implementation within a giv-en geography, and contain findings that are ultimately health-related. Environmental and economic factors often contribute to these findings. It is also widely suggested that HIA give particular consideration to the uneven distribution of
health impacts (i.e. disparities) within geographic areas and to specific populations that are vulnerable to environmental or regulatory changes. HIA should also seek to contribute to the public dialogue about a pro-posal by disseminating findings and recommendations (includ-ing submissions to the public record), by seeking meaningful and substantial input from a range of stakeholders, and by drawing constituencies into regular engagement with the decision-making process.2
The production of HIA often advance through a multi-step process that begins with (1) an examination of the feasibility and usefulness of an HIA and (2) the identification of causal pathways, research objectives and assessment methodologies; then progresses to (3) the gath-ering of quantitative and quali-
tative information to assess ex-isting conditions and potential impacts and (4) the formulation of recommendations ; and end-ing with (5) the communication of findings and considerations to the public and (6) the moni-toring of public discourse, leg-islative or regulatory outcomes, and policy or project implemen-tation following dissemination of the HIA.
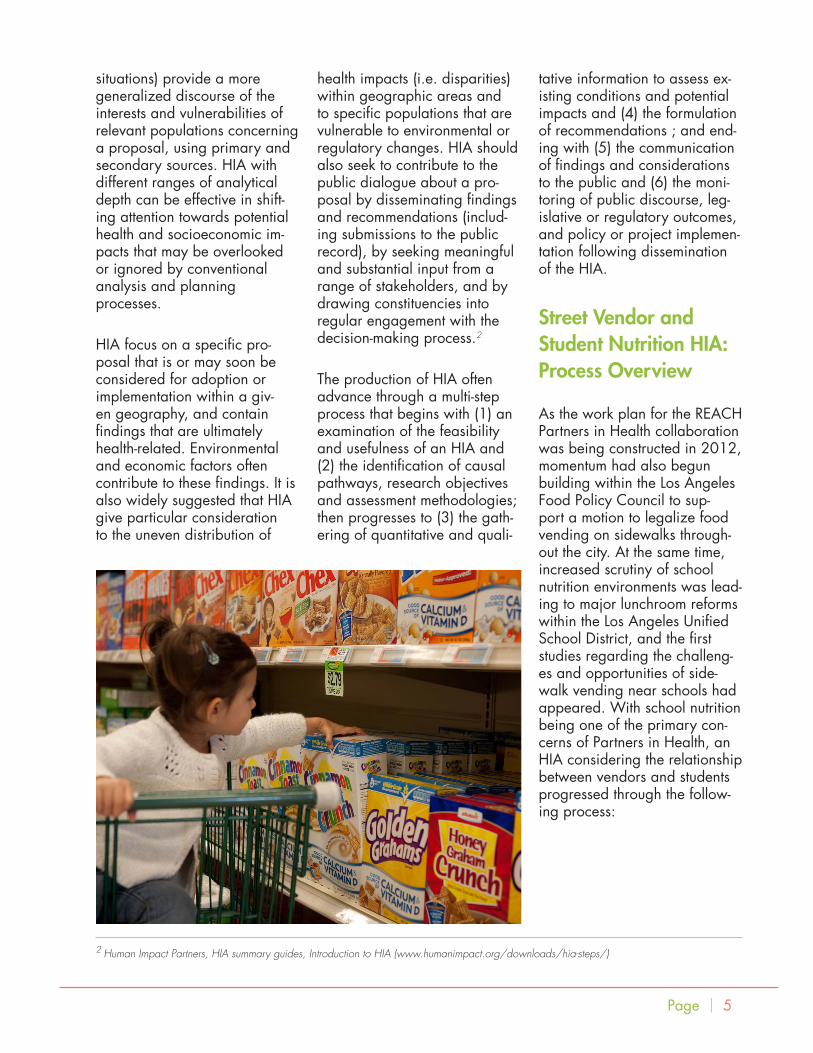
Street Vendor and Student Nutrition HIA: Process Overview
As the work plan for the REACH Partners in Health collaboration was being constructed in 2012, momentum had also begun building within the Los Angeles Food Policy Council to sup-port a motion to legalize food vending on sidewalks through-out the city. At the same time, increased scrutiny of school nutrition environments was lead-ing to major lunchroom reforms within the Los Angeles Unified School District, and the first studies regarding the challeng-es and opportunities of side-walk vending near schools had appeared. With school nutrition being one of the primary con-cerns of Partners in Health, an HIA considering the relationship between vendors and students progressed through the follow-ing process:
2 Human Impact Partners, HIA summary guides, Introduction to HIA (www.humanimpact.org/downloads/hia-steps/)

Screening CHC determined that an HIA addressing the potential legalization of sidewalk vending in relation to student health could provide a timely contribution to public dialogue about the issue possibly lead to improved access to healthy food in underinvested neighborhoods surrounding schools, and that a range of stakeholders were available to help inform the methodology and findings.
Scoping A steering committee was formed containing vendor organizers, school nutrition advocates, experts on vendor regulations and economics, representatives of enforcement agencies, school administrators, and HIA practitioners. During a series of meetings, the steering committee considered a broad spectrum of policy variables and environmental factors that correlate to student health, narrowed the scope of the assessment to the most important and feasible metrics, and helped identify the most practical methods of gathering data.
Assessment Assessors were utilized to perform field observations near selected schools, and coordination with school personnel enabled student surveys to be conducted.
Findings Analysis of the primary data collected, as well as secondary data from other sources and relevant policy alternatives for consideration, is included in this report.
Reporting The HIA report will be made available to the public on the CHC website, distributed to relevant decision-makers and to health policy and food policy stakeholders, and submitted for journal publication.
Monitoring As with many issues related to nutrition environments in South Los Angeles, CHC will reference the conclusions of this HIA as an active participant in future dialogues about sidewalk vending.
Page ︱ 6
Page ︱ 7
Section 2 BackgroundStudent Health Outcomes Related to Street Vending
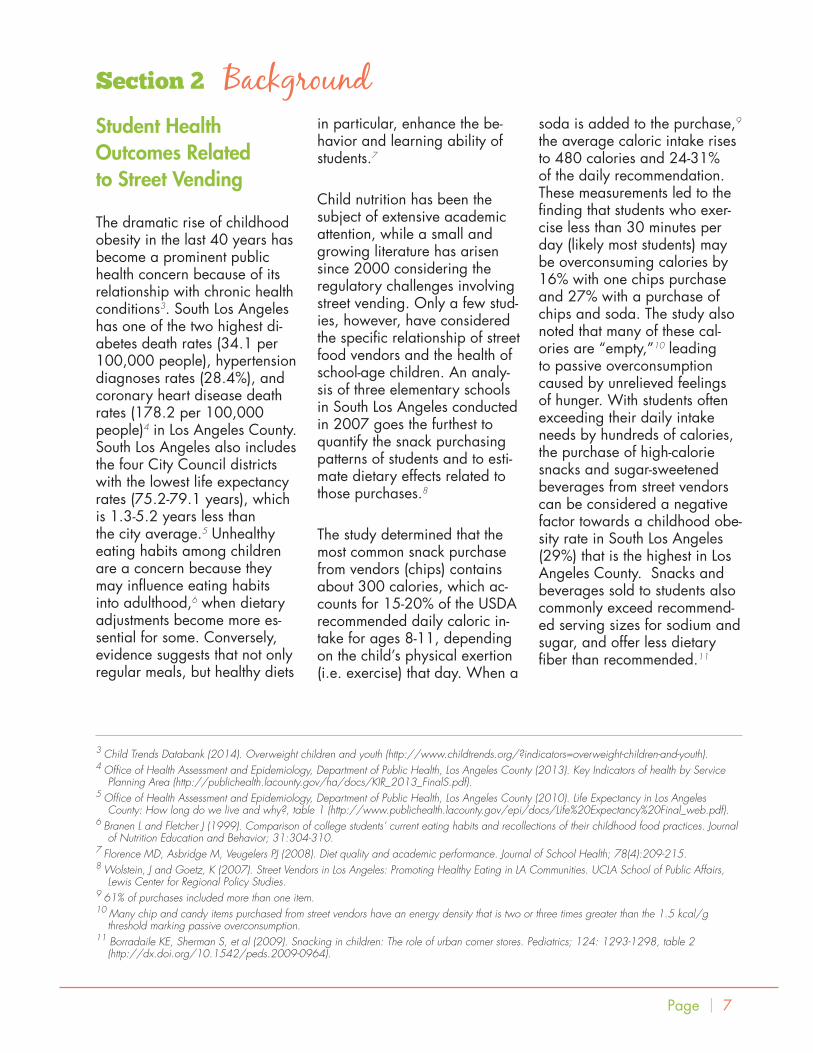
The dramatic rise of childhood obesity in the last 40 years has become a prominent public health concern because of its relationship with chronic health conditions3. South Los Angeles has one of the two highest di-abetes death rates (34.1 per 100,000 people), hypertension diagnoses rates (28.4%), and coronary heart disease death rates (178.2 per 100,000 people)4 in Los Angeles County. South Los Angeles also includes the four City Council districts with the lowest life expectancy rates (75.2-79.1 years), which is 1.3-5.2 years less than the city average.5 Unhealthy eating habits among children are a concern because they may influence eating habits into adulthood,6 when dietary adjustments become more es-sential for some. Conversely, evidence suggests that not only regular meals, but healthy diets
in particular, enhance the be-havior and learning ability of students.7
Child nutrition has been the subject of extensive academic attention, while a small and growing literature has arisen since 2000 considering the regulatory challenges involving street vending. Only a few stud-ies, however, have considered the specific relationship of street food vendors and the health of school-age children. An analy-sis of three elementary schools in South Los Angeles conducted in 2007 goes the furthest to quantify the snack purchasing patterns of students and to esti-mate dietary effects related to those purchases.8
The study determined that the most common snack purchase from vendors (chips) contains about 300 calories, which ac-counts for 15-20% of the USDA recommended daily caloric in-take for ages 8-11, depending on the child’s physical exertion (i.e. exercise) that day. When a
soda is added to the purchase,9 the average caloric intake rises to 480 calories and 24-31% of the daily recommendation. These measurements led to the finding that students who exer-cise less than 30 minutes per day (likely most students) may be overconsuming calories by 16% with one chips purchase and 27% with a purchase of chips and soda. The study also noted that many of these cal-ories are “empty,”10 leading to passive overconsumption caused by unrelieved feelings of hunger. With students often exceeding their daily intake needs by hundreds of calories, the purchase of high-calorie snacks and sugar-sweetened beverages from street vendors can be considered a negative factor towards a childhood obe-sity rate in South Los Angeles (29%) that is the highest in Los Angeles County. Snacks and beverages sold to students also commonly exceed recommend-ed serving sizes for sodium and sugar, and offer less dietary fiber than recommended.11
3 Child Trends Databank (2014). Overweight children and youth (http://www.childtrends.org/?indicators=overweight-children-and-youth). 4 Office of Health Assessment and Epidemiology, Department of Public Health, Los Angeles County (2013). Key Indicators of health by Service
Planning Area (http://publichealth.lacounty.gov/ha/docs/KIR_2013_FinalS.pdf). 5 Office of Health Assessment and Epidemiology, Department of Public Health, Los Angeles County (2010). Life Expectancy in Los Angeles
County: How long do we live and why?, table 1 (http://www.publichealth.lacounty.gov/epi/docs/Life%20Expectancy%20Final_web.pdf). 6 Branen L and Fletcher J (1999). Comparison of college students’ current eating habits and recollections of their childhood food practices. Journal
of Nutrition Education and Behavior; 31:304-310.7 Florence MD, Asbridge M, Veugelers PJ (2008). Diet quality and academic performance. Journal of School Health; 78(4):209-215.8 Wolstein, J and Goetz, K (2007). Street Vendors in Los Angeles: Promoting Healthy Eating in LA Communities. UCLA School of Public Affairs,
Lewis Center for Regional Policy Studies.9 61% of purchases included more than one item.10 Many chip and candy items purchased from street vendors have an energy density that is two or three times greater than the 1.5 kcal/g
threshold marking passive overconsumption.11 Borradaile KE, Sherman S, et al (2009). Snacking in children: The role of urban corner stores. Pediatrics; 124: 1293-1298, table 2
(http://dx.doi.org/10.1542/peds.2009-0964).
8 ︱ Page
Student Nutrition Environments in South Los Angeles
Increasing attention has been given to the issue of school nutrition in Los Angeles since the early 2000s. In response to pressures from parent groups and health advocates, the Los Angeles Unified School District has reformed policy and lunchroom programs in an effort to make school meals healthier, more accessible, and more presentable to students. These reforms are often works-in-progress, attracting continual scrutiny and revision.12 The process has been driven by a series of resolutions enacted by the Board of Education, including:
�� a Motion to Promote Healthy Beverage Sales (2002) prohib-iting the sale of sodas and other sugary drinks on campuses (in-cluding vending machines and student stores) during school hours
�� an Obesity Prevention Motion (2003) setting minimum nutri-tional standards above USDA requirements for low-nutrient snack foods sold on campuses
�� a Cafeteria Improvement Motion (2005) implementing mea-sures to improve the marketability of school food, reduce sodium and fat content and emphasize fruit and vegetable offerings
�� an Improving Food Nutrition Policy (2012) that called for mini-mum lunch periods and improved participation in school break- fast programs
�� a Good Food Procurement Policy (2012) that emphasizes local food sourcing, environmental sustainability, fair labor standards, animal welfare and nutrition when negotiating vendor contracts
12 Wheeler M. Love at First Bite? Not for LA School Kids and their Vegetables. UCLA Newsroom, 2014 May 22 (http://newsroom.ucla.edu/releases/love-at-first-bite).
13 Health Atlas for the City of Los Angeles (2013), figure 38.14 Misako A, Gilliland S, Vallianatos M, Gottlieb R (2010). Food Access, Availability and Affordability in three Los Angeles Communities, Project
CAFÉ, 2004-2006. Preventing Chronic Disease; 7 (http://www.cdc.gov/pcd/issues/2010/mar/08_0232.htm).15 Park A, Watson N, Galloway-Gilliam L (2008). South Los Angeles Healthy Equity Scorecard. Community Health Councils, Inc., figure 18. 16 US Census Bureau; 2010 Census, detailed tables; generated by Breanna Morrison; using American FactFinder; July 2, 2013.17 US Department of Agriculture and US Department of Health and Human Services (2010). Dietary Guidelines for Americans, 7.
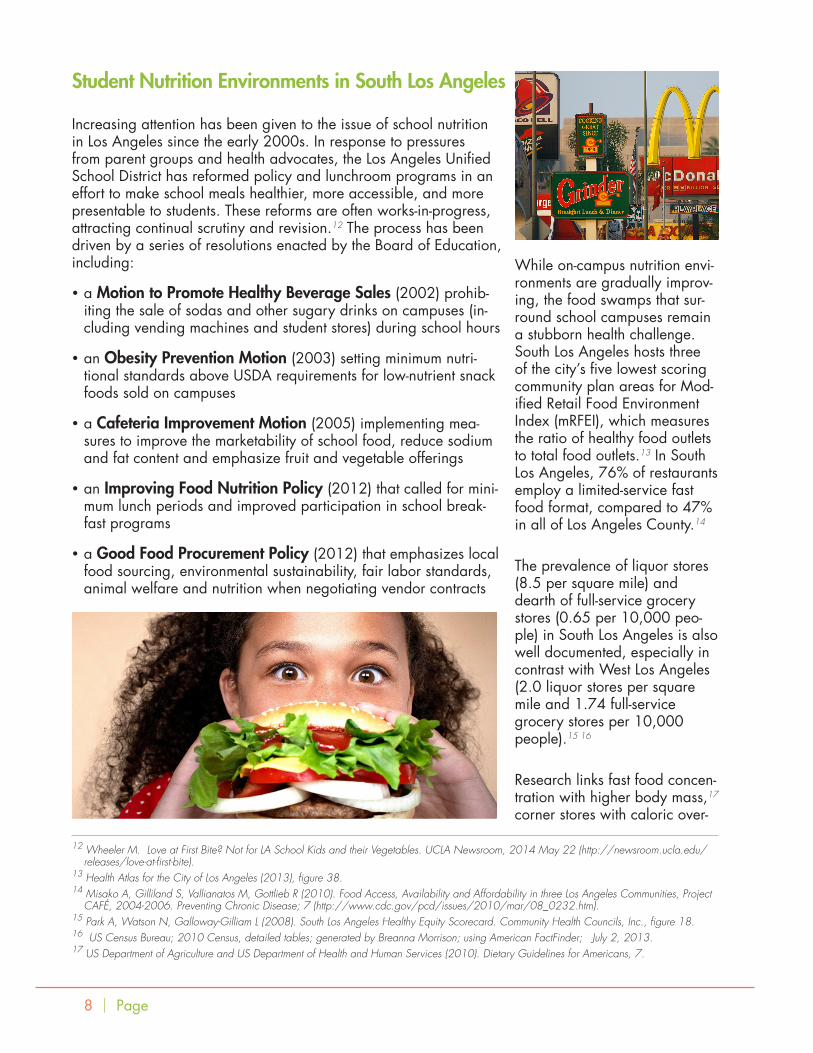
While on-campus nutrition envi-ronments are gradually improv-ing, the food swamps that sur-round school campuses remain a stubborn health challenge. South Los Angeles hosts three of the city’s five lowest scoring community plan areas for Mod-ified Retail Food Environment Index (mRFEI), which measures the ratio of healthy food outlets to total food outlets.13 In South Los Angeles, 76% of restaurants employ a limited-service fast food format, compared to 47% in all of Los Angeles County.14
The prevalence of liquor stores (8.5 per square mile) and dearth of full-service grocery stores (0.65 per 10,000 peo-ple) in South Los Angeles is also well documented, especially in contrast with West Los Angeles (2.0 liquor stores per square mile and 1.74 full-service grocery stores per 10,000 people).15 16
Research links fast food concen-tration with higher body mass,17 corner stores with caloric over-

Page ︱ 9
consumption,18 and grocery store proximity with improved eating behaviors.19 Also trou-bling is a demonstrated shift towards less healthy value-menu offerings within the fast food industry,20 which find more receptive audiences among young and low-income popu-lations.21 The eating behaviors of children and adolescents in South Los Angeles reflect their challenging environments. Their rates of fast food and sugar-sweetened beverage con-sumption are substantially high-er than the overall county, and their rates of fruit and vegetable consumption are the lowest.22
Awareness is growing that mobile food vendors (including sidewalk vendors and food trucks) are a functioning, if challenging to quantify, component of this wider food ecology. There is also a grow-ing awareness that student nu-trition advocacy must eventually pivot from campus-oriented interventions towards a wid-er consideration of resource environments in surrounding communities.23 24 Frustration regarding street vendors exists
among some school adminis-trators in South Los Angeles, with proactive administrators requesting help from authorities to enforce prohibitions against street vending near schools.25 As lunchroom operators and patrons (i.e. students) navi-gate a transition to a new and healthier menu, the possibility that students will negate this ef-fort by purchasing nutrient-poor snacks and sugary beverag-es is a clear contradiction to many. But street vendors are also contributors to defensible
space and sidewalk vitality by providing passive surveillance (“eyes on the street”) and shop-ping amenities. The benefits of safe and vibrant public spaces include increased physical activity (i.e. bicycling and walking), which has become a noted health priority in South Los Angeles.26 Furthermore, street vendors represent an opportunity to introduce healthi-er food (e.g. fresh fruit and vegetables) into communities where major retailers do not provide it.27
18 Borradaile KE, Sherman S, et al (2009). Snacking in children: The role of urban corner stores. Pediatrics; 124: 1293-1298 (http://dx.doi.org/10.1542/peds.2009-0964).
19 Chen SE, Florax RJGM, Snyder SD (2009). Obesity, Fast Food, and Grocery Stores: Evidence from Geo-referenced Micro Data. National Poverty Center Working Paper (http://www.npc.umich.edu/news/events/foodaccess/index.php)
20 Physicians Committee for Responsible Medicine (2008). Cheap Eats for Hard Times, A Report from PCRM’s Cancer Project (http://www.pcrm.org/health/reports/cheap-eats-for-hard-times-findings).
21 Schorr BC, Sanjur D, Erikson E (2002). Teenage Food Habits. Journal of the American Dietetic Association. (61): 415-419. 22 Office of Health Assessment and Epidemiology, Department of Public Health, Los Angeles County (2013). Key Indicators of health by Service
Planning Area (http://publichealth.lacounty.gov/ha/docs/KIR_2013_FinalS.pdf).23 Mieszkowski K (2013). Open-Campus Policy Eats Away at School Nutrition Effort. The Center for Investigative Reporting (http://cironline.org/
reports/open-campus-policy-eats-away-school-nutrition-effort-4475). 24 Mikkelsen L, Chehimi S (2007). The Links Between the Neighborhood Food Environment and Childhood Nutrition. Prevention Institute.25 The relationship is not always antagonistic. Vendors commonly have daily, amicable interactions with parents and school staff. 26 Community Health Councils (2013). South LA’s Guide to LA2B (http://org2.salsalabs.com/o/5382/t/10/blastContent.jsp?email_blast_
KEY=126184727 Fuchs ER, Holloway SM, Bayer K, Feathers A (2014). Innovative Partnership for Public Health: an Evaluation of the New York City Green Cart
Initiative to Expand Access to Healthy Produce in Low-Income Neighborhoods. Columbia University School of International and Public Affairs.
Source: US Census Bureau (2008-11), County Business Patterns (NAICS), 2010 Decennial Census
Figure 1 Food Resource Environment Comparison

10 ︱ Page
28 Los Angeles Municipal Code, section 42.00(b)29 Kettles GW, Formal Versus Informal Allocation of Land in a Commons: The Case of MacArthur Park Sidewalk Vendors, Southern California
Interdisciplinary Law Journal, 16.30 7:30 AM-4:30 PM on weekdays; Los Angeles Municipal Code, section 80.7331 Rosales, R (2013). Survival, Economic Mobility and Community among Los Angeles Fruit Vendors. Journal of Ethnic and Migration Studies.
39(5): 697-717.32 ibid33 Chief Legislative Analyst report (2014 November 26), City of Los Angeles. Council file 13-1493
(http://clkrep.lacity.org/onlinedocs/2013/13-1493_rpt_cla_11-26-14.pdf).
Street Vending Regulatory Environment
Sidewalk vending (including food sold from street carts) is currently prohibited on a city-wide basis in Los Angeles.28 It is the only major US city to prohibit the activity on such a comprehensive scale, rather than regulate it as legitimate commercial (and taxable) ac-tivity. There is a provision to enact sidewalk vending districts within the city, but only a single district in MacArthur Park has been created, having eventu-ally lapsed due to a lack of effectiveness.29 A separate or-dinance also prohibits vending on a more generalized basis (including sidewalk vendors and mobile food trucks) within 500 feet of school campuses during normal school hours.30 The latter regulation exists in numerous jurisdictions across the nation, though the specific distances and times vary, and often include other sensitive locations (e.g. libraries, parks). Vending is legal in city parks on a permit basis.
On a countywide basis, street food vendors are required to maintain a food service cart permit, which involves push-carts of a sufficient quality and
overnight storage in a commis-sary. This certification process subjects vendors to permit fees, warehousing fees, higher equip-ment costs, as well as periodic food handling inspections. While many street vendors take care to maintain hygiene and food safety, certain regulations designed for more conventional food preparers, such as running water and restroom access, can be difficult for street vendor compliance.31 Already lacking access to commercial vending rights in Los Angeles, some street vendors also choose to operate unpermitted carts or without carts.
Enforcing these regulations involves actions to either cite street vendors (by law enforce-ment agencies) or confiscate products and equipment (by public health officials), and are sometimes coordinated to involve both. Outcomes from these actions can be as mild as a warning to move on and as severe as an arrest and de-struction of property.32 Although sidewalk food vendors often incur crippling economic conse-quences from enforcement ac-tions, it is estimated that around 10,000 operate in Los Angeles on a particular day,33 many having rebounded from pre-vious fines and confiscations. With limited resources avail-able to enforce regulations,
these actions take place at ar-bitrary times and places (often driven by complaints from local merchants, property owners or school administrators) and, rather than discouraging illegal street vending, may actually be trapping people within the city’s shadow economy by eliminating the economic gains that would help them secure a foothold in more legitimized enterprises.
Street Vendor Legalization Campaign
Street vending offers more in-dependence and flexibility than other types of low-skill work, but it also represents a type of sur-vival economy for many people (particularly less-settled immi-grants) who struggle to access the formal employment sector or meet Los Angeles’ high cost-of-living demands. Seeking to re-lieve pressure on these informal

Page ︱ 11
sector workers and micro-entre-preneurs, dozens of communi-ty-based organizations34 have partnered on a campaign to highlight the legal challenges faced by street vendors and recognize their influence on Los Angeles’ emergent food culture, with the primary objective of le-galizing food vending on all or most sidewalks in the city. Do-ing so would likely necessitate the implementation of a new permitting structure by the city, though advocates have assert-ed that the details of new regu-latory processes can be formu-lated after the prohibitions have been repealed.35 The campaign has also supported the use of incentives to encourage vendors who sell healthy foods, the in-volvement of non-profit entities as a supportive infrastructure to street vendors, the formulation of mutually-beneficial partner-ships between street vendors and bricks-and-mortar business-es or farmers’ market operators,
and the incorporation of street vendors in land use planning exercises.
The framework that has been outlined so far would require permitted vendors to hold busi-ness tax registrations and liabil-ity insurance, in addition to the county’s existing food handling certifications, and would des-ignate stationary locations or specific roaming areas for each permit.36 School-proximal prohi-bitions of street vending (within 500 feet of campuses) would be maintained if it were to be legalized elsewhere.
The legislative process to con-sider the legalization of street vending was initiated in No-vember 2013 by a City Council motion37 referring the issue to its Economic Development committee and calling for the formulation of regulatory alter-natives (see appendix 4). The
committee received an initial report prepared by the Chief Legislative Analyst (CLA) in May 2014,38 which provided background on the city’s previ-ous experience with regulated vendor districts, a summary of enforcement actions, and a review of policies in other cities. Responding to calls for more details on potential al-ternatives, the CLA followed with an additional report in November 201439 describing a new vendor permit typolo-gy and roles for various city and county agencies involved in vendor certifications and oversight. While many coun-cilmembers have agreed that the current citywide prohibition of street vending is impractical and in need of at least a par-tial repeal, reservations about the details of a new regulatory structure has held the issue from moving to a full City Council hearing.
34 A list of partner organizations can be found at: http://streetvendorcampaign.blogspot.com/p/partners.html.35 Public comment provided by Maria Cabildo, East Los Angeles Community Corporation, at Los Angeles City Council (2014 December 2).36 Chief Legislative Analyst report (2014 November 26), City of Los Angeles. Council file 13-1493
(http://clkrep.lacity.org/onlinedocs/2013/13-1493_rpt_cla_11-26-14.pdf).37 Los Angeles City Council motion (2013 November 6). Council file 13-1493
(http://clkrep.lacity.org/onlinedocs/2013/13-1493_MOT_11-06-13.pdf)38 Chief Legislative Analyst report (2014 May 13), City of Los Angeles. Council file 13-1493
(http://clkrep.lacity.org/onlinedocs/2013/13-1493_rpt_cla_5-13-14.pdf).39 Chief Legislative Analyst report (2014 November 26), City of Los Angeles. Council file 13-1493
(http://clkrep.lacity.org/onlinedocs/2013/13-1493_rpt_cla_11-26-14.pdf).
Research Framework
The primary research objective of this HIA is to consider how proposed changes to street vendor regulations could affect student nutrition and health in
South Los Angeles. A compar-ison between the non-permis-sive regulatory environment in question and a more permis-sive regulatory environment in Compton is employed to mea-sure differences in street vendor presence , snack and beverage
consumption amongst students, and bicyclist/pedestrian pres-ence near selected schools. These jurisdictions have similar socioeconomic conditions (food retail environment, bicyclist/pedestrian safety, cultural char-acteristics, household income)
Section 3 Methods

12 ︱ Page
40 Not within 10 feet of vehicle realm; Not within 50 feet of another pushcart; not within 300 feet of school campuses on school days between 7 AM and 5 PM; not in residential areas between 6 PM standard/8 PM daylight and 8 AM (Compton Municipal Code, section 9-26).
41 The Street Vendor Project, Urban Justice Center (2011). Street Vendors Do Not Compete with Brick-and-Mortar Merchants (http://www.scribd.com/doc/58478966/Vendors-Do-Not-Compete-With-Brick-And-mortars).
that may influence street vendor activity, though Compton allows sidewalk vending at limited times and locations.40
Assessing multiple schools in each jurisdiction provides an (1) environmental perspective and (2) regulatory perspective to interpret the collected data. Results may indicate that certain socioeconomic factors correlate to higher or lower street vendor activity regardless of jurisdic-tion, suggesting an influence on the student nutrition environ-ment apart from vendor regu-lations. However, differences between the two jurisdictions that are consistent across socio-economic factors would suggest that vendor regulations do influence the student nutrition environment.
In developing this methodology, the steering committee identi-fied numerous environmental and behavior changes that have potential correlations to the legalization of sidewalk food vending. These include new vendor permit revenues that could potentially augment food handling enforcement efforts or fund school-based nutrition education programs, leading to improvements in food safety and student nutrition behaviors. Legitimized street vending could also lead to sta-bilized employment and income for student households and shifts in local sales tax revenue (derived from vendor sales and complimentary bricks-and-mor-
tar business41), which can be beneficial factors for household food security and the quality of city-funded recreation pro-grams and facilities. However, measuring the potential eco-nomic and health effects of these variables is highly challenging due to the time- and resource-inten-sive effort required and the speculative nature of future programmatic decisions and economic conditions.
This HIA considers three variables (see figure 2) that are closely related to street vendor activity and can be measured using field ob-servations and student sur-veys. The presence of street vendors in proximity to school campuses provides one measure of how nutri-ent-poor snacks and sug-ary beverages are made accessible to students, and how effectual vendor prohibi-tions are in regulating access. Snack and beverage offerings are also observed for any dis-tinction between more and less healthy vendors. Surveying student/caretaker purchases provides insight on nutrition behaviors in relation to street vendors and, by including other food retail points, assesses the role of street vendors within the wider food resource environ-ment. Street vendors have also been viewed as a safety haz-ard due to congested sidewalks and a perceived relationship to jaywalking, but also as positive influence on safety in the pub-
lic realm and traffic calming42 This question is addressed by recording bicyclist/pedestrian activity and sidewalk conditions near the same schools where vendor activity was observed.
School Comparisons
To construct the comparison between the non-permissive and permissive regulatory environ-ments in this HIA, a statistical analysis was first performed to quantify the socioeconomic factors related to street vending that are present in South Los Angeles and to identify jurisdic-tions that compare most similar-ly. Spanish-speaking population was used as one comparison point, based on references in local studies that connect street vending with the culture of Latin

Page ︱ 13
Figure 2 Street Vendor and Student Nutrition HIA Logic Model
42 Traffic calming refers to design elements or activities that cause the reduced travel speeds of vehicles.43 Rosales, R (2013). Survival, Economic Mobility and Community among Los Angeles Fruit Vendors. Journal of Ethnic and Migration Studies.
39(5): 697-717.44 Wolstein, J and Goetz, K (2007). Street Vendors in Los Angeles: Promoting Healthy Eating in LA Communities. UCLA School of Public Affairs,
Lewis Center for Regional Policy Studies.45 Census data was tabulated using Missouri Census Data Center online CAPS application (http://mcdc.missouri.edu/websas/caps10acsb.html).46 Applicable schools are 42nd Street ES, 59th Street ES, 61st Street ES, 74th Street ES, Angeles Mesa ES, Hillcrest ES, La Salle Avenue ES,
Manchester Avenue ES, Manhattan Place ES, Normandie Avenues ES, Raymond Avenue ES, Western Avenue ES, Audubon MS, Mann MS, Obama Global Prep, Crenshaw HS, Fremont HS. Washington HS was included in the REACH scope of work, but was excluded from the HIA demographic comparison because it is located in a different regulatory environment (unincorporated Athens-Westmont).
American immigrants.43 44 In this case, language was preferred as a correlation to street vend-ing, rather than Hispanic/Latino population or foreign-born pop-ulation, as Latino communities in metropolitan Los Angeles can vary significantly in their immigrant composition, and not every immigrant community in the metropolitan area has prom-inent Latin American influences. Another comparison point was population living under the poverty level, which relates to the prevailing view that street vending is a fallback enterprise for many people that struggle to generate sufficient incomes within the formal economy.
For South Los Angeles, census block data aggregated within
½-mile circular area profiles (CAPS)45 was applied at the location of each school in-cluded in the REACH scope of work,46 resulting in a median percentage of Spanish speakers of 46.8% and a median per-centage of household incomes under the Federal Poverty Level of 26.8%. For comparison, the equivalent census data was gathered for dozens of juris-dictions near Los Angeles that were found to have regulations concerning street vending (table 1). According to the data, some communities had similar socioeconomic condi-tions, but offered less compari-son environments due to narrow restrictions on street vendor activity. Other jurisdictions pro-vided a more permissive regula-
tory environment for street vend-ing, but did not provide socio-economic conditions that were very similar. Ultimately, three jurisdictions (Bell Gardens, Compton and Hawaiian Gar-dens) were chosen for deeper analysis based on poverty rates that were above 20%, Span-ish-speaking populations that were at least as high as South Los Angeles, and the existence of more permissive vendor regulations.
There remains significant socio-economic variety within the co-hort of REACH schools, as well as schools in comparison juris-dictions. The statistical analysis was, therefore, extended to the level of specific schools in order to identify the closest matches for specific environmental vari-ables. The ½-mile CAPS aggre-gations were applied to schools in the three comparison jurisdic-tions to generate census data. For clarification, the CAPS aggregations reflect socioeco-nomic characteristics of resi-dents living in proximity of the applicable school campus, not students attending that school or their households. Modified Retail Food Environment Index (mRFEI) scores were collected for the applicable census tract of each school in the analy-sis, utilizing 2011 data made available by the Centers for Disease Control and Prevention

14 ︱ Page
Jurisdiction Regulatory Status Spanish-Speaking Population (%)
Population < Poverty Level (%)
REACH schools (median) Prohibited 46.8 26.8
Bell Gardens Permitted 92.4 25.0
Compton Permitted 61.3 24.9
Hawaiian Gardens Permitted 67.4 21.8
Huntington Park Highly Restricted47 93.2 25.5
Inglewood Highly Restricted48 45.8 21.0
South Gate Highly Restricted49 87.9 19.6
Santa Monica Permitted 9.1 10.7
Culver City Permitted 19.9 7.3
Table 1 Socioeconomic and Street Vending Regulatory Conditions of Comparative Jurisdictions
47 Vendors are limited to 10 minutes of activity in one location (Huntington Park Municipal Code, section 4-7.1612). 48 Vending is prohibited outside any place of public assemblage (Inglewood Municipal Code, section 5-18.2).49 Sidewalk vending only permitted in commercial zones (South Gate Municipal Code, section 5.10.010).50 Modified Retail Food Environment Index (mRFEI) data is accessible at: http://www.cdc.gov/obesity/resources/reports.html. 51 Safe Transportation Research and Education Center (SafeTREC), Transportation Injury Mapping System (TIMS), Safe Routes to School (SRTS)
collision map viewer (2007-09), accessed November 2013.52 Wolstein, J and Goetz, K (2007). Street Vendors in Los Angeles: Promoting Healthy Eating in LA Communities. UCLA School of Public Affairs,
Lewis Center for Regional Policy Studies.53 A portion of the observation for Elementary S3 was delayed two weeks due to unanticipated staffing constraints.
Source: Missouri Census Data Center, Circular Area Profiles (CAPS), ACS version (2007-11); US Census Bureau (2007-11), American Community Survey (ACS)
(CDC).50 The aggregate num-ber of bicyclist and pedestrian collisions within ½-mile of each school for 2007-09 was also collected using the Safe Routes to School mapping tool.51
At the level of schools, Comp-ton emerged as the ideal com-parison environment because it was the only jurisdiction to offer close matches to REACH schools for each of the environ-mental variables. An elementa-ry school from the former was then matched with a compari-son school from the latter based on close similarities for one of the following variables: Span-ish-speaking population, pover-
ty, retail food environment, and bicyclist/pedestrian safety. Mid-dle schools and high schools were also matched when close similarities for a variable were present. In every match, student age ranges were made as com-parable as possible, because the ability to make purchase choices varies considerably based on the age students.
Field Observations
The most feasible method for gathering primary data on vendor-related activity was to deploy field assessors that observed environments near
schools during afternoon hours. The 14 schools selected for the assessment (see table 2) were observed in March-April 2014, each for a 60-minute period beginning at the closing bell, which prior studies documented as the time when street vendors make the majority of their sales near schools.52 To approxi-mate the most average day for student-vendor interactions, observations only took place on midweek days (Tuesday-Thurs-day) and days with irregular bell schedules were avoided. In most cases, observations for matching schools (based on environmental criteria detailed above) took place on the same

Page ︱ 15
54 Data is representative of general population and environment within ½-mile vicinity of school campus.
South Los Angeles Criteria Match Compton
Elementary S1 58.2 %Spanish-speaking population
59.4 % Elementary C1
Middle S1 47.2 % 49.3 % Middle C1
Elementary S2 22.9 % population < poverty level 22.5 % Elementary C2
Elementary S3 10mRFEI score
10 Elementary C3
Middle S3 8 10 Middle C3
Elementary S4 11 bicyclist/pedestrian collisions (2007-09) 11 Elementary C4
High S5 9-12 grade level 9-12 High C5
Table 2 School Comparison Matches Based on Environmental Criteria54
source: Missouri Census Data Center, Circular Area Profiles (CAPS), ACS version (2007-11); Centers for Disease Control & Prevention, Children’s Food Environment State Indicator Report (2011); Safe Transportation Research and Education Center (SafeTREC), Transportation Injury Mapping System (TIMS), Safe Routes to School (SRTS) collision map viewer (2007-09), accessed November 2013
day or on consecutive days,53 so that conditions between the comparison schools would be most similar. Significant weather differences (i.e. rain) between comparison schools would have warranted resched-uled observations, but none were necessary.
Preliminary observations of the 14 school environments helped to identify anticipated pedestri-an pathways for students and caretakers leaving campuses and the likeliest locations of street vendors. During each observation period, a Span-ish-speaking assessor walked the periphery of the school cam-pus and adjacent streets within a 2-block radius to record any street food vendors that were present. When encountering vendors, the assessor com-municated their purpose and requested permission to briefly note the inventory of snacks and beverages available. Two to four additional assessors were placed at key observa-
tion points as needed to tally the number of pedestrians and bicyclists present during the ob-servation period. Assessors car-ried information sheets about the HIA to give to people in the field who inquired about their activity.
During each observation peri-od, field assessors completed an observation grid containing information specific to their task. Vendor observers noted the general content of snacks and beverages offered by each street vendor, the location (in relation to school gates) and travel method (pushed/carried or pedaled) of each vendor, and how congested sidewalks were near vendors. Products available for purchase were grouped into seven categories (see appendix 1): unhealthy snack food (e.g. chips, cook-ies, candy, ice cream, elote), fruits and vegetables, hot/prepared foods (e.g. tamales), other foods, sugar-sweetened beverages (e.g. soda, fruit
punch, sports drink, energy drink, aguas frescas), healthy beverages (e.g. 100% fruit juice, water) and other bever-ages. Though not a focus of the study, ice cream trucks and food trucks operating within the observation area were also tallied, so that any correlation with higher/lower street vendor activity might be assessed. The peripheral observers noted four types of circulation at their spe-cific location (see appendix 1): student pedestrians, adult pe-destrians, student bicyclists, and adult bicyclists. Vehicle traffic conditions were also noted, in order to asses any possible cor-relation between vendor activity and road congestion.
A training session took place before the observations to pre-pare assessors from the Univer-sity of Southern California and the CHC Community Research-er Development and Training (CReDT) program for the study protocols and anticipated inter-actions that could occur in the

16 ︱ Page
field. Particular instruction was given on the sometimes unclear distinction between sidewalk food vendors and other types of street and mobile vendors (e.g. food trucks, toy vendors, appar-el vendors), and recognition of the variety of conveyances that street vendors utilize.
Student Surveys
Conducting in-school surveys of students was a preferable method for gathering primary data on nutrition behaviors, for a number of reasons. It was more efficient than tracking snack and beverage purchases from street vendors at the point-of-sale, which could allow for higher accuracy, but would also require much more observer staffing and coordination with vendors willing to be observed. Surveys also allowed for the collection of other information useful to this assessment, includ-ing purchases from a broader range of access points not limit-ed to street vendors, frequency of school meal participation, and motivating factors for street vendor purchases.
The surveys were administered in October-December 2014, at the four elementary schools in South Los Angeles where field observation had occurred previously. CHC was not able to coordinate with Compton Unified School District person-nel to administer surveys at the comparison schools included in this assessment, so findings on student nutrition behaviors are necessarily limited to data col-lected in South Los Angeles. Be-cause data from field observa-tion showed negligible vendor presence at middle schools and high schools, these were also left out of the survey portion of the assessment.
Survey questions related to this HIA were included in a larger survey form that includ-ed questions about exercise and nutrition pertinent to other REACH objectives (see ap-pendix 2). Students indicated the general frequency (never/often/sometimes) for which they obtained snacks from eight types of access points that are known to commonly exist within the wider nutrition environment (vending machines, school store, sidewalk vendor, food trucks, corner store, fast food restaurant, from home, from someone else). They indicated the general frequency for how often they obtained items from sidewalk vendors from five cat-egories: unhealthy snack food (e.g. chips, cookies, candy, ice cream, elote), fruits and vegeta-bles, hot/prepared foods (e.g. tamales, sandwiches, other homemade food), sugar-sweet-ened beverages (e.g. soda, sports drink, fruit punch, hot chocolate, other sweet drinks),
and water or natural fruit juice. Students also indicated whether convenience, price or selection influenced their decisions to obtain snack/beverage items from sidewalk vendors. To as-sess any possible correlation between off-campus snack/bev-erage consumption and school nutrition programs, students indicated how often per week they ate lunch or snacks pro-vided at school. Regarding the assessment’s bicyclist/pedestri-an considerations, students indi-cated their most common trans-portation methods for getting to school, how safe they felt riding a bicycle in the street, and how safe they felt walking across a street or driveway.
School personnel helped to identify the classrooms and times when surveys would be completed, and respondents were 4th- and 5th-grade stu-dents whose identities remained anonymous. Students received passive consent forms in ad-vance of the survey period, which caretakers could return signed if they wished for their student not to participate. During the survey period, stu-dents completed the survey form at their desk, with instruc-tions given by REACH staff from the front of the classroom. Survey administrators were pre-pared to give clarification and guidance to students wherever questions were difficult to interpret.

Page ︱ 17
Section 4 ResultsStreet Vendor Presence Near Schools
Primary data collected from field observations in this HIA do not indicate that regulatory factors correlate to differences in the presence of sidewalk food vendors near schools. Of the eight elementary schools as-sessed , the highest and lowest vendor presence was observed near schools in South Los An-geles (see table 3), the more prohibitive environment. Each elementary school in Compton, the less prohibitive environment, had some vendor presence during observation periods, but was neither the highest nor the lowest. When the analysis is narrowed to only matched schools for each socioeconomic factor (see table 4), substantive differences in vendor presence are apparent, but these differ-ences do not lean towards one jurisdiction more than the other.
No vendors were observed near the two high schools in this assessment, and only two vendors were observed near the four middle schools as-sessed. Considering the gener-ally higher degree of mobility and purchasing independence available to older students, this may point to a market niche for street vendors that diminishes as students move through higher grades. Comparisons between the various school levels is, therefore, less warranted and narrows the focus of the analy-sis to only elementary schools.
School City ObservedVendors
Students Per Vendor55
Elementary S1 LA 8 104
Elementary S3 LA 6 126
Elementary C1 C 4 136
Elementary C4 C 3 211
Elementary C2 C 2 202
Elementary C3 C 1 466
Elementary S2 LA 0 -
Elementary S4 LA 0 -
Middle S1 LA 1 454
Middle C1 C 1 518
Middle S3 LA 0 -
Middle C3 C 0 -
High S5 LA 0 -
High C5 C 0 -
Criteria Match South Los Angeles
Observed Vendors Compton
Spanish-speaking population Elementary S1 8 4 Elementary C1
population < poverty level Elementary S2 0 2 Elementary C2
mRFEI score Elementary S3 6 1 Elementary C3
bicycle/pedestrian collisions Elementary S4 0 3 Elementary C4
Table 3 Observed Sidewalk Food Vendors Near Schools
Table 4 Observed Sidewalk Food Vendors By Environmental Criteria Matches
Source: HIA field assessments; California Department of Education, DataQuest (2013-14)
Source: HIA field assessments
55 Calculated based on 2013-14 enrollment statistics (available at http://dq.cde.ca.gov/dataquest/).

18 ︱ Page
Analyzing primary vendor data with socioeconomic factors give some indication that poverty and language are two environ-mental characteristics that may influence the presence of street vendors near schools (see table 5). Elementary S1 and Elemen-tary S3 had both the highest household poverty rates in their vicinity (31.5-32.1%) and the highest vendor presence (6-8) when observed. The remaining six elementary schools, in com-parison, had local household poverty rates of 22.5-26.8% and 0-4 vendors present. Ele-mentary S2 and Elementary S4 had the lowest Spanish-speak-ing populations in their vicinity (42.6-46.8%) and were also the only schools where no ven-dors were observed during field assessments. The other elemen-
tary schools, in comparison, had Spanish-speaking popula-tions of 54.2-74.6% and 1-8 vendors present. Vendor pres-ence had a strong correlation coefficient with poverty (0.78) and a moderate correlation with language (0.37). Howev-er, survey responses by students indicate that Elementary S2 (which has the lowest poverty rate and Spanish-speaking population amongst South LA schools) may encounter a high-er typical street vendor pres-ence than what was observed in this assessment, due to rates of vendor purchases that are quite similar to those at Elemen-tary S3 (see tables 7-8).
Relationships were less ap-parent between street vendors and retail food environment
or bicyclist/pedestrian safe-ty. It could be expected that underdeveloped food retail environments might correlate to higher street vendor activity, but schools in this assessment with the highest local mRFEI scores (Elementary C2 and Elementary C4) had only moderate vendor presence (2-3 observed), while schools with the lowest local mRFEI scores (Elementary S4 and Elementary S1) had highly differentiated vendor presence (0-8 observed). Another ex-pectation could be that higher vendor presence leads to safer or less safe bicyclist/pedestrian environments, but schools with the lowest local collision rates (Elementary C2 and Elementa-ry C1) had moderate vendor presence (2-4 observed), and schools with the highest local
56 Measures the statistical relationship or dependence between observed vendors and the environment variable.
School City Observed Vendors
Spanish-Speaking (%)
Population < Poverty (%)
Mrfei Score
Bike/Ped Collisions
Elementary S1 LA 8 58.2 32.1 2 24
Elementary S3 LA 6 58.8 31.5 10 12
Elementary C1 C 4 59.4 23.9 13 3
Elementary C4 C 3 74.6 25.0 19 11
Elementary C2 C 2 54.2 22.5 29 1
Elementary C3 C 1 65.1 24.4 10 4
Elementary S2 LA 0 42.6 22.9 7 13
Elementary S4 LA 0 46.8 26.8 0 11
Vendor Presence Correlation56 0.37 0.78 -0.09 0.53
Table 5 Observed Sidewalk Food Vendors Near Schools and Environmental Conditions Within ½-Mile Vicinity
Source: HIA field assessments and student surveys; Missouri Census Data Center, Circular Area Profiles (CAPS), ACS version (2007-11); Centers for Disease Control & Prevention, Children’s Food Environment State Indicator Report (2011); Safe Transportation Research and Education Center (SafeTREC), Transportation Injury Mapping System (TIMS), Safe Routes to School (SRTS) collision map viewer (2007-09), accessed November 2013

Page ︱ 19
collision rates (Elementary S1 and Elementary S2) had highly differentiated vendor presence (0-8 observed). Vendor pres-ence had a moderate positive correlation with bicyclist/pedes-trian safety (0.53) and a weak negative correlation with retail food environment (-0.09).
The presence of mobile food trucks near the assessed schools showed one clear difference between the two jurisdictions. Ice cream trucks that sold sim-ilar snack and beverage items (i.e. chips, soda, candy) as street vendors were present in the vicinity of every elementary school assessed in South Los Angeles, but were not present at any schools in Compton (see table 6). While it is prohibited for these vehicles to conduct vending operations in proximity of schools in either jurisdiction, it is possible that more recent or consistent enforcement could have discouraged the activity in Compton. Though it appears that the presence of mobile food trucks may have influ-enced the product offerings of sidewalk vendors (explained in the following section), it did not correlate to a higher or lower presence near schools. Elemen-tary S3 and Elementary S2 had the highest presence of mobile food trucks (2-3 observed), but had a highly differentiated sidewalk vendor presence (0-6 observed).
In both jurisdictions, vendors were about four times more
Table 6 Observed Sidewalk Vendors And Mobile Food Trucks Near Schools
Source: HIA field assessments
School City SidewalkVendors
MobileFood Trucks
Elementary S1 LA 8 1
Elementary S3 LA 6 3
Elementary C1 C 4 0
Elementary C4 C 3 0
Elementary C2 C 2 0
Elementary C3 C 1 0
Elementary S2 LA 0 2
Elementary S4 LA 0 1
likely to utilize a pushcart or handheld container (9-12 ob-served) in their operations, com-pared to a pedaled cart (2-3 observed). Nearly all sidewalk vendors observed in field as-sessments were located directly adjacent to or across the street from school gates (see appendix 3).
Student Nutrition Behaviors in Relation to Street Vending
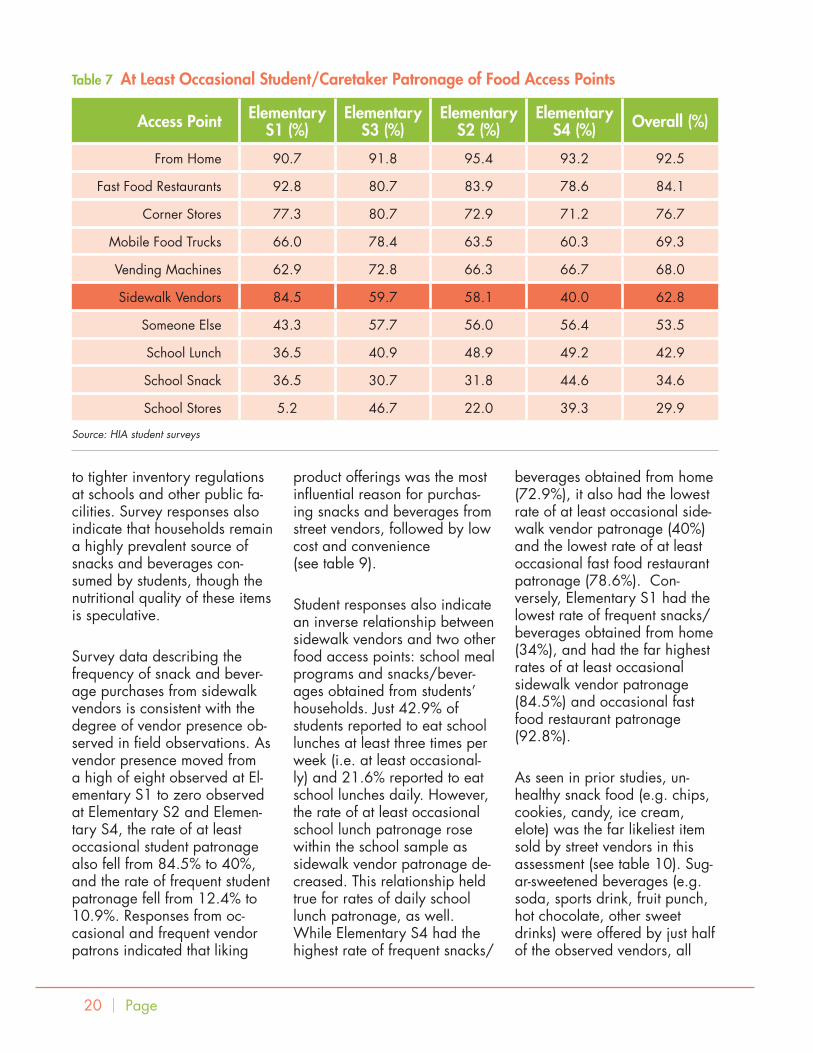
Survey responses indicate that 62.8% of students at least occa-sionally obtain snacks and bev-erages from sidewalk vendors, and 11.9% of students frequent-ly do so. While these rates rep-resent a significant patronage between students/caretakers and sidewalk vendors, it is not
among the most utilized food access points within the wider nutrition environment (see tables 7-8). By comparison, 84.1% of students patronize fast food restaurants at least occasionally and 25.4% do so frequently, while 76.7% patronize corner stores at least occasionally and 21.5% do so frequently. These are two access points that are routinely highlighted as a source of high-calorie food and sugary beverages in underdeveloped food retail environments.57 58 Though snack and beverage purchasing trends vary somewhat between schools, sidewalk vendors ap-pear to compete for student/caretaker patronage on relative-ly close terms with mobile food trucks, which offer many of the same items, and with vending machines, which are healthier food sources in some cases due
57 Bassford N, Galloway-Gilliam L, Flynn G, Morrison BN (2012). Fast Food Restaurant Report: Promoting Healthy Dining in South Los Angeles. Community Health Councils, Inc.
58 Borradaile KE, Sherman S, et al (2009). Snacking in children: The role of urban corner stores. Pediatrics; 124: 1293-1298 (http://dx.doi.org/10.1542/peds.2009-0964).
20 ︱ Page
to tighter inventory regulations at schools and other public fa-cilities. Survey responses also indicate that households remain a highly prevalent source of snacks and beverages con-sumed by students, though the nutritional quality of these items is speculative.
Survey data describing the frequency of snack and bever-age purchases from sidewalk vendors is consistent with the degree of vendor presence ob-served in field observations. As vendor presence moved from a high of eight observed at El-ementary S1 to zero observed at Elementary S2 and Elemen-tary S4, the rate of at least occasional student patronage also fell from 84.5% to 40%, and the rate of frequent student patronage fell from 12.4% to 10.9%. Responses from oc-casional and frequent vendor patrons indicated that liking
product offerings was the most influential reason for purchas-ing snacks and beverages from street vendors, followed by low cost and convenience (see table 9).
Student responses also indicate an inverse relationship between sidewalk vendors and two other food access points: school meal programs and snacks/bever-ages obtained from students’ households. Just 42.9% of students reported to eat school lunches at least three times per week (i.e. at least occasional-ly) and 21.6% reported to eat school lunches daily. However, the rate of at least occasional school lunch patronage rose within the school sample as sidewalk vendor patronage de-creased. This relationship held true for rates of daily school lunch patronage, as well. While Elementary S4 had the highest rate of frequent snacks/
beverages obtained from home (72.9%), it also had the lowest rate of at least occasional side-walk vendor patronage (40%) and the lowest rate of at least occasional fast food restaurant patronage (78.6%). Con-versely, Elementary S1 had the lowest rate of frequent snacks/beverages obtained from home (34%), and had the far highest rates of at least occasional sidewalk vendor patronage (84.5%) and occasional fast food restaurant patronage (92.8%).
As seen in prior studies, un-healthy snack food (e.g. chips, cookies, candy, ice cream, elote) was the far likeliest item sold by street vendors in this assessment (see table 10). Sug-ar-sweetened beverages (e.g. soda, sports drink, fruit punch, hot chocolate, other sweet drinks) were offered by just half of the observed vendors, all
Table 7 At Least Occasional Student/Caretaker Patronage of Food Access Points
Source: HIA student surveys
Access Point Elementary S1 (%)
Elementary S3 (%)
Elementary S2 (%)
Elementary S4 (%) Overall (%)
From Home 90.7 91.8 95.4 93.2 92.5
Fast Food Restaurants 92.8 80.7 83.9 78.6 84.1
Corner Stores 77.3 80.7 72.9 71.2 76.7
Mobile Food Trucks 66.0 78.4 63.5 60.3 69.3
Vending Machines 62.9 72.8 66.3 66.7 68.0
Sidewalk Vendors 84.5 59.7 58.1 40.0 62.8
Someone Else 43.3 57.7 56.0 56.4 53.5
School Lunch 36.5 40.9 48.9 49.2 42.9
School Snack 36.5 30.7 31.8 44.6 34.6
School Stores 5.2 46.7 22.0 39.3 29.9

Page ︱ 21
Table 8 Frequent Student/Caretaker Patronage of Food Access Points
Table 9 Student Motivations for Snack And Beverages Purchases From Sidewalk Vendors59
Source: HIA student surveys
Source: HIA student survey (limited to responses indicating occasional or frequent sidewalk vendor purchases)
59 Survey respondents could select none or multiple answers that applied.
Access Point Elementary S1 (%)
Elementary S3 (%)
Elementary S2 (%)
Elementary S4 (%) Overall (%)
From Home 34.0 55.5 70.1 72.9 56.0
Fast Food Restaurants 36.1 18.7 21.8 30.4 25.4
School Lunch 12.5 24.0 22.7 27.7 21.6
Corner Stores 17.5 18.7 23.5 32.2 21.5
School Snack 15.6 15.0 15.9 23.1 16.7
Mobile Food Trucks 21.6 9.5 10.6 12.1 13.1
Sidewalk Vendors 12.4 12.1 11.6 10.9 11.9
Vending Machines 5.2 6.6 8.1 7.4 6.7
Someone Else 2.1 4.0 3.6 20.0 5.7
School Stores 1.0 4.7 3.7 3.6 3.4
they sell what I like 85.9 %
it’s quick and easy 63.9 %
it’s cheaper 53.9 %
but two of which were found in South Los Angeles. Hot/pre-pared foods (e.g. tamales) and healthy beverages (e.g. 100% fruit juice, water) were only of-fered by vendors at one school (Elementary S3). A possible explanation for the broader product offerings in South Los Angeles is that competition from mobile food trucks encouraged the sale of more specialty or made-to-order items, such as raspados (flavored ice drinks) or homemade tamales, by street vendors. Despite the popularity of fruteros throughout the city, fruits or vegetables were not of-fered by vendors at any schools observed in this assessment.
These product offerings ob-served during field assessments provide a somewhat contra-dictory view of the snack and beverage consumption sourced
from street vendors, when com-pared with information provid-ed by students. As expected, survey responses indicated that unhealthy snack food was purchased at least sometimes by 92.3% of occasional vendor patrons, and purchased often by 60.9% of frequent vendor patrons (see table 11). Howev-er, each of the above product categories was purchased at least sometimes by 72.8% of occasional vendor patrons, and purchased often by 39.1-56.5% of frequent vendor patrons, in-cluding such products as fruits/vegetables and hot/prepared foods, which were rarely or never observed during field assessments. It is possible that a lack of question clarity or re-call difficulty may have skewed survey response data towards a less accurate depiction of snack and beverage purchases from street vendors.
Bicyclist/Pedestrian Presence in Relation to Street Vending
Field assessments indicated that half of the street vendors observed near schools caused

22 ︱ Page
Item South LA Compton Total
Vendors Present 15 11 26
Unhealthy Snack Food 13 11 24
Fruits And Vegetables 0 0 0
Hot/Prepared Foods 3 0 3
Sugar-Sweetened Beverages 11 2 13
Healthy Beverages 3 0 3
ItemOccasional Vendor Patrons Frequent Vendor Patrons
Purchased =/>Sometimes (%)
Purchased Often (%)
Purchased =/>Sometimes (%)
Purchased Often (%)
Unhealthy Snack Food 92.3 12.4 97.8 60.9
Fruits And Vegetables 72.8 25.6 75.6 40.0
Hot/Prepared Foods 77.3 17.5 84.8 39.1
Sugar-Sweetened Beverages 81.3 18.8 84.8 41.3
Healthy Beverages 85.3 38.7 87.0 56.5
Table 10 Observed Sidewalk Vendor Inventories
Table 11 Reported Snack and Beverage Purchase Frequency By Item Category
Source: HIA field assessments
Source: HIA student survey (Limited to responses indicating occasional or frequent sidewalk vendor purchases)
sidewalk congestion amongst pedestrians (due to the crowding of waiting customers) and that sidewalk congestion was not present near the rest of vendors (see table 12). This rate of congestion was true in both South Los Angeles and Compton. In no instance did observers note that vendor-related congestion caused pedestrians to walk into the street or otherwise come into conflict with vehicles. A range of vehicle traffic conditions (light to heavy) were noted on streets where vendors operated, but no relationship to a high or low presence of street vendors was apparent.
Survey responses by students indicated that cars (49.7-77.3% of respondents) were the most common travel method to/from ele-mentary schools in South Los Angeles (see table 13), with walking as the primary alternative (43.3-51.1%). Bicycling (2.1-12.1%), school busses (0-7.6%) and Metro rail/bus services (0-6.1%) were far less common travel methods. This data provides a somewhat more balanced view of student travel than what field assessments of pedestrian and bicycle activity near schools depicted. Obser-vations indicated that a range of 22-82.5% of students at each
elementary school walked home and 0-11 students bicy-cled home at the conclusion of the school day (see table 14). During each observation peri-od, 38-271 adult pedestrians (the majority of whom accom-panied exiting students) and 1-9 adult bicyclists were noted in the vicinity of school campus-es. Approximately 62.2% of elementary school students in Compton walked home, com-pared to only 39% in South Los Angeles. Despite these differ-ences, schools with higher street vendor presence in either juris-diction were not likelier to have more or less pedestrians or bicyclists active in their vicinity. Schools with the lowest student pedestrian rates (Elementary S4 and Elementary S3) had highly differentiated vendor presence (0-6 observed), while schools with no vendor presence (El-ementary S4 and Elementary S2) had highly differentiated student pedestrian rates (22-82.5% of school enrollment). Schools with moderate vendor presence (Elementary C4 and Elementary C1) had highly differentiated student bicyclist rates (0-11 observed). Vendor

Page ︱ 23
60 Light: occasional cards passing, moderate: consistent vehicle flow with a number of cards on the road, heavy: frequent slowing due to vehicle congestion
Table 12 Observed Sidewalk Congestion and Vehicle Traffic Conditions in Relation to Street Vendors
Source: HIA field assessments
School City SidewalkVendors
Sidewalk Congestion Vehicle Traffic Conditions(At Peak)60
No Obstruction Obstruction Spillover
Into Street
Elementary S1 LA 8 ••• ••••• Heavy
Elementary S3 LA 6 •••• •• Heavy
Elementary C1 C 4 •• •• Moderate
Elementary C4 C 3 • •• Moderate
Elementary C2 C 2 • • Heavy
Elementary C3 C 1 • Light
Elementary S2 LA 0 Heavy
Elementary S4 LA 0 Light
Middle S1 LA 1 • Heavy
Middle C1 C 1 • Moderate
Middle S3 LA 0 Moderate
Middle C3 C 0 Heavy
Total 26 13 13 0
presence had a moderate negative correlation coefficient with student pedestrians (-0.46) and adult bicyclists (-0.39), but a weak correlation with adult pedestrians (0.09) and student bicyclists (-0.04).
In response to survey questions regarding safety (see table 15), most students in South Los Angeles indicated that they felt somewhat safe crossing a street or driveway (52.8% of re-spondents) and somewhat safe riding a bicycle in the street (54.2%). Similar proportions of
students felt very safe crossing a street or driveway (26.6%) as felt unsafe (20.7%), though they were more likely to indicate feeling unsafe riding a bicycle in the street (30.1%) than very safe (15.7%). Differences be-tween schools regarding these safety perceptions showed no correlation with differences in street vendor presence. Howev-er, reported street vendor pa-tronage by students does show a correlation with pedestrian safety perceptions. Elementary S4 was the only elementary school in South Los Angeles
where fewer than half the students at least occasionally obtained snacks and beverages from sidewalk vendors, and it was also the only school more students felt unsafe (23.1%) crossing a street or driveway than felt very safe (15.4%). Conversely, other elementary schools in South Los Angeles had vendor patronage rates of 58.1-84.5% and more students that felt very safe (23.5-30.3%) crossing a street or driveway than felt unsafe (16.7-23.5%).

24 ︱ Page
School City Sidewalk Vendors
Pedestrians Bicyclists
Students (%) Adults Students Adults
Elementary S1 LA 8 35.7 156 2 1
Elementary S3 LA 6 27.5 122 4 1
Elementary C1 C 4 40.0 100 0 4
Elementary C4 C 3 73.9 271 11 9
Elementary C2 C 2 52.7 62 1 2
Elementary C3 C 1 80.3 216 0 1
Elementary S2 LA 0 82.5 165 6 8
Elementary S4 LA 0 22.0 38 2 3
Vendor Presence Correlation61 -0.46 0.09 -0.04 -0.39
Table 13 Reported Student Travel Methods To/From School
Table 14 Bicyclists/Pedestrians and Sidewalk Vendors Observed Near Schools
Source: HIA student surveys
Source: HIA field assessments
61 Measures the statistical relationship or dependence between sidewalk vendors and bicyclist/pedestrian presence.
Travel Method Elementary S1 (%) Elementary S3 (%) Elementary S2 (%) Elementary S4 (%)
Car 57.7 49.7 61.4 77.3
Walking 45.4 43.3 51.1 47.0
Bicycling 2.1 5.7 3.4 12.1
Metro - 5.1 2.3 6.1
School Bus - 1.3 1.1 7.6
School Sidewalk Vendors
=/> Occasional Purchases
(%)
Crossing Street /Driveway Riding Bicycle in Street
Unsafe (%)
Some-what
Safe (%)
Very Safe (%)
Unsafe (%)
Some-what
Safe (%)
Very Safe (%)
Elementary S1 8 84.5 17.6 58.8 23.5 40.0 46.7 13.3
Elementary S3 6 59.7 23.5 45.4 31.1 24.7 56.2 19.2
Elementary S2 0 58.1 16.7 53.0 30.3 28.0 48.0 24.0
Elementary S4 0 40.0 23.1 61.5 15.4 35.8 56.6 7.5
Overall 20.7 52.8 26.6 30.1 54.2 15.7
Table 15 Student Bicycle/Pedestrian Safety Perceptions by Vendor Presence and Purchase Frequency
Source: HIA field assessments and student surveys

Page ︱ 25
Limitations
This HIA utilizes available resources to measure differences between contrasting regulatory environments on the activity of sidewalk food vendors, and to consider relationships between student nutrition behaviors, food resource environments and other socioeconomic factors using available data. Future studies can improve the understanding of street vending as a commercial activity and component of the environment with access to a broader school and student sample and more detailed transaction data.
Schools were included in the assessment with the purpose of creating a diverse sample of off-campus environments found in two jurisdictions. However, single observation periods of four elementary schools provide a small picture of the vendor transactions that occur in each community. Differences in vendor activity and nutrition behaviors between schools can be random and hard to rationalize, and may change during the course of a school year for uncertain reasons. Assessing a greater proportion of school environments in each jurisdiction, and conducting repeated observations at each location, has the potential to reveal more consistent trends and clearer relationships. Including more jurisdictions to the assessment can also provide additional comparison opportunities based on differing
regulatory and socioeconomic factors.
Studies that can coordinate willing vendors and ample observer staffing have the potential to gather data that more directly measures the nutritional content of snacks and beverages purchased by students and caretakers. The current political sensitivity of the issue made it difficult to outreach to vendors for purposes of research. Instead, the assessment relied on a contrast of observed vendor inventories and student survey responses to draw nutrition-related conclusions regarding these transactions. While helpful, the available observation data does not capture the bundling of products within individual transactions that may be driving the severe end of caloric overconsumption amongst the most frequent vendor patrons. Tracking sales for individual vendors and, perhaps, the purchase history of segmented consumer groups can help determine the proportion of students who are only supplementing their daily nutrition needs through vendor snacks and beverages, and those that may be skewing their diets away from healthier options.
Gathering primary data at the point-of-sale would also provide more reliable information on street vendor transactions than what can be gathered through survey responses. While
classroom surveys employed by this assessment where helpful in outlining a general student perception of the off-campus nutrition environment, answers regarding individual purchases and preferences were subject, like most surveys, to a variety of inaccuracies. Some respondents could have struggled to accurately interpret questions, recalled inaccurate information from their past experience, or not given full attention to questions due to survey fatigue. Although students completed surveys anonymously and were encouraged to give honest answers, some respondents may still have been more motivated to give socially desirable answers.
Conclusions
The evidence gathered for this assessment does not suggest that citywide prohibitions against sidewalk food vending are functioning as a protection of quality nutrition environments surrounding school campuses. Whether enforcement resources are inadequate to consistently enforce the prohibitions, or the income-generation needs of low-income people are acute enough to justify the risks, school environments in South Los Angeles appear as likely to include an abundance of street vendors selling snacks and beverages as other places. Evidence also suggests a higher presence of street vendors where residents have a more tenuous foothold in the formal
Section 5 Discussion

26 ︱ Page
economy and where the cultural context is more accustomed to informal enterprise in the public realm. It is reasonable, therefore, to consider whether legitimized forms of sidewalk vending would be adaptable and socioeconomically beneficial in many sections of Los Angeles. Because the prohibition does not appear to discourage vendor activity near schools, permitted sidewalk vending would not likely amplify the hazards from nutrient-poor snacks and sugary beverages that already exist within the wider food ecology occupied by students.
Evidence from this assessment does not suggest that sidewalk vendors are an occasional or consistent generator of vehicle-pedestrian conflicts in their vicinity. It is not clear from this assessment whether sidewalk vendors have a positive effect on bicycle/pedestrian safety or the creation of defensible space. However, unsubstantiated views persist that the presence of street vendors contributes to unsafe and unkempt conditions in a neighborhood. More specific evidence is needed to assess the relationship of street vendors to a variety of environmental factors, such as crime prevention, food safety, and ancillary business activity.
Reforming the regulatory environment of street vending does offer an opportunity to
focus closer on the food access challenges faced by students and caretakers in South Los Angeles. To address the child obesity epidemic locally, a comprehensive policy and programmatic approach is evolving that includes restrictions on the proliferation of unhealthy food sources (e.g. fast food density limitations) and development initiatives to scale the presence of healthier food sources (e.g. corner store conversions, nutrition benefits matching, food retail financing initiatives). Both of these approaches have implications for the regulation of street vending.
While vendors in many areas make authentic and valued contributions to the city’s emergent food culture, observations confirmed that students and caretakers represent a market niche that is served by vendors with largely unhealthy snack and beverage choices. Survey evidence suggest that a majority of elementary school students in South Los Angeles participate in this market on part-time basis, and a sizeable minority of students participate on a near-daily basis. Though exercise can mitigate some of the negative health effects from these snack and beverage purchases, in many cases they are contributing to varying degrees of caloric overconsumption.62
The continued prohibition of this sidewalk vending mode in proximity to school campuses should, therefore, be a distinct consideration from the wider legalization of street vending. New permitting structures that would be implemented with these regulatory reforms may also include revenue sources that can be allocated for more consistent enforcement. If these resources are applied with student nutrition as a primary concern (as opposed to business concerns), they could make school-proximal regulations of street vending more effective than yet seen.
However, vendors that elect to sell healthy food (most likely fruit and water, but possibly homemade meals and certain packaged snacks) provide a compelling reason for allowing approved modes of street vending near schools that compliment campus-based nutrition efforts. Research suggests that this type of health-oriented street vendor can be sustained independently,63 but their economic prospects could be significantly enhanced if granted exclusive access to a regulated environment near schools, if offered other regulatory incentives (e.g. fee waivers, permit expediting), and if supported by a public or philanthropic vendor incubation initiative.
The assessment’s data on student nutrition behaviors
62 Wolstein, J and Goetz, K (2007). Street Vendors in Los Angeles: Promoting Healthy Eating in LA Communities. UCLA School of Public Affairs, Lewis Center for Regional Policy Studies.
63 Tester JM, Yen IH, Laraia B (2012). Using Mobile Fruit Vendors to Increase Access to Fresh Fruit and Vegetables for Schoolchildren. Preventing Chronic Disease; 9:110222 (http://dx.doi.org/10.5888/pcd9.110222).

Page ︱ 27
does provide outlines of a multifaceted food resource environment containing multiple challenges to healthy eating. Based on the patronage rates indicated in student surveys, the presence and product offerings of fast food restaurants and convenience stores may be more imperative to address than street vending, while ice cream trucks operating near schools are a similar or greater source of non-nutritious snacks and sugary beverages. It is also speculative whether curtailing street vendor activity near schools or transforming their product offerings would actually improve student nutrition behaviors, or whether this demand would only shift to food access points that are unregulated or where nutrition content is less of a regulatory concern. It is plausible that both changes would occur to some extent.
Elementary school students, who appear to be the primary consumer base of street vendors operating near school campuses, are more dependent on the choices of caretakers to patronize certain food access points. While some older students may have the ability to obtain snack and beverage items on their own from convenience stores and fast food restaurants, other students would only do so if their caretakers chose to. A prior group of students surveyed suggested that 44%
would purchase snacks and beverages from other retail outlets in lieu of street vendors, while 37% would forego those purchases.64 Caretaker choices may depend on whether convenience stores and fast food restaurants match the locational advantages of street vendors along the primary pedestrian routes leading from schools. Not matching this proximity could influence caretakers to rely more on household food supplies or encourage their students to eat more food provided at school.
If their activity near schools continues to be inconsistently enforced, ice cream trucks would also be well positioned to absorb the snack and beverage demand of street vendors. Furthermore, anecdotal insights do suggest that an informal snack market operated by students and adults, motivated by enterprise or concern, does exist within wider school communities. More than half of surveyed students indicated that they at least occasionally obtain snacks and beverages from “someone else” (see tables 7-8). While considerate of nutritional needs in some cases, this market usually replicates (or sometimes innovates upon) the offerings that are proven popular (e.g. chips and candy) within the wider marketplace. In the same way that this market has counterbalanced improvements in school meal offerings, it also
has potential to offset changes in sidewalk and mobile vendor activity near school campuses.
Successes in making school food more nutritious and appetizing can help to limit the demand for sidewalk food vendors that is generated from hungry students at the close of the school day. But as recent experience with lunchroom reforms indicate, established tastes are hard to counter.65 Recognition of the highly nimble demand for popular snacks and beverages, which can move between established retail businesses to multiple channels of informal exchange, underscores the challenge of regulating the presence and character of food retail in a community. It also points to the key role that nutrition and consumer awareness plays in addressing child obesity. Building the conviction to forgo the unhealthy food available in a neighborhood appears to be as important to community health as the effort to bring healthier and affordable food to a neighborhood. Some of the most integral efforts to form this awareness are occurring at schools, where more students than before are learning about urban agriculture, the origins and production processes of our food, and the food access disparities in their community.
64 Wolstein, J and Goetz, K (2007). Street Vendors in Los Angeles: Promoting Healthy Eating in LA Communities. UCLA School of Public Affairs, Lewis Center for Regional Policy Studies.
65 Wheeler M. Love at First Bite? Not for LA School Kids and their Vegetables. UCLA Newsroom, 2014 May 22 (http://newsroom.ucla.edu/releases/love-at-first-bite).
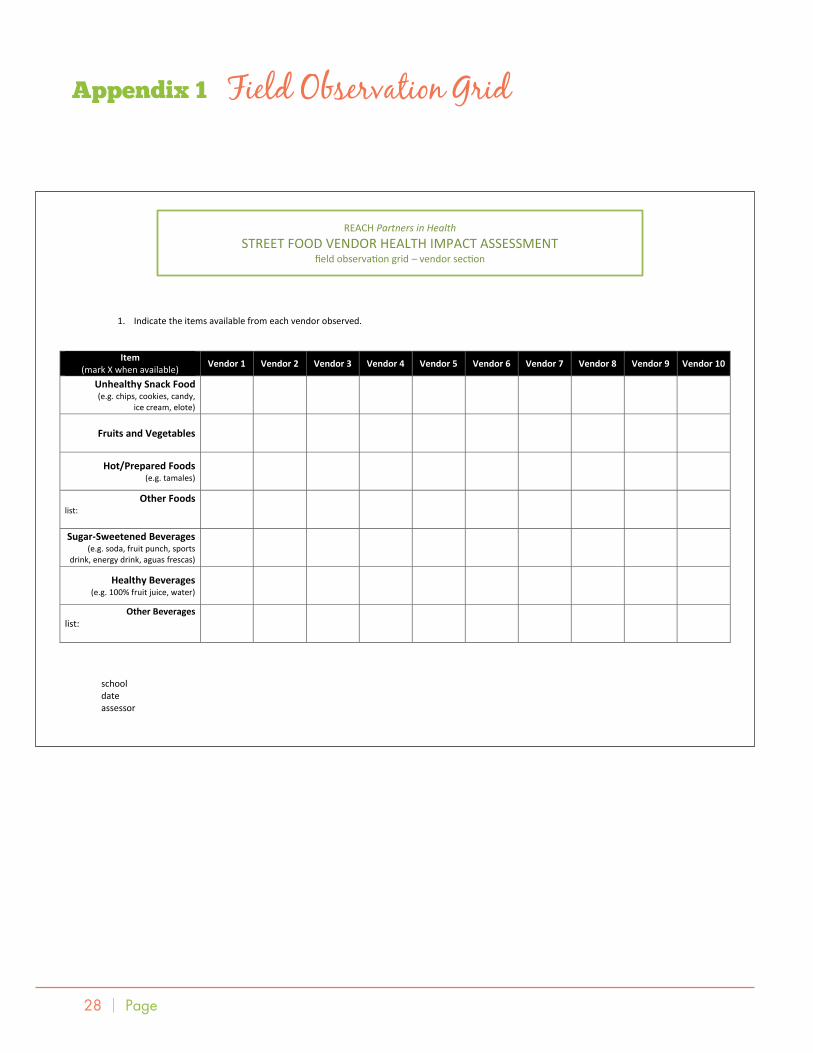
28 ︱ Page
Appendix 1 Field Observation Grid
school date assessor
1. Indicate the items available from each vendor observed.
Item (mark X when available) Vendor 1 Vendor 2 Vendor 3 Vendor 4 Vendor 5 Vendor 6 Vendor 7 Vendor 8 Vendor 9 Vendor 10
Unhealthy Snack Food (e.g. chips, cookies, candy,
ice cream, elote)
Fruits and Vegetables
Hot/Prepared Foods (e.g. tamales)
Other Foods list:
Sugar-Sweetened Beverages (e.g. soda, fruit punch, sports
drink, energy drink, aguas frescas)
Healthy Beverages (e.g. 100% fruit juice, water)
Other Beverages list:
REACH Partners in Health STREET FOOD VENDOR HEALTH IMPACT ASSESSMENT
field observation grid – vendor section

Page ︱ 29
school date assessor
2. Indicate the location and pedestrian conditions for each vendor observed.
3. Indicate the number of food trucks or ice cream trucks that were present during the observation period?
Location (mark one for each vendor) Vendor 1 Vendor 2 Vendor 3 Vendor 4 Vendor 5 Vendor 6 Vendor 7 Vendor 8 Vendor 9 Vendor 10
Between school gates and street
Across the street from school
Within 2 blocks of school
Farther that 2 blocks from school
Vendor travel method (mark one for each vendor) Vendor 1 Vendor 2 Vendor 3 Vendor 4 Vendor 5 Vendor 6 Vendor 7 Vendor 8 Vendor 9 Vendor 10
Pushed or carried
Pedaled
Sidewalk congestion (mark one for each vendor) Vendor 1 Vendor 2 Vendor 3 Vendor 4 Vendor 5 Vendor 6 Vendor 7 Vendor 8 Vendor 9 Vendor 10
Groupings did not generally obstruct sidewalk
Groupings often made sidewalk passage difficult
Groupings caused passersby to walk in the street

30 ︱ Page
school date assessor
1. Describe car traffic conditions where vendors were present during the observation period (chose one option)? ¨ light (occasional cars passing) ¨ medium (consistent vehicle flow with a number of cars on the road) ¨ heavy (frequent slowing due to vehicle congestion)
2. How many pedestrians were present during the observation period?
Students Adults
3. How many bicyclists were present during the observation period? Students Adults
REACH Partners in Health STREET FOOD VENDOR HEALTH IMPACT ASSESSMENT
field observation grid – mobility section
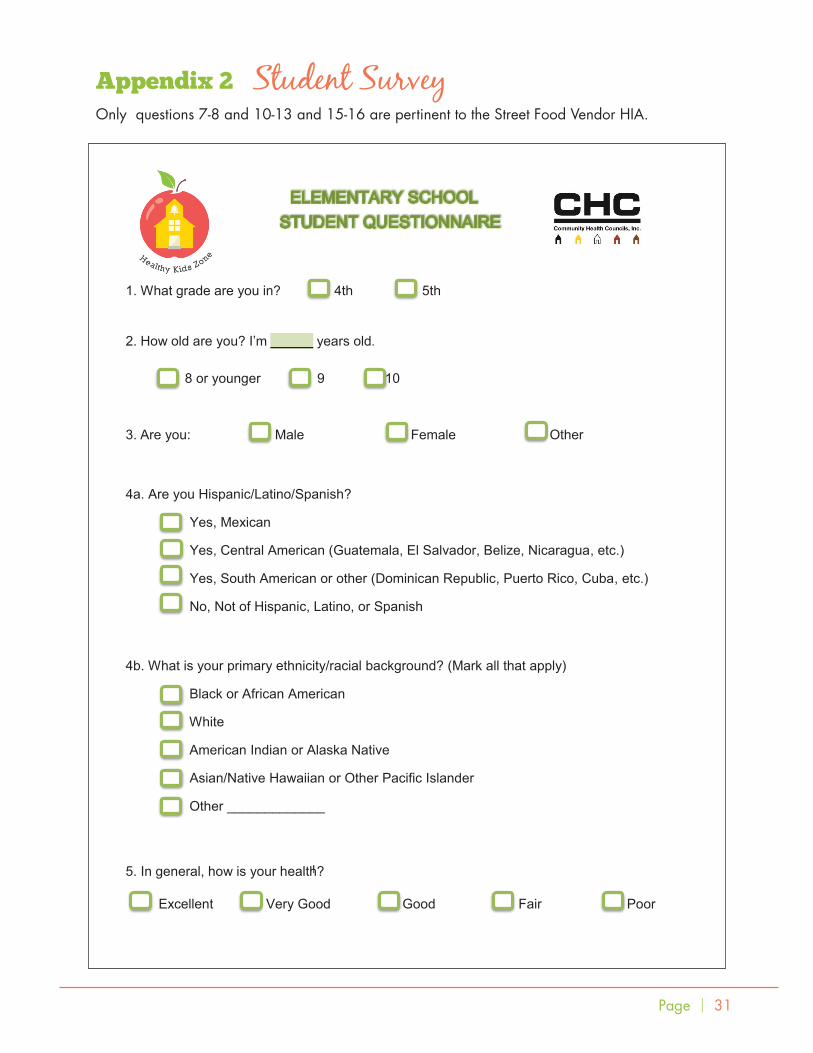
Page ︱ 31
Appendix 2 Student SurveyOnly questions 7-8 and 10-13 and 15-16 are pertinent to the Street Food Vendor HIA.
!
1. What grade are you in? 4th 5th
2. How old are you? I’m years old.
8 or younger 9 10
3. Are you: Male Female Other 4a. Are you Hispanic/Latino/Spanish?
Yes, Mexican
Yes, Central American (Guatemala, El Salvador, Belize, Nicaragua, etc.)
Yes, South American or other (Dominican Republic, Puerto Rico, Cuba, etc.)
No, Not of Hispanic, Latino, or Spanish
4b. What is your primary ethnicity/racial background? (Mark all that apply)
Black or African American
White
American Indian or Alaska Native
Asian/Native Hawaiian or Other Pacific Islander
Other _____________ 5. In general, how is your health? Excellent Very Good Good Fair Poor
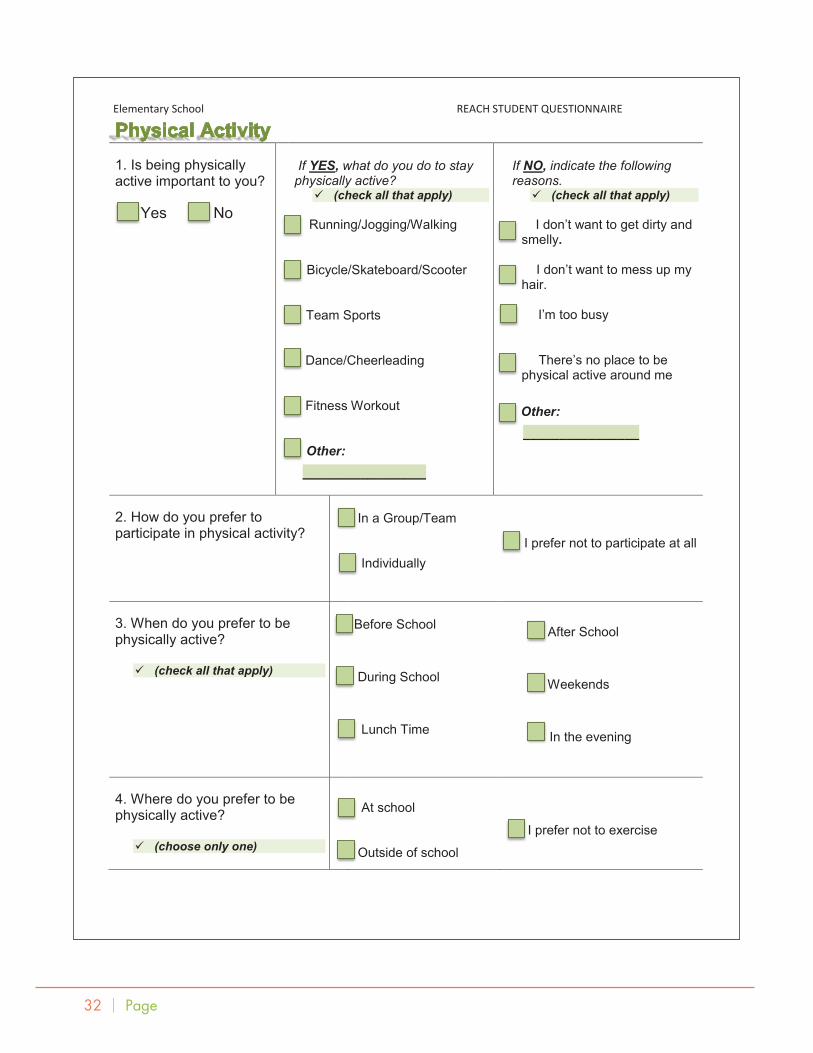
32 ︱ Page
Elementary School REACH STUDENT QUESTIONNAIRE
1. Is being physically active important to you? Yes No
If YES, what do you do to stay physically active? ü (check all that apply)
Running/Jogging/Walking
Bicycle/Skateboard/Scooter
Team Sports
Dance/Cheerleading
Fitness Workout
Other: _________________
If NO, indicate the following reasons. ü (check all that apply)
I don’t want to get dirty and
smelly. I don’t want to mess up my
hair.
I’m too busy
There’s no place to be physical active around me
Other: ________________
2. How do you prefer to participate in physical activity?
In a Group/Team Individually
I prefer not to participate at all
3. When do you prefer to be physically active? ü (check all that apply)
Before School During School Lunch Time
After School Weekends In the evening
4. Where do you prefer to be physically active? ü (choose only one)
At school Outside of school
I prefer not to exercise

Page ︱ 33
Elementary School REACH STUDENT QUESTIONNAIRE
6. Is eating healthy food important to you?
Yes No
7. How many times a week do you eat school lunch? 8. How many times a week do you eat school snack?
0 Never 1-2 Times per week 3-4 Times per week 0 Never 1-2 Times per week 3-4 Times per week
5 Times per week More than 5 times per week 5 Times per week More than 5 times per week
5. What other physical activities would you participate in if they were offered at school? ü (check all that apply)
Wii Sports Swimming Ultimate Frisbee Zumba/Dance
Field Hockey Martial Arts Fitness Workout Other:
________________

34 ︱ Page
Elementary School REACH STUDENT QUESTIONNAIRE
9. When choosing to eat food from the cafeteria, what matters to you the most? ü (choose the best answer)
10. Mark how often you get snacks from the following places? 11. Mark how often you buy these snacks from sidewalk vendors?
The food tastes good to me The food looks good to me It is something I have eaten before My friends also eat the food Vending machines
School store
Sidewalk vendor
Food trucks
Corner store
Fast food restaurant
From home
Someone else Chips, cookies, candy, ice cream, elote
Fruits and vegetables
Tamales, sandwiches or other homemade food Soda, Gatorade, fruit punch, hot chocolate, or other sweet drinks Water or natural fruit juice
The food is healthy I do not eat cafeteria food Other:
________________ sometimes often never
never sometimes often
never sometimes often
never sometimes often
never sometimes often
never sometimes often
never sometimes often
never sometimes often
never sometimes often
never sometimes often
never sometimes often
never sometimes often
never sometimes often
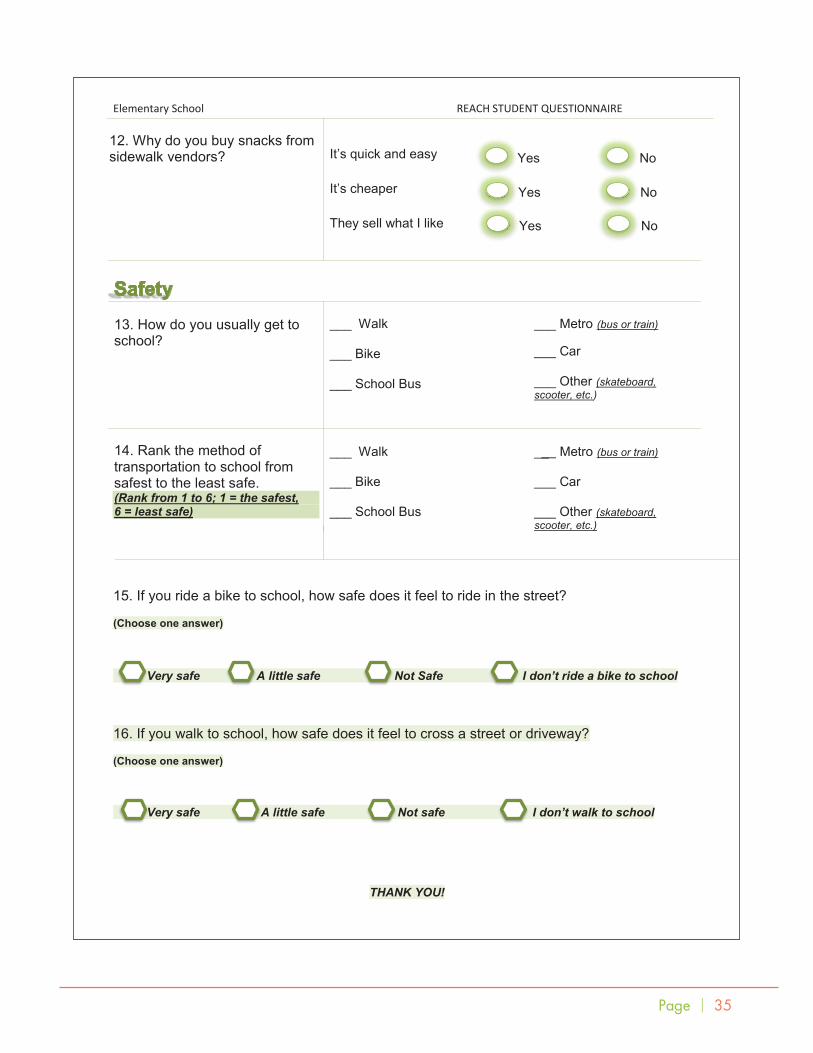
Page ︱ 35
Elementary School REACH STUDENT QUESTIONNAIRE
12. Why do you buy snacks from sidewalk vendors?
It’s quick and easy no
It’s cheaper
They sell what I like
13. How do you usually get to school?
___ Walk ___ Bike ___ School Bus
___ Metro (bus or train) ___ Car ___ Other (skateboard, scooter, etc.)
14. Rank the method of transportation to school from safest to the least safe. (Rank from 1 to 6; 1 = the safest, 6 = least safe)
___ Walk ___ Bike ___ School Bus
__ Metro (bus or train) ___ Car ___ Other (skateboard, scooter, etc.)
15. If you ride a bike to school, how safe does it feel to ride in the street?
(Choose one answer)
Very safe A little safe Not Safe I don’t ride a bike to school
16. If you walk to school, how safe does it feel to cross a street or driveway?
(Choose one answer)
Very safe A little safe Not safe I don’t walk to school
THANK YOU!
No Yes
No Yes
No Yes

36 ︱ Page
Appendix 3 Additional DataTable A Sidewalk Vendors Near Schools by Observed Travel Method
Table B Sidewalk Vendors Near Schools by Observed Location
Source: HIA field assessments
Source: HIA field assessments
School City Sidewalk Vendors Pushed or Carried Pedaled
Elementary S1 LA 8 ••••••• •
Elementary S3 LA 6 •••• ••
Elementary C1 C 4 ••• •
Elementary C4 C 3 •••
Elementary C2 C 2 ••
Elementary C3 C 1 •
Elementary S2 LA 0
Elementary S4 LA 0
Middle S1 LA 1 •
Middle C1 C 1 •
Middle S3 LA 0
Middle C3 C 0
Total 26 21 5
School City Sidewalk Vendors
Inside School Gates
Between School
Gates and Street
Across Street From
School
WithinTwo
Blocks of School
Beyond Two
Blocks of School
Elementary S1 LA 8 •••••• ••
Elementary S3 LA 6 ••• •••
Elementary C1 C 4 ••• •
Elementary C4 C 3 • • •
Elementary C2 C 2 • •
Elementary C3 C 1 •
Elementary S2 LA 0
Elementary S4 LA 0
Middle S1 LA 1 •
Middle C1 C 1 •
Middle S3 LA 0
Middle C3 C 0
Total 26 1 14 9 2 0

Page ︱ 37
Appendix 4 City Council Motion (CF 13-1493)

38 ︱ Page
Appendix 5 Proposed Sidewalk Vending Ordinance (LA Street Vendor Campaign)
Source: streetvendorcampaign.blogspot.com (accessed September 2015)