HEALTH FINANCING - -
92
Learning from Experience: Health care financing in low- and middle-income countries HEALTH FINANCING Diane McIntyre
Transcript of HEALTH FINANCING - -
Global Forum for Health Research1-5 route des Morillons
PO Box 21001211 Geneva 2 - Switzerland
T +41 22 791 4260F +41 22 791 4394
He
al
th
F
in
an
ci
ng
Glo
ba
l Fo
rum
for H
ea
lth R
ese
arc
hH
ea
lth C
are
Fin
an
cin
g2
00
7
Learning from Experience:Health care �nancing in low-
and middle-income countries
HEA
LTH
FIN
AN
CIN
G
Diane McIntyre
"Stronger health systems are needed to promote health equity, deliver e�ective interventions, and ensure that health systems contribute to broader development goals, such as the UN Millennium Development Goals. This comprehensive review of experience with health care �nancing is a major contribution to the international literature in this �eld. It represents an invaluable resource for policy-makers, those providing technical support to policy-makers, researchers, and students."
Lucy Gilson, Leader, Hub for Health Systems Knowledge Network, Commission on Social Determinants of Health
This report reviews health care �nancing in resource-poor countries. It o�ers a framework to assess the performance of a health care �nancing system and make it more equitable, e�cient and sustainable by optimizing the three key functions of health care �nancing: revenue collection, pooling of funds and purchasing.
A user-friendly fold-out table provides the international experience in the performance of these functions in terms of feasibility, equity, e�ciency and sustainability at a glance. An Executive Summary is provided in Chinese, English, French, Portuguese and Spanish.
To facilitate drawing from the experience of other countries, the report presents country case studies that highlight some of the factors that have contributed to the successful set-up and implementation of these functions.


Learning from Experience:Health care financing in low-and middle-income countries
By Diane McIntyreHealth Economics Unit,
University of Cape Town,
South Africa

ii
Acknowledgements
This report was written by Diane McIntyre, University of Cape Town, South Africa, and the work carried out under the general direction of Sylvie Olifson-Houriet of the Global Forum for Health Research in Geneva, Switzerland.
We would like to acknowledge the helpful comments and contributions of the peer reviewers − Eleonora Cavagnero, Tim Ensor, Adam Leive and George Schieber. We also extend our thanks to Guy Carrin, Andrés de Francisco and Stephen Matlin, who provided constructive comments, and to Abdul Ghaffar, Lakshmi Sundaram and other colleagues who contributed to the conceptualization of the project. Any errors or omissions, however, are the sole responsibility of the author. Thanks are also due to John Maurice for editing this report.
We believe that the subject is important and deserves more attention than it has received to date – attention that ideally should be followed by concerted action. We hope that others, particularly national-level policy-makers striving to improve the equity, efficiency and sustainability of health care financing in their country, will find the report of value.

iii
Foreword
Despite impressive progress since 1950, huge challenges remain in the effort to improve health outcomes in developing countries and achieve related goals concerning universal coverage, basic needs, equity, inclusion, risk protection and reaching poor and marginalized groups. One of these challenges is how health should be financed – who should pay how much and through what arrangements, given the reality that the services and other actions needed to attain desired health results inevitably involve costs that must be financed somehow.
This is no simple matter. Developing countries’ public, private and civil society sectors, together with external donors and other partners, act as financiers and/or providers of health services. Funds are mobilized through taxes, social security/insurance systems, fees, grants, loans and other revenue-generating instruments, and flow through budgets and various off-budget channels. The public and private choices that are made in this complex space have profound implications not just for which groups bear what share of the costs, but also for who actually gets services and in what quantity and quality.
Diane McIntyre captures here the state of thinking and evidence on health care financing choices and their impact in developing countries, and points out that a hard-won consensus has been achieved in the field. There is now little doubt that prevailing systems that rely heavily on out-of-pocket fees – with all their adverse effects, including their impoverishing effect on vulnerable households – are too dominant now and need to give way to more modern solutions drawing on prepayment and integrated risk pools.
Her analysis provides sufficient details to demonstrate clearly the complex issues under discussion. Useful country examples are employed to illustrate points made in the text, a summary policy recommendation table is provided in the conclusions, and policy guidance is practical and specific.
The hard-won technical consensus now needs to be communicated clearly and effectively. At the Health Financing Task Force (www.healthfinancingtaskforce.org), we are committed to doing just that, promoting the application of evidence-based health financing policies in developing countries. Dr McIntyre’s work provides an excellent example of what can and should be done to move things forward.
David de FerrantiChair, Health Financing Task Force

iv
About the author
Diane McIntyre (PhD) is Professor at the University of Cape Town, South Africa. She founded the Health Economics Unit in 1990 and was its director for 13 years. She has served on numerous policy committees and has extensive experience in research, technical support and capacity development in South Africa and other parts of Africa. Her experience in research and technical support has focused mainly on health care financing, health equity, resource allocation, public-private mixes and pharmaceutical regulation.
The author Diane McIntyre

v
Table of contents
Acknowledgements ii
Foreword iii
About the author iv
Abbreviations and acronyms vii
Glossary viii
Executive summary xiii
1 Introduction 1
2 Main mechanisms of health care financing 3Government funding 3
Health insurance 3
Mandatory health insurance 3
Voluntary health insurance 3
Out-of-pocket payments 4
3 Assessing financing mechanisms 5Feasibility 5
Equity 5
Efficiency 6
Sustainability 6
4 Key functions of health care financing 7Revenue collection 8
Sources of funds 9
Contribution mechanisms 10
General tax revenue 11
Health insurance 18
Donor funding 22
Types of collecting organizations 25
Pooling of funds 25
Coverage and composition of risk pools 26
Allocation mechanisms 33
Purchasing 37
The benefit package 37
Type of service 37
Type of provider 40
Affordability and sustainability 40

vi
BoxesBox 1: Case study: removal of user fees in Uganda 12
Box 2: Implications of private health insurance for tax revenue in South Africa 16
Box 3: Case study: benefits to the health sector of debt relief in Nigeria 19
Box 4: Case study: mandatory insurance in Costa Rica 20
Box 5: Case study: a SWAp in Bangladesh 24
Box 6: Case study: general tax funding as a basis for universal health coverage
in Sri Lanka
Box 7: Case study: mandatory health insurance as the basis for universal coverage
in Ghana
Box 8: Examples of countries using a needs-based resource allocation formula 34
Box 9: Case study: equitable distribution of health care benefits in Thailand 38
Box 10: Case study: contracting for health services in Colombia 41
Box 11: Case study: accessing benefits in the Bwamanda CBHI scheme in the
Democratic Republic of Congo
FiguresFigure 1: Proportion of GDP spent on public health compared to military spending 17
Figure 2: Government expenditure on debt servicing and public health in selected
countries
Figure 3: Hypothetical allocation of health care resources between districts 36
TablesTable 1: Advantages and disadvantages of different provider payment mechanisms 44
Table 2: Summary of key issues in health care financing 47
27
29
43
18
Service delivery infrastructure 42
Provider payment mechanisms 42
5 Conclusions 45
Appendix A: Financial protection for the poor 49
Appendix B: Key macroeconomic, health and health care expenditure indicators
Résumé 59
Resumen 61
Sumário 63
65
References 67
53

vii
Abbreviations and acronyms
ARV antiretroviral (therapy)
CBHI community-based health insurance
CCSS Caja Costarricense de Seguro Social (Costa Rican Social Security Fund)
CSMBS Civil Servant Medical Benefit Scheme (Thailand)
DFID Department for International Development (United Kingdom)
DRG diagnosis related group
GBS general budget support
GDP gross domestic product
GST general sales tax
HDI human development index
HPSP Health and Population Sector Program (Bangladesh)
IFI international financing institutions
LI Card low-income card (Thailand)
MDGs Millennium Development Goals
MDRI Multilateral Debt Relief Initiative
MHIS Mutual Health Insurance Scheme (Ghana)
MoH Ministry of Health
MTEF medium-term expenditure framework
NGO nongovernmental organization
NHI National Health Insurance
NHIF National Health Insurance Fund (Ghana)
OECD Organisation for Economic Co-operation and Development
OOP out of pocket
PHC primary health care
PPP purchasing power parity
SHI social health insurance
SSNIT Social Security and National Insurance Trust (Ghana)
SSS Social Security Scheme (Thailand)
SWAp sector-wide approach
UC universal coverage
VAT value added tax
VH Card voluntary health card (Thailand)
WHO World Health Organization

viii
Glossary
actuarial information system
in the health insurance context, a system that contains information about the demographic and morbidity profiles of health insurance scheme members and that can be used to estimate members’ probable future health care use and the related expenditure required from the insurance scheme
adverse selection the likelihood that a person with a high risk of illness and a greater need for frequent health care will be more likely to enrol in a health insurance scheme than a person with a low risk of illness and less need for frequent health care use
allocative efficiency
the allocation of resources preferentially to health services providing care for those aspects of ill-health for which effective interventions exist and which are most common in the community being served, with priority given, among those preferential services, to the most cost-effective interventions, i.e. interventions offering the lowest cost per unit of health outcome (see also technical efficiency, below)
appropriate referral route
the order in which a patient seeks care, or is advised to seek care, from the different levels of health care provider: with the exception of emergency care, the most logical and efficient route begins with a provider at the primary care level (e.g. a government primary health care centre or a general practitioner), followed, as required and as recommended by the primary health care provider, to a higher level of care; the aim is to avoid use of specialist or hospital care if a health problem can be addressed, at lower cost, at the primary health care level
basket fund the pooling of funds provided by government and donors into a single basket, which is then used to implement public sector health services in accordance with a strategic plan agreed by all contributors to the basket
breadth and depth of coverage
breadth of coverage: the proportion of the total population covered by health insurance
depth of coverage: the composition of the health insurance benefit package – the more comprehensive the package, the greater the depth of coverage
capitation an amount of money per capita or per person, which may be adjusted for the relative risk of that person needing health care (see risk-adjusted capitation, below)
capitation fee usually, a negotiated payment paid for an agreed period of time by an insurance scheme to a health care provider per person covered by the scheme and receiving health care from the provider
catastrophic event an episode of acute illness or a long-term illness that requires unexpected health care so costly as to risk impoverishing a household
catastrophic expenditure
expenditure at such a high level as to force households to reduce spending on other basic goods (e.g. food or water), to sell assets or to incur high levels of debt, and ultimately to risk impoverishment
cherry-picking (sometimes called “cream-skimming”)
the practice whereby an insurance scheme enrols a disproportionate percentage of individuals (e.g. young people) who present a lower than average risk of ill-health

ix
community-based prepayment scheme (also called "community-based health insurance" or "community health fund")
an insurance scheme to which members of a local, often rural but also peri-urban, community pay a small contribution and which then pays the fees charged by local health services
community-rated contribution
a contribution to health insurance calculated on the basis of the insurance claims profile of the entire community or of the insurance scheme, or on the basis of the average expected cost of health service use of the entire insured group rather than of an individual
consumer price index (also called “inflation rate”)
the average price of a basket of goods and services bought by a typical consumer or household over a given time
co-payment out-of-pocket (see below) partial payment by a health insurance member for health services used in addition to the amount paid by the insurance: the aim is to place some cost burden on members and thereby discourage them from excessive use of health services
costed-norms approach
an approach that determines, for each geographic area within a country, the health services to be provided by each type of health facility in the area according to its size, equipment and staffing level, and that calculates the cost of meeting these norms in each area: the aim is to ensure that the different geographic areas in the country have access to comparable health services
cream-skimming see cherry-picking, above
cross-subsidies see income and risk cross-subsidies, below
deficit budget government spending at levels exceeding the revenue it is able to generate from taxes
deficit financing government spending at levels exceeding the revenue from general tax and other government sources but covered by domestic or international loans
diagnosis related group
the grouping of patients according to such criteria as diagnosis, likely medical procedures required, age, sex, and the presence of complications or co-existent illness: since each group is comprised of patients presenting similar clinical problems and likely to require the same level of hospital resources, a government or insurance scheme can estimate relatively easily how much it has to reimburse a hospital for services rendered to patients in each group
donor-pooled health fund
a fund into which a number of donors combine most or all of their funding so that it can be used to support a range of public sector health services, rather than having separate individual funds, each earmarked for the health project preferred by the donor
fiscal space “room” or leeway within the government budget to direct resources to a specific activity that the government regards as important, without jeopardizing the sustainability of the government’s overall financial situation
formal sector the official sector of the economy, regulated by society’s institutions, recognized by the government and recorded in official statistics (see also informal sector, below)
fund pooling accumulation of prepaid health care revenues, such as health insurance contributions, that can be used to benefit a population: the aim is to share risk across the population, so that unexpected health care expenditure does not fall solely on an individual or household, with sometimes catastrophic consequences (see catastrophic expenditure, above)

x
general budget support
financial support through donor funds that are all given to a country’s ministry of finance rather than directly to the ministry of health: the ultimate decision about how the funds should be distributed between the health sector and other sectors rests with the ministry of finance
general sales tax tax based on a percentage of the selling price of goods and services, imposed by the government at the point of sale, collected by the retailer and passed on to the state
general taxes direct taxes, such as company and personal income tax, indirect taxes such as value added tax (VAT) (see below) or general sales tax (GST) (see above), and customs and excise duties
income and risk cross-subsidies
income cross-subsidy: whereby the wealthy make greater contributions to health care funding than the poor but all have access to the same range of health services
risk cross-subsidy: whereby people with a greater need for health care (i.e. high-risk individuals) are able to use more health services than those who are healthy (i.e. low-risk individuals), irrespective of the contribution made by each group
incremental budgeting
budgeting for a particular health service or facility on the basis of the previous year’s budget but with a small increment (or increase)
indigent refers to a very poor person or a person who has no observable or adequate means of income and who obtains no support from any source whatsoever
informal sector the unofficial sector of the economy, in which income and the means used to obtain it are unregulated, and which coexists within a legal and social environment where similar income-producing activities are regulated: in the informal sector, labour relations, where they exist, are based mostly on casual employment, kinship or personal and social relations rather than on contractual arrangements with formal guarantees (see also formal sector, above)
international financing institutions
organizations, such as the World Bank and the International Monetary Fund, that are multilateral (i.e. have a mandate from, and interact with, many governments) and that deal with financial issues
low- and middle-income countries
in 2005, low-income countries were classified by the World Bank as countries with a per capita gross national income (GNI) of US$ 875 or less and middle-income countries as those with a per capita GNI of US$ 876 to US$ 10 725
mandatory health insurance
a health insurance scheme to which certain population groups or the entire population must belong by law: such schemes, which imply income and risk cross-subsidies (see above), are founded on the principle of social solidarity, whereby individuals contribute to the insurance according to their ability to pay (or their income) and benefit from coverage according to their need for health care
marginal income tax rate
a percentage levied by the government on the last unit (e.g. dollar or pound) that an individual earns: for example, if income is taxed at 5% from US$ 0 up to US$ 50 000, 10% from US$ 50 000 to US$ 100 000, and 15% for over US$ 100 000, a taxpayer with an income of US$ 175 000 would have a marginal tax rate of 15% but a person with an income of US$ 75 000 would have a marginal tax rate of 10%
marginalization index
a composite index of socio-economic status used in Mexico to guide resource allocation: it includes such indicators as educational status, access to potable water and sanitation, and overcrowding
means testing a means of determining the income of an individual and, usually in a health sector context, the individual’s right to exemption from paying for health services or from contributing to a health insurance scheme

xi
medium-term expenditure framework
a system of three-year (or longer-term) rolling budgets (see below) which creates a predictable medium-term planning environment, gives the health sector an advance indication of allocations likely to be made over the next few years and thus allows policy development and implementation to be linked with resources over time
micro-insurance see community-based prepayment scheme, above
moral hazard a tendency of entitlement to the benefits of health insurance to act as a strong incentive for people to consume more and “better” health care and a weak incentive for them to maintain a healthy lifestyle
multilateral debt relief initiative
an initiative to fully cancel the debt owed by some countries to international financing institutions (see above)
mutual health insurance
see community-based prepayment scheme, above
national health insurance
a mandatory health insurance scheme (see above) that covers all or most of the population, whether or not individuals have contributed to the scheme
needs-based formula
a formula used to inform the allocation of health care resources among different geographic areas: it includes indicators of each area’s need for health care, such as population size, the age and sex composition of the population, and its relative burden of ill-health
out-of-pocket payment
payment made by an individual patient directly to a health care provider, as distinct from payments made by a health insurance scheme or taken from government revenue
perverse incentive an incentive that can lead to behaviour contrary to the goals of public health policy: for example, services offered to beneficiaries free of charge may encourage beneficiaries to consume medical care without regard to cost, thus leading to moral hazard (see above)
poverty reduction strategy papers
documents that are prepared by developing country governments in collaboration with the World Bank, the International Monetary Fund, civil society, and development partners, that set out a national strategy for promoting growth and reducing poverty and that specify the policies, programmes, sources of financing and external financing needed to implement the strategy: Poverty Reduction Strategy Papers are needed by countries seeking to obtain debt relief under the Heavily Indebted Poor Countries Initiative
prepayment funding
payments made by individuals via taxes or health insurance contributions before they need to use a health service: prepayment contributions are pooled (see fund pooling, above)
progressive (or equitable) contribution mechanism
a financing mechanism whereby high-income groups contribute a higher percentage of their income than do low-income groups
proportional contributions
a financing mechanism, whereby everyone contributes the same percentage of income to a health insurance scheme, irrespective of income level
regressive contribution
a financing mechanism whereby low-income groups contribute a higher percentage of their income than high-income groups
reinsurance an insurance for insurers: in the case of health insurance, a process whereby several small health insurance schemes can transfer the risk of unexpectedly high health care expenditure (or of adverse selection, see above) to a single insurer (a “reinsurer”)
risk-adjusted capitation
a per capita (or per person) amount of money paid to a health care provider that is based on a person’s likelihood, or risk, of requiring health care (judging from indicators of risk, such as age, gender, and the presence of chronic disease)

xii
risk-adjusted, or needs-based, resource allocation
the allocation of resources among several geographic areas (in the case of general tax-funded services) or individual insurance schemes (in the case of a mandatory health insurance system) based on the relative need for health care or the risk of incurring health care expenditure (based on indicators such as age, gender and morbidity profiles) (see needs-based formula, above)
risk equalization a mechanism whereby revenue accruing from contributions to several health insurance schemes or health funds acting as financing intermediaries (i.e. organizations that receive contributions and pay health care providers) for a social health insurance system is pooled and the individual schemes allocated an amount which reflects the expected costs of each scheme according to the overall ill-health risk profile of its membership (calculated on a risk-adjusted capitation basis, see above)
risk pooling risk sharing across a group of people or across the entire population, so that unexpected health care expenditure does not fall solely on an individual or household and that individuals and households are protected from catastrophic expenditure (see above)
risk-rated contribution
the contribution an individual or group pays to an insurance scheme adjusted to the level of the individual’s or group’s risk of illness, expected future cost of health care use or past claims experience
rolling budget a system of budgeting within a medium-term expenditure framework (see above) whereby future budgets covering a period of several years (say, three years or five years or more) are prepared or revised every year: e.g. for a three-year rolling budget, in 2000, budgets are prepared for 2001, 2002 and 2003; in 2001, the final budget for 2002 is prepared, the 2003 budget revised if necessary and the 2004 budget prepared; and so on
sector-wide approach
a mechanism for collecting funds to support a health policy and expenditure programme that is implemented and managed by the government through a common approach across the health sector: the aim is to increase the coordination and efficiency of development aid and prompt beneficiary governments to take the leadership in strategy formulation and policy implementation
social health insurance
a mandatory health insurance (see above), to which only certain groups are legally required to subscribe or which provides benefits only to those who make insurance contributions
technical efficiency
a measure of the maximum number of health services that can be provided within a specific budget or a measure of the lowest cost needed for each health service to function without compromising quality of care (see allocative efficiency, above)
top-up voluntary health insurance
a voluntary health insurance scheme that covers the costs of services not funded from tax revenue or not covered by a mandatory insurance scheme providing a specified package of health services that is not comprehensive
universal coverage
a health system that provides all citizens with adequate health care, regardless of their employment status or any other factors
user fee a fee charged at the place and time of service use within a public health facility and paid on an out-of-pocket basis (see above)
value added tax a form of indirect tax applied to the value added at each stage a manufactured product goes through, from production to sale: it differs from the general sales tax (see above), which is levied on the total value of the product
voluntary health insurance
a health insurance, to which an individual or group can subscribe without a legal requirement to do so
xiii
Executive summary
Health care financing is once again prominent on the global health policy agenda. The difficulty that low- and middle-income countries have in providing for the health care needs of their populations remains a major problem. At the same time, the current focus on poverty reduction, as reflected in the Millennium Development Goals (MDGs) and other international initiatives, has spurred a growing emphasis on the need for health care financing mechanisms that protect the populations of these countries from the potentially impoverishing effects of health care costs.
This report reviews health care financing in low- and middle-income countries as it relates to three main functions:
• Revenue collection, which concerns the sources of funds, their structure, and the means by which they are collected.
• Pooling of funds, which addresses: the unpredictability of illness, particularly at the individual level; the inability of individuals to mobilize sufficient resources to cover unexpected health care costs; and, consequently, the need to spread health risks over as broad a population group and period of time as possible.
• Purchasing, which transfers pooled resources to health service providers so that appropriate and efficient services are available to the population.
Enormous challenges face low- and middle-income countries confronted with the need to improve or replace their existing health care financing system. Yet, several countries with limited financial resources have managed to improve the health of their populations by introducing innovative health care financing mechanisms and health care provision, as well as by encouraging health-fostering interventions that take place, or stem from, outside the health system. By improving revenue collection, risk pooling and purchasing and by learning from the experience of other low- and middle-income countries and adapting it to their own circumstances, all resource-poor countries can improve their health care financing systems and make them more equitable, efficient and sustainable.
Examples of “best practice” could be highly instructive but, regrettably, there is a paucity of success stories. Indeed, there is real scope for future research to document how these health care financing functions actually operate in countries. Two countries, for example, Costa Rica and Sri Lanka, are widely regarded as having been successful in setting up and implementing these functions. This report highlights some of the factors that have contributed to the success. However, a deeper study identifying additional factors would be an enlightening exercise.
A few “take-home messages” emerge from this review of international experience and current thinking:
• Every effort should be made to achieve universal health care coverage – defined as a system that provides all citizens with adequate health care at an affordable cost – by a prepayment financing mechanism.
• A health care financing mechanism should provide sufficient financial protection, so that no household is impoverished because of a need to use health services. One way of providing such protection is by incorporating a risk-sharing plan in the

xiv
health care financing mechanism, whereby unexpected health care expenditure does not fall solely on an individual or household.
• These first two objectives imply a need for strong cross-subsidies within the health system, both in terms of income (cross-subsidies from the wealthy to the poor) and of risk of requiring health care (cross-subsidies from the healthy, or low-risk, to the ill, or high-risk, individuals).
• The need for cross-subsidies implies in turn that prepayment funding mechanisms, whereby people contribute regularly to health costs in the form of tax payments and/or health insurance contributions, should be at the core of health financing.
• Progressive (or equitable) contribution mechanisms involving income cross-subsidies should be preferred to regressive (or inequitable) mechanisms.
• Health care benefit packages covering the major causes of ill-health should be encouraged, since they ensure that those in need derive optimal benefit from health services and receive value for the money spent on these services.
• Cross-subsidies should be adopted on a system-wide basis and focused not only on who contributes how much to funding the health care system but also on how the funds are pooled and how and what services are purchased for whose benefit.
• A system-wide approach for cross-subsidies means that a health care financing mechanism should not be considered in isolation but rather in relation to how it can contribute to cross-subsidies in the overall health system.
• The emphasis should be increasingly on integrated financing mechanisms: fragmentation of financing mechanisms reduces the potential for cross-subsidies.

Chap
ter 11 Introduction
Health care financing is once again prominent on the global health policy agenda. Over the last few years, several books have been written on the subject (Dror and Preker, 2002; Gottret and Scheiber, 2006; Preker and Carrin, 2004); resolutions have been adopted by multilateral organizations (World Health Organization, 2005b); and numerous conferences and workshops have been held on the topic. Several factors are fuelling this resurgence of interest. The difficulty that low- and middle-income countries have in providing for the health care needs of their populations remains a major problem. Moreover, the so-called "health care financing gap" has been spotlighted by the MDGs, as have the escalating burden of ill-health related to the AIDS epidemic, particularly in Africa and Asia, and a growing prevalence of non-communicable diseases in some low- and middle-income countries. There is a race against time to achieve the MDGs by the 2015 deadline. The socio-economic development issues enshrined in the MDGs are likely to facilitate the attainment not only of the poverty-related MDGs but, given the social determinants of health, also of the health-related MDGs. Health systems could certainly play a critical role in this process but to do so they need adequate funding and good management (Freedman et al., 2005).
Part of the revival of interest in health care financing is due to the realization that new mechanisms are required that go beyond conventional wisdom. In the 1980s and 1990s, cost-recovery or cost-sharing systems that called for contributions from users of public sector facilities, primarily through direct out-of-pocket payments or user fees, were much in the public eye (Akin et al., 1987). However, in recent years, the consensus has grown that prepayment health care financing, whereby people contribute regularly to the cost of health care through tax payments and/or health insurance contributions, provides greater financial protection to households than – and is, therefore, preferable to – out-of-pocket health care financing (Preker and Carrin, 2004; World Health Organization, 2000; World Health Organization, 2005a).
This report highlights the issues that should be taken into account when changing a health care financing system. Its conclusions are based on the experience of low- and middle-income countries, particularly in Africa, Asia, Latin America and the Caribbean, and also, where relevant, on the experience of high-income countries. It seeks to identify “best practice”, i.e. what has worked well in the different countries. However, detailed examples of best practice are hard to come by. It is not so easy to determine just why a given health care financing strategy works well and has produced a health system that can, to all intents and purposes, be regarded as successful. One reason for this difficulty is that problems in health systems generally overshadow so-called "success stories". To some extent, this report follows the trend: in order to signpost avoidable mistakes that may be made in changing health systems or health financing systems, this report seeks
Prepayment health care financing, whereby people
contribute regularly to the cost of health care through
tax payments and/or health insurance contributions,
provides greater financial protection to households
than – and is, therefore, preferable to – out-of-pocket
health care financing.

2 Health care financing in low- and middle-income countries
to pinpoint problems that are repeatedly found in health systems around the world. To quote a Russian proverb, “the wise learn from others’ mistakes; fools learn from their own”.
There is no “one-size-fits-all” solution. Best practices are not the answer for every country. A strategy that works well in one country may not work well in another. What changes can be made in a country’s health care financing system, the pace at which they can be made and the effects of the changes will depend on the characteristics of the previous system and on the country’s macro-economic, social and political setting. This report attempts to provide guidance on possible approaches to adopt and pitfalls to avoid.
2 Main mechanisms of health care financing
Government fundingGovernment funds are generally derived from taxes, including direct taxes, levied on personal and company income, and indirect taxes, such as value added tax and customs duties. Government funds may also accrue from deficit financing, whereby domestic or international loans are secured to fund government activities over and above those funded from general tax revenue alone. Donor funding, from bilateral or multilateral international organizations, may take the form of loans, which have to be repaid along with interest charges, or of aid grants, which do not have to be repaid.
Health insuranceThere are several types of health insurance. Mandatory Health Insurance (NHI) is an insurance system that the law requires certain population groups or the entire population to adhere to, in contrast to voluntary health insurance, which carries no such legal requirement.
Mandatory health insuranceMandatory health insurance is often called "social health insurance" (SHI), especially if only certain groups are legally required to become members or if only those who make insurance contributions are entitled to coverage. NHI is also a form of mandatory health insurance but one that covers the entire population, including individuals who have not personally contributed to the scheme. The terms "social health insurance" and "national health insurance" are often used interchangeably but the more inclusive term "mandatory insurance" will be used for either form in this report. Mandatory health insurance is based on the principle of social solidarity. Contributions are “community-rated”, i.e. based on the average expected cost of health service use by the entire insured group and not by that of an individual or sub-group. Contributions can also be tailored to income level and, in some cases, to the number of dependents covered by the scheme. There may be a single insurance fund or several insurance funds. Where there are several funds, a standardized, prescribed minimum benefit package is usually specified in the enabling legislation and a mechanism is put in place for sharing risks among the different funds.
Sometimes it is difficult to distinguish between income tax funding and mandatory insurance, as both are collected through payroll deductions. As Normand (1999) writes, “social [mandatory] insurance is distinguished from government finance by the presence of an independent or quasi-independent insurance fund, clear separation of insurance contributions from tax for most contributors and defined rights for insured people”. He further notes that these rights create a sense of entitlement: “The expectations of patients are that membership of the insurance scheme gives them rights and makes them customers of the health care providers”.
Voluntary health insuranceAlso called "private health insurance", voluntary insurance has historically been the preserve of higher-income groups. It is frequently employment-based, i.e. company
Chap
ter 2

4 Health care financing in low- and middle-income countries
employees join a health insurance scheme and contributions to the scheme are shared between employees and employers, although membership may be open to anyone who chooses to contribute. In the case of insurance schemes run on a for-profit basis by commercial companies, contributions tend to be risk-rated, i.e. adjusted according to the anticipated cost of service use (e.g. the elderly and people with chronic conditions would pay a larger contribution than people likely to require fewer and less costly services). However, some private voluntary insurance schemes charge community-rated contributions, often because of a legal requirement to do so.
A form of voluntary health insurance that in recent years has become widespread in Africa and Asia is community-based health insurance (CBHI), sometimes called "mutual health insurance", "community-based prepayment schemes", "community health funds" or "micro-insurance" (Bennett et al., 1998). These schemes exist within localized communities, most often in rural areas: members make small payments to the scheme, often annually and after harvest time, and the scheme covers the fees charged by local health services.
Out-of-pocket paymentsOut-of-pocket payments are direct payments made by a patient to a health care provider, i.e. funds are not channelled via any financing intermediary. User fees paid directly to public health facilities are a form of out-of-pocket payment. Another form of out-of-pocket payment consists of co-payments made by members of a health insurance scheme, which reimburses only a portion of the cost of a health service paid by the members. Finally, out-of-pocket payments are also made to private providers by individuals not covered by any form of health insurance.

Chap
ter 33 Assessing financing mechanisms
Health care financing mechanisms are frequently judged on the basis of the extent to which they are feasible, equitable, efficient and sustainable. These criteria, which are explained briefly in the following paragraphs, are used in the analysis of health care financing presented in the main section of this report. They are also used to identify financing mechanisms that exemplify “best practice”.
FeasibilityFeasibility, often overlooked in assessing financing mechanisms, raises critical questions: Are stakeholders likely to support or to oppose a given financing mechanism? Is there adequate administrative capacity (e.g. actuarial expertise, information systems, etc.) to ensure its successful implementation?
EquityThe concept of equity is still a much-debated subject. There is, however, general agreement that individuals should contribute to health care funding according to their ability to pay and should benefit from health services according to their need for care (Wagstaff and Van Doorslaer, 1993). An equitable health care financing system will, therefore, involve cross-subsidies from the rich to the poor and from the healthy to the ill. These cross-subsidies ensure that no household is impoverished by its need for health services and that an unexpected health care cost does not fall solely on an individual or a household.
Debate centres on how the principle of “contributing according to ability to pay” should be interpreted. It is clear that any health care scheme should, as far as possible, avoid regressive financing mechanisms, whereby low-income groups contribute a higher percentage of their income to health care than high-income groups. However, it is not immediately clear whether it is preferable to have a proportional system, whereby everyone contributes the same percentage of income to health care funding (although the wealthy will obviously pay more in absolute terms), or a progressive system, whereby high-income groups contribute a higher percentage of their income than low-income groups. For countries with a substantial degree of income inequality, as is the case in many low- and middle-income countries (see Gini Index in Appendix B), there is a strong case for progressive health care financing. Indeed, progressively funded social services are considered central to redistributive policy in low- and middle-income countries (Mkandawire, 2005; Squire, 1993). Although a proportional, or even mildly regressive, health care financing system would help to reduce inequalities in such countries, this review favours progressive funding mechanisms as a means of achieving an equitable financing system, i.e. a system whereby individuals contribute according to their ability to pay.
Individuals should contribute to health care funding
according to their ability to pay and should benefit
from health services according to their need for
care.

6 Health care financing in low- and middle-income countries
Efficiency An efficient financing mechanism is one that generates a relatively large amount of funding and thus obviates the need for multiple funding mechanisms, with each generating only a limited amount of funds. In addition, the costs of fund collection and administration will be low with an efficient financing mechanism, leaving as much revenue as possible for actual health service provision (Hoare and Mills, 1986).
An important point is the extent to which a health care financing mechanism fosters both allocative efficiency (“doing the right thing”) and technical efficiency (“doing it the right way”) in the use of resources.
Allocative efficiency refers to the allocation of resources among different levels of care, e.g. tertiary (hospital) care vs. primary health care, and among services dealing with different areas of care, e.g. tuberculosis, immunization, hypertension, and so on. “Doing the right thing” through allocative efficiency means allocating resources to those services dealing with the heaviest burden of ill-health in the community for which effective interventions exist and, within those services, giving priority to the most cost-effective interventions, i.e. interventions offering the lowest cost per unit of health outcome (quality-adjusted life year, for example).
“Doing it the right way” through technical efficiency means providing resources to the maximum number of fundable services and minimizing the cost of each service without compromising quality of care (Donaldson and Gerard, 1993).
SustainabilityThe sustainability of a financing mechanism refers mainly to its long-term stability and potential for generating revenue. If the revenue generated by a financing mechanism is subject to considerable and frequent fluctuations, the mechanism cannot be regarded as reliable and is likely to be replaced by financing mechanisms that are more predictable in the medium to long term. Sustainability also relates to the ability of a financing mechanism both to maintain its level of funding in the long term and to expand its level of funding over time as the need for health care grows (McPake and Kutzin, 1997). Sustainability implies ongoing long-term, purposeful planning for gradual increases in domestic funding for health services. For example, the GAVI Alliance (formerly known as the Global Alliance for Vaccines and Immunisation) provides donor funds to enable or help a country to initiate or expand an immunization programme but requires the country to develop a plan, signed by the ministry of finance, to gradually increase domestic funding of the programme in order to ensure its sustainability (see www.gavialliance.org).

Chap
ter 44 Key functions of health care financing
Discussion about health care financing has in the past tended to degenerate into controversy over ideology and definitions. For example, there have been heated debates in some countries about whether a tax-funded national health service is better than a universal system funded through mandatory health insurance, but arguments one way or another have offered little or no technical substantiation or empirical evidence.
This analysis uses a framework for assessing health care financing mechanisms that has been widely adopted. It was used by the World Health Organization (WHO) in its evaluation of the world’s health systems (World Health Organization, 2000) and more recently by the World Bank (Gottret and Scheiber, 2006). The framework is based on the key functions that a financing mechanism must perform to be accepted as a candidate for adoption by a country or community (Kutzin, 2001; World Health Organization, 2000). It is hoped that such a framework, grounded as it is on solid operational principles, will help to dispel much of the contentiousness of past debate, which has tended to revolve around abstract concepts. More importantly, it should allow any country to judge whether and to what extent its current system or a proposed future system fulfils the essential functions of a good financial mechanism and to what extent it can be adapted to, or integrated into, the country’s specific context.
The key health care financing functions that this report focuses on are:
• Revenue collection, which concerns the sources of funds, their structure and the means by which they are collected.
• Pooling of funds, which addresses: the unpredictability of illness, particularly at the individual level; the inability of individuals to mobilize sufficient resources to cover unexpected health care costs; and, consequently, the need to spread health risks over as broad a population group and period of time as possible.
• Purchasing, which covers the transfer of pooled resources to health service providers in such a way that appropriate and efficient services are available to the population.
This analysis is structured around these key functions: revenue collection, pooling and purchasing. For each function, the reader is given:
• a description of the key issues;
• an overview of available options, drawing on the international health care financing literature;
• country case studies from Africa, Asia, Latin America and the Caribbean, reflect a range of experiences and, where possible, present examples of best practice.
All issues relating to financing mechanisms, such as general tax funding, donor funding, mandatory insurance and so on, will be dealt with in this report as they relate to revenue collection, pooling and purchasing. This contrasts with most other published reviews of
Discussion about health care financing has in
the past tended to degenerate into controversy
over ideology and definitions. (...) [The proposed]
framework, grounded as it is on solid operational
principles, (...) should allow any country to judge
whether and to what extent its current system or a
proposed future system fulfils the essential functions
of a good financial mechanism (...).

Health care financing in low- and middle-income countries8
health care financing, which discuss each issue (tax funding, donor funding, etc.) in a separate “water-tight” section. The aim of this analysis is to focus the reader’s attention primarily on the key functions in order to facilitate broad policy discussions about revenue collection, pooling
and purchasing rather than, say, on the advantages and disadvantages of government tax funding versus mandatory insurance. This approach should, it is hoped, foster innovative thinking about the choice and design of financing systems best suited to individual country contexts.
An account of the different options available for implementing each of the three functions is based on an extensive review of the literature, which included electronic searches of peer-reviewed journal articles, particularly those published in the last 10 years, using Academic Search Premier, CINAHL, EconLit, Health Source, MEDLINE, Science Citation Index and Social Sciences Citation Index. The literature review also covered publications identified on web sites, including those of WHO (www.who.int/health_financing/en/), the World Bank (www.worldbank.org/), Partnerships for Health Reform (www.phrplus.org), id21 (www.id21.org/health/index.html) and ELDIS (www.eldis.org/healthsystems/financing/).
For case studies, preference was given to countries that could provide examples of best practice or success stories. One indicator, or criterion, used to identify such a country was the attainment of an excellent health status of the population despite relatively limited economic resources. Countries or areas most frequently referred to in the literature as meeting this criterion include Costa Rica, Sri Lanka and the Indian state of Kerala (Birdsall and Hecht, 1995). Of course, a country’s health care financing mechanisms and other aspects of its health system may not be the only factors responsible for health status achievements. Other possible factors are discussed in the presentation of the case studies. In addition to these high-performing countries, other countries that have developed innovative approaches – even if they have not been entirely successful – have also been used as case studies. For such countries, “success” means meeting the criteria used to judge a health care financing mechanism, namely, feasibility, equity, efficiency and sustainability. To cover regional variability of country characteristics, examples pertaining to each of the three key health care financing functions were taken from Africa, Asia, Latin America and the Caribbean.
Revenue collectionRevenue collection concerns the sources of health care funding contributions, the way these contributions are structured and the entity or organization chosen to collect them.
More specifically:
• with regard to sources of funds, the main issue is the balance between external and domestic sources and, within domestic sources, between commercial companies (or employers) and individuals (or households);
• with regard to contribution mechanisms, the main issues are the way in which
The aim of this analysis is to focus the reader’s
attention primarily on the key functions in order to
facilitate broad policy discussions about revenue
collection, pooling and purchasing.

Chapter 4 – Key functions of health care financing 9
contributions are structured and the extent to which they are, or are not, equitable (i.e. their progressivity or regressivity);
• with regard to type of collecting organization, this could, for example, be the government, a parastatal or private organization, and, if a private organization, for-profit or not-for-profit.
Sources of fundsWithin any country, all domestic funding for health care ultimately comes – whether through general tax payments, health insurance or direct out-of-pocket payments – from two main sources: companies and households (or individuals).
The ratio of funding from companies to funding from households is important and is influenced by many factors.
For example, the extent to which a general tax burden can be imposed on companies depends, among other things, on the size of the formal sector (from which taxes can be more easily levied than from the informal sector) and the extent to which the government wishes to encourage business investment. Similarly, the poverty level and the distribution of income among the population influence the size of the tax burden that can be borne by households.
The ability of companies and households to make health insurance contributions is influenced by similar factors, which impose even greater constraints than for general taxes. If a government is considering introducing a mandatory health insurance scheme, it must determine whether companies and households can bear this financial burden in addition to the tax burden. This constraint will always be present unless tax rates are reduced to compensate for the burden of health insurance contributions.
A fundamental question is whether certain companies and/or households should be exempted, either fully or partially, from contributing to the health scheme. In the case of income tax, partial exemption generally takes the form of deductions from taxable income or of an income threshold below which individuals do not have to pay tax. A similar approach can be used for mandatory health insurance contributions, with clear guidelines given about which firms are expected to contribute, the cut-off level being linked, say, to the number of employees or size (in net worth, for example) of the company. For voluntary private health insurance, those who cannot or do not wish to contribute are automatically excluded.
The question of exemption is less clear-cut in the case of direct out-of-pocket payments and community-based health insurance (CBHI). The consensus is that certain individuals should be protected from user fees and other forms of out-of-pocket payments (Bitrán and Giedion, 2003; Newbrander et al., 2000). Extending CBHI to the poorest in the community through a system of fully or partially subsidized membership is also gaining acceptance (Bennett et al., 1998). However, the challenge in implementing user fee exemption and subsidized CBHI is how to identify those who should benefit
A fundamental question is whether certain companies
and/or households should be exempted, either fully or
partially, from contributing to the health scheme.
Extending community-based health insurance to
the poorest in the community through a system
of fully or partially subsidized membership is (...)
gaining acceptance.

Health care financing in low- and middle-income countries10
from these devices. There are several ways of determining the socio-economic status of individuals for the purpose of applying or withholding exemptions (see Appendix A).
Another important issue for low- and middle-income countries is the balance between domestic and external resources for health care funding. Many low- and middle-income countries could not even begin to meet the health care needs of their populations without substantial external support (World Health Organization, 2001). The reliance of these countries on donor funding (see Appendix B) raises concerns about the long-term stability and sustainability of such funding (McIntyre, Gilson and Mutyambizi, 2005).
Contribution mechanismsIn deciding how contributions to health care financing should be made, there are two options: an out-of-pocket mechanism, whereby the user pays a fee or a charge at the time of receiving the health care service, or a prepayment mechanism, whereby the user contributes to the financing of health care through regular social health insurance or tax payments or through a mix of prepayment mechanisms. In the 1980s and 1990s, the international financing institutions (IFIs) argued strongly in favour of out-of-pocket payments for low- and middle-income countries (Akin et al., 1987). The current consensus is now overwhelmingly in favour of prepayment mechanisms (Claeson et al.,
2001; Kutzin, 2001; World Health Organization, 2005a). This consensus has coalesced from growing evidence of the impoverishing effects of out-of-pocket payments combined with increasingly widespread attention on poverty
issues: two examples are the Poverty Reduction Strategy Papers in Heavily Indebted Poor Countries and the MDGs.
There is now considerable evidence that user fees and other out-of-pocket payments are the least progressive form of health care financing. Out-of-pocket payments have been shown to be regressive in all high-income countries for which data are available (Van Doorslaer and Wagstaff, 1993; Wagstaff et al., 1999). However, recent studies in low- and middle-income countries have found that out-of-pocket payments can be progressive in these countries if the lowest-income groups use the health services only rarely or not at all (EQUITAP, 2005). The term "progressive" in this context can be misleading, as it refers to equitable financing but inequitable delivery of health care: where everyone is expected to pay on an out-of-pocket basis, high-income groups certainly bear the burden of payment, but they are the only beneficiaries of the services. Because of the heavy financial burden that direct payments can impose on many households in low- and middle-income countries (Whitehead et al., 2001; Xu et al., 2003) some households try to avoid seeking care but in so doing may ultimately incur even higher costs if the illness becomes severe and requires expensive health care. Those who need care but do not have ready cash may have to borrow from family, friends or other sources,
possibly at high interest rates, or sell assets, such as livestock, thereby jeopardizing the livelihood of the household (McIntyre et al., 2005; Russell, 2004). According to a recent WHO estimate, every year some 100 million people become
The current consensus is now overwhelmingly in
favour of prepayment mechanisms.
There is now considerable evidence that user fees
and other out-of-pocket payments are the least
progressive form of health care financing.

Chapter 4 – Key functions of health care financing 11
impoverished and a further 150 million face severe financial hardship as a result of health care payments (World Health Organization, 2005a).
Although the revenue generated by user fees may represent only a small proportion of total recurrent public sector expenditure, they can be an important source of funding for an individual health facility. By ensuring a reliable supply of medicines and/or by supplementing staff salaries, they can help to improve the quality of care provided (Nolan and Turbat, 1995). It is also argued that user fees deter unnecessary or excessive use of health services and that if user fees are adjusted according to type of health facility, they can encourage patients to follow an appropriate referral route (Akin et al., 1987; de Ferranti, 1985).
Prompted by growing awareness of the potentially drastic effects of out-of-pocket payments on households, combined with the current emphasis on poverty reduction, several countries, including South Africa, Uganda and Zambia, have removed some or all user fees charged at public health facilities (see Box 1 overleaf). It is clear that such a move cannot be implemented overnight and that alternative funds must be sought to avoid compromising quality of care (Gilson and McIntyre, 2005). Nevertheless, there is a clear movement in favour of prepayment mechanisms – a movement strengthened by the 2005 World Health Assembly resolution encouraging the organization’s Member States to favour social and other forms of health insurance (World Health Organization, 2005b). In the light of this movement, the remainder of the present report will focus primarily on prepayment funding mechanisms. However, since some forms of out-of-pocket payment for health care will continue in most countries, ways of reducing the frequency or severity of their adverse consequences are described in Appendix A.
The two main forms of prepayment funding are tax revenue and health insurance. Several variations and combinations of both exist today among different countries, each offering a specific configuration of advantages, such as equity and sustainability.
General tax revenue
In most cases, tax revenue takes the form either of direct income tax levied on companies and individuals or indirect taxes levied on goods and services, such as value added tax (VAT), general sales tax (GST) and excise and import duties. Income taxes tend to have a progressive structure, with higher-income groups taxed at a higher rate. Some countries, however, such as Denmark and Sweden, have a proportional, or near-proportional, local income tax structure, with the same tax rate for everyone (Wagstaff et al., 1999). How income tax exemptions and deductions are structured also affects the relative progressivity of income taxes. Overall direct income taxes have been found to be progressive in all member countries of the Organisation for Economic Co-operation and Development (OECD) for which the results of tax system analyses are
According to a recent WHO estimate, every year
some 100 million people become impoverished and
a further 150 million face severe financial hardship
as a result of health care payments.
The clear movement in favour of prepayment
mechanisms (...) has been strengthened by the 2005
World Health Assembly resolution encouraging the
organization’s Member States to favour social and
other forms of health insurance.

Health care financing in low- and middle-income countries12
Box 1: Case study: removal of user fees in Uganda
Uganda introduced user fees on a nationwide basis in 1993. Although revenue from user fees was relatively low (generally less than 5% of health care expenditure), it was an important source of funds for supplementing health workers’ salaries, maintaining health facilities, and purchasing additional drugs. However, the use of health care services declined dramatically and there were growing concerns about the impact of user fees on the 46% of the Ugandan population who live on less than US$ 1 per day.
In March 2001, user fees were abolished at public sector facilities, except for patients in private wards. There was an immediate, dramatic surge in the use of health services. One study of 78 health facilities in 10 districts compared data for eight months before and 12 months after the removal of fees and found that the mean monthly number of new visits had increased by 53% and repeat visits by 24%. Two years after the abolition of fees, use of services had increased by 77%.
An extensive study using the first and second Ugandan National Household Surveys conducted in 1999–2000 and 2002–2003, respectively, and data from the Health Management Information System showed that the poor in particular had benefited from removal of the fees. Although the incidence of illness reported over the 30 days before the survey remained at just under 30% in the two surveys, the percentage of ill people seeking professional care increased from 69% to 79% and the duration of inability to work as a result of illness declined from an average of 8.3 to 7 days per person. In addition, only 30% of people who did not seek care cited the cost of the health care as the reason in 2002–2003 vs. 50% in 1999–2000. The poor showed the greatest benefit from abolition of fees: the use of health services by individuals in the poorest quintile of the population increased from 58% to 70% vs. an increase from 80% to 85% for those in the richest quintile.
A number of studies have suggested that the sustained increases in the use of health services and the positive outcomes of these increases – a rise, for example, in national immunization coverage from 41% in 1999–2000 to 84% in 2002–2003 – could not have been achieved without an influx of funding for public sector health services. Of particular importance was the proactive provision of a US$ 5.5 million buffer fund by the Ministry of Health (MoH) to offset the potential shortage of drugs likely to result from loss of fee revenue combined with increased service use. In addition, the move away from donor funds for projects to donor sector-wide approach (SWAp) support to the MoH doubled the Ministry budget in real terms between 1999–2000 and 2002–2003. The Ministry controls the allocation of SWAp resources and has directed additional resources preferentially to primary health care services, with district budgets increasing seven-fold on average since 1999–2000. Thus, the removal of user fees combined with increased government funding contributed to the positive changes in patterns of health service use.
Fee removal, however, also had negative effects. A decline occurred in staff morale, related to the fact that revenue from user fees had previously been used to supplement staff salaries and also to the fact that workload increased by about 47%. In some instances, users of public health services had to pay informal or “under-the-table” fees to enable

Chapter 4 – Key functions of health care financing 13
health workers to maintain their previous income levels. In addition, despite increased public funding of health services, drug stock-outs occurred, forcing public sector services to purchase prescribed medicine from private outlets. As a result of informal fees and informal payments for medicines, the incidence of catastrophic health care payments by the poor did not decline dramatically following the removal of user fees. Moreover, health workers and members of health facility management committees also noted a decline in the maintenance, including the cleanliness, of health facilities. Overall, access to health care has undoubtedly improved, particularly for the poorest groups. However, further efforts are required to address the problems posed by informal fees and a fall in staff morale. Fee removal clearly calls for careful planning, adequate resources and a good relationship with front-line health workers (see Gilson and McIntyre, 2005, for a more detailed discussion of these issues).
Sources: Burnham et al., 2004; Deininger and Mpuga, 2004; Kipp et al., 2001; Xu et al., 2006; Yates, 2004
available (Van Doorslaer and Wagstaff, 1993; Wagstaff et al., 1999). Direct income tax is generally much more progressive in low- and middle-income countries than in high-income countries, given that these taxes are often paid almost exclusively by the highest-income groups. A study of Asian countries found that some poorer countries, including Bangladesh, Philippines, Sri Lanka and Thailand, have the most progressive direct taxation (EQUITAP, 2005).
Indirect taxes are nearly always regressive in high-income countries (Wagstaff et al., 1999). Where VAT or GST is the main indirect tax, taxation is very regressive. Only where high tax rates are applied to luxury goods are overall indirect taxes progressive in high-income countries (Van Doorslaer and Wagstaff, 1993). VAT or GST is regressive because it is levied as a flat rate (e.g. 15% on all goods and services), so that poorer households pay a higher proportion of their income than richer households, which are more able to save some of their income. In low- and middle-income countries, indirect taxes may be proportional, as they are, for example, in China, Indonesia, Philippines, Republic of Korea, Sri Lanka and Taiwan, or slightly progressive, as in Bangladesh, Hong Kong, Nepal and Thailand (EQUITAP, 2005). One reason why indirect taxes are not regressive in such countries is that in low- and middle-income countries basic foodstuffs are often exempt from VAT or GST, or poor households subsist on home-grown crops or food purchased in local, informal markets that are beyond the reach of VAT or GST. However, even where indirect taxes are progressive, they are much less so than direct taxes.
The relative progressivity of general tax revenue as a whole is related to the mix of direct and indirect taxes and to the progressivity of each form of taxation.
Overall tax revenue will be less progressive, and may even be regressive, where indirect taxes account for a high proportion of tax revenue. For example, Italy had regressive general tax revenue in 1987, partly due to the fact that its indirect taxes were very regressive and accounted for 54% of total tax revenue and that its direct taxes were only mildly progressive (Van Doorslaer and Wagstaff, 1993).

Health care financing in low- and middle-income countries14
Since general taxation is in many countries the most progressive prepayment mechanism for health care financing, low- and middle-income countries may be well advised to increase this source of revenue where government funding of health services is limited. Much recent discussion has focused on what is termed “fiscal space” for increasing tax funding and, sometimes, donor funding of health care. Fiscal space has been defined as “the availability of budgetary room that allows a government to provide resources for a desired purpose without any prejudice to the sustainability of [that] government’s financial position” (Heller, 2005). The major factors influencing fiscal space in relation to health services include (Hay, 2003):
• Gross Domestic Product (GDP) per capita;
• share of GDP devoted to government spending;
• proportion of total government spending that goes on health services.
These factors are related to the size of a country’s economy, its economic growth rate, the priority the government accords to the health sector relative to other sectors, the government’s debt obligations, and the size of the government sector relative to the rest of the economy (which is, in turn, influenced by the amount of tax revenue generated and the ability of the government to secure loans or grants). In general, tax revenue and the proportion of economic resources devoted to government spending increase as the economy grows. For example, in 2004, government expenditure accounted for 28.9% of GDP in high-income countries (and 38.6% in European Monetary Union countries) but for only 15.5% in low-income countries (World Bank, 2005a). Economic growth rates have certainly improved in recent years: low- and middle-income countries achieved a 7.1% rise in GDP in 2004 (World Bank, 2005a). Between 1990 and 2003, growth of GDP per capita in middle-income countries was running at an annual average of 2.5%, compared with 1.8% in high-income countries and only 0.1% in low-income countries (ranging from -6.3% in the Democratic Republic of Congo to +5.9% in Vietnam) (UNDP, 2005).
Waiting for the effects of slow economic growth to filter down to tax revenue is too passive an approach, given the urgent need for additional health care resources in many low- and middle-income countries. Are there more active ways of increasing tax revenue? A few low- and middle-income countries have relatively low tax rates but most have rates comparable to those in higher-income countries: with the highest marginal income tax rate within the 20-40% range, there is little room for increases in tax rates (World Bank, 2005b). There may be scope for introducing a wider range of wealth taxes in low- and middle-income countries that might include taxes on financial transaction flows, luxury airline travel, currency exchanges and so on (Bond, 2006). Some countries have introduced a new tax dedicated specifically to raising funds for health. For example, Ghana has increased its VAT by 2.5% and the additional revenue contributes to the funding of its recently introduced NHI system (Government of Ghana, 2003). Another example is the introduction of a 3% levy on top of existing personal and company income taxes in order to fund AIDS interventions in Zimbabwe.
Dedicated or earmarked taxes may elicit greater willingness to pay taxes and thus improve compliance: revenue is devoted entirely to health services (Buchanan, 1963). A

Chapter 4 – Key functions of health care financing 15
major drawback of dedicated taxes, however, is their tendency to displace funding from general tax revenue (Zschock, 1979). Frequently, the entire revenue generated through the dedicated tax is offset by an equivalent reduction in the general tax-funded proportion of the budget allocation to the health sector. Dedicated taxes are generally not favoured by central treasuries, since a separate “health fund” can hamper budget flexibility to respond to changing public priorities and macro-economic circumstances (Jones and Duncan, 1995).
Tax revenue can be increased not only by raising tax rates or introducing additional taxes but also by proactive measures, such as improving tax collection and limiting allowable deductions on income tax returns. One form of tax deduction, whose legitimacy is highly questionable, is that of contributions to private voluntary health insurance schemes. Proponents of such deductions argue that they make private health insurance affordable by a greater proportion of the population. This is seen as beneficial to government, as the insured population will no longer be dependent on publicly funded health services and limited government resources can then be devoted to population groups who are dependent on government services. However, the amount of tax revenue lost as a result of making health insurance contributions tax-deductible can exceed the general tax revenue that would be devoted to direct public provision of health care for this group (see Box 2 overleaf). Hence, a policy of distributing scarce tax resources to subsidize the purchase of private health insurance for the wealthiest in society is open to serious criticism. Removing this tax deductibility can result in substantial increases in tax revenue in countries, mainly in the middle- and high-income range, with a fairly sizeable private health insurance sector.
Most low- and middle-income countries cannot increase government spending without increasing tax revenue, especially if they are already operating on a deficit budget. However, even if they cannot increase tax revenue or can do so only marginally or for the short term, most of them can increase the percentage of total government revenue allocated to the health sector. The table in Appendix B indicates that government spending on health frequently accounts for more than 15% or well above 10% of total government spending in most high-income countries but in most low- and middle-income countries is frequently below 10%. Moreover, these percentages are taken from the WHO National Health Accounts database, which includes donor funds used by the government for its expenditure on health care. Thus, the proportion of government expenditure devoted to health care is clearly overstated in the case of low- and middle-income countries that receive substantial donor funding.
The proportion of total government spending allocated to the health sector is particularly low in African countries. Confronted with the triple burden of HIV/AIDS, tuberculosis and malaria, African heads of state committed themselves at a meeting in Abuja in 2001 to devote at least 15% of government expenditure to health care (OAU, 2001). Progress in meeting this commitment has been limited to date (McIntyre et al., 2005), but
Dedicated or earmarked taxes may elicit greater
willingness to pay taxes and thus improve compliance:
revenue is devoted entirely to health services.
A policy of distributing scarce tax resources to
subsidize the purchase of private health insurance for
the wealthiest in society is open to serious criticism.

Health care financing in low- and middle-income countries16
Box 2: Implications of private health insurance for tax revenue in South Africa
At present, private voluntary health insurance organizations, or medical schemes, which cover less than 15% of the population, account for almost half of total health care spending in South Africa. Over the past two decades, there have been very rapid increases in spending by these medical schemes and hence in contribution rates. In most years, medical scheme contribution rates have increased by two- to threefold more than the overall rate of inflation (consumer price index). This cost spiral has reached a point where medical scheme membership is declining, both as a percentage of the population and in some years in absolute numbers: an increasing number of South Africans simply cannot afford to purchase medical scheme coverage.
The government subsidizes the cost of medical scheme coverage by allowing at least part of the contributions to be tax-deductible. The highest-income earners, who are taxed at the highest rates, derive the greatest benefit from this subsidy. The total value of the subsidy amounted to an estimated ZAR 10.1 billion in 2005, equivalent to over 20% of the government health budget. The South African Government is thus losing more tax revenue through the tax deductibility of medical scheme contributions than it would spend on providing health care through public facilities to those who are currently covered by medical schemes.
Limited general tax resources are also used to purchase medical scheme coverage for civil servants and their dependents, who account for over a quarter of all medical scheme members. In the late 1990s, the South African Government was spending twelve times as much per person per year on subsidizing civil servants’ contributions to medical schemes as it was on funding public-sector health care per person per year.
Sources: McIntyre and Doherty, 2004; McIntyre et al., 2006; McIntyre, McLeod and Thiede, 2005; McLeod, 2005
ministers of health attending a recent African Union Conference committed themselves to working with their counterparts in ministries of finance and/or economic development in giving “greater urgency to the Abuja target of allocating 15% of national budgets to health” (AU, 2006).
Military spending and debt servicing are the two areas of current government expenditure that tend to take the lion’s share of the fiscal space, to the detriment of the health sector. Many low- and middle-income countries have experienced long-standing civil conflicts or are located in conflict-racked regions, such as the Middle East, and thus feel compelled to maintain a relatively high level of military expenditure. The table in Appendix B shows that in high-income countries – with the exception of a few countries, including Bahrain, Israel, Kuwait and Saudi Arabia – the proportion of GDP spent on health care is far greater than the proportion allocated to military spending (see second set of seven double bars in Figure 1). The reverse is true in many low- and middle-income countries. In Jordan, for example, military and public health care expenditure accounts for 8.9% and 4.3%, respectively, of GDP; in Syria, 7.1% and 2.3%; in Pakistan, 4.4% and 1.1%;

Chapter 4 – Key functions of health care financing 17
in Eritrea, 19.4% and 3.2%; in Burundi, 5.9% and 0.6%; and in Angola, 4.7% and 2.1% (see first set of six double bars in Figure 1) (UNDP, 2005).
These countries seem to have scope for redistributing government resources so as to reduce military expenditure and redress the balance in favour of the health sector, but this strategy would require dramatic improvements in domestic governance in some countries and successful regional peace initiatives in others. Neither scenario is likely in the near future.
Reducing the debt burden in low- and middle-income countries and thereby freeing up for the health sector the limited government resources currently being spent on debt servicing may hold more promise. In a number of middle-income countries, particularly in Asia and Latin America, debt servicing accounts for a two- to threefold greater proportion of GDP – even more in some countries – than the proportion of GDP spent on health care. In Angola, Argentina, Brazil, Chile, Lebanon, Philippines and Thailand, for example, expenditure on debt servicing takes a much larger share of GDP than does public health care (see the first set of seven double bars in Figure 2) (UNDP, 2005). The majority of African countries, particularly those in the low-income group, currently spend less than 10% of their GDP on debt servicing, largely as a result of recent debt relief initiatives. Nevertheless, in many low-income countries in Africa, and to a limited extent in Asia, government spending on health services is still low but could be increased dramatically if more substantial debt relief initiatives, including full debt cancellation, were introduced. This would apply particularly to countries such as Burundi, Côte d’Ivoire, Ghana, India, Kenya, Pakistan, Papua New Guinea and Zambia (see second set of eight double bars in Figure 2) (UNDP, 2005).
Figure 1: Proportion of GDP spent on public health compared to military spending
Source: Data based on UNDP (2005)
Military spending and debt servicing are the two
areas of current government expenditure that tend
to take the lion’s share of the fiscal space, to the
detriment of the health sector.

Health care financing in low- and middle-income countries18
The latest Multilateral Debt Relief Initiative (MDRI), which took effect in July 2006, will result in full cancellation of debt owed to some IFIs, thereby providing the countries concerned with an important window of opportunity for creating fiscal space for health services. The Nigeria case study (see Box 3) is an example of how resources freed by previous debt relief are used for the health sector.
While there is certainly potential for greater priority to be given to the health sector in the allocation of government resources, where public sector health care spending is relatively low, tax revenue can be an unstable source of funds for this purpose. Government health budgets, for example, can change markedly from one year to the next with changing government prioritization of sectors. Furthermore, since donor funding is often channelled through government budget processes along with general tax revenue, health budget instability may also occur if promised donor funding is delivered late or not at all. In many low- and middle-income countries, the negative effects of budget instability have to some extent been mitigated by the adoption of medium-term expenditure frameworks (MTEFs), whereby three-year (or longer-term) rolling budgets ensure that each sector has a reasonable advance indication of allocations over the next few years (Le Houerou and Taliercio, 2002).
Finally, while government health budgets and donor funding may increase, there is no guarantee that these resources can be appropriately and effectively absorbed by the health sector. Government systems, such as tender procedures for purchasing and authorizations for the filling of staff posts, can be very inflexible, as can the rules of donor procurement. Thus, if budgets and/or donor funding increase and, more importantly, if there is likely to be a sudden large increase in allocations to the health sector, the capacity of this sector to absorb such additional resources may have to be expanded.
Health insurance
As in the case of taxes, the type of health insurance can also determine its degree of progressivity. Private voluntary health insurance tends to be regressive, particularly
Figure 2: Government expenditure on debt servicing and public health in selected countries
Source: Data based on UNDP (2005)

Chapter 4 – Key functions of health care financing 19
where it is a major component of overall health care financing, as it is in Switzerland and the United States. In countries where health care is primarily funded by tax revenue and/or mandatory health insurance and where private voluntary insurance is a supplementary financing mechanism favoured by the wealthy, as in Portugal and the United Kingdom, the supplementary voluntary insurance scheme can be progressive in the sense that only the rich contribute – but they are also the only beneficiaries (Van Doorslaer and Wagstaff, 1993). Mildly progressive supplementary private voluntary insurance is also found in low- and middle-income countries, such as Indonesia and Thailand (EQUITAP, 2005).
Depending on the insurance contribution structure, mandatory health insurance ranges from mildly regressive to progressive in both high-income and low- and middle-income countries, although only limited data are available from low-income countries (EQUITAP, 2005; Van Doorslaer and Wagstaff, 1993; Wagstaff et al., 1999). Where contributions to mandatory insurance are proportional rather than progressive and where there is a ceiling on contributions (i.e. where high-income earners have to make a fixed payment rather than a contribution calculated as a percentage of their earnings), mandatory insurance is more likely to be regressive (Van Doorslaer and Wagstaff, 1993). Mandatory health insurance contributions are frequently a fixed proportion of payroll
Box 3: Case study: benefits to the health sector of debt relief in Nigeria
Nigeria, home to one in every five Africans, is the most populous country in Africa. In 2005, Nigeria negotiated a debt relief agreement with the Paris Club amounting to US$ 18 billion, equivalent to a 67% reduction of the face value of the country’s external debt. Among Nigeria’s justifications for the operation was the fact that many of the loans it had received previously had been granted during the rule of corrupt military dictators. The Paris Club was also persuaded that Nigeria, with a wide-ranging economic reform programme in place since 2003, had turned over a new leaf. By June 2006, the external debt had been reduced to US$ 4.8 million. The commitment made by the Nigerian government under the debt relief initiative was that freed-up resources would be devoted to poverty reduction, including increased government spending on health, education, water, housing and agriculture.
Malaria is the main cause of ill-health in Nigeria. Some of the funds released from the debt relief agreement were spent on purchasing 3 million insecticide-treated bed nets for distribution to pregnant women and children under five. In addition, Nigeria purchased over 5 million doses of artemisinin-based combination antimalarial drugs and is distributing them free of charge to children under five throughout the country. The overall health budget for 2007 is 14% greater than it was for 2006. In the Nigerian context, where less than 2% of government expenditure is devoted to the health sector and out-of-pocket payments account for nearly 80% of all health care expenditure, the increased government spending on malaria prevention and treatment made possible by debt relief will be of great value to the Nigerian population.
Sources: Global Policy Forum, 2005; Government of Nigeria, 2006
Health care financing in low- and middle-income countries20
earnings and thus confer regressivity on the system: salaries or wages are only a small component of overall income for wealthier groups but the main, or only, component of overall income for less wealthy groups (EQUITAP, 2005). Mandatory health insurance can have an equitable health care financing mechanism, particularly where it achieves universal coverage (UC) by using tax revenue to subsidize the contributions of lower-income groups, either fully or partly (see Box 4 below).
Unfortunately, there is no evidence about the progressivity of CBHI. However, CBHI schemes, which focus on rural areas and sometimes cover informal sector workers in urban areas, provide a means of collecting revenue from poorer groups and would, therefore, tend to be regressive in terms of overall health care financing. CBHI tends to place a burden on those least able to pay and may end up as a mechanism whereby “the poor simply cross-subsidize the health care costs of other poor members of the population” (Bennett et al., 1998).
International experience of all forms of health insurance suggests that the factors that make for progressivity in health insurance contributions include the following:
Box 4: Case study: mandatory insurance in Costa Rica
Costa Rica is regarded as a health sector success story: its population has achieved a remarkable health status despite its relatively low level of economic development. A middle-income country, with a per capita GDP of less than purchasing power parity (PPP) US$ 10 000 in 2003, Costa Rica has an infant mortality rate of 8 per 1000 live births and an average life expectancy at birth of over 78 years. Its success is attributed, among other things, to an extensive rural primary health care programme, which started before the 1978 Alma Ata Conference on Primary Health Care, a strong government commitment to social services (notably, health care, social security and a compulsory, free education system) and relatively low levels of income inequality (although inequalities have recently increased). The tax-funded rural primary health care programme provided for the building and staffing of 218 health centres and the training of auxiliary health workers, who visit each household regularly in their area to vaccinate children, monitor their growth and nutritional status, provide health education, undertake malaria and tuberculosis surveillance, and refer household members for treatment of acute and chronic illness.
Costa Rica has achieved near universal health care coverage through a combination of mandatory health insurance and tax funding. Mandatory insurance was introduced in late 1941, when the Caja Costarricense de Seguro Social (CCSS) was established. The scheme initially covered only sickness and maternity care for low-income workers living in the national and provincial capitals. Coverage was gradually extended to workers in rural areas and the income threshold for membership was raised. By 1961, 18% of the population was covered. In 1961, legislation was introduced to make membership of CCSS compulsory for all, with the aim of attaining UC within 10 years. Progress to UC was slower than anticipated: 45% of the population was covered by 1971 and 75% by 1981; at present 90% of the population is covered. Ownership of all health facilities was transferred to the CCSS in the mid-1970s.

Chapter 4 – Key functions of health care financing 21
For every formal sector worker the total contribution to the CCSS is equivalent to 15% of salary, of which the employer pays 9.25%, the worker 5.5% and the Government 0.25%. The Government uses general tax funds to pay the full CCSS contribution on behalf of the poor, the handicapped and the elderly. In addition, the CCSS receives revenue from the national lottery and from so-called “sin taxes” (indirect taxes on cigarettes). Thus, almost all Costa Ricans are covered under a single mandatory insurance system, with revenue derived both from payroll contributions and from substantial tax revenue. Although there are no empirical data available on the relative progressivity of overall health care funding in Costa Rica, the lack of a maximum cap on payroll contributions, the inability to opt out of the CCSS and full tax-derived funding for vulnerable groups through a unified funding system suggest a strong degree of progressivity (i.e. a wealthy-to-poor cross-subsidy) in the Costa Rican health system. In addition, risk pooling (i.e. a healthy-to-ill cross-subsidy) is maximized. Most importantly, all Costa Ricans use the same health facilities and receive the same package of services, although the very wealthy have recently begun to use the growing private sector outpatient services provided by general and specialist practitioners. With 28% of public health care expenditure accruing to the poorest 20% of households and only 11% to the richest 20%, poor Costa Ricans benefit disproportionately from public sector expenditure.
Sources: Birdsall and Hecht, 1995; Carrin and James, 2004; Casas and Vargas, 1980; McGuire, 2001; Morgan, 1987
• Contributions are calculated as a percentage of income rather than a fixed sum.• Contribution rates are adjusted to income, e.g. higher-income groups pay a higher
percentage of their income.• There is no cap, or ceiling, on contributions
or, if a cap is imposed, it is not set at too low an income level.
A health insurance scheme may, of course, be progressive as far as contributions are concerned without actually fostering overall equity in health. Such is the case, for example, where health insurance is not universal and only the rich contribute (an “internally” progressive situation), but only the rich benefit from the scheme (EQUITAP, 2005).
An important question is whether a health insurance scheme can mobilize the resources required for quality health care. Health insurance has an advantage over taxes in that taxes, especially proposals to increase taxes, tend to face reluctance or outright opposition, whereas there may be greater willingness to contribute to health insurance. One reason is that members of a health insurance scheme know that their contributions produce a direct entitlement to health services, whereas tax payers are often not sure what the tax revenue will be used for (a particularly acute problem in countries where corruption is rife) or they may not agree with government spending priorities, such as the use of tax funds for military purposes (Normand and Weber, 1994). Health insurance, therefore, has an undeniable potential to generate considerable resources for health care.
Community-based health insurance tends to place
a burden on those least able to pay and may end
up as a mechanism whereby “the poor simply
cross-subsidize the health care costs of other poor
members of the population”.

Health care financing in low- and middle-income countries22
The revenue-generating potential of health insurance, however, is heavily constrained by the income level and distribution of income within a country, two factors that affect the ability of individual households to make health insurance contributions. The potential for mandatory and private voluntary health insurance to generate
revenue is also constrained by the size of the formal employment sector, which, at least in the early stages of an insurance scheme, is the main source of insurance revenue. Some concerns have been voiced that mandatory insurance schemes may increase the cost of labour, thereby swelling unemployment (Normand and Weber, 1994) and kindling opposition to their introduction from both employers and trade unions. These concerns, however, may not be justified. Frequently, the entire cost of health-related payroll taxes or insurance contributions are borne by the employee. Health insurance is seen by employees as part of their remuneration package and while it may result in lower take-home pay, it can be regarded as a form of enforced savings which translate into health service benefits for employees and their families. There is no empirical evidence that these contributions increase unemployment. By contrast, there is clear empirical evidence that lowering mandatory health insurance payroll deductions, as was done in some Latin American countries in the 1990s, does not reduce unemployment but simply results in lower revenue for the health insurance scheme (Cavagnero et al., 2006).
There is very limited empirical evidence about the ability of CBHI to generate sufficient revenue to improve access to health services and to ensure adequate financial protection for members. CBHI schemes tend to focus on rural areas and informal sector workers, whose income tends to be relatively low (Bennett et al., 1998; Ekman, 2004), so that their revenue-generating potential is certainly much lower than that of voluntary or mandatory insurance for formal sector employees.
One important constraint on health insurance is its generally high administrative cost, including the cost of revenue collection. This is particularly true of voluntary insurance,
which has to invest in marketing activities in order to attract members. Private voluntary health insurance, moreover, may face substantial actuarial costs, particularly if contributions are risk-rated. In the case of CBHI schemes, if contributions are income-related, means
testing to determine income status can be difficult and costly. A relatively inexpensive alternative to means testing is for the insurance scheme to set wide income bands (Normand, 1999).
Donor funding
A fairly large number of low-income countries are dependent on donor funding (see Appendix B). Notable examples are São Tomé and Principe, where external sources account for 75% of total health care expenditure; Rwanda, 47%; Solomon Islands, 41%; and Mozambique and Papua New Guinea, 38% each. When a country relies even minimally on external funding for health services, a key consideration with regard to
Health insurance has an advantage over taxes in that
taxes, especially proposals to increase taxes, tend
to face reluctance or outright opposition, whereas
there may be greater willingness to contribute to
health insurance.
One important constraint on health insurance is its
generally high administrative cost, including the cost
of revenue collection.

Chapter 4 – Key functions of health care financing 23
contribution mechanisms is whether the country can secure grants or loans. Interest charges on a loan and repayment of the loan from future general tax revenues combine to reduce net revenue available for expenditure on health services (Hoare and Mills, 1986; Zschock, 1982). The adverse impact of debt servicing costs on government health spending was clearly illustrated in an earlier section of this report (see General tax revenue). However, given the limited availability of external grant funding, reliance on loans may be unavoidable, although they too may be difficult to acquire.
Another consideration in relation to donor funding is whether it takes the form of programme or project funding, of a sector-wide approach (SWAp) or of general budget support (GBS).
In the case of project or programme funding, donor grants or loans are earmarked for a specific project and are sometimes restricted to certain areas of a country.
A SWAp, by contrast, pools funds from most, or all, donors in order to support the overall health sector of the recipient country. A SWAp has been defined as a mechanism for bringing together all significant funding that is provided to support the policy and expenditure programme of a single sector; and that is implemented and managed by the government through a common approach across the sector (Foster et al., 2000).
The aim of a SWAp is to ensure co-ordination of donor funding and to improve its effectiveness by directing resources to priority activities identified through strategic health sector plans developed jointly by the health ministry and donors. SWAps are also seen as critical in promoting ownership by recipient governments, who assume leadership of the development process (Walford, 2003). SWAps can also improve health system equity and efficiency by ensuring that resource allocation is planned and executed comprehensively within the sector and in line with national needs and priorities (Walford, 2002). Health sector SWAps have been introduced in many countries, including Ghana, Mozambique, the United Republic of Tanzania and Uganda, in Africa, and Bangladesh, in Asia (see Box 5 overleaf).
With GBS, the most recent form of donor funding, most or all funds from donors are given to the country’s ministry of finance rather than directly to the ministry of health. The ultimate decision about how the funds should be distributed between the health and other sectors rests with the ministry of finance, which consults with the donors providing GBS and the parliament. As GBS donor funds are allocated, disbursed and managed through the recipient government’s financial management, procurement and accountability systems already in place, GBS could reduce administrative costs, improve efficiency in the management of public expenditure, and bring donor funding more in line with the national budget process and national priorities (DFID, 2004). It is also a way of increasing the predictability of donor funding over the medium term. The United Kingdom’s Department for International Development (DFID), a GBS donor, has described this form of donor funding as “the aid instrument most likely to support a relationship between donor and developing country partners which will help to build the accountability and capability of the state” (DFID, 2004). GBS is a relatively new development, but the experience of
SWAps can also improve health system equity and
efficiency by ensuring that resource allocation is
planned and executed comprehensively within the
sector and in line with national needs and priorities.

Health care financing in low- and middle-income countries24
Uganda, one of the first countries in which it was implemented, indicates that it gives greater government control over external funds and improves the alignment of budget allocations with government priorities, thereby enhancing government “ownership” of donor funding. However, it has not been shown to reduce administrative costs nor to make donor funding more predictable (OPM and ODI, 2003).
Concerns have been voiced about whether the health sector receives a “fair share” of donor funds under a GBS arrangement. There is growing evidence that the education
sector enjoys greater priority than the health sector in the allocation of funds released from debt relief initiatives (McIntyre, Gilson and Mutyambizi, 2005) and it is possible that the same preference may prevail under a GBS agreement, since neither debt relief nor GBS funding is earmarked for a specific sector. While
this may be appropriate, the relative priorities given to the different social sectors merit close attention.
Box 5: Case study: a SWAp in Bangladesh
In 1998, in consultation with its key donors, Bangladesh established a Health and Population Sector Programme (HPSP), and a SWAp was formally instituted through a Memorandum of Understanding between the donors and the Bangladesh Government.
Key achievements made as a result of the SWAp included the following:
• Greater responsibility was placed on the Government for strategic planning, budgeting and monitoring of HPSP activities, leading to increased government “ownership”.
• Institutional reforms were made, including a restructuring of directorates in the Ministry of Health and Family Welfare.
• Coordination among donors improved and the number of overlapping activities and projects declined: today, not all donors participate in pooled funding arrangements but most have agreed to work within the HPSP framework.
The SWAp, however, has not removed the potential for conflict between Government and donors on key policy decisions. For example, in 2003, the Ministry of Health, without consulting its donor partners, decided not to pursue the integration of family planning with other health services. The confidence of donors in the Government suffered and some donors suspended part of their contributions to the pooled health fund until the Government presented a comprehensive plan for implementing reforms agreed in the HPSP. Although some donors displayed an interventionist or intrusive attitude, many continued to support the SWAp and to work closely with the Government. This incident highlights the need to develop strong working relationships between SWAp partners and to reach a common understanding of what such concepts as “government ownership” really mean.
Sources: Sundewall et al., 2006; Sundewall and Sahlin-Andersson, 2006; Walford, 1998
There is growing evidence that the education sector
enjoys greater priority than the health sector in
the allocation of funds released from debt relief
initiatives.

Chapter 4 – Key functions of health care financing 25
Another concern is that GBS could potentially undermine the role of the ministry of health in crucial areas of health policy, particularly health care financing. Ministries of finance wield considerable power in many African governments and are frequently more responsive to donor demands than sectoral ministries. Donors could, therefore, attempt to impose their health sector priorities, especially their views on health care financing strategies, by “leaning on” treasury officials, who could in turn put pressure on ministry of health officials. Under a GBS arrangement, the relationship between the ministry of health and the ministry of finance is of critical importance.
Types of collecting organizationsThe final issue in relation to revenue collection is who collects financing contributions. The type of collecting entity is closely linked to the type of contribution mechanism. For example, taxes are collected by government organizations; mandatory health insurance contributions may be collected by a government, parastatal or private organization; and private health insurance contributions are collected by a private organization, which may be for-profit or not-for-profit. The type of collecting entity can have an impact on the proportion of collectable revenue actually collected. For example, in countries where the government is not seen as accountable to the population or has not gained its confidence, tax evasion can be high. In the case of mandatory insurance, if the government does not enjoy widespread support or if citizens do not trust the government to act in their best interests, it may be preferable for the mandatory insurance to be managed by a parastatal or even a private not-for-profit organization.
The degree of trust a collecting organization enjoys is even more important in the case of voluntary health insurance, whether private or community-based. The ease with which new members are enrolled in a voluntary insurance scheme will depend very much on how confident potential members are that their contributions will be secure and properly used (Schneider, 2005).
Pooling of fundsThe fund pooling function of health care financing has been described as “the accumulation of prepaid health care revenues on behalf of a population” (Kutzin, 2001). Health care costs are unpredictable: individuals do not generally know when they are going to fall ill, what health care they will require and what this health care will cost. The cost of care can be very high, particularly for hospitalization or for long-term, serious illness, such as cancer or AIDS. Most people are unable to pay for these unexpected costs from resources available at any one point in time. Although it is difficult to predict an individual’s future health care needs and costs, it is possible to draw on epidemiological and actuarial data to estimate the probable future health care needs of a group. This possibility is at the core of risk pooling: individuals contribute on a regular basis to a pooled fund, so that when they fall ill, the fund will cover their health care costs. Essentially, at any one point in time, the healthy members of the pool are helping to pay for the health care costs of those who are ill. Clearly, those who are healthy and
Although it is difficult to predict an individual’s future
health care needs and costs, it is possible to draw on
epidemiological and actuarial data to estimate the
probable future health care needs of a group.

Health care financing in low- and middle-income countries26
those who are ill will change over time. The risk of falling ill and incurring unexpected, high health care costs is thus shared among those in the pool. There is also a time element to risk pooling in that individuals draw on contributions that they made when healthy to pay for the health care they need on becoming ill (Normand, 1999). The larger the risk-pooling group, the easier it is to predict required health care expenditure. “There is growing consensus that, other things being equal, systems in which the degree of risk pooling is greater achieve more” (Davies and Carrin, 2001). Very often, the organization responsible for the collection of contributions is also responsible for the pooling of these resources.
Key points with respect to risk-pooling funds are:
• the size of the population and the socio-economic groups covered by the financing mechanism;
• the mechanisms used to allocate resources from pooling to purchasing organizations.
Coverage and composition of risk poolsThere are two health care financing mechanisms that allow for little or no pooling of risks (other than by sharing the risk of health care costs within an individual household). First, with direct out-of-pocket payments, the person who is ill and uses a health service bears the full burden of the fee charged by the health care provider. Second, medical savings accounts are a form of prepayment financing, but these accounts are individualized and can only be used to cover the health care costs of the contributing household. However, there is sometimes a small element of pooling, as when a general insurance pool covers some costs after the resources from the medical savings account have been used up. Medical savings accounts are a central aspect of health care financing in Singapore, but they are also a component of private voluntary insurance schemes in a growing number of countries, including high-income countries, such as the United States, and some low- and middle-income countries, such as South Africa (Hanvoravongchai, 2002).
Some health care financing mechanisms are universal, in the sense that the entire population is entitled to benefit from the health services funded through these mechanisms. For example, some countries have achieved UC through tax funding (see Box 6), others through mandatory health insurance (see Box 4). In countries where tax or mandatory health insurance accounts for most health care financing, maximum risk pooling is achieved, since the risk is shared across the entire population. It is possible
to achieve UC – defined as all citizens having access to adequate health care at an affordable cost (Carrin and James, 2004) – using a mix of financing mechanisms within one country: different groups are covered by different mechanisms, but all are adequately covered in
one way or another. However, in countries with highly fragmented health care financing mechanisms, a sizeable number of individuals often “fall through the cracks”. In the United States, for example, a large proportion of the population – 33 million adults between 18 and 64 years of age – is covered neither by private voluntary health insurance nor the state Medicaid and Medicare schemes (Ayanian et al., 2000).
In countries with highly fragmented health care
financing mechanisms, a sizeable number of
individuals often “fall through the cracks”.

Chapter 4 – Key functions of health care financing 27
Box 6: Case study: general tax funding as a basis for universal health coverage in Sri Lanka
Sri Lanka has long been held up as an example of a country that has achieved remarkably good health status indicators despite relatively low income levels. For example, life expectancy at birth rose from 43.9 years for men and 41.6 years for women in 1946 to 64.8 years and 66.9 years, respectively, in 1967 and to 70.7 years and 75.4 years in 2001, i.e. to levels comparable to those of high-income countries. While factors outside the health sector contributed to this achievement, such as a relatively high level of gender equality and of female literacy, the universal tax-funded health system is seen as a critical factor.
Sri Lanka adopted a policy of sustained, relatively high government spending on social services as a means of promoting equity within the country. It also rejected user fees as a means of financing public sector health (and also education) services. In 1953, all public sector health services were made available to the entire population, without patients having to pay on using a service. A private health sector, which began to flourish in the 1960s, does exist in Sri Lanka for outpatient care. Most private health care is provided by public sector staff working in private practice outside of official working hours. Only 15% of all outpatient consultations are provided by full-time private doctors vs. slightly more than 30% by public sector doctors working a relatively small number of hours in private practice. The remaining 55% of outpatient consultations are provided in the public sector. Higher-income groups use private providers for outpatient care far more than do lower-income groups, reportedly because waiting times are shorter in private practice. Access to tax-funded health care is particularly extensive at the hospital level, with 94% of inpatients being treated in public sector hospitals.
Sri Lanka has a well-organized public health infrastructure: most rural residents are within 5–10 kilometres of a peripheral health facility. The technical quality of care given by public facilities, particularly hospitals, is highly rated. The Sri Lankan public health system is very efficient, requiring only 2–2.5% of GDP to cater for the health care needs of the vast majority of its population. High levels of productivity are partly attributable to a culture among health workers of dedicated service to citizens.
Sri Lanka has used tax funding to achieve UC, i.e. to provide all citizens with adequate health care at an affordable cost. This tax-funded system offers the population a high degree of protection against the potentially catastrophic costs of hospitalization. While some concerns have recently been expressed about declining tax funding of health care (currently down to approximately 1.2% of GDP) and a possible deterioration in the provider-patient relationship, Sri Lanka has accomplished remarkable achievements in its population’s health status thanks to its universal tax-funded health system.
Sources: McNay et al., 2004; Russell, 2005; Withanachchi and Uchida, 2006

Health care financing in low- and middle-income countries28
A growing number of countries, particularly low- and middle-income countries, are exploring the possibility of introducing, or are in the early stages of implementing, some form of mandatory health insurance. If the aim is to achieve UC through this financing mechanism, a single insurance scheme is not essential: several schemes or health funds can make up the universal mandatory insurance system, as long as there is some mechanism to link the different schemes in some way (see Allocation mechanisms).
Most universal mandatory insurance systems began with coverage of only formal sector employees and, in many cases, their dependents: thus, the size of the formal sector largely determined the extent of initial coverage of the population. Coverage gradually expanded as the formal sector expanded and as efforts were made to include the self-employed, agricultural workers and informal sector workers. Achieving UC through a gradual process can take time. However, some recent mandatory insurance initiatives
have completed the process in a relatively short period of time. It took, for example, 127 years for Germany, the first country to introduce mandatory insurance, to achieve UC, compared with 26 years for the Republic of Korea, the most recent newcomer to UC via mandatory insurance (Carrin and James, 2004).
Carrin and James (2004) have identified a number of factors that make for a speedier transition to UC via mandatory insurance, namely:
• a level of income and economic growth high enough to enable firms and households to make mandatory insurance contributions without risking impoverishment;
• an economy whose formal sector is larger than the informal sector: determining the income of, and collecting contributions from, informal sector workers can be administratively difficult and can slow down the transition to UC via mandatory insurance;
• a population more urban than rural: it is easier to enrol an urban population in a mandatory insurance system than a rural population and easier, too, to ensure that the beneficiaries are able to access the health care services to which they are entitled (see Appendix B, which shows that urbanization levels are far lower in low- and middle-income than in high-income countries);
• an administrative capacity, including actuarial information systems and management skills, required to run a mandatory insurance system;
• a high level of social solidarity, and willingness of the population to participate in a system involving considerable cross-subsidies from the rich to the poor and the healthy to the ill;
• the quality of government stewardship needed to guide the introduction and expansion of a mandatory insurance system and to gain the trust of citizens working in the institutions responsible for running the system.
It took 127 years for Germany, the first country to
introduce mandatory insurance, to achieve universal
coverage, compared with 26 years for the Republic
of Korea, the most recent newcomer to universal
coverage via mandatory insurance.

Chapter 4 – Key functions of health care financing 29
In addition to these facilitating factors, there are also factors that can obstruct progress towards UC under a mandatory health insurance system or hinder the creation of the largest possible risk pool.
One such factor is the necessarily slow extension of coverage. Several Latin American countries, for example, which began a mandatory insurance scheme many decades ago, covering only formal sector workers and their dependents, have found that this system has become entrenched and is proving an obstacle to extending coverage to the rest of the population. Clearly, at the outset, there must be an explicit commitment to achieving UC via mandatory insurance in the shortest possible time and to ensuring that the process of extending coverage is a continuous one (see Box 7 below).
Box 7: Case study: mandatory health insurance as the basis for universal coverage in Ghana
While a growing number of African countries are considering or are in the early stages of introducing mandatory health insurance, the Ghanaian Government has made the boldest moves in this direction of any African country to date. It has explicitly committed itself to achieving UC under a NHI scheme, but it recognizes that the extension of coverage will have to be gradual. The aim is to enrol about 60% of Ghana residents within 10 years of starting mandatory health insurance. Two aspects of the NHI suggest that its commitment to UC is more than just “politico-speak”. First, unlike other countries, which initially included only formal sector workers in their health insurance system, Ghana’s NHI has from the outset included both the formal and the informal sectors. Second, although there are different sources of funding for each sector, they will all end up under a single unified scheme.
The basis of the NHI system will be a Mutual Health Insurance Scheme (MHIS) – a form of CBHI – in each district. The NHI Act, passed in 2003, requires every Ghanaian citizen to join either a district MHIS or a private mutual or commercial insurance scheme. However, Government subsidies will only be given to a district MHIS, thereby creating a strong incentive for people not to opt out of the integrated NHI system by purchasing coverage from a private insurance organization. Formal sector employees will be covered through payroll-deducted contributions to the Social Security and National Insurance Trust (SSNIT) fund. Those outside the formal sector are expected to make direct contributions to their district MHIS: contributions have been set at approximately the equivalent in Ghanaian cedis of US$ 8 per adult per annum for the low-income groups, US$ 20 for middle-income groups and US$ 53 for high-income groups. All adults of a household are expected to become MHIS member, each in his or her own right and each paying the required contribution for his or her own coverage and that of dependent children under 18. The National Health Insurance Fund (NHIF) will fully subsidize the contributions of the indigent.
The NHIF will be funded from a 2.5% sales tax levied on almost all goods and services; a 2.5% payroll deduction for formal sector employees as part of their contribution to the SSNIT fund; and Government allocations from such sources as general tax revenue

Health care financing in low- and middle-income countries30
and donor funding. The NHIF will allocate to each district MHIS the funds acquired from the SSNIT payroll contributions made by formal sector workers. It will partially subsidize contributions from low-income households and fully subsidize contributions from the indigent. It will also fulfil a risk equalization and reinsurance function (see figure below). A relatively large proportion of funds for MHIS in poor rural areas will probably be channelled from the NHIF, since most MHIS members would require partially or fully subsidized membership.
Source: McIntyre, Gilson and Mutyambizi, 2005
Implementation of the NHI will benefit from a well-established CBHI tradition in Ghana, which has several hundred CBHI schemes: many Ghanaians are familiar with health insurance principles and the MHIS system. However, the district-wide MHIS offers a different benefit package and has a different contribution structure from those of previous CBHI-type schemes and there have been concerns within the older MHISs about the proposed changes and their future role in the community.
Another positive factor is the considerable Government and donor support for successful implementation of the NHI, whose creation was an election promise that the Government is committed to fulfilling. Initially, many donors were doubtful about the feasibility of an ambitious restructuring of health care financing but they have since committed themselves to supporting its completion.
There are, nevertheless, concerns about the affordability of the NHI, particularly because of the comprehensive benefit package it will offer. Its sustainability will depend very much on the extent to which fully contributing informal sector members can be enrolled and on its long-term ability to garner high levels of general tax and donor funding support.
Sources: Atim et al., 2002; Government of Ghana, 2003; McIntyre, Gilson and Mutyambizi, 2005; Ministerial Task Team, 2002; National Health Insurance Secretariat, 2004
2.5% sales tax 2.5% SSNIT MoH funds
NHI fund
Metropolitan MHIS
Large town MHIS
Poor rural MHIS
(% of MHIS funds from NHIF)
Informal sector members’ contributions
Chapter 4 – Key functions of health care financing 31
A second potentially constraining factor relates to the growing interest in using CBHI schemes to draw informal sector workers into a mandatory insurance system. The idea is not new: CBHIs founded in 19th century Japan were gradually expanded to form part of the mandatory insurance system (Ogawa et al., 2003). On the one hand, there is evidence that CBHI schemes are most successful if they are community-initiated and -driven, as their design will reflect the preferences of the community they serve (Bennett et al., 1998). On the other hand, if a multitude of CBHI schemes develop, each with a different benefit package, contribution rate and other design features, their integration into a mandatory insurance system may be problematic, if for no other reason than the dissatisfaction of, and resistance from, existing CBHI members (see Box 7) – a common reaction to attempts to unify fragmented insurance schemes, whether they be CBHI or private voluntary insurance schemes. Referring to experience in Latin America, Ensor (2001) notes that “levelling up to the best plan has proved to be too costly, while a reduction is resisted by those with more comprehensive cover”. A careful balance needs to be struck between providing clear guidelines within which CBHI schemes should be developed and allowing for leeway for some degree of community ownership.
A third obstacle to the creation of a large risk pool is the freedom given to individuals to opt out of the mandatory insurance system. Chile is a frequently quoted example. For decades, formal sector workers had to contribute to mandatory health insurance, which consisted of two public schemes, one for blue-collar workers, the other for white-collar workers. In 1981, a reform was introduced allowing employees to opt out of the public schemes and sign up with a private health insurance scheme. Contributions to the public scheme are community-rated, whereas contributions to the private schemes are to some degree risk-rated. All workers are required to contribute 7% of their income to the health insurance scheme of their choice. However, if a worker belongs to a private scheme and is regarded as a high-risk enrollee, he or she either has to contribute more than 7% or accept a reduced benefit package, whereas if the worker is in a public scheme, he or she receives the same benefit package for the 7% contribution, whatever the level of risk (Sapelli, 2004). The result is that the healthier and wealthier are heavily concentrated in the private schemes and the less healthy and less wealthy in the public schemes (Barrientos and Lloyd-Sherlock, 2000). With two public and more than 20 private schemes, the risk pool is now highly fragmented. Opting out has a more adverse effect in Chile than in high-income countries because anyone is allowed to opt out in Chile, whereas other countries that allow opting out grant this freedom only to people above a certain income level (Ensor, 2001).
Not all countries attempt to achieve UC through a single predominant financing mechanism (plus a limited number of supplementary mechanisms). Some prefer to develop a range of financing mechanisms, each serving a different population group. The reasons for adopting this approach vary: society may be very individualistic and lack social solidarity or a country’s low income level and economic growth rate may
There is evidence that CBHI schemes are most
successful if they are community-initiated and
-driven, as their design will reflect the preferences of
the community they serve.
A careful balance needs to be struck between
providing clear guidelines within which CBHI
schemes should be developed and allowing for
leeway for some degree of community ownership.
Health care financing in low- and middle-income countries32
compromise the feasibility of funding a health system entirely from taxes or mandatory insurance.
The greatest concern with having a range of financing mechanisms is fragmentation of risk among a large number of small risk pools. The smaller the risk pool, the less sustainable the financing mechanism. For example, a small-group health insurance scheme is less able to
predict its members’ risks of future health care needs and costs and is less able to cope with unexpectedly high expenditure levels, such as during an epidemic or when one or more members incur very high health care costs. CBHI schemes are frequently very small and particularly vulnerable to solvency problems. One solution is reinsurance, whereby small insurance schemes can transfer the risk of unexpectedly high health care expenditure to a “reinsurer” catering for several small schemes (Dror, 2001). Reinsurance has traditionally been used to protect private voluntary insurance schemes from low-frequency, high-cost events but Dror (2001) suggests that a similar approach can be
used for CBHI schemes that provide coverage for high-frequency, low-cost services. Reinsurance is a way of pooling the risks of individual schemes and of sharing higher-than-expected health care costs among several schemes.
Another concern over multiple financing mechanisms is that many insurance schemes will be voluntary in nature. Voluntary insurance schemes are particularly vulnerable to adverse selection, whereby those with the greatest risk of falling ill are the most likely to seek insurance cover, thus limiting the potential for cross-subsidies from the healthy to the ill. Strategies to limit adverse selection include the requirement that entire families, rather than a single family member, become members and, in the case of formal sector employees, that all employees in a company enrol. Some insurance schemes engage in “cream-skimming” or “cherry-picking”, whereby the insurance scheme makes efforts to attract the healthiest individuals and denies or discourages membership to high-risk individuals, by setting very high risk-rated contributions, for example, or by restricting benefits by excluding coverage of pre-existing conditions (Sekhri et al., 2005). These devices also restrict the potential for cross-subsidies. Often they result in a drastic limitation of cross-subsidies in the overall health system, with the healthy and wealthy belonging to private voluntary health insurance schemes, leaving the ill and the poor to rely on publicly funded health services. Cream-skimming can be countered by legislation requiring open enrolment, whereby any person or family wishing to join a health insurance scheme must be allowed to do so. Creating a regulatory environment whereby contributions are community-rated rather than risk-rated can also counter exclusion of the ill and the poor.
Finally, concern over multiple financing mechanisms also stems from the difficulty of using public resources to protect those who do not have adequate financial protection from unexpected health care costs. One approach would be to direct government funds to public, and possibly nongovernmental, entities that do not charge user fees but provide services most likely to be needed by people lacking any form of health
The greatest concern with having a range of financing
mechanisms is fragmentation of risk among a large
number of small risk pools. The smaller the risk pool,
the less sustainable the financing mechanism.
Reinsurance is a way of pooling the risks of individual
schemes and of sharing higher-than-expected health
care costs among several schemes.

Chapter 4 – Key functions of health care financing 33
insurance. This approach assumes that those covered under other health care financing mechanisms will “self-select” not to use publicly funded services (Bitrán and Giedion, 2003). Another approach is to provide a wider range of services at publicly funded facilities but to charge user fees from which vulnerable groups are exempted. A final approach, which is particularly relevant to countries seeking to expand health insurance coverage, whether voluntary or mandatory, is to use public funds to partially or fully subsidize the health insurance contributions of vulnerable groups (Bennett et al., 1998). There are considerable obstacles to targeting government funds to the most vulnerable but they are difficult to avoid, except for a country able to fund its health system fully from general tax revenue and other public funds (see Appendix A for a discussion of how public resources can be targeted to the most vulnerable population groups through user fee exemptions and/or subsidized health insurance contributions).
Allocation mechanismsAnother aspect of risk pooling is the need to ensure that resources are equitably distributed in accordance with health care needs and the risk of future health care costs. Risk-adjusted allocation mechanisms can be applied either to insurance funds or to public, i.e. general tax and donor, funds.
Risk-adjusted mechanisms are used to allocate central government health care resources to decentralized health authorities. Until recently, government resources were distributed, according to supply and demand, through historical processes, such as incremental budgeting (Pearson, 2002). Since relatively well-equipped health facilities, particularly hospitals, are more likely to be in urban than in rural areas, use of historical budgeting approaches frequently results in urban populations capturing a disproportionate share of public health care resources. Risk-adjusted, or “needs-based”, resource allocation mechanisms, which are designed to redress geographic disparities in health care resources, are a clear departure from historical budgeting. Their goal is to promote equity of access to health care on the basis of need. In general, a formula incorporating indicators of relative need for health care is used to determine resource allocations for each geographic area (Rice and Smith, 2002). Indicators most widely used to measure relative need for health services in a specific geographic area are:
• population size;• demographic composition (young children, the elderly and women of childbearing
age tend to have a greater need for health services than other population groups);• levels of ill-health, with mortality rates usually being used as a proxy for
morbidity; • socio-economic status, since there is a strong relation between ill-health and low
socio-economic status and the poor are most reliant on publicly funded services (McIntyre et al., 1990).
Some countries also adjust for the difference in the cost of providing health services in different areas. In certain high-income countries, this adjustment relates to urban areas – in England, for example, the higher cost of employing staff in London is taken
Risk-adjusted, or “needs-based”, resource allocation
mechanisms, which are designed to redress
geographic disparities in health care resources, are a
clear departure from historical budgeting. Their goal
is to promote equity of access to health care on the
basis of need.

Health care financing in low- and middle-income countries34
Box 8: Examples of countries using a needs-based resource allocation formula
HIGH-INCOME COUNTRIES
The earliest and best-known application of a needs-based formula was in the United Kingdom. In the late 1970s, England, Scotland, Wales and Northern Ireland adopted formulae based on population size and demographic structure and weighted by mortality data. Socio-economic status was included as a weighting factor in a later revision of the English formula. Similar approaches have been adopted in Australia, Portugal and a number of other high-income countries. As indicated below, the use of such formulae is also rapidly spreading in low- and middle-income countries.
AFRICA
Ghana
Since 2004, Ghana has been allocating its tax-funded and donor-pooled health funds to its regions according to a formula that includes regional population size, weighted for deprivation (i.e. the size of the population living below the poverty line), and under-five mortality.
United Republic of Tanzania
The formula for the allocation of basket funds to districts includes population size and under-five mortality as a proxy for disease burden and poverty level, and adjusts for the differential cost of providing health services to rural areas of low-population density.
Uganda
The primary health care budget is allocated among districts using a formula based on population size, the inverse of the Human Development Index (HDI) and the inverse of per capita donor and NGO spending. A supplement is allocated to districts with security problems and those with no district hospital. The HDI component of the formula includes measures of socio-economic status and ill-health, while inclusion of donor and NGO funding in the formula ensures that the full resource envelope for each district is taken into account in the allocation of government funds.
Zambia
Initially, a simple per capita formula was used because of the scarcity of accurate data on other needs-based indicators. However, weightings for remoteness and disease patterns were later included in the formula and a measure of poverty was added more recently.
LATIN AMERICA
Chile
Resources for primary health care are allocated from the central Government to municipalities on the basis of population size, with an adjustment for rurality and municipal poverty level.

Chapter 4 – Key functions of health care financing 35
Colombia
The central Government allocates general funds to municipalities on the basis of a formula that includes the size of the municipal population, adjusted for poverty level, unmet basic needs, quality of life indicators and locally-generated revenue. A portion of these funds is explicitly earmarked for health services. Thus, a needs-based formula is used to determine overall allocation for all municipal services, but the freedom of municipal authorities to decide how these funds are distributed among the different services is limited by the requirement that they assign a minimum percentage of central government transfers to health (and to education). This approach has been highly effective in promoting equity in the distribution of health care resources among municipalities.
Mexico
The Ministry of Health recently introduced a resource allocation formula which includes population size, child mortality rate and a “marginalization index” (a composite index of socio-economic status, including such indicators as educational status, access to potable water and sanitation and overcrowding).
ASIA
Cambodia
Cambodia has not adopted a traditional needs-based resource allocation formula (i.e. solely based on population size, burden of illness, etc.). Instead, it uses what could be termed a “costed-norms” approach. The health system covers 73 health districts, each with a hospital and an approved number of health centres, based on population size. Although the size of districts may vary, each health centre in a district supports a broadly similar population size and is expected to provide a similar package of services (i.e. a population- and service-based norm has been established for health centres and district hospitals). Each district’s budget allocation is based mainly on the average cost of running a health facility in the district, multiplied by the number of facilities of that type in the district. An adjustment for patient workload has been included to prevent disincentives to treating additional patients.
Sources: Bossert et al., 2003; Pearson, 2002; Rocha et al., 2004; Semali and Minja, 2005
into account. In low- and middle-income countries, a similar adjustment is made for the higher cost of providing care in remote rural areas. Box 8 above gives examples of countries using a needs-based resource allocation formula and highlights the indicators used in each case.
When allocating government and donor funds to regions or districts, some countries, such as Colombia and Uganda (see Box 8), take into account additional health care resources if these are pooled with tax funding through SWAps or GBS. Figure 3 overleaf demonstrates the potential equity implications of not taking these additional funds into account.

Health care financing in low- and middle-income countries36
Figure 3: Hypothetical allocation of health care resources between districts
Source: McIntyre, Gilson and Mutyambizi, 2005
The bars in Figure 3 above represent the level of per capita funding from different sources. The bottom bar is the same size in the two large blocks of bars, indicating that government resources have been allocated to rural and urban districts on an equal per capita basis. The difference in size of the next bars up, between the rural and urban blocks, indicates that more user-fee revenue is generated in the urban than in the rural district, because urban dwellers working in the formal or informal sector have a greater ability to pay than rural workers. This is also the case with CBHI contributions. If the government matches CBHI contributions on a dollar-for-dollar basis, the urban district benefits more than the rural district. The Global Fund ARV bar represents donor programme funds that are at present likely to be heavily concentrated in urban areas: Global Fund resources for the provision of antiretroviral drugs (ARV), for example,
are likely to flow more generously to urban than to rural areas, at least in the initial stages of the ARV roll-out, since the treatment is more easily administered in urban than in rural areas. Finally, the uppermost urban bar represents revenue that public sector facilities, particularly hospitals,
receive in the form of mandatory health insurance reimbursements when their members use these facilities. Mandatory insurance members will be heavily concentrated in urban areas, so that funds may not even accrue to rural facilities. This illustrates how significant inequities in the allocation of health care resources may arise even when government allocates tax resources on an equal per capita basis.
Equitable resource allocation can be achieved through what is commonly referred to as “risk-equalization”, a process often adopted by mandatory health insurance schemes made up of several small funds. In broad terms, the risk profile of each fund or scheme is assessed using a range of factors, such as the age, gender and disability profiles of members, and the proportion of members with chronic illnesses (Rice and Smith, 2002).
Significant inequities in the allocation of health care
resources may arise even when government allocates
tax resources on an equal per capita basis.
Mandatory insurance reimbursements
Global Fund ARV
Matching govt. grant
CBHI contributions
OOP user-fee revenue
Tax & donor pooled
Rural district Urban district

Chapter 4 – Key functions of health care financing 37
A risk-adjusted capitation amount, equivalent to the average sum per member required to cover likely health care costs for a standard benefit package, is calculated from the risk profile structure of all schemes or funds. To determine the total amount to be allocated to each scheme, the risk-adjusted amount per capita is multiplied by the number of members in the scheme corresponding to each type of risk profile. In some countries, such as the Netherlands, mandatory insurance contributions are collected centrally and individual health funds or insurance schemes undertake purchasing (see next section). In this case, risk-adjusted capitation is used to allocate all resources among the different schemes. In other countries, each scheme or fund collects its own contributions. Risk-adjusted capitation in such instances is used to determine which insurance schemes or health funds collect more contribution revenue than is warranted by their membership profile and thus who should pay into a risk-equalization fund. Conversely, risk-adjusted capitation is used to determine which schemes or funds collect less revenue than they require, given the risk profile of their membership, and thus who should receive payments from a risk-equalization fund. These risk-adjustment mechanisms allow for cross-subsidies between individual insurance schemes or health funds, thereby consolidating the risk pool.
The Ghana case study (see Box 7) exemplifies a resource allocation mechanism that combines equitable allocation of general tax and donor funds between geographic areas, with risk-equalization between district-wide CBHI schemes managed under the umbrella of a mandatory health insurance system.
PurchasingPurchasing has been defined as “the transfer of pooled resources to service providers on behalf of the population for which the funds were pooled” (Kutzin, 2001). The term “transfer” implies a passive approach, yet there is a growing awareness that the organization transferring funds should be an active purchaser of services for the beneficiaries of the pooled resources – active particularly in ensuring that the appropriate services are secured efficiently. The key issues in the purchasing function of health care financing are:
• the choice of benefit package to which beneficiaries would be entitled, including type of service and type of provider, and the route by which different services should be accessed;
• the choice of mechanism for paying providers or the route used to transfer resources from purchaser to provider.
The benefit package
Type of service
In planning a benefit package, the first consideration is the type of service to be covered under a particular financing mechanism (e.g. tax revenue and/or health insurance). In particular, should the package only include low-frequency, high-cost services, such as hospital care and long-term, terminal illnesses, which are often regarded as
The organization transferring funds should be an
active purchaser of services for the beneficiaries of
the pooled resources – active particularly in ensuring
that the appropriate services are secured efficiently.

Health care financing in low- and middle-income countries38
“catastrophic events”? Or should it only cover high-frequency, low-cost services, such as acute and chronic care that can be provided at the primary care level? Or should it cover both types of service? Given the central goal of providing financial protection, many believe that the emphasis should be on protecting individuals and households from “catastrophic” expenditure, which has traditionally been associated with inpatient
care and other high-cost, low-frequency services. However, it is becoming increasingly clear that even small payments for primary care services can have catastrophic consequences for vulnerable households (Whitehead et al., 2001) and that essential primary health care services should, therefore, be covered in countries with high poverty levels. The design of a benefit package clearly depends on what people in a
given country can afford, but a reasonably comprehensive benefit package is best able to protect households from catastrophic health care costs (see Box 9 below).
Box 9: Case study: equitable distribution of health care benefits in Thailand
Thailand has been engaged over the past 25 years in a gradual extension of the population covered by health insurance. Formal sector workers were enrolled in a Civil Servant Medical Benefit Scheme (CSMBS) for government employees created in 1978 and employees of private firms, in a Social Security Scheme (SSS) created in 1990. The poorest households were enrolled in a publicly funded low-income card (LI Card) scheme introduced in 1975 and informal sector workers not classified as poor, in a publicly subsidized voluntary health card (VH Card) scheme set up in 1981. In 2001, the 30% of the population still uninsured were enrolled in a tax-funded public UC scheme, into which the original LI Card and VH Card schemes were integrated. Together, the UC, CSMBS and SSS now cover the entire population. Whereas the CSMBS and SSS operate as insurance schemes, the UC scheme is financed in a manner similar to direct tax funding. UC members must register with a local primary care facility, which is usually within the public sector but may sometimes be an accredited private provider. The facility is paid a capitation fee from tax funds to provide primary care to UC members. Public hospitals are funded by a global budget based on diagnosis related group (DRG) estimates. (The DRG system, which is used to determine how much a government has to reimburse a hospital for services rendered to a patient, categorizes patients into one of several hundred groups, according to criteria such as diagnosis, likely medical procedures required, age, sex, and the presence of complications or co-existent illness; each group is thus comprised of patients presenting similar clinical problems and likely to require the same level of hospital care). The UC scheme is also known as the “30 Baht scheme”, since members are expected to make a nominal payment of 30 Baht (slightly less than US$ 1) per outpatient visit and per hospital admission. The poor, who were previously part of the LI Card scheme, are not required to pay anything. All schemes have a relatively comprehensive benefit package, with a “negative list” that excludes very high-cost services, such as dialysis for end-stage renal disease, cosmetic
It is becoming increasingly clear that even
small payments for primary care services can
have catastrophic consequences for vulnerable
households and that essential primary health care
services should, therefore, be covered in countries
with high poverty levels.

Chapter 4 – Key functions of health care financing 39
surgery, treatment for drug addiction, organ transplantation, and infertility treatment.
In Thailand, the poor benefit from public subsidies (particularly for their use of health services) to a much greater extent than the rich. This is particularly the case for outpatient services at health centres and for outpatient and inpatient services at district hospitals, which are generally more physically accessible to the poorest population groups (and hence also more financially accessible since they reduce, or avoid the need for, transport costs). The inequality between socio-economic groups in the use of health care and in public subsidy benefits has declined since the introduction of UC. Even though the poor benefit more from the public subsidy than the rich, the UC also provides the better-off with substantial protection against catastrophic inpatient costs: generally, the frequency of catastrophic out-of-pocket payments has declined for all socio-economic groups but particularly for the poorest. Before the creation of the UC scheme, 2.1% of the population was pushed below the poverty line as a result of out-of-pocket payments; in 2004, three years after the introduction of UC, only 0.5% was impoverished from this cause. A combination of UC, a relatively comprehensive health service benefit package, and relatively high levels of tax funding to support the provision of good quality public sector health services have led to a distribution of health service benefits that is distinctly to the advantage of the poorest in Thailand.
Sources: Limwattananon et al., 2005; Suraratdecha et al., 2005
Cost-containment may be a problem if the benefit package of an insurance scheme only covers hospital services. If primary care services are not included in the package, patients tend to go directly to a hospital or a medical specialist for a health problem that could have been dealt with at the primary care level at a much lower cost. Many countries have found that having primary health care providers act as gatekeepers to hospital care is a useful cost-containment mechanism (Ros et al., 2000).
A benefit package can offer beneficiaries a “positive list” or a “negative list” of services they can use under the health insurance scheme (Rutten and van Busschbach, 2001). A positive list itemizes each service included in the benefit package, such as immunizations, treatment of malaria, childbirth services, surgical procedures, and so on. A negative list is used for a benefit package that covers all health care except for a limited number of specified services, such as organ transplantation, cosmetic surgery, and so on.
Allocative efficiency is an important consideration in deciding which services should be included in the benefit package. The purchaser, whether a ministry of health, district health office or insurance scheme, must be aware of the major causes of ill-health and hence the health care requirements of the beneficiary population. An active purchasing approach is called for, with the purchaser routinely compiling and analysing relevant epidemiological information about the beneficiary population and translating this into a benefit package that more or less meets the health care needs of this population (Kutzin, 2001).
Many countries have found that having primary
health care providers act as gatekeepers to hospital
care is a useful cost-containment mechanism.

Health care financing in low- and middle-income countries40
Type of provider
Once the types of service to be included in the package have been determined, the next issue is to decide on the types of provider that beneficiaries can use to secure services.
The purchaser may stipulate that the full costs of services included in the benefit package will be covered only if they are provided by a public sector or NGO facility. This is often the case, at least implicitly, in tax-funded systems, particularly where all tax resources are channelled to public facilities (and in some countries also to NGO facilities). The benefit package of a health
insurance scheme usually stipulates that beneficiaries will be reimbursed for health care costs only if accredited providers have been used (Normand and Weber, 1994). Accreditation is generally based on the facility meeting certain basic standards that ensure adequate quality of care, an appropriate range of services and a willingness to charge rates that provide value for money.
In addition to accreditation of providers, contracts may need to be drawn up between purchaser and provider if there is a very clear distinction between them. This is often the case with insurance schemes but it may also apply to tax-funded health systems, as is the case in the United Kingdom, where budgets are no longer given directly to providers but to “primary care trusts”, which purchase services on behalf of the resident population (Maynard, 1994). The contract between purchaser and provider usually specifies the types of service that may be provided to beneficiaries, the amount of money the provider will receive for services, the mechanism for paying the provider and the quality and other performance requirements related to the service provided. As noted in the Colombia case study (Box 10), contracting is frequently used to ensure efficiency and quality of care.
Affordability and sustainability
An overriding consideration in benefit package design is the affordability and sustainability of the package. The resources available now and likely to be available in the future will affect which services are included in the benefit package and which types of provider may be used. There is an important trade-off between what are frequently referred to as the breadth (how many people) and depth (which services) of coverage. If UC under a health care financing mechanism is the objective, it may be possible
to offer only a very limited benefit package; a more comprehensive package may be possible but only if coverage is confined to a limited section of the population (Gottret and Scheiber, 2006). If the benefit package is not clearly spelled out, expenditure on health care benefits is likely to increase rapidly and to prompt corresponding increases in contributions or tax
revenue allocations to health care, thereby threatening the sustainability of the financing mechanism (Normand, 1999).
An active purchasing approach is called for, with
the purchaser routinely compiling and analysing
relevant epidemiological information about the
beneficiary population and translating this into a
benefit package that more or less meets the health
care needs of this population.
If the benefit package is not clearly spelled out,
expenditure on health care benefits is likely to increase
rapidly and to prompt corresponding increases in
contributions or tax revenue allocations to health care,
thereby threatening the sustainability of the financing
mechanism.

Chapter 4 – Key functions of health care financing 41
Box 10: Case study: contracting for health services in Colombia
Up to the early 1990s, Colombia had two systems: a social health insurance (SHI) scheme (plus some private insurance) covering formal sector workers and direct public provision of health services (i.e. through budget transfers from the Government to public hospitals) for others. In 1993, in a move towards universal mandatory health insurance, wide-ranging reforms were introduced whereby public funds would be used increasingly to subsidize SHI membership for those unable to afford full contributions. At the same time, contracting for health services was introduced on a large scale. “Health promotion enterprises” (known by the local Spanish language acronym as “EPSs”) were established as financing intermediaries. The EPSs compete for membership of the insured population, i.e. formal sector workers, and contract with selected service providers (public and/or private). Regulations specify the minimum benefit package that must be covered by an EPS: there are two packages, one for “full contributors” and one for those with a subsidized membership, each carrying the same contribution rate. An equalization mechanism that fosters income-related cross-subsidies has also been established. Since the Government is now devoting more and more of its funds to subsidize insurance coverage and is contracting with providers, public hospitals have become autonomous institutions that will no longer receive budgets but will bill each EPS for services provided to its members. During the move towards UC, public hospitals will still receive budgetary support. The move to a contracting environment is intended to promote efficiency by encouraging competition between providers, particularly hospitals, which account for the bulk of health spending, and by allowing the insured population some freedom in the choice of provider.
The reforms have produced mixed results, partly due to the two major simultaneous changes they have introduced, namely, a move to UC through subsidized insurance membership and a shift to a contracting environment. A critical problem was that, during the transition period from partial to UC, government funds, although they increased, had to be used to fund public hospitals so that they could cater for the uninsured, thus reducing the funds available for subsidizing insurance membership. As a result, progress towards UC has been slower than anticipated, which has in turn limited the extent to which full-scale contracting could be introduced. The desired impact on the operating efficiency of public hospitals has thus not been achieved, suggesting that competition alone will not produce gains in efficiency.
Sources: Gaviria et al., 2006; Homedes and Ugalde, 2005; McPake and Mills, 2000
Health care expenditure can increase rapidly in both tax-funded and insurance schemes as a result of so-called “moral hazard”: those entitled to benefit from coverage have a strong incentive to consume more and “better” health care and a weaker incentive to maintain a healthy lifestyle than if they did not have this entitlement (Arrow, 1963). A common device to counter moral hazard is to require users to bear part of the cost of services through out-of-pocket payments, called "user fees" in the case of tax-funded

Health care financing in low- and middle-income countries42
health services and "co-payments" in the case of health insurance. The adverse effects of user fees in creating an obstacle to the use of health care by low-income groups have been mentioned. Similar constraints exist in relation to co-payments for those covered by health insurance. For example, co-payments are relatively high in the mandatory health insurance scheme of the Republic of
Korea, accounting for 40–55% of the cost of outpatient care: the lowest-income groups in the country use health services far less than higher-income groups, who are more able to pay these co-payments (Kim et al., 2005). However, despite high co-payment levels, health expenditure under mandatory insurance increased from 3.7% to 6.6% of GDP in the 1980s, a rise fuelled both by unit cost increases and by increased usage of services by higher-income earners (De Geyndt, 1991).
The adverse impact of co-payments is likely to be particularly severe in low-income countries. Kutzin (1995) notes: “Although incentives to consumers based on cost-sharing requirements appear to have some effect in reducing demand, incentives to providers are much more powerful tools for containing costs”. This view is echoed in a recent review of cost-containment strategies, which concluded that “patient charges do not appear to be a successful cost-containment tool” (Carrin and Hanvoravongchai, 2002). One alternative to co-payments that does not raise obstacles to health care use by the lowest-income groups is to create incentives for efficient provider behaviour (see section below). Another is to use primary health care providers as gate-keepers requiring patients to adhere to appropriate referral routes (see Box 11).
Service delivery infrastructure
There has to be an adequate service delivery infrastructure to ensure that the entitlements specified in the benefit package can actually be realized. Health facilities providing services that are included in the benefit package and that are of adequate quality must be physically and culturally accessible to potential beneficiaries.
This requirement is particularly important in the case of voluntary insurance, which has to attract members (see Box 11). Moreover, when mandatory insurance is being introduced, possibly in the face of opposition, beneficiaries must be sure that they will have access to quality care (Normand and Weber, 1994).
Provider payment mechanismsProvider payment mechanisms broadly refer to the way in which funds are transferred from a purchaser to a health care provider. Through arrangements between providers and purchasers, such as incentives and risk sharing, payment mechanisms can bring a provider’s behaviour more into line with the objectives of the purchaser. Payments are made either to an individual provider or to a health care facility, and in either case can be prospective, i.e. determined and/or made in advance, or retrospective, i.e. made after the service has been provided. The main forms of provider payment mechanism are as follows:
Health care expenditure can increase rapidly in both
tax-funded and insurance schemes as a result of so-
called “moral hazard”: those entitled to benefit from
coverage have a strong incentive to consume more
and “better” health care and a weaker incentive to
maintain a healthy lifestyle.
When mandatory insurance is being introduced,
possibly in the face of opposition, beneficiaries must
be sure that they will have access to quality care.

Chapter 4 – Key functions of health care financing 43
• To individual providersÑsalary: determined prospectively, paid retrospectively;Ñfee for service: determined prospectively, paid retrospectively;Ñcapitation (i.e. a flat payment per person covered, who is then entitled to use all
services covered in the benefit package offered by that provider): determined prospectively, paid prospectively.
• To facilitiesÑbudget allocations: determined prospectively, paid prospectively;Ñfee for service: determined prospectively, paid retrospectively;Ñper diem (a flat payment per day of hospitalization): determined prospectively,
paid retrospectively;Ñcase-based fee (a flat payment per treatment package, such as for normal
childbirth services), sometimes adjusted for risk factors, such as age and co-morbidities: determined prospectively, paid retrospectively.
Table 1 overleaf summarizes the advantages and disadvantages of each of these payment mechanisms and suggests strategies to minimize the disadvantages. The most effective way of maximizing positive incentives and minimizing perverse incentives (incentives
Box 11: Case study: accessing benefits in the Bwamanda CBHI scheme in the Democratic Republic of Congo
The Bwamanda CBHI scheme was established in 1986 by Belgian doctors working for
nongovernmental organizations in the Bwamanda district of the Democratic Republic
of Congo. The scheme covers the cost of care given at a district hospital if the patient
has been referred from a health centre. It is recognized as one of the most successful
CBHI schemes, achieving and maintaining coverage of 60–70% of the district population
(of nearly 160 000 people in 1994) and doubling the financial resources available to the
hospital in the period 1997-1998. Before the introduction of the scheme, Government
subsidies were declining dramatically, prompting frequent increases in the flat-rate user
fees that made hospital care increasingly unaffordable. The scheme improved access to
hospital care, with admission rates for the insured being three times greater than for the
uninsured. Although the scheme requires a 20% co-payment of hospital fees, members
pay much less for hospital care on an out-of-pocket basis than non-members. However,
the poorest are excluded, because, as most of them claim, they cannot afford to pay the
scheme’s contributions.
Physical access to services in the scheme’s benefit package plays a critical role in
insurance membership and use of services: membership levels and hospital utilization
rates are higher among those living within 35 km of the hospital than among those
living further away. The ability to translate entitlements into real service benefits through
ready physical access to health facilities is thus an important incentive to join a health
insurance scheme. Moreover, the willingness of the district population to join the scheme
owes much to the fact that the Bwamanda hospital is known to give high-quality care,
including adequate availability of doctors and drugs.
Sources: Criel et al., 1999; Criel et al., 1998; Shaw and Griffin, 1995

Health care financing in low- and middle-income countries44
that have unforeseen, unintended, and/or adverse effects) is to use a mix of payment mechanisms. However, capacity constraints in low- and middle-income countries may preclude complex combinations of payment mechanisms.
The more fragmented a health care financing system and the greater the number of independent purchasers, the more difficult it is to exert pressure on providers to contain costs. If there are only one or two large purchasers, they can use their combined purchasing power to negotiate lower fees with providers and to impose global caps on reimbursement claims (Normand and Weber, 1994). With a large number of small purchasers, providers can simply refuse to provide services to beneficiaries of purchasers who attempt to limit their profit margins and income levels. Alternatively, fee levels can be fixed by government regulation, but this will not limit practices such as overservicing.
Table 1: Advantages and disadvantages of different provider payment mechanisms
Payment mechanism
Advantages DisadvantagesWays of minimiz-
ing disadvantages
Salary Predictable expenditure
Low administrative costs
Possible underprovision and/or poor quality of care
Little incentive for efficient behaviour and productivity unless linked to performance
Peer review of provider practices
Link part of payment to performance
Capitation Incentive for technical efficiency and preventive care
Administration costs reasonably low
Incentive for underservice
Possible cream-skimming (attracting low-risk patients)
Possible cost shifting (referral to another provider)
Adjust payments to risk
Monitoring and peer review of provider practices (including referral patterns)
Patient choice of provider
Fee for service
Incentive for technical efficiency (where fee schedules are fixed)
Incentive for overprovision and cost escalation
High administrative costs
Global caps and/or adjusting fee to keep within resource limits
Budget allocation
Predictable expenditure and tight control
Low administrative costs
Limited direct incentives for efficiency unless linked to performance
Can lead to underservicing and cost shifting
Link part of payment to performance
Monitoring and peer review
Per diem Some incentive for technical efficiency
Incentive to extend length of stay and/or increase number of admissions
Global caps/budget limits
Lower fees for longer stays
Case-based
(includes diagnosis related group payments)
Strong incentive for efficient operation
Unpredictable expenditure
Relatively high administrative costs
Incentive for cream-skimming
Adjust for case mix, i.e. by grouping people according to their use of resources
Sources: Carrin and Hanvoravongchai, 2002; Kutzin, 2001

Chap
ter 55 Conclusions
No country has a single health care financing mechanism. A country may, for example, have universal mandatory health insurance funded from payroll contributions by formal sector employees, from contributions by informal sector workers in the community and, for the poor, from contributions fully subsidized out of tax revenue. In addition, the country may have “top-up” voluntary health insurance and out-of-pocket payments for services outside of the mandatory insurance benefit package. Each financing mechanism has advantages and disadvantages and each can be structured differently in order to enhance its potential for achieving specific objectives and for minimizing the risk of adverse consequences.
The framework used in this review focuses on three key health care financing functions: revenue collection, risk pooling and purchasing. This framework can be used by a country to evaluate or modify its existing system or to replace or supplement it with a new system. The first step is to define clearly the desired objectives of the health system. The next step is to choose the mechanisms for collecting revenue, pooling risk and purchasing health services that are most likely to facilitate attainment of the objectives. In making these decisions, it can be helpful to examine the results, both positive and negative, that other countries have obtained in implementing the three key health care financing functions. Table 2 summarizes some important aspects of international experience in the performance of the key functions from the perspectives of feasibility, equity, efficiency and sustainability. Examples of “best practice” could be highly instructive but, regrettably, there is a paucity of success stories. Indeed, there is real scope for future research to document how these health care financing functions actually operate in countries. Two countries, for example, Costa Rica and Sri Lanka, are widely regarded as having been successful in setting up and implementing the functions. This review has highlighted some of the factors that have contributed to the success. However, a deeper study identifying additional factors would be an enlightening exercise.
Overall, international experience and current thinking suggest a few “take-home messages”:
• Every effort should be made to achieve universal health care coverage – defined as a system that provides all citizens with adequate health care at an affordable cost.
• A health care financing mechanism should provide sufficient financial protection, so that no household is impoverished because of a need to use health services. One way of providing such protection is by incorporating a risk-sharing plan in the health care financing mechanism, whereby the risk of incurring unexpected health care expenditure does not fall solely on an individual or household.
This framework can be used by a country to evaluate
or modify its existing system or to replace or
supplement it with a new system.
A health care financing mechanism should provide
sufficient financial protection, so that no household
is impoverished because of a need to use health
services. One way of providing such protection is by
incorporating a risk-sharing plan in the health care
financing mechanism.

Health care financing in low- and middle-income countries46
• These first two objectives imply a need for strong cross-subsidies within the health system, both in terms of income (cross-subsidies from the wealthy to the poor) and of risk of requiring health care (cross-subsidies from the healthy, or low-risk, to the ill, or high-risk individuals).
• Cross-subsidies should be adopted on a system-wide basis and focused not only on who contributes how much to funding the health care system but also on how the funds are pooled and how and what services are purchased for whose benefit.
• A system-wide approach for cross-subsidies means that a health care financing mechanism should not be considered in isolation but rather in relation to how it can contribute to cross-subsidies in the overall health system.
• The emphasis should be increasingly on integrated financing mechanisms: fragmentation of financing mechanisms reduces the potential for cross-subsidies.
Health care financing presents an enormous challenge to low- and middle-income countries. However, despite their limited economic resources, a small number of countries have greatly improved the health status of their populations. They have done so through innovative mechanisms
for financing and providing health care, as well as through other interventions affecting but not directly stemming from the health sector. There is clearly a strong potential for a country to improve its existing health care financing system and make it feasible, equitable, efficient and sustainable. To do so, however, the country needs to critically evaluate the three basic functions of its health care financing system – revenue collection, risk pooling and purchasing. It also needs to draw on and, where needed, adapt from the experience of other low- and middle-income countries that have embarked successfully on a similar undertaking.
Cross-subsidies should be adopted on a system-wide
basis and focused not only on who contributes how
much to funding the health care system but also on
how the funds are pooled and how and what services
are purchased for whose benefit.
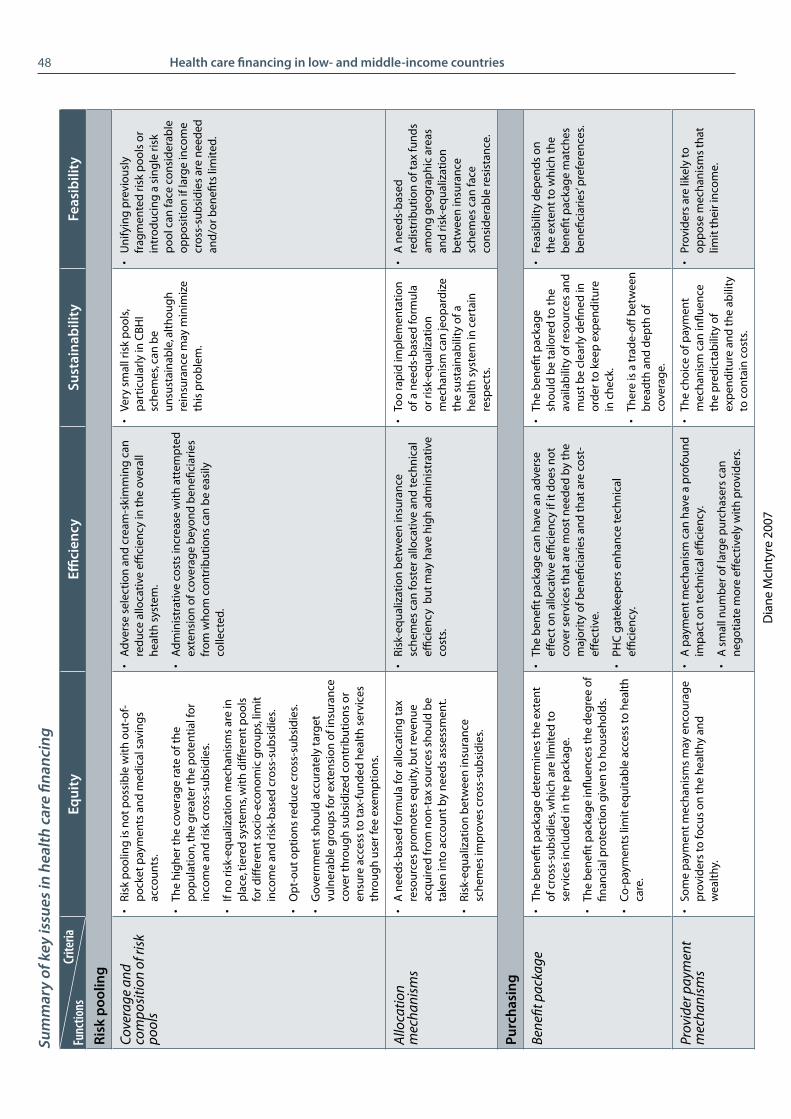
Chapter 5 – Conclusions 47
Tabl
e 2:
Su
mm
ary
of k
ey is
sues
in h
ealth
car
e fin
anci
ng
Equi
tyEffi
cien
cySu
stai
nabi
lity
Feas
ibili
ty
Reve
nue
colle
ctio
n
Sour
ces
of fu
nds
• So
me
com
pan
ies
and
ind
ivid
ual
s m
ay h
ave
to b
e ex
emp
t fr
om
co
ntr
ibu
tin
g to
hea
lth
ca
re fu
nd
s.
• It
is e
asie
r an
d le
ss c
ost
ly to
co
llect
fun
ds
fro
m fo
rmal
th
an fr
om
info
rmal
sec
tor
com
pan
ies
and
em
plo
yees
.
• A
bal
ance
is n
eed
ed
bet
wee
n d
om
esti
c an
d
exte
rnal
so
urc
es.
• Th
ere
sho
uld
be
an
app
rop
riat
e d
istr
ibu
tio
n
bet
wee
n fu
nd
s fr
om
co
mp
anie
s an
d t
ho
se fr
om
in
div
idu
als
or h
ou
seh
old
s.
Con
trib
utio
n m
echa
nism
s•
Ou
t-o
f-p
ock
et p
aym
ents
are
th
e m
ost
re
gre
ssiv
e (o
r lea
st p
rog
ress
ive)
mec
han
ism
s an
d c
reat
e in
equ
itie
s in
use
of h
ealt
h c
are
serv
ices
.
• G
ener
al t
ax is
usu
ally
pro
gre
ssiv
e; d
irec
t in
com
e ta
x is
pro
gre
ssiv
e b
ut
ind
irec
t ta
x (e
.g.
VAT
) is
usu
ally
reg
ress
ive.
• Pr
ivat
e vo
lun
tary
insu
ran
ce te
nd
s to
be
reg
ress
ive
bu
t ca
n b
e p
rog
ress
ive
in lo
w- a
nd
m
idd
le-i
nco
me
cou
ntr
ies,
alth
ou
gh
it o
nly
b
enefi
ts h
igh
er-i
nco
me
gro
up
s.
• M
and
ato
ry in
sura
nce
can
be
rela
tive
ly
pro
gre
ssiv
e, d
epen
din
g o
n c
on
trib
uti
on
st
ruct
ure
; if c
over
age
is n
ot
un
iver
sal,
it o
nly
b
enefi
ts c
on
trib
uto
rs.
• H
ealt
h in
sura
nce
can
be
mad
e m
ore
p
rog
ress
ive
by
use
of i
nco
me-
adju
sted
co
ntr
ibu
tio
ns
rath
er t
han
flat
-fee
co
ntr
ibu
tio
ns,
by
avo
idin
g m
axim
um
co
ntr
ibu
tio
n c
aps
set
at to
o lo
w a
n in
com
e le
vel a
nd,
in t
he
case
of m
and
ato
ry in
sura
nce
, b
y ex
clu
din
g o
r min
imiz
ing
op
tin
g-o
ut.
• O
ut-
of-
po
cket
pay
men
ts a
nd
CB
HI g
ener
ate
limit
ed fu
nd
s.
• Fi
scal
sp
ace
stra
teg
ies
incl
ud
e im
pro
vin
g t
ax
colle
ctio
n, l
imit
ing
tax
ded
uct
ion
s o
n p
riva
te
insu
ran
ce c
on
trib
uti
on
s, ac
cord
ing
deb
t re
lief a
nd
allo
cati
ng
a h
igh
er p
rop
ort
ion
of
gov
ern
men
t fu
nd
s to
hea
lth
.
• In
sura
nce
can
gen
erat
e m
ore
fun
din
g t
han
ta
xes
bec
ause
of g
reat
er w
illin
gn
ess
of
peo
ple
to m
ake
con
trib
uti
on
s to
an
en
tity
fr
om
wh
ich
th
ey re
ap d
irec
t b
enefi
t.
• H
igh
er a
dm
inis
trat
ive
cost
s o
f in
sura
nce
m
ay re
du
ce n
et re
ven
ue
avai
lab
le fo
r hea
lth
se
rvic
es.
• A
id g
ran
ts y
ield
mo
re re
ven
ue
than
loan
s, w
hic
h in
cur i
nte
rest
.
• SW
Ap
s an
d G
BS
fost
er g
reat
er a
cco
un
tab
ility
an
d a
lloca
tive
an
d a
dm
inis
trat
ive
effic
ien
cy.
• C
on
cern
s ex
ist
abo
ut
wh
eth
er a
fair
sh
are
of
do
no
r fu
nd
s g
oes
to t
he
hea
lth
sec
tor u
nd
er
a G
BS
arra
ng
emen
t.
• M
ediu
m-t
erm
exp
end
itu
re
fram
ewo
rks
are
con
du
cive
to
pre
dic
tab
ility
an
d
stab
ility
in g
over
nm
ent
hea
lth
sp
end
ing.
• R
ate
of g
row
th o
f th
e ec
on
om
y an
d o
f fo
rmal
se
cto
r em
plo
ymen
t in
fluen
ces
po
ten
tial
in
crea
ses
in t
ax a
nd
in
sura
nce
reve
nu
e ov
er
tim
e.
• D
on
or f
un
din
g c
an b
e u
np
red
icta
ble
an
d e
xter
nal
lo
ans
(rat
her
th
an a
id
gra
nts
) no
t su
stai
nab
le
over
th
e lo
ng
term
.
• Th
ere
may
be
gre
ater
w
illin
gn
ess
to p
ay t
axes
d
edic
ated
to t
he
hea
lth
se
cto
r th
an to
acc
ept
incr
ease
s in
gen
eral
tax
ra
tes
or n
ew t
axes
.
• Pe
op
le a
re m
ore
will
ing
to
co
ntr
ibu
te to
hea
lth
in
sura
nce
, giv
en it
s d
irec
t lin
k to
hea
lth
car
e b
enefi
ts,
than
to t
axes
.
• In
sura
nce
may
be
op
po
sed
b
y co
mp
anie
s an
d t
rad
e u
nio
ns
if se
en a
s in
crea
sin
g
lab
ou
r co
sts
bu
t n
ot
if se
en
as e
nfo
rced
sav
ing
s fo
r h
ealt
h s
ervi
ce b
enefi
ts.
• D
on
or l
oan
s ca
n fu
el
op
po
siti
on
bec
ause
of
con
dit
ion
s at
tach
ed to
th
em a
nd
bec
ause
of f
ears
th
at d
on
ors
will
att
emp
t to
in
fluen
ce h
ealt
h p
olic
y.
Col
lect
ing
orga
niza
tion
s (n
atur
e an
d go
als
of
orga
niza
tion
)
• O
rgan
izat
ion
al g
oal
s an
d in
tere
sts
(bro
ad
pu
blic
inte
rest
, pro
fit m
oti
ve, e
tc.)
may
in
fluen
ce w
ho
is t
arg
eted
for i
ncl
usi
on
.
• Le
vel o
f tax
an
d in
sura
nce
reve
nu
e is
aff
ecte
d
by
the
deg
ree
of t
rust
in, a
nd
co
mp
lian
ce
wit
h, t
he
gov
ern
men
t o
r in
sura
nce
o
rgan
izat
ion
.
• Th
e co
llect
ing
org
aniz
atio
n
mu
st b
e tr
ust
wo
rth
y,
acco
un
tab
le a
nd
free
of
corr
up
tio
n.
• Th
e co
llect
ing
org
aniz
atio
n
may
face
resi
stan
ce if
it
is n
ot
tru
sted
to a
ct
in t
he
bes
t in
tere
sts
of
con
trib
uto
rs.
Dia
ne
McI
nty
re 2
007
Criteria
Functions

Health care financing in low- and middle-income countries48Eq
uity
Effici
ency
Sust
aina
bilit
yFe
asib
ility
Risk
poo
ling
Cov
erag
e an
d co
mpo
siti
on o
f ris
k po
ols
• R
isk
po
olin
g is
no
t p
oss
ible
wit
h o
ut-
of-
po
cket
pay
men
ts a
nd
med
ical
sav
ing
s ac
cou
nts
.
• Th
e h
igh
er t
he
cove
rag
e ra
te o
f th
e p
op
ula
tio
n, t
he
gre
ater
th
e p
ote
nti
al fo
r in
com
e an
d r
isk
cro
ss-s
ub
sid
ies.
• If
no
ris
k-eq
ual
izat
ion
mec
han
ism
s ar
e in
p
lace
, tie
red
sys
tem
s, w
ith
diff
eren
t p
oo
ls
for d
iffer
ent
soci
o-e
con
om
ic g
rou
ps,
limit
in
com
e an
d r
isk-
bas
ed c
ross
-su
bsi
die
s.
• O
pt-
ou
t o
pti
on
s re
du
ce c
ross
-su
bsi
die
s.
• G
over
nm
ent
sho
uld
acc
ura
tely
tar
get
vu
lner
able
gro
up
s fo
r ext
ensi
on
of i
nsu
ran
ce
cove
r th
rou
gh
su
bsi
diz
ed c
on
trib
uti
on
s o
r en
sure
acc
ess
to t
ax-f
un
ded
hea
lth
ser
vice
s th
rou
gh
use
r fee
exe
mp
tio
ns.
• A
dve
rse
sele
ctio
n a
nd
cre
am-s
kim
min
g c
an
red
uce
allo
cati
ve e
ffici
ency
in t
he
over
all
hea
lth
sys
tem
.
• A
dm
inis
trat
ive
cost
s in
crea
se w
ith
att
emp
ted
ex
ten
sio
n o
f cov
erag
e b
eyo
nd
ben
efici
arie
s fr
om
wh
om
co
ntr
ibu
tio
ns
can
be
easi
ly
colle
cted
.
• Ve
ry s
mal
l ris
k p
oo
ls,
par
ticu
larl
y in
CB
HI
sch
emes
, can
be
un
sust
ain
able
, alt
ho
ug
h
rein
sura
nce
may
min
imiz
e th
is p
rob
lem
.
• U
nify
ing
pre
vio
usl
y fr
agm
ente
d r
isk
po
ols
or
intr
od
uci
ng
a s
ing
le r
isk
po
ol c
an fa
ce c
on
sid
erab
le
op
po
siti
on
if la
rge
inco
me
cro
ss-s
ub
sid
ies
are
nee
ded
an
d/o
r ben
efits
lim
ited
.
Allo
cati
on
mec
hani
sms
• A
nee
ds-
bas
ed fo
rmu
la fo
r allo
cati
ng
tax
re
sou
rces
pro
mo
tes
equ
ity,
bu
t re
ven
ue
acq
uir
ed fr
om
no
n-t
ax s
ou
rces
sh
ou
ld b
e ta
ken
into
acc
ou
nt
by
nee
ds
asse
ssm
ent.
• R
isk-
equ
aliz
atio
n b
etw
een
insu
ran
ce
sch
emes
imp
rove
s cr
oss
-su
bsi
die
s.
• R
isk-
equ
aliz
atio
n b
etw
een
insu
ran
ce
sch
emes
can
fost
er a
lloca
tive
an
d te
chn
ical
ef
ficie
ncy
bu
t m
ay h
ave
hig
h a
dm
inis
trat
ive
cost
s.
• To
o ra
pid
imp
lem
enta
tio
n
of a
nee
ds-
bas
ed fo
rmu
la
or r
isk-
equ
aliz
atio
n
mec
han
ism
can
jeo
par
diz
e th
e su
stai
nab
ility
of a
h
ealt
h s
yste
m in
cer
tain
re
spec
ts.
• A
nee
ds-
bas
ed
red
istr
ibu
tio
n o
f tax
fun
ds
amo
ng
geo
gra
ph
ic a
reas
an
d r
isk-
equ
aliz
atio
n
bet
wee
n in
sura
nce
sc
hem
es c
an fa
ce
con
sid
erab
le re
sist
ance
.
Purc
hasi
ng
Bene
fit p
acka
ge•
The
ben
efit
pac
kag
e d
eter
min
es t
he
exte
nt
of c
ross
-su
bsi
die
s, w
hic
h a
re li
mit
ed to
se
rvic
es in
clu
ded
in t
he
pac
kag
e.
• Th
e b
enefi
t p
acka
ge
influ
ence
s th
e d
egre
e o
f fin
anci
al p
rote
ctio
n g
iven
to h
ou
seh
old
s.
• C
o-p
aym
ents
lim
it e
qu
itab
le a
cces
s to
hea
lth
ca
re.
• Th
e b
enefi
t p
acka
ge
can
hav
e an
ad
vers
e ef
fect
on
allo
cati
ve e
ffici
ency
if it
do
es n
ot
cove
r ser
vice
s th
at a
re m
ost
nee
ded
by
the
maj
ori
ty o
f ben
efici
arie
s an
d t
hat
are
co
st-
effe
ctiv
e.
• PH
C g
atek
eep
ers
enh
ance
tech
nic
al
effic
ien
cy.
• Th
e b
enefi
t p
acka
ge
sho
uld
be
tailo
red
to t
he
avai
lab
ility
of r
eso
urc
es a
nd
m
ust
be
clea
rly
defi
ned
in
ord
er to
kee
p e
xpen
dit
ure
in
ch
eck.
• Th
ere
is a
tra
de-
off
bet
wee
n
bre
adth
an
d d
epth
of
cove
rag
e.
• Fe
asib
ility
dep
end
s o
n
the
exte
nt
to w
hic
h t
he
ben
efit
pac
kag
e m
atch
es
ben
efici
arie
s’ p
refe
ren
ces.
Prov
ider
pay
men
t m
echa
nism
s•
Som
e p
aym
ent
mec
han
ism
s m
ay e
nco
ura
ge
pro
vid
ers
to fo
cus
on
th
e h
ealt
hy
and
w
ealt
hy.
• A
pay
men
t m
ech
anis
m c
an h
ave
a p
rofo
un
d
imp
act
on
tech
nic
al e
ffici
ency
.
• A
sm
all n
um
ber
of l
arg
e p
urc
has
ers
can
n
ego
tiat
e m
ore
eff
ecti
vely
wit
h p
rovi
der
s.
• Th
e ch
oic
e o
f pay
men
t m
ech
anis
m c
an in
fluen
ce
the
pre
dic
tab
ility
of
exp
end
itu
re a
nd
th
e ab
ility
to
co
nta
in c
ost
s.
• Pr
ovid
ers
are
likel
y to
o
pp
ose
mec
han
ism
s th
at
limit
th
eir i
nco
me.
Criteria
Functions
Sum
mar
y of
key
issu
es in
hea
lth c
are
finan
cing
Dia
ne
McI
nty
re 2
007

App
endi
x A
Appendix A: Financial protection for the poor
This appendix provides a brief overview of international experience in designing exemption schemes (Bitrán and Giedion, 2003; Ensor, 2004; Garshong et al., 2002; Gilson, 1998; Gilson et al., 1995; Gilson et al., 1998; Newbrander et al., 2000; Nyonator and Kutzin, 1999). The main focus of the appendix is the exemption of vulnerable individuals from paying user fees. Most of the points it highlights, however, also have a bearing on full or partial subsidization of the contributions vulnerable population groups are required to make to community-based or mandatory health insurance. The appendix also offers guidance on identifying such vulnerable groups.
Who should be the beneficiaries of exemptions?There is general agreement that the most vulnerable groups should be protected from health care costs. Although “the poor” are often the targets of such protection, identifying the poor by means testing is both time-consuming and administratively costly. For this reason, many countries target exemptions on the basis of demographic characteristics, such as children under five, pregnant women, the elderly, and so on, or on the basis of health problems, such as diarrhoeal diseases, that disproportionately affect the poor. These categorizations, however, have shortcomings: young children from wealthy households, for example, may be included as beneficiaries, whereas truly poor people who do not fall into one of these demographic or disease categories may not benefit. Where individual targeting is considered too difficult, it may be more appropriate to identify small geographic areas, such as villages or sub-districts, that are thought to have a very high concentration of poor residents and exempt all residents from fees or fully subsidize their health insurance contributions.
When should an assessment be made of a person’s eligibility for exemption of insurance contributions?Traditionally, most countries assess eligibility for fee exemption when the person presents at a health facility. However, more and more countries do so at a community level before individuals or households actually need to use the health services. In Colombia, for example, municipalities undertake surveys within their communities to identify the poor. In Thailand, the poor are required to apply to their village committee and can do so at any time.
When an exemption eligibility assessment has been undertaken at the community level, there must be a mechanism for health workers to identify those who have been judged eligible for exemptions. A card can be given to the person (as in Thailand’s LI Card scheme), although this system may prove expensive, particularly if the card bears a photograph of the eligible person in order to prevent non-exempt individuals from using the card. Alternatively, the local health facility could be provided with a list of eligible people who are required to bring some form of photo identification with them when seeking health care. Where a health facility is based in a small community, particularly where staff make extension visits, photo identification may not be necessary.
There has been a recent trend towards community-level eligibility assessments made in advance, because they improve access to, and increase the use of, health services:
Health care financing in low- and middle-income countries50
the poor who are eligible are sure that they will receive free care if they seek it. By contrast, if the assessment is done when a patient presents at a health facility, potential beneficiaries may be discouraged from seeking care as they are not sure that an exemption will be granted. Another factor that deters the poor from seeking care if the assessment is done at the facility, particularly in the presence of other patients (as is the practice in Cambodia), is the stigma attached to poverty.
Advance identification of the most vulnerable individuals is also useful in identifying those whose health insurance contributions should be subsidized. The poor are identified in advance, enrolled in the insurance scheme and issued with a health insurance card: their contribution is then fully or partially paid from general tax or pooled donor funds.
Given the many barriers to the use of health services by the poor, there is a growing consensus in favour of proactive identification of exemption beneficiaries as a means of boosting the demand for health services among the poor. Several countries are also considering or are already implementing voucher schemes, whereby a poor household is issued with a voucher that has a specified monetary value and can be presented at a health facility as payment of services. This is simply another way of identifying those who have been judged eligible for free care and of assuring the poor that they will not have to pay for health care when they need it. Vouchers are frequently used when the goal is to enable access to a range of health care providers, whether public or private, whereas standard exemption mechanisms only operate in the public sector.
A factor that affects the timing of an exemption eligibility assessment is the duration of eligibility. People’s socio-economic circumstances may change over time, with some achieving higher living standards and others sliding into poverty. For this reason, permanent exemption status on the grounds of poverty is not advisable. However, the shorter the duration of exemption, the more frequent the need for renewal and the greater the administrative costs. International experience indicates that exemption eligibility should last for a year or two. In some countries, the period of validity is three years, as is the case for Thailand’s LI Card scheme.
Who should carry out an exemption eligibility assessment?The issue of who should undertake the assessment is closely related to when and where the assessment is carried out. If the assessment takes place when a patient presents at a health facility, it is likely to be conducted by staff at the facility. At a primary care facility, this would usually be a health worker, whereas in a large hospital, it may be the task of a social worker employed by the hospital. However, one observer has noted that identifying those who currently do not gain access to health services due to inability to pay has “proven elusive in the hands of health workers alone” (Adams, 2002). This is particularly the case when fee revenue is retained at health facility level and where the facility depends on such revenue to maintain service quality, including availability of routinely used drugs. There is a clear incentive for health service providers to minimize the number of exemptions granted.
An assessment undertaken at the community level is usually performed by a committee of community representatives. Problems have arisen where the decision to grant or withhold exemption is in the hands of a few powerful local leaders, who may abuse

Appendix A – Financial protection for the poor 51
their power and award exemptions to non-poor relatives, friends or political supporters. The challenge is thus to identify respected, trusted community representatives to serve on the committee and to provide them with clear guidelines as to how the assessment should be carried out. The same approach would be used to identify households eligible for fully or partially subsidized health insurance.
Internationally, exemption schemes that have been successful tend to use a mix of the above approaches. A social welfare officer or health extension worker may assist in identifying likely candidates, but the final decision is made by a committee comprised of community members, one or more respected community or local government leaders, and a representative of the local health facility.
How should the exemption eligibility assessment be conducted?Some countries, such as Zimbabwe, still use a means test with an income cut-off point. Most countries, however, use more easily measurable and verifiable proxy indicators of poverty, such as:
• housing, including the type of building material, size of the house, number of rooms, and so on;
• number of household members or dependents;• educational level of adult household members;• ownership of assets, such as vehicles, livestock or other durable assets;• occupation or employment status;• indicators of vulnerability, such as being female, a child, an elderly household head
or a member of a minority group and unable to meet the household’s needs for food, and so on.
Many countries have found that, to ensure a certain consistency between geographic areas in the granting of exemptions, it is useful to provide broad national or regional guidelines on eligibility for exemptions, including a set of questions based on proxy indicators of poverty. However, some local input is advisable from the community and from local leaders, who have a sense of what poverty means in their community, e.g. some indicators, such as livestock ownership, may not be applicable to a given community.
How should exemptions be funded?There is a strong consensus that exemption strategies will fail unless there is adequate funding to reimburse the revenue “lost” by facilities providing services to exemption beneficiaries. Increasingly, health facilities retain the fee revenue they generate and use it to provide adequate services. If revenue losses through exemptions are not reimbursed, health facilities will ration or stop providing services to those eligible for exemptions. This is also true of subsidized health insurance membership: if contributions are not paid to schemes from some kind of subsidization fund, they will not cover the poor.
The exemption package and the number of households receiving subsidized insurance membership must be aligned closely with the availability of government (and donor) resources. This requirement calls for accurate information about the likely cost of exemptions, such as the number of people who would be eligible for exemptions (or for subsidized insurance membership), the expected use of services by exempted patients

Health care financing in low- and middle-income countries52
and the fee levels (or contribution rates of insurance members). This information can be used to identify the funding requirements for exemptions and to estimate the number of people to be exempted and/or the services to be provided to exempted members.
Exemptions can be funded in different ways. In some cases, the fees charged to non-exempt patients are inflated to subsidize care provided to those exempted. Similarly, health insurance rates can be increased to subsidize membership for the poor. However, it is difficult to generate sufficient funds through this approach in countries with very high levels of overall poverty. In the vast majority of countries, government funding, sometimes combined with donor “basket” funding (i.e. several donors combining their resources with government funds), is used as the primary, if not the only, source of exemption reimbursements and insurance contribution subsidies. From an equity perspective, such funding is critical, given that geographic areas with the highest levels of poverty and the greatest need for exemptions and insurance subsidies are also the areas least able to generate revenue for fees or insurance contributions.
A useful way of fostering equitable access to health services and to ensure an appropriate distribution of exemptions or subsidized insurance memberships between districts/municipalities is to allocate government (and donor) funds available for exemptions to districts/municipalities on the basis of need, in this case defined as the local poverty level. This mechanism will reduce disparities in fee and insurance contribution revenue between districts or municipalities. In addition, local committees will be able to determine how many people or households can be exempted or given subsidized insurance – within the limits of the budget granted for reimbursement. They can then prioritize the allocation of exemptions or insurance contribution subsidies to those in greatest need.
What are the keys to successful implementation of an exemption policy?It is crucial for health personnel, facility managers and the general public to be fully informed about the exemption policy. There is often resistance among health workers to implementing exemptions, even if “lost revenue” is reimbursed. It is, therefore, important to explain the rationale and importance of the policy, particularly if discriminatory practices towards exempted patients are to be avoided. One advantage of subsidized insurance membership over user fee exemptions is that there is less likely to be discrimination against the beneficiaries by health service providers. A patient benefiting from a fee exemption is clearly identifiable (e.g. when showing an exemption card or when requesting an exemption at a health facility), whereas a patient with a subsidized insurance membership will carry a membership card (or be included on a list at the facility) that is no different from that of a full contributor. People eligible for exemptions or subsidized insurance membership should be made aware of this entitlement. Informing the general public can also serve to make members of an eligibility assessment committee more accountable to the community.
A final lesson from international experience is that successful exemption mechanisms include monitoring and evaluation strategies from the outset. The information from monitoring and evaluation is used to refine the exemption mechanism, ensure maximum coverage of the poor, and reduce “leakage” to those who are not eligible.

Appendix B: Key macroeconomic, health and health care expenditure indicators
App
endi
x B
Co
un
try
HD
I2
00
3
GD
P p
erca
pit
aP
PP
US$
20
03
GD
P p
erca
pit
ag
row
th
p.a
.1
99
0-
20
03
Gin
iIn
dex
Urb
anP
op
.%
of t
ota
l2
00
3
Life
exp
ect-
ancy
at b
irth
20
03
IMR
per
10
00
live
bir
ths
20
03
Hea
lth
exp
. as
%
of t
ota
l g
ovt
. exp
.2
00
2
Per
cap
ita
hea
lth
ex
p.
PP
P U
S$2
00
2
Pri
vate
hea
lth
ex
p.
% G
DP
20
02
Exte
rnal
% t
ota
lh
ealt
h
exp
.2
00
2
Pu
blic
hea
lth
ex
p.
% G
DP
20
02
Deb
tse
rvic
e%
GD
P2
00
3
Mili
tary
exp
end
.%
GD
P2
00
3
Hig
h-i
nco
me
cou
ntr
ies
Luxe
mb
ou
rg0.
949
62 2
983.
6..
91.8
78.5
514
.830
660.
90
5.3
..0.
9
Irel
and
0.94
637
738
6.7
35.9
59.9
77.7
616
.323
671.
80
5.5
..0.
7
No
rway
0.96
337
670
2.9
25.8
78.6
79.4
317
.434
091.
60
8.0
..2.
0
Un
ited
Sta
tes
0.94
437
562
2.1
40.8
80.1
77.4
718
.252
748.
00
6.6
..3.
8
Den
mar
k0.
941
31 4
651.
924
.785
.477
.23
13.2
2583
1.5
07.
3..
1.5
Icel
and
0.95
631
243
2.1
..92
.880
.73
18.2
2802
1.6
08.
3..
0.0
Can
ada
0.94
930
677
2.3
33.1
80.4
80.0
516
.129
312.
90
6.7
..1.
2
Swit
zerl
and
0.94
730
552
0.5
33.1
67.6
80.5
418
.234
464.
70
6.5
..1.
0
Au
stri
a0.
936
30 0
941.
830
.065
.879
.04
1022
202.
30
5.4
..0.
8
Au
stra
lia0.
955
29 6
322.
635
.291
.980
.36
17.7
2699
3.0
06.
5..
1.9
Net
her
lan
ds
0.94
329
371
2.1
30.9
65.8
78.4
512
2564
3.0
05.
8..
1.6
Bel
giu
m0.
945
28 3
351.
825
.097
.278
.94
12.5
2515
2.6
06.
5..
1.3
Jap
an0.
943
27 9
671.
024
.965
.582
.03
16.8
2133
1.4
06.
5..
1.0
Ger
man
y0.
930
27 7
561.
328
.388
.178
.74
17.6
2817
2.3
08.
6..
1.4
Fran
ce0.
938
27 6
771.
632
.776
.379
.54
13.8
2736
2.3
07.
4..
2.6
Fin
lan
d0.
941
27 6
192.
526
.961
.078
.54
1119
431.
80
5.5
..1.
2
Hon
g K
ong,
Ch
ina
(SA
R)0.
916
27 1
792.
143
.410
0.0
81.6
.. ..
....
.. ..
....
Un
ited
Kin
gd
om
0.93
927
147
2.5
36.0
89.1
78.4
515
.421
601.
30
6.4
..2.
8
Ital
y0.
934
27 1
191.
536
.067
.480
.14
13.1
2166
2.1
06.
4..
1.9
Swed
en0.
949
26 7
502.
025
.083
.480
.23
13.4
2512
1.4
07.
8..
1.8
Sin
gap
ore
0.90
724
481
3.5
42.5
100.
078
.73
6.6
1105
3.0
01.
3..
5.2
New
Zea
lan
d0.
933
22 5
822.
136
.285
.979
.15
17.3
1857
1.9
06.
6..
1.1
Un
ited
Ara
b E
mir
ates
0.84
922
420
-2.1
..85
.178
.07
7.8
750
0.8
02.
3..
3.1
Spai
n0.
928
22 3
912.
432
.576
.579
.54
13.4
1640
2.2
05.
4..
1.2
Isra
el0.
915
20 0
331.
635
.591
.679
.75
11.4
1890
3.1
4.9
6.0
..9.
1
Gre
ece
0.91
219
954
2.1
35.4
60.9
78.3
410
.118
144.
5n
/a5.
0..
4.1
Qat
ar0.
849
19 8
44..
..92
.072
.811
6.8
894
0.7
02.
4..
..
Equ
ato
rial
Gu
inea
0.65
519
780
16.8
..48
.043
.397
8.8
139
0.5
3.6
1.3
0.3
..
Bru
nei
Dar
uss
alam
0.86
619
210
....
76.1
76.4
54.
765
30.
8n
/a2.
7..
..
Slov
enia
0.90
419
150
3.1
28.4
50.8
76.4
414
1547
2.1
0.1
6.2
..1.
5

Health care financing in low- and middle-income countries54
Co
un
try
HD
I2
00
3
GD
P p
erca
pit
aP
PP
US$
20
03
GD
P p
erca
pit
ag
row
th
p.a
.1
99
0-
20
03
Gin
iIn
dex
Urb
anP
op
.%
of t
ota
l2
00
3
Life
exp
ect-
ancy
at b
irth
20
03
IMR
per
10
00
live
bir
ths
20
03
Hea
lth
exp
. as
%
of t
ota
l g
ovt
. exp
.2
00
2
Per
cap
ita
hea
lth
ex
p.
PP
P U
S$2
00
2
Pri
vate
hea
lth
ex
p.
% G
DP
20
02
Exte
rnal
% t
ota
lh
ealt
h
exp
.2
00
2
Pu
blic
hea
lth
ex
p.
% G
DP
20
02
Deb
tse
rvic
e%
GD
P2
00
3
Mili
tary
exp
end
.%
GD
P2
00
3
Cyp
rus
0.89
118
776
3.2
..69
.278
.64
6.8
883
4.1
2.6
2.9
..1.
5
Port
ug
al0.
904
18 1
262.
238
.554
.677
.24
14.3
1702
2.7
06.
6..
2.1
Kuw
ait
0.84
418
047
-2.3
..96
.276
.98
6.6
552
0.9
02.
9..
9.0
Ko
rea,
Rep
. of
0.90
117
971
4.6
31.6
80.3
77.0
510
.798
22.
40
2.6
..2.
5
Mal
ta0.
867
17 6
333.
3..
91.6
78.4
515
.396
52.
70
7.0
..0.
8
Bah
rain
0.84
617
479
1.5
..90
.074
.312
8.7
792
1.2
03.
2..
5.1
Bah
amas
0.83
217
159
0.3
..89
.469
.711
14.6
1074
3.5
0.2
3.4
....
Mid
dle
-in
com
e co
un
trie
sC
zech
Rep
ub
lic0.
874
16 3
571.
525
.474
.375
.64
13.9
1118
0.6
06.
46.
12.
2
Bar
bad
os
0.87
815
720
1.4
..51
.775
.011
12.3
1018
2.2
4.2
4.7
3.2
..
Hu
ng
ary
0.86
214
584
2.6
26.9
65.2
72.7
710
.410
782.
30
5.5
18.3
1.8
Om
an0.
781
13 5
840.
9..
77.6
74.1
107.
237
90.
60
2.8
0.0
12.2
Esto
nia
0.85
313
539
3.3
37.2
69.5
71.3
810
.660
41.
20
3.9
13.4
1.9
Slov
akia
0.84
913
494
2.4
25.8
57.5
74.0
711
.572
30.
60
5.3
10.7
1.9
Sau
di A
rab
ia0.
772
13 2
26-0
.6..
87.6
71.8
2210
.653
41.
00
3.3
..8.
7
Sain
t K
itts
an
d N
evis
0.83
412
404
3.1
..32
.270
.019
9.7
667
2.1
4.8
3.4
12.6
..
Arg
enti
na
0.86
312
106
1.3
52.2
90.1
74.5
1715
.295
64.
40.
34.
510
.81.
2
Lith
uan
ia0.
852
11 7
020.
531
.966
.872
.38
14.2
549
1.6
1.5
4.3
36.4
1.6
Pola
nd
0.85
811
379
4.2
34.1
61.9
74.3
610
.265
71.
70
4.4
9.1
2.0
Mau
riti
us
0.79
111
287
4.0
..43
.372
.216
9.4
317
0.7
1.4
2.2
4.5
0.2
Cro
atia
0.84
111
080
2.1
29.0
59.0
75.0
613
.263
01.
41
5.9
11.8
2.1
Trin
idad
an
d T
ob
ago
0.80
110
766
3.2
40.3
75.4
69.9
175.
742
82.
36.
61.
42.
4..
Sou
th A
fric
a0.
658
10 3
460.
157
.856
.948
.453
11.6
689
5.2
0.4
3.5
2.7
1.6
An
tig
ua
and
Bar
bu
da
0.79
710
294
1.6
..37
.873
.911
1052
71.
51.
13.
3..
..
Ch
ile0.
854
10 2
744.
157
.187
.077
.98
11.8
642
3.2
02.
611
.73.
5
Latv
ia0.
836
10 2
702.
233
.666
.371
.610
9.3
477
1.8
0.4
3.3
8.4
1.7
Seyc
hel
les
0.82
110
232
2.2
..50
.072
.711
755
71.
30.
53.
911
.01.
7
Co
sta
Ric
a0.
838
9606
2.6
46.5
60.6
78.2
822
.274
33.
21.
66.
14.
80.
0
Mal
aysi
a0.
796
9512
3.4
49.2
63.8
73.2
76.
634
91.
80
2.0
9.1
2.8
Russ
ian
Fed
erat
ion
0.79
592
30-1
.531
.073
.365
.316
9.6
535
2.7
0.2
3.5
4.4
4.3
Mex
ico
0.81
491
681.
454
.675
.575
.123
11.6
550
3.4
0.8
2.7
6.5
0.5
Bo
tsw
ana
0.56
587
142.
763
.051
.636
.382
6.4
387
2.3
3.4
3.7
0.7
4.1

Appendix B – Key macroeconomic, health and health care expenditure indicators 55
Co
un
try
HD
I2
00
3
GD
P p
erca
pit
aP
PP
US$
20
03
GD
P p
erca
pit
ag
row
th
p.a
.1
99
0-
20
03
Gin
iIn
dex
Urb
anP
op
.%
of t
ota
l2
00
3
Life
exp
ect-
ancy
at b
irth
20
03
IMR
per
10
00
live
bir
ths
20
03
Hea
lth
exp
. as
%
of t
ota
l g
ovt
. exp
.2
00
2
Per
cap
ita
hea
lth
ex
p.
PP
P U
S$2
00
2
Pri
vate
hea
lth
ex
p.
% G
DP
20
02
Exte
rnal
% t
ota
lh
ealt
h
exp
.2
00
2
Pu
blic
hea
lth
ex
p.
% G
DP
20
02
Deb
tse
rvic
e%
GD
P2
00
3
Mili
tary
exp
end
.%
GD
P2
00
3
Uru
gu
ay0.
840
8280
0.9
44.6
92.5
75.4
128
805
7.1
0.6
2.9
7.8
1.6
Gre
nad
a0.
787
7959
2.4
..40
.765
.318
10.7
465
1.7
10.5
4.0
7.0
..
Bra
zil
0.79
277
901.
259
.383
.070
.533
9.7
611
4.3
0.5
3.6
11.5
1.6
Bu
lgar
ia0.
808
7731
0.6
31.9
69.8
72.2
1411
.349
93.
41.
34.
05.
82.
6
Thai
lan
d0.
778
7595
2.8
43.2
32.0
70.0
2311
.832
11.
30.
23.
110
.51.
3
Ro
man
ia0.
792
7277
0.6
30.3
54.6
71.3
1810
.546
92.
13.
74.
26.
42.
4
Tun
isia
0.75
371
613.
139
.863
.773
.319
6.9
415
2.9
0.2
2.9
6.4
1.6
Iran
, Is
lam
ic R
ep. o
f0.
736
6995
2.1
43.0
66.6
70.4
338
432
3.1
0.1
2.9
1.2
3.8
Ton
ga
0.81
069
922.
0..
33.5
72.2
1517
.129
21.
833
.55.
12.
3..
Bel
ize
0.75
369
502.
2..
48.4
71.9
335.
330
02.
78
2.5
13.6
..
Pan
ama
0.80
468
542.
456
.457
.274
.818
20.2
576
2.5
16.
47.
4..
Do
min
ican
Rep
ub
lic0.
749
6823
4.0
47.4
59.3
67.2
2912
.429
53.
92
2.2
5.6
..
Mac
edo
nia
, TFY
R0.
797
6794
-0.7
28.2
59.6
73.8
1014
....
1.8
..5.
22.
5
Turk
ey0.
750
6772
1.3
40.0
66.3
68.7
3312
.142
02.
20
4.3
11.7
4.9
Co
lom
bia
0.78
567
020.
457
.676
.472
.418
1953
61.
40
6.7
10.7
4.4
Kaz
akh
stan
0.76
166
710.
432
.355
.963
.263
926
11.
60.
81.
917
.81.
1
Gab
on
0.63
563
97-0
.4..
83.7
54.5
6010
.724
82.
50.
71.
86.
2..
Nam
ibia
0.62
761
800.
970
.732
.448
.348
1133
12.
04.
34.
7..
2.8
Sain
t Vin
cen
t an
d t
he
Gre
nad
ines
0.75
561
231.
8..
58.2
71.1
2310
.734
02.
00.
13.
93.
9..
Alg
eria
0.72
261
070.
635
.358
.871
.135
9.6
182
1.1
03.
26.
53.
3
Bel
aru
s0.
786
6052
0.9
30.4
70.9
68.1
1310
.158
31.
70.
14.
71.
41.
3
Bo
snia
an
d
Her
zeg
ovin
a0.
786
5967
11.9
26.2
44.4
74.2
148.
632
24.
61.
84.
62.
62.
9
Turk
men
ista
n0.
738
5938
-1.3
40.8
45.4
62.4
7912
.718
21.
30.
53.
0..
..
Fiji
0.75
258
801.
8..
51.7
67.8
168.
324
01.
55.
72.
71.
41.
6
Sam
oa
(Wes
tern
)0.
776
5854
2.4
..22
.370
.219
24.5
238
1.5
18.3
4.7
4.9
..
Sain
t Lu
cia
0.77
257
090.
3..
30.5
72.4
1610
.630
61.
60.
13.
44.
7..
Ukr
ain
e0.
766
5491
-4.7
29.0
67.3
66.1
159.
421
01.
43.
13.
37.
42.
9
Do
min
ica
0.78
354
481.
2..
72.0
75.6
1211
.931
01.
80.
54.
66.
5..
Peru
0.76
252
602.
149
.873
.970
.026
12.1
226
2.2
4.6
2.2
4.2
1.3
Cap
e Ve
rde
0.72
152
143.
3..
55.9
70.4
2611
.119
31.
215
.23.
82.
70.
7
Leb
ano
n0.
759
5074
2.9
..87
.572
.027
8.8
697
8.0
0.1
3.5
17.1
4.3

Health care financing in low- and middle-income countries56
Co
un
try
HD
I2
00
3
GD
P p
erca
pit
aP
PP
US$
20
03
GD
P p
erca
pit
ag
row
th
p.a
.1
99
0-
20
03
Gin
iIn
dex
Urb
anP
op
.%
of t
ota
l2
00
3
Life
exp
ect-
ancy
at b
irth
20
03
IMR
per
10
00
live
bir
ths
20
03
Hea
lth
exp
. as
%
of t
ota
l g
ovt
. exp
.2
00
2
Per
cap
ita
hea
lth
ex
p.
PP
P U
S$2
00
2
Pri
vate
hea
lth
ex
p.
% G
DP
20
02
Exte
rnal
% t
ota
lh
ealt
h
exp
.2
00
2
Pu
blic
hea
lth
ex
p.
% G
DP
20
02
Deb
tse
rvic
e%
GD
P2
00
3
Mili
tary
exp
end
.%
GD
P2
00
3
Ch
ina
0.75
550
038.
544
.738
.671
.630
9.4
261
3.8
0.1
2.0
2.6
2.3
Ven
ezu
ela
0.77
249
19-1
.549
.187
.672
.918
7.8
272
2.6
0.1
2.3
10.4
1.3
El S
alva
do
r0.
722
4781
2.1
53.2
59.4
70.9
3222
.837
24.
40.
73.
63.
70.
7
Swaz
ilan
d0.
498
4726
0.2
60.9
23.6
32.5
105
10.9
309
2.4
5.1
3.6
1.5
..
Para
gu
ay0.
755
4684
-0.6
57.8
57.2
71.0
2515
343
5.2
3.2
3.2
5.1
0.9
Alb
ania
0.78
045
845.
128
.243
.873
.818
930
23.
73.
72.
40.
91.
2
Phili
pp
ines
0.75
843
211.
246
.161
.070
.427
4.9
153
1.8
2.8
1.1
12.8
0.9
Jord
an0.
753
4320
0.9
36.4
79.1
71.3
239.
941
85.
03.
44.
311
.78.
9
Gu
yan
a0.
720
4230
3.6
..37
.663
.152
12.2
227
1.3
2.6
4.3
7.8
..
Gu
atem
ala
0.66
341
481.
159
.946
.367
.335
14.1
199
2.5
2.2
2.3
1.9
0.5
Jam
aica
0.73
841
04(.)
37.9
52.2
70.8
174.
523
42.
64.
73.
410
.1..
Mo
rocc
o0.
631
4004
1.0
39.5
57.4
69.7
365.
318
63.
10.
51.
59.
84.
2
Egyp
t0.
659
3950
2.5
34.4
42.2
69.8
338.
419
23.
10.
81.
83.
42.
6
Sri L
anka
0.75
137
783.
333
.221
.174
.013
6.4
131
1.9
1.9
1.8
3.3
2.7
Arm
enia
0.75
936
712.
837
.964
.571
.530
5.3
232
4.5
22.2
1.3
3.4
2.7
Ecu
ado
r0.
759
3641
0.1
43.7
61.8
74.3
249.
719
73.
11
1.7
8.9
2.4
Aze
rbai
jan
0.72
936
17-2
.636
.550
.166
.975
2.9
120
2.9
1.9
0.8
3.4
1.9
Syri
an A
rab
Rep
ub
lic0.
721
3576
1.4
..50
.273
.316
6.5
109
2.8
0.3
2.3
1.6
7.1
Ind
on
esia
0.69
733
612.
034
.345
.566
.831
5.1
110
2.0
1.8
1.2
8.9
1.5
Nic
arag
ua
0.69
032
620.
943
.157
.369
.730
15.2
206
4.0
9.3
3.9
5.0
0.9
Van
uat
u0.
659
2944
-0.3
..22
.968
.631
1212
11.
018
.32.
80.
7..
Ind
ia0.
602
2892
4.0
32.5
28.3
63.3
633.
996
4.8
1.3
1.3
3.4
2.1
Ho
nd
ura
s0.
667
2665
0.2
55.0
45.6
67.8
3215
.615
63.
07.
23.
25.
90.
4
Pap
ua
New
Gu
inea
0.52
326
190.
250
.913
.255
.369
11.4
136
0.5
37.7
3.8
9.3
0.6
Geo
rgia
0.73
225
88-2
.736
.952
.070
.541
6.6
123
2.8
10.7
1.0
4.5
1.1
Bo
livia
0.68
725
871.
344
.763
.464
.153
11.6
179
2.8
7.4
4.2
5.4
1.7
Leso
tho
0.49
725
612.
363
.218
.036
.363
10.9
119
0.9
6.4
5.3
5.9
2.6
Vie
t N
am0.
704
2490
5.9
37.0
25.8
70.5
195.
114
83.
73.
51.
52.
1..
Zim
bab
we
0.50
524
43-0
.856
.835
.036
.978
9.8
152
4.1
1.4
4.4
0.0
2.1
An
go
la0.
445
2344
0.4
..35
.740
.815
44.
192
2.9
8.3
2.1
10.1
4.7
Gh
ana
0.52
022
381.
840
.845
.456
.859
5.4
733.
314
.42.
36.
30.
7
Cam
ero
on
0.49
721
180.
244
.651
.445
.895
8.4
683.
42.
31.
23.
61.
5

Appendix B – Key macroeconomic, health and health care expenditure indicators 57
Co
un
try
HD
I2
00
3
GD
P p
erca
pit
aP
PP
US$
20
03
GD
P p
erca
pit
ag
row
th
p.a
.1
99
0-
20
03
Gin
iIn
dex
Urb
anP
op
.%
of t
ota
l2
00
3
Life
exp
ect-
ancy
at b
irth
20
03
IMR
per
10
00
live
bir
ths
20
03
Hea
lth
exp
. as
%
of t
ota
l g
ovt
. exp
.2
00
2
Per
cap
ita
hea
lth
ex
p.
PP
P U
S$2
00
2
Pri
vate
hea
lth
ex
p.
% G
DP
20
02
Exte
rnal
% t
ota
lh
ealt
h
exp
.2
00
2
Pu
blic
hea
lth
ex
p.
% G
DP
20
02
Deb
tse
rvic
e%
GD
P2
00
3
Mili
tary
exp
end
.%
GD
P2
00
3
Djib
ou
ti0.
495
2086
-3.3
..83
.652
.897
10.8
783.
031
.63.
32.
5..
Cu
ba
0.81
7..
3.5
..75
.777
.36
11.2
236
1.0
0.2
6.5
....
Lib
yan
Ara
b
Jam
ahir
iya
0.79
9..
....
86.2
73.6
137.
922
21.
70
1.6
..2.
0
Suri
nam
e0.
755
..0.
9..
76.0
69.1
3010
.438
55.
07.
33.
6..
..
Mal
div
es0.
745
..4.
7..
28.8
66.6
5513
.330
70.
73.
45.
13.
0..
Low
-in
com
e co
un
trie
sG
uin
ea0.
466
2097
1.6
40.3
34.9
53.7
104
4.2
105
4.9
6.3
0.9
3.6
..
Paki
stan
0.52
720
971.
133
.034
.163
.081
3.1
622.
12
1.1
3.7
4.4
Mya
nm
ar0.
578
..5.
7..
29.5
60.2
762.
330
1.8
10.
40.
0..
Tim
or-
Lest
e0.
513
....
..7.
755
.587
8.6
195
3.5
45.8
6.2
....
Cam
bo
dia
0.57
120
784.
040
.418
.656
.297
9.9
192
9.9
11.5
2.1
0.6
2.5
Bh
uta
n0.
536
1969
3.6
..8.
562
.970
8.3
760.
423
.94.
11.
0..
Sud
an0.
512
1910
3.3
..38
.956
.463
8.8
583.
92.
91.
00.
22.
4
Gam
bia
0.47
018
59-0
.147
.526
.255
.790
1283
4.0
18.5
3.3
5.0
0.5
Mo
ng
olia
0.67
918
50-2
.530
.356
.864
.056
11.5
128
2.0
12.8
4.6
22.6
..
Ban
gla
des
h0.
520
1770
3.1
31.8
24.3
62.8
465.
454
2.3
12.9
0.8
1.3
1.2
Mau
rita
nia
0.47
717
661.
639
.061
.752
.712
09.
254
1.0
2.5
2.9
5.0
1.6
Lao
Peo
ple
's D
em. R
ep.
0.54
517
593.
737
.020
.754
.782
7.6
491.
49.
51.
52.
3..
Solo
mo
n Is
lan
ds
0.59
417
53-2
.5..
16.5
62.3
1913
.283
0.3
40.9
4.5
3.7
..
Kyrg
yzst
an0.
702
1751
-2.4
34.8
34.0
66.8
598.
711
72.
19.
92.
27.
12.
9
Uzb
ekis
tan
0.69
417
44-0
.526
.836
.766
.557
6.8
143
3.0
4.1
2.5
8.2
0.5
Hai
ti0.
475
1742
-2.8
..37
.551
.676
23.8
834.
615
.63.
01.
8..
Co
mo
ros
0.54
717
14-1
.3..
35.0
63.2
546.
427
1.2
431.
70.
8..
Tog
o0.
512
1696
0.4
..35
.254
.378
6.9
163
9.4
11.4
1.1
0.9
1.6
Sen
egal
0.45
816
481.
341
.349
.655
.778
9.5
622.
810
.32.
33.
81.
5
Mo
ldov
a, R
ep. o
f0.
671
1510
-5.7
36.9
46.1
67.7
2612
.915
12.
92.
84.
18.
10.
4
Cô
te d
'Ivo
ire
0.42
014
76-0
.444
.644
.945
.911
76.
210
74.
83.
71.
44.
21.
5
Ug
and
a0.
508
1457
3.9
43.0
12.3
47.3
8110
.877
5.3
29.1
2.1
1.3
2.3

Health care financing in low- and middle-income countries58
Co
un
try
HD
I2
00
3
GD
P p
erca
pit
aP
PP
US$
20
03
GD
P p
erca
pit
ag
row
th
p.a
.1
99
0-
20
03
Gin
iIn
dex
Urb
anP
op
.%
of t
ota
l2
00
3
Life
exp
ect-
ancy
at b
irth
20
03
IMR
per
10
00
live
bir
ths
20
03
Hea
lth
exp
. as
%
of t
ota
l g
ovt
. exp
.2
00
2
Per
cap
ita
hea
lth
ex
p.
PP
P U
S$2
00
2
Pri
vate
hea
lth
ex
p.
% G
DP
20
02
Exte
rnal
% t
ota
lh
ealt
h
exp
.2
00
2
Pu
blic
hea
lth
ex
p.
% G
DP
20
02
Deb
tse
rvic
e%
GD
P2
00
3
Mili
tary
exp
end
.%
GD
P2
00
3
Nep
al0.
526
1420
2.2
36.7
15.0
61.6
619.
564
3.8
8.4
1.4
1.9
1.6
Rwan
da
0.45
012
680.
728
.918
.543
.911
810
.248
2.4
46.9
3.1
1.3
2.8
São
To
mé
and
Pri
nci
pe
0.60
412
31-0
.2..
37.8
63.0
7511
.310
81.
474
.99.
711
.1..
Ch
ad0.
341
1210
(.)..
25.0
43.6
117
9.4
473.
817
2.7
1.8
1.5
Bu
rkin
a Fa
so0.
317
1174
1.7
48.2
17.8
47.5
107
12.8
382.
37
2.0
1.2
1.3
Moz
amb
iqu
e0.
379
1117
4.6
39.6
35.6
41.9
109
11.5
501.
738
.34.
12.
01.
3
Ben
in0.
431
1115
2.2
..44
.654
.091
844
2.6
8.5
2.1
1.7
..
Tajik
ista
n0.
652
1106
-6.5
32.6
24.8
63.6
924.
847
2.4
14.9
0.9
5.7
2.2
Cen
tral
Afr
ican
R
epu
blic
0.35
510
89-0
.461
.342
.739
.311
511
.250
2.3
13.4
1.6
0.1
1.3
Nig
eria
0.45
310
50(.)
50.6
46.6
43.4
983.
143
3.5
6.1
1.2
2.8
1.2
Ken
ya0.
474
1037
-0.6
42.5
39.3
47.2
799.
270
2.7
16.4
2.2
4.0
1.7
Mal
i0.
333
994
2.4
50.5
32.3
47.9
122
933
2.2
3.4
2.3
1.8
1.9
Co
ng
o0.
512
965
-1.4
..53
.552
.081
3.7
250.
72.
41.
51.
71.
4
Yem
en0.
489
889
2.4
33.4
25.7
60.6
825.
658
2.7
7.3
1.0
1.6
7.1
Zam
bia
0.39
487
7-0
.952
.635
.937
.512
10.6
512.
718
.33.
19.
0..
Erit
rea
0.44
484
91.
0..
20.0
53.8
453.
936
1.9
22.5
3.2
1.6
19.4
Nig
er0.
281
835
-0.6
50.5
22.2
44.4
154
11.5
272.
022
.72.
01.
2..
Mad
agas
car
0.49
980
9-0
.947
.526
.655
.478
11.4
180.
931
.61.
21.
3..
Eth
iop
ia0.
367
711
2.0
30.0
15.7
47.6
112
9.9
213.
121
.72.
61.
44.
3
Gu
inea
-Bis
sau
0.34
871
1-2
.447
.034
.044
.712
66.
638
3.3
35.5
3.0
6.4
..
Co
ng
o, D
em. R
ep. o
f th
e0.
385
697
-6.3
..31
.843
.112
94.
215
2.9
12.7
1.2
2.6
..
Bu
run
di
0.37
864
8-3
.533
.310
.043
.611
42
162.
410
.30.
64.
95.
9
Tan
zan
ia U
. Rep
. of
0.41
862
11.
038
.235
.446
.010
412
.831
2.2
29.6
2.7
0.9
2.1
Mal
awi
0.40
460
50.
950
.316
.339
.711
29.
148
5.8
234.
02.
1..
Sier
ra L
eon
e0.
298
548
-5.3
62.9
38.8
40.8
166
7.9
271.
25.
81.
73.
21.
7

Résu
mé
Résumé
Le financement des soins de santé figure une fois de plus en tête de l’ordre du jour de la politique mondiale de santé. La difficulté qu’ont les pays à faibles et moyens revenus à répondre aux besoins de leurs populations en matière de soins de santé reste un problème de tout premier plan. Dans le même temps, le coup de projecteur sur la réduction de la pauvreté, à l’instar des objectifs du Millénaire pour le développement et d’autres initiatives internationales, met de plus en plus en exergue la nécessité de mécanismes de financement des soins de santé protégeant les populations de ces pays d’un éventuel appauvrissement consécutif aux coûts des soins de santé.
Le présent rapport passe en revue le financement des soins de santé dans les pays à faibles et moyens revenus, et s’articule autour de trois fonctions principales :
• La collecte des revenus qui concerne les sources des fonds, leur structure et les moyens de collecte.
• La mise en commun des fonds afin de pallier: aux impondérables dus à la maladie, en particulier au niveau individuel ; à l’incapacité des personnes à mobiliser suffisamment de ressources pour couvrir les coûts des soins de santé imprévus ; et, par voie de conséquence, à la nécessité de répartir les risques de santé sur la plus grande population possible et la durée la plus longue.
• L’achat qui transfère les ressources mises en commun aux prestataires des services de santé, de telle sorte que des services efficaces et adaptés soient mis à la disposition de la population.
La nécessité d’améliorer ou de remplacer leur système de financement des soins de santé représente une gageure pour les pays à faibles et moyens revenus. Pourtant, plusieurs pays ayant des ressources financières limitées sont parvenus à améliorer la santé de leurs populations en introduisant des mécanismes innovants de financement des soins de santé et en encourageant les interventions favorables à la santé à l’extérieur du système de santé. En améliorant la collecte des revenus, la mise en commun des risques et l’achat, en tirant les enseignements de l’expérience d’autres pays à faibles et moyens revenus et en les adaptant à leurs conditions locales, tous les pays pauvres peuvent améliorer leur système de financement des soins de santé et les rendre plus équitables, efficaces et durables.
Les exemples de "meilleures pratiques" pourraient être très instructifs, mais force est de déplorer que les "success stories" sont plutôt rares. En effet, la documentation des modalités de fonctionnement du financement des soins de santé dans les pays représente un véritable chantier de recherche pour l’avenir. Par exemple, deux pays, le Costa Rica et le Sri Lanka, se distinguent par leur réussite après la mise en place et le déploiement de ces fonctions. Ce rapport met en lumière certains des facteurs décisifs du succès. Cependant, une étude plus approfondie permettant de recenser des facteurs additionnels constituerait un exercice révélateur et utile.
Ce passage en revue de l’expérience internationale et du courant de pensée actuel a permis de dégager quelques "messages à retenir" :

Health care financing in low- and middle-income countries60
• Il convient de fournir tous les efforts nécessaires pour obtenir une couverture universelle des soins de santé – définie comme un système qui fournit des soins de santé adéquats à tous les citoyens à un coût accessible – par le biais d’un système de préfinancement.
• Un mécanisme de financement des soins de santé devrait fournir une protection financière suffisante de telle sorte qu’aucun ménage ne s’appauvrisse en raison du recours aux services de santé. Une telle protection comprend l’intégration d’un plan de partage des risques dans le mécanisme de financement des soins de santé, dans le cadre duquel les dépenses de soins de santé imprévues ne sont pas supportées uniquement par un individu ou un ménage.
• Ces deux premiers objectifs nécessitent d’importantes subventions croisées au sein du système de santé, tant en termes de revenus (subventions croisées des riches vers les pauvres) que de risques de besoins de soins de santé (subventions croisées des personnes en bonne santé, ou à faible risque, aux personnes malades, ou à haut risque).
• La nécessité de subventions croisées implique que les mécanismes de préfinancement soient au cœur du financement de la santé. Dans le cadre de ce système, chacun contribue régulièrement aux coûts de la santé sous forme de taxes et/ou en versant des cotisations à des assurances santé.
• Des mécanismes de contribution progressive (ou équitable) comprenant des subventions croisées devraient être préférés aux mécanismes régressifs (ou inéquitables).
• La prise en charge de paquets de soins couvrant les principaux problèmes de santé devrait être encouragée, puisque ceux-ci assurent une efficience optimale des services de santé et une valeur ajoutée à tous ceux qui en ont besoin.
• Les subventions croisées devraient être adoptées à l’échelle du système entier et se concentrer non seulement sur qui contribue au financement du système des soins de santé et à quel niveau, mais également sur les modalités de mise en commun des fonds et sur la manière et les types de services qui sont achetés pour leurs bénéficiaires.
• Une approche des subventions croisées à l’échelle du système signifie qu’un mécanisme de financement des soins de santé ne devrait pas être considéré isolément mais plutôt dans son interaction avec la contribution aux subventions croisées de l'ensemble du système de santé.
• L’intégration des mécanismes de financement devrait recevoir de plus en plus d’attention, car leur fragmentation réduit les possibilités de subventions croisées.
Resu
menResumen
La financiación de la atención sanitaria ocupa de nuevo un lugar destacado en la agenda de la política sanitaria mundial. La dificultad que los países con ingresos bajos e intermedios tienen para satisfacer las necesidades de atención sanitaria de sus poblaciones sigue siendo un problema importante. Al mismo tiempo, el actual centro de atención en la reducción de la pobreza, tal y como se refleja en los Objetivos de Desarrollo del Milenio y otras iniciativas internacionales, pone un énfasis cada vez mayor en la necesidad de mecanismos de financiación de la atención sanitaria que protejan a las poblaciones de esos países de los efectos potencialmente empobrecedores de los costos de la atención sanitaria.
El presente informe revisa la financiación de la atención sanitaria en los países con ingresos bajos e intermedios en relación con tres funciones principales:
• Recaudación de fondos, es decir, fuentes de financiación, su estructura y medios a través de los cuales se recaudan.
• Agrupación y distribución de fondos, que aborda: la imprevisibilidad de la enfermedad, especialmente a nivel individual; la incapacidad de los individuos para movilizar los recursos suficientes para cubrir costes de atención sanitaria inesperados; y por consiguiente, la necesidad de extender los riesgos sanitarios a un grupo de población y durante un periodo de tiempo lo más amplio posible.
• Adquisiciones, que transmite los recursos agrupados a los proveedores de servicios de atención sanitaria de forma que la población disponga de unos servicios adecuados y eficaces.
Los países con ingresos bajos e intermedios se enfrentan a enormes retos en lo referente a la necesidad de mejora o sustitución de sus actuales sistemas de financiación de la atención sanitaria. Sin embargo, algunos países con recursos financieros limitados han conseguido mejorar la salud de sus poblaciones mediante la introducción de mecanismos de financiación de la atención sanitaria y servicios sanitarios innovadores, así como fomentando intervenciones de promoción de la salud que tienen lugar o se originan fuera del sistema sanitario. Mejorando la recaudación de fondos, la agrupación de riesgos y las adquisiciones, y aprendiendo de la experiencia de otros países con ingresos bajos e intermedios, adaptándola a sus propias circunstancias, todos los países pobres en recursos pueden mejorar sus sistemas de financiación de la atención sanitaria y hacerlos más equitativos, eficientes y sostenibles.
Los ejemplos de «mejor práctica» podrían ser muy instructivos pero, lamentablemente, no hay muchos ejemplos de éxito. Hay un verdadero campo para futuras investigaciones en la documentación de cómo estas funciones de financiación de la atención sanitaria funcionan realmente en los países. Por ejemplo, se considera en general que dos países como Costa Rica y Sri Lanka, han conseguido establecer y poner en práctica estas funciones satisfactoriamente. Esta revisión ha subrayado algunos de los factores que han contribuido al éxito. Sin embargo, un análisis más exhaustivo que identificara factores adicionales sería un ejercicio instructivo.

Health care financing in low- and middle-income countries62
De esta revisión de la experiencia internacional y de la corriente de pensamiento actual surgen algunos mensajes claros.
• Debe hacerse todo lo posible para conseguir una cobertura sanitaria universal, lo que se define como un sistema que proporcione a todos los ciudadanos una atención sanitaria adecuada a un costo asequible, a través de un mecanismo de financiación mediante pago anticipado.
• Un mecanismo de financiación de la atención sanitaria debería proporcionar una protección financiera suficiente, de forma que ningún hogar se vea empobrecido por la necesidad de utilizar los servicios sanitarios. Una manera de proporcionar dicha protección podría ser la incorporación de un plan de riesgo compartido en el mecanismo de financiación de la atención sanitaria, mediante el cual, un gasto de atención sanitaria inesperado no recaiga únicamente sobre una persona o unidad familiar.
• Estos dos primeros objetivos implican la necesidad de subvenciones cruzadas dentro del sistema sanitario, tanto en términos de ingresos (subvenciones cruzadas de los ricos a los pobres) como de riesgo de necesidad de atención sanitaria (subvenciones cruzadas de los individuos sanos, o con riesgo bajo, a los individuos enfermos o con riesgo alto).
• La necesidad de subvenciones cruzadas implica a su vez que los mecanismos de financiación mediante pago anticipado, a través de los cuales la gente contribuye regularmente a los costos sanitarios en forma de pago de impuestos y aportaciones a seguros de enfermedad, deberían estar en el centro de la financiación de la sanidad.
• Se preferirían mecanismos de contribución progresivos (o equitativos) que impliquen subvenciones cruzadas de ingresos que mecanismos regresivos (o no equitativos).
• Deberían fomentarse paquetes de prestaciones sanitarias que cubran las causas más importantes de enfermedad, ya que dichos paquetes garantizan que aquellos que lo necesiten obtengan un beneficio óptimo de los servicios sanitarios y reciban valor por el dinero gastado en dichos servicios.
• Las subvenciones cruzadas deberían adoptarse en todo el sistema y centrarse no sólo en quién aporta cuánto a la financiación del sistema sanitario, sino también en cómo se agrupan los fondos y cómo y qué servicios se adquieren, y para beneficio de quién.
• Un enfoque que abarque todo el sistema para las subvenciones cruzadas significa que un mecanismo de financiación de la atención sanitaria no debería considerarse de manera aislada sino en relación con cómo puede contribuir a las subvenciones cruzadas en el sistema sanitario general.
• El énfasis debería ponerse cada vez más en mecanismos de financiación integrados: la fragmentación de los mecanismos de financiación reduce el potencial para las subvenciones cruzadas.
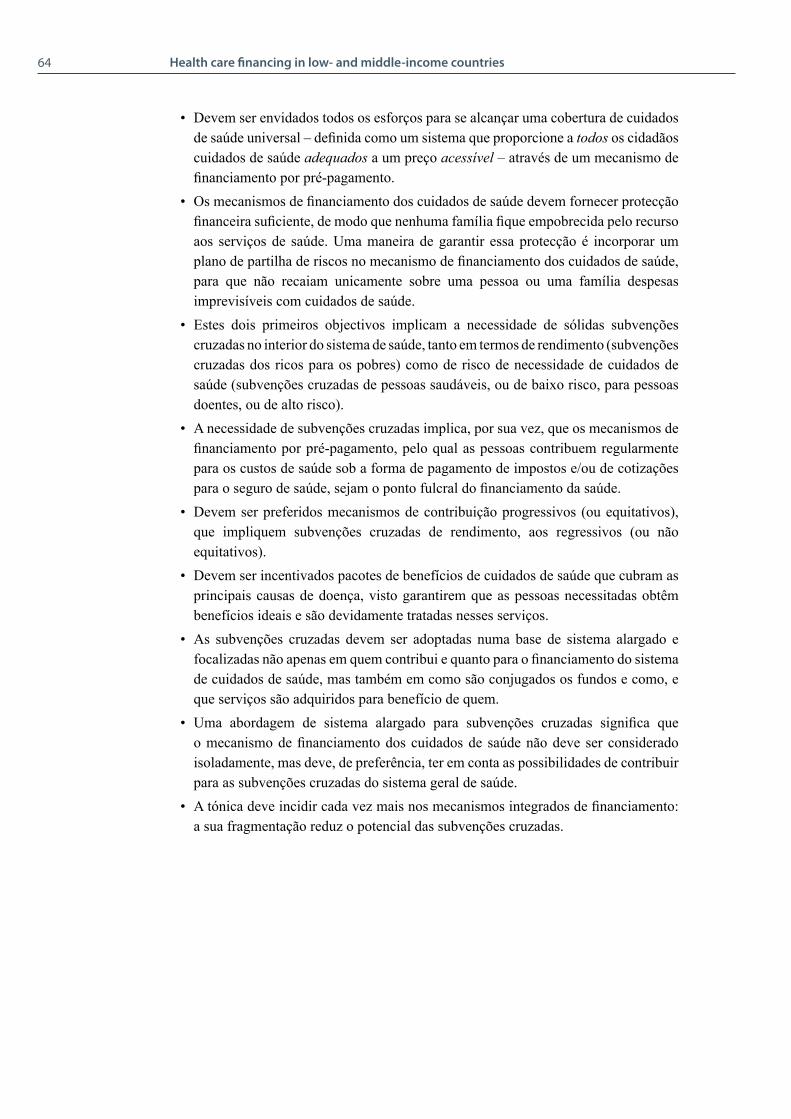
Sum
ário
Sumário
O financiamento dos cuidados de saúde ressurge uma vez mais na agenda política mondiale da saúde. A dificuldade dos países com rendimentos baixos e médios em prover às necessidades de cuidados de saúde das suas populações continua a ser um grande problema. Ao mesmo tempo, a actual focalização na redução da pobreza, como demostra a iniciativa Objectivos de Desenvolvimento do Milénio e outras a nível internacional, chamou a atenção para a necessidade cada vez maior da introdução de mecanismos de financiamento dos cuidados de saúde que protejam as populações destes países dos efeitos potencialmente empobrecedores dos seus custos.
Este relatório analisa o financiamento dos cuidados de saúde nos países com rendimentos baixos e médios no que se refere às três funções principais:
• Colecta de receitas – diz respeito às fontes dos fundos, à sua estrutura e aos processos de colecta.
• Conjugação de fundos – responde à imprevisibilidade de doença, especialmente a nível individual, à incapacidade de mobilização de recursos suficientes para fazer face a custos de cuidados de saúde imprevisíveis e, consequentemente, à necessidade de distribuir o mais possível os riscos de saúde por um grupo de população e um período de tempo alargados.
• Atribuição de recursos – transfere os recursos conjugados para os prestadores de serviços de saúde a fim de disponibilizar serviços apropriados e eficazes à população.
Os países de rendimentos baixos e médios, confrontados com a necessidade de melhorar ou substituir o seu actual sistema de financiamento dos cuidados de saúde, enfrentam enormes desafios. Apesar de tudo, vários países com recursos financeiros limitados têm conseguido melhorar a saúde das suas populações introduzindo mecanismos inovadores de financiamento dos cuidados de saúde e de prestação de cuidados de saúde, assim como estimular intervenções de protecção da saúde, dentro ou fora do sistema de saúde. Melhorando a colecta de receitas, a conjugação de fundos e a atribuição de recursos e aprendendo com a experiência de outros países de rendimentos baixos e médios e adaptando-a às suas próprias circunstâncias, todos os países pobres em recursos podem melhorar os seus sistemas de financiamento dos cuidados de saúde e torná-los mais equitativos, eficientes e sustentáveis.
Os exemplos de “melhores práticas” podem ser altamente instrutivos, mas, infelizamente, a carestia de casos de sucesso é gritante. Naturalmente, o campo de investigação futura para documentar como estas funções de financiamento dos cuidados de saúde operam realmente nos países oferece perspectivas incontestáveis. Neste sentido, citam-se frequentemente dois países, a Costa Rica e o Sri Lanka, como tendo sido bem sucedidos no estabelecimento e implementação destas funções. Esta análise destacou alguns dos factores que contribuíram para o sucesso. Contudo, poderia ser muito instrutivo um estudo mais profundo que identificasse factores adicionais.
Eis algumas “mensagens de levar para casa” deste estudo que emergem da experiência internacional e da reflexão actual:
Health care financing in low- and middle-income countries64
• Devem ser envidados todos os esforços para se alcançar uma cobertura de cuidados de saúde universal – definida como um sistema que proporcione a todos os cidadãos cuidados de saúde adequados a um preço acessível – através de um mecanismo de financiamento por pré-pagamento.
• Os mecanismos de financiamento dos cuidados de saúde devem fornecer protecção financeira suficiente, de modo que nenhuma família fique empobrecida pelo recurso aos serviços de saúde. Uma maneira de garantir essa protecção é incorporar um plano de partilha de riscos no mecanismo de financiamento dos cuidados de saúde, para que não recaiam unicamente sobre uma pessoa ou uma família despesas imprevisíveis com cuidados de saúde.
• Estes dois primeiros objectivos implicam a necessidade de sólidas subvenções cruzadas no interior do sistema de saúde, tanto em termos de rendimento (subvenções cruzadas dos ricos para os pobres) como de risco de necessidade de cuidados de saúde (subvenções cruzadas de pessoas saudáveis, ou de baixo risco, para pessoas doentes, ou de alto risco).
• A necessidade de subvenções cruzadas implica, por sua vez, que os mecanismos de financiamento por pré-pagamento, pelo qual as pessoas contribuem regularmente para os custos de saúde sob a forma de pagamento de impostos e/ou de cotizações para o seguro de saúde, sejam o ponto fulcral do financiamento da saúde.
• Devem ser preferidos mecanismos de contribuição progressivos (ou equitativos), que impliquem subvenções cruzadas de rendimento, aos regressivos (ou não equitativos).
• Devem ser incentivados pacotes de benefícios de cuidados de saúde que cubram as principais causas de doença, visto garantirem que as pessoas necessitadas obtêm benefícios ideais e são devidamente tratadas nesses serviços.
• As subvenções cruzadas devem ser adoptadas numa base de sistema alargado e focalizadas não apenas em quem contribui e quanto para o financiamento do sistema de cuidados de saúde, mas também em como são conjugados os fundos e como, e que serviços são adquiridos para benefício de quem.
• Uma abordagem de sistema alargado para subvenções cruzadas significa que o mecanismo de financiamento dos cuidados de saúde não deve ser considerado isoladamente, mas deve, de preferência, ter em conta as possibilidades de contribuir para as subvenções cruzadas do sistema geral de saúde.
• A tónica deve incidir cada vez mais nos mecanismos integrados de financiamento: a sua fragmentação reduz o potencial das subvenções cruzadas.


Health care financing in low- and middle-income countries66

ReferencesAdams, I. (2002) Implementation of user fee policy in Ghana: A review of the issues (Part 1).
Bulletin of Health Information 2002, 1, 3-13.
Akin, J., Birdsall, N. and de Ferranti, D. (1987) Financing health services in developing countries: An agenda for reform. A World Bank Policy Study. Washington, D.C.: The World Bank.
Arrow, K. (1963) Uncertainty and the welfare economics of medical care. American Economic Review, 53, 941-973.
Atim, C., Grey, S. and Apoya, P. (2002) A Survey of Mutual Health Organizations in Ghana. Bethesda: PHRplus.
AU (2006) Resolution of the Ministers of Health on health financing in Africa: Special Summit of the African Union on HIV/AIDS, tuberculosis and malaria, Abuja, 2-4 May 2006. Addis Ababa: African Union.
Ayanian, J., Weissman, J., Schneider, E., Ginsburg, J. and Zaslavsky, A. (2000) Unmet health needs of uninsured adults in the United States. The Journal of the American Medical Association, 284, 2061-2069.
Barrientos, A. and Lloyd-Sherlock, P. (2000) Reforming health insurance in Argentina and Chile. Health Policy and Planning, 15, 417-423.
Bennett, S., Creese, A. and Monasch, R. (1998) Health insurance schemes for people outside formal sector employment: ARA Paper No. 16. Geneva: Division of Analysis, Research and Assessment, World Health Organization.
Birdsall, N. and Hecht, R. (1995) Swimming against the tide: Strategies for improving equity in health. Washington D.C.: Inter-American Development Bank.
Bitrán, R. and Giedion, U. (2003) Waivers and exemptions for health services in developing countries. Social Protection Discussion Paper Series No. 0308. Washington, D.C.: The World Bank.
Bond, P. (2006) The dispossession of African wealth at the cost of African health. Harare: Regional Network for Equity in Health in East and Southern Africa (EQUINET).
Bossert, T., Larranaga, S., Giedion, U., Arbelaez, J. and Bowser, D. (2003) Decentralization and equity of resource allocation: evidence from Colombia and Chile. Bulletin of the World Health Organization, 81, 95-100.
Buchanan, J. (1963) The economics of earmarked taxes. Journal of Political Economy, 71, 457-469.
Burnham, G., Pariyo, G., Galiwango, E. and Wabwire-Mangen, F. (2004) Discontinuation of cost sharing in Uganda. Bulletin of the World Health Organization, 82, 187-195.
Carrin, G. and Hanvoravongchai, P. (2002) Health care cost-containment policies in high-income countries: how successful are monetary incentives? Discussion Paper Number 2-2002. Geneva: World Health Organization.
Carrin, G. and James, C. (2004) Reaching universal coverage via social health insurance: key design features in the transiation period. Discussion Paper Number 2 - 2004. Geneva: World Health Organization.
Casas, A. and Vargas, H. (1980) The health system in Costa Rica: Toward a National Health Service. Journal of Public Health Policy, 1, 258-279.
Cavagnero, E., Carrin, G., Xu, K. and Rivera, A. (2006) Health financing in Argentina: An empirical study of health care utilization and health care expenditure. Discussion paper Number 5 -2006. Geneva: World Health Organization.
Claeson, M., Griffin, C., Johnston, M., McLachlan, A., Soucat, A., Wagstaff, A. and Yazbeck, A. (2001) Poverty-Reduction and the Health-Sector. In: Poverty Reduction Strategy Sourcebook, Washington: World Bank.
Refe
renc
es
Health care financing in low- and middle-income countries References68 69Health care financing in low- and middle-income countries References68 69
Criel, B., Van der Stuyft, P. and Van Lerberghe, W. (1999) The Bwamanda hospital insurance scheme: effective for whom? A study of its impact on hospital utilization patterns. Social Science and Medicine, 48, 897-911.
Criel, B., Van Dormael, M., Lefevre, P., Menase, U. and Van Lerberghe, W. (1998) Voluntary health insurance in Bwamanda, Democratic Republic of Congo. An exploration of its meanings to the community. Tropical Medicine and International Health, 3, 640-653.
Davies, P. and Carrin, G. (2001) Risk-pooling - necessary but not sufficient? Bulletin of the World Health Organization, 79, 587.
de Ferranti, D. (1985) Paying for health services in developing countries: An Overview. Washington, D.C.: The World Bank.
De Geyndt, W. (1991) Managing health expenditures under national health insurance: The case of Korea. World Bank Technical Paper 156. Washington, D.C.: The World Bank.
Deininger, K. and Mpuga, P. (2004) Economic and welfare effects of the abolition of health user fees: Evidence from Uganda. World Bank Policy Research Working Paper 3276. Washington, D.C.: World Bank.
DFID (2004) Poverty Reduction Budget Support: A DFID Policy Paper. London: Department for International Development (DFID).
Donaldson, C. and Gerard, K. (1993) Economics of health care financing: The visible hand. Basingstoke: Macmillan.
Dror, D. M. (2001) Reinsurance of health insurance for the informal sector. Bulletin of the World Health Organization, 79, 672-678.
Dror, D. M. and Preker, A. S. (Eds.) (2002) Social ReInsurance: A new approach to sustainable community health financing. Washington, D.C. and Geneva: The World Bank and International Labour Office.
Ekman, B. (2004) Community-based health insurance in low-income countries: A systematic review of the evidence. Health Policy and Planning, 19, 249-270.
Ensor, T. (2001) Transition to universal coverage in developing countries: An overview. York: Centre for Health Economics, University of York.
Ensor, T. (2004) Consumer-led demand side financing in health and education and its relevance for low and middle income countries. International Journal of Health Planning and Management, 19, 1-19.
EQUITAP (2005) Who pays for health care in Asia? Colombo: Institute of Policy Studies.
Foster, M., Brown, A. and Conway, T. (2000) Sector-wide approaches for Health Development: A Review of Experience. Geneva: World Health Organization and Overseas Development Institute.
Freedman, L. P., Waldman, R. J., de Pinho, H., Wirth, M. E., Chowdury, A. M. R. and Rosenfield, A. (2005) Who's got the power? Transforming health systems for women and children. UN Millennium Project Task Force on Child and Maternal Health. New York: United Nations Development Programme.
Garshong, B., Ansah, E., Dakpallah, G., Huijts, I. and Adjei, S. (2002) A study on factors affecting the implementation of the exemption policy in Ghana. Bulletin of Health Information, 1, 22-31.
Gaviria, A., Medina, C. and Mejia, C. (2006) Evaluating the impact of health care reform in Colombia: From theory to practice. Bogota: CEDE, Universidad de los Andes.
Gilson, L. (1998) The lessons of user fee experience in Africa. In: Beattie, A., Doherty, J., Gilson, L., Lambo, E. and Shaw, P. (Eds.) Sustainable Health Care Financing in Southern Africa, Washington, D.C.: World Bank.
Gilson, L. and McIntyre, D. (2005) Removing user fees for primary care in Africa: the need for careful action. British Medical Journal, 331, 762-765.

Health care financing in low- and middle-income countries References68 69Health care financing in low- and middle-income countries References68 69
Gilson, L., Russell, S. and Buse, K. (1995) The political economy of user fees with targeting: Developing equitable health financing policy. Journal of International Development, 7, 369-401.
Gilson, L., Russell, S. and Rauyajin, O. (1998) Exempting the poor: A review and evaluation of the low income card scheme in Thailand. PHP Departmental Publication No. 30. London: Department of Public Health and Policy, London School of Hygiene and Tropical Medicine.
Global Policy Forum (2005) Nigeria to get US$ 18 bn debt relief. Access date: 22 October 2006. www.globalpolicy.org/socecon/develop/debt/2005/0630nigeria.htm
Gottret, P. and Scheiber, G. (2006) Health financing revisited: A practitioner's guide. Washington, DC: The World Bank.
Government of Ghana (2003) National Health Insurance Act (Act 650). Accra: Government of Ghana.
Government of Nigeria (2006) 2007 Budget Speech by his Excellency President Olusegun Obasanjo, 11 October 2006. Access date: 22 October 2006. www.nigeria.gov.ng/speeches_2007budget.aspx
Hanvoravongchai, P. (2002) Medical savings accounts: Lessons learned from limited international experience. Discussion Paper Number 3 -2002. Geneva: World Health Organization.
Hay, R. (2003) The 'fiscal space' for publicly financed healthcare. Oxford Policy Institute Policy Brief, 4, 1-8.
Heller, P. (2005) Understanding fiscal space. Washington, DC: International Monetary Fund.
Hoare, G. and Mills, A. (1986) Paying for the health sector: A review and annotated bibliography of the literature on developing countries. Evaluation and Planning Centre for Health Care Publication No 12. London: EPC, London School of Hygiene and Tropical Medicine.
Homedes, N. and Ugalde, A. (2005) Why neoliberal health reforms have failed in Latin America. Health Policy, 71, 83-96.
Jones, A. and Duncan, A. (1995) Hypothecated health taxes: An evaluation of recent proposals. London: Office of Health Economics.
Kim, J., Ko, S. and Yang, B. (2005) The effects of patient cost sharing on ambulatory utilization in South Korea. Health Policy, 72, 293-300.
Kipp, W., Kamugisha, J., Jacobs, P., Burnham, G. and Rubaale, T. (2001) User fees, health staff incentives and service utilization in Kabarole District, Uganda. Bulletin of the World Health Organization, 79, 1032-1037.
Kutzin, J. (1995) Experience with organizational and financing reform of the health sector. SHS Current Concerns Paper Number 8. Geneva: Division of Strengthening of Health Services, World Health Organization.
Kutzin, J. (2001) A descriptive framework for country-level analysis of health care financing arrangements. Health Policy, 56, 171-204.
Le Houerou, P. and Taliercio, R. (2002) Medium term expenditure frameworks: from concept to practice. Preliminary lessons from Africa. Africa Region Working Paper Series No. 28. Washington, D.C.: The World Bank.
Limwattananon, S., Tangcharoensathien, V. and Prakongsai, P. (2005) Equity in financing healthcare: impact of universal access to healthcare in Thailand. EQUITAP Project: Working Paper #16. Nonthaburi: International Health Policy Program.
Maynard, A. (1994) Can competition enhance efficiency in health care? Lessons from the reform of the UK national health service. Social Science and Medicine, 39, 1438-1445.
McGuire, J. (2001) Social policy and mortality decline in East Asia and Latin America. World Development, 29, 1673-1697.

Health care financing in low- and middle-income countries References70 71Health care financing in low- and middle-income countries References70 71
McIntyre, D. and Doherty, J. (2004) Health care financing and expenditure: Progress since 1994 and remaining challenges. In: Van Rensburg, H. (Ed.) Health care in South Africa, Pretoria: Van Schaik Publishers.
McIntyre, D., Gilson, L. and Mutyambizi, V. (2005) Promoting equitable health care financing in the African context: Current challenges and future prospects. Harare: Regional Network for Equity in Health in Southern Africa (EQUINET).
McIntyre, D., Gilson, L., Wadee, H., Thiede, M. and Okorafor, O. (2006) Commercialisation and extreme inequality in health: The policy challenges in South Africa. Journal of International Development, 18, 435-446.
McIntyre, D., McLeod, H. and Thiede, M. (2005) Comments on the National Treasury Discussion Document on the proposed tax reforms relating to medical scheme contributions and medical expenses. Cape Town: Health Economics Unit.
McIntyre, D., Taylor, S., Pick, W., Bourne, D. and Klopper, J. (1990) A methodology for resource allocation in health care for South Africa. Part II - The British Experience and its relevance to South Africa. South African Medical Journal, 77, 453-455.
McIntyre, D., Thiede, M., Dahlgren, G. and Whitehead, M. (2005) What are the economic consequences for households of illness and of paying for health care in low- and middle- income country contexts? Social Science and Medicine, 62, 858-865.
McLeod, H. (2005) Mutuality and solidarity in healthcare in South Africa. Sessional meetings of the Actuarial Society of South Africa. Actuarial Society of South Africa.
McNay, K., Keith, R. and Penrose, A. (2004) Bucking the trend: How Sri Lanka has achieved good health at low cost - challenges and policy lessons for the 21st century. London: Save the Children.
McPake, B. and Kutzin, J. (1997) Methods for evaluating health system performance and the effects of reform. Geneva: World Health Organization.
McPake, B. and Mills, A. (2000) What can we learn from international comparisons of health systems and health system reform? Bulletin of the World Health Organization, 78, 811-820.
Ministerial Task Team (2002) Policy Framework for Establishment of Health Insurance in Ghana. Accra: Ministry of Health.
Mkandawire, T. (2005) Targeting and universalism in poverty reduction. Geneva: UNRISD.
Morgan, L. (1987) Health without wealth? Costa Rica's health system under economic crisis. Journal of Public Health Policy, 8, 86-105.
National Health Insurance Secretariat (2004) National Health Insurance Scheme: Proposed minimum benefit package. Daily Graphic. Accra.
Newbrander, W., Collins, D. and Gilson, L. (2000) Ensuring equal access to health services: User fee systems and the poor. Boston: Management Sciences for Health.
Nolan, B. and Turbat, V. (1995) Cost recovery in public health services in Sub-Saharan Africa. Washington, D.C.: Economic Development Institute, The World Bank.
Normand, C. (1999) Using social health insurance to meet policy goals. Social Science and Medicine, 48, 865-869.
Normand, C. and Weber, A. (1994) Social health insurance: A guidebook for planning. Geneva: World Health Organization and International Labour Office.
Nyonator, F. and Kutzin, J. (1999) Health for some? The effects of user fees in the Volta Region of Ghana. Health Policy and Planning, 14, 329-341.
OAU (2001) Abuja Declaration on HIV/AIDS, tuberculosis and other related infectious diseases. Organisation of African Unity.
Ogawa, S., Hasegawa, T., Carrin, G. and Kawabata, K. (2003) Scaling up community health insurance: Japan's experience with the 19th century Jyorei scheme. Health Policy and Planning, 18, 270-278.
Health care financing in low- and middle-income countries References70 71Health care financing in low- and middle-income countries References70 71
OPM and ODI (2003) General budget support evaluability study, Phase I: Final synthesis report. Oxford and London: Oxford Policy Management and Overseas Development Institute.
Pearson, M. (2002) Allocating Public Resources for Health: Developing Pro-poor Approaches. London: DFID Health Systems Resource Centre.
Preker, A. and Carrin, G. (2004) Health financing for poor people: Resource mobilization and risk sharing. Washington, D.C.: World Bank.
Rice, N. and Smith, P. (2002) Strategic resource allocation and funding decisions. In: Mossialos, E., Dixon, A., Figueras, J. and Kutzin, J. (Eds.) Funding health care: Options for Europ, Buckingham: Open University Press.
Rocha, G., Martinez, A., Rios, E. and Elizondo, E. (2004) Resource allocation equity in northeastern Mexico. Health Policy, 70, 271-279.
Ros, C., Groenewegen, P. P. and Delnoij, D. M. (2000) All rights reserved, or can we just copy? Cost sharing arrangements and characteristics of health care systems. Health Policy, 52, 1-13.
Russell, S. (2004) The economic burden of illness for households in developing countries: A review of studies focusing on malaria, tuberculosis and Human Immunodeficiency Virus/Aquired Immunodeficiency Syndrome. American Journal of Tropical Medicine and Hygiene, 7, 147-155.
Russell, S. (2005) Treatment-seeking behaviour in urban Sri Lanka: Trusting the state, trusting private providers. Social Science and Medicine, 61, 1396-1407.
Rutten, F. and van Busschbach, J. (2001) How to define a basic package of health services for a tax funded or social insurance based health care system? Health Economics in Prevention and Care, 2, 45-46.
Sapelli, C. (2004) Risk segmentation and equity in the Chilean mandatory health insurance system. Social Science and Medicine, 58, 259-265.
Schneider, P. (2005) Trust in micro-health insurance: an exploratory study in Rwanda. Social Science and Medicine, 61, 1430-1438.
Sekhri, N., Savedoff, W. and Thripathi, S. (2005) Regulation of private health insurance to serve the public interest: policy issues for developing countries. Discussion Paper Number 3 - 2005. Geneva: World Health Organization.
Semali, I. and Minja, G. (2005) Deprivation and the equitable allocation of health care resources to decentralised districts in Tanzania. Harare: Regional Network on Equity in Health in Southern Africa.
Shaw, R. and Griffin, C. (1995) Financing health care in Sub-Saharan Africa through user fees and insurance. Washington, D.C.: The World Bank.
Squire, L. (1993) Fighting Poverty. The American Economic Review, 83, 377-382.
Sundewall, J., Forsberg, B. and Tomson, G. (2006) Theory and practice - a case study of coordination and ownership in the Bangladesh health SWAp. Health Policy and Systems, 4, 5.
Sundewall, J. and Sahlin-Andersson, K. (2006) Translations of health sector SWAps - A comparative study of health sector development cooperation in Uganda, Zambia and Bangladesh. Health Policy, 76, 277-287.
Suraratdecha, C., Saithanu, S. and Tangcharoensathien, V. (2005) Is universal coverage a solution for disparities in health care? Findings from three low-income provinces of Thailand. Health Policy, 73, 272-284.
UNDP (2005) Human Development Report 2005. New York: United Nations Development Programme.
Van Doorslaer, E. and Wagstaff, A. (1993) Equity in the finance of health care: Methods and findings. In: Van Doorslaer, E., Wagstaff, A. and Rutten, F. (Eds.) Equity in the finance and delivery of health care: An international perspective, New York: Oxford University Press.

Health care financing in low- and middle-income countries References72 73
Wagstaff, A. and Van Doorslaer, E. (1993) Equity in the finance and delivery of health care: Concepts and definitions. In: Van Doorslaer, E., Wagstaff, A. and Rutten, F. (Eds.) Equity in the finance and delivery of health care: An international perspective, New York: Oxford University Press.
Wagstaff, A., Van Doorslaer, E., van der Burg, H., Calonge, S., Christiansen, T., Citoni, G. and et al. (1999) Equity in the finance of health care: some further international comparisons. Journal of Health Economics, 18, 263-290.
Walford, V. (1998) Developing Sector Wide Approaches in the health sector: An issues paper for DFID advisers and field managers. London: Institute for Health Sector Development.
Walford, V. (2002) Health in Poverty Reduction Strategy Papers (PRSPs): An introduction and early experience. London: DFID Health Systems Resource Centre.
Walford, V. (2003) Defining and evaluating SWAps. London: Institute for Health Sector Development.
Whitehead, M., Dahlgren, G. and Evans, T. (2001) Equity and health sector reforms: Can low-income countries escape the medical poverty trap? Lancet, 358, 833-836.
Withanachchi, N. and Uchida, Y. (2006) Healthcare rationing: A guide to policy directions in Sri Lanka. Health Policy, 78, 17-25.
World Bank (2005a) World Development Indicators. Access date: 31 August 2006. http://devdata.worldbank.org/
World Bank (2005b) World Development Report 2006: Equity and Development. Washington, D.C.: The World Bank.
World Health Organization (2000) The World Health Report 2000: Health systems: Improving performance. Geneva: World Health Organization.
World Health Organization (2001) Macroeconomics and Health: Investing in health for economic development. Report of the Commission on Macroeconomics and Health. Geneva: World Health Organization.
World Health Organization (2005a) Designing health financing systems to reduce catastrophic health expenditure: Technical Briefs for Policy-Makers, Number 2. Geneva: World Health Organization.
World Health Organization (2005b) Sustainable health financing, universal coverage and social health insurance: World Health Assembly resolution WHA58.33. Geneva: World Health Organization.
Xu, K., Evans, D., Kadama, P., Nabyonga, J., Ogwal, P., Nabukhonzo, P. and Aguilar, A. (2006) Understanding the impact of eliminating user fees: Utilization and catastrophic health expenditures in Uganda. Social Science and Medicine, 62, 866-876.
Xu, K., Evans, D., Kawabata, K., Zeramdini, R., Klavus, J. and Murray, C. (2003) Household catastrophic health expenditure: A multicountry analysis. Lancet, 362, 111-117.
Yates, R. (2004) Voting with their feet: What lessons can be learnt from increased consumption of public services in Uganda? Health Policy and Development, 2, 48-51.
Zschock, D. (1979) Health care financing in developing countries. American Public Health Association International Health Programs Monograph Series No.1. Washington, D.C.: American Public Health Association.
Zschock, D. (1982) General review of problems of medical care delivery under social security in developing countries. International Social Security Review, 35, 3-15.

Health care financing in low- and middle-income countries References72 73

For your notes For your notes74 75

For your notes For your notes74 75

For your notes For your notes76 NP

Global Forum for Health Research1-5 route des Morillons
PO Box 21001211 Geneva 2 - Switzerland
T +41 22 791 4260F +41 22 791 4394
He
al
th
F
in
an
ci
ng
Glo
ba
l Fo
rum
for H
ea
lth R
ese
arc
hH
ea
lth C
are
Fin
an
cin
g2
00
7
Learning from Experience:Health care �nancing in low-
and middle-income countries
HEA
LTH
FIN
AN
CIN
GDiane McIntyre
"Stronger health systems are needed to promote health equity, deliver e�ective interventions and ensure that health systems contribute to broader development goals, such as the UN Millennium Development Goals. This comprehensive review of experience with health care �nancing is a major contribution to the international literature in this �eld. It represents an invaluable resource for policy-makers, those providing technical support to policy-makers, researchers and students".
Lucy Gilson, Leader, Hub for Health Systems Knowledge Network, Commission on Social Determinants of Health
This report reviews health care �nancing in resource-poor countries. It o�ers a framework to assess the performance of a health care �nancing system and make it more equitable, e�cient and sustainable by optimizing the three key functions of health care �nancing: revenue collection, pooling of funds and purchasing.
A user-friendly fold-out table summarizes at a glance international experience in the performance of these functions in terms of feasibility, equity, e�ciency and sustainability. An Executive Summary is provided in Chinese, English, French, Portuguese and Spanish.
To facilitate drawing from the experience of other countries, the report presents country case studies that highlight some of the factors that have contributed to the successful set-up and implementation of these functions.