Health Economics Program
5
Issue Brief November 2013 Minnesota Department of Health Introduction With a sizeable number of currently uninsured individuals potentially obtaining health insurance coverage in January 2014, understanding their current patterns of health care utilization can help the state, insurers and providers prepare for this transition. is issue brief illustrates differences in health care utilization for Minnesota residents by demographic characteristics and insurance coverage status based on findings from the 2011 Minnesota Health Access Survey (MNHA). 1 Metrics of utilization analyzed for this issue brief include the incidence of doctor visits, overnight hospital stays and emergency room visits. e analysis also considers barriers to care and health status. is issue brief examines each type of utilization by both insurance status and health status. Overall findings show the uninsured population has a much different pattern of utilization than the insured population, with lower utilization in clinic and inpatient settings. ese differences persist when accounting for health status. In contrast, the uninsured used the Emergency Department at comparable rates with the privately insured and lower rates of those with public coverage. Doctor Visits In 2011, a majority of people nationwide had contact with a health care professional over a period of six months. 2 Consistent with the national trend, Minnesota saw 73.0% of the population visiting a doctor during the six month period preceding the survey, which is an increase from 61.9% in 2001 when survey respondents were asked the same question. As shown in Figure 1, there were stark differences in patterns of doctor visits by type of insurance coverage and lack of coverage. Most striking, uninsured individuals were much less likely to have had a doctor visit than people with health insurance coverage. 3 In 2011, only 43.2% of the uninsured had at least one doctor visit over a six month period, compared to three-fourths of people who had insurance coverage (76.3%). People with public coverage were most likely to have had a doctor visit, followed by those with group coverage and individual health insurance. Interestingly, all insured population groups saw an increase in the share of people with a doctor visit between 2001 and 2011, with statistically significant increases in the overall population and those with group and individual coverage. In contrast, the share of the uninsured population with a doctor visit fell between 2001 and 2011 from 46% to 43.2%, albeit not at a statistically significant level 4 . Health Economics Program Utilization of Health Care by Insurance Status Figure 1 Percent of Minnesotans with a Doctor Visit in the Past 6 Months by Insurance Status, 2001 and 2011 * Indicates statistically significant difference from previous year at p<0.05 ^ Indicates statistically significant difference from overall at p<0.05
Transcript of Health Economics Program

Issue BriefNovember 2013
Minnesota Department of Health
Introduction With a sizeable number of currently uninsured individuals potentially obtaining health insurance coverage in January 2014, understanding their current patterns of health care utilization can help the state, insurers and providers prepare for this transition. This issue brief illustrates differences in health care utilization for Minnesota residents by demographic characteristics and insurance coverage status based on findings from the 2011 Minnesota Health Access Survey (MNHA).1 Metrics of utilization analyzed for this issue brief include the incidence of doctor visits, overnight hospital stays and emergency room visits. The analysis also considers barriers to care and health status. This issue brief examines each type of utilization by both insurance status and health status. Overall findings show the uninsured population has a much different pattern of utilization than the insured population, with lower utilization in clinic and inpatient settings. These differences persist when accounting for health status. In contrast, the uninsured used the Emergency Department at comparable rates with the privately insured and lower rates of those with public coverage.
Doctor VisitsIn 2011, a majority of people nationwide had contact with a health care professional over a period of six months.2 Consistent with the national trend, Minnesota saw 73.0% of the population visiting a doctor during the six month period preceding the survey, which is an increase from 61.9% in 2001 when survey respondents were asked the same question.
As shown in Figure 1, there were stark differences in patterns of doctor visits by type of insurance coverage and lack of coverage. Most striking, uninsured
individuals were much less likely to have had a doctor visit than people with health insurance coverage.3 In 2011, only 43.2% of the uninsured had at least one doctor visit over a six month period, compared to three-fourths of people who had insurance coverage (76.3%). People with public coverage were most likely to have had a doctor visit, followed by those with group coverage and individual health insurance. Interestingly, all insured population groups saw an increase in the share of people with a doctor visit between 2001 and 2011, with statistically significant increases in the overall population and those with group and individual coverage. In contrast, the share of the uninsured population with a doctor visit fell between 2001 and 2011 from 46% to 43.2%, albeit not at a statistically significant level4.
Health Economics Program
Utilization of Health Care by Insurance Status
Figure 1
Percent of Minnesotans with a Doctor Visit in the Past 6 Months by Insurance Status,
2001 and 2011
* Indicatesstatisticallysignificantdifferencefrompreviousyearatp<0.05^ Indicatesstatisticallysignificantdifferencefromoverallatp<0.05

Utilization of Health Care by Insurance Status
2
Figure 2
Percent Of Minnesotans With A Doctor Visit In The Past 6 Months By Insurance Status And
Health Status, 2011
The ability to afford needed care is a likely contributor to why a lower share of the uninsured visited the doctor in the past 6 months. As shown in Figure 3, uninsured people were three to six times more likely than people with coverage to say they did not get needed routine medical or specialist care due to cost. Another notable difference in Figure 3 is that among people with insurance those with individual insurance had significantly higher rates of not getting needed routine medical care due to cost than their counterparts with group or public insurance (11.6% versus 5.2% and 7.3%, respectively).
Figure 3
Percent Of Minnesotans Who Did Not Get Routine Medical Or Specialist Care In
The Past 12 Months Because Of Cost By Insurance Status
* IndicatesstatisticallysignificantdifferencefromOverallatp<0.05^ IndicatesstatisticallysignificantdifferencefromUninsuredatp<0.05
Beyond these general differences by insurance type, health status plays an important role in affecting patterns of utilization. For instance, one would expect to see lower rates of utilization among people in better health compared to people in poorer health, who have a greater health care need. Indeed, data from the 2011 survey show that a significantly smaller share of people in good health (72.0%) compared to those with poor health (84.8%) had seen a doctor over a six month period.5 But health status also interacts with insurance status: For instance, Minnesotans with public insurance and the uninsured population report significantly poorer health than those with private insurance.6
As Figure 2 illustrates, health status alone does not explain differences in utilization of doctor visits across people with different insurance status. As expected, there is lower utilization among those with good health as compared to those with poor health. However, uninsured people in poor health were less likely to have seen a doctor over a six month window (63.3%) than people in good health who had public coverage (77.9%, p<0.05) or were privately insured (73.83%, p<0.10).
^ IndicatesstatisticallysignificantdifferencefromUninsuredatp<0.05# IndicatesstatisticallysignificantdifferencefromPoorHealthStatus atp<0.05
Overnight Hospital StaysOvernight hospital stays are typically not elective, and many are in response to acute conditions or emergent events. Therefore, one might expect less variation in hospital utilization across people with different types of coverage. The likelihood of an overnight stay in the hospital also turns out to be quite sensitive to insurance coverage, with the publicly insured holding the highest rates of utilization among the insured (15.5%), followed by those with group coverage (6.3%), and those with individual coverage (3.3%). The rate of utilization among the uninsured population was 5.4%, comparable to those

3
Utilization of Health Care by Insurance Status
Figure 4
Percent Of Minnesotans With An Emergency Department Visit In The Past 12 Months By Insurance Status And Health Status, 2011
* IndicatesstatisticallysignificantdifferencefromOverallatp<0.05~ IndicatesstatisticallysignificantdifferencefromOverallatp<0.10^ IndicatesstatisticallysignificantdifferencefromUninsuredatp<0.05# IndicatesstatisticallysignificantdifferencefromPoorHealthStatus atp<0.05
with private insurance. (See Table 1). As one would expect, those in poorer health, regardless of insurance coverage, were more likely to have had at least one overnight hospital stay in the past 12 months: 26.5% of those in poor health had at least one overnight stay compared to 6.5% of those with good self-reported health in 2011.
When differences by insurance coverage and health status are considered together, a number of observations stand out. First, while there were no differences in the likelihood of having had an overnight hospital stay between people in poor health with private insurance (group or individual) and those with public coverage, people in good health with public coverage were more than twice as likely as those with group coverage to have had an overnight hospital stay and more than five times as likely as individually insured to have been hospitalized. Second, of those in poor health, the uninsured were the least likely population to have had an overnight hospital stay: about 11% of this group had an overnight stay in 2011 compared with 19%, 27% and 31% for the individually insured, those with group coverage and those with public coverage, respectively. Surprisingly, there were no significant differences in the proportion of the uninsured population in good or poor health who had an overnight hospital stay, but this may be due to the statistical properties of population groups with small numbers that prevent identifying meaningful differences.
Emergency Department VisitsLastly, the Minnesota Health Access Survey measures patterns of emergency department (ED) usage in Minnesota by demographic and insurance coverage statistics. As with other types of utilization, there are observable differences in usage patterns by insurance type; however, in contrast to utilization of doctor visits and inpatient stays where uninsured people had the lowest rates of utilization, the uninsured are significantly more likely to have had an ED visit (17.0% of uninsured people had at least one ED visit in the past 12 months) than those with group (12.2%) or individual (10.8%) insurance. The highest rate of ED usage was among the publicly insured; 27.0% had at least one ED visit in the past 12 months. (See Table 1)
As with doctor visits and inpatient stays, Minnesotans with poorer health status were more likely to use the ED
than those in good health. Figure 4 demonstrates, people with public coverage, whether in good or poor health use the ED more often than the population overall (nearly half of the publicly insured had at least one visit in a 12 month period). Uninsured people in good health reported using the ED at comparable rates to those with private coverage. In contrast, people without insurance coverage who were in poor health reported the lowest rates of ED usage (25.3%), even though the uninsured as a group report relying more significantly than others on the ED as their usual source of care. In 2011, 7.4% of the uninsured as compared to 1.9% of the insured indicated that they view the ED as the regular place they go for medical care. What the data may be showing is the uninsured in good health use the ED as their usual source of care for a variety of reasons, but that their overall moderate use leaves rates of ED use comparable to other populations.
Utilization of Health Care by Insurance Status
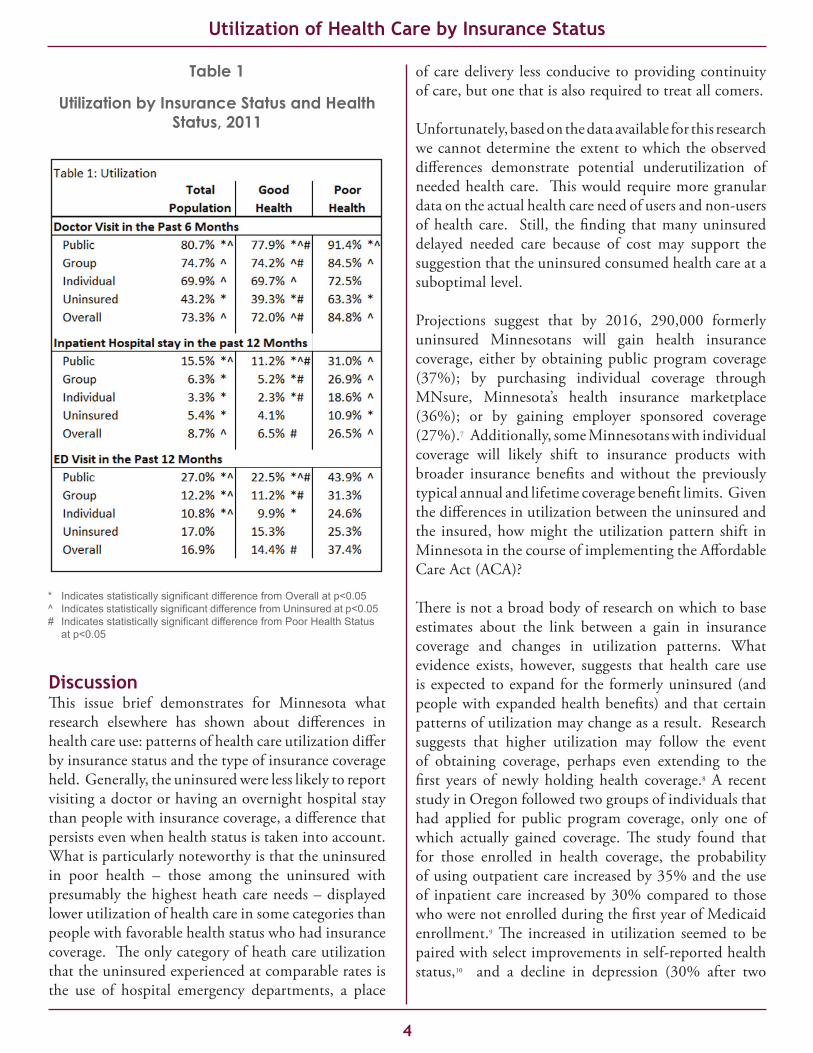
Table 1
Utilization by Insurance Status and Health Status, 2011
* IndicatesstatisticallysignificantdifferencefromOverallatp<0.05^ IndicatesstatisticallysignificantdifferencefromUninsuredatp<0.05# IndicatesstatisticallysignificantdifferencefromPoorHealthStatus atp<0.05
DiscussionThis issue brief demonstrates for Minnesota what research elsewhere has shown about differences in health care use: patterns of health care utilization differ by insurance status and the type of insurance coverage held. Generally, the uninsured were less likely to report visiting a doctor or having an overnight hospital stay than people with insurance coverage, a difference that persists even when health status is taken into account. What is particularly noteworthy is that the uninsured in poor health – those among the uninsured with presumably the highest heath care needs – displayed lower utilization of health care in some categories than people with favorable health status who had insurance coverage. The only category of heath care utilization that the uninsured experienced at comparable rates is the use of hospital emergency departments, a place
of care delivery less conducive to providing continuity of care, but one that is also required to treat all comers.
Unfortunately, based on the data available for this research we cannot determine the extent to which the observed differences demonstrate potential underutilization of needed health care. This would require more granular data on the actual health care need of users and non-users of health care. Still, the finding that many uninsured delayed needed care because of cost may support the suggestion that the uninsured consumed health care at a suboptimal level.
Projections suggest that by 2016, 290,000 formerly uninsured Minnesotans will gain health insurance coverage, either by obtaining public program coverage (37%); by purchasing individual coverage through MNsure, Minnesota’s health insurance marketplace (36%); or by gaining employer sponsored coverage (27%).7 Additionally, some Minnesotans with individual coverage will likely shift to insurance products with broader insurance benefits and without the previously typical annual and lifetime coverage benefit limits. Given the differences in utilization between the uninsured and the insured, how might the utilization pattern shift in Minnesota in the course of implementing the Affordable Care Act (ACA)?
There is not a broad body of research on which to base estimates about the link between a gain in insurance coverage and changes in utilization patterns. What evidence exists, however, suggests that health care use is expected to expand for the formerly uninsured (and people with expanded health benefits) and that certain patterns of utilization may change as a result. Research suggests that higher utilization may follow the event of obtaining coverage, perhaps even extending to the first years of newly holding health coverage.8 A recent study in Oregon followed two groups of individuals that had applied for public program coverage, only one of which actually gained coverage. The study found that for those enrolled in health coverage, the probability of using outpatient care increased by 35% and the use of inpatient care increased by 30% compared to those who were not enrolled during the first year of Medicaid enrollment.9 The increased in utilization seemed to be paired with select improvements in self-reported health status,10 and a decline in depression (30% after two
4

years of enrollment).11 A study conducted in Massachusetts following that state’s expansion of health insurance in 2008, with coverage changes not dissimilar from expected patterns prompted by the ACA, found overall utilization of the ED to have increased after implementation of health reform. At the same time, low severity visits to the ED (visits for types of care that generally can be more amenable to primary care treatment) decreased, as did hospitalizations from the ED for ambulatory care sensitive conditions.12
Experts are still debating whether the expected change in utilization will improve outcomes and whether newly covered populations will “settle in” at the same (but declining) rates of utilization as the general population. Ongoing monitoring of health reform implementation will help us better understand this empirically; although, any effect of coverage and utilization changes on health outcomes will likely be significantly lagged or appear only as avoided future health care utilization.
5
Utilization of Health Care by Insurance Status
1. This survey is a biennial population survey to develop estimates of health insur-ance coverage and health care access for Minnesota residents. It is conducted in partnership between the Health Economics Program of the Minnesota Department of Health and the School of Public Health at the University of Minnesota. For more information on the Minnesota Health Access Survey, and to use the data, see http://www.health.state.mn.us/healtheconomics and https://pqc.health.state.mn.us/mnha/Welcome.action. For a summary of the data, see http://www.health.state.mn.us/divs/hpsc/hep/publications/coverage/healthinscovmhas2011.pdf. 2. National Center for Health Statistics. Vital Health Stat 10(256). 2012. And Bloom B, Cohen RA, Freeman G. Summary Health Statistics for U.S. Children: National Health Interview Survey, 2011. National Center for Health Statistics. Vital Health Stat 10(254). 2012. insurance. 3. The survey analyzes Minnesotans by four major insurance categories: Public (Medicare, Medicaid, MinnesotaCare, VA and military coverage); Group (insurance through an employer or union); Individual, (individually purchased insurance for oneself or a family); and Uninsured (no health insurance). In 2011, 56.4% of Min-nesotans had group coverage, 5.2% held individual coverage, 29.2% were covered by public insurance was 29.2% and 9.1% of the population did not have health4. Unless otherwise noted, the differences between estimates in this issue brief that are highlighted as statistically significant, are estimated at the 95%level.5. Self-reported health is based on the question “Would you say your health is ex-cellent, very good, good, fair or poor?” Those who responded excellent, very good, or good are considered in good health, those with fair or poor health are considered in poor health.6. In 2011, 20.7% of those on public insurance report poor health, 4.6% of those with Group insurance report poor health, 5.5% of those with Individual insurance report poor health, and 18.4% of uninsured people report poor health. Overall, 10.6% of Minnesotans report poor health.7. Gruber, J. et al. The Impact of the ACA and Exchange on Minnesota. Prepared for the Minnesota Department of Commerce, April, 2012. http://mn.gov/com-merce/insurance/images/ExchGruberGormanFinalReport4-12.pdf8. Finkelstein A, Taubman S, Wright B, et al. The Oregon health insurance exper-iment: evidence from the first year. NBER working paper no. 17190. Cambridge, MA: National Bureau of Economic Research, July 20119. Baicker, K and Finklestein, A, The Effects of Medicaid Coverage – Learning from the Oregon Experiment. New England Journal of Medicine. 2011; 365(8): 683-685.10. Finkelstein A, Taubman S, Wright B, et al. The Oregon health insurance exper-iment: evidence from the first year. NBER working paper no. 17190. Cambridge, MA: National Bureau of Economic Research, July 201111. Baicker, K, Taubman, SL, Allen, HL et al. The Oregon Experiment – Effects of Medicaid on Clinical Outcomes. New England Journal of Medicine. 2013; 368(18): 1713-1722.12. Smulnowitz, PB, Lipton, R, Wharam, F, et al. Emergency Department Utiliza-tion After the Implementation of Massachusetts Health Reform. Annals of Emergency Medicine 2011; 58(3): 225-234.
Endnotes
The Health Economics Program conducts research and applied policy analysis to monitor changes in the health care marketplace; to understand factors influencing health care cost, quality and access; and to provide technical assistance in the development of state health care policy.
For more information, contact the Health Economics Programat (651) 201-3550. This issue brief, as well as other HealthEconomicsProgrampublications,canbefoundonourwebsiteathttp://www.health.state.mn.us/healtheconomics.
Minnesota Department of HealthHealth Economics Program
85 East Seventh Place, PO Box 64882St. Paul, MN 55164-0882
(651) 201-3550