
HEALTH DIRECTORATE - Home - Treasury · Web viewHEALTH Directorate Purpose The Health Directorate...
53
HEALTH DIRECTORATE Purpose The Health Directorate aims to achieve good health for all residents of the Territory by planning, purchasing and providing quality community based health services, hospital and extended care services, managing public health risks, and promoting health and early care interventions. The Health Directorate’s objectives are grouped around the following seven key performance areas: consumer experience; sustainability; hospital and related care; prevention; social inclusion and indigenous health; community based health; and aged care. 2012-13 Priorities Strategic and operational initiatives to be pursued in 2012-13 include: implementing the national health reforms as agreed by the Council of Australian Governments (COAG), including the implementation of hospital activity based funding; continuing to implement the National Partnership Programs (NPPs); continuing to meet the growth in demand for acute care, cancer treatment, mental health and critical care services through extra capacity and by redesigning care delivery systems; continuing implementation of a comprehensive Health Infrastructure Program (HIP) to build a sustainable and modern health system to ensure safety, availability and viability of quality health care in the ACT for now and into the future; continuing to expand services for the rapidly growing number of ACT residents living with chronic illness; 2012-13 Budget Paper No. 4 55 Health Directorate
Transcript of HEALTH DIRECTORATE - Home - Treasury · Web viewHEALTH Directorate Purpose The Health Directorate...

HEALTH DIRECTORATE
PurposeThe Health Directorate aims to achieve good health for all residents of the Territory by planning, purchasing and providing quality community based health services, hospital and extended care services, managing public health risks, and promoting health and early care interventions.
The Health Directorate’s objectives are grouped around the following seven key performance areas:
consumer experience;
sustainability;
hospital and related care;
prevention;
social inclusion and indigenous health;
community based health; and
aged care.
2012-13 PrioritiesStrategic and operational initiatives to be pursued in 2012-13 include:
implementing the national health reforms as agreed by the Council of Australian Governments (COAG), including the implementation of hospital activity based funding;
continuing to implement the National Partnership Programs (NPPs);
continuing to meet the growth in demand for acute care, cancer treatment, mental health and critical care services through extra capacity and by redesigning care delivery systems;
continuing implementation of a comprehensive Health Infrastructure Program (HIP) to build a sustainable and modern health system to ensure safety, availability and viability of quality health care in the ACT for now and into the future;
continuing to expand services for the rapidly growing number of ACT residents living with chronic illness;
continuing work to improve health and wellbeing within the Aboriginal and Torres Strait Islander (ATSI) community;
opening the new Gungahlin Health Centre; and
maintaining accreditation with appropriate bodies.
2012-13 Budget Paper No. 4 55 Health Directorate

Business and Corporate StrategiesThe Health Directorate has a comprehensive and effective governance framework, which manages strategic and operational risk, infrastructure and workforce planning, activity, information technology and financial performance.
The Health Directorate is committed to:
achieving a comprehensive health system that protects and improves the health of the community;
being an effective and efficient service provider;
working in partnership with other government services and community organisations;
developing new models of care and service delivery;
ongoing improvement in the cost of acute health services against the national peer hospital costs;
strengthening staff skills and professionalism; and
achieving a system of care and support that improves the quality of life for vulnerable groups.
Estimated Employment Level2010-11
Actual Outcome2011-12Budget
2011-12Est. Outcome
2012-13Budget
5,167 Staffing (FTE)1,2 5,153 5,411 5,549
Notes:1. The increase in the 2011-12 estimated outcome from the 2011-12 Budget is mainly due to employment agency staff being replaced
with permanent staff.2. The increase in the 2012-13 Budget from the 2011-12 estimated outcome is mainly due to the implementation of new and
continuing initiatives.
Strategic Objectives and IndicatorsThe Government’s overarching health policy, Your health - our priority identifies the following priorities:
timely access to better care;
management of chronic disease;
improved care for the elderly;
comprehensive services for mental health;
supporting children and vulnerable families; and
addressing gaps in Aboriginal and Torres Strait Islander health status.
2012-13 Budget Paper No. 4 56 Health Directorate

Strategic Objectives and Indicators cont.Some strategic indicators which were reported in 2011-12 have been deleted from the 2012-13 set of strategic indicators. The strategic indicators relating to emergency department access block have been deleted as they are no longer consistent with national reporting or consistent with reporting under the National Health Reforms. The strategic indicators relating to discharge planning have also been deleted as they are not reflective of wider discharge planning services.
These indicators include Calvary Public Hospital for 2012-13 for what is a transition year for further developing the model for funding and reporting under the National Health Reform Agreement.
Strategic Objective 1Removals from waiting list for elective surgery
The number of people removed from the ACT elective surgery waiting lists managed by ACT public hospitals. This may include public patients treated in private hospitals.
Strategic Indicator 1: Number of people removed from waiting list.2011-12
Target2011-12
Est. Outcome2012-13
TargetPeople removed from the ACT elective
surgery waiting list for surgery 11,000 11,000 11,000
In order to improve access to elective surgery, the Commonwealth and State and Territory Governments have entered into a partnership to significantly increase the number of elective surgery operations provided in our public hospitals each year and reduce the number of people waiting more than clinically recommended times for that surgery.
As part of this program, the Commonwealth and the ACT Government have committed funds to specifically increase access to surgery over the period 2009-10 to 2012-13.
Strategic Objective 2No waiting for access to emergency dental health services
Strategic Indicator 2: Percentage of assessed emergency clients seen within 24 hours.
This provides an indication of the responsiveness of the dental service to emergency clients.
2011-12 Target
2011-12 Est. Outcome
2012-13Target
Long Term Target
Percentage of emergency clients seen within 24 hours 100% 100% 100% 100%
2012-13 Budget Paper No. 4 57 Health Directorate

Strategic Objectives and Indicators cont.
Strategic Objective 3Reaching the optimum occupancy rate for acute adult overnight hospital beds
Strategic Indicator 3: The mean percentage of adult overnight acute medical and surgical beds in use.
This provides an indication of the efficient use of resources available for hospital services.
2011-12 Target
2011-12 Est. Outcome
2012-13Target
Long Term Target
Percentage of adult overnight acute medical and surgical beds in use 85% 89%1 85% 85%
Note:1. There has been an increase in the number of non same day bed days which has impacted on the bed occupancy rate.
Strategic Objective 4Access to radiotherapy services
Strategic Indicator 4: Percentage of radiotherapy patients who commence treatment within standard time frames.
This provides an indication of the effectiveness of public hospitals in meeting the need for cancer treatment services.
Category 2011-12Target
2011-12Est. Outcome
2012-13Target
Long Term Target
Urgent - treatment starts within 48 hours 100% 100% 100% 100%Semi Urgent - treatment starts within
4 weeks 95% 99.8% 95% 100%
Non Urgent - treatment starts within 6 weeks 95% 99.2% 95% 100%
Strategic Objective 5Government capital expenditure on healthcare infrastructure
Strategic Indicator 5: Capital consumption.
This indicator provides information on government investment to improve healthcare infrastructure. Information on the level of funding allocated for health infrastructure as a proportion of overall expenditure provides an indication of investment towards developing sustainable and improved models of care. The aim for the ACT is to exceed the national rate.
Government1 capital expenditure as a proportion of government2 capital consumption expenditure by healthcare facilities, 2007-08 to 2009-10
ACT Rate National Rate
2007-08 1.89 1.512008-09 2.76 1.902009-10 2.67 1.57Source: Health Expenditure Australia 2009-10 (Australian Institute of Health and Welfare)
Notes:1. Excludes local government.2. Expenditure on publicly owned healthcare facilities.
2012-13 Budget Paper No. 4 58 Health Directorate

Strategic Objectives and Indicators cont.
Strategic Objective 6Management of chronic disease
The top ten leading causes of disease burden in terms of Disability Adjusted Life Years are chronic diseases. These diseases, which include chronic heart disease, anxiety and depression, type 2 diabetes, stroke, chronic obstructive pulmonary disorder, lung cancer, Alzheimer’s and other dementias, colorectal cancer, asthma, and breast cancer, account for nearly 43 per cent of the total disease burden in Australia.
Strategic Indicator 6: Maintenance of the highest life expectancy at birth in Australia.
Life expectancy at birth provides an indication of the general health of the population and reflects on a range of issues other than the provision of health services, such as economic and environmental factors. The ACT has the highest life expectancy of any jurisdiction in Australia and the Government aims to maintain this result.
Maintenance of the highest life expectancy at birth in Australia ACT Rate National RateFemales 84.7 84Males 80.5 79.5Source: ABS 2011, Deaths, Australia, 2010, cat. no. 3302.0, ABS, Canberra.
Strategic Objective 7Lower than national average prevalence of circulatory disease
Strategic Indicator 7: The proportion of the ACT population with some form of circulatory disease.
Population projections suggest that the ACT population is ageing faster than other jurisdictions. The median age of the ACT population (34.5 years in 2005) has increased 6.4 years since 1985. While people of all ages can present with a chronic disease, the ageing of the population and longer lifespans mean that chronic diseases will place major demands on the health system for workforce and financial resources. The ACT continues to have a lower prevalence rate of cardiovascular disease than the national rate.
Cardiovascular Disease ACT Rate National RateProportion of the ACT population diagnosed with some form of
cardiovascular disease 15.2% 16.4%
Source: National Health Survey 2007-08 updates. No updated data for this indicator has been published.
Strategic Objective 8Lower than national average prevalence of diabetes
Strategic Indicator 8: The proportion of the ACT population diagnosed with some form of diabetes.
This indicator provides an indication of the success of prevention and early intervention initiatives. The self reported prevalence of diabetes in Australia has more than doubled over the past 25 years. Prevalence rates may increase in the short term as a result of early intervention and detection campaigns. This would be a positive result as experts predict that only half of those with diabetes are aware of their condition. This can have significant impacts on their long term health.
Diabetes ACT Rate National RatePrevalence of diabetes in the ACT 3.1% 3.6%Source: National Health Survey 2007-08 Summary of Results 2007-08 (reissue) Australian Bureau of Statistics. No updated data for this indicator has been published.
2012-13 Budget Paper No. 4 59 Health Directorate

Strategic Objectives and Indicators cont.
Strategic Objective 9Higher than national average proportion of Government recurrent health funding expenditure on public
health activities
Strategic Indicator 9: Proportion of Government recurrent health funding expenditure on public health activities.
Improvements in prevention of diseases can reduce longer term impacts on the health system, particularly for people with chronic diseases. The aim for the ACT is to exceed the Australian average.
Estimated total government expenditure on public health activities as a proportion of total current health expenditure
ACT Rate National Rate
2005-06 3.1% 2.6%2006-07 3.1% 2.8%2007-08 3.5% 3.1%Source: Public Health Expenditure Report 2007-08 (Australian Institute of Health and Welfare)
Strategic Objective 10Maintaining the waiting times for in hospital assessments by the Aged Care Assessment Team
Strategic Indicator 10: The mean waiting time in working days between the request for, and provision of, assessment by the Aged Care Assessment Team (ACAT) for patients in public hospitals.
This provides an indication of the responsiveness of the ACAT in assessing the needs of clients.
2011-12 Target
2011-12Est. Outcome
2012-13Target
Long Term Target
Mean waiting time in working days 2 days 2 days 2 days 2 days
Strategic Objective 11Providing comprehensive services for mental health and reducing the usage of seclusion
Strategic Indicator 11: The proportion of clients with episodes of seclusion of public mental health in the ACT who are subject to seclusion during an inpatient episode.
This measures the effectiveness of public mental health services in the ACT over time in providing services that minimise the need for seclusion.
2011-12Target
2011-12Est. Outcome
2012-13Target
Long TermTarget
Proportion of clients of public mental health services in the ACT subject to seclusion during an inpatient episode
3% 1.7% 3% <5%
2012-13 Budget Paper No. 4 60 Health Directorate

Strategic Objectives and Indicators cont.
Strategic Objective 12Maintaining consumer and carer participation on relevant mental health committees
Strategic Indicator 12: The proportion of mental health ACT committees in which consumers and carers are represented.
This measure ensures that the Committees, which monitor the delivery and planning of our mental health services, have effective input from mental health consumers.
2011-12Target
2011-12Est. Outcome
2012-13Target
Long TermTarget
Proportion of Mental Health Services committees with consumer and carer representation
100% 100% 100% 100%
Strategic Objective 13Patients return rate to an ACT public mental health inpatient unit lower than national average.
Strategic Indicator 13: The proportion of clients who return to hospital within 28 days of discharge from an ACT public mental health inpatient unit.
2011-12Target
2011-12 Est. Outcome
2012-13 Target
National Rate 2009-101
Proportion of clients who return to hospital within 28 days of discharge from an ACT public mental health inpatient unit
<10%2 8.8% <10%2 12%
Source: Report on Government Services 2012
Notes:1. Group A Jurisdictions (NSW, Victoria, Queensland, Western Australia, ACT, Northern Territory).2. COAG suggests rate below 10 per cent as good practice.
Strategic Objective 14Addressing gaps in Aboriginal and Torres Strait Islander health status
Strategic Indicator 14: Immunisation rates – ACT indigenous population
This provides an indication of the public health services to minimise the incidence of vaccine preventable diseases, as recorded by the Australian Childhood Immunisation Register, in the ACT’s indigenous population to minimise disparities between indigenous and non indigenous Australians.
2011-12Target
2011-12 Est. Outcome1
2012-13Target
Long TermTarget
Immunisation rates for vaccines in the national schedule for the ACT indigenous population: 12 to 15 months 24 to 27 months 60 to 63months All
≥90%≥90%≥90%≥90%
87%98%88%91%
≥90%≥90%≥90%≥90%
≥90%≥90%≥90%≥90%
Note:1. The very low numbers of Aboriginal and Torres Strait Islander children in the ACT means that the ACT Aboriginal and Torres Strait
Islander coverage data should be read with caution. This small population can cause rate fluctuations.
2012-13 Budget Paper No. 4 61 Health Directorate

Strategic Objectives and Indicators cont.
Strategic Objective 15Maximising the quality of hospital services
The following three indicators are a selection of the patient safety and service quality indicators that are used to monitor ACT public hospital services. The targets provide an indication of the desired outcomes over time. Given the nature of the indicators, small fluctuations during a particular period can skew results. The success of the Health Directorate in meeting these indicators requires a consideration of performance over time rather than for any given period.
Strategic Indicator 15.1: The proportion of people who undergo a surgical operation requiring an unplanned return to the operating theatre within a single episode of care due to complications of their primary condition. This provides an indication of the quality of theatre and post operative care.
2011-12 Target 2011-12 Est. Outcome 2012-13 TargetCanberra Hospital <1.0% 0.74% <1.0%1
Calvary Public Hospital <0.5% 0.33% <0.5%
Note:1. The Canberra Hospital target is based on similar rates for peer hospitals – based on Australian Council of Healthcare Standards
(ACHS).
Strategic Indicator 15.2: The proportion of people separated from ACT public hospitals who are re-admitted to hospital within 28 days of their separation due to complications of their condition (where the re-admission was unforseen at the time of separation). This provides an indication of the effectiveness of hospital based and community services in the ACT in the treatment of persons who receive hospital based care.
2011-12 Target 2011-12 Est. Outcome 2012-13 TargetCanberra Hospital <2.0% 1.34% <2.0%Calvary Public Hospital <1.0% 0.79% <1.0%
Strategic Indicator 15.3: The number of people admitted to hospitals per 10,000 occupied bed days who acquire a bacteraemial infection (bacteria in the blood) during their stay. This provides an indication of the safety of hospital based services.
2011-12 Target 2011-12 Est. Outcome1 2012-13 TargetCanberra Hospital <7 per 10,000 7 per 10,000 <7 per 10,000Calvary Public Hospital <3 per 10,000 0.99 per 10,000 <3 per 10,000
Note:1. Very small numbers can cause fluctuations in the results for this indicator.
Strategic Objective 16High participation rate in the cervical screening program
Strategic Indicator 16: Two year participation rate in the cervical screening program.
The two year participation rate provides an indication of the effectiveness of early intervention health messages. The ACT aims to exceed the national average for this indicator.
ACT Rate National RateTwo year participation rate 58.8% 57.4%Source: Cervical Screening in Australia 2009-10 (Australian Institute of Health and Welfare, May 2012)
2012-13 Budget Paper No. 4 62 Health Directorate

Strategic Objectives and Indicators cont.
Strategic Objective 17Improved emergency department timeliness
Strategic Indicator 17: The proportion of emergency department presentations that are treated within clinically appropriate timeframes.
2011-12 Target
2011-12 Est. Outcome1
2012-13 Target
Long TermTarget
One (resuscitation seen immediately) 100% np2 100% 100%Two (emergency seen within 10 mins) 80% np 80% 80%Three (urgent seen within 30 mins) 75% np 75% 75%Four (semi-urgent seen within 60 mins) 70% np 70% 70%Five (non-urgent seen within 120 mins) 70% np 70% 70%All Presentations 70% np 70% 80%
Notes:1. The results of emergency department performance in the Territory are under a formal investigation. ACT Emergency Department
activity will be published when the data has been rectified.2. Not published.
Strategic Objective 18Improved breast screen participation rate for women aged 50 to 69 years
Strategic Indicator 18: The proportion of women in the target age group (50 to 69 years) who have a breast screen in the 24 months prior to each counting period.
2011-12 Target
2011-12 Est. Outcome
2012-13 Target
Long Term Target
Proportion of women aged 50 to 69 who have a breast screen 60% 57% 60% 70%
Strategic Objective 19Achieve lower than the Australian average in the Decayed, Missing, or Filled Teeth (DMFT) index
Strategic Indicator 19: The mean number of teeth with dental decay, missing or filled teeth at ages 6 and 12.
This gives an indication of the effectiveness of prevention, early intervention and treatment services in the ACT. The aim for the ACT is to better the Australian average.
Dental Health - Decay, missing or filled teeth (DMFT) ACT Rate National RateDMFT index at 6 years 1.91 1.96DMFT Index at 12 years 1.27 1.02Source: Australia’s Health 2008 (2002 data). No updated data for this indicator has been published.
2012-13 Budget Paper No. 4 63 Health Directorate

Strategic Objectives and Indicators cont.
Strategic Objective 20Reducing the risk of fractured femurs in ACT residents aged over 75 years
Strategic Indicator 20: Reduction in the rate of broken hips (fractured neck of femur).
This provides an indication of the success of public and community health initiatives to prevent hip fractures. In 2010-11, the ACT rate of admissions in persons aged 75 years and over with a fractured neck of femur was 5.3 per 1,000 ACT population. This is within the long term target and follows the generally decreasing trend over the 10 year period from 2001-02.
2010-11 Outcome
Long Term Target
Rate per 1,000 people 5.3 5.3
Strategic Objective 21Reduction in the youth smoking rate
Strategic Indicator 21: Percentage of persons aged 12 to 17 years who smoke regularly.
The results from the 2008 Secondary School Alcohol and Drug Survey (ASSAD) show that 6.7 per cent of students were current smokers in that year. This demonstrates a continued decline in current smoking from 15.3 per cent in 2001 to 6.7 per cent. The national rate for current smoking in 2008 was 7.3 per cent.
2008 Outcome National Rate Long Term Target
Percentage of persons aged 12 to17 who are current smokers 6.7% 7.3% 5%
Source: ACT Chief Health Officer’s Report 2010. No updated data for this indicator has been published.
2012-13 Budget Paper No. 4 64 Health Directorate

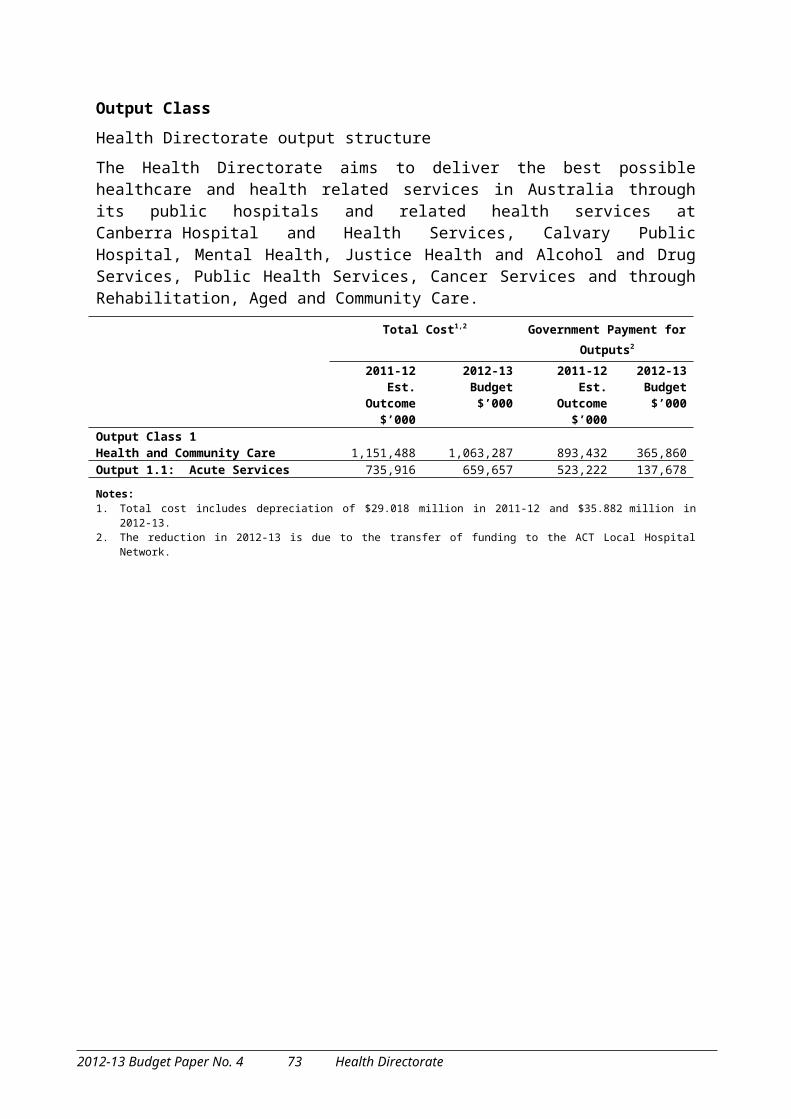
Output ClassHealth Directorate output structure
The Health Directorate aims to deliver the best possible healthcare and health related services in Australia through its public hospitals and related health services at Canberra Hospital and Health Services, Calvary Public Hospital, Mental Health, Justice Health and Alcohol and Drug Services, Public Health Services, Cancer Services and through Rehabilitation, Aged and Community Care.
Total Cost1,2 Government Payment forOutputs2
2011-12Est. Outcome
$’000
2012-13Budget
$’000
2011-12Est. Outcome
$’000
2012-13Budget
$’000Output Class 1 Health and Community Care 1,151,488 1,063,287 893,432 365,860Output 1.1: Acute Services 735,916 659,657 523,222 137,678
Notes:1. Total cost includes depreciation of $29.018 million in 2011-12 and $35.882 million in 2012-13.2. The reduction in 2012-13 is due to the transfer of funding to the ACT Local Hospital Network.
Output Description
The Canberra Hospital provides a comprehensive range of acute care, including inpatient, outpatient, and emergency department services. The key strategic priority for acute services is to deliver timely access to effective and safe hospital care services.
This means focussing on:
implementing work arising from the National Health Reform Agreement which the Commonwealth Government has put into place through a number of national partnerships and agreements with the aim of improving services to the Australian community;
strategies to improve access to emergency services under the National Health Reform;
meeting the increasing demand for elective surgery in the Territory and reduce the number of people waiting longer than recommended standard waiting times;
strategies to meet performance targets for the emergency department and elective and emergency surgery; and
continuing to increase the capacity of acute care services within the ACT and surrounding region.
Total Cost1 Government Payment forOutputs1
2011-12Est. Outcome
$’000
2012-13 Budget$’000
2011-12Est. Outcome
$’000
2012-13Budget
$’000Output 1.2: Mental Health, Justice Health
and Alcohol and Drug Services113,324 117,504 105,308 54,432
Note:1. The reduction in 2012-13 is due to the transfer of funding to the ACT Local Hospital Network.
2012-13 Budget Paper No. 4 65 Health Directorate

Output Classes cont.
Output Description
Mental Health, Justice Health and Alcohol and Drug Services provide a range of services in hospitals, community health centres, adult and youth correctional facilities and peoples’ homes across the Territory. This service works with its community partners to provide integrated and responsive care to a range of services including hospital based specialist services, supported accommodation services and community based service responses.
The key strategic priorities for Mental Health, Justice Health and Alcohol and Drug Services are ensuring that clients’ needs are met in a timely fashion and that care is integrated across hospital, community, and residential support services.
This means focussing on:
ensuring timely access to emergency mental health care by reducing waiting times for urgent admissions to acute psychiatric units;
ensuring that public mental health services in the ACT provide consumers with appropriate assessment, treatment and care that result in improved mental health outcomes; and
providing hospital and community based alcohol and drug services and health care assessments for people detained in corrective facilities.
Total Cost Government Payment for Outputs
2011-12Est. Outcome
$’000
2012-13Budget
$’000
2011-12Est. Outcome
$’000
2012-13Budget
$’000Output 1.3: Public Health Services 39,315 40,952 36,320 37,417
Output Description
Public Health Services provides high quality health and community services to the ACT and surrounding region. The key strategic priorities for Public Health Services include monitoring the health of the ACT population, promoting health, preventing disease, improving health equity, protecting the health of the public, and supporting workforce excellence (Population Health Division).
Total Cost1 Government Payment forOutputs1
2011-12Est. Outcome
$’000
2012-13Budget
$’000
2011-12Est. Outcome
$’000
2012-13Budget
$’000Output 1.4: Cancer Services 67,481 64,866 57,070 15,205
Note:1. The reduction in 2012-13 is due to the transfer of funding to the ACT Local Hospital Network.
2012-13 Budget Paper No. 4 66 Health Directorate

Output Classes cont.
Output Description
Capital Region Cancer Services provides a comprehensive range of screening, assessment, diagnostic, treatment, and palliative care services. Services are provided in inpatient, outpatient, and community settings.
The key strategic priorities for cancer care services are early detection and timely access to diagnostic and treatment services. These include ensuring that population screening rates for breast and cancer meet targets, waiting time for access to essential services such as radiotherapy are consistent with agreed benchmarks, and increasing the proportion of women screened through the BreastScreen Australia program for the target population (aged 50 to 69 years) to 70 per cent over time.
Total Cost1 Government Payment for Outputs1
2011-12Est. Outcome
$’000
2012-13Budget
$’000
2011-12Est. Outcome
$’000
2012-13Budget
$’000Output 1.5: Rehabilitation, Aged and
Community Care 124,125 101,815 108,874 69,160
Notes:1. The reduction in 2012-13 is due to the transfer of funding to the ACT Local Hospital Network and the transfer of transitioning of
responsibilities for aged care to the Commonwealth.
Output Description
The provision of an integrated, effective and timely response to rehabilitation, aged care and community care services in inpatient, outpatient, emergency department, sub acute and community based settings.
The key strategic priorities for Rehabilitation, Aged and Community Care are:
ensuring that older persons in hospital wait the least possible time for access to comprehensive assessment by the Aged Care Assessment Team. This will assist in their safe return home with appropriate support, or access to appropriately supported residential accommodation;
improving discharge planning to minimise the likelihood of readmission or inadequate support for independent living, following completion of hospital care; and
ensuring that access, consistent with clinical need, is timely for community based nursing and allied health services and that community based services are in place to better provide for the acute and post acute health care needs of the community.
Total Cost1 Government Payment for Outputs1
2011-12Est. Outcome
$’000
2012-13Budget
$’000
2011-12Est. Outcome
$’000
2012-13Budget
$’000Output 1.6: Early Intervention and Prevention 71,327 78,493 62,638 51,968
Note:1. The reduction in 2012-13 is due to the transfer of funding to the ACT Local Hospital Network.
2012-13 Budget Paper No. 4 67 Health Directorate

Output Classes cont.Output Description
Increasing the focus on initiatives that provide early intervention to, or prevent, health care conditions that result in major acute or chronic health care burdens on the community.
The key strategic priorities for intervention and prevention are reducing the level of youth smoking in the ACT and maintaining immunisation rates for children above 90 per cent.
Accountability IndicatorsThe 2012-13 Targets do not include Calvary Public Hospital and Clare Holland House as these are now included in the ACT Local Hospital Network (LHN) Directorate.
2011-12Targets
2011-12Est. Outcome
2012-13Targets
Output Class 1: Health and Community CareOutput 1.1: Acute Services
Patient activitya. Cost weighted patient separations 91,6001 91,6001 63,5412,3
b. Non admitted occasions of service 300,235 309,310 268,4343
c. Percentage of category one elective surgery patients who receive surgery within 30 days of listing
95% 95% 97%
d. Number of allied health care services provided for acute care patients in ACT Public Hospitals
101,400 101,400 101,400
e. Mean waiting time for clients on the dental services waiting list
12 months 12 months 12 months
f. Percentage of the Women’s Health Service Intake Officer’s clients who receive an intake and assessment service within 14 working days of their initial referral
100% 100% 100%
Notes:1. Cost weights presented using AR-DRG Version 5.2 mapped to National Public Weights Round 13.2. Cost weights presented using AR-DRG Version 6 mapped to National Public Weights Round 14. This figure reflects an estimated
3 per cent growth on the 2011-12 estimated outcome using round 14 weights.3. This figure excludes Calvary Public Hospital activity which is reported in the ACT Local Hospital Network Directorate from 2012-13.
2011-12Targets
2011-12Est. Outcome
2012-13Targets
Output 1.2: Mental Health, Justice Health and Alcohol and Drug ServicesPatient activity
a. Cost weighted separations 4,0301 4,2841 3,0042,3
b. Admitted patient separations 1,380 1,394 8303,4
c. Adult services (18 - 64 years) 175,100 187,207 185,000d. Children and youth services (0 - 17 years) 56,000 52,528 52,000e. Older persons’ services (65+ years) 18,600 16,794 17,000f. Older persons’ services bed days5 6,570 5,255 4,928g. Supported accommodation bed occupancy rate6 95% 95% 95%h. Proportion of clients contacted by a Health Directorate
community facility within 7 days post discharge from inpatient services
75% 75% 75%
2012-13 Budget Paper No. 4 68 Health Directorate

Accountability Indicators cont.2011-12Targets
2011-12Est. Outcome
2012-13Targets
Output 1.2: Mental Health, Justice Health and Alcohol and Drug Services cont.Patient activityi. Percentage of clients with outcome measures completed 65% 65% 65%j. Proportion of offenders and detainees at the Alexander
Maconochie Centre with a completed health assessment within 24 hours of detention
100% 100% 100%
k. Proportion of offenders and detainees in Bimberi Youth Detention Centre with a completed health assessment within 24 hours of detention7
100% 88% 100%
l. Percentage of current clients on opioid treatment with management plans
98% 99% 98%
Notes:1. Cost weights presented using AR-DRG Version 5.2 mapped to National Public Weights Round 13.2. Cost weights presented using AR-DRG Version 6 mapped to National Public Weights Round 14. This figure requests an estimated
3 per cent growth on the 2011-12 estimated outcome of 4,043 cost weights using Round 14 weights. The 2012-13 targets include Alcohol and Drug Service CWS, which was previously reported in output 1.1.
3. This figure excludes Calvary Public Hospital activity which is reported in the ACT Local Hospital Network Directorate from 2012-13.4. Target adjusted for opening of new beds at Adult Mental Health Unit from 30 to 35. 5. The bed days target has been adjusted to available beds at 15 with 90 per cent occupancy (previous target was based on 20 beds –
additional 5 were not opened in 2011-12).6. The proportion of occupied supported accommodation bed days compared to the total available bed days. This provides an
indication of the efficient use of resources available for supported accommodation services.7. Young people detained for periods less than 24 hours are excluded.
2011-12Targets
2011-12Est. Outcome
2012-13Targets
Output 1.3: Public Health Services
a. Samples analysed 7,600 7,600 7,600b. Compliance of licensable, registrable and non licensable
activities at time of inspection85% 76%1 85%
c. Response time to environmental health hazards, communicable disease hazards relating to measles and meningococcal infections and food poisoning outbreaks is less than 24 hours
100% 100% 100%
Note:1. The estimated under achievement for 2011-12 relates to targeted inspections of identified problem premises, compliant based
inspections and re-inspections of non compliant premises.
2011-12Targets
2011-12Est. Outcome
2012-13Targets
Output 1.4: Cancer ServicesPatient activitya. Cost weighted admitted patient separations 5,0401 5,0671 4,1422,3
b. Non admitted occasions of service 57,288 59,600 59,2603
Breast screeningc. Total breast screens4 11,400 14,7705 14,9076
d. Number of breast screens for women aged 50 to 694 9,975 12,1845 12,5527
e. Percentage of women who receive results of screen within 28 days8
100% 99% 100%
f. Percentage of screened who are assessed within 28 days8 90% 85% 90%
2012-13 Budget Paper No. 4 69 Health Directorate

Accountability Indicators cont.Notes:1. Cost weights presented using AR-DRG Version 5.2 mapped to National Public Weights Round 13. The number of hospital based
services provided to clients. These provide an indication of the number of services provided for hospital based cancer patients.2. Cost weights presented using AR-DRG Version 6 mapped to National Public Weights Round 14. This figure reflects an estimated 3 per
cent growth on the 2011-12 estimated outcome of 4,886 cost weights using Round 14 weights.3. This figure excludes Calvary Public Hospital activity which is reported in the ACT Local Hospital Network Directorate from 2012-13.4. The total number of women who have breast screens each year and the number of women in the major target group (aged 50 to
69 years) who access this service. This gives an indication of the total volume of services as well as providing an indication of the level of services provided to women in the target age group.
5. The estimated outcome for these Outputs are above target due the engagement of locum radiographers and the recruitment of two permanent radiographers, increasing screening capacity.
6. This target is calculated based on the annual number of screens required to achieve the Output 1.4.d target, with the addition of the average associated screens for women outside the target group provided annually.
7. This target is calculated based on the annual number of screens required to achieve the 2012-13 Strategic Objective 18. Improved Breast Screen Participation Rate target of 60 per cent, with an adjustment for women attending for screening annually who are only counted once towards the 24 month Participation Rate.
8. These provide an indication of the effectiveness of the service providing timely advice to women on the results of their breast screen.
2011-12Targets
2011-12Est. Outcome
2012-13Targets
Output 1.5: Rehabilitation, Aged and Community Care Patient activitya. Cost weighted admitted patient separations 5,0701 4,7731 3,5412,3
b. Non-admitted occasions of service 2,230 1,8504 2,230c. Sub-acute service - episodes of care 1,640 1,757 1,3843
d. Sub-acute service - occupied bed days 22,849 20,1565 13,3493
e. Number of people assessed in falls clinics6 420 492 420f. Number of nursing (domiciliary and clinic based) occasions
of service80,000 83,333 80,000
g. Number of allied health regional services (occasions of service)
22,000 29,333 22,000
Notes:1. Cost weights presented using AR-DRG Version 5.2 mapped to National Public Weights Round 13.2. Cost weights presented using AR-DRG Version 6 mapped to National Public Weights Round 14. This figure reflects an estimated
3 per cent growth on the 2011-12 estimated outcome of 4,200 cost weights using Round 14 weights. 3. This figure excludes Calvary Public Hospital activity which is reported in the ACT Local Hospital Network Directorate from 2012-13.4. Non admitted outpatients occasions of service have decreased due to availability of staffing. 5. Sub acute services – occupied bed days have decreased due to increased same day separations at the Rehabilitation Independent
Living Unit and Calvary Geriatric Evaluation Medicine Beds not operational due to reduced number of Geriatricians.6. This is an indication of demand for this service and the effectiveness of aged care services in minimising the fall risks for older people.
2011-12Targets
2011-12Est. Outcome
2012-13Targets
Output 1.6: Early Intervention and Preventiona. Immunisation coverage for the primary immunisation
schedule measured at 1 year of age, in accordance with the Australian Childhood Immunisation Register
92% 92% 92%
b. Proportion of clients attending ‘Well Women's Check’ within the Women's Health Service that are from culturally and linguistically diverse communities
30% 39% 30%
c. Proportion of children aged 0-14 who are entering substitute and kinship care within the ACT who attend the Child at Risk Health Unit for a health and wellbeing screen.
80% 71% 80%
2012-13 Budget Paper No. 4 70 Health Directorate

Changes to AppropriationChanges to Appropriation - Controlled 2011-12 2012-13 2013-14 2014-15 2015-16Government Payment for Outputs Est. Out. Budget Estimate Estimate Estimate $'000 $'000 $'000 $'000 $'000
2011-12 Budget 896,185 924,618 998,082 1,073,620 1,073,620
2nd AppropriationRevised Wage Parameters 4,743 14,267 15,304 16,315 17,354
2012-13 Budget Policy AdjustmentsIncreased Critical Care Capacity - 2,500 2,588 2,678 2,772 Growth in Demand for Acute Services - 7,500 7,763 8,034 8,315 Growth in Demand for Surgical Services - 3,000 3,105 3,214 3,326 Growth in Cancer Services - 1,000 1,035 1,071 1,109 Mental Health Growth - 1,000 1,035 1,071 1,109 Chronic Disease Management - 1,000 1,035 1,071 1,109 Expansion of Neonatal Intensive Care Services - 2,500 3,088 3,196 3,307 Gungahlin Health Centre - 1,000 1,600 1,900 2,100 Update to Growth Envelope - 7,763 - - - Enhance Emergency Department Services - 1,940 3,486 3,567 3,652 Higher Costs for ACT Blood Supply Plan - 1,827 - - - Additional Air Quality Performance Station - 165 170 174 180 Enhanced Counselling and Volunteer Services - 50 50 50 - Healthy Weight Action Plan - 100 100 100 - Social and Community Services (SACS) Pay Equity Award - 46 178 335 525 Enhanced Community Health Centre Backup Power - - 10 20 53 Offset – Base Funding Envelope - (19,500) (21,249) (22,235) (23,147)Revised Wage Indexation Parameters - - (3,921) (8,340) (13,275)Savings Initiatives - (3,739) (6,002) (8,372) (10,512)
2012-13 Budget Technical AdjustmentsRevised Indexation Parameters - (1,055) (1,081) (1,108) 91,042 Revised Indexation Parameters – Community Sector
Funding- (128) (133) (138) 238
Revised Notional Superannuation Contribution Rates - 3,692 3,740 3,788 3,837 Transfer – Funding for Public Hospital Services to the ACT
LHN- (598,740) (642,788) (699,089) (760,828)
Transfer – Funding for Equal Remuneration Project Team to CSD
- (184) (190) (196)
Rollover – Commonwealth Grants – Health Services NP (24) 24 - - - Rollover – Commonwealth Grants – Hospital and Health
Workforce Reform NP(220) 220 - - -
Rollover – Commonwealth Grants – Indigenous Early Childhood Development NP
(165) 165 - - -
Rollover – Commonwealth Grants – Preventative Health NP
(482) 482 - - -
Rollover – Commonwealth Grants – Essential Vaccines NP (2,900) 2,900 - - - Rollover – Commonwealth Grants – National Health
Reform NP(8,008) 8,008 - - -
Commonwealth Grants – Health Services NP 456 291 638 575 585 Commonwealth Grants – Elective Surgery Waiting List
Reduction Program NP666 - - - -
Commonwealth Grants – Preventative Health NP 280 286 - 1 (3,937)
2012-13 Budget Paper No. 4 71 Health Directorate

Changes to Appropriation cont.Changes to Appropriation - Controlled 2011-12 2012-13 2013-14 2014-15 2015-16Government Payment for Outputs Est. Out. Budget Estimate Estimate Estimate $'000 $'000 $'000 $'000 $'000
Commonwealth Grants – Essential Vaccines NP 2,479 (2,780) 4,897 4,829 4,580 Commonwealth Grants – Hepatitis C Settlement Fund NP (42) - - - - Commonwealth Grants – Home and Community Care
Services for Veterans NP165 - - 7 7
Commonwealth Grants – Aged Care Assessment NP 81 95 - - - Commonwealth Grants – Health and Hospital Fund
Projects (Integrated Cancer Centre) NP- 2,337 - - -
Commonwealth Grants – Mental Health (Reform Program) NP
310 620 620 721 -
Commonwealth Grants – Commonwealth Dental Health Program NP
- 1,102 2,471 1,904 -
Commonwealth Grants – Transitioning Responsibilities for Aged Care and Disability Services NP
(92) 1 1 (1) 13
Commonwealth Grants – Revised Transfer of Aged Care Services NP
- 1,487 1,774 2,246 2,173
2012-13 Budget 893,432 365,860 377,406 391,008 409,307
Changes to Appropriation - Territorial 2011-12 2012-13 2013-14 2014-15 2015-16Payment for Expenses on Behalf of Territory Est. Out. Budget Estimate Estimate Estimate $'000 $'000 $'000 $'000 $'000
2011-12 Budget 727 746 765 784 784
2012-13 Budget Technical AdjustmentsRevised Indexation Parameters - - - - 19 Rollover – Payment for Residential Accommodation
Refurbishment – Calvary259
2012-13 Budget 986 746 765 784 803
Changes to Appropriation - Controlled 2011-12 2012-13 2013-14 2014-15 2015-16Capital Injections Est. Out. Budget Estimate Estimate Estimate $'000 $'000 $'000 $'000 $'000
2011-12 Budget 282,739 199,172 7,512 3,942 3,942
FMA Section 16B Rollovers from 2010-11An E-Healthy Future 14,546 - - - - Provision for Project Definition Planning 4,963 - - - - Linear Accelerator Procurement and Replacement 4,528 - - - - New Multistorey Car Park TCH 2,517 - - - - Clinical Equipment for Calvary Hospital 2,356 - - - - Women and Children's Hospital 2,142 - - - - Adult Mental Health Inpatient Facility 1,648 - - - - CADP Change Management and Communication Support 1,487 - - - -
2012-13 Budget Paper No. 4 72 Health Directorate
Changes to Appropriation cont.Changes to Appropriation - Controlled 2011-12 2012-13 2013-14 2014-15 2015-16Capital Injections Est. Out. Budget Estimate Estimate Estimate $'000 $'000 $'000 $'000 $'000
Integrated Cancer Centre – Phase 1 661 - - - - Secure Adult Mental Health Unit (Forward Design) 453 - - - - Enhanced Community Health Centre - Belconnen 361 - - - - Mental Health Assessment Unit 322 - - - - Augmentation of Patient and Research Facilities 316 - - - - Radiation Equipment 230 - - - - Aboriginal Torres Strait Islander Residential Alcohol &
Other Drug Rehabilitation Facility197 - - - -
New Gungahlin Health Centre 178 - - - - Workplace Improvements 173 - - - - Augmentation of Medical Offices 171 - - - - Surgical Assessment and Planning Unit 161 - - - - Installation of Energy Savings Equipment and
Sustainability Upgrades134 - - - -
Clinical Services Redevelopment – Phase 2 119 - - - - Neonatal Intensive Care Unit – Video Streaming Services 100 - - - - TCH Discharge Lounge Relocation 96 - - - - Upgrade of Mechanical Systems 75 - - - - Elective Surgery (Commonwealth Funding) 74 - - - - Ophthalmology Service 69 - - - - Refurbishment of Health Centre – Tuggeranong 68 - - - - Mental Health Young Persons Unit 66 - - - - Improvements to OH&S and Fire and Safety Systems 27 - - - - National Health Reform 20 - - - - Procurement and Installation of a PET/CT Scanner 20 - - - - Refurbishment of Non-Clinical Accommodation at TCH 19 - - - - Workplace Redesign to Meet Accommodation and OH&S
Standards12 - - - -
Building Upgrades – Including Asbestos Removal Non Acute Sites (Stage 1)
2 - - - -
TCH 12 Building Works (2) - - - - Safety Upgrades (3) - - - - TCH Upgrades to Ambulatory Area, IC Facilities, Pathology
Laboratories and ED(9) - - - -
Building Upgrades (11) - - - - ACT Health Skills Development Centre (79) - - - - Additional Beds (159) - - - - Digital Mammography (159) - - - - Fire Systems Upgrade (Phase 1) (356) - - - - Provision for Phase 1 – CSR (1,774) - - - -
2012-13 Budget Policy AdjustmentsAdult Secure Mental Health Unit (Finalising Design) - 2,000 - - - Staging and Decanting – Moving to Our Future - 10,800 11,500 - - Health Infrastructure Program – Project Management - 10,819 8,500 - - Enhanced Community Health Centre Backup Power - 2,000 1,540 - - Major Building Plant Replacement and Upgrade - 3,000 2,292 - -
2012-13 Budget Paper No. 4 73 Health Directorate

Changes to Appropriation cont.Changes to Appropriation - Controlled 2011-12 2012-13 2013-14 2014-15 2015-16Capital Injections Est. Out. Budget Estimate Estimate Estimate $'000 $'000 $'000 $'000 $'000
Replacement of CT Scanner at the Canberra Hospital - 2,893 - - - Additional Air Quality Performance Station - 207 - - -
2012-13 Budget Technical AdjustmentsRevised Indexation Parameters - - - - 99 Revised Funding Profile – Clinical Services Redevelopment
(Phase 3)(11,000) (3,321) 14,321 - -
Revised Funding Profile – Integrated Cancer Care Centre – (Phase 2)
(830) 155 675 - -
Revised Funding Profile – Enhancement of Canberra Hospital Facilities (Design)
(19,000) (8,020) 27,020 - -
Revised Funding Profile – Staging, Decanting and Continuity of Services
(12,600) 3,370 9,230 - -
Revised Funding Profile – Identity and Access Management
(350) 350 - - -
Revised Funding Profile – Central Sterilising Service (1,310) (10,739) 12,049 - - Revised Funding Profile – Northside Hospital Specification
and Documentation(3,500) 3,500 - - -
Revised Funding Profile – Building Upgrades (50) 50 - - - Revised Funding Profile – Energy Savings/Sustainability (50) 50 - - - Revised Funding Profile – Mechanical Systems Upgrades (100) 100 - - - Revised Funding Profile – Patient/Medical Facilities (200) 200 - - - Revised Funding Profile – Workplace Improvements (150) 150 - - - Revised Funding Profile – Augmentation of Medical
Offices(150) 150 - - -
Revised Funding Profile – Clinical Services Redevelopment (Phase 2)
(932) 732 200 - -
Revised Funding Profile – Tuggeranong Health Centre – Stage 2
(9,018) 2,234 6,489 295 -
Revised Funding Profile – HIP Change Management and Communication Support
(2,000) 2,000 - - -
Revised Funding Profile – National Health Reform (3,488) 3,488 - - - Revised Funding Profile – Integrated Cancer Care Centre –
(Phase 1)(5,409) (65) 5,474 - -
Revised Funding Profile – Enhanced Community Health Centre - Belconnen
(7,936) 5,082 2,854 - -
Revised Funding Profile – Mental Health Young Persons Unit
(630) 575 55 - -
Revised Funding Profile – ACT Health Skills Development Centre
(827) 827 - - -
Revised Funding Profile – Women and Children's Hospital (1,083) (8,117) 9,200 - - Revised Funding Profile – New Gungahlin Health Centre (1,938) 1,938 - - - Revised Funding Profile – Provision for Project Definition
Planning(3,457) 3,457 - - -
Revised Funding Profile – Aboriginal Torres Strait Islander Residential Alcohol & Other Drug Rehabilitation Facility
(3,177) 2,178 999 - -
Revised Funding Profile – An E-Healthy Future (41,050) 4,050 22,000 15,000 - Revised Funding Profile – Digital Mammography (749) 749 - - - Revised Funding Profile – Safety/Security Upgrades (50) 50 - - - Revised Funding Profile – Linear Accelerator Procurement
and Replacement(300) 300 - - -
2012-13 Budget Paper No. 4 74 Health Directorate

Changes to Appropriation cont.Changes to Appropriation - Controlled 2011-12 2012-13 2013-14 2014-15 2015-16Capital Injections Est. Out. Budget Estimate Estimate Estimate $'000 $'000 $'000 $'000 $'000
Revised Funding Profile – Clinical Equipment for Calvary Hospital
(1,045) 1,045 - - -
Revised Funding Profile – Neonatal Intensive Care Unit – Video Streaming Services
(100) 100 - - -
Revised Funding Profile – Provision for Phase 1 CSR 57 (57) - - - Revised Funding Profile – Secure Adult Mental Health Unit
(Forward Design)(430) 430 - - -
Commonwealth Grants – Health and Hospital Funds Projects (Integrated Cancer Centre) NP
- - 1,752 - -
2012-13 Budget 185,646 237,882 143,662 19,237 4,041
2012-13 Budget Paper No. 4 75 Health Directorate

2012-13 Capital Works Program Controlled Estimated Estimated 2012-13 2013-14 2014-15 Physical
Total Expenditure Financing Financing Financing Completion Cost Pre 2012-13 Date
$’000 $’000 $’000 $’000 $’000
New Capital WorksAdult Secure Mental Health Unit
(Finalising Design)2,000 - 2,000 - - Jun 2013
Staging and Decanting – Moving To Our Future
22,300 - 10,800 11,500 - Jun 2014
Health Infrastructure Program – Project Management
19,319 - 10,819 8,500 - Jun 2014
Enhanced Community Centre Backup Power
3,540 - 2,000 1,540 - Jun 2014
Total New Capital Works 47,159 - 25,619 21,540 -
Capital UpgradesBuilding Upgrades 580 - 580Fire/Safety/Security Upgrades 352 - 352Mechanical Systems Upgrades 580 - 580Medical Facilities Upgrades 520 - 520Facilities Improvements to Patient
Accommodation620 - 620
Ambulatory Care Improvements 680 - 680Augmentation of Medical and
Administrative Offices420 - 420
Total Capital Upgrades 3,752 - 3,752
Total New Works 50,911 - 29,371 21,540 -
Works in ProgressEnhancing Canberra Hospital Facilities
(Design)41,000 1,000 12,980 27,020 - Jun 2014
Staging, Decanting and Continuity of Services
19,430 2,000 8,200 9,230 - Jun 2014
Clinical Services Redevelopment(Phase 3)
25,700 4,700 6,679 14,321 - Jun 2014
Integrated Cancer Centre (Phase 2) 15,102 2,191 8,570 4,341 - Sep 2013Central Sterilising Services 17,270 450 4,771 12,049 - Apr 2014Northside Hospital Specification and
Documentation4,000 500 3,500 - - Jun 2013
Building Upgrades (Prior Year Capital Upgrades)
561 511 50
Energy Savings/Sustainability (Prior Year Capital Upgrades)
300 250 50
Safety/Security Upgrades (Prior Year Capital Upgrades)
380 330 50
Mechanical Systems Upgrades (Prior Year Capital Upgrades)
600 500 100
Patient/Medical Facilities (Prior Year Capital Upgrades)
670 470 200
Workplace Improvements (Prior Year Capital Upgrades)
590 440 150
Augmentation of Medical Offices (Prior Year Capital Upgrades)
560 410 150
Clinical Services Redevelopment(Phase 2)2
9,800 8,868 732 200 - Jun 2013
Tuggeranong Health Centre – Stage 2 14,000 55 7,500 6,150 295 May 2014
2012-13 Budget Paper No. 4 76 Health Directorate

2012-13 Capital Works Program cont. Estimated Estimated 2012-13 2013-14 2014-15 Physical
Total Expenditure Financing Financing Financing Completion Cost Pre 2012-13 Date
$’000 $’000 $’000 $’000 $’000
Works in Progress cont.HIP Change Management and
Communication Support4,117 2,117 2,000 - - Jun 2013
National Health Reform1 10,088 4,931 5,157 - - Jun 2013Integrated Cancer Centre (Phase 1) 29,652 7,091 15,335 7,226 - Sep 2013Enhanced Community Health Centre
– Belconnen251,344 12,464 36,026 2,854 - Jun 2013
Mental Health Young Persons Unit 775 145 575 55 - Nov 2013ACT Health Skills Development Centre 1,300 473 827 - - Nov 2012Women and Children's Hospital 111,060 71,607 30,253 9,200 - Aug 2013New Gungahlin Health Centre 18,000 12,529 5,471 - - Aug 2012Refurbishment of Health Centre –
Tuggeranong5,000 1,027 3,634 339 - May 2014
Provision for Project Definition Planning 61,090 46,138 14,952 - - Jun 2013Secure Adult Mental Health Unit –
Forward Design1,200 770 430 - - Jun 2013
Aboriginal & Torres Strait Islander Residential Alcohol & Other Drug Rehabilitation Facility
5,883 744 4,140 999 - Sep 2013
Linear Accelerator Procurement and Replacement
17,700 17,400 300 - - Dec 2012
Total Works in Progress 467,172 200,111 172,782 93,984 295
Total Controlled Capital Works 518,083 200,111 202,153 115,524 295
Notes:1. $5.010 million removed from the National Health Reform project, pending a transfer to recurrent funding.2. This project will be completed by 30 June 2013. 2013-14 funding provides for defects liability period.
Territorial Estimated Estimated 2012-13 2013-14 2014-15 Physical Total Expenditure Financing Financing Financing Completion Cost Pre 2012-13 Date
$’000 $’000 $’000 $’000 $’000
Capital UpgradesWorks Associated with the Installation of
a MRI70 - 70
Security Upgrades 50 - 50Environmental Improvements to Cooling
System200 - 200
Improvements to Patient Safety – Expansion of Reticulated Suction System
50 - 50
Improvements to the Keaney Environmental Cooling System
296 - 296
Installation of Service Column – Cardiac Procedure Room
80 - 80
Total Capital Upgrades 746 - 746
Total New Works 746 - 746
Total Territorial Capital Works 746 - 746
2012-13 Budget Paper No. 4 77 Health Directorate

Health DirectorateOperating Statement
2011-12 2011-12 2012-13 2013-14 2014-15 2015-16Budget Est. Outcome Budget Var Estimate Estimate Estimate
$'000 $'000 $'000 % $'000 $'000 $'000
Income Revenue
896,185 Government Payment for Outputs
893,432 365,860 -59 377,406 391,008 409,307
206,151 User Charges - Non ACT Government
198,151 100,803 -49 102,949 105,315 107,893
885 User Charges - ACT Government
885 546,730 # 583,712 630,286 680,574
278 Interest 278 278 - 278 278 27812,289 Other Revenue 16,289 16,746 3 17,230 17,722 18,183
986 Resources Received Free of Charge
736 758 3 780 792 804
1,116,774 Total Revenue 1,109,771 1,031,175 -7 1,082,355 1,145,401 1,217,039
Gains
1,496 Other Gains 1,496 1,524 2 1,544 1,574 1,604
1,496 Total Gains 1,496 1,524 2 1,544 1,574 1,604
1,118,270 Total Income 1,111,267 1,032,699 -7 1,083,899 1,146,975 1,218,643 Expenses
506,241 Employee Expenses 515,423 553,280 7 588,922 626,603 665,16861,869 Superannuation Expenses 62,387 69,116 11 70,174 71,546 75,728
291,564 Supplies and Services 288,001 301,234 5 315,459 333,634 356,81029,018 Depreciation and
Amortisation29,018 35,882 24 43,615 47,266 47,266
401 Borrowing Costs 401 401 - 401 401 40118,763 Cost of Goods Sold 14,763 15,394 4 16,051 16,434 16,853
229,256 Grants and Purchased Services
230,881 76,920 -67 80,713 84,824 88,564
9,219 Other Expenses 10,614 11,060 4 10,425 11,157 12,081
1,146,331 Total Ordinary Expenses 1,151,488 1,063,287 -8 1,125,760 1,191,865 1,262,871
-28,061 Operating Result -40,221 -30,588 24 -41,861 -44,890 -44,228
-28,061 Total Comprehensive Income
-40,221 -30,588 24 -41,861 -44,890 -44,228
2012-13 Budget Paper No. 4 78 Health Directorate

Health DirectorateBalance Sheet
Budget Est. Outcome Planned Planned Planned Plannedas at 30/6/12 as at 30/6/12 as at 30/6/13 Var as at 30/6/14 as at 30/6/15 as at 30/6/16
$'000 $'000 $'000 % $'000 $'000 $'000 Current Assets
744 Cash and Cash Equivalents
1,560 1,522 -2 1,484 1,446 1,408
53,977 Receivables 46,526 47,572 2 48,814 50,056 51,2986,242 Inventories 7,866 8,066 3 8,266 8,466 8,666
234 Assets Held for Sale 127 127 - 127 127 1272,986 Other Current Assets 2,416 2,516 4 2,616 2,716 2,816
64,183 Total Current Assets 58,495 59,803 2 61,307 62,811 64,315
Non Current Assets
0 Receivables 2,135 2,235 5 2,335 2,435 2,5353,000 Investments 3,000 3,000 - 3,000 3,000 3,000
645,350 Property, Plant and Equipment
740,422 785,281 6 1,104,307 1,161,459 1,139,051
63,005 Intangibles 17,688 33,872 91 45,980 50,995 41,010294,979 Capital Works in Progress 148,772 301,294 103 79,936 0 0
1,006,334 Total Non Current Assets 912,017 1,125,682 23 1,235,558 1,217,889 1,185,596
1,070,517 TOTAL ASSETS 970,512 1,185,485 22 1,296,865 1,280,700 1,249,911
Current Liabilities
40,223 Payables 56,397 56,597 .. 56,797 56,997 57,1971,471 Finance Leases 2,999 3,099 3 3,199 3,299 3,399
138,685 Employee Benefits 153,765 159,114 3 166,525 173,845 181,07517,066 Other Liabilities 5,262 5,462 4 5,662 5,862 6,062
197,445 Total Current Liabilities 218,423 224,272 3 232,183 240,003 247,733
Non Current Liabilities
4,401 Finance Leases 2,999 3,099 3 3,199 3,299 3,39915,833 Employee Benefits 16,662 18,392 10 19,960 21,528 23,096
0 Other 1,503 1,503 - 1,503 1,503 1,503
20,234 Total Non Current Liabilities 21,164 22,994 9 24,662 26,330 27,998
217,679 TOTAL LIABILITIES 239,587 247,266 3 256,845 266,333 275,731
852,838 NET ASSETS 730,925 938,219 28 1,040,020 1,014,367 974,180 REPRESENTED BY FUNDS EMPLOYED
717,444 Accumulated Funds 585,924 793,218 35 895,019 869,366 829,179135,394 Reserves 145,001 145,001 - 145,001 145,001 145,001
852,838 TOTAL FUNDS EMPLOYED 730,925 938,219 28 1,040,020 1,014,367 974,180
2012-13 Budget Paper No. 4 79 Health Directorate

Health DirectorateStatement of Changes in Equity
Budget Est. Outcome Planned Planned Planned Plannedas at 30/6/12 as at 30/6/12 as at 30/6/13 Var as at 30/6/14 as at 30/6/15 as at 30/6/16
$'000 $'000 $'000 % $'000 $'000 $'000 Opening Equity
462,766 Opening Accumulated Funds 440,499 585,924 33 793,218 895,019 869,366135,394 Opening Asset Revaluation
Reserve145,001 145,001 - 145,001 145,001 145,001
598,160 Balance at the Start of the
Reporting Period585,500 730,925 25 938,219 1,040,020 1,014,367
Comprehensive Income
-28,061 Operating Result for the Period
-40,221 -30,588 24 -41,861 -44,890 -44,228
-28,061 Total Comprehensive
Income-40,221 -30,588 24 -41,861 -44,890 -44,228
0 Total Movement in Reserves 0 0 - 0 0 0
Transactions Involving Owners Affecting Accumulated Funds
282,739 Capital Injections 185,646 237,882 28 143,662 19,237 4,041
282,739 Total Transactions Involving Owners Affecting Accumulated Funds
185,646 237,882 28 143,662 19,237 4,041
Closing Equity
717,444 Closing Accumulated Funds 585,924 793,218 35 895,019 869,366 829,179135,394 Closing Asset Revaluation
Reserve145,001 145,001 - 145,001 145,001 145,001
852,838 Balance at the End of the
Reporting Period730,925 938,219 28 1,040,020 1,014,367 974,180
2012-13 Budget Paper No. 4 80 Health Directorate

Health DirectorateCash Flow Statement
2011-12 2011-12 2012-13 2013-14 2014-15 2015-16Budget Est. Outcome Budget Var Estimate Estimate Estimate
$'000 $'000 $'000 % $'000 $'000 $'000
CASH FLOWS FROM OPERATING ACTIVITIES
Receipts896,185 Cash from Government
for Outputs893,432 365,860 -59 377,406 391,008 409,307
206,977 User Charges 198,977 647,487 225 686,419 735,359 788,225278 Interest Received 278 278 - 278 278 278
63,982 Other Receipts 102,785 104,670 2 106,174 106,696 107,1871,167,422 Operating Receipts 1,195,472 1,118,295 -6 1,170,277 1,233,341 1,304,997
Payments497,814 Related to Employees 496,333 551,238 11 579,979 617,751 656,343
61,869 Related to Superannuation 62,387 69,116 11 70,175 71,547 75,729291,420 Related to Supplies and
Services288,047 296,432 3 315,263 339,963 365,168
401 Borrowing Costs 401 401 - 401 401 401229,256 Grants and Purchased
Services230,881 76,920 -67 80,713 78,324 80,104
77,953 Other 108,714 112,660 4 114,054 115,132 116,4571,158,713 Operating Payments 1,186,763 1,106,767 -7 1,160,585 1,223,118 1,294,202
8,709 NET CASH INFLOW/ (OUTFLOW) FROM OPERATING ACTIVITIES
8,709 11,528 32 9,692 10,223 10,795
CASH FLOWS FROM INVESTING ACTIVITIES
Payments290,034 Purchase of Property, Plant
and Equipment and Capital Works
221,941 247,996 12 151,940 28,046 13,422
290,034 Investing Payments 221,941 247,996 12 151,940 28,046 13,422
-290,034 NET CASH INFLOW/ (OUTFLOW) FROM INVESTING ACTIVITIES
-221,941 -247,996 -12 -151,940 -28,046 -13,422
CASH FLOWS FROM FINANCING ACTIVITIES
Receipts282,739 Capital Injections from
Government185,646 237,882 28 143,662 19,237 4,041
282,739 Financing Receipts 185,646 237,882 28 143,662 19,237 4,041
Payments1,452 Repayment of Finance Leases 1,452 1,452 - 1,452 1,452 1,4521,452 Financing Payments 1,452 1,452 - 1,452 1,452 1,452
281,287 NET CASH INFLOW/ (OUTFLOW) FROM FINANCING ACTIVITIES
184,194 236,430 28 142,210 17,785 2,589
-38 NET INCREASE / (DECREASE) IN CASH HELD
-29,038 -38 100 -38 -38 -38
782 CASH AT THE BEGINNING OF REPORTING PERIOD
30,598 1,560 -95 1,522 1,484 1,446
744 CASH AT THE END OF REPORTING PERIOD
1,560 1,522 -2 1,484 1,446 1,408
2012-13 Budget Paper No. 4 81 Health Directorate

Notes to the Budget StatementsSignificant variations are as follows:
Operating Statement
government payment for outputs:
– the decrease of $2.753 million in the 2011-12 estimated outcome from the original budget is mainly due to roll-overs into 2012-13 ($11.799 million), partially offset by revised wage parameters ($4.743 million) and increased Commonwealth funding ($4.303 million); and
– the decrease of $527.572 million in the 2012-13 Budget from the 2011-12 estimated outcome is mainly due to the transfer of funding to the ACT Local Hospital Network Directorate (ACT LHN) associated with the National Health Reform.
user charges – non ACT Government:
– the decrease of $8 million in the 2011-12 estimated outcome from the original budget is mainly due to adjustments in patient, Department of Veteran Affairs (DVA) and facility fees revenue, as well as a reduction in the sale of medical and surgical supplies to private hospitals; and
– the decrease of $97.348 million in the 2012-13 Budget from the 2011-12 estimated outcome is mainly due to the removal of Patient Cross Border revenue, which will now be received by the ACT LHN.
user charges – ACT Government: the increase of $545.845 million in the 2012-13 Budget from the 2011-12 estimated outcome is mainly due to the changed funding arrangements following the implementation of the National Health Reform. This revenue predominantly relates to the receipt of funding from the ACT LHN for public hospital services at the Canberra Hospital.
other revenue: the increase of $4 million in the 2011-12 estimated outcome from the original budget is mainly due to grants received from Health Workforce Australia.
employee expenses:
– the increase of $9.182 million in the 2011-12 estimated outcome from the original budget is mainly due to increased Commonwealth funding ($1 million), revised wage parameters ($6.890 million) and the impact of the discount rate on the long service leave liability ($7.738 million), partially offset by rollovers ($6.5 million); and
– the increase of $37.857 million in the 2012-13 Budget from the 2011-12 estimated outcome is mainly due to revised wage parameters ($18.9 million), growth and new initiatives ($17.7 million) and the full year effect of prior year initiatives ($3.9 million) partially offset by the savings initiatives ($2.5 million).
superannuation expenses: the increase of $6.729 million in the 2012-13 Budget from the 2011-12 estimated outcome is mainly due to revised notional superannuation contributions, revised wage parameters and increased employee numbers from new initiatives.
2012-13 Budget Paper No. 4 82 Health Directorate

supplies and services:
– the decrease of $3.563 million in the 2011-12 estimated outcome from the original budget is due to the deferral of Commonwealth projects ($2.9 million) and the reallocation of funding to grants and purchased services and wages and salaries ($3.2 million), partially offset by increased Commonwealth funding ($2.5 million); and
– the increase of $13.233 million in the 2012-13 Budget from the 2011-12 estimated outcome is mainly due to indexation ($7 million), growth and new initiatives ($5.7 million) and the full year effect of prior year initiatives ($1.5 million), partially offset by the savings initiatives ($1 million).
depreciation and amortisation: the increase of $6.864 million in the 2012-13 Budget from the 2011-12 estimated outcome is mainly due to the completion of the HIP projects, including elements of the information technology project, ‘An E-Healthy Future’.
cost of goods sold: the decrease of $4 million in the 2011-12 estimated outcome from the original budget is mainly due to a decreased volume in sale of medical and surgical supplies to private hospitals.
grants and purchased services: the decrease of $153.961 million in the 2012-13 Budget from the 2011-12 estimated outcome is mainly due to the transfer of most of the Calvary Public Hospital and all of QEII funding to the ACT LHN, as well as a reduction in home and community care grants following the transition of responsibility for aged care services to the Commonwealth.
Balance Sheet
current and non current receivables: the decrease of $5.316 million in the 2011-12 estimated outcome from the original budget is due to the 2010-11 audited outcome flow-on effect.
property, plant and equipment:
– the increase of $95.072 million in the 2011-12 estimated outcome from the original budget is mainly due to a reclassification of assets from intangibles and completion of projects under the Health Infrastructure Program (HIP); and
– the increase of $44.859 million in the 2012-13 Budget from the 2011-12 estimated outcome is mainly due to expected completion of HIP projects, net of depreciation.
intangibles:
– the decrease of $45.317 million in the 2011-12 estimated outcome from the original budget is mainly due to delays in the ‘An E-Healthy Future’ capital program and the reclassification of some assets as plant and equipment; and
– the increase of $16.184 million in 2012-13 Budget from the 2011-12 estimated outcome is due to the expected completion of projects under the ‘An E-Healthy Future’ capital program.
2012-13 Budget Paper No. 4 83 Health Directorate

capital works in progress: the decrease of $146.207 million in the 2011-12 estimated outcome from the original budget and the increase of $152.522 million in the 2012-13 Budget from the 2011-12 estimated outcome is mainly due to the timing of the HIP projects currently underway or commencing in 2012-13.
current payables: the increase of $16.174 million in the 2011-12 estimated outcome from the original budget is mainly due to the timing of invoices received by the Health Directorate.
current employee benefits: the increase of $15.080 million in the 2011-12 estimated outcome from the original budget is mainly due to the impact of the discount rate on the long service leave liability.
other current liabilities: the decrease of $11.804 million in the 2011-12 estimated outcome from the original budget is due to the flow-on effect of the 2010-11 audited outcome.
Statement of Changes in Equity
Variations in the statement are explained in the notes above.
Cash Flow Statement
Variations in the statement are explained in the notes above.
2012-13 Budget Paper No. 4 84 Health Directorate

Health DirectorateStatement of Income and Expenses on Behalf of the Territory
2011-12 2011-12 2012-13 2013-14 2014-15 2015-16Budget Est. Outcome Budget Var Estimate Estimate Estimate
$'000 $'000 $'000 % $'000 $'000 $'000
Income Revenue
727 Payment for Expenses on behalf of Territory
986 746 -24 765 784 803
676 Taxes, Fees and Fines 676 693 3 710 728 728
1,403 Total Revenue 1,662 1,439 -13 1,475 1,512 1,531
1,403 Total Income 1,662 1,439 -13 1,475 1,512 1,531 Expenses
727 Grants and Purchased Services
727 746 3 765 784 803
676 Transfer Expenses 676 693 3 710 728 728
1,403 Total Ordinary Expenses 1,403 1,439 3 1,475 1,512 1,531
0 Operating Result 259 0 -100 0 0 0
0 Total Comprehensive Income
259 0 -100 0 0 0
2012-13 Budget Paper No. 4 85 Health Directorate

Health DirectorateStatement of Assets and Liabilities on Behalf of the Territory
Budget Est. Outcome Planned Planned Planned Plannedas at 30/6/12 as at 30/6/12 as at 30/6/13 Var as at 30/6/14 as at 30/6/15 as at 30/6/16
$'000 $'000 $'000 % $'000 $'000 $'000 Current Assets
295 Cash and Cash Equivalents
294 294 - 294 294 294
5 Receivables 6 6 - 6 6 6
300 Total Current Assets 300 300 - 300 300 300
300 TOTAL ASSETS 300 300 - 300 300 300 Current Liabilities
300 Payables 300 300 - 300 300 300
300 Total Current Liabilities 300 300 - 300 300 300
300 TOTAL LIABILITIES 300 300 - 300 300 300
0 NET ASSETS 0 0 - 0 0 0 REPRESENTED BY FUNDS EMPLOYED
0 TOTAL FUNDS EMPLOYED 0 0 - 0 0 0
2012-13 Budget Paper No. 4 86 Health Directorate

Health DirectorateStatement of Changes in Equity on Behalf of the Territory
Budget Est. Outcome Planned Planned Planned Plannedas at 30/6/12 as at 30/6/12 as at 30/6/13 Var as at 30/6/14 as at 30/6/15 as at 30/6/16
$'000 $'000 $'000 % $'000 $'000 $'000 Opening Equity
0 Opening Accumulated Funds -259 0 100 0 0 0
0 Balance at the Start of the Reporting Period
-259 0 100 0 0 0
Comprehensive Income
0 Operating Result for the Period
259 0 -100 0 0 0
0 Total Comprehensive
Income259 0 -100 0 0 0
0 Total Movement in Reserves 0 0 - 0 0 0
0 Balance at the End of the Reporting Period
0 0 - 0 0 0
2012-13 Budget Paper No. 4 87 Health Directorate

Health DirectorateStatement of Cash Flows on Behalf of the Territory
2011-12 2011-12 2012-13 2013-14 2014-15 2015-16Budget Est. Outcome Budget Var Estimate Estimate Estimate
$'000 $'000 $'000 % $'000 $'000 $'000 CASH FLOWS FROM OPERATING ACTIVITIES Receipts
727 Cash from Government for EBT
986 746 -24 765 784 803
676 Taxes, Fees and Fines 676 693 3 710 728 72873 Other Receipts 73 75 3 77 79 81
1,476 Operating Receipts 1,735 1,514 -13 1,552 1,591 1,612 Payments
727 Grants and Purchased Services
727 746 3 765 784 803
73 Other 73 75 3 77 79 81676 Territory Receipts to
Government676 693 3 710 728 728
1,476 Operating Payments 1,476 1,514 3 1,552 1,591 1,612
0 NET CASH INFLOW/ (OUTFLOW) FROM OPERATING ACTIVITIES
259 0 -100 0 0 0
0 NET INCREASE / (DECREASE)
IN CASH HELD259 0 -100 0 0 0
295 CASH AT THE BEGINNING OF
REPORTING PERIOD35 294 740 294 294 294
295 CASH AT THE END OF REPORTING PERIOD
294 294 - 294 294 294
Note to the Budget StatementsThere are no material variations to the Statement of Income and Expenses on Behalf of the Territory or Statement of Assets and Liabilities on Behalf of the Territory.
2012-13 Budget Paper No. 4 88 Health Directorate