
Health Consultation Bruce Mansfield Power Plant ... · 4/22/2011 · better evaluate potential...
29
Health Consultation Bruce Mansfield Power Plant: Evaluation of Air Monitoring Data (2008-2009) Borough of Shippingport, Beaver County, Pennsylvania April 22, 2011 Prepared by: Pennsylvania Department of Health
Transcript of Health Consultation Bruce Mansfield Power Plant ... · 4/22/2011 · better evaluate potential...
Health Consultation
Bruce Mansfield Power Plant: Evaluation of Air Monitoring Data (2008-2009)
Borough of Shippingport, Beaver County, Pennsylvania
April 22, 2011
1
Prepared by: Pennsylvania Department of Health
2
Table of Contents
Summary ............................................................................................................................................. 3 Introduction .................................................................................................................................... 3
Health Consultation: Disclaimer ......................................................................................................... 4 Conclusions ......................................................................................................................................... 5 Background and Statement of Issues .................................................................................................. 7
Public Health Involvement ............................................................................................................. 7 Air Monitoring Events ........................................................................................................................ 8 Exposure Pathway Analysis ............................................................................................................... 8 ATSDR Comparison Values ............................................................................................................... 9
A Note on Public Health Conclusions Terminology .................................................................... 10 Results ............................................................................................................................................... 11 Discussion ......................................................................................................................................... 12
Public Health Evaluation of Air Monitoring Data Results ........................................................... 13 Arsenic ................................................................................................................................... 13 Chromium .............................................................................................................................. 13 Cadmium ................................................................................................................................ 14 Manganese ............................................................................................................................. 14
PADEP NAAQS Air Monitoring Stations ................................................................................... 14 Child Health Considerations ............................................................................................................. 15 Conclusions ....................................................................................................................................... 16 Recommendations ............................................................................................................................. 17 Public Health Action Plan ................................................................................................................ 17 References ......................................................................................................................................... 18 Authors, Technical Advisors ............................................................................................................ 20 Appendix 1: Figures and Tables ....................................................................................................... 21 Appendix 2: Contaminant Evaluation .............................................................................................. 25
3
Summary
Introduction At the request of concerned community members and the Pennsylvania Department of Environmental Protection (PADEP), the Pennsylvania Department of Health (PADOH) prepared this Health Consultation (HC) document for the Bruce Mansfield Power Plant in Shippingport, Beaver County, Pennsylvania (‘the site’). PADOH primary goal is to evaluate whether a community is being exposed to levels of contaminants that may harm their health, as well as to ensure that the community has the best information possible to safeguard their health. In response to two stack rain fallout events at the site that occurred in 2006 and 2007, PADOH and the Agency for Toxic Substances and Disease Registry (ATSDR) produced a health consultation (HC) document in 2009 that evaluated and summarized various sampling results in the surrounding communities including, dust fall, wipe, soot, soil, surface water, and air samples. PADOH and ATSDR could not determine if a public health threat existed for the community because there was insufficient sampling data. Based on recommendations in the previous HC, PADOH and ATSDR collaborated with PADEP to develop a comprehensive ambient air monitoring plan for the site to better evaluate potential community-level exposures. Between 2008 and 2009, PADEP collected additional ambient air samples near the site for particulates and metals. The main focus of this HC is to evaluate the air monitoring data from the 2008-2009 air monitoring event to determine whether residents near the site are being exposed to contaminants at levels that could harm their health. It is important to note that the data and conclusions from the air monitoring event discussed in this HC apply only to on-going air quality near the site and cannot delineate contaminant or exposure levels from the past operational malfunctions or past sampling data gaps, as discussed in the 2009 HC.
4
Health Consultation: Disclaimer The Pennsylvania Department of Health (PADOH) Health Assessment Program (HAP) collaborates with the Agency for Toxic Substances and Disease Registry (ATSDR), the lead federal public health agency, to prepare health consultation documents which determine if exposure to contaminants can harm people’s health as well as prevent and reduce exposures and illnesses. A health consultation is a written response to a specific request for information about health risks related to a specific site, a chemical release, or the presence of hazardous material, and considers the levels of hazardous substances at a site, whether people might be exposed to contaminants, by what pathways, and what potential harm the substances might cause to them. In order to prevent or mitigate exposures, a consultation may lead to specific actions and recommendations, such as restricting use of or replacing water supplies; intensifying environmental sampling; restricting site access; or removing the contaminated material. In addition, consultations may recommend additional public health actions, such as conducting health surveillance activities to evaluate exposure or trends in adverse health outcomes; conducting biological indicators of exposure studies to assess exposure; conducting health studies; characterizing demographics; recommending changes/additions to related Commonwealth of Pennsylvania policies/regulations, improving quality of life; and/or providing health education for health care providers and community members. ATSDR provides technical assistance and funding to PADOH to help identify and evaluate environmental health threats to communities using the best science, taking responsive public health actions, and providing trusted health information. While this health consultation was supported by funds from a cooperative agreement with the ATSDR, it has not been reviewed and cleared by ATSDR. More information about ATSDR is available online at www.atsdr.cdc.gov The conclusions and recommendations presented in this health consultation document are based on an analysis of the environmental sampling data and information made available to the PADOH within a limited time frame. The availability of additional sampling data, new information and/or changes in site conditions could affect the conclusions and recommendations presented in this document. PADOH will consider reviewing additional future data related to the site, if made available and deemed appropriate.
Conclusions Upon reviewing the available air monitoring data, PADOH conclude the following for the Bruce Mansfield site:
Conclusion 1 Basis for Conclusion Next Steps
Acute, or short-term, exposure to the levels of metals detected during the 2008-2009 air monitoring event is not expected to harm people’s health. PADOH evaluated the 24-hour maximum values against available acute ATSDR CVs, for each monitoring location, to determine if acute exposure to these levels could harm people’s health. The maximum 24-hour levels were below available CVs, and well below levels documented in the literature to cause adverse health effects. ATSDR does not currently have an acute CV for inhalation exposure to arsenic, zinc, beryllium, and manganese. However, PADOH would not anticipate the public would be exposed to maximum levels on an on-going basis. PADOH will review additional air monitoring data and issue a public health conclusion if requested. PADOH will also provide health education to area residents, as needed.
Conclusion 2 Basis for conclusion Next Steps Conclusion 3 Basis for conclusion
Chronic, or long-term, exposure to the levels of metals detected is not expected to harm people’s health. The average 24-hour levels of metals detected during the year-long air monitoring event were below available comparison values (CV), except for arsenic, cadmium, chromium, and manganese. The average levels of arsenic, cadmium and chromium exceeded the ATSDR Cancer Risk Evaluation Guide (CREG) CV for all the monitoring locations, including the background monitoring location; however, the observed concentrations were well below levels documented in the literature that have resulted in adverse health effects. In addition, the levels detected are similar to typical background levels observed in urban and rural areas throughout the United States. The average 24-hour concentrations of manganese were present at levels exceeding the EPA reference concentration (Rfc) level at the monitoring locations closest to the site (Shippingport and Montgomery Locks and Dam), but also were below the lowest-observed-adverse-effects-level (LOAEL) documented in the literature. PADOH will review additional air monitoring data and issue a public health conclusion if requested. In addition, PADOH will continue working with the community to answer questions and address ongoing concerns
Based on a review of the limited data on particulate matter, PADOH conclude that exposure to the levels of total suspended particulates (TSP) during the air monitoring event are not expected to harm people’s health. The levels of TSP observed during the air monitoring event are below the old EPA TSP standard for both acute and chronic exposure levels and the levels are
5
Next Steps
similar to typical particulate levels for the area. Since the sampling only measured TSP, PADOH cannot make conclusions on potential concentrations or exposure levels of particulate matter less than or equal to 2.5 microns in diameter (PM2.5) and particulate matter less than or equal to 10 microns in diameter (PM10). Of note that the lower Beaver Valley is currently in ‘non attainment’ status for PM2.5. Due to sampling equipment limitations PM2.5 and PM10 were not sampled during the site-specific air monitoring event. Therefore, PADOH cannot reach a conclusion on any potential site-specific levels. PM2.5 non-attainment status likely represents a regional issue for particulate matter that could potentially affect people’s health, specifically the health of sensitive individuals, such as children, the elderly and asthmatics. PADOH will review additional air monitoring data if requested and issue a public health conclusion.
For More Information
If you have concerns about your health, you should contact your health care provider. For questions or concerns about the Bruce Mansfield site, please contact the Pennsylvania Department of Health, Division of Environmental Health Epidemiology at (717) 346-3285.
6
7
Background and Statement of Issues The Bruce Mansfield Power Plant, owned by the First Energy Corporation, encompasses 473 acres in size and is located in Shippingport, Beaver County, Pennsylvania. The site is bordered by the Ohio River to the west to northwest and residential areas and Shippingport Community Park towards the east to northeast. Raccoon Township is located east of the site. The site contains three coal-fired generators; the first went on-line in 1976. The second and third units came on-line in 1977 and 1980. In addition, a joint project between First Energy and National Gypsum Company was developed to convert calcium sulfate from the plant’s scrubber by-products into dry wall. [1] In July 2006 and June 2007, the Bruce Mansfield Power Plant experienced two ‘black stack rain’ fallouts events at the site that resulted in a release of black soot that fell into in the adjacent community. The ‘black stack rain’ events were later determined to be the result of a buildup of deposits on the mist eliminators in the air scrubbing system which caused them to malfunction, allowing additional moisture mist with scrubber material to be released in the form of stack rain. The first black stack rain event occurred on July 22, 2006, when a black oily substance rained over Shippingport Borough and extended 2 miles into neighboring Raccoon Township, affecting nearly 300 residents. A second stack rain event occurred on June 10, 2007, with 25 property owners in Shippingport and Raccoon Township reporting this incident. [3] The adjacent community was concerned that exposure to the released material could potentially affect their health. The distance from the point of release to the nearest home was approximately 1200 feet. First Energy reportedly responded to the stack rain incidents by cleaning up affected residents’ homes and businesses. Contractors cut grass and disposed of clippings, mowed crop and hay fields, mulched the harvest, and power-washed houses, driveways, buildings and vehicles. The Shippingport Borough Community Park was also cleaned and re-opened by the Borough. After the fallout events, PADEP and First Energy collected a variety of samples including, dustfall, wipe, soot, soil, and air samples. [1]
Public Health Involvement In response to the stack fallout events and at the request of PADEP and concerned community members, PADOH and ATSDR, prepared and published a health consultation (HC) document in 2009. The HC evaluated and summarized various sampling results in the surrounding communities including dustfall, wipe and soot, soil, surface water, stack, historical fish, and limited air samples. The objective of the HC was to determine whether exposures to the site contaminants were at levels that would harm people’s health. Based on the available data evaluated, ATSDR and PADOH could not determine if a public health threat existed for the community because the type of data needed to make a public health determination was insufficient and several data gaps existed. Thus, PADOH and ATSDR concluded that exposures to the detected contaminants posed an indeterminate public health hazard to residents in the surrounding communities. [1] PADOH and ATSDR recommended in the HC that additional air monitoring for metals, particulate matter and other pollutants under the National Ambient Air Quality Standard (NAAQS) be collected to evaluate the potential community exposure levels. PADOH and ATSDR recommended PADEP install several air monitoring stations in proximity to the site, including downwind, in nearby residential areas, and in background upwind locations. In July 2008, PADOH and ATSDR discussed and assisted PADEP in the development of a comprehensive community-based air sampling plan for the site. Based on these discussions, several monitoring locations were selected, to sample metals and particulate matter in 2008 and 2009. This HC evaluates the ambient air monitoring data to determine if
8
on-going community level exposures could potentially harm people’s health. The data and conclusions from the air monitoring event discussed in this HC apply only to on-going air quality and cannot delineate contaminant or exposure levels from the past operational malfunctions or past sampling data gaps, as discussed in the previous HC for the site.
Air Monitoring Events In order to evaluate air contaminants and potential community-level exposure, PADOH and ATSDR consulted with PADEP on the location of the air monitors and the sampling parameters. PADOH, ATSDR and PADEP agreed that air monitoring would occur from June 2008 through August 2009, provided that no additional ‘operational upsets’ occurred at the site. In addition, monitors would be placed in several locations near the site, including downwind and a background upwind location. [2] PADEP collected high-volume air samples (see figure 1 in Appendix 1 for air monitoring locations) at the following five locations:
1. Shippingport Borough Building- south and closest to the site (2000 feet) 2. Farm off Route 168 – approximately 2 miles west to southwest of the site 3. Montgomery Locks and Dam (L&D) – 1 mile east to northeast of the site 4. Raccoon Township Building – 2 miles south of the site 5. Ohioville Borough Building (background sample) – 5 miles northwest of the site
Ambient air samples were collected over a 24-hour time frame, with collection occurring every sixth day. Due to sampling and equipment restraints, the air samples were only analyzed for total suspended particulates (TSP) and not for particulate matter less than or equal to 2.5 microns in diameter (PM2.5) and/or particulate matter less than or equal to 10 microns in diameter (PM10). The TSP was further analyzed to determine concentrations of the following metals: arsenic, beryllium, cadmium, chromium, lead, manganese, nickel and zinc. [2] The prevailing wind in the area is from the northwest. Therefore, the Raccoon Township and Shippingport Borough monitors would be down wind of the site. The Ohioville monitoring location is upwind of the site and served as a background location for comparison. During the air monitoring event, unforeseen sampling issues occurred, including weather interference and access to electrical power, which caused sampling at the Farm monitor to be discontinued in December 2008. At the time PADOH and ATSDR did not believe that abbreviated sampling at this one monitoring location would affect the overall monitoring program or the ability to draw conclusions from the monitoring data.
Exposure Pathway Analysis
An exposure pathway is how a person comes in contact with contaminants originating from a site. A completed pathway requires that all five of the following elements be present: 1) a source of contamination, 2) an environmental medium that transports contaminants, 3) a point of exposure, 4) a route of human exposure, and 5) a receptor population. PADOH and ATSDR consider the air pathway to be a completed pathway, as described in the table below. The presence of a completed exposure pathway does not, however, necessarily mean that adverse health effects will occur or have occurred in the past as a result of such exposure. [3]
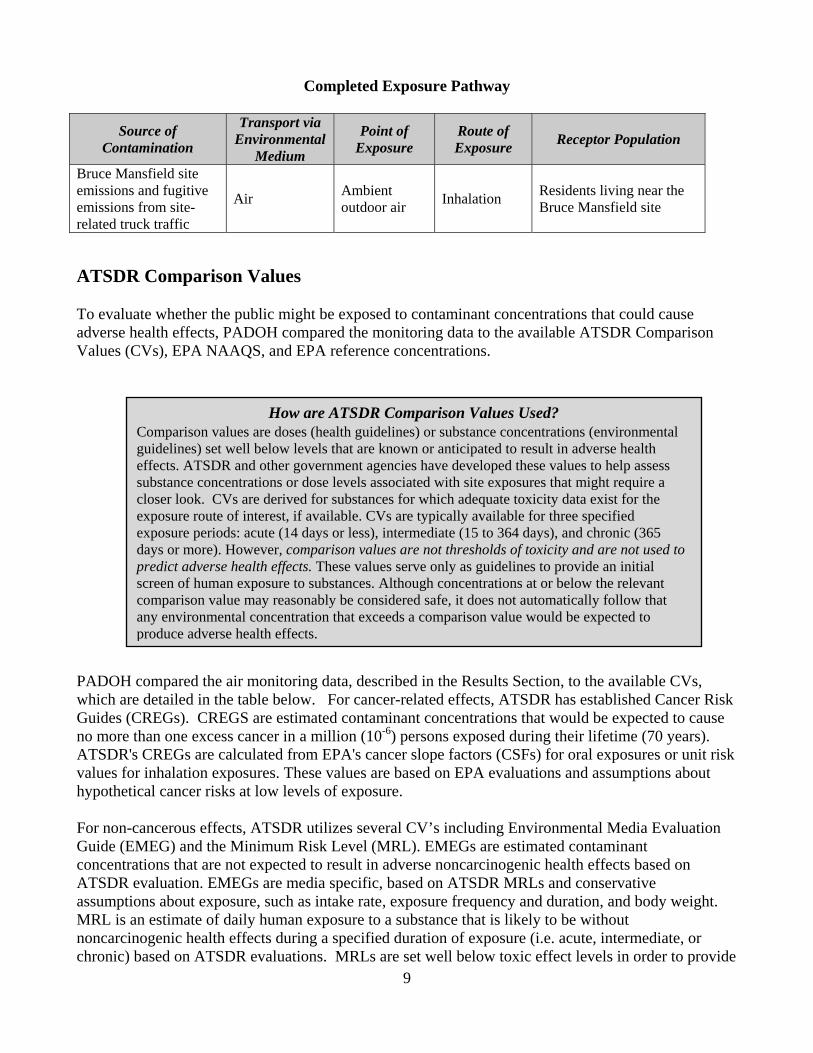
Completed Exposure Pathway
Source of
Contamination Transport via
Environmental Medium
Point of Exposure
Route of Exposure Receptor Population
Bruce Mansfield site emissions and fugitive emissions from site-related truck traffic
Air Ambient outdoor air Inhalation Residents living near the
Bruce Mansfield site
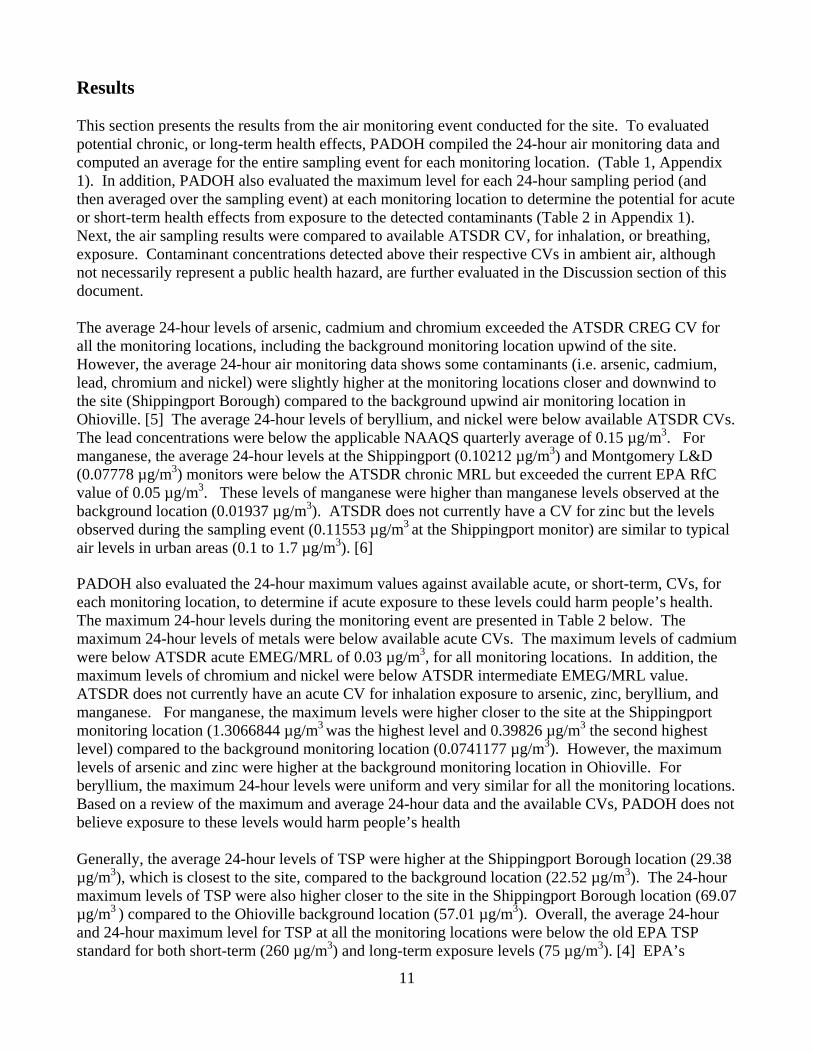
ATSDR Comparison Values To evaluate whether the public might be exposed to contaminant concentrations that could cause adverse health effects, PADOH compared the monitoring data to the available ATSDR Comparison Values (CVs), EPA NAAQS, and EPA reference concentrations. How are ATSDR Comparison Values Used?
Comparison values are doses (health guidelines) or substance concentrations (environmental guidelines) set well below levels that are known or anticipated to result in adverse health effects. ATSDR and other government agencies have developed these values to help assess substance concentrations or dose levels associated with site exposures that might require a closer look. CVs are derived for substances for which adequate toxicity data exist for the exposure route of interest, if available. CVs are typically available for three specified exposure periods: acute (14 days or less), intermediate (15 to 364 days), and chronic (365 days or more). However, comparison values are not thresholds of toxicity and are not used to predict adverse health effects. These values serve only as guidelines to provide an initial screen of human exposure to substances. Although concentrations at or below the relevant comparison value may reasonably be considered safe, it does not automatically follow that any environmental concentration that exceeds a comparison value would be expected to produce adverse health effects.
PADOH compared the air monitoring data, described in the Results Section, to the available CVs, which are detailed in the table below. For cancer-related effects, ATSDR has established Cancer Risk Guides (CREGs). CREGS are estimated contaminant concentrations that would be expected to cause no more than one excess cancer in a million (10-6) persons exposed during their lifetime (70 years). ATSDR's CREGs are calculated from EPA's cancer slope factors (CSFs) for oral exposures or unit risk values for inhalation exposures. These values are based on EPA evaluations and assumptions about hypothetical cancer risks at low levels of exposure. For non-cancerous effects, ATSDR utilizes several CV’s including Environmental Media Evaluation Guide (EMEG) and the Minimum Risk Level (MRL). EMEGs are estimated contaminant concentrations that are not expected to result in adverse noncarcinogenic health effects based on ATSDR evaluation. EMEGs are media specific, based on ATSDR MRLs and conservative assumptions about exposure, such as intake rate, exposure frequency and duration, and body weight. MRL is an estimate of daily human exposure to a substance that is likely to be without noncarcinogenic health effects during a specified duration of exposure (i.e. acute, intermediate, or chronic) based on ATSDR evaluations. MRLs are set well below toxic effect levels in order to provide
9

10
an added measure of safety. In addition, EPA has established a RfC value, which is the concentration of a chemical in air at which levels at or below this concentration are very unlikely to have adverse non-carcinogenic health effects if breathed continuously over a lifetime. PADOH also compared the contaminant results against the available highest No Observed Adverse Effect Level (NOAEL) and Lowest Observed Adverse Effect Level (LOAEL), if available. The LOAEL represents the lowest dose level at which an adverse or toxic effect has been observed in either human epidemiologic or experimental animal studies. The NOAEL corresponds to the highest dose level at which no adverse or toxic effect has been observed, based on available human epidemiologic or experimental animal studies [3]
NAAQS – Particulate Matter EPA regulates particulate matter under the NAAQS. Since particulate matter can originate from a variety of mobile and stationary sources (diesel trucks, woodstoves, power plants, etc.), their chemical and physical compositions vary widely. Particulate matter can be directly emitted or can be formed in the atmosphere when gaseous pollutants such as SO2 and NOx react to form fine particles. Particles in the PM10 classification pose a health concern because they can be inhaled and accumulate in the respiratory system. Whereas PM2.5 are referred to as "fine" particles and are believed to pose the largest health risks due to their small size and ability to lodge deeply into the lungs. Health studies have shown a significant association between exposure to fine particles and premature mortality, aggravation of respiratory and cardiovascular disease, lung disease, decreased lung function, asthma attacks, and certain cardiovascular problems such as heart attacks and cardiac arrhythmia. Individuals particularly sensitive to fine particle exposure include older adults, people with heart and lung disease, and children. [8] Over the years, EPA has emphasized the importance and effects of smaller particles on human health by revising particulate matter pollution standards to apply to smaller and smaller particles, first PM10 in 1987, then PM2.5 in 1997. [7] The old long-term TSP EPA standard was an annual geometric mean not to exceed 75 µg/m3 and a short-term standard of 260 µg/m3. EPA’s NAAQS currently regulates PM10 and PM2.5, and therefore, the former EPA standards for TSP are no longer regulated or enforceable. [8] Since ATSDR does not have CVs for particulate matter, PADOH and ATSDR utilized EPA’s NAAQS, as presented in Tables 1 and 2 of Appendix 1. Until 1987 the primary particulate matter standards under NAAQS were for total suspended particulates (TSP), independent of particle size or chemical composition. TSP generally consists of particles whose average aerodynamic diameter is approximately 40 microns. SP was used historically as the basis for particulate matter under NAAQS, however studies have shown that these larger particles do not penetrate into the lungs and are less likely to affect people’s health.
A Note on Public Health Conclusions Terminology In the previous HC, produced by ATSDR and PADOH, the site was designated as an “indeterminate public health hazard”. Since the generation of that HC, ATSDR has changed the public health conclusions terminology (or hazard category) used in health assessment documents and issued a new guidance in order to provide more clarity to the community on potential adverse health effects; however, the process that PADOH uses for evaluating environmental sampling data, community exposure levels, and potential adverse health effects has not changed under the new guidance. Under the new hazard category language, the conclusion for this HC is that exposure at the contaminant levels evaluated is “not expected to harm people’s health”. Under the old hazard category language the conclusion for this HC would have been “no apparent health hazard”.
11
Results This section presents the results from the air monitoring event conducted for the site. To evaluated potential chronic, or long-term health effects, PADOH compiled the 24-hour air monitoring data and computed an average for the entire sampling event for each monitoring location. (Table 1, Appendix 1). In addition, PADOH also evaluated the maximum level for each 24-hour sampling period (and then averaged over the sampling event) at each monitoring location to determine the potential for acute or short-term health effects from exposure to the detected contaminants (Table 2 in Appendix 1). Next, the air sampling results were compared to available ATSDR CV, for inhalation, or breathing, exposure. Contaminant concentrations detected above their respective CVs in ambient air, although not necessarily represent a public health hazard, are further evaluated in the Discussion section of this document. The average 24-hour levels of arsenic, cadmium and chromium exceeded the ATSDR CREG CV for all the monitoring locations, including the background monitoring location upwind of the site. However, the average 24-hour air monitoring data shows some contaminants (i.e. arsenic, cadmium, lead, chromium and nickel) were slightly higher at the monitoring locations closer and downwind to the site (Shippingport Borough) compared to the background upwind air monitoring location in Ohioville. [5] The average 24-hour levels of beryllium, and nickel were below available ATSDR CVs. The lead concentrations were below the applicable NAAQS quarterly average of 0.15 µg/m3. For manganese, the average 24-hour levels at the Shippingport (0.10212 µg/m3) and Montgomery L&D (0.07778 µg/m3) monitors were below the ATSDR chronic MRL but exceeded the current EPA RfC value of 0.05 µg/m3. These levels of manganese were higher than manganese levels observed at the background location (0.01937 µg/m3). ATSDR does not currently have a CV for zinc but the levels observed during the sampling event (0.11553 µg/m3 at the Shippingport monitor) are similar to typical air levels in urban areas (0.1 to 1.7 µg/m3). [6]
PADOH also evaluated the 24-hour maximum values against available acute, or short-term, CVs, for each monitoring location, to determine if acute exposure to these levels could harm people’s health. The maximum 24-hour levels during the monitoring event are presented in Table 2 below. The maximum 24-hour levels of metals were below available acute CVs. The maximum levels of cadmium were below ATSDR acute EMEG/MRL of 0.03 µg/m3, for all monitoring locations. In addition, the maximum levels of chromium and nickel were below ATSDR intermediate EMEG/MRL value. ATSDR does not currently have an acute CV for inhalation exposure to arsenic, zinc, beryllium, and manganese. For manganese, the maximum levels were higher closer to the site at the Shippingport monitoring location (1.3066844 µg/m3 was the highest level and 0.39826 µg/m3 the second highest level) compared to the background monitoring location (0.0741177 µg/m3). However, the maximum levels of arsenic and zinc were higher at the background monitoring location in Ohioville. For beryllium, the maximum 24-hour levels were uniform and very similar for all the monitoring locations. Based on a review of the maximum and average 24-hour data and the available CVs, PADOH does not believe exposure to these levels would harm people’s health Generally, the average 24-hour levels of TSP were higher at the Shippingport Borough location (29.38 µg/m3), which is closest to the site, compared to the background location (22.52 µg/m3). The 24-hour maximum levels of TSP were also higher closer to the site in the Shippingport Borough location (69.07 µg/m3 ) compared to the Ohioville background location (57.01 µg/m3). Overall, the average 24-hour and 24-hour maximum level for TSP at all the monitoring locations were below the old EPA TSP standard for both short-term (260 µg/m3) and long-term exposure levels (75 µg/m3). [4] EPA’s
12
NAAQS currently regulates PM10 and PM2.5. Although the former EPA standards for TSP are no longer regulated or enforceable, a comparison of TSP at up and downwind locations can offer general information about particulate matter near the site. PADOH cannot assess potential exposure levels or concentrations of PM2.5 and PM10 because those parameters were not collected during the air monitoring event due to the sampling equipment being unavailable. Although this sampling event did not collect PM10 or PM 2.5, there is NAAQS air monitoring data are routinely collected by PADEP and EPA in the Beaver Valley area. The Beaver Valley area has obtained in attainment status for all NAAQS contaminants except for PM2.5. Beaver Valley has been in non-attainment status for PM2.5 in both the 2006 and 1997 declaration by the EPA. This is discussed further in the PADEP NAAQS Air Monitoring Station Section below [9]
Discussion This section provides more information on the chemicals detected above CVs during the air monitoring event, as discussed above. Based on the air monitoring data evaluated by PADOH, exposure to the detected levels would not be expected to result in harmful effects for the public. Overall, the air monitoring results were as following:
• The average 24-hour levels of arsenic, chromium, and cadmium were above the ATSDR CREG
CV but the observed levels are typical of background urban air. The ATSDR CREG is a very conservative number which represents a value several orders of magnitude below levels associated with observed health effects. In addition, we compared the levels detected to levels found in available literature that have been shown to cause adverse health effects. The levels detected were below levels in the literature shown to cause adverse health effects.
• The average 24-hour levels of manganese were below the ATSDR chronic MRL but exceeded the EPA Rfc.
• The maximum 24-hour levels of metals were below available acute CVs and well below levels documented in the literature to cause adverse health effects.
The majority of information summarized below, including context for how the levels for the various CVs were developed, has been extracted from ATDSR’s chemical-specific Toxicological Profiles. For more information about each chemical, refer to Appendix 2 or visit online profiles at http://www.atsdr.cdc.gov/toxprofiles/index.asp. The adverse health effects documented in the toxicological literature and summarized here are based on much higher levels than were observed in communities living near the site. When human toxicological data are not available, often studies of laboratory animals or occupationally exposed workers are used to calculate no-observed-adverse-effects-level (NOAEL) and lowest-observed-adverse-effects-level (LOAEL). Occupational workers are generally exposed to much higher levels of contaminants than the general population and the resulting NOAEL or LOAEL values would be lower. Therefore, the health effects observed in some occupational studies would be greater than those anticipated in the general population, including those observed during this air monitoring event. Some of the studies discussed in this section pertain to exposures to chemical fumes (in an occupational or laboratory setting) and not to particulate matter, which is the form present in the air monitoring performed near the Bruce Mansfield Power Plant site. Finally, exposure to a hazardous substance does not make it a hazard. The magnitude, frequency, timing, and duration of exposure and the toxicity characteristics of individual substances affect the existence and degree of hazard, if any.
13
Public Health Evaluation of Air Monitoring Data Results
Arsenic Arsenic (as particulates) was detected above ATSDR’s CREG of 0.0002 µg/m3 at all the air monitoring locations, including the upwind background station. The average 24-hour arsenic levels ranged from 0.00076 µg/m3 at the background location to 0.00127 µg/m3 at the Farm monitoring location. Although the arsenic levels exceeded the ATSDR CREG CV, they were all within the range of what is considered typical arsenic background levels for urban and rural air. It is not unusual to find typical rural (<0.001-0.003 µg/m3) and urban (0.020- 0.030 µg/m3) background levels to be 10 to 100 times above the CREG, respectively, for arsenic, because the CREG is a very conservative number which represents a value several orders of magnitude below levels associated with observed health effects. For non cancerous effects, the lowest NOAEL found in the scientific literature for chronic inhalation of arsenic was 613 µg/m3, based on occupational exposures, and a LOAEL of 0.7 µg/m3, based on human environmental exposures, The LOAEL was found to be associated with an increased risk of stillbirth. [13] The highest average 24-hour concentration of arsenic sampled (0.00127 µg/m3 at the Shippingport monitor) is well below the LOAEL (over 300 times below). The highest 24-hour maximum level of 0.0069407 µg/m3 was observed at the Raccoon Township monitoring location and is 100 times lower than the LOAEL value of 0.7 µg/m3. ATSDR does not currently have an acute CV for arsenic via inhalation. However, PADOH and ATSDR would not expect the public would be exposed to highest levels on an on-going basis. Based on the data evaluated by PADOH and ATSDR, exposures to the arsenic levels recorded and evaluated near the site are not expected to harm people’s health.
Chromium Chromium (as particulates) was detected above the ATSDR CREG CV of 0.00008 µg/m3 at all the air monitoring location. The average 24-hour levels of chromium ranged from 0.0045 µg/m3 at the Farm monitor to 0.00757 µg/m3 at Montgomery L&D monitor; however, these concentrations of chromium observed during the air monitoring events are all below or within typical chromium background levels. Background total chromium is typically less than 0.01 µg/m3 in rural areas and between 0.01 to 0.03 µg/m3 in urban areas. Although typical rural and urban background levels are reportedly 1,000 to 8,000 times above ATSDR’s CREG, respectively, for chromium, the CREG is a very conservative number that represents a value several orders of magnitude below levels associated with observed health effects. The average 24-hour levels for all the monitoring locations were below the ATSDR intermediate EMEG of 1.0 µg/m3 and EPA Rfc of 0.1 µg/m3. The air monitoring data was also well below (approximately 250 times below) the LOAEL for chromium of 2.0 µg/m3. The LOAEL is based on a case study of an occupational worker with nasal problems and decreased lung function. [14] It is important to note that the laboratory method did not determine whether or nothexavalent chromium was present. Therefore, for the public health evaluation of chromium, PADOH and ATSDR conservatively assumed all chromium to be chromium VI, which is considered to the more toxic form of chromium. The maximum measured 24-hour concentration of chromium was observed at the Shippingport monitor, at 0.0575752 µg/m3. The maximum 24-hour level is 40 times lower than the LOAEL for chromium of 2.0 µg/m3. ATSDR does not currently have an acute CV for chromium, but the maximum 24-hour levels are below the above mentioned intermediate EMEG value of 1.0 µg/m3. PADOH does not expect the public would be exposed to maximum levels on an on-going basis. Based on the data evaluated and considering typical background levels of chromium, PADOH and ATSDR would not expect exposure to the observed levels would harm people’s health.
14
Cadmium During the air monitoring event cadmium (as particulates) was detected above the ATSDR CREG CV of 0.0006 µg/m3. The average 24-hour levels ranged from 0.00065 µg/m3 at the Farm monitor to 0.00153 µg/m3 at Montgomery L&D monitor. However, these levels are consistent with typical background concentrations of cadmium in ambient air of 0.001 µg/m3 in non-industrialized areas and 0.04 µg/m3 in urban areas. In addition, these levels are well below (10 times lower) the ATSDR MRL for chronic exposure to cadmium of 0.01 µg/m3. The chronic MRL is based on studies of workers inhaling cadmium fumes and is well below a study showing that exposure to 17 µg/m3 of cadmium dust for 30 years and 25 µg/m3 of cadmium fumes for 24 years resulted in respiratory problems amongst workers. The potential for cancer effects was evaluated based on a LOAEL of 100 µg/m3 that was derived from epidemiologic studies of male workers who developed lung cancer and died after being occupationally exposed to cadmium oxide for up to 45 years. [15] The highest 24-hour concentration, of 0.0096869 µg/m3 observed at the Shippingport monitoring location is within the range of typical urban air (0.04 µg/m3). [15] The maximum levels are well below ATSDR’s acute EMEG/MRL level of 0.03 µg/m3. Also, PADOH and ATSDR do not expect the public would be exposed to maximum levels on an on-going basis and therefore, would not be expected to harm people’s health. Exposure to the cadmium levels recorded and evaluated in the air in the vicinity of the site is not expected to harm people’s health, based on data evaluated by PADOH and ATSDR.
Manganese The average 24-hour levels of manganese at the Shippingport (0.10212 µg/m3) and the Montgomery L&D 0.07778 µg/m3) monitors exceeded the EPA Intermediate Rfc level of 0.05 µg/m3 but was below the current ATSDR chronic MRL of 0.3 µg/m3. The EPA RfC and the ATSDR chronic MRL for manganese are both derived from data gathered in a study of neurological effects seen in workers exposed to manganese in a dry alkaline battery factory. The air monitoring results are well below the inhalation LOAEL value of 50 µg/m3, based on the above mentioned neurological effects. [16] Chronic exposure to manganese at low levels is nutritionally essential in humans. Manganese is not classified as a carcinogen. The maximum 24-hour levels of manganese were above typical air levels in the United States of 0.02 µg/m3 at all the monitoring location and could represent a potential regional issue. However, no reports of effects in humans following acute (short-term) effects of exposure to manganese were available [17]. PADOH would not anticipate the public would be exposed to maximum levels on an on-going basis. ATSDR does not currently have an acute CV for manganese. Based on the air monitoring data evaluated, PADOH and ATSDR would not expect exposure to these levels would harm peoples’ health.
PADEP NAAQS Air Monitoring Stations In addition to the above mentioned air monitoring data, PADEP maintains a network of air monitoring stations throughout the Commonwealth that monitor for NAAQS pollutants, as directed under the Clean Air Act. EPA has set NAAQS for six principal pollutants, which are also called "criteria" pollutants, to protect public health, including the health of "sensitive" populations such as asthmatics, children, and the elderly. The principal pollutants include carbon monoxide, lead, nitrogen dioxide, ozone, particulate matter and sulfur dioxide. The monitors are specifically located in areas having high population density, high levels of expected contaminants, or a combination of both factors. The Bruce

15
Mansfield Site is located in the lower Beaver Valley. Several NAAQS air monitoring locations are located in the Beaver Valley area. The closest monitor to the site is located in Hookstown, 4 miles southwest of the site and monitors for sulfur dioxide (SO2). A second monitor is located in Beaver Falls, 10 miles northeast of the site and samples for SO2, nitrogen dioxide (NO2), PM10, and PM2.5. PADEP also historically monitored TSP in Vanport, approximately 12 miles northeast of the site, however this monitor is not currently in operation. [4] In 2009, the lower Beaver Valley obtained attainment status for NAAQS, or principal pollutants, with the exception of PM2.5 .[9] An area is considered to be in attainment status if it meets the NAAQS, as defined in the Clean Air Act. An area may be an attainment area for one pollutant and a non-attainment area for others. [9] Between the years 1998 to 2007, the Beaver Valley had an average PM2.5 value of 15.96 µg/m3 for 24-hour and 40.55 µg/m3 for annual average time frames. These levels slightly exceed the current EPA NAAQS standards for maximum average 24-hour and annual levels of PM2.5 of 15 µg/m3 and 35 µg/m3, respectively. Based on the particulate matter sampling data collected in Beaver Falls, which is approximately ten miles away from the site, the Beaver Valley region received ‘non attainment’ status for PM2.5 and has been in non-attainment since 1997. Therefore, there is likely a regional issue with particulate matter that could potentially affect people’s health, particularly sensitive individuals. It is the understanding of PADOH that, based on the non attainment status, the Commonwealth of Pennsylvania is charged by the EPA with addressing the particulate matter and implementing a plan for reducing the levels of PM2.5. [10, 11] Airborne PM2.5, also known as fine particulate matter, can originate from many sources. Many different industrial, vehicle, natural, agricultural, and emissions sources contribute to airborne PM2.5. Airborne PM2.5 observed in the Beaver Valley may reflect contributions from primary emissions, as well as from the combined effect of industrial and mobile emissions sources throughout the area and beyond. [12] In most instances, elevated PM2.5 concentrations cannot be attributed to a single source, because the pollutant forms in the air from precursors that originate from multiple combustion and industrial sources over broad areas. In addition, “secondary” particles form in the air from chemical reactions involving precursor gaseous emissions, such as sulfur dioxide and nitrogen oxides. It is important to note that these secondary particles can form at locations far from the emissions sources that released the precursors. Public health concern is warranted for adverse health effects from long-term exposure to particulate matter (PM2.5), especially to individuals with pre-existing respiratory and cardiac disease. In the Mid-Atlantic States, PM2.5 levels tend to be highest in the summer, and it is not unusual for elevated levels to be observed at monitoring stations throughout the region on the same days.[18] Mortality as well as cardiovascular and respiratory morbidity has been associated with both short-and long-term exposure to PM2.5. Groups identified within the population that may be more susceptible to the effects of PM exposure include infants, older adults, asthmatics, individuals with chronic obstructive pulmonary disease (COPD), cardiovascular disease, diabetics, and individuals with certain genetic polymorphisms. [19]
Child Health Considerations PADOH recognize that children are especially sensitive when exposed to many contaminants. A child’s lower body weight and higher intake rate results in a greater dose of hazardous substance per unit of body weight. If toxic exposure levels are high enough during critical growth stages, the developing body systems of children can sustain permanent damage. PADOH has taken into account the unique vulnerabilities of infants and children to environmental contaminants during the evaluation
16
of this public health issue and the preparation of this health consultation, specifically to through possible inhalation by children off-site. Arsenic has been documented to cross the placenta, is present in human breast milk, and long-term exposure to arsenic in children may result in lower IQ scores. [13] Children do not appear to be any more or less sensitive than adults to the toxic effects of chromium, cadmium and manganese. [14, 15, 16, 17] As stated in the previous section, children and asthmatics are particularly vulnerable to the effects of inhalation of particulate matter, which appears to be a regional air problem. [8] Studies have shown that in communities with highly elevated particulate matter, children's lungs developed more slowly and did not move air as efficiently as children's lungs in clean air communities. Children and infants are susceptible to harm from inhaling pollutants such as particulate matter because they inhale more air per pound of body weight than do adults - they breathe faster, spend more time outdoors and have smaller body sizes. In addition, children's immature immune systems may cause them to be more susceptible to PM than healthy adults. Additional research is needed to clarify the relationship between particulate matter exposure and children's health. [22]
Conclusions Based on a review of the PADEP air monitoring data, PADOH conclude the following:
Acute, or short-term, exposure to the levels of metals detected during the monitoring event is not expected to harm people’s health. PADOH and ATSDR evaluated the 24-hour maximum values against available acute CVs, for each monitoring location, to determine if acute exposure to these levels could harm people’s health. The maximum 24-hour levels were below available comparison values, and are not expected to result in acute health effects. ATSDR does not currently have an acute CV for inhalation exposure to arsenic, zinc, beryllium, and manganese. However, PADOH does not anticipate the public would be exposed to maximum levels on an on-going basis. Chronic, or long-term, exposure to the levels of metals detected is not expected to harm people’s health. The average 24-hour levels of metals detected during the year-long monitoring event were below available ATSDR CV, except for arsenic, cadmium and chromium. The average levels of arsenic, cadmium and chromium exceeded the ATSDR Cancer Risk Evaluation Guide (CREG) comparison value (CV) for all the monitoring locations, including the background monitoring location. However, the observed concentrations were well below levels documented in the literature to result in adverse health effects and are similar to typical background levels observed in urban and rural areas throughout the United States. In addition, the average 24-hour concentrations of manganese were present at levels exceeding the EPA reference concentration (Rfc) level at the monitoring locations closest to the site (Shippingport and Montgomery Locks and Dam monitoring locations), but also below lowest-observed-adverse-effects-level (LOAEL) documented in the literature. Based on a review of the limited data on particulate matter, PADOH conclude that exposure to the levels of total suspended particulates (TSP) during the monitoring event are not expected to harm people’s health. The levels of TSP observed during the air monitoring event are below the old EPA TSP standard for both acute and chronic exposure levels and the levels similar to typical particulate levels for the area. However, since the sampling only measured
17
TSP, PADOH cannot make conclusions on potential concentrations or exposure levels of particulate matter less than or equal to 2.5 microns in diameter (PM2.5) and particulate matter less than or equal to 10 microns in diameter (PM10). It is important to note that the lower Beaver Valley is currently in ‘non attainment’ status for PM2.5. However, due to sampling equipment limitations PM2.5 and PM10 were not sampled for during the site-specific air monitoring event. Therefore, PADOH cannot conclude on any potential site-specific levels. PM2.5 non-attainment status likely represents a regional issue for particulate matter that could potentially affect people’s health, specifically the health of sensitive individuals, such as children, the elderly and asthmatics.
Recommendations
PADOH will provide health education to area residents regarding the site and community exposure levels, as needed.
Public Health Action Plan
PADOH will review additional sampling data related to the site, as needed and as appropriate, and issue a public health conclusion.
PADOH will continue working with the community to answer questions and address ongoing concerns. PADOH will pursue meetings with the community, as well as state health, local health and other government agencies as appropriate. PADOH will make this health consultation available to the residents and will be available to answer the residents’ health questions.
18
References
1. Agency for Toxic Substances and Disease Registry. Health Consultation. First Energy Corporation, Bruce Mansfield Power Plant. Shippingport, Beaver County, Pennsylvania. March 31, 2009. http://www.atsdr.cdc.gov/HAC/pha/BruceMansfieldPowerPlant/BruceMansfieldPowerPlantHC03-31-09.pdf
2. E-mail correspondence from Dr. Mark White (PADOH HAP) and Ronald Schwartz (PADEP Southwest Regional Office) detailing sampling plan; June 18, 2008
3. Agency for Toxic Substances and Disease Registry. Public Health Assessment Guidance Manual. 2005, Updated. http://www.atsdr.cdc.gov/HAC/PHAmanual/toc.html
4. Pennsylvania Department of Environmental Protection. Bureau of Air Quality, 2007 Ambient Air Quality Monitoring and Emission Trends Report. 2007 http://www.dep.state.pa.us/dep/deputate/airwaste/aq/aqm/aqreport/2007aqreport.pdf
5. Pennsylvania Department of Environmental Protection, Bureau of Laboratories. Analytical Report for Air Quality for Bruce Mansfield monitoring locations. 2008-2009
6. Agency for Toxic Substances and Disease Registry. Toxicological Profiles. http://www.atsdr.cdc.gov/toxprofiles/index.asp
7. Environmental Protection Agency, Center for Environmental Research Information. Sampling of Ambient Air for Total Suspended Particulate Matter (SPM) and PM10 Using High Volume Sampler. June 1999 http://www.epa.gov/ttnamti1/files/ambient/inorganic/mthd-2-1.pdf
8. Environmental Protection Agency. National Ambient Air Quality Standards. October 15, 2008, updated. http://www.epa.gov/air/criteria.html
9. Pennsylvania Department of Environmental Protection. Bureau of Air Quality. Attainment Status for Principle Pollutants. 2008 http://www.dep.state.pa.us/dep/deputate/airwaste/aq/attain/status.htm
10. Letter from Lisa P. Jackson, EPA Administrator to Edward G. Rendell, Governor of Pennsylvania. Nonattainment designation. October 8, 2009 http://www.dep.state.pa.us/dep/deputate/airwaste/aq/attain/PM25Des/Pennsylvania_Rendell.pdf
11. Pennsylvania Department of Environmental Protection. Recommendations to the U.S. EPA for 24-hour Fine Particulate (PM2.5) Attainment/nonattainment Areas. December 2007 http://www.dep.state.pa.us/dep/deputate/airwaste/aq/attain/pm25des/2007_PM25_Attain_Final.pdf
19
12. Environmental Protection Agency. EPA’s 2008 Report on the Environment. EPA/600/R-07/045F. May, 2008. http://cfpub.epa.gov/ncea/cfm/recordisplay.cfm?deid=190806
13. Agency for Toxic Substances and Disease Registry. Toxicological Profile for Arsenic. August 2007 http://www.atsdr.cdc.gov/ToxProfiles/tp.asp?id=22&tid=3
14. Agency for Toxic Substances and Disease Registry. Toxicological Profile for Chromium, draft for public comment. September 2008 http://www.atsdr.cdc.gov/ToxProfiles/tp.asp?id=62&tid=17
15. Agency for Toxic Substances and Disease Registry. Toxicological Profile for Cadmium, draft for public comment. September 2008 http://www.atsdr.cdc.gov/ToxProfiles/tp.asp?id=48&tid=15
16. Agency for Toxic Substances and Disease Registry. Toxicological Profile for Manganese, draft for public comment. September 2008 http://www.atsdr.cdc.gov/ToxProfiles/tp.asp?id=102&tid=23
17. Environmental Protection Agency. Hazard Summary for Manganese. February 2010. http://www.epa.gov/ttn/atw/hlthef/manganes.html
18. Mid-Atlantic Regional Air Management Association. A Guide to Mid-Atlantic Regional Air Quality. October, 2005. http://www.marama.org/reports/Guide-MidAtlantic_RegAQ_Final.pdf
19. Environmental Protection Agency. Integrated Science Assessment for Particulate Matter. First External Review Draft. ISA: EPA/600/R-08/139. December, 2008. http://cfpub.epa.gov/ncea/cfm/recordisplay.cfm?deid=201805
20. Welch, A.C., et.al. 1982. Arsenic exposure, smoking, and respiratory cancer in copper smelter
workers. Archives of Environmental Health, 37(6):325-335.
21. Environmental Protection Agency. Integrated Risk Information System (IRIS), Manganese. Revised, May 1996. http://www.epa.gov/iris/subst/0373.htm
22. California EPA. Air Resources Board. The Children’s Health Study. September 2004. http://www.arb.ca.gov/research/chs/chs.htm
20
Authors, Technical Advisors Pennsylvania Department of Health Bureau of Epidemiology Division of Environmental Health Epidemiology Health Assessment Program
PADOH Authors:
Christine Lloyd, M.S. Epidemiology Program Specialist Farhad Ahmed, MBBS, MPH Principal Investigator
PADOH Reviewers:
Stephen Ostroff, MD Director, Bureau of Epidemiology James Logue, DrPH, MPH Director, Division of Environmental Health Epidemiology Barbara Allerton, MPH, RN Epidemiology Research Associate

21
Appendix 1: Figures and Tables
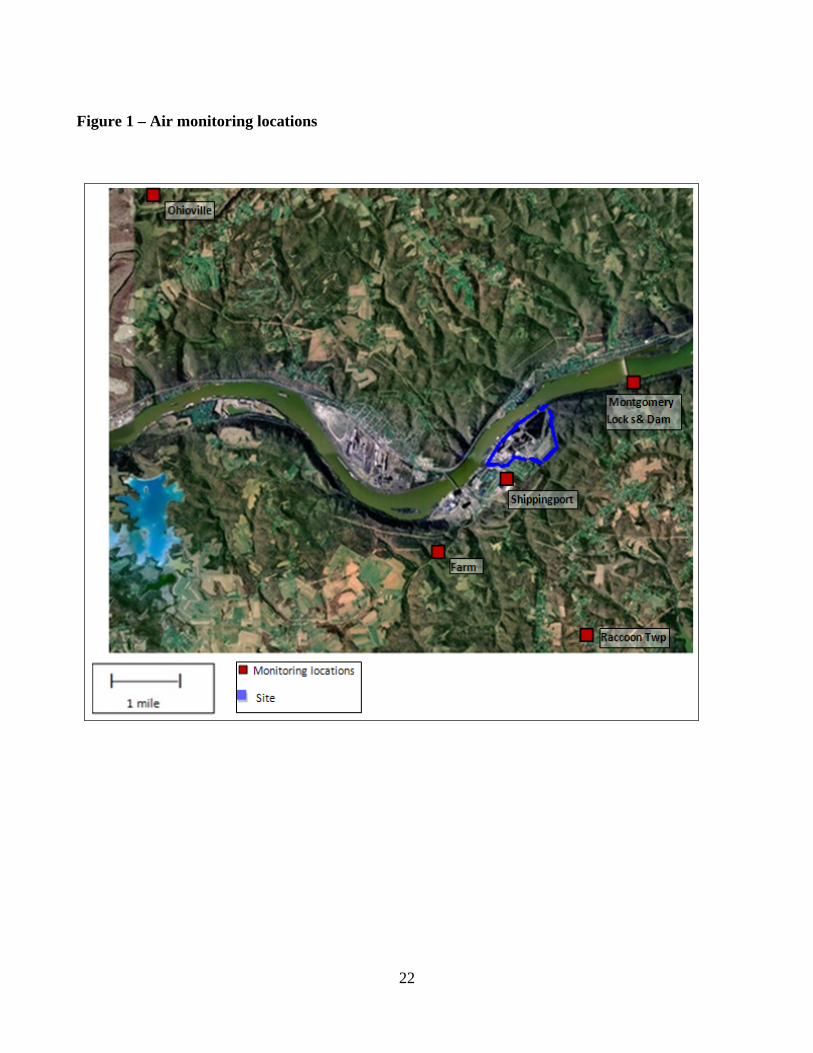
Figure 1 – Air monitoring locations
22
23
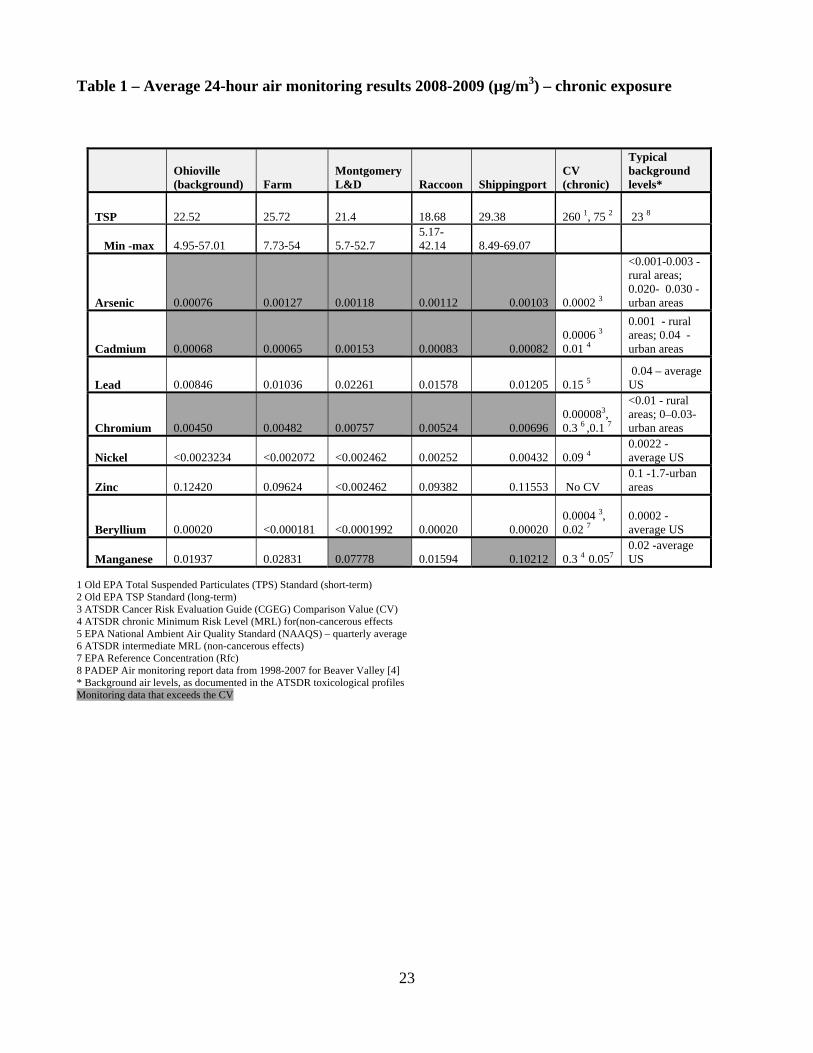
Table 1 – Average 24-hour air monitoring results 2008-2009 (µg/m3) – chronic exposure
Ohioville (background) Farm
Montgomery L&D Raccoon Shippingport
CV (chronic)
Typical background levels*
TSP 22.52 25.72 21.4 18.68 29.38 260 1, 75 2 23 8
Min -max 4.95-57.01 7.73-54 5.7-52.7 5.17-42.14 8.49-69.07
Arsenic 0.00076 0.00127 0.00118 0.00112 0.00103 0.0002 3
<0.001-0.003 - rural areas; 0.020- 0.030 - urban areas
Cadmium 0.00068 0.00065 0.00153 0.00083 0.00082 0.0006 3
0.01 4
0.001 - rural areas; 0.04 -urban areas
Lead 0.00846 0.01036 0.02261 0.01578 0.01205 0.15 5 0.04 – average US
Chromium 0.00450 0.00482 0.00757 0.00524 0.00696 0.000083, 0.3 6 ,0.1 7
<0.01 - rural areas; 0–0.03- urban areas
Nickel <0.0023234 <0.002072 <0.002462 0.00252 0.00432 0.09 4 0.0022 -average US
Zinc 0.12420 0.09624 <0.002462 0.09382 0.11553 No CV 0.1 -1.7-urban areas
Beryllium 0.00020 <0.000181 <0.0001992 0.00020 0.00020 0.0004 3, 0.02 7
0.0002 -average US
Manganese 0.01937 0.02831 0.07778 0.01594 0.10212 0.3 4 0.057 0.02 -average US
1 Old EPA Total Suspended Particulates (TPS) Standard (short-term) 2 Old EPA TSP Standard (long-term) 3 ATSDR Cancer Risk Evaluation Guide (CGEG) Comparison Value (CV) 4 ATSDR chronic Minimum Risk Level (MRL) for(non-cancerous effects 5 EPA National Ambient Air Quality Standard (NAAQS) – quarterly average 6 ATSDR intermediate MRL (non-cancerous effects) 7 EPA Reference Concentration (Rfc) 8 PADEP Air monitoring report data from 1998-2007 for Beaver Valley [4] * Background air levels, as documented in the ATSDR toxicological profiles Monitoring data that exceeds the CV
24
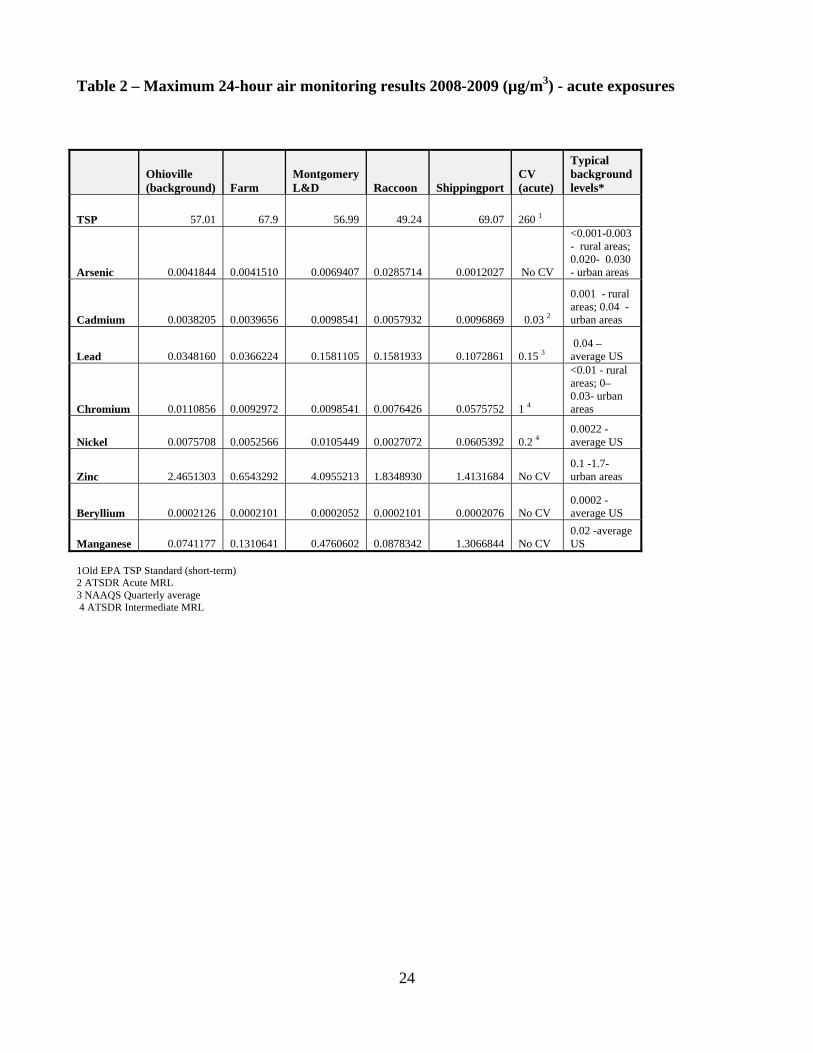
Table 2 – Maximum 24-hour air monitoring results 2008-2009 (µg/m3) - acute exposures
Ohioville (background) Farm
Montgomery L&D Raccoon Shippingport
CV (acute)
Typical background levels*
TSP 57.01 67.9 56.99 49.24 69.07 260 1
Arsenic 0.0041844 0.0041510 0.0069407 0.0285714 0.0012027 No CV
<0.001-0.003 - rural areas; 0.020- 0.030 - urban areas
Cadmium 0.0038205 0.0039656 0.0098541 0.0057932 0.0096869 0.03 2
0.001 - rural areas; 0.04 -urban areas
Lead 0.0348160 0.0366224 0.1581105 0.1581933 0.1072861 0.15 3 0.04 – average US
Chromium 0.0110856 0.0092972 0.0098541 0.0076426 0.0575752 1 4
<0.01 - rural areas; 0–0.03- urban areas
Nickel 0.0075708 0.0052566 0.0105449 0.0027072 0.0605392 0.2 4 0.0022 -average US
Zinc 2.4651303 0.6543292 4.0955213 1.8348930 1.4131684 No CV 0.1 -1.7-urban areas
Beryllium 0.0002126 0.0002101 0.0002052 0.0002101 0.0002076 No CV 0.0002 -average US
Manganese 0.0741177 0.1310641 0.4760602 0.0878342 1.3066844 No CV 0.02 -average US
1Old EPA TSP Standard (short-term) 2 ATSDR Acute MRL 3 NAAQS Quarterly average 4 ATSDR Intermediate MRL
25
Appendix 2: Contaminant Evaluation
26
Arsenic
Arsenic occurs naturally in soil and minerals and it therefore may enter the air, water, and land from wind-blown dust and may get into water from runoff and leaching. Arsenic is associated with ores containing metals, such as copper and lead and may enter the environment during the mining and smelting of these ores. Small amounts of arsenic also may be released into the atmosphere from coal-fired power plants and incinerators because coal and waste products often contain some arsenic. Arsenic is usually found in the environment combined with other elements such as oxygen, chlorine, and sulfur. Arsenic combined with these elements is called inorganic arsenic. Arsenic combined with carbon and hydrogen is referred to as organic arsenic. [13]
Inhalation exposure to inorganic arsenic (primarily arsenic trioxide dust in air at copper smelters) is, in multiple studies, associated with increased risks of lung cancer in occupational settings. However, scientific literature does not support associations between lung cancer and exposure to airborne arsenic in residential settings as the form of arsenic is different than that found in occupational (smelter) settings. For the general population, food is the primary source of arsenic exposure; inhalation exposure is generally negligible by comparison. Most information on human inhalation exposure to arsenic derives from occupational settings such as smelters and chemical plants, where the predominant form of airborne arsenic is arsenic trioxide dust. [13] The lowest LOAEL for lung cancer reported in ATSDR's Toxicological Profile for is 50 µg/m3. [13] It is based on a study of workers chronically exposed at a Swiss smelter for periods ranging from 3 months to 30 years. Since smoking was more common in this occupational cohort than in the general population (as is generally the case), and the synergistic effect of smoking and occupational inhalation of arsenic on lung cancer risk was not taken into account, the true LOAEL for lung cancer attributable to arsenic exposure alone is likely to be significantly higher than 50 µg/m3. When confounding factors such as smoking have been taking into account, no statistically significant increase of lung cancer has been observed at 50 µg/m3. [20] The Department of Health and Human Services (DHHS), the EPA, and International Agency for Research on Cancer (IARC) have determined that inorganic arsenic is a known human carcinogen. Exposure to arsenic may increase the risk of liver, bladder, kidney, prostate, and lung cancers. Children who are exposed to inorganic arsenic may have many of the same effects as adults, including irritation of the stomach and intestines, blood vessel damage, skin changes, and reduced nerve function. Thus, all health effects observed in adults are of potential concern in children. There is also some evidence that suggests that long-term exposure to inorganic arsenic in children may result in lower IQ scores. There is some evidence that inhaled or ingested inorganic arsenic can injure pregnant women or their unborn babies, although the studies are not definitive. [13] Chromium
Chromium is a naturally-occurring element found in rocks, animals, plants, soil, and volcanic dusts and gases. Chromium is present in the environment in several forms. The most common forms are elemental chromium (Cr 0), trivalent chromium (Cr III), and hexavalent chromium (Cr VI). Cr III occurs naturally in the environment and is an essential nutrient. Cr VI and Cr 0 are generally produced by industrial processes. The metal chromium, which is the Cr 0 form, is used for making steel. Cr VI and Cr III are used for chrome plating, making dyes and pigments, leather tanning, and wood
27
preserving. Most of the chromium compounds, usually Cr III and Cr VI, form fine dust in the air and settle on the ground or in water. The respiratory tract is the major target organ for chromium (VI) toxicity, for acute (short-term) and chronic (long-term) inhalation exposures. Shortness of breath, coughing, and wheezing were reported from a case of acute exposure to chromium (VI), while perforations and ulcerations of the septum, bronchitis, decreased pulmonary function, pneumonia, and other respiratory effects have been noted from chronic exposure. The main health effects associated with chronic (long-term) inhalation exposure to hexavalent chromium are irritation of the skin and mucous membranes. Lung cancer has been documented from occupational exposure to Cr VI. [14]
EPA has designated Cr VI as a known human carcinogen (Group A) by the inhalation route of exposure. Human studies have clearly established that inhaled chromium (VI) is a human carcinogen, resulting in an increased risk of lung cancer. The results of toxicological studies using animal models suggest that chromium (VI) can cause lung tumors via inhalation exposure of fumes. Because emissions and exposure data for chromium do not identify specific compounds or valence states, there is greater uncertainty associated with risk estimation for this class of pollutants. The LOAEL for chromium is 2.0 µg/m3, which is derived from a case study of an occupational workers. The effects observed in this study included mild decreased lung function and atrophy of the nasal mucosa. [14] The potential for cancer effects was evaluated based on a LOAEL of 40 µg/m3 derived from epidemiologic studies of male workers who developed lung cancer after being occupationally exposed to mixtures of chromium III and IV for up to 49 years. In human studies, the NOAEL is 1,990 µg/m3, resulting from an occupational medicine study on trivalent chromium compounds. In this study, respiratory system effects were observed in workers occupationally exposed to chromium for up to 23.6 years. [14] Cadmium
Small amounts of cadmium occur naturally in all soils and rocks, including coal and mineral fertilizers. In the environment, cadmium usually is not found in the metallic state, but is combined with other elements such as oxygen, chlorine, or sulfur. Most cadmium in the environment is released by human activities such as mining and smelting operations, fuel combustion, disposal of metal-containing products, and application of phosphate fertilizer or sewage sludges. Cadmium is extracted from natural materials during the production of other metals including lead, zinc, or copper [15].
Cadmium concentrations in non-polluted soil are highly variable, depending upon sources of minerals and organic materials. Cadmium enters the environment through the air as a result of burning coal and household waste, and metal mining and refining processes. Average concentrations in air range from less than 1 to 6 nanograms per cubic meter of air (ng/m3) in rural areas and from 20 to 700 ng/m3 in industrial areas. For the general population, cadmium intake by inhalation averages 0.02 µg/day but can be as high as 2 µg/day in highly polluted areas. Cigarette smokers absorb an additional 1 to 3 µg per day (based on smoking one pack of cigarettes per day). Populations surrounding hazardous waste sites can be exposed to higher levels of cadmium through inhalation of fugitive dust emissions from cadmium-contaminated soil.
Food is the major source of human exposure to cadmium in the general population. Average cadmium levels in U.S. food range from 2 to 40 parts of cadmium per billion parts of food. Adults consume approximately 30 µg of cadmium in food each day, absorbing approximately 1 to 3 µg. Vegetables generally contain the highest levels of cadmium, particularly leafy vegetables and potatoes. Liver,
28
kidney, and shellfish contain higher levels (up to 1 ppm) of cadmium than other meat and seafood products. For populations surrounding hazardous waste sites increased exposure can result from eating fruits and vegetables grown in cadmium-contaminated soil, ingestion of cadmium-contaminated dust on food or hands, and from the direct ingestion of soil.
More than 90% of inhaled cadmium can be absorbed, depending on the in vivo solubility of the inhaled compound. The amount of cadmium that is absorbed is also affected by the availability of the cadmium to the lung, which is largely a function of particle size. Only 5% of particles greater than 10 microns in diameter are deposited in the lung, while up to 50% of particles less than 0.1 micron are deposited. Once cadmium is absorbed, it is bound to red blood cells and serum albumin. Serum cadmium is rapidly taken up by the liver and kidney. Since the half-life of cadmium is thought to be quite long (25 to 30 years), cadmium accumulates in these tissues. The placenta appears to be an effective barrier to cadmium; however, fetal exposure can occur with high maternal exposure.
The toxic effects of chronic exposure to cadmium occur primarily in the lungs and in the kidney. Effects on the lungs are associated solely with inhalation exposure, while the kidney effects may occur after oral or inhalation exposures. Chronic cadmium exposure also has been associated with cardiovascular disease and cancer of the lung, prostate, kidney, and stomach, although these associations are not well established. Studies on the effects of cadmium exposure via inhalation are often complicated by such factors as cigarette smoking. [15] Studies on humans occupationally exposed to cadmium in the air report a NOAEL for kidney toxicity (proteinuria) of 0.017 µg/m3 [15]. Adjusting for continuous lifetime exposure and using an uncertainty factor of 10, ATSDR has used this NOAEL to derive an inhalation MRL of 0.2 µg/m3.
Substantial evidence from laboratory studies suggests that cadmium inhalation can cause lung cancer in rats, but evidence that cadmium inhalation can cause lung cancer in humans is rather weak. Evidence for evaluating potential carcinogenicity of cadmium by the oral and dermal routes in both animals and humans is insufficient. Based on extensive animal data and limited human data associating inhalation of cadmium with lung cancer, EPA classifies cadmium as a B1 carcinogen (probable human carcinogen). [15]
Manganese Manganese is a naturally occurring substance found in many types of rock and soil; it is ubiquitous in the environment and found in low levels in water air, soil, and food. Manganese can also be released into the air by iron and steel production plants, power plants, and coke ovens. Manganese is essential for normal physiologic functioning in humans and animals, and exposure to low levels of manganese in the diet is considered to be nutritionally essential in humans. [16] Food is the largest manganese source for most people. However, people living near coal- or oil-burning factories or close to a major highway may breathe in higher than normal amounts of manganese. Inhaled manganese particles are coughed up and swallowed or slowly absorbed from the lungs into the bloodstream. Because manganese is a normal part of the body, the body ordinarily controls the amount of manganese that is absorbed and retained. Healthy humans maintain efficient control over ingested manganese in the body. The body absorbs and uses what is nutritionally necessary and excretes the remainder. Thus, ingested manganese has rarely been associated with toxicity. [16]
29
Inhaled manganese is often transported directly to the brain before it is metabolized by the liver. The symptoms of manganese toxicity may appear slowly over months and years. Chronic (long-term) exposure to high levels of manganese by inhalation in humans may result in central nervous system (CNS) effects. Visual reaction time, hand steadiness, and eye-hand coordination were affected in chronically-exposed workers. The recommended daily intake of manganese is 2 to 5 mg/day for adults and adolescents. [16] No reports of effects in humans following acute effects of exposure to manganese are available. Effects to the lung have been reported following acute exposure of rats to manganese via inhalation. Chronic exposure to manganese at low levels is nutritionally essential in humans. Chronic inhalation exposure of humans to manganese results primarily in effects on the nervous system. Slower visual reaction time, poorer hand steadiness, and impaired eye-hand coordination were reported in several studies of workers occupationally exposed to manganese dust in air. Other chronic effects reported in humans from inhalation exposure to manganese are respiratory effects such as an increased incidence of cough, bronchitis, dyspnea during exercise, and an increased susceptibility to infectious lung disease. [17] Elderly people may be somewhat more susceptible to manganese's toxic effects on the nervous system than the general population, perhaps because of loss of nerve cells due to aging or to accumulated damage from other environmental toxins acting on the nervous system. Because manganese is excreted through the liver, people with liver disease may have a decreased ability to handle excess manganese. Children do not appear to be any more or less sensitive than adults to the toxic effects of manganese, whether exposure is via ingestion or inhalation. Daily oral intake of small amounts of manganese is needed for growth and good health in children. [16]
The EPA concluded that existing scientific information cannot determine whether or not excess manganese can cause cancer. The EPA Rfc and the current ATSDR chronic MRL for manganese are both derived from data gathered in a study of neurological effects seen in workers exposed to manganese in a dry alkaline battery factory. Inhalation Rfc LOAEL for neurological effects 50 µg/m3 This LOAEL is from the MRL are derived from an “integrated respirable dust” (PM10) concentration and not from a TSP concentration. [21] ATSDR does not have MRL values for acute or intermediate because an MRL based on animal data would be lower than the proposed chronic-duration inhalation MRL that is based on effects observed in humans. It is uncertain if this is due to species differences in susceptibility to the neurotoxic properties of inhaled manganese or to the testing of humans with sensitive neurobehavioral tests that have not been applied to animals following inhalation exposures to manganese. [16]