Health Care Worldwide - Fresenius · Sales 2014 EBITDA 2014 ~ 31% 100% 100%4 77%4 Fresenius Group:...
44
Presentation Barclays High Yield Bond and Syndicated Loan Conference Colorado Springs © Copyright Page 1 Barclays – High Yield Bond and Syndicated Loan Conference June 12, 2015 – Colorado Springs Health Care Worldwide
Transcript of Health Care Worldwide - Fresenius · Sales 2014 EBITDA 2014 ~ 31% 100% 100%4 77%4 Fresenius Group:...

Presentation Barclays High Yield Bond and Syndicated Loan Conference Colorado Springs © Copyright Page 1
Barclays – High Yield Bond and Syndicated Loan Conference June 12, 2015 – Colorado Springs
Health Care Worldwide

Presentation Barclays High Yield Bond and Syndicated Loan Conference Colorado Springs © Copyright Page 2
Safe Harbor Statement
This presentation contains forward-looking statements that are subject to various risks and uncertainties. Future results could differ materially from those described in these forward-looking statements due to certain factors, e.g. changes in business, economic and competitive conditions, regulatory reforms, results of clinical trials, foreign exchange rate fluctuations, uncertainties in litigation or investigative proceedings, and the availability of financing. Fresenius does not undertake any responsibility to update the forward-looking statements contained in this presentation.

Presentation Barclays High Yield Bond and Syndicated Loan Conference Colorado Springs © Copyright Page 3
Agenda
Company Overview
Business Segments- Fresenius Medical Care- Fresenius Kabi- Fresenius Helios- Fresenius Vamed
Financial Overview
Financing Facilities and Debt Structure
Summary and Outlook

Presentation Barclays High Yield Bond and Syndicated Loan Conference Colorado Springs © Copyright Page 4
Company Overview

Presentation Barclays High Yield Bond and Syndicated Loan Conference Colorado Springs © Copyright Page 5
A Global Leader in Health Care Products and Services
- Sales €23.2bn, net income1 €1.8bn for FY 2014
- Strong and well-diversified portfolio
- Global presence in approx. 100 countries
- Long-term opportunities in growing markets
- Leading market positions
1 – Net income incl. attributable to non-controlling interest, before one-time items

Presentation Barclays High Yield Bond and Syndicated Loan Conference Colorado Springs © Copyright Page 6
Sales 2014
EBITDA 2014
~ 31% 100% 77%4100%4
Fresenius Group: Strong and Balanced Health Care Portfolio
$15,832 m
$2,954 m
€5,146 m
€1,084 m6
€5,244 m
€732 m7
€1,042 m
€71 m
Market Cap.5 €24.7 bn
Sales 2014 €23.2 bn EBITDA 20141 €4.1 bnMarket Cap.2 €31.5 bnGroup EV3 €63.6 bn
1 – Before integration costs (Fenwal, acquired Rhön hospitals) and disposal gains (two HELIOS hospitals; Rhön stake)2 – market cap of FSE as of May 28, 2015 3 – Based on consolidated market capitalization of FSE and FMC as of as of May 28, 2015 and consolidated net debt as of March 31, 2015 4 – Held by Fresenius ProServe GmbH, a wholly owned subsidiary of FSE5 – market cap of FMC as of May 28, 2015 6 – Before integration costs (Fenwal)7 – Before integration costs (acquired Rhön hospitals) and disposal gains (two HELIOS hospitals Rhön stake)
S&P:Moody‘s:Fitch:
BBB- stableBa1 stableBB+ stable

Presentation Barclays High Yield Bond and Syndicated Loan Conference Colorado Springs © Copyright Page 7
Fresenius Group: Sales Distribution by Region 2014
€23.2 bn Europe44%
Asia-Pacific9%
North America40%
Latin America5%
Africa2%

Presentation Barclays High Yield Bond and Syndicated Loan Conference Colorado Springs © Copyright Page 8
2009 2010 2011 2012 2013 LTMSept2014
€ million Sales 5-year CAGR: 10%
EBIT1
5-year CAGR: 7%
Net Income1,2
5-year CAGR: 10%
Fresenius Group: Financial Results
2009 20112010 201320121 – Before special items2 – Net Income incl. attributable to non-controlling interest3 – 2011 sales were adjusted by -€161m according to a U.S. GAAP accounting change.
This solely relates to Fresenius Medical Care North America
+16% cc
+4% cc
+3% cc
14,164
19,290
2,054
3,075
1,011
1,707
15,972
2,418
1,243
16,3613
2,563
1,408
23,231
3,158
1,831
20,331
3,045
1,778
2014

Presentation Barclays High Yield Bond and Syndicated Loan Conference Colorado Springs © Copyright Page 9
9%
7%
8%
6%
3%
6%
7%
9%
6%
8% 8%
7%
4%
6%
4% 4%
1999 2000 2001 2002 2003 2004 2005 2006 2007 2008 2009 2010 2011 2012 2013 2014
Fresenius Group: Organic Growth 1999 – 2014
Target:> 2x World GDP
Growth

Presentation Barclays High Yield Bond and Syndicated Loan Conference Colorado Springs © Copyright Page 10
5%
7%
5%4%
5%
3%4%
2008 2009 2010 2011 2012 2013 2014
25%
15% 15%
4% 5%
13%
0%
2008 2009 2010 2011 2012 2013 2014
9%8%
12%
9% 9%
5% 4%
2008 2009 2010 2011 2012 2013 2014
7%8%
6%
2%
5% 5% 5%
2008 2009 2010 2011 2012 2013 2014
Fresenius Helios
Fresenius Group:Sustainable Organic Sales Growth in all Business Segments
Fresenius Kabi
Fresenius Vamed
Fresenius Medical Care
1 – Due to project delays in Russia and the Ukraine
1

Presentation Barclays High Yield Bond and Syndicated Loan Conference Colorado Springs © Copyright Page 11
Business Segments

Presentation Barclays High Yield Bond and Syndicated Loan Conference Colorado Springs © Copyright Page 12
Fresenius Medical Care:Key Facts
GlobalProduction
Network~40 Sites
GlobalProduction
Network~40 Sites
34% of Dialysis Product Market
$3.6 bn Dialysis
Products Revenue
$3.6 bn Dialysis
Products Revenue
$11.3 bn Services Revenue
$11.3 bn Services Revenue
Coordination
~$1.3 bn Care
Coordination
3,396 Clinics
43.4 m Treatments
286,768 Patients286,768 Patients
Presentation Barclays High Yield Bond and Syndicated Loan Conference Colorado Springs © Copyright Page 13
1970 1980 1990 2000 2010 2020E
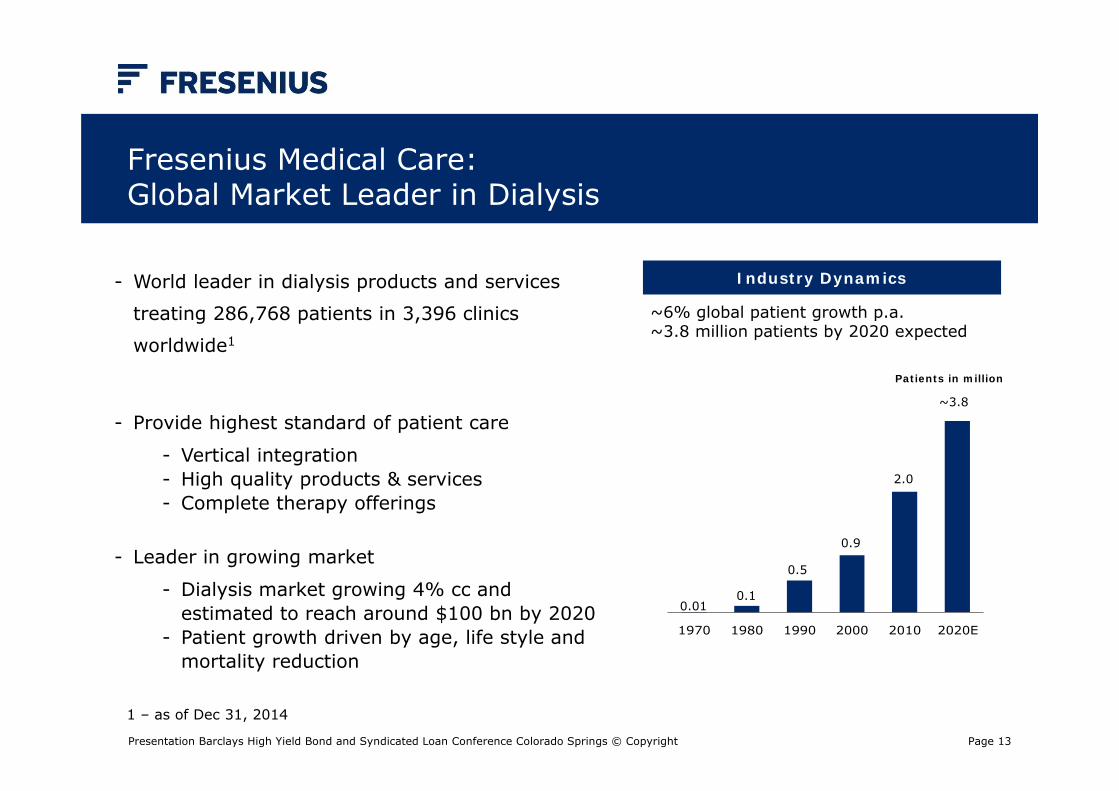
Fresenius Medical Care: Global Market Leader in Dialysis
~3.8
2.0
0.9
0.5
0.10.01
Patients in million
Industry Dynamics
~6% global patient growth p.a.~3.8 million patients by 2020 expected
- World leader in dialysis products and services
treating 286,768 patients in 3,396 clinics
worldwide1
- Provide highest standard of patient care
- Vertical integration- High quality products & services- Complete therapy offerings
- Leader in growing market
- Dialysis market growing 4% cc and estimated to reach around $100 bn by 2020
- Patient growth driven by age, life style and mortality reduction
1 – as of Dec 31, 2014

Presentation Barclays High Yield Bond and Syndicated Loan Conference Colorado Springs © Copyright Page 14
Europe, Middle East, AfricaProvider Patients Countries
52,790 25
21,700 15
18,700 1
13,700 18
6,900 1
3,020 4
2,660 3
Asia PacificProvider Patients Countries
25,680 12
5,100 1
4,000 1
3,880 5
1,830 5
340 1
North AmericaProvider Patients Countries
176,300 2
172,800 1
15,000 1
14,400 1
11,000 1
6,660 1Other
7%
Latin AmericaProvider Patients Countries
31,970 8
8,990 2
4,500 3
2,370 1
930 1
Fresenius Medical Care:Market Leader in all Regions
Presentation Barclays High Yield Bond and Syndicated Loan Conference Colorado Springs © Copyright Page 15
€ million Q1/2013 Q1/2012 Growth
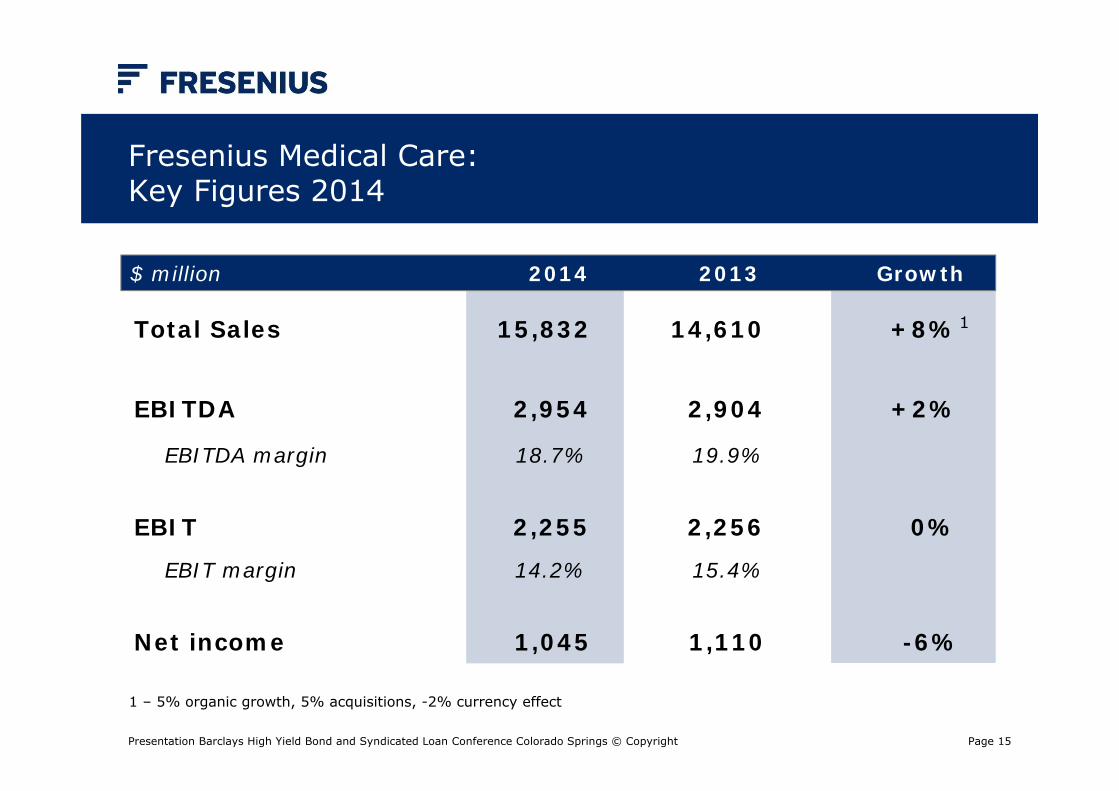
Total Sales 15,832 14,610 +8%1
EBITDA 2,954 2,904 +2%
EBITDA margin 18.7% 19.9%
EBIT 2,255 2,256 0%
EBIT margin 14.2% 15.4%
Net income 1,045 1,110 -6%
Fresenius Medical Care: Key Figures 2014
1 – 5% organic growth, 5% acquisitions, -2% currency effect
$ million 2014 2013 Growth

Presentation Barclays High Yield Bond and Syndicated Loan Conference Colorado Springs © Copyright Page 16
€ million Q1/2013 Q1/2012 Growth
Total Sales 3,960 3,564 +11%1
EBITDA 680 612 +11%
EBITDA margin 17.2% 17.2%
EBIT 504 445 +13%
EBIT margin 12.7% 12.5%
Net income 210 205 +2%
Fresenius Medical Care: Key Figures Q1/2015
1 – 7% organic growth, 10% acquisitions, -6% currency effect
$ million Q1/2015 Q1/2014 Growth

Presentation Barclays High Yield Bond and Syndicated Loan Conference Colorado Springs © Copyright Page 17
$ million Q1/2015 Q1/2014
Operating Cash Flow
Operating Cash Flow Margin
Capex (net)
Free Cash Flow(before acquisitions and dividends)
Free Cash Flow(after acquisitions and dividends)
447
11.3%
197
250
239
112
3.2%
197
-85
-220
Fresenius Medical Care: Cash Flow Q1/2015

Presentation Barclays High Yield Bond and Syndicated Loan Conference Colorado Springs © Copyright Page 18
2013
Debt/EBITDATotal debt $ million
2.8
9,532
Q1/2015
2013
2014
2014
9,052 3.1
Q1 2015
2.98,417
Fresenius Medical Care:Leverage Ratio and Ratings
Current Ratings S&P Moody‘s Fitch
Company BBB- Ba1 BB+
Outlook stable stable stable

Presentation Barclays High Yield Bond and Syndicated Loan Conference Colorado Springs © Copyright Page 19
- Comprehensive product portfolio for critically and chronically ill patients
- IV Drugs- Clinical Nutrition- Infusion Therapy- Medical Devices / Transfusion Technology
- Global addressable market: >€29 bn
- Leading market positions
- Focus on organic growth driven by geographic product rollout and robust product pipeline
- Aim to expand the business through selective acquisitions
Fresenius Kabi: A Worldwide Leading Hospital Supplier
Emerging markets€1,513 m
Europe€2,102 m
North America€1,531 m
29%
41%
30%
2014 Sales by Region
€5.1 bn
Presentation Barclays High Yield Bond and Syndicated Loan Conference Colorado Springs © Copyright Page 20
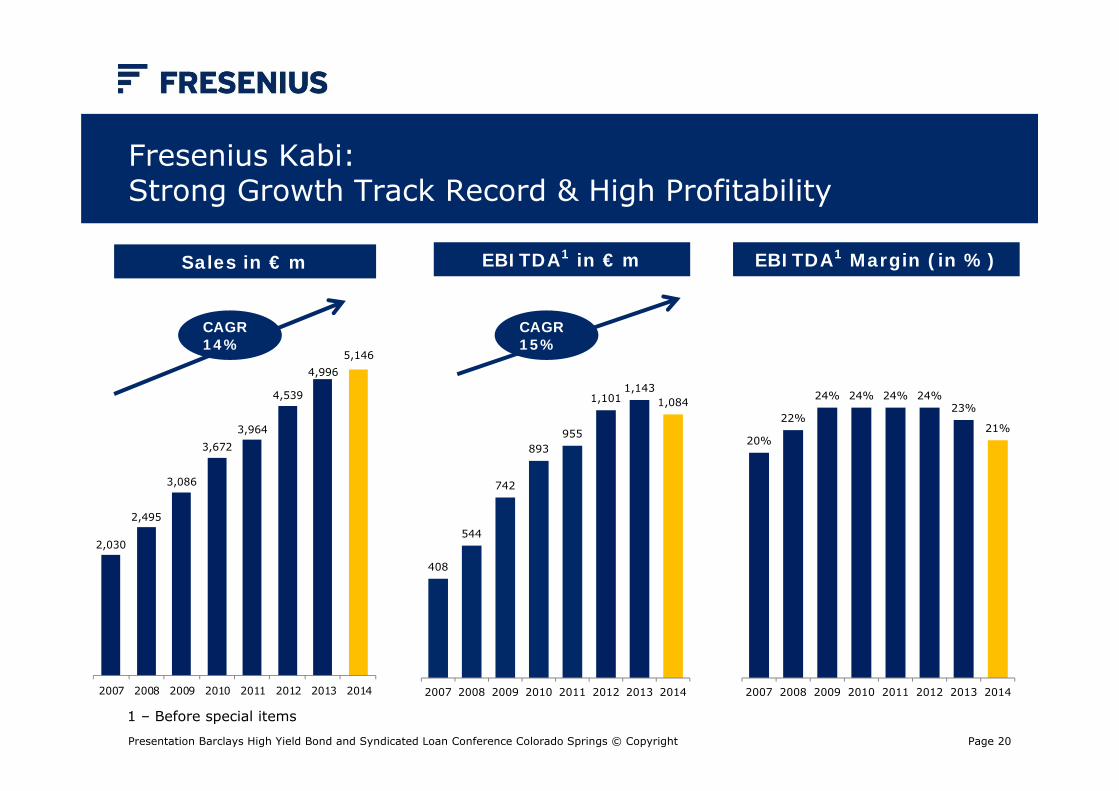
2,030
2,495
3,086
3,6723,964
4,539
4,9965,146
2007 2008 2009 2010 2011 2012 2013 2014
EBITDA1 in € m
Fresenius Kabi: Strong Growth Track Record & High Profitability
CAGR14%
CAGR15%
1 – Before special items
Sales in € m EBITDA1 Margin (in %)
408
544
742
893955
1,1011,143
1,084
2007 2008 2009 2010 2011 2012 2013 2014
20%
22%
24% 24% 24% 24%23%
21%
2007 2008 2009 2010 2011 2012 2013 2014

Presentation Barclays High Yield Bond and Syndicated Loan Conference Colorado Springs © Copyright Page 21
€ million 2014 2013 Growth
Sales 5,146 4,996 3%- IV Drugs 1,813 1,733 5% - Clinical Nutrition 1,384 1,332 4%- Infusion Therapy 977 980 0%- Medical Devices/ Transfusion Technology 972 951 2%
EBITDA 1,084 1,143 -5%EBITDA margin 21.1% 22.9%
EBIT 873 926 -6%EBIT margin 17.0% 18.5%
Net income 468 487 -4%
Fresenius Kabi: Key Figures 2014
2
2
2
1
1 – 4% organic growth, -2% currency effect, 1% acquisitions2 – Before integration costs (Fenwal)

Presentation Barclays High Yield Bond and Syndicated Loan Conference Colorado Springs © Copyright Page 22
€ million Q1/2015 Q1/2014 Growth
Sales 1,394 1,213 +15%- IV Drugs 545 441 +24% - Clinical Nutrition 372 318 +17%- Infusion Therapy 231 230 +0%- Medical Devices/ Transfusion Technology 246 224 +10%
EBITDA 315 253 +25%
EBITDA margin 22.6% 20.9%
EBIT 257 201 +28%
EBIT margin 18.5% 16.6%
Net income 140 106 +32%
Fresenius Kabi: Key Figures Q1/2015
1
1
1
2
1 – 2015 before costs for the Kabi efficiency program, 2014 before Fenwal integration costs2 – 5% organic growth, 10% currency effect, 1% acquisitions, -1% divestitures

Presentation Barclays High Yield Bond and Syndicated Loan Conference Colorado Springs © Copyright Page 23
Fresenius Helios: Leading Private Hospital Operator in Germany
- Acute and post-acute care in 111 proprietary hospitals1
- High-quality medical care (e.g., mortality rate for heart failure and pneumonia >30% below German average)
- Strong track record in hospital operations and acquisitions: targeting 12 − 15% EBIT margin within 6 years per individual clinic location
- Landmark acquisition of 41 hospitals from Rhön-Klinikum provides excellent long-term growth opportunities
2014 Sales: €5,244 m; EBIT: €553 m
Majority of population has access to a HELIOS hospital within one hour‘s drive
1 – as of April 1, 2015
Maximum care hospitalsAcute care hospitalsAcute care hospitals/post-acute care clinicsPost-acute care clinicsCompany headquarters

Presentation Barclays High Yield Bond and Syndicated Loan Conference Colorado Springs © Copyright Page 24
€ million 2014 2013 Growth
Sales 5,244 3,393 +55%
EBITDA2 732 508 +44%
EBITDA margin 14.0% 15.0%
EBIT2 553 390 +42%
EBIT margin 10.5% 11.5%
Net income 400 275 +45%
Fresenius Helios: Key Figures 2014
1 – 4% organic growth, 53% acquisitions, -2% divestitures 2 – 2014 before integration costs (€51 m) and disposal gains (two HELIOS hospitals: €22 m; Rhön stake: €35 m)3 – 2014 before integration costs (€41 m) and disposal gains (two HELIOS hospitals: €21 m; Rhön stake: €34 m)
1
3

Presentation Barclays High Yield Bond and Syndicated Loan Conference Colorado Springs © Copyright Page 25
€ million Q1/2015 Q1/2014 Growth
Sales 1,391 1,227 +13%
EBITDA 192 158 +22%
EBITDA margin 13.8% 12.9%
EBIT 147 114 +29%
EBIT margin 10.6% 9.3%
Net income 107 77 +39%
Fresenius Helios: Key Figures Q1/2015
1 – Q1/2015: Excluding disposal gains from the divestment of two HELIOS hospitals (€34 m) and integration costs for acquired Rhönhospitals (€2 m)Q1/2014: Excluding disposal gains from the divestment of two HELIOS hospitals (€22 m)
2 – 4% organic growth, 10% acquisitions, -1% divestitures
2
1
1
1
1

Presentation Barclays High Yield Bond and Syndicated Loan Conference Colorado Springs © Copyright Page 26
Financial Overview

Presentation Barclays High Yield Bond and Syndicated Loan Conference Colorado Springs © Copyright Page 27
2.0
2.3
2.6
3.1 3.2
3.9 3.94.1
2007 2008 2009 2010 2011 2012 2013 2014
11.412.3
14.216.0 16.4
19.320.3
23.2
2007 2008 2009 2010 2011 2012 2013 2014
Fresenius Group: Demonstrated Strong Sales and EBITDA Growth
CAGR11%
Sales in € bn EBITDA1 in € bn
1 – Before special items
CAGR11%

Presentation Barclays High Yield Bond and Syndicated Loan Conference Colorado Springs © Copyright Page 28
2014 2013 Change Change€ million actual constant
rates rates
Sales 23,231 20,331 +14% +16%1
EBITDA2 4,095 3,888 +5% +6%
EBIT2 3,158 3,045 +4% +4%
Interest, net -602 -584 -3% -4%
EBT2 2,556 2,461 +4% +4%
Taxes -725 -683 -6% -7%
Net income3,4 1,831 1,778 3% +3%
Employees 216,275 178,337
Fresenius Group: Key Figures 2014
1 – 4% organic growth, 12% acquisitions, 2 – 2014 before integration costs (Fenwal: €50 million; acquired Rhön hospitals: €51 million) and disposal gains
(two HELIOS hospitals: €22 million; Rhön stake: €35 million); 2013 before integration costs (Fenwal: €54 million)3 – 2014 before integration costs (Fenwal: €33 million; acquired Rhön hospitals: €41 million) and disposal gains
(two HELIOS hospitals: €21 million; Rhön stake: €34 million); 2013 before integration costs (Fenwal: €40 million)
4 – incl. attributable to non-controlling interest

Presentation Barclays High Yield Bond and Syndicated Loan Conference Colorado Springs © Copyright Page 29
Q1/2015 Q1/2014 Change Change€ million actual constant
rates rates
Sales 6,483 5,212 +24%1 +13%
EBITDA2 1,115 867 +29% +15%
EBIT2 851 643 +32% +18%
Interest, net - 165 - 138 -20% -7%
EBT2 686 505 +36% +21%
Taxes - 207 -133 -56% -38%
Net income3,4 479 3725 +29% +15%
Employees 217,836 216,2756
Fresenius Group: Key Figures Q1/2015
1 – 6% organic growth, 11% currency effect, 8% acquisitions, -1 % divestitures2 – 2015 before integration costs for acquired Rhön hospitals (€2 million), before costs for efficiency program
at Fresenius Kabi (€10 million) and disposal gains from the divestment of two HELIOS hospitals (€34 million); 2014 before Fenwal integration costs (€1 million) and disposal gains from the divestment of two HELIOS hospitals (€22 million)
3 – 2015 before integration costs for acquired Rhön hospitals (€2 million), before costs for efficiency program at Fresenius Kabi (€7 million) and disposal gains from the divestment of two HELIOS hospitals (€34 million); 2014 before Fenwal integration costs (€1 million) and disposal gains from the divestment of two HELIOS hospitals (€21 million)
4 – incl. attributable to non-controlling interest5 – €11 million one-time effect from dissolution
of tax audit accrual 6 – as of December 31, 2014

Presentation Barclays High Yield Bond and Syndicated Loan Conference Colorado Springs © Copyright Page 30
Fresenius Group:Cash Flow Development Q1/2015
€ million Operating CF Capex (net) Free Cash Flow1
Q1/15 LTM Margin Q1/15 LTM Margin Q1/15 LTM Margin
83
114
-37
-26
134
531
12.8%
11.0%
0.8%
n.a.
11.4%
12.1%
-65
-30
-1
-2
-98
-273
-6.6%
-4.8%
-0.9%
n.a.
-5.4%
-5.5%
18
84
-38
-28
36
258
6.2%
6.2%
-0.1%
n.a.
6.0%
6.6%
Corporate/Other
excl. FMC
Group
2 2
3
1 - Before acquisitions and dividends2 - Margin incl. FMC dividend3 - Understated: 7.4% excluding €69 million of capex commitments from acquisitions
Margin = in % of sales

Presentation Barclays High Yield Bond and Syndicated Loan Conference Colorado Springs © Copyright Page 31
3.07
2.632.72
2.60
2.57
3.26
3.12
YE/09 YE/10 YE/11 YE/12 YE/13 YE/14 Q1/15
Fresenius Group: Debt and Interest Ratios
1 – Before integration costs, disposal gains (two HELIOS hospitals; Rhön stake) and costs for Fresenius Kabi efficiency program2 – Pro forma including acquired Rhön hospitals and Fresenius Medical Care acquisitions; excluding two HELIOS hospitals3 – Before integration costs and disposal gains (two HELIOS hospitals; Rhön stake) 4 – At annual average exchange rates for both net debt and EBITDA; without major acquisitions; before special items 5 – Before integration costs, disposal gains (two HELIOS hospitals) and costs for Fresenius Kabi efficiency program
Mar 31,2015
Dec 31,2014
Debt (€m)thereof 52% US$denominated
15,940 15,454
Net debt (€m) 14,948 14,279
Net debt/EBITDA 3.401,2 3.412,3
EBITDA/Interest 6.85 6.83at actualat annual average FX rates
Net debt/EBITDA
Target 2015 YE:~3.04
3.403.41

Presentation Barclays High Yield Bond and Syndicated Loan Conference Colorado Springs © Copyright Page 32
3.2x
3.0x
2.7x
2.2x 2.3x
3.5x
3.0x
2.6x
3.6x
3.0x
2.6x
2.8x
2.6x 2.5x
3.4x 3.4x
2001 2002 2003 2004 2005 Q1/06(1)
2006(1)
2007 2008(2)
2009 2010 2011 2012(3)
2013(4)
2014(5)
Q1/15(7)
Fresenius Group: Proven Track Record of Deleveraging
1 – Pro forma incl. Renal Care Group2 – Pro forma incl. APP Pharmaceuticals Inc., before APP-transaction related special items3 – Pro forma incl. Damp Group, Liberty Dialysis Holdings, Inc. and Fenwal, adjusted for €6 million one-time costs related to the 2012 takeover offer to
Rhön-Klinikum AG shareholders as well as for €86 million other one-time costs at FMC 4 – Pro forma excluding advances made for the acquisition of hospitals and outpatient facilities of Rhön-Klinikum AG; Before integration costs (Fenwal)5 – Pro forma acquired Rhön hospitals and FMC acquistions; excluding two HELIOS hospitals; before integration costs (Fenwal; acquired Rhön hospitals) and
disposal gains (two HELIOS hospitals; Rhön stake)6 – At annual average exchange rates for both net debt and EBITDA, without major acquisitons and before special items7 – Pro forma acquired Rhön hospitals and FMC acquisitions; excluding two HELIOS hospitals; before costs for the efficiency program and integration costs
(Fenwal, acquired Rhön hospitals) and disposal gains (two HELIOS hospitals, Rhön stake)
Acquisitionof Renal
Care Group
Acquisitionof APP
Pharmaceuticals
Acquisitionof hospitals
from Rhön-Klinikum
Target 2015 YE6:~3.0
Presentation Barclays High Yield Bond and Syndicated Loan Conference Colorado Springs © Copyright Page 33
Financing Facilities and Debt Structure

Presentation Barclays High Yield Bond and Syndicated Loan Conference Colorado Springs © Copyright Page 34
1 – External debt as of March 31, 20152 – Incl. Fresenius Finance B.V. and other financing subsidiaries3 – Controlling stake
Fresenius Group: Current Debt and Cash Flow Structure March 31, 2015
Profit transferAgreements,UpstreamGuarantee
Profit transferAgreements,UpstreamGuarantee
100% 100%4
Market Value~ € 7.5 bn
€7,117 m Net Debt2
€7,834 m Net Debt5
Fresenius Medical Care Financing Fresenius SE Financing
€133 m Net Debt5- €100 m Net Debt5
€14,948 m Total Net Debt1
Profit transferAgreements,UpstreamGuarantee
77%4
- €35 m Net Debt5
~31%3
Total Net Debt€7.1 bn
4 – As held by Fresenius ProServe GmbH, a wholly owned subsidiary of Fresenius SE & Co. KGaA, which provides the guarantees
5 – Incl. subsidiaries

Presentation Barclays High Yield Bond and Syndicated Loan Conference Colorado Springs © Copyright Page 35
1 - Net of Cash and intercompany adjustments2 - Based on market capitalization for FSE and FMC as of May 28, 20153 - Pro forma acquisitions (Rhön hospitals -€1 m, FMC acquisitions €55 m, excl. two HELIOS hospitals); before integration costs (Fenwal €49 m,
acquired Rhön hospitals €53 m, disposal gains two HELIOS hospitals €34 m, Rhön stake €35 m and costs for efficiency program €10 m)4 - Exchange rate as of March 31, 2015, except for market capitalization which uses exchange rate as of May 28, 2015
3
Fresenius Group: Capitalization March 31, 2015
in € million in $ million % of total cap EBITDA LTM x
FSE 2013 Credit Agreement: Term Loan A (€, US-$) 1,940 2,087 3.1%
FSE 2013 Credit Agreement: Term Loan B (US-$) 458 493 0.7%
8.750% and 9.000% Senior Notes due 2015 (€, US-$) 737 793 1.2%
4.250% Senior Notes due 2019 500 538 0.8%
2.375% Senior Notes due 2019 299 322 0.5%
2.875% Senior Notes due 2020 500 538 0.8%
3.000% Senior Notes due 2021 445 479 0.7%
4.250% Senior Notes due 2021 279 300 0.4%
4.000% Senior Notes due 2024 453 487 0.7%
Convertible Bonds 462 497 0.7%
Euro Notes 1,025 1,103 1.6%
Other debt, gross 460 495 0.7%
Total Debt (FSE excl. FMC), gross 7,558 8,132 11.9%
Cash (excl. FMC) 413 444 0.7%
Total debt (FSE excl. FMC), net 7,145 7,688 11.2%
Total FMC debt, net1 7,803 8,395 12.3%
Total consolidated debt, net 14,948 16,083 23.5% 3.4x 3,4
Market capitalization2 48,648 53,007 76.5% 11.1x
Total capitalization 63,596 69,090 100.0% 14.5x FSE Group EBITDA3 4,397

Presentation Barclays High Yield Bond and Syndicated Loan Conference Colorado Springs © Copyright Page 36
0200400600800
1,0001,2001,4001,6001,8002,0002,2002,4002,6002,8003,000
2015 2016 2017 2018 2019 2020 2021 2022 2023 2024
in €
mill
ion
Fresenius Medical Care Fresenius excl. FMC
Fresenius Group: Debt Maturity Profile1 March 31, 2015
Maturity 4.1 years on
average
1 – based on utilization of major financing instruments

Presentation Barclays High Yield Bond and Syndicated Loan Conference Colorado Springs © Copyright Page 37
Summary and Outlook

Presentation Barclays High Yield Bond and Syndicated Loan Conference Colorado Springs © Copyright Page 38
Fresenius Medical Care: Financial Outlook 2015 and beyond
2015 E2016
projection
Long term target 2020
CAGR 2015-2020
Sales5-7%
10-12%cc
9-12%
9-12%cc~10%
Net Income 0-5% 15-20% High single digit
- The outlook is based on exchange rates prevailing at the beginning of 2015
- Information includes savings from the Global Efficiency Program
- Potential acquisitions are not included
- The outlook is based on the execution and the operating cost investments within the Care
Coordination business – in line with FMC’s 2020 strategy
cc = constant currency CAGR = Compound Annual Growth Rate

Presentation Barclays High Yield Bond and Syndicated Loan Conference Colorado Springs © Copyright Page 39
Fresenius Group: Increased Outlook for Fresenius Kabi
Old New
FreseniusKabi
Sales growth organicEBIT growth constant currency
3% – 5%4% – 6%
4% – 7%11% – 14%
FreseniusHelios
Sales growth organicSales growth reportedEBIT
3% – 5%6% – 9%€630 – 650 m
FreseniusVamed
Sales growth organicEBIT growth
single–digit %5% – 10%

Presentation Barclays High Yield Bond and Syndicated Loan Conference Colorado Springs © Copyright Page 40
Fresenius Group: Increased Earnings Guidance
Old New
Revenue growthat constant currency
7% ‒ 10%
Net income growth1
at constant currency9% ‒ 12% 13% – 16%
1 – Net income attributable to shareholders of Fresenius SE & Co. KGaA; 2015 before integration costs for hospitals of Rhön-Klinikum AG (~€10 m before tax), before costs for efficiency program at Fresenius Kabi (~€100 m before tax) and disposal gains from the divestment of two HELIOS hospitals (€34 m before tax); 2014 before special items

Presentation Barclays High Yield Bond and Syndicated Loan Conference Colorado Springs © Copyright Page 41
Aging population and higher incidence of chronic diseasesWorld population aged 60+ will more than double by 2050 to >2 bn (OECD)
Continuing growth of genericsApprox. $19 bn branded IV drug sales (base: 2013) go off-patentin the U.S. by 2023
Increasing health care spending in emerging marketsIncreasing health care coverage and per capita spending (e.g. India: $157, China: $480, vs. USA: $8,895; WHO)
Rise of private providers in health care servicesFurther privatization of German hospital marketGlobal opportunity to provide dialysis services (e.g. China, India)
Fresenius Group: Ideal Strategic Posture to Benefit from Major Healthcare Trends

Presentation Barclays High Yield Bond and Syndicated Loan Conference Colorado Springs © Copyright Page 42
Mid-Term Target
~ €30 billion sales€1.4 to €1.5 billion net income1
by 2017
Fresenius Group: Attractive Mid-Term Growth Prospects
Strong and Balanced Health Care Portfolio
1 – excl. attributable to non-controlling interest

Presentation Barclays High Yield Bond and Syndicated Loan Conference Colorado Springs © Copyright Page 43
Investment Highlights
Clear track record of and commitment to de-leveraging
Strong financial performance and cash flow generation
Leading market positions
Diversified revenue base with four strong business segments
Proven ability to integrate acquisitions
Global presence in growing, non-cyclical markets

Presentation Barclays High Yield Bond and Syndicated Loan Conference Colorado Springs © Copyright Page 44
Health Care Worldwide