Md Nazrul Islam,* Afroza Akter Liza, Mst. Liza Khatun, Md ...

HEALTH CARE SEEKINGIN POOR URBAN SETTLEMENTS
IN SYLHET CITY CORPORATION, 2013
Health Systems and Population Studies Division,International Centre for Diarrhoeal Disease Research, Bangladesh (icddr,b)
Implemented by: In cooperation with:
A quantitative surveyThis report has been prepared by the Health Systems and Population Studies Division, icddr,b for the Addressing Bangladesh’s Demographic Challenges project, which is implemented by Deutsche Gesellschaft für Internationale Zusammenarbeit (GIZ) GmbH on behalf of the German Federal Ministry for Economic Cooperation and Development (BMZ).

icddr,b special publication no. 149June 2016
ISBN: 978-984-551-365-4
PublisherHealth Systems and Population Studies Division,icddr,b, dhakaPhone: +880-2-982 7001-10Fax: +880-2-881 1686Email: [email protected]: www.icddrb.org
Cover DesignRahenul Islam
© icddr,b

Health Systems and Population Studies Division,International Centre for Diarrhoeal Disease Research, Bangladesh (icddr,b)
68, Shaheed Tajuddin Ahmed Sarani, Mohakhali, Dhaka – 1212, BangladeshPhone: +880-2-982 7001-10, Email: [email protected]
GPO Box 128, Dhaka 1000, Bangladesh
� www.icddrb.org � /icddrb � @icddr_b � linkedin.com/company/icddrb
Rubana Islam1
Syed Jafar Raza Rizvi1
Tessa Hillgrove2
Rushdia Ahmed1
Alayne M Adams1
HEALTH CARE SEEKINGIN POOR URBAN SETTLEMENTS
IN SYLHET CITY CORPORATION, 2013
1 icddr,b, Mohakhali, Dhaka 1212, Bangladesh2 The Fred Hollows Foundation, 52 Barry St. Carlton VIC 3053 Australia

ii
Acknowledgements
This study was possible due to the continuous support of the Addressing Bangladesh’s Demographic
Challenges project, implemented by Deutsche Gesellschaft für Internationale Zusammenarbeit (GIZ)
GmbH on behalf of the German Federal Ministry for Economic Cooperation and Development (BMZ).
The authors would like to acknowledge the contributions of the following individuals:
Dr. Laura Reichenbaich for involvement in the conceptualization of the survey, Bidhan Chandra Sarkar
for his conceptual input and technical support in terms of survey implementation, Dr. Tanvir Ahmed and
Dr. Nadira Sultana Kakoly for advice regarding survey tool development, Ruman M Salam Zakaria and
Rahenul Islam for digitizing the survey tool, and the data collection team-
A.K.M.M.Murshed Mushfiqur Rahman
Al-Mokarrom Ahmed Polash Naima Amin
Beauti Halder Nasrin Akhter
Beauty Akter Rupa Rajib Pramanik
Chamely Roy Refata Nasim
Didarul Alam Rinki Rani Saha
Farhana Yasmin Roksana Sharker
Faria Khan Rubina Yesmen
Fayeza Sultana S. M. Modud
Humayun Kabir Sabina Yeasmin
Irin Parvin Sadiqul Islam
Ismat Ara Begum Safaet Ahmed
Juma Akter Shanaj Parvin
K.H.Motiul Islam Sharmin Akter
Kashfia Afrin Subarna Khatun
Khadija Akter Sufia Akther Sonia
Mahmud Hasan Suma Akhter
Marzia Sultana Tania Sultana
Md. Abdul Munim Th. Ashita
icddr,b is also grateful to the Governments of Bangladesh, Canada, Sweden, and the UK for providing
core/ unrestricted support.

iii
Table of Contents Acronyms ...................................................................................................................................................... v
Findings Overview ........................................................................................................................................ vi
Chapter 1. Introduction ................................................................................................................................ 1
1.1 Background ......................................................................................................................................... 1
1.2 Justification ......................................................................................................................................... 3
1.3 Objectives............................................................................................................................................ 3
1.4 Methods .......................................................................................................................................... 3
1.4.1 Study design ................................................................................................................................. 3
1.4.2 Sample selection and size ............................................................................................................ 3
1.4.3 Data collection instrument .......................................................................................................... 5
1.4.4 Data collection & entry ................................................................................................................ 6
1.4.5 Challenges in fieldwork ................................................................................................................ 8
1.4.6 Data analysis ................................................................................................................................ 8
Chapter 2. Population and household characteristics ............................................................................... 10
2.1 Household population....................................................................................................................... 10
2.2 Household assets and socioeconomic status.................................................................................... 14
Chapter 3. Survey Respondents .................................................................................................................. 18
3.1 Characteristics of survey respondents .............................................................................................. 18
3.2 Employment and occupation ............................................................................................................ 20
3.3 Knowledge and perceptions about health care service providers ................................................... 21
3.4 Access to media and cell phones ...................................................................................................... 23
Chapter 4. Acute Health Problems ............................................................................................................. 25
4.1 Background characteristics of cases and types of health problems ................................................. 26
4.2 Choice of provider ............................................................................................................................. 30
4.3 Patient experience ............................................................................................................................ 35
4.4 Travel and expenses related to receiving healthcare ....................................................................... 38
Chapter 5. Chronic Health Issues and Related Health Care Seeking .......................................................... 42
5.1 Characteristics of health problems ................................................................................................... 43
5.2 Pattern of healthcare seeking ........................................................................................................... 48
5.3 Healthcare cost and coping mechanism ........................................................................................... 52
Chapter 6. Family Planning ......................................................................................................................... 55

iv
6.1 Knowledge of and experience with contraceptive methods ever used ........................................... 59
6.2 Termination of pregnancy and future birth plans ............................................................................ 62
Chapter 7. Pregnancy and Delivery ............................................................................................................. 64
7.1 Prenatal checkups ............................................................................................................................. 68
7.2 Birth planning & delivery .................................................................................................................. 72
7.3 Additional information about accessing services: transport and cost.............................................. 76
............................................................................................................................................................ 78
7.4 Post-delivery health status and care seeking ................................................................................... 78
Conclusion ................................................................................................................................................... 81
Reference List .............................................................................................................................................. 83
Annex 1 Questionnaire (English) ................................................................................................................. 87

v
Acronyms
ANC Antenatal Checkup
BDHS Bangladesh Demographic and Health Survey
FP Family Planning
HIES Household Income and Expenditure Survey
ICPC International Classification of Primary Care
IUD Intra Uterine Device
LMIC Low & Middle Income Countries
MNCH Maternal Neonatal and Child Health
MR Menstrual Regulation
PPI Progress out of Poverty Index
SCC Sylhet City Corporation
WHO World Health Organization

vi
Findings Overview Population and household characteristics & characteristics of survey respondents
In Sylhet City Corporation (SCC), average household size in poor urban settlements was 4.8 members,
slightly higher than the national average for urban areas. The study population also was younger than
the national average, a likely consequence of the relatively higher fertility rate in Sylhet Division. Eighty
percent of women reported age of marriage to be 19 years or less, and 60% reported having their first
birth before the age of 20. The sex ratio was 95 female per 100 male which is the reverse of the
national ratio of 0.95 male/female, and suggests a persistent female disadvantage.
Electricity and mobile phones were almost ubiquitous, 98% for men and 86% for women, although more
men had access to mobile phones around the clock. Very few, roughly 12%, of those who possessed
mobile phones, used them for health purposes.
Median household income in Sylhet’s poor urban settlements was 9000 taka (USD 141) per month which
is surpassed by a median consumption of 13,000 taka. These findings suggest that fifty percent of
households may be experiencing chronic debt. The majority of households living in these settlements
had a 30% likelihood of living under USD 1.25/day as per the Progress out of Poverty Index (PPI) scale.
However, were a health crisis to occur, even households at a moderate risk of poverty could be pushed
into poverty.
Among survey respondents approximately 42% had no education and only three-fifth had any
education, with a 33% primary level education. Slightly more women than men had completed primary
and secondary education, but more men completed higher secondary studies. Only 20% of women were
employed compared to 80% of men. Women typically worked as housemaids and men were involved in
rickshaw pulling, service jobs, and small business.
Knowledge and perceptions about health care service providers
Residents of poor urban settlements knew about surrounding health services from their own experience
and by word of mouth from family/friends/neighbors. Few women also reported community health
workers as a source of information on available health service providers.
They determined quality of healthcare providers based on considerations of affordability (either low
cost or free treatment) and treatment by qualified doctors. One-third of respondents noted good
behavior of healthcare providers as evidence of good service, and one-fifth emphasized the importance
of a provider’s patience in listening to their problems. Half of them believed government hospitals
provided quality services followed by doctor’s chambers and private hospitals.
Health problems and care seeking behavior
The prevalence of health problems was slightly higher in women than in men for both acute and chronic
conditions. More than one third of children under 5 and people aged 65 and above were suffering from
some kind of a health problem in the last 2 weeks (acute) from the survey. As for chronic health

vii
problems, prevalence increased with age, starting in the 30-39 year old age group. Nearly 2 out of 3
people in the oldest age group reported chronic health problems of some nature. The overall prevalence
of acute health problems across the study population was 27%, and 26% for chronic conditions.
Acute Health Problems
Across all age and sex groups, the most common types of acute health problems reported were of a
general/unspecified kind, such as fever and weakness, and respiratory symptoms. Women complained
more of neurological, musculoskeletal, and psychological health problems than men. Respiratory
symptoms were more of a problem in men than women. Other than the prevalent symptoms already
mentioned, children were reported to frequently suffer from skin and nutritional problems.
Three fourths of people suffering from acute health problems sought treatment; this included self-
treatment/home remedy. Rates of seeking care were nearly the same for both males and females.
However more women reported seeking care multiple times. Those not seeking treatment felt that the
health condition would resolve spontaneously.
By far care seeking from pharmacies was the most widespread, followed by government hospitals,
doctor’s chambers, and private clinics/hospitals. Public hospitals were frequented by men more than by
women whereas more women went to Doctor’s chambers and NGO clinics than men. In choosing a
health facility, proximity to their place of residence played the most important role. Other factors that
were considered in making decisions about where to seek care included whether or not the provider
was perceived to have special skills, gave effective treatment, or provided low cost services.
The average waiting time was the lowest, around 6 minutes, in pharmacies followed by NGO clinics. The
slowest service was reported in government hospitals where it typically takes 42 minutes on an average
to get services. More than half of the respondents said that they were fully satisfied with their
treatment and one-third of respondents were moderately satisfied. Overall, people who went to private
clinics were more inclined (80%) to go to the same facility in future. Seventy five percent of those who
visited a private doctor’s office (doctor’s chamber) said they would do so again.
Within SCC, a comparatively smaller city, the average time taken to reach a facility was less than 20
minutes and was mostly covered by foot or by rickshaw. Median cost for all subgroups was under 200
taka (USD 2.60), with most money spent on diagnostic tests (up to 600 taka) followed by
drugs/medicines and consultation fees. To pay for the costs of healthcare, most respondents spent their
household wages, suggesting high levels of out of pocket expenditures.
Chronic Health Problems
Shortness of breath or dyspnoea was the most frequently reported chronic health problem and was
more prominent in men, children and older age groups, although lower back pain was the most
prevalent complaint (13.5%) in the older group. Respondents had been experiencing these symptoms
for a mean duration of 41 months. On average, women were affected by chronic health problems 6
months longer than men, and also complained more about functional difficulty in daily activities from

viii
these conditions. In children, severe functional disability was quite rare, but 40% of all children up to 14
years experienced mild to moderate restriction in their daily activities.
People suffering from chronic health problems were more likely to seek treatment than those who were
suffering acute health problems. Almost 90% of respondents sought treatment at some point or other
and most of them went to a provider at least once a month.
Three out of five people sought treatment from qualified (MBBS) doctors and 26% visited a pharmacist
or a village doctor. The criteria on which their choice was based were effective treatment, low cost,
proximity to home, and qualified doctors in that order. Among those receiving treatment, lack of money
was frequently mentioned.
The mean monthly expenditure for chronic health problems was 445 taka (USD 6), and was the highest
among people aged 65 and above who paid up to 1200 taka. The median cost for healthcare during their
most recent visit to a healthcare provider was 400 taka, with older age groups spending somewhere
between 500 and 700 taka. Cost of drugs, tests and consultation fees added a considerable amount to
their expenses, with people aged 65 and above spending a median of 600 taka for drugs alone.
As for acute cases, costs for health care were made from regular household wages. However males
reported spending household wages more than females. Women reported paying for their treatment
with donations from neighbors more often than men.
Family planning and care seeking around pregnancy and delivery
Family Planning
Around 70% of all married women, pregnant or not, had ever used some sort of contraceptive. Common
reasons for discontinuation of a particular method ranged from side effects, switching to another
method, difficultly obtaining certain forms of contraception (injectable, IUD) or wanting children.
However at the time of the survey, only 66% of non-pregnant women were using some form of
contraception, with the greatest reported use in the 25-34 age group.
The most frequently currently used contraceptive method were pills followed by injectables. These were
either obtained from pharmacies or NGO clinics. Condoms were not commonly used. Reasons for not
currently using any FP method were cessation of menstruation (for reasons not specified), infrequent or
no intercourse, planning a pregnancy, and postpartum amenorrhea.
One in seven married female respondents reported having terminated an unplanned pregnancy at some
point in their lives. Almost half of respondents who ended an unplanned pregnancy reported using MR,
followed by an abortion (28.3%), and herbal medicine (12.3%).

ix
Pregnancy & delivery
Eighty percent of all women interviewed for the pregnancy and delivery module were married by the
age of 19, and almost 60% delivered their first child by this age. Out of every 10 babies delivered, there
was one stillborn. Twelve percent of women miscarried or experienced spontaneous abortions.
Of all the women who delivered in the previous year, only 65% wanted to conceive and the rest either
wanted to space the birth or did not want any more children indicating an unmet need for FP. More
than 80% of women reported getting a checkup during their gestational period at least once to assure
foetal wellness, confirm pregnancy or because they felt sick. Most women went to NGO clinics followed
by private and government hospitals.
Virtually all women had made some plans for their delivery although most were only about the place of
delivery, with 60% planning to deliver at home. Only three in ten women reported saving money for
their childbirth. Despite intentions to deliver at home, some 50% delivered in a facility such as
government hospital, NGO clinic and delivery centres of BRAC MANOSHI. Traditional birth attendants or
a relative attended almost half of all deliveries (49%), and doctors, nurses, and skilled birth attendants
attended 39% of the deliveries. The place of delivery/provider was chosen on the basis of multiple
factors such as proximity provider friendliness, and cost.
One-fifth of the women delivered by caesarean section due to a previous history of C-section,
malpresentation of the foetus, and premature rupture of the amniotic membrane. However, 95% of all
the women would not choose a C-section over normal delivery. Many women reported complications
after their delivery, mostly pain and fever, but around 15% also suffered from infections and anemia.
The assessment of cost of delivery included cost of transportation, actual cost of the procedure, bed fee,
if any, and any unofficial payments. Normal institutional deliveries cost 2,400 BD taka (approximately
USD 31) on an average, and women who delivered via C-section paid a mean amount of 17,000 BD taka.
To meet these expenses some women (40%) reported having to utilize household savings or requested
donations from a neighbor.

Chapter 1. Introduction
1.1 Background
Rapid, unplanned urbanization is a major concern in Bangladesh. Today, 80% of the world’s big cities
are located in developing countries and 60% of their inhabitants are “slum dwellers’ living in poor urban
settlements (1-3). Many poor urban settlements are considered ‘illegal’, without an official address and
are denied basic entitlements, including the right to access water, sanitation, education, and healthcare
(4). The urban population of Bangladesh now makes up 28.4% of the total population (5), and within
urban areas, approximately 35% live poor urban settlements. This proportion is increasing due to the
continued influx of migrants from rural areas seeking opportunity, or escaping poverty (over 1000 per
day in the capital, Dhaka). In 2012, the annual urbanization rate was 3.3% (6). If it continues at this rate,
the United Nations estimates that by 2050, 52% (101.4 million) of the total population will reside in
urban areas (7). While much is written about Dhaka as an emerging ‘mega-city’, the challenges of
urbanization and poverty that accompanies rapid, unplanned and unregulated urban growth,
manifested in poor health and sanitation practices, are insufficiently discussed. Beyond Dhaka city, the
fastest growing megacity in the world, Bangladesh’s other metropolitan areas also struggle with growing
urban poverty, as the following exploration of northeastern Bangladeshi city of Sylhet will demonstrate.
Sylhet is urbanizing and also underperforming in health: Sylhet City has a population of 647,583
(estimated in 2010), of which 27% are slum dwellers (8). Like the rest of the country, Sylhet is urbanizing
but Sylhet division continues to have the poorest health indicators in Bangladesh. Higher mortality for
both mother and child, and poor utilization of healthcare services still exist in Sylhet Division. However,
although there have been previous studies on health seeking behaviour in rural and urban populations
of Bangladesh (9-13), there is little information available for Sylhet Division, and a particular dearth of
information on the urban poor residing in Sylhet City. National surveys carried out in Bangladesh identify
that a significant number of women experience complications during pregnancy and childbirth,
however, only a small proportion report that they sought care from a medically trained provider in a
health facility (14-16). Preliminary findings from the most recent BDHS in 2011 reports that just 21 per
cent of women in Sylhet Division delivered in a health facility, lower than the national average of 29 per
cent (14). Medically trained personnel in Sylhet attend a slightly higher number of births (24%),
however, this too is lower than the national figure of 32%. These numbers represent the experience of
Sylhet’s population overall and do not begin to explain the experience of Sylhet’s urban poor.
There is little documentation regarding urban health and poverty in Sylhet. Indeed, research from Dhaka
suggests what it might be like for those living there. First, it is clear that the urban health advantage is
not equitably experienced in Bangladesh. Indeed, the situation in urban poor settlements is often
worse than in rural and non- poor settlements urban areas (17). For example, the mortality rate in
Bangladesh for children under the age of five is 65 per 1,000 live births but in urban poor settlements
(e.g., slums) it is approximately 81 (18). Similarly, neonatal and infant mortalities are higher in urban
poor settlements than in rural areas. Inequities are even greater within urban areas: the neonatal
mortality rate is 44 per 1,000 live births for urban poor settlements, and only 20 per 1,000 live births in

2
non-poor settlements areas; the infant mortality rate is 63 per 1,000 live births in urban poor
settlements compared to about 30 per 1,000 live births in urban non poor settlements areas (16, 18).
Moreover, two separate child mortality patterns have been identified in Bangladesh: one for urban
natives and another for rural-urban migrants, with higher under-five mortality among the latter group
(19).
Environmental conditions may exacerbate poor health in urban slums. Urban slum dwellers are
exposed to adverse environmental conditions such as overcrowding, poor quality drinking water and
sanitation, and lack of waste removal. Difficult living conditions and poor access to services in poor
settlements have resulted in limited health care use and hygiene awareness, lack of knowledge of the
origins of illness, inadequate food habits and breast feeding practices, and low acceptance of
vaccination (20, 21). A review of health services for people who live in informal settlements in Dhaka
city found that only 7.3% have access to a public health clinic (4). The confluence of these conditions in
poor settlements significantly impacts the effectiveness of both general and sexual and reproductive
health programmes to serve the urban poor.
In light of the poor health statistics and poor environmental conditions in which many of the urban poor
live, it is critical that health services be accessible. Despite being located in physical proximity to skilled
care facilities, nearly 80% of deliveries in poor settlements are conducted by neighbours or relatives in
the home, and only 13% of births are assisted by skilled attendants. Antenatal care (ANC) coverage is
55% in poor settlements, much lower than the 74% found in urban non-poor settlement areas.
Immunization coverage in urban poor settlements is also lower than the national and non-poor
settlements averages (22).
Barriers to health seeking are multi-faceted. In a study in Dhaka’s urban slums, Hussain and Hoque (10)
illustrated some economic and socio-cultural factors that impact the use of traditional and modern
delivery care. Factors that influenced use of traditional delivery care included: low household income,
high cost of care in hospital, illiteracy, large family size, reliance on traditional systems of care, lack of
knowledge about modern facilities, social taboos and traditional beliefs and little access to media and
family planning programmes (23).
What do we know about health-seeking in Sylhet? Existing literature provides some insight into health-
seeking in Sylhet, but gaps exist – particularly for the urban population. Kalim et al. (2007) found that
women in rural Sylhet were more inclined to call a health service provider, whether medically or
traditionally trained, to their home rather than to be transported to a facility (18). Similarly, Moran et al.
(2007) outlined three health-seeking behaviours commonly seen relating to obstetric complications in
Sylhet District; (i) sending a family member to purchase treatment to administer in the home; (ii)
sending for a provider to treat the woman in the home; and (iii) taking the woman outside the home to
a facility or provider’s office (12). With informal providers currently making up 95% of the total health
workforce in Bangladesh (24), the issues around providing adequate coverage for sexual and
reproductive health needs in urban slum populations are even more complex.
3
1.2 Justification This report considers health seeking patterns among the urban poor of Sylhet City and seeks to fill gaps
in knowledge about the behaviours of all demographic groups, including adolescents and older men and
women. Information available on health seeking behaviour among the urban poor has previously
focused on maternal and neonatal morbidities and mortality. There is a relative lack of specific
knowledge on the behaviour of adolescents in poor settlements in relation to accessing family planning
or reproductive health services. There is also limited evidence on the health seeking behaviour and
needs of older men and women beyond the reproductive age. Thus, the objectives of this study are as
follows:
1.3 Objectives To explore age and gender differences in health care seeking among the urban poor in Sylhet;
To identify where and from whom the urban poor seek treatment;
To describe factors influencing choice of treatment;
To explore perceived quality of care and its influence on health seeking behavior;
To identify barriers to formal care seeking.
1.4 Methods
1.4.1 Study design
To fulfill these objectives, the research team employed a two-stage cluster sampling approach to
identify poor urban households. Respondents in different age/sex categories were selected to create
age/sex homogenous groups. Structured questionnaires were developed to ask questions about health
seeking among these groups.
1.4.2 Sample selection and size
Study participants were selected using a two-stage cluster sample of poor households (HHs). The
research team identified these households using secondary data from the BRAC Manoshi program,
which identifies poor households using specific targeting criteria, and separates them into three
geographic zones under their three branch offices. The program updates this list quarterly through a
program-specific census.
Within these 3 zones, 189 designated community health workers (CHW) are assigned to approximately
200 HHs each. Each 200 HH catchment area was considered a cluster. Clusters were randomly selected
(30 clusters out of 189 of the survey with 10 clusters in each zone). Each HH had 5 members, on average
(25), resulting in a total population of 30,000. Later in the survey, 9 additional clusters were added to
the sample in light of insufficient available respondents in certain age categories.
Eligibility to participate was determined based on sex, age, and specific health experiences or care
seeking behaviors (Table 1). Field teams visited each HH in each cluster and gave each HH a unique
identifier number. Within each HH, HH members’ age, sex, experience of any illness in the last three
months and whether the illness was acute or chronic, was recorded. All household members above 14
years of age with acute or chronic health problems, with the exception of acoustically, visually, speech,

4
and mentally disabled persons, were eligible to be interviewed and were included in the sampling
frame. Mothers of children under 15 were interviewed as their guardians. Teams created sampling
frames based on age, sex and module-specific lists of all possible eligible respondents, from which
respondents were randomly selected.
Sample size for each group was deduced using existing population statistics from the Bangladesh Urban
Health Survey (BUHS), 2006. Sample Statistics on the prevalence of serious illness were used to calculate
sample size in most groups (16). For children under 5, however, the prevalence of care seeking for Acute
Respiratory Infection (ARI) was used to calculate the sample size from the same source. Because no
pertinent data was available for children and adolescents aged 6-14, 50 percent was employed to give
the maximum sample size.
For Family Planning and Pregnancy and Delivery modules calculations were made separately using
contraceptive prevalence rates and rate of care seeking for maternal complications, respectively. For the
latter module (Pregnancy and Delivery), care seeking for maternal complications yielded the largest
sample size compared to rate of facility delivery, or delivery by skilled attendant, and was therefore
applied.
The following table (Table 1.1) shows the sample sizes calculated using the formula n= z2 pq/d2. The
prevalence of serious illness was used for men and women to calculate the sample size in these 2 groups.
Proportions of men and women in each of age group of interest i.e. 15-49 and 50 years and above were
then applied on the computed number to find the sample size in those groups. For example, the
calculated sample size for men was 396. In BUHS 75% of the men who had serious illness were between
the ages of 15-49. Hence, our sample size for this group was 75% of 396 i.e. 296. This allowed us to
investigate the prevalence of health problems and seeking pattern for each group.
In each group, 50% of the sample received the chronic illness questionnaire and the other 50% received
the acute illness questionnaire. Extending the previous example, among the 300 men aged 15-49 in the
sample, 150 were interviewed for acute health problems and 150 were interviewed for chronic health
problems.

5
Table 1.1 Sample size calculation
Respondents Indicator (Z/d)2 p q= (1-p) n Deff
(1.5%)
10% non-
response rate
Men
Serious illness in previous year 1536.6 0.2 0.8 240 360.4 396
15-49 yrs (75%) 295
50 years and above (25%) 75
Child ARI care seeking (under 5) 1536.6 0.4 0.6 372 557.6 613
6 to 14 1536.6 0.5 0.5 384 576.2 634
Women
Serious illness in previous year 1536.6 0.3 0.8 261 391.6 431
15-49 yrs (72%) 312
50 years and above (28%) 86
Care seeking for maternal
complications 1536.6 0.5 0.5 384 575.3 633
CPR in 15 -49 yrs 1536.6 0.5 0.5 383 573.9 631
Total 3280
In the table above, the numbers in bold were added to find the total sample size. The total sample size
thus calculated was 3280. However, the actual interviews performed exceeded this number as for each
module, the calculated size was equally divided across each cluster.
1.4.3 Data collection instrument
Questions in the study instrument were designed to be comparable to existing healthcare seeking
behavior items from the Bangladesh Urban Health Survey, Bangladesh Demographic and Health Survey,
Households Income and Expenditure survey and Smiling Sun survey. The survey instrument also
included a slightly modified version of the play-performance scale developed by Lanksy et al (26) to
assess perceived severity of children’s health problems by parents. The Progress of Poverty Index ® (PPI)
tool 1 by Grameen Foundation was used to assess HH socio-economic status.
The final questionnaire featured six modules (Annex 1). Table 1.2 displays questionnaire modules, types
of respondents and descriptions. Once the questionnaire was prepared it was digitized using MySQL,
which generated automated skip patterns. The digital questionnaire was uploaded into Samsung Galaxy
Tab 3. Digital data collection was expected to reduce human errors in following skip patterns and reduce
study duration by excluding the data entry phase during which errors often occur. Additionally, the GIS
functionality of the tabs enables us to link the data from this study with a facility mapping effort, and
perform additional analyses such as calculating actual distance of the sample from a given health facility.
1 More information at http://www.progressoutofpoverty.org/

6
Table 1.2: Different modules of the survey instrument
Sl. Module name Respondents Description
1 Household Household head/ adult with knowledge of the household matters
Basic information (age, sex, education, employment status, relationship with the head) on all regular members of the household; household characteristics only required in PPI and some household possessions. Housing characteristics as such was not recorded.
2
Healthcare seeking for acute health problems
Adult males, adult females, elderly male, elderly female, under 5 children, children aged 6-14 years
Types of health problems suffered in the previous 2 weeks and related healthcare seeking patterns. For child groups, mothers of the selected children are interviewed.
3
Healthcare seeking chronic health problems
Adult males, adult females, elderly male, elderly female, under 5 children, children aged 6-14 years
Types of health problems respondents are currently suffering that have lasted 3 months or more and related care seeking patterns. For child groups, mothers of the selected children are interviewed.
4 Family planning
Married women 15-49 years of age
Contraceptive use behavior of married couples of reproductive age. Only women are interviewed.
5 Pregnancy and delivery
Married women 15-49 years who have given child birth in the past one year from survey
Care seeking pattern during pregnancy and childbirth. To avoid recall bias only women with children under 1 year of age are interviewed.
6 Individual respondent
All respondents in 2,3,4,5, except children
Detailed background information of each respondent.
1.4.4 Data collection & entry
A field team of 50 staff was responsible for data collection, including 44 research assistants and 6
supervisors. Investigators organized a rigorous 14-day training session consisting of two parts: 1)
Understanding the objectives and questions of the survey instrument and 2) Developing skills in
operating tablet computers for the purpose of data collection. Following training, the field team
conducted pre-tests in Gazipur for 2 days. Feedback was collected and the questionnaire was modified
accordingly.
Data collection started with household listing commencing on the last week of June 2013 that took 3
weeks to complete. Twenty-two teams (2 persons per team) conducted the interviews. Supervisor
responsibilities included helping teams to build rapport with the community, monitoring interviews,
reviewing filled questionnaires for mistakes and inconsistencies, and communicating with the principal
investigators. When inconsistencies were identified, field teams were asked to contact the respondent
and recheck the details. When respondents were absent, field teams revisited or established a mutually
agreeable time for the visit via telephone. Once the supervisors were satisfied with the collected data

7
they were transferred to a central database for data storage. A total of 3600 interviews were completed
by November 2013.
The completed questionnaires were uploaded to a central server from where an in-house data
management team processed them through editing, coding of open-ended questions and editing
inconsistencies. Data cleaning and analysis was done using SPSS v.20 and STATA 10.
Figure 1 Our team at work

8
1.4.5 Challenges in fieldwork
Several factors impeded data collection:
High levels of migration made it difficult to find some respondents.
Eid holidays disrupted data collection as respondents returned to their villages for holidays.
Respondents were hesitant to sign the informed consent form. This concern related to
insufficient understanding of why a signature was necessary. It did not reflect a fear of
answering questions.
Strikes (hartals) limited field teams’ mobility.
Tablets did not support GIS to the desired accuracy.
1.4.6 Data analysis
After cleaning, the data set was transferred from SPSS to STATA v.12. For the purpose of this report
simple descriptive, univariate analysis is employed. Each result is accompanied by a 95% confidence
interval to indicate accuracy.
Progress out of Poverty Index ® (PPI) scores, a proxy for SES, were collapsed into quintiles and averaged.
The proportion of households in each quintile was calculated, as well as the proportion falling under 2
poverty lines i.e. national upper and USD 1.25/day lines.
Data has been weighted to reflect the likelihood of selection at each stage of sampling (see below). All
statistics, henceforth, represent the weighted data. Missing values are not presented in cross-tab
analysis as they were low (<2% for each variable) unless indicated otherwise.
Weighting process:
Sampling weights are adjustment factors applied to each case to adjust for differences in the probability
of selection and interview between cases in a sample. Due to the non-proportional allocation of sample
and the differences in response rate in our study, sampling weights were required for analysis to ensure
the representativeness of the survey result at the national level.
The study used a two-stage cluster sampling; sampling weight was calculated based on the sampling
probability separately for each sampling stage and cluster. The following notations were used:
Let,
P1: The first stage sampling probability of selection for each sampled cluster
P2: The second stage sampling probability of selection for each individual in each of the sampled cluster.
a= number individual/household in each cluster
b= total individuals/households in all clusters
c= number individuals/household sampled pre cluster
d= number sampled clusters (39)

9
Here,
𝑃1 =(𝑎×𝑑)
𝑏 and 𝑃2 =
𝑐
𝑎
So the overall selection probability of each cluster was the product of the two stages of selection
probabilities: 𝑃 = 𝑃1 × 𝑃2
The sampling weight:
𝑊 =1
𝑃
A spreadsheet containing all sampling parameters and selection probability was prepared to facilitate
the calculation of the sampling weight adjusted for household and individual non-responses (here non
responses rate is 1) to get the final sampling weight for each household, male and female in the sample.

10
Chapter 2. Population and household characteristics
This chapter gives an overview of the study population’s demographic characteristics including age and
sex and socioeconomic characteristics. Socioeconomic status has been defined in terms of the
assessment of household assets such as electricity, TV, radio, mobile phone, vehicle etc., and the
Progress out of Poverty Index ® (PPI) scoring system (see Data Analysis section).
A household has been defined as a group of people, related or unrelated, who share the same dwelling
unit and meals. Shared accommodations such as hostels/mess were also included. Household members
are those who have been living in the dwelling for more than 2 weeks. If any member has been away for
more than six months at a stretch they have been excluded during listing.
2.1 Household population A total of 7,742 households and 37,101 members were listed in the 39 clusters. Weighted values are
41,564 and 199,794 respectively. Those living in shared accommodation (mess) constituted less than 2%
of the total population and hence are not analyzed separately (Figure 2).
Key Findings:
Average household size was 4.8 members
Almost 90% were male headed households
Average income per household was 11000 BDT (~USD 141)
Only 60% of households owned a television
86% of households owned a mobile phone
Health-related expenditures comprised 11% of overall mean household expenditure
26% of all households in the poor urban settlements were living below the upper
national poverty line and 36.5% were living below $1.25 per day
One-third of under-5 children and aged people above 65 years report suffering from
acute health problems
66% of the population aged 65 years and above report chronic health problems of
some nature

11
Figure 2 Types of households in the poor urban settlements of Sylhet City Corporation
Among all the individuals listed, 51% were male and 49% were female (or 95 female per 100 male).
Thirty-eight percent of the population was under 15 years of age; 50% was comprised of those aged 15-
49 and just 10% were 50 years and above (Table 2.1). Poor settlements of SCC had a younger population
than the national average: nationally, 35.3% of the population was below the age of 15 in 2011 (27),
while in our sample 38% were under the age of 15- unchanged from 2004 BDHS results (28), and
suggestive of a persistently higher fertility rate in this area of Bangladesh.
As seen in Table 2.2, 89% of households are headed by men compared to the 11% by women which is
similar to figures reported in BDHS 2011 (27). Almost 65% of households consisted of 3-5 members,
with 4.8 members on average which is larger than 2011 figures from BDHS for both rural (4.7) and urban
(4.4) areas (27).
Family98%
Mess1.8 %
Missing0.2%

12
Table 2.1 Household population by age and sex
Age Male Female Total
a B c a b c a b c
under-5(59m) 12.1 12,429 2,334 12.3 11,963 2,269 12.2 24,393 4,603
5-14 Years 25.7 26,319 4,986 25.8 25,166 4,708 25.8 51,485 9,694
15-19 Years 9.6 9,832 1,839 9.6 9,389 1,741 9.6 19,221 3,580
20-24 8.0 8,222 1,514 11.0 10,749 1,976 9.5 18,971 3,490
25-29 9.3 9,558 1,768 10.5 10,214 1,875 9.9 19,772 3,643
30-39 15.0 15,374 2,833 13.6 13,288 2,442 14.3 28,662 5,275
40-49 9.7 9,907 1,813 7.8 7,630 1,425 8.8 17,538 3,238
50-64 7.6 7,741 1,421 6.8 6,593 1,176 7.2 14,333 2,597
65 & above 2.9 2,955 540 2.5 2,465 441 2.7 5,420 981
Total 100 102,337 19,048 100.0 97,457 18,053 100.0 199,795 37,101
a- Weighted Percentage, b- Weighted Number, c- Unweighted Number
Table 2.2 Household composition: sex of household head and size of household
Characteristics Weighted percentage [ 95% CI] Weighted number Unweighted number
Household head
Male 88.6 [87.9, 90.0] 36,807 6,856
Female 10.7 [10.0, 12.1] 4,472 833
Missing 0.7 [0.5, 0.9] 285 53
Number of members
1 1.4 [1.1, 1.8] 592 109
2 7.1 [6.3, 7.9] 2,941 550
3 16.4 [15.4, 17.5] 6,817 1,280
4 24.2 [22.8, 25.7] 10,050 1,836
5 20.5 [19.4, 21.6] 8,492 1,595
6 14.0 [13.2, 14.8] 5808 1,099
7 7.4 [6.8, 8.0] 3,058 569
8 3.9 [3.4, 4.5] 1,627 307
9+ 5.2 [4.3, 6.2] 2,140 389
Missing 0.1 [0.1, 0.2] 39 8
Total 100 41,564 7742
Mean size of households 4.8

13
Tables 2.3 a & b provide information on the marital status of the survey population. Marital patterns
reflect national statistics. More women at younger age were married than men; nearly 30% of women
aged 15-19 were currently married and 77% aged 20-24 were ever married, whereas a substantial
proportion of men were married only at the ages of 25-29. This is also the case nationally as husbands
are generally older than wives (27). In the 30-39 year old age group, more than 90% of the population
were currently married, however, unlike men, this proportion declined among women in older age
groups as more women were widowed. Although negligible, more proportions of women reported being
separated, divorced or widowed at all ages than men.
Table 2.3-a Marital status of the household population in SCC poor urban settlements (male)
Age Currently married Separated Divorced Widowed Unmarried Total no.
under 5 -- -- -- -- 100 12,429
5-14 -- -- -- -- 100 26,319
15-19 2.1 [1.4,3.4] 0.1 [0.0,0.5] 0.3 [0.1,1.1] 0.1 [0.0,0.7] 97.3 [95.9,98.2] 9,832
20-24 29.5 [25.3,34.0] 0.3 [0.1,0.8] 0.2 [0.1,0.7] -- 70.1 [65.6,74.2] 8,222
25-29 67.2 [63.2,71.0] 0.3 [0.1,0.7] 0.3 [0.1,0.7] 0.2 [0.1,0.6] 32.0 [28.3,36.0] 9,558
30-39 91.8 [89.8,93.4] 0.3 [0.2,0.7] 0.2 [0.1,0.4] 0.1 [0.0,0.3] 7.6 [6.0,9.6] 15,374
40-49 96.8 [95.9,97.5] 0.3 [0.1,0.8] 0.1 [0.0,0.6] 0.5 [0.3,1.0] 2.3 [1.6,3.2] 9,907
50-64 96.4 [95.1,97.4] 0.3 [0.1,0.9] 0.2 [0.0,0.7] 2.6 [1.6,4.0] 0.5 [0.3,1.1] 7,741
65 & above 92.6 [89.4,94.9] 1.0 [0.4,2.5] -- 6.1 [4.1,8.9] 0.4 [0.1,1.3] 2,955
Total 42.0 [41.1,42.9] 0.2 [0.1,0.3] 0.1 [0.1,0.2] 0.5 [0.3,0.6] 57.2 [56.4,58.1] 102,337
Table 2.3-b Marital status of the household population in SCC poor urban settlements (female)
Age Currently Married Separated Divorced Widowed Unmarried Total #
under 5 -- -- -- -- 100 11,963
5-14 -- -- -- -- 100 25,166
15-19 28.2 [24.2,32.6] 1.1 [0.6, 2.1] 0.4 [0.2, 0.8] 0.1 [0.0, 0.5] 70.2 [65.5 74.5] 9,389
20-24 74.1 [69.6,78.1] 2.3 [1.6, 3.3] 0.7 [0.3, 1.4] 0.3 [0.1, 0.7] 22.7[18.7, 27.3] 10,749
25-29 90.3 [88.3, 91.9] 2.7 [1.9, 3.7] 0.5 [0.3, 1.0] 1.1 [0.6, 1.9] 5.5 [4.1, 7.3] 10,214
30-39 90.7 [89.0, 92.3] 3.1 [2.4, 4.0] 0.7 [0.4, 1.2] 3.7 [2.8, 4.9] 1.8 [1.2, 2.6] 13,288
40-49 78.7 [75.8, 81.4] 4.9 [3.3, 7.2] 1.4 [0.9, 2.4] 13.7[11.8, 16] 1.2 [0.7, 2.1] 7,631
50-64 55.0 [51.6, 58.3] 3.9 [2.7, 5.6] 0.4 [0.1, 1.2] 39.7[37.0,42.4] 1.1 [0.6, 2.2] 6,593
65 & above 19.7 [13.1 28.5] 1.1 [0.5, 2.6] -- 76.9[67.9,84.0] 2.3 [1.0,5.2] 2,465
Total 43.1 [42.3 43.9] 1.7 [1.4, 2.1] 0.4 [0.3, 0.5] 6.4 [5.7, 7.1] 48.4[47.4,49.4] 97,458

14
Table 2.4 presents the health status of individuals from 7,742 listed households in the 39 clusters
selected for study. Analysis was done on weighted data. Although not designed to estimate the
prevalence of disease, the listing level data provides an indication of the proportion of people reporting
health problems for 2 weeks or more. The rate of reported health problems was seen to be slightly
higher in women than in men for both acute and chronic conditions. More than one third of children
under 5 and people aged 65 and above reported some kind of a health problem in the 2 weeks
preceding the survey. This is close to the scenario in Dhaka slums where 38% of the under 5 children
were found to be suffering from fever even after an MNCH intervention program of five years (29).
Chronic health problems were more common with increasing age, and nearly 2 out of 3 people in the
oldest age group reported experiencing chronic health problems of some nature.
Table 2.4 Percentage of people with acute and chronic health problems in SCC poor urban settlements
Background characteristics Health problems Total number
Last 14 days [95% CI]
3 months or more [95% CI]
Sex
Male 25.6 23.3 19,048
Female 28.1 29.3 18,053
Age
under 5 39.8 11.5 4,603
5-14 21.2 11.2 9,694
15-19 20.0 15.9 3,580
20-24 24.0 21.9 3,490
25-29 25.9 29.7 3,643
30-39 27.8 38.4 5,275
40-49 30.5 47.9 3,238
50-64 30.9 56.6 2,597
65 and above 31.4 65.7 981
Total 26.8 26.2 37,101
2.2 Household assets and socioeconomic status The relationship between household durable goods and health is well established in the literature (27).
Analysis of weighted asset data was performed on 2709 households. Table 2.5 shows that electricity was
almost universally present. Televisions were present in 6 out of 10 households, while radios were less
commonly found. Eighty-six percent of sampled households possessed mobile phones. Only 11% of
households possessed personal transport, such as bicycles and rickshaws/vans, and only a few had
automobiles.

15
Table 2.5 Percent distribution of households by household possessions* (n= 41,570)
Possessions Household
Weighted Percentage Weighted number Unweighted number
Electricity 97.6 40,580 2,647
Radio 3.2 1,309 85
Television 58.9 24,491 1,568
Mobile 86.1 35,775 2,310
Refrigerator 15.9 6,609 393
Bicycle 11.7 4,876 301
Motorcycle 3.3 1,362 79
Car or truck 0.7 294 16
Rickshaw or van 11.3 4,701 303
DVD player 13.6 5,651 356
*multiple responses
Information on overall household monthly income (including wage/salary, rent, and remittance) and
consumption data was recorded to ascertain the economic status and living standard of the urban poor
in SCC. Figure 3 shows the mean and median income of the households. Average household income
among residents of poor urban settlements was nearly 11,000 taka and the median income was 9000
taka. This is equivalent to a mean of USD 141 per household per month or USD 4.70 per day and,
considering an average of 4.8 members per household (see the next subsection), is equivalent to USD
0.98 (~1) per capita/day.
Figure 3 Monthly income of the surveyed households (n=41,570)
However income alone does not provide a good measure of living standard especially for the poor as it
is subject to seasonal variation (30). Information was collected on various categories of expenditure a
household generally makes according to the typical timeframe of each expenditure i.e. daily for food,
weekly for transport and mobile bills, monthly for rent, utilities, and education, or year for clothing,
furniture, miscellaneous events such as weddings, health emergencies, then standardized into monthly
expenses.
10726
9000
5000
6000
7000
8000
9000
10000
11000
Mean Median
Inco
me
in B
DT

16
Table 2.6 shows the distribution of monthly household expenditure by category. The denominator for
the mean and median for each item came from the households who reported expenses in that category
and the overall expenditure is for all the expenses mentioned by all the households. The total median
expenditure is slightly higher than the median income of the urban poor in SCC suggesting that over half
of these households are in a situation of chronic debt. The highest expenditures were made on food,
which constitute half of total household expenditure. Almost half of the households were repaying
loans at a monthly rate of 3400 taka on an average. Expenditure on health comprised 11% of the overall
mean expenditure or 8% of their median expenditure.
Table 2.6 Monthly household expenditure in BDT in SCC poor urban settlements
Expenditure composition Mean Median Total households
Transport 1,483 1,200 27,648
Food 7,659 6,400 41,570
Loan 3,392 2,000 19,476
Education 1,179 700 23,672
Health (regular) 696 500 36,145
Health (incidental)* 1,022 535 37,494
Utility 867 600 21,797
Mobile 532 400 36,065
Clothing 540 416 40,310
Miscellaneous 837 300 25,137
Overall expenditure 15,472 12,983 41,570
% household expenditure on health
11.1% 7.9% 41,570
*Information for last one year was taken and converted to monthly expenses.
The Progress out of Poverty Index (PPI)2 is a simple low cost poverty measurement tool that computes
the likelihood that a household is living below the poverty line based on a few key indicators that
together comprise a country specific scorecard.
Various levels of poverty were apparent in poor urban settlements in Sylhet City Corporation (SCC). A
total of 2772 households scored between 0 and 19 on the PPI scorecard (Table 2.7) suggesting that 76%
of households had a likelihood of falling under the national poverty line and 86% lived on less than $1.25
per day. Around 50% of households (12,042) had a moderate likelihood of falling under the national
poverty line and a daily expenditure of below $1.25. Ten percent of households (11,239) had scores
between 60 to 100, and a 10% odds of ending up below the poverty line. The Poverty Rate was
calculated by averaging all poverty likelihoods, revealing that 26% of all poor urban households were
living below the upper national poverty line and 36.5% were living below $1.25 per day.
2 More information at http://www.progressoutofpoverty.org/

17
Table 2.7 Percent of households in each PPI score categories and likelihood of falling below poverty line
of the households
PPI Score categories
No. of households (a)
Poverty likelihood
National Upper poverty line (%) (b)
Total household under the upper
poverty (a*b/100)
$1.25/day 2005 PPP (%) (c)
Total household under $1.25/
(a*c/100)
0-19 2,772 75.6 2,096 85.8 2,378
20-39 12,042 46.3 55,756 61.5 7,406
40-59 15,512 17.9 2,777 29.4 4,560
60-79 9,587 3.8 3,647 8.2 786
80-100 1,652 0.3 5.0 1.7 28
Total 41,565 10,817 15,159
Poverty rate (% hholds below the poverty line) 26% 36.5%
Figure 4 Percentage of households by PPI Score
The chart above (figure 4) shows how households in poor urban settlements are distributed on the PPI
scale from 0 to 100. The majority of households scored between 40-59 which corresponds to 18% to
30% probability of poverty. This essentially shows not all residents of poor urban settlements are in
abject poverty. It remains, however, that these sit on the borderline, and might easily be pushed below
the poverty line were a catastrophic health event to occur.
0
5
10
15
20
25
30
35
40
0-19 20-39 40-59 60-79 80-100
% o
f h
ou
seh
old
s
PPI ScoreExtreme poor Non-poor

18
Chapter 3. Survey Respondents
This chapter provides information on respondents for all the modules except for children aged 0-14
years (acute and chronic). Since mothers acted as respondents for their children, it was possible that
one woman could be selected for two interviews, one for herself and one for her child. Therefore, to
avoid duplication, we excluded respondent information when analyzing child health related modules.
3.1 Characteristics of survey respondents A total of 2,368 (36,216 when weighted), 445 males and 1,923 females, were interviewed for various
modules. There were more females respondents due to additional women-specific modules on family
planning and pregnancy.
Basic characteristics of respondents are presented in Table 3.1. Over 80%, of the respondents were
currently married. There were more never married men (15%) than women (2%). Forty-four percent
men and 41% women had no education, which is higher than the national level for poor urban residents
reported in the latest Urban Health Survey (31), and only 33% of all respondents had primary level
education. However, more men continued their education to the secondary level than women. Most
were Muslim and a quarter of them were Hindu. Only 20% of women were employed compared to 80%
of men. More details on employment are presented in the next subsection.
Key Findings:
Only 33% of all respondents had primary level and 25% had secondary or higher level
education
Over 40% had no education. Slightly more proportion of men were illiterate compared
to women but more men completed secondary level
Above 80% of men were working at the time of the survey, with rickshaw pulling and
service constituting the most common forms of employment
Far fewer women were employed (20%), and mostly as housemaids
People knew about nearby health facilities from their own experience or from
neighbors.
Nearly half of the respondents regularly watched television
66% of the respondents had access to mobile phones 24/7, but access was less for
women than men
Only 10% used mobile phones for health advice

19
Table 3.1 Background characteristics of respondents
Male Female Total Weighted
Percentage Weighted Number
Unweighted Number
Weighted Percentage
Weighted Number
Unweighted Number
Weighted Percentage
Weighted Number
Unweighted Number
Marital status
Currently Married 81.9 5,514 361 89.2 26,300 1,715 87.8 31,814 2,076
Separated -- -- -- 0.6 177 12 0.5 177 12
Deserted -- -- -- 0.5 147 10 0.4 147 10
Divorced 0.1 7 1 0.3 88 6 0.3 95 7
Widowed 1.5 101 8 6.6 1,946 127 5.6 2,047 135
Remarried 1.3 88 6 0.6 177 12 0.7 265 18
Never married 15.2 1,023 69 2.2 649 42 4.6 1,672 111
Education
None 44.4 2,988 198 41.3 12,168 825 41.8 15,156 1,023
Primary 30.4 2,044 134 33.4 9,846 635 32.8 11,890 769
Secondary 19.4 1,305 92 22.1 6,517 408 21.6 7,822 500
Higher Secondary 4.4 299 16 2.5 750 45 2.9 1,049 61
Graduation 1.1 72 4 0.7 203 10 0.8 275 14
Post-Graduation 0.4 25 1 -- -- -- 0.1 25 1
Religion
Islam 84.6 5,699 384 83.1 24,512 1,639 83.4 30,211 2,023
Hinduism 15.0 1,010 59 16.7 4,923 280 16.4 5,933 339
Buddhism -- -- -- 0.0 11.3 1 0.0 11 1
Christian 0.4 23.5 2 0.1 38 3 0.2 62 5
Employment
No 16.6 1,118 80 80.4 23,693 1,533 68.5 24,811 1,613
Yes 83.4 5,615 365 19.6 5,791 390 31.5 11,406 755
Total 100 6,733 445 100 29,484 1,923 100 36,217 2,368

20
3.2 Employment and occupation Questions on employment were asked in a manner that captured both primary and secondary
occupation (Table 3.2). Female participation in the labor force was minimal with only 20% reported
doing work of some nature. The unemployment rate was almost 20% higher than recent statistics on
slum women reported in the Urban Health Survey (31). This could be due to the fact that Sylhet is a
more conservative region of Bangladesh. Eighty percent of men were working at the time of the survey
and 5% were engaged in more than one job.
Table 3.2 Employment and job status of survey respondents
Status Male Female Total
a b c a b c a b c
Employment
Unemployed 16.6
[13.5,20.3] 1,118 80 80.4
[76.9,83.4] 23,693 1,533 68.5
[65.7,71.2] 24,811 1,613
Employed 83.4
[79.7,86.5] 5,614 365 19.6
[16.6,23.1] 5,791 390 31.5
[28.8,34.3] 11,405 755
Total 100 6,733 445 100 29,484 1,923 100 36,217 2,368
Number of Jobs
1 95.7
[93.1,97.4] 5,374 346 87.1
[79.0,92.3] 5,043 348 91.3
[87.7,94.0] 10,417 694
>1 4.3
[2.6,6.9] 240 19 12.9
[7.7,21.0] 748 42 8.7
[6.0,12.3] 988 61
Total 100 5,614 445 100 5,791 390 100 11,405 755
a: Weighted percentage (CI] ,b: Weighted number, c: Unweighted number
Table 3.3 Characteristics of respondents employed at the time of the survey
Background characteristics
Male Female
a [95% CI] b c d e a [95% CI] b c d e
Age
15-19 81.9 [67.2,90.9] 585 41 715 50 18.1 [11.0,28.1] 386 23 2,137 150
20-24 88.4 [68.3,96.4] 424 27 480 30 10.8 [7.8,14.7] 690 48 6,414 422
25-29 91.3 [83.6,95.6] 1,407 88 1,541 99 19.4 [15.0,24.7] 2,161 144 11,143 719
30-39 92.2 [85.5,96.0] 1,449 93 1,572 102 29.6 [24.0,35.8] 1,602 109 5,412 350
40-49 93.8 [85.7,97.5] 998 65 1,064 71 26.2 [18.4,35.8] 627 45 2,396 152
50-64 70.1 [52.9,83.0] 506 35 723 51 18.3 [11.0,28.8] 217 15 1,186 77
65 and above 38.2 [23.9,55.0] 245 16 639 42 13.5 [5.7,28.8] 107 6 796 53
Education
None 82.5 [76.5,87.2] 2,464 160 2,044 198 26.3 [22.0,31.0] 3,201 217 12,168 825
Primary 85.6 [80.0,89.8] 1,749 113 2,044 134 14.7 [11.8,18.2] 1,448 103 9,846 635
Secondary 79.8 [69.3,87.4] 1,042 73 1,305 92 13.6 [9.63,19.0] 889 55 6,517 408
Higher Secondary 87.7 [58.4,97.3] 262 14 299 16 25.5 [16.0,38.2] 192 12 750 45
Graduation 100 72 4 72 4 30.4 [9.5,64.5] 62 3 203 10
Post-Graduation 100 25 1 25 1 -- -- -- --
Total 83.4 [79.7,86.5] 5,614 365 6,733 445 19.6 [16.6,23.1] 5,791 390 29,484 1,923 a: Weighted percentage ,b: Weighted number employed, c: Unweighted number employed, d:Total Weighted, e:Total Unweighted
The nature of work by gender is displayed in table 3.4. Men were mostly engaged in rickshaw pulling,
service, and small business. Around 13% were skilled laborers and another 10% owned a medium scale

21
business. Women, on the other hand, reported working as housemaids most of the time, followed by
service and day laborer. A few women also reported being involved in some kind of small business.
Table 3.4 Primary Occupation of the respondents with 95% CI
Profession Male [95% CI]
(n=5614) Female [95% CI]
(n=5791) Total [95% CI]
(n=11405)
Night guard/security guard/peon/housemaid (bua) 3.5 [1.8,6.7] 46.2 [38.0,54.7] 25.2 [19.4,32]
Rickshaw/van puller 18.7 [14.2,24.3] -- 9.3 [6.9,12.5]
Service (contractual/fixed) 15.6 [11.4,20.9] 17.5 [11.6,25.6] 16.6 [12.6,21.4]
Small business (handicraft, tea stall owner, hawker) 14.4 [10.0,20.4] 9.9 [6.5,14.9] 12.1 [9.0,16.2]
Skilled labor (mason/painter/electrician) 13.2 [9.5,18.0] 4.9 [2.9,8.4] 9.0 [6.5,12.5]
Business (grocery, stationary, electronics, cosmetics, cloth store, pharmacy, land lord)
10.2 [6.8,15.0] 1.9 [0.7,5.3] 6.0 [3.8,9.3]
Day labor 8.6 [5.8,12.4] 10.6 [6.7,16.3] 9.6 [6.9,13.2]
Motorized transport worker (bus/truck/taxi/CNG/easy bike, etc ) 7.2 [5.1,10.1] -- 3.5 [2.4,5.1]
Student 4.6 [2.9,7.3] 5.1 [3.3,7.9] 4.9 [3.6,6.5]
Sales man/woman 1.8 [0.8,4.1] 0.8 [0.3,2.3] 1.3 [0.6,2.7]
Garments/factory/hotel worker 0.7 [0.2,2.8] 1.3 [0.4,3.7] 1.0 [0.4,2.3]
Agriculture/farming/fisherman/boat man 0.7 [0.2,2.9] -- 0.3 [0.1,1.4]
Other 0.7 [0.2,2.3] 1.7 [0.6,4.3] 1.2 [0.5,2.8]
3.3 Knowledge and perceptions about health care service providers Respondents were asked about their knowledge regarding formal health facilities or providers within 1
km of their residence. Around 66% men and women knew about surrounding health care providers and
mostly based on “their own experience”. Word of mouth from family/friends/neighbors was the source
of information for over 70% of respondents. More women than men (8% vs. 20%), reported heath
workers as a source of knowledge (Table 3.5).
Table 3.5 Source of knowledge on formal health service providers with 95% CI*
Knowledge about formal Provider Male [95% CI]
n=6,733 Female [95% CI]
n=29,484 Total [95% CI]
n=36,216
Yes 66.8 [56.9,75.4] 65.5 [57.1,73] 65.7 [57.7,73]
No 33.2 [24.6,43.1] 34.5 [27,42.9] 34.3 [27,42.3]
Source of knowledge Male [95% CI]
n=4,496 Female [95% CI]
n=19,307 Total [95% CI]
n=23,803
Own experience 69 [58.6,77.7] 47.7 [39.5,55.9] 51.7 [44,59.3]
Neighbors 44.3 [35.7,53.3] 44.5 [37.1,52.2] 44.5 [37.8,51.4]
Family/friends 35.5 [25,47.6] 44.9 [37.3,52.8] 43.1 [35.6,51]
Signboard 20.4 [13.3,30] 12.4 [9.1,16.7] 13.9 [10.1,18.8]
Health workers 9.7 [6.1,15.1] 20.3 [14.7,27.2] 18.3 [13.5,24.3]
Pharmacist 1.4 [0.5,4.2] 1.1 [0.6,2.1] 1.2 [0.6,2.2]
Print media (Newspaper) 0 0.6 [0.2,1.6] 0.5 [0.2,1.3]
Electronic media (TV, Radio, etc.) 0 0.3 [0.1,1.1] 0.3 [0.1,0.9]
Other 0.5 [0.1,3.5] 0.2 [0.1,0.7] 0.3 [0.1,0.7]
*multiple responses

22
Respondents were asked to define what they perceived to be the attributes of good quality healthcare.
For both male and female respondents, the most important factors were availability of qualified doctors
and low cost treatment. One-third of respondents believed good behavior of healthcare providers
means good service and one-fifth emphasized the importance of a provider’s patience in listening to
their problems. Twenty-four hour service by doctors and availability of medicines, short waiting time,
and emergency services were also perceived as indicators of good quality care.
Respondents felt that the highest quality healthcare services could be found in government hospitals,
followed by doctor’s chambers3, or private hospitals. NGO clinics were rarely mentioned, with more
women mentioning them than men (Table 3.6).
Table 3.6 Perceptions of quality health care and places to obtain them*
Perception Male [95% CI]
n=6733 Female [95% CI]
n=29484 Total [95% CI]
n= 36217
Criteria for quality health care
Availability of qualified doctors 59.5 [53.0,65.8] 50.0 [45.0,55.0] 52.2 [47.5,56.9]
Treatment at low or free of cost 50.1 [42.9,57.3] 48.2 [42.3,54.2] 48.6 [42.8,54.6]
Good behavior of providers 36.3 [30.0,43.0] 37.3 [32.7,42.1] 37.1 [32.8,41.6]
Listens to problems with patience 21.3 [17.4,25.9] 21.8 [17.8,26.4] 21.7 [18.3,25.6]
Availability of medicines and doctors 24 hours 11.8 [8.4,16.5] 10.6 [8.0,13.9] 10.9 [8.5,13.8]
Short waiting time 10.5 [7.5,14.5] 13.6 [10.2,18] 12.9 [10.0,16.4]
Emergency services 7.8 [5.3,11.2] 11.3 [8.0,15.9] 10.5 [7.8,14.0]
Neat and clean environment 6.0 [3.8,9.5] 5.6 [4.1,7.6] 5.7 [4.3,7.5]
Appropriate treatment 2.4 [1.2,4.5] 5.3 [3.3,8.3] 4.6 [2.9,7.3]
Don’t know 3.5 [1.9,6.2] 3.9 [2.6,5.9] 3.8 [2.6,5.7]
Other 7.7 [4.0,14.3] 4.5 [3.3,6.2] 5.2 [3.5,7.7]
Quality healthcare provider
Government hospital 52.1 [44.6,59.5] 49.4 [44.6,54.1] 50.0 [45.0,54.9]
Doctor’s chamber (MBBS doctor/qualified doctor) 49.9 [43.5,56.4] 38.2 [33.6,43.0] 40.9 [36.9,45.0]
Private clinic / hospital 33.8 [28.8,39.2] 28.8 [24.1,34.1] 30.0 [25.6,34.7]
Pharmacy/drug seller/village doctor 10.4 [7.5,14.2] 8.9 [6.8,11.7] 9.3 [7.2,11.9]
NGO clinic 2.7 [1.5,4.8] 8.9 [6.4,12.3] 7.5 [5.4,10.4]
Homeopath doctor 1.3 [0.6,2.8] 1.7 [1.0,2.8] 1.6 [1.0,2.5]
Traditional healer 0.7 [0.2,2.3] 0.3 [0.1,0.8] 0.4 [0.2,0.8]
Community Health Worker (SS/SK/CSB etc.) 0.2 [0.0,1.2] 0.2 [0.1,.5] 0.2 [0.1,0.5]
Don’t know 0.5 [0.2,1.8] 1.5 [1.1,2.2] 1.3 [0.9,1.9]
Other 0.6 [0.2,1.6] 0.4 [0.2,0.8] 0.4 [0.2,0.8]
*multiple responses
3 Private practice by doctor’s not attached with any larger institute like hospital or clinic

23
3.4 Access to media and cell phones Use of media and various modes of communication provide insight on how messages are disseminated
in communities. Table 3.7 displays the use of paper or electronic media in poor urban settlements in
SCC. By and large, more men used media than women. Television was the most regularly accessed
source of information, followed by magazines/newspapers and finally, radio. Only 44% men and 25%
women reported reading magazines/newspaper and the majority of reading was labeled infrequent. Just
11% men and 3% women read print media daily. More than 50% men and women watched TV everyday
mostly at night.
Table 3.7 Proportions of the urban poor with access to different media and their frequency of use
Media Male [95% CI]
n= 6733 Female [95% CI]
n= 29,484 Total [95% CI]
n=36,217
Frequency of reading magazine
Everyday 10.5 [8.1,13.5] 2.5 [1.4,4.4] 4.3 [3.1,6.0]
At least once a week 1.4 [0.7,2.6] 1.7 [1.0,2.7] 1.6[1.0,2.4]
Infrequently 22.2 [19.2,25.5] 21.1 [18.4,24.0] 21.3 [19.0,23.8]
Never 66.0 [62.2,69.5] 74.8 [71.4,77.9] 72.8 [69.6,75.7]
How often do you listen to the radio?
Every day 3.5 [2.1,5.7] 0.9 [0.6,1.5] 1.5 [1.1,2.2]
At least once a week 1.5 [0.8,2.7] 0.6 [0.3,1.12] 0.8 [0.5,1.3]
Infrequently 6.5 [4.6,9.0] 6.6 [4.63,9.45 6.6 [4.8,9.0]
Never 88.6 [85.2,91.3] 91.8 [89.0,93.9] 91.0 [88.6,93.0]
When do you usually listen to radio?
Morning 3.9 [1.3,10.8] 10.0 [5.6,17.3] 8.2 [4.8,13.8]
Afternoon 7.7 [2.9,18.5] 10.9 [6.9,16.9] 9.9 [6.3,15.4]
Evening 24.0 [15.2,35.7] 29.5 [18.5,43.7] 27.9 [18.5,39.7]
Night 64.5 [51.6,75.6] 49.5 [38.6,60.5] 53.9 [44.5,63.1]
How often do you watch television?
Everyday 55.2 [49.7,60.5] 51.8 [47.7,55.9] 52.6 [48.7,56.5]
At least once a week 3.9 [2.4,6.2] 4.1 [2.9,5.9] 4.1 [2.9,5.7]
Infrequently 24.9 [21.3,29.0] 24.1 [21.5,26.9] 24.3 [21.9,26.8]
Never 16 [12.3,20.6] 19.9 [16.8,23.5] 19.0 [16.0,22.5]
When do you usually watch television?
Morning 1.3 [0.6,2.7] 2.1 [1.3,3.3] 1.9 [1.3,2.8]
Afternoon 3.4 [1.5,7.6] 5.9 [4.3,8.2] 5.4 [3.8,7.5]
Evening 15.8 [11.7,21.0] 28.0 [24.0,32.4] 25.1 [21.3,29.2]
Night 79.5 [73.6,84.4] 64.0 [59.7,68.1] 67.7 [63.5,71.6]
Total 100 100 100
Almost 90% of respondents possessed mobile phones. Overall 66% of respondents (though more men
than women) had access to a mobile phone 24 hours daily (Table 3.8). Only 10% of the respondents,
(slightly more women than men) had ever used mobile phones to obtain advice regarding health issues.
Among those who used mobile phones for health advice, almost all reported it being very helpful.

24
Table 3.8 Possession of mobile phones and use for health purposes
Mobile phone use Male [95% CI] n=6733
Female [95% CI] n=29,484
Total [95% CI] n= 36,217 Possession of mobile phones
No 10.0 [7.2,13.9] 12.9 [10.3,16.0] 12.2 [9.9,15.0]
Yes 90.0 [86.1,92.8] 87.1 [84.0,89.7] 87.8 [85.0,90.1]
24 hours access to a mobile phone n=6733 n=29,484 n= 36,217
No 21.8 [17.3,27.0] 38.3 [32.9,44.1] 34.5 [29.8,39.6]
Yes 78.2 [73.0,82.7] 61.7 [55.9,67.1] 65.5 [60.4,70.2]
Communication for health purposes n=6733 n=29,484 n= 36,217
No 89.2[ 86.0,91.7] 87.9 [85.6,89.8] 88.2 [86.2,89.9]
Yes 10.8 [8.3,14.0] 12.1 [10.2,14.4] 11.8 [10.1,13.8]
Satisfaction from health advice n=727 n=3568 n=4295
Very helpful 96.5 [90.5,98.8] 95.0 [89.9,97.6] 95.4 [91.5,97.5]
Somewhat helpful 3.5 [1.2,9.4] 4.9 [2.4,10.1] 4.6 [2.5,8.5]
Total 100 100 100
People who reported using mobile phones for health advice did so to consult doctors (49%), other family
members (15%), and local pharmacists (13%). Only 2.5% had ever called a mobile health line. More
women called doctors, community health workers, and health lines than men. Men typically made calls
to local pharmacists and other family members for health advice (Table 3.9).
Table 3.9 Source of health advice received via mobile phone
Source Male [95% CI]
n=727 Female [95% CI]
n=3568 Total [95% CI]
n=4295
A doctor 44.9 [30.1,60.7] 49.7 [42.0,57.4] 48.7 [41.6,55.9]
Other family members 20.7 [9.4,39.7] 12.8 [8.1,19.8] 14.5 [9.5,21.3]
Local pharmacist 17.4 [7.4,35.5] 11.8 [8.0,16.9] 12.9 [8.8,18.5]
Spouse 5.1 [1.2,19.3] 5.0 [2.1,11.7] 5.0 [2.0,12.0]
Community Health Worker (SK) 5.9 [2.1,15.8] 13.2 [8.5,20.2] 11.7 [7.5,17.8]
Friends 4.5 [1.2,16.1] 1.7 [0.5,5.2] 2.3 [1.0,5.1]
Mobile health line 1.6 [0.3,6.3] 2.5 [1.1,5.4] 2.2 [1.0,4.8]
Colleagues -- 0.3 [0.0,2.5] 0.3 [0.3,1.9]
Other acquaintances -- 0.9 [0.2,4.34] 0.8 [0.1,3.4]
Others -- 1.9 [0.8,4.6] 1.6 [0.9,5.1]
Total 100 100 100

25
Chapter 4. Acute Health Problems
This section covers any acute health problem experienced by different age groups over the two weeks
prior to completing the survey questionnaire. The recall window was intentionally short to reduce any
recall bias regarding health events or related information. Respondents who answered ‘yes’ to the filter
question “Have you experienced any health problem/illness/disability in the last two weeks?” and no to
“Have you been experiencing health problem/illness/disability for 3 months or more?” were eligible to
be interviewed for this module. Mothers provided information about children aged 0-14 years. A total of
1,187 cases were available for analysis; a weighted denominator of 75,930. Table 4.1 shows the number
Key Findings:
Fever and cough were the most common complaints across all age groups
A greater proportion of men had respiratory complaints than women
Neurological and musculoskeletal related symptoms were more common in women
than men
On average, 76% of the respondents sought some sort of care for their acute health
problem; People aged 65 and above did so the least
Important reasons for not seeking care were no need (thought would resolve
spontaneously), not severe, and no money
Approximately 45% of all respondents visited a pharmacy for care followed by
government hospitals
NGO and other private clinics were least frequented
Proximity, special skills, effective treatment, and low cost emerged as key criteria in
choosing a provider
Respondents received the quickest service from pharmacies and the slowest from
government hospitals
On average 60% people said they were fully satisfied with the healthcare received and
would visit the same provider the next time. However, for those attending private
clinics and doctor chambers, 75% expressed satisfaction
Interestingly women were more prone to reporting greater satisfaction but less likely
to see the same provider again
The topmost reason for not returning to the same provider was ineffective treatment
The most common modes of travelling to health facilities were foot and rickshaw
A mean time of 19 minutes was needed to reach a health facility
The average expenditure for a health episode was between 150-200 BDT including
transport cost
Healthcare costs were mostly met from household wages

26
of surveyed respondents based on our sample size calculation for each age group. Analyses show
proportions with in each age group for each outcome variable.
Table 4.1 Number of surveyed respondents reporting acute health problems
Background characteristics Number Percent of cases
Sex
Male 581 48.9
Female 606 51.1
Age
under 5 333 28.1
6-14 330 27.8
15-19 71 6
20-24 50 4.2
25-29 61 5.1
30-39 102 8.6
40-49 79 6.7
50-64 121 10.2
65 & above 40 3.4
Total 1187 100
4.1 Background characteristics of cases and types of health problems Respondents described their health problems and symptoms experienced in the previous 2 weeks.
These qualitative data were recorded and later coded by doctors in the study team using the
International Classification of Primary Care (ICPC) codes developed by the WONCA International
Classification Committee4. The ICPC is a classification method for primary care encounters accepted by
WHO within its WHO Family of International Classifications.
Table 4.2 displays the types of acute health problems mentioned. Categories included: general and
unspecified (86%) that included fever, pain, and weakness etc.; Respiratory (62%); Neurological (24%),
and Digestive (23%). Women complained more of neurological, musculoskeletal, and psychological
health problems than men. Respiratory symptoms were more frequently reported in men than women.
Other than the prevalent symptoms mentioned, children also suffered from skin and nutritional
problems. The proportion of respondents indicating cardiovascular problems increased with age.
Women of younger ages suffered from reproductive health problems (menstrual and breast) more than
older women while older men complained more about male sexual health problems (swelling).
4 World Health Organization. International Classification of Primary Care, Second edition (ICPC-
2).Geneva

27
The majority of respondents indicated that they experienced acute health problems falling in the ‘general’ and ‘respiratory’ categories. Table 4.3
displays the most frequently described symptoms within those categories. Seven percent of those complaining of ‘general’ health problems
reported experiencing fever. Children suffered from fevers and cough/congestion more than other groups. Around 60-70% of children up to 14
years of age who were ill had fever in the last 2 weeks. General weakness and pain were more common in older age groups. Other symptoms that
were recorded but not shown here were unspecific chest pain, abdominal pain, heartburn, constipation, rectal bleeding, eye complaint/injury,
some skin disease etc.
Table 4.2 Perceived symptoms/health problems by localization experienced in last two weeks*
Background Characteristics
Disease Category Total
number
Sex A B C D E F G H I J K L M N O P
Male 87.6 67.8 16.7 21.5 0.2 3.9 2.6 0.7 7.9 1.0 7.4 6.5 0.7 -- -- 0.7 43,872
Female 84.5 56.5 31.1 23.6 0.5 4.6 1.8 3.8 11.9 3.1 6.8 5.9 1.3 0.5 2.3 -- 31,519
Age
under 5 83.5 63.7 6.1 24.1 0.5 1.9 4.1 0.3 4.9 1.9 9.2 6.8 0.8 -- 0.3 0.3 19,101
5-14 80.3 59.2 15.4 22.5 -- 5.6 1.4 1.4 8.5 -- 4.2 8.5 -- -- 1.4 -- 26,320
15-19 68.0 40.0 40.8 22.0 -- 4.0 2.0 4.0 12 .0 6.0 2.0 6.0 6.0 2.0 8.0 -- 4085
20-24 86.9 49.2 44.0 19.7 -- 8.2 1.6 3.3 11.5 1.6 3.3 1.6 1.6 0.0 6.6 -- 2960
25-29 91.2 37.3 47.5 22.5 -- 4.9 1.9 2.9 16.7 0.9 2.9 6.9 1.9 0.9 2.9 -- 3766
30-39 82.3 43.0 46.1 17.7 -- 7.6 -- 5.1 25.3 2.5 2.5 1.3 2.5 1.3 1.3 -- 5877
40-49 93.3 36.7 29.1 15.0 1.7 5.8 -- 7.5 20.8 3.3 6.7 7.5 -- -- -- 0.8 4251
50-64 92.5 37.5 41.7 25.0 -- 5.0 -- 10.0 27.5 5.0 2.5 2.5 -- -- -- 5.0 6747
65 and above 92.5 37.5 25.0 25.0 -- 5 .0 -- 10 0 27.5 5.0 2.5 2.5 -- -- -- 5.0 2284
Total 86.0 62.1 24.0 22.6 0.3 4.3 2.2 2.3 9.9 2.1 7.1 6.2 1 .0 0.3 1.2 0.3 75,391
A- General and unspecified; B- Respiratory; C- Neurological, D- Digestive; E- Blood and Immune mechanism, F- Eye, G- Ear, H- Cardiovascular, I- Musculoskeletal, J- Psychological, K- Skin, L- Endocrine/Metabolic and Nutritional, M- Urological, N- Pregnancy, Childbearing, Family Planning; O- Genital (female); P- Genital (male)

28
Table 4.3 Most common perceived general and respiratory symptoms/health problems by symptom
name experienced in last 2 weeks*
Background characteristics
General and unspecified
Total number
Respiratory
Total number Fever
General weakness/ tiredness
General pain/ multiple
sites Cough
Sneezing/ nasal
congestion
Sex
Male 62.8 8.6 6.5 32,406 30.5 31.0 22,177
Female 52.2 13.2 7.4 21,705 24.5 23.3 13,822
Age
under 5 72.4 4.1 1.7 15,561 41.5 43.5 13,425
5-14 64.0 7.9 4.1 18,661 27.1 29.5 11,979
15-19 54.9 11.3 7.0 2,575 28.2 28.2 1,904
20-24 30.0 22.0 8.0 1,527 14.0 16.0 998
25-29 52.5 8.2 13.1 2,676 18.0 19.7 1,110
30-39 43.1 21.6 8.8 4,242 12.7 16.7 2,176
40-49 39.2 16.5 13.9 2,821 21.5 11.4 1,630
50-64 45.8 16.7 17.5 4,400 20.0 12.5 1,990
65 and above 40.0 25.0 12.5 1,648 27.5 7.5 787
Total 57.4 11.0 7.0 54,111 27.4 27.1 35,999
* multiple responses
Seventy-five percent of those who reported acute health problems sought care. Table 4.4, which
includes self-treatment as a form of care seeking, shows equal rates of seeking care comparing males
and females. In the age groups 20-24 years and 40-49 years, care was sought by more than 80% of the
respondents. Even among the group reporting lowest proportions of care seeking, over half sought care
(66%). Women and those in the age group 20-29 reported seeking care multiple times. This was not the
case with other groups who tended to report seeking care only once.
Those who did not seek care were questioned about their reasons for not seeking care. As depicted in
Table 4.5, the majority of those who did not seek care reported that they felt the health problem would
self-resolve. Others reported that it was not severe enough of a problem to seek care. Women claimed
lack of money as a barrier to care-seeking more than men.

29
Table 4.4 Care-seeking behavior for health problems experienced in last 2 weeks
Background characteristics
Percent sought care
Total number
# times sought treatment for the health problem Total number 1 2 3 4 +
Sex
Male 77.6 [68.3,84.8]
43,872 79.0 [74.4,82.9]
16.3 [13.1,20.1]
3.4 [1.8,6.2] 1.3 [0.6,3.1]
34,058
Female 72.5 [66.5,77.8]
31,519 74.8 [66.6,81.6]
19.6 [13.5,27.7
2.8 [1.5,5.2]
2.7 [1.3,5.3]
22,854
Age
under 5 77.3 [32.2,60.4]
19,101 74.2 [65.3,81.5]
20.5 [14.5,28.1]
2.6 [0.8,7.6]
2.8 [1.0,7.4] 14,759
5-14 76.5 [27.1,59.2]
26,320 83.1 [77.4,87.6]
15.6 [11.1,21.3]
0.8 [0.3,2.1]
0.6 [0.1,2.6]
20,123
15-19 72.0 [27.5,50.7]
4,085 70.5 [53.6,83.2]
23.7 [12.8,39.7]
3.8 [0.5,23.4]
1.9 [0.3,13.1]
2,943
20-24 80.8 [20.9,53.6]
2,960 69.6 [53.2,82.2]
22.8 [11.6,40.0]
6.4 [1.9,20.1]
1.1 [0.2,8.3]
2,393
25-29 79.8 [16.9,42.8]
3,766 66.7 [39.7,85.9]
13.8 [6.3,27.8]
16.3 [2.3,61.5]
3.2 [0.7,14.1]
3,007
30-39 68.5 [16.2,34.5]
5,877 72.4 [55.2,84.7]
21.6 [10.0,40.5]
5.3 [1.6,16.0]
0.8 [0.2,5.3] 4,024
40-49 81.1 [20.5,42.3]
4,251 74.7 [59.0,85.8]
20 [10.4,34.9]
3.4 [1.1,10.3]
1.9 [0.4,7.9]
3,448
50-64 69.7 [31.3,44.8]
6,747 80.8 [67.6,89.4]
12.2 [6.1,22.8]
3.7 [0.9,14.7]
3.3 [0.8,12.8]
4,700
65 and above 66.3 [27.5,53.4]
2,284 86.4 [67.3,95.1]
6.3 [1.3,25.3]
-- 7.3 [1.7,26.7]
1,515
Total 75.5 [68.8,81.1]
75,391 77.3 [72.0,81.9]
17.6 [13.5,22.7]
3.2 [1.9,5.2] 1.9 [1.0,3.4] 56,912
Table 4.5 Reasons for not seeking care during health problem/disability*
Background characteristics
Thought would resolve by itself
Not severe Lack of money No one to
accompany Others Total
Sex Male 59.3[48.5,69.2] 44.1 [34.1,54.6] 36.0 [24.0,52.9] 0.6 [0.7,3.9] 6.6[3.0,13.8] 9,814
Female 48.7 [37.7,59.8] 35.8 [27.3,45.4] 46.8 [34.8,62.3] 2.1 [0.5,7.86] 6.3[2.8,13.9] 8,665
Age
under 5 63.0[50.4,74.1] 41.4[27.7,56.6] 27.0 [16.0,41.7] -- 7.8[1.6,30.1] 4,342
5-14 52.9 [40.0,65.5] 33.0 [21.0,47.6] 41.7 [27.2,63.1] 0.9 [0.1,6.4] 14.1[3.4,43.6] 6,197
15-19 65.0[41.9,82.7] 48.6 [23.5,74.5] 20.1 [7.9,48.1] -- 6.0[1.4,22.9] 1,142
20-24 37.2 [11.4,73.2] 21.8 [5.6,56.6] 82.5 [31.3,86.9] 21.9 [3.1,71.4] 9.8[1.3,48.1] 567
25-29 24.5 [9.4,50.4] 22.7 [6.9,54] 72.4[30.2,130.9] -- 5.3[1.4,18.1] 759
30-39 58.1 [38.9,75.2] 46.7 [32.3,61.6] 58.1 [33.6,93.6] -- 10.8[1.5,48.3] 1,853
40-49 65.2 [37.9,85.2] 51.1 [25.7,76.0] 20.7 [5.8,69.1] -- 3.8[1.2,11.3] 802
50-64 47.0 [30.9,63.7] 57.5 [34.6,77.5] 45.1 [25.2,76.5] 2.8 [0.4,16.9] 7.3 [3.0,16.7] 2,047
65 and above 41.3 [19.6,67.0] 38.0 [14.4,69.1] 54.0 [22.0,111.6] -- 7.8 [1.6,30.1] 770
Total 54.3 [45.6,62.8] 40.2 [32.1,49.0] 41.1 [31.0,53.7] 1.3 [0.4,3.9] 6.5 [3.7,11.2] 18,479 *multiple responses. Others include: Not curable, unfriendly staff, religious or cultural belief, don’t know where to go, don’t like medicine, lack
of time, availability of previous drug.

30
All respondents, whether they sought care or not, were asked about how decisions to seek care (or not)
were made. Specifically, respondents answered questions about the identity of the ‘decision-maker’
responsible for deciding to seek care or not. Multiple answers were accepted. The decision to seek care
was clearly not only an individual decision. In all categories (with the exception of children) some
proportion of respondents reported that decision was their own. Among women, spouses made
decisions about their care seeking more often than they did themselves, while older adults appeared to
rely on others (presumably their children) to make decisions about care seeking.
Table 4.6 Decision maker regarding care seeking for perceived health problems *
Background characteristics
Self Spouse Parent Other family
members Mother-in-
law Father-in-
law Others
Sex
Male 22.3 [17.0,28.8]
5.6 [3.3,9.6]
66.9 [61.6,71.9]
5.5 [2.9,10.1]
-- -- --
Female 16.1 [12.6,20.2]
22.2 [18.8,26.0]
49.1 [44.6,53.7]
12.3 [9.6,15.6]
0.9 [0.3,2.6]
0.3 [0.1,1.2]
0.5 [0.1,1.7]
Age
under 5 -- -- 90.1 [83.6,94.2]
5.9 [2.7,12.4]
-- -- --
5-14 -- -- 94.3 [91.3,96.3]
5.1 [3.0,8.6]
-- -- --
15-19 29.7 [18.1,44.6]
15.8 [8.36,27.9]
45.2 [34.0,57.0]
15.0 [6.7,30.0]
1.5 [0.2,10.8]
0.9 [0.1,7.0]
20-24 37.3 [25.6,50.7]
40.5 [25.7,57.3]
18.4 [8.5,35.3]
4.7 [1.2,17.5]
4.2 [0.6,24.6 ]
-- 4.3 [1.0,16.4]
25-29 55.1 [38.6,70.5]
36.8 [22.5,54.0
8.5 [3.1,21.4]
2.0 [0.5,8.2]
-- -- --
30-39 60.5 [48.9,71.1]
39.7 [28.5,52.0]
1.9 [0.6,6.0]
1.5 [0.4,6.3]
1.5 [0.2,10.9]
0.9 [0.1,7.1]
--
40-49 54.3 [43.5,64.8 ]
37.5 [28.6,47.2]
-- 4.5 [1.6,11.5]
0.6 [0.1,4.5]
-- --
50-64 52.5 [39.0,65.6]
28.7 [18.2,42.0]
-- 22.4 [14.3,33.3]
-- -- 0.4 [0.1,3.3]
65 and above 46.7 [34.3,59.5]
5.9 [1.6,19.6]
-- 51.1 [39.4,62.7]
-- -- --
Total 19.7 [16.2,23.8]
12.5 [9.8,16.0]
59.5 [54.6,64.2]
8.3 [6.6,10.4]
0.4 [0.1,1.2]
0.5 [0.2,1.3]
0.2 [0.1,0.8]
*multiple responses
4.2 Choice of provider Respondents who sought care were asked further detailed questions about their recent care seeking
experience. A series of questions provided information about respondent’ visits, including multiple
treatments when appropriate. Since only 23% of respondents sought care multiple times, most of the
information presented in this section describes first visits, unless otherwise indicated.
Table 4.7 shows the choice of facility by the respondents in their first and last visits. Regardless of age,
and sex, the first point of contact for care was a pharmacy in more than 40% of the cases. Patients also
went to government hospitals (24%), doctor’s chambers (17%), and private clinics/hospitals (7%). Public

31
hospitals were frequented by men more than by women whereas more women went to Doctor’s
chambers and NGO clinics than men. Self-treatment or home remedy was minimally reported and only a
few respondents went to traditional healers, homeopaths, and spiritual healers. Not much variation was
seen across the age groups except for children under 5, who were most likely to be taken either to a
hospital or a doctor’s chamber than to a pharmacy. A higher proportion of respondents above 65 years
went to doctor’s chambers than any other group.
Overall, pharmacies are visited more than other ‘facilities’. This was the case in ‘last visits’ also. For last
visits, more men and children went to a pharmacy than their first visit. Women and other age groups
diversified into other facilities like government hospital or doctor’s chambers.
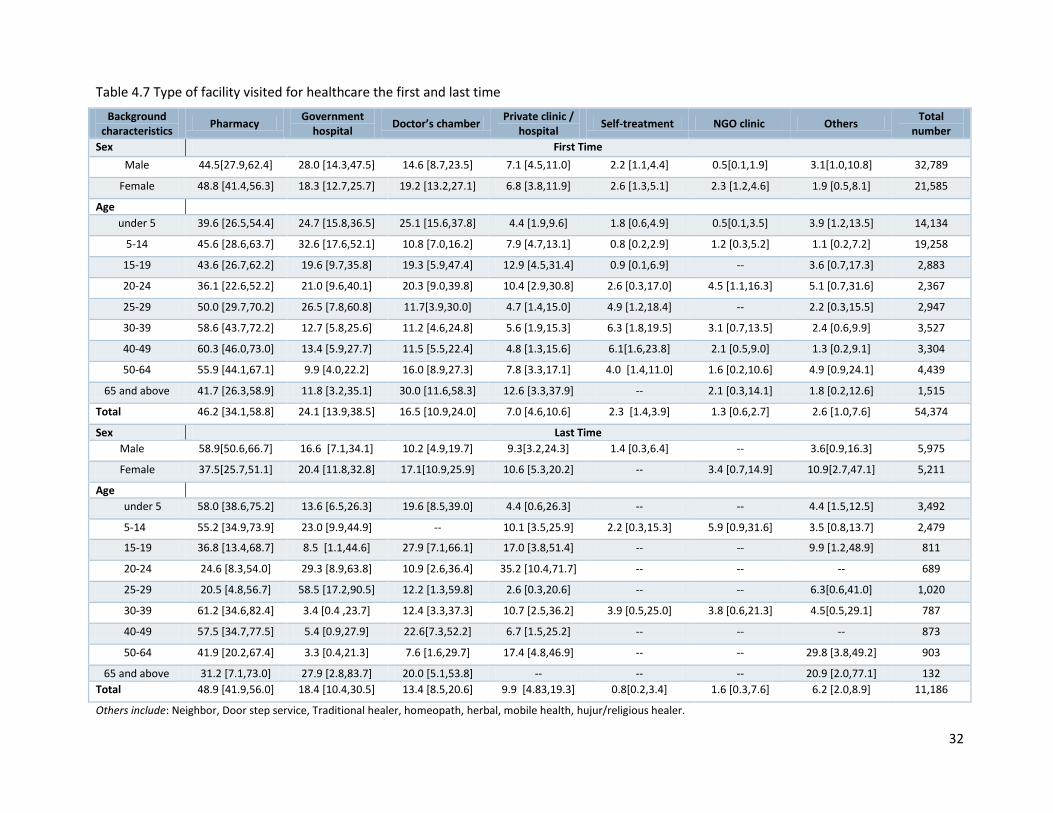
32
Table 4.7 Type of facility visited for healthcare the first and last time
Background characteristics
Pharmacy Government
hospital Doctor’s chamber
Private clinic / hospital
Self-treatment NGO clinic Others Total
number
Sex First Time
Male 44.5[27.9,62.4] 28.0 [14.3,47.5] 14.6 [8.7,23.5] 7.1 [4.5,11.0] 2.2 [1.1,4.4] 0.5[0.1,1.9] 3.1[1.0,10.8] 32,789
Female 48.8 [41.4,56.3] 18.3 [12.7,25.7] 19.2 [13.2,27.1] 6.8 [3.8,11.9] 2.6 [1.3,5.1] 2.3 [1.2,4.6] 1.9 [0.5,8.1] 21,585
Age
under 5 39.6 [26.5,54.4] 24.7 [15.8,36.5] 25.1 [15.6,37.8] 4.4 [1.9,9.6] 1.8 [0.6,4.9] 0.5[0.1,3.5] 3.9 [1.2,13.5] 14,134
5-14 45.6 [28.6,63.7] 32.6 [17.6,52.1] 10.8 [7.0,16.2] 7.9 [4.7,13.1] 0.8 [0.2,2.9] 1.2 [0.3,5.2] 1.1 [0.2,7.2] 19,258
15-19 43.6 [26.7,62.2] 19.6 [9.7,35.8] 19.3 [5.9,47.4] 12.9 [4.5,31.4] 0.9 [0.1,6.9] -- 3.6 [0.7,17.3] 2,883
20-24 36.1 [22.6,52.2] 21.0 [9.6,40.1] 20.3 [9.0,39.8] 10.4 [2.9,30.8] 2.6 [0.3,17.0] 4.5 [1.1,16.3] 5.1 [0.7,31.6] 2,367
25-29 50.0 [29.7,70.2] 26.5 [7.8,60.8] 11.7[3.9,30.0] 4.7 [1.4,15.0] 4.9 [1.2,18.4] -- 2.2 [0.3,15.5] 2,947
30-39 58.6 [43.7,72.2] 12.7 [5.8,25.6] 11.2 [4.6,24.8] 5.6 [1.9,15.3] 6.3 [1.8,19.5] 3.1 [0.7,13.5] 2.4 [0.6,9.9] 3,527
40-49 60.3 [46.0,73.0] 13.4 [5.9,27.7] 11.5 [5.5,22.4] 4.8 [1.3,15.6] 6.1[1.6,23.8] 2.1 [0.5,9.0] 1.3 [0.2,9.1] 3,304
50-64 55.9 [44.1,67.1] 9.9 [4.0,22.2] 16.0 [8.9,27.3] 7.8 [3.3,17.1] 4.0 [1.4,11.0] 1.6 [0.2,10.6] 4.9 [0.9,24.1] 4,439
65 and above 41.7 [26.3,58.9] 11.8 [3.2,35.1] 30.0 [11.6,58.3] 12.6 [3.3,37.9] -- 2.1 [0.3,14.1] 1.8 [0.2,12.6] 1,515
Total 46.2 [34.1,58.8] 24.1 [13.9,38.5] 16.5 [10.9,24.0] 7.0 [4.6,10.6] 2.3 [1.4,3.9] 1.3 [0.6,2.7] 2.6 [1.0,7.6] 54,374
Sex Last Time
Male 58.9[50.6,66.7] 16.6 [7.1,34.1] 10.2 [4.9,19.7] 9.3[3.2,24.3] 1.4 [0.3,6.4] -- 3.6[0.9,16.3] 5,975
Female 37.5[25.7,51.1] 20.4 [11.8,32.8] 17.1[10.9,25.9] 10.6 [5.3,20.2] -- 3.4 [0.7,14.9] 10.9[2.7,47.1] 5,211
Age
under 5 58.0 [38.6,75.2] 13.6 [6.5,26.3] 19.6 [8.5,39.0] 4.4 [0.6,26.3] -- -- 4.4 [1.5,12.5] 3,492
5-14 55.2 [34.9,73.9] 23.0 [9.9,44.9] -- 10.1 [3.5,25.9] 2.2 [0.3,15.3] 5.9 [0.9,31.6] 3.5 [0.8,13.7] 2,479
15-19 36.8 [13.4,68.7] 8.5 [1.1,44.6] 27.9 [7.1,66.1] 17.0 [3.8,51.4] -- -- 9.9 [1.2,48.9] 811
20-24 24.6 [8.3,54.0] 29.3 [8.9,63.8] 10.9 [2.6,36.4] 35.2 [10.4,71.7] -- -- -- 689
25-29 20.5 [4.8,56.7] 58.5 [17.2,90.5] 12.2 [1.3,59.8] 2.6 [0.3,20.6] -- -- 6.3[0.6,41.0] 1,020
30-39 61.2 [34.6,82.4] 3.4 [0.4 ,23.7] 12.4 [3.3,37.3] 10.7 [2.5,36.2] 3.9 [0.5,25.0] 3.8 [0.6,21.3] 4.5[0.5,29.1] 787
40-49 57.5 [34.7,77.5] 5.4 [0.9,27.9] 22.6[7.3,52.2] 6.7 [1.5,25.2] -- -- -- 873
50-64 41.9 [20.2,67.4] 3.3 [0.4,21.3] 7.6 [1.6,29.7] 17.4 [4.8,46.9] -- -- 29.8 [3.8,49.2] 903
65 and above 31.2 [7.1,73.0] 27.9 [2.8,83.7] 20.0 [5.1,53.8] -- -- -- 20.9 [2.0,77.1] 132
Total 48.9 [41.9,56.0] 18.4 [10.4,30.5] 13.4 [8.5,20.6] 9.9 [4.83,19.3] 0.8[0.2,3.4] 1.6 [0.3,7.6] 6.2 [2.0,8.9] 11,186
Others include: Neighbor, Door step service, Traditional healer, homeopath, herbal, mobile health, hujur/religious healer.

33
In most cases, health information was not sought from medical professionals but rather respondents
reported relying on self-knowledge or the knowledge of family members to determine where to seek
care (Figure 5). Variation among age groups was minimal, so findings are presented for the total sample.
Almost 90% of respondents knew where to seek care from previous experience. Other sources of
information were their spouse, family members, and neighbors. The ‘other acquaintances’ category
included friends and colleagues. Referral from doctors was mentioned, but in a minority of cases.
Figure 6 displays data describing respondents’ criteria for choosing a facility. Multiple responses were
allowed. There was little variation in responses between men and women. Proximity emerged as the
chief criterion influencing the decision for choosing a certain facility/provider. People also went to
providers whom they believed had some special skills or gave effective treatment. Special skills came up
during pre-test by which respondents meant homeopathic/ayurvedic/spiritual and similar skills and
effective treatment implies that they had, from a previous encounter, found the treatment to cure or
heal them. Respondents with multiple visits mentioned cleanliness as a criterion, but not in the first
visit. Cost was also considered as important in choosing a facility. Some other negligible reasons cited
(not shown here) were friendly providers, recommended by others, privacy maintained, qualified
doctors, emergency service, availability of female doctors, etc.
Figure 2 Source of information on the place of healthcare chosen in the first visit (n=54374) (multiple responses)
89.5
73.3
73.4
67.3
39.2
15.6
Own experience
Spouse
Family members
Neighbours
Other acquanitance
Another doctor
0 10 20 30 40 50 60 70 80 90 100

34
Figure 3 Four most important factors in choosing a facility or a provider (n=54374)
Most medicines were purchased from pharmacies, with only 17% obtained from government hospitals.
A higher proportion of men reported accessing medicines at government hospitals than women. Other
less prevalent sources of medicines included NGO clinics, private clinics, traditional healers and
homeopath chambers. Our findings confirm the common knowledge that, although medicines at
hospitals are supposed to be free most respondents reported accessing medicines at pharmacies – and
paying for them.
Table 4.8 Place of getting medications for treatment*
Background characteristics Pharmacy Govt. Hospital NGO clinic
Private Clinic/ Hospital
Other1 Total
number
Sex
Male 74.6 [64.6,82.5] 19.7 [10.6,33.5] 0.1 [0.0,0.8] 1.2 [0.4,3.7] 2.5 [1.4,9.2] 34,058
Female 77.7 [72.5,82.2] 13.8 [10.0,18.7] 1.1 [11.2,20.4] 1.8[0.8,4.1] 2.6 [0.9,8.4] 22,854
Age
under 5 71.1 [60.9,79.6] 19.3 [10.4,33.0] -- 2.6 [1.0,6.6] 2.5 [0.4,14.9] 14,759
5-14 74.6 [66.4,81.4] 21.4 [14.0,31.3] 0.8 [0.1,5.8] 0.8 [0.2,3.3] 1.4 [1.0,6.9] 20,123
15-19 76.2 [58.3,88.0] 12.1 [4.7,27.7] -- -- 2.8 [0.4,19.2] 2,943
20-24 85.6 [68.2,94.2] 11.6 [4.4,27.1] -- 1.2 [0.2,8.6] 1.7 [0.2,10.7] 2,393
25-29 67.3 [36.1,88.3] 27.8 [8.2,62.5] -- -- 4.8 [1.1,19.3] 3,007
30-39 83.1 [67.5,92.1] 10.6 [4.1,24.5] -- -- 2.6 [0.3,18.6] 4,024
40-49 80.4 [67.3,89.1] 14.7 [6.5,30.0] -- -- 4.9 [0.9,23.5] 3,448
50-64 85.2 [74.0,92.0] 0.7 [0.0,5.4] 1.8 [0.2,11.5] 4.8[1.4,15.3] 5.3 [1.5,18.4] 4,700
65 and above 82.5 [60.9,93.5] 11.6 [2.9,36.6] 2.1 [0.3,14.1] 1.8 [0.2,12] 2.1 [0.3,14.1] 1,515
Total 75.8 [68.9,81.6] 17.3 [10.5,27.3] 0.5 [0.1,1.8] 1.5 [0.7,3.1] 2.5 [1.3,6.9] 56,912
*multiple responses 1Other: Homeopath chamber, traditional healer, don’t know
45.3 43.7
34.1
28.427.1
15.1
22.5 20.9
0
10
20
30
40
50
Male Female
Close to home
Special Skills
Effective treatment
Low cost/free

35
4.3 Patient experience Long waiting time can be a deterrent to health care seeking (32, 33). Table 4.9 provides data on the
average time needed for the respondents to receive healthcare once they reached the facility. The
slowest service was reported to be provided in government hospitals where it typically took an average
of 42 minutes to get services but could reach up to 50 minutes for women. Long wait times at
government hospitals were also reported by HIES 2010, as were longer wait times in rural versus urban
areas (34 minutes) (34). Among poor urban respondents, the least time taken to attend a patient was at
pharmacies, followed by NGO clinics, although relatively few mentioned using NGO services (see table
4.7)
Table 4.9 Mean waiting time in minutes to receive health care after reaching a provider
Background characteristics
Government hospital
Private clinic/ hospital
Doctor’s chamber
NGO clinic Pharmacy Others Total
number
Sex
Male 38.4 33.9 34.8 6.4 5.8 17.4 28,976
Female 50.3 37.3 26.2 9.8 8.0 20.7 18,924
Age
under 5 43.7 44.4 30.2 -- 9.9 8.6 12,124
5-14 39.7 33.0 31.1 3.5 5.9 -- 17,415
15-19 46.8 22.8 27.6 -- 5.7 4.5 2,717
20-24 28.2 25.6 47.6 9.4 6.2 -- 2,048
25-29 27.5 39.8 27.1 -- 3.3 -- 2,610
30-39 70.9 16.8 29.0 10.0 5.1 42.8 2,939
40-49 71.8 37.3 17.0 10.0 5.1 7.0 2,797
50-64 39.6 40.9 36.0 10.0 6.1 2.8 3,864
65 and above 34.5 58.7 30.1 -- 14.2 -- 1,386
Total 42.0 35.1 30.7 8.8 6.7 18.2 47,900
Others: Traditional healer, homeopath, herbal, mobile health, hujur/religious, free service facility.
Questions on perceived quality of care were asked of respondents who reported seeking care for health
problems in the recent past. Two aspects of quality of care were assessed. The first aspect concerned
the respondent’s perception of care. This was assessed by asking whether the provider spent enough
time with the respondent, whether the provider explained the health condition and whether the
provider gave the respondent/patient a sense of how to treat the health problem in an understandable
manner. More than 80% of respondents believed that providers met these criteria. In general female
respondents felt slightly more positive than males towards their experiences with providers. The second
component of ‘quality’ was satisfaction. The majority of respondents (60% of cases) said that they were
fully satisfied with their treatment. One-third of respondents were only moderately satisfied. Very few
said that they were not satisfied at all. Satisfaction levels were the highest in the 65 years and above age
group. Client perceptions and satisfaction did not vary greatly in second or third visits to facilities and
thus, are not displayed.

36
However this data should be assessed together with the qualitative information we have on satisfaction. There has been concern around proper
explanation of diseases and appropriate medication in case of pharmacies and disrespectful behavior in government facilities. Such high levels of
satisfaction in the quantitative survey may imply over compliance and discomfort in criticizing health care providers.
Table 4.9 Perception and satisfaction of the respondents regarding behavior of the provider during treatment in the first visit
Perception [95% CI] Satisfaction [95% CI]
Background characteristics
Spent enough time
Problem properly
explained
Treatment properly
explained Total number Fully satisfied
Somewhat satisfied
Not satisfied Total
number
Sex
Male 85.4 [71.1,93.3] 78.2 [68,85.8] 85.5 [71.6,93.3] 33,350 58.7[51.1,65.9] 35.2[27.9,43.3] 6.1 [4.3,9.1] 31,668
Female 91.6 [87.5,94.4] 80.8 [75,85.6] 86.5 [78.4,91.9] 22,294 63.0 [54,71.2] 33.6 25.6,42.7] 3.4 [1.6,6.9] 20,898
Age
under 5 89.8 [79.1,95.4] 85.5[75.5,91.9] 83.9 [63.1,94.1] 14,503 68.6[60.5,75.8] 28.2[21.1,36.6] 3.1 [2.8, 3.4] 13,777
5-14 80.1 [62.4,90.8] 76.5 [67.0,83.9]
82.6 [73.3,89.2] 19,966 61.6[52.6,69.9] 31.4[23.1,41.2] 6.9[4.3,11.1] 19,010
15-19 96.4 [85.2,99.2] 71.8[58.1,82.4] 97.3 [80.5,99.7] 2,914 54.3 39.5,68.5] 40.9[27.4,56.0] 4.7 [1.3,15.5] 2,826
20-24 93.5 [77.0,98.4] 82.9[65.6,92.5] 87.9 [55.3,97.7] 2,333 66.2[46.5,81.5] 27.0[14.2,45.3] 6.8 [1.6,25.1] 2,307
25-29 94.7 [77.4,98.9] 62.8 32.6,85.5] 86.8 [63.0,96.2] 2,861 51.9 29.5,73.5] 40.5[19.0,66.4] 7.6 [2.1,24.2] 2,801
30-39 91.1 [81.4,96.0] 80.7 65.5,90.2] 90.3 [68.0,97.6] 3,804 35.6[24.4,48.7] 59.4[45.2,72.3] 4.9 [1.5,15.3] 3,306
40-49 94.5 [84.1,98.2] 73.4 59.5,83.8] 87.8 [57.5,97.5] 3,227 48.3[34.2,62.7] 49.2[35.4,63.1] 2.5 [0.6,10.1] 3,027
50-64 94.2 [86.0,97.7] 82.2[65.3,91.8] 93.4 [61.7,99.2] 4,523 59.5[43.7,73.5] 37.7[24.1,53.6] 2.8 [0.6,12.3] 3,998
65 and above 93.7 [80.8,98.1] 95.7[82.8,99.0] 100 1,514 69.3[43.1,87.0] 29.0[12.3,54.3] 1.8 [0.2,12.0] 1,514
Total 79.2 [71.6,85.3] 85.9[74.8,92.5] 86.0 [75.0,92.6] 55,644 60.4[53.1,67.3] 34.6[27.6,42.3] 5.0 [3.5,7.2] 52,566

37
In order to further assess respondents’ assessment of quality, those who had visited a healthcare provider were
asked whether they would visit the provider again in the future.
Overall people who went to private clinics were more inclined (80%) to go to the same facility in the future.
Seventy five percent of those who visited a private doctor’s office (doctor’s chamber) said they would do so
again. Interestingly, though females reported higher levels of satisfaction in prior questions, fewer women than
men said they would visit the same provider again– particularly in the case of non-pharmacists.
Table 4.10 Willingness to choose the same provider for future health problems (n represents the number of
people who went to that particular facility)
Background characteristics
Pharmacy % [n] Government
hospital % [n] Private clinic / hospital % [n]
Doctor’s chamber % [n]
Total % [n]
Sex
Male 57.8 [8428] 69.7 [6385] 87.7 [2049] 83.7 [4013] 66.1 [21,659]
Female 57.0 [6014] 58.6 [2315] 68.3 [1003] 64.1 [2659] 58 .0[12,520]
Age
under 5 63.1 [4085] 68.9 [3142] 63.9 [399] 72.9 [2676] 66.7 [10,796]
5-14 58.1 [4551] 67.7 [3508] 87.3 [1339] 79.4 [1558] 65.6 [11,269]
15-19 53.9 [678] 83.8 [474] 82.7 [307] 100 [556] 73.5 [2119]
20-24 52.6 [450] 46.0 [229] 87.8 [217] 79.3 [382] 58.6 [1387]
25-29 66.0 [971] 93.8 [734] 100 [138] 100 [344] 74.2 [2187]
30-39 63.6 [1314] 58.9 [264] 81.0 [161] 64.0 [253] 58.8 [2072]
40-49 44.3 [882] 40.8 [181] 100 [158] 63.3 [240] 45.1 [1489]
50-64 41.8 [1036] 30.0 [131] 62.8 [216] 45.9 [327] 41.3 [1834]
65 and above 75.3 [476] 20.7 [37] 61.3 [117] 73.7 [335] 67.6 [1023]
Total 57.5 [14,443] 66.3 [8700] 80.2 [3052] 74.6 [6672] 62.9 [34,179]
Respondents who expressed they would NOT return to the same provider were asked why. The most frequently
provided reason was that the treatment had not been useful. Some other reasons cited were unfriendliness, lack
of cleanliness, long waiting time, unavailability of medicines, and distance.

38
Table 4.11 Reasons for not visiting this provider for next health problem with 95% CI*
Background characteristics
Not useful% Not
friendly% Not clean%
Long waiting time%
Medicines unavailable
% Too far% Other%
Total number
Sex
Male 75.6
[47.8,91.3] 8.7
[2.3,27.4] 6.7
[1.4,26.4] 3.4
[0.4,24.5] -- 6.2
[0.7,37.6] 5.9
[0.7,36.6] 12,399
Female 54.2
[27.7,78.4] 11.7
[3.1,35.7] -- -- 7.1
[1.6,27.2] 6.3
[1.3,24.9] 28.0
[12.0,52.6] 10,334
Age
under 5 70.3
[28.2,93.5] 10.9
[1.7,46.6] 7.0
[0.7,45.7] 6.6
[0.6,44.2] -- 3.9
[0.3,30.8] 7.9
[1.3,36.9] 5,336
5-14 78.4
[47.0,93.7] -- -- -- 7.2
[1.2,33.9] 14.3
[4.9,35.3] 7,481
15-19 -- 100 100 -- -- -- -- 823
20-24 85.3
[34.0,98.5] 14.7
[1.5,66.0] -- -- -- -- 23.7
[2.6,78.2] 1,006
25-29 100 -- -- -- -- -- -- 820
30-39 55.5
[12.5,91.6] 9.1
[0.9,52.1] -- -- 9.1
[0.9,52.1] -- 35.4
[4.7,85.8] 1,952
40-49 100 -- -- -- -- -- -- 1,959
50-64 44.2
[11.9,82.4] 21.0
[2.6,72.8 ] -- -- -- 10.8
[1.2,54.7] 24.0
[3.0,76.0] 2,865
65 and above -- -- -- -- -- 100 -- 491
Total 67.0
[49.1,81.1] 9.9
[3.9,23.1] 4.0
[0.9,16.5] 2.0
[0.2,14.4] 2.9
[0.6,12.5] 6.2
[1.4,21.9] 14.8
[6.7,28.0] 22,733
*multiple responses
Others: unfriendliness, uncleanliness, unavailability of medicines, distance
4.4 Travel and expenses related to receiving healthcare In poor urban settlements, data suggest that respondents prefer to visit facilities that are close to home.
Respondents were initially asked about transportation to facilities as an entry point in gauging level of difficulty
in accessing facilities. Those who spoke about self-treatment were not asked these questions.
Universally, across all age groups and sexes, similar modes of transportation were used to access facilities.
Around 50% of respondents traveled by foot, approximately 35% traveled by rickshaw, and less than 10% by
auto-rickshaws (CNG or battery driven). A very small proportion traveled by car, bus, ambulance, motorcycle,
bicycle, boat, and train.

39
Table 4.12 Main mode of transport to health facility for first visit with 95% CI
Background characteristics
Foot Rickshaw/van CNG/ easy
bike Others1 Missing Total number
Sex
Male 51.5[37.4,65.3] 36.1[19.7,56.5] 3.5 [1.6,7.6] 2.4 [0.5,12.9] 6.5 [3.6,11.4] 33,350
Female 50.9[42.5,59.1] 34.4[27.9,41.5] 3.9 [2.0,7.8] 2.6 [0.7,11.5] 8.2 [5.6,11.8] 22,294
Age
under 5 52.9[41.2,64.4] 37.9[24.6,53.3] 6.1 [2.9,12.3] 2.8 [0.6,15.1] 6.5 [3.6,11.5] 14,503
5-14 54.6[35.2,72.7] 40.1[21.3,62.3] 2.9 [0.8,9.6] 2.3 [0.4,13.2] 6.9 [3.9,12.1] 19,966
15-19 52.8[35.7,69.2] 37.0[24.3,51.8] 3.6 [0.8,15.5] 6.5 [0.9,40.2] 2.1 [0.3,14.1] 2,914
20-24 50.9[32.3,69.3] 38.3[22.0,57.8] 9.1 [2.0,33.1] 1.6 [0.2,10.6] 1.1 [0.1,8.1] 2,333
25-29 56.9[32.1,78.6] 42.1[20.4,67.4] -- 1.0 [0.1,7.7] 2.1 [0.3,13.5] 2,861
30-39 56.9[32.1,78.6] 42.1[20.4,67.4] -- 1.4 [0.2,10.0] 13.4 [6.6,25.4] 3,804
40-49 62.8[44.5,78.0] 31.8[17.1,51.3] -- 5.0 [0.8,28.3] 8.6 [4.3,16.7] 3,227
50-64 62.0[45.4,76.3] 30.6[19.5,44.6] -- 0.9 [0.1,6.6] 14.6 [7.2,27.1] 4,523
65 and above 47.5[23.7,72.5] 47.4[23.1,73.0] 5.1 [0.6,31.3] -- 4.5 [0.7,25.2] 1,514
Total 51.2[40.7,61.7] 35.4[23.4,49.6] 3.7 [2.0,6.8] 2.5 [0.7,9.0] 7.2 [5.0,10.1] 55,644 1Others: Bus, Car, Ambulance, Motorbike, Bicycle, Boat, Train.
Questions regarding the time for travel concerned: a) how long the respondent had to wait to get the transport
and b) how long the actual journey to the health facility took. The mean amount of time reported spent waiting
to get transport was 5 minutes for all age groups. It took an average 13 minutes to reach facilities once transport
had been accessed. Thus, the total duration for one-way travel to the health facility for respondents was 18.8
minutes. Younger and older age groups required slightly more time than adults; most probably because these
groups had a greater tendency to walk to a facility.
Table 4.13 Duration (mean) for one way travel to the health facility in minutes with 95% CI
Background characteristics
To get transport To reach facility (Journey time) Total travel time
Sex
Male 5.6 [4.1,7.2] 12.8 [11.0,14.5] 18.6 [15.8,21.3]
Female 4.5 [3.4,5.6] 13.9 [11.9,15.9] 19.1 [16.2,21.9]
Age
under 5 5.1 [3.4,6.9] 13.4 [10.8,16.1] 18.2 [15.0,21.4]
5-14 5.1 [3.9,6.4] 14.3 [12.2,16.5] 20.1 [17.0,23.2]
15-19 4.7 [0.5,8.9] 13.3 [8.3,18.2] 18.6 [9.5,27.7]
20-24 5.7 [1.3,10.2] 12.8 [8.7,16.9] 18.4 [10.8,26.0]
25-29 4.1 [1.1,7.0] 9.8 [7.9,11.8] 13.7 [10.1,17.4]
30-39 8.2 [0.4,16.0] 10.0 [7.9,12.1] 19.3 [10.1,28.5]
40-49 3.4 [1.2,5.6] 9.9 [7.4,12.5] 14.2 [9.7,18.7]
50-64 5.1 [1.9,8.4] 13.6 [9.9,17.2] 20.7 [14.8,26.6]
65 and above 4.8 [1.4,8.3] 16.4 [9.9,22.9] 21.0 [11.8,30.3]
Total 5.2[3.9,6.4] 13.2 [11.8,14.7] 18.8 [16.5,21.1]

40
Expenses related to acute health conditions involving multiple visits were also examined. Cost information was
collected according to various categories including transport, registration fees, consultation fees (or
hospitalization fees in case of hospital admission), diagnostic tests, drugs, unofficial payments and package costs
in cases where respondents were unable to breakdown their expenditure or who purchased a package of
healthcare services offered by a facility. The median statistic for categories where at least ten observations were
available (in each age and sex group) was considered to avoid extreme values and represent typical health
expenditure for the slum communities in SCC. Findings were segregated by sex and age group in Table 4.14. All
amounts were recorded in Bangladesh Taka (BDT).
While total median cost for all subgroups were under 200 taka, the greatest expenditure was on diagnostic tests
(up to 600 taka,) followed by drugs/medicines and consultation fees. Consultation fees are not recorded for
most subgroups probably due to self-treatment or treatment from pharmacy where no consultation fee is
charged. Unofficial payments such as bribes or tips were reported by eleven respondents only, and are therefore
not shown in the table.
Table 4.14 Median expenditure for healthcare around an episode of illness/health problem in BDT
Background characteristics
Transport Registration
fee
Consultation/ hospitalization
Fee Test Drug Package Total
Sex
Male 30 10 100 500 150 160 152
Female 40 20 200 580 150 275 190
Age
under 5 40 10 100 250 175 -- 200
5-14 40 10 175 500 150 250 150
15-19 40 15 -- -- 200 -- 180
20-24 40 25 -- -- 150 -- 240
25-29 40 20 -- -- 142 -- 150
30-39 30 10 -- -- 150 -- 180
40-49 30 20 -- -- 160 -- 185
50-64 40 20 300 -- 150 -- 185
65 & above 30 20 100 365 150 -- 180
Overall 40 10 175 520 150 200 170
To pay for the costs of healthcare, most respondents spent from “out-of–pocket” or from household wages.
Multiple sources of money were mobilized for each health care visit (Table 4.15). After household wages,
respondents reported using savings, followed by donations or loans.

41
Table 4.15 Sources of meeting medical expenses with 95% CI
Background characteristics
Household wages
Household savings
Donation from neighbor/friend
/relative
Loan from NGO/money
lender Others Missing
Total no.
Sex
Male 85.6[80.0,89.8] 4.9 [3.1,7.7] 0.7 [0.2,2.3] 0.5 [0.1,1.6] 1.7 [0.7,4.0] 8.7 [5.1,14.6] 34,058
Female 84.5[78.5,89.1] 4.1 [2.3,7.3] 2.1 [1.0,4.2] 0.9 [0.3,2.4] 2.3 [1.3, 4.0] 10.2 [6.4,15.7] 22,854
Age
under 5 87.6 [80.6,92.4] 2.4 [1.0,5.7] 1.4 [0.5,3.9] -- 1.9 [0.7,4.9] 8.6 [5.2,13.8] 14,759
5-14 84.5[78.0,89.3] 6.3 [3.9,10.1 ] 0.9 [0.2,4.32] 0.3 [0.0,2.4] 2.3 [0.7,6.6] 8.5 [4.1,16.9] 20,123
15-19 86.3[58.3,96.6 ] 0.9 [0.1,6.8] 2.2 [0.3,13.7 ] 1.9 [0.3,13.1] 13.7 [3.4,21.7] 2,943
20-24 93.7 [80.8,98.1] -- -- 3.2[0.5,19.1] 2.5 [0.3,16.4] 3.8 [0.8,6.4] 2,393
25-29 84.2[66.3,93.5 ] 11.5 [4.23,27.6] -- -- -- 10.5 [3.7,16.6] 3,007
30-39 75.8[61.9,85.9] 3.3[1.24,8.7 ] 1.6 [0.4,6.6] 1.4 [0.3,5.6] 3.8 [1.4,9.8] 17.3 [9.3,19.8] 4,024
40-49 85.9[76.1,92.0] 7.7 [2.8,19.7] 0.9 [0.1,6.3] 1.4 [0.2,10.1 ] 3.3 [1.1,9.6] 6.6 [2.9,14.6] 3,448
50-64 82.7[74.2,88.9] 3.6 [0.9,13.2 ] 2.8[0.7,10.9] 1.9 [0.4,7.9] -- 10.7 [5.8,19.2] 4,700
65 % above 87.3[66.5,96.0] 3.5 [0.5,22.4 ] 3.9 [0.5,25.4] 1.8 [0.2,12.6 ] -- 5.2 [0.6,31.8 ] 1,515
Total 85.2[80.5,88.9] 4.6[3.2,6.5] 1.3 [0.6,2.6] 0.6 [0.3,1.4] 1.9[1.1,3.3] 9.3 [6.2,13.7] 56,912
*multiple responses
Others: Borrowing, selling household objects.

42
Chapter 5. Chronic Health Issues and Related Health Care Seeking
Key Findings:
The mean duration of reported chronic health problems was 42 months or 3.5 years; this could
be as long as 7 years
Women in general complained of suffering for a longer duration than men
Shortness of breath, pruritus/itching, headache, abdominal pain/cramp, fever were some of the
more serious symptoms according to respondents Functional difficulty occurred in 66% percent of the age group 65 and above, which is a twofold
increment from the preceding age group. More women reported greater functional difficulty
than men Almost 90% people suffering from chronic health problems sought treatment Roughly 60% people saw an MBBS doctor in their last visit and 25% went to pharmacist/village
doctors Pharmacies and Government hospitals remained the most visited facilities for chronic health
problems
Effective treatment emerged as the most important factor for selecting a facility/provider
followed by cost of treatment For women, proximity and friendliness of the providers were the more important criteria
whereas man valued qualified doctors more People experiencing chronic health problems had to spend approximately 450 taka per month The highest monthly medical expenditures were recorded among those aged 65 and older at
1200 tk In general, household wages were the main source of coping with healthcare costs. However,
more women had to depend on donations from others than men. The most frequent reasons for not seeking care were: lack of money (58%), the perception that
the health problem would resolve by itself (44%), and not severe enough to warrant treatment
(38%)

43
This chapter reports on the health seeking behavior of those experiencing chronic health issues, defined here as
health problems lasting three or more months in duration. In the case of children of 0-14 years, their mothers
responded on their behalf. Analysis was conducted using weighted numbers on a total sample of 1,128
individuals. Table 5. 1 shows the number of respondents surveyed based on the sample size calculated for each
age group.
Table 5.1 Number of respondents surveyed by age and sex
Background characteristics Number Percent of cases
Sex
Male 532 47.0
Female 599 53.0
Age
0-5 308 27.2
6-14 313 27.7
15-19 26 2.3
20-24 47 4.2
25-29 54 4.8
30-39 121 10.7
40-49 97 8.6
50-64 112 9.9
65 & above 53 4.7
Total 1131 100
5.1 Characteristics of health problems Each respondent was asked to describe what symptoms/health problems they were experiencing that had
lasted three months. WHO International Classification of Primary Care (ICPC) codes were used5 to classify
responses. The most frequently mentioned symptoms included: general and unspecified health problems (49%),
respiratory problems (40%), digestive problems (34%), and musculoskeletal problems (28%). Symptoms were
experienced in similar proportions (less than 5% difference) comparing men and women with the exception of
respiratory problems, neurological problems, musculoskeletal problems, eye problems, and cardiovascular
problems.
5 World Health Organization. International Classification of Primary Care, Second edition (ICPC-2). Geneva

44
Table 5.2 Symptoms/health problems experiencing for 3 months or more by localization*
Background characteristics
A B C D E F G H I J K L M N O Total
number
Sex
Male 50.9 45.0 16.5 33.4 21.8 10.6 5.5 9.5 5.1 6.1 2.5 3.0 0.8 0.8 0.6 38,491
Female 48.1 36.7 28.1 34.7 33.5 10.4 13.1 9.4 12.2 5.5 3.5 3 .0 4.9 0.3 0.2 33,911
Age
Under 5 56.1 77.0 7.9 25.9 7.5 14.1 3.3 9.5 0.3 8.2 2.6 2.3 0.7 1.0 1.0 21,196
5-14 46.5 37.8 17.6 27.9 15.4 14.7 8.7 10.6 2.2 9 1.9 3.2 1.6 0.6 -- 20,444
15-19 53.8 11.5 38.5 34.6 19.2 15.4 11.5 3.8 7.7 11.5 3.8 -- 3.8 -- -- 1,688
20-24 42.6 25.5 23.4 61.7 34.0 6.4 8.5 12.8 4.3 -- 2.1 2.1 8.5 -- -- 2,334
25-29 53.7 22.2 29.6 42.6 35.2 11.1 3.7 7.4 14.8 3.7 3.7 3.7 5.6 -- -- 3,540
30-39 41.3 16.5 39.7 48.8 56.2 5.0 9.9 8.3 18.2 0.8 2.5 3.3 7.4 0.8 -- 7,578
40-49 43.3 21.6 30.9 45.4 52.6 5.2 14.4 5.2 16.5 3.1 5.2 4.1 5.2 -- 1.0 5,558
50-64 49.1 19.6 39.3 41.1 46.4 2.7 15.2 13.4 26.8 1.8 7.1 2.7 3.6 -- -- 6,858
65 and above 56.6 24.5 35.8 15.1 62.3 5.7 34.0 5.7 24.5 1.9 0 5.7 0 -- -- 3,206
Total 49.3 40.5 22.8 34.1 28.0 10.6 9.5 9.4 9.0 5.8 3.0 3.0 2.9 0.5 0.4 72,402 *multiple responses A- General and unspecified; B- Respiratory; C- Neurological, D- Digestive; E- Musculoskeletal, F- Skin, G- Eye, H- Endocrine/Metabolic and Nutritional, I-
Cardiovascular , J -Ear , K- Psychological, L- Urological, M- Genital (female), N- Genital (male), O - Pregnancy, Childbearing & Family Planning, Blood and
Immune mechanism
Table 5.3 displays the duration of chronic symptoms as described by respondents. The average duration of
chronic health issues rose incrementally with age; the highest was 85 months (7 years) in the ‘50-64 years’ age
group. Women experienced chronic illness 6 months more on an average (45 months) compared to men (39
months).
Table 5.3 Duration of illness among respondents with chronic health problems in months (mean)
Background characteristics Mean duration in
months
95% Confidence Interval Total Number
ub Lb
Sex
Male 38.9 31.2 46.7 38,491
Female 45.2 37.1 53.3 33,911
Age
Under 5 16.2 13.7 18.6 21,196
5-14 37.2 32.3 42.1 20,444
15-19 27.8 16.4 39.2 1,688
20-24 29.0 19.2 38.8 2,334
25-29 46.8 31.9 61.8 3,540
30-39 61.1 43.6 78.6 7,578
40-49 69.6 47.9 91.2 5,558
50-64 84.6 54.8 114.3 6,858
65 and above 68.4 46.0 90.7 3,206
Total 41.9 35.5 48.3 72,402

45
Respondents were asked to identify their most ‘severe’ symptom. Table 5.4 displays symptoms with highest
frequency in each disease category. Shortness of breath or dyspnoea was the most frequently reported severe
chronic health problem and was more prominent in men, children and older age groups. Older respondents also
complained about lower back pain (13.5%). Skin problems, such as itching, were most common among younger
age groups. Interestingly chest pain was considered relatively most severe in the 20-24 age group but less so in
older age group of those 65 years and above. This could not be further explored due to the closed nature of the
interview, however high levels in the young age group could be a result of any etiology of chest pain such as
digestion or muscular pain. Other symptoms that were recorded but not shown here were allergy, visual
disturbance, eye discharge, diarrhea, vomiting, jaundice, teeth symptom, high blood pressure, other
cardiovascular symptoms, ear infection and pain, hand ache, neck ache and many more.
Table 5.4 Most severe symptom respondents experienced for 3 or more months
Background characteristics a b c d e f g h i Total
n
Sex
Male 13.7 8.3 3.6 4.9 5.7 3.2 3.8 4.7 3.8 38,491
Female 9.3 5.9 8.8 5.3 3.4 5.3 4.5 3.1 2.1 33,911
Age
Under5 22.0 5.9 1.3 2.6 10.5 -- 1.3 3.6 0.3 21,196
5-14 11.3 10.6 8.7 6.8 4.8 0.3 3.9 2.9 1.6 20,444
15-19 3.8 11.5 7.7 11.5 3.8 -- 7.7 3.8 11.5 1,688
20-24 2.2 2.2 6.5 8.7 -- 6.5 10.9 2.2 10.9 2,334
25-29 5.6 3.7 7.4 3.7 1.9 3.7 3.7 1.9 7.4 3,540
30-39 1.7 4.2 7.5 7.5 -- 13.3 8.3 3.3 6.7 7,578
40-49 7.5 4.3 5.4 6.5 -- 11.8 9.7 6.5 7.5 5,558
50-64 5.4 -- 7.2 4.5 -- 5.4 9.0 2.7 8.1 6,858
65 and above 11.5 5.8 3.8 -- -- 13.5 3.8 3.8 1.9 3,206
Total 11.7 7.2 6 5.1 4.6 4.2 4.2 3.9 2.9 72,402 a-shortness of breath, b-pruritus/itching, c-headache, d-abdominal pain/cramp, e-fever, f- low back symptom, g-unspecified chest pain, h-arm symptom, i-
heartburn
Respondents were asked about the cause of their chronic symptoms (Table 5.5). Multiple answers were
accepted for this question. Approximately 36% of respondents in the age group of 65 years or more and 24% in
the age group of 50-64 years stated that age was the main cause of their chronic ailment. Almost 37% of
respondents did not know why they were suffering from symptoms. Other causes of illness were occupation (8%
men, 3% women), living environment (14% men, 7% women) and accident (9% men, 7% women).
Researchers applied two different scales to assess the severity of reported conditions. An adapted version of the
“Activities of Daily Living” (ADL) scale (which was also used in the BUHS, 2006) was applied on adults only. The
ADL scale includes eight daily tasks such as feeding, walking, carrying heavy load, dressing, going to bathroom,
bowing/squatting/kneeling, etc. that an individual should be able to perform in general. Based on feedback
during pre-testing, a “perform household chores/attend school/work” category was added. The difficulty level
for each task was recorded (easily/slight difficulty/much difficulty/cannot perform) and the scores combined to
give a proxy for severity of illness. Table 5.6 presents this data.

46
Table 5.5 Perception on cause of the symptom/health problems experiencing for last three months or more*
Background characteristics
Age [95% CI]
Occupation [95% CI]
Accident [95% CI]
Environment [95% CI]
Don’t Know [95% CI]
Others [95% CI]
Total number
Sex
Male 2.5
[1.4,4.6] 8.0
[5.3, 12.0] 9.0
[5.6,14.3] 13.5
[9.2, 19.3] 36.7
[29.0, 45.1] 30.3
[25.1,36.1] 38,491
Female 8.5
[6.3,11.4] 3.1
[1.9, 5.0] 6.6
[4.7, 9.1] 7.0
[4.7, 10.4] 36.6
[31.9,41.6] 29.7
[24.4,35.6] 33,911
Age
Under5 0.2
[0.0,1.8] -- 5.4
[2.6,10.9] 17.6
[12.7, 23.7] 38.9
[28.1, 51] 30.4
[21.9,40.5] 21,196
5-14 0.6
[0.1, 2.4] -- 8.6
[5.3,13.7] 15.4
[9.4, 24.3] 41.7
[34.1, 49.6] 28.4
[22.2,35.7] 20,444
15-19 -- -- 16.7
[5.9,39.4] 6.6
[1.0, 33.6] 26.3
[12.0, 48.2] 40.6
[22.5,61.6] 1,688
20-24 -- 10.9
[4.0,26.3] 12.1
[5.5,24.5] 2.4
[0.5,9.0] 39.7
[25.4, 55.9] 33.5
[19.2,51.7] 2,334
25-29 2.0
[0.3, 13.3] 12.1
[5.5,24.7] 23.9
[7.5,55.0] 3.2
[0.7, 13.6] 23.5
[13.2, 38.4] 31.2
[17.6,49.1] 3,540
30-39 6.0
[2.9, 12.2] 16.6
[8.8,29.3] 5.1
[2.5,10.3] 2.3
[0.5, 9.5] 29.2
[18.9, 42.1] 40.9
[31.4,51.1] 7,578
40-49 6.3
[3.0, 13.0] 13.2
[7.5,22.3] 9.7
[3.3,25.2] 0.6
[0.1, 4.5] 35.2
[26.4, 45.1] 28.6
[17.6,42.8] 5,558
50-64 24.3
[16.0, 35.1] 13.8
[7.4,24.2] 5.6
[2.5,12.0] 2.1
[0.6, 6.8] 35.6
[26.7,45.7] 22.5
[15.2,32.0] 6,858
65 and Above 35.8
[22.8,51.2] 8.3
[2.5,24.5] 2.9
[0.6,12.3] 2.5
[0.7, 7.9] 29.3
[16.5, 46.6] 21.5
[11.0,37.8] 3,206
Total 5.5
[3.9,8.0] 5.6
[3.6,8.5] 7.8
[5.2,11.7] 10.3
[7.0,14.9] 36.7
[30.5,43.4] 30.0
[24.8,35.9] 72,402
*Multiple responses possible
Others: not being breastfed, smoking, physical weakness, wrong treatment, using drugs, work at home, contagious, family history.
Higher proportions of females reported difficulty in their daily living activities compared to males -- 40% versus
21%. An incremental change across age groups was seen with a dramatic two-fold increase from ages 50-64 to
65 and above.
Table 5.6 Health related functional difficulty in adults due to chronic health problems
Background characteristics Functional Difficulty [95% CI] No functional difficulty [95% CI] Total number
Sex
Male 20.7 [14.8,28.3] 79.3 [71.7,85.2] 13,947
Female 40.4 [31.7,49.8] 59.6 [50.2,68.3] 16,815
Age
15-19 16.5 [5.9,38.2] 83.5 [61.8,94.1] 1,688
20-24 17.0 [7.0,35.9] 83.0 [64.1,93.0] 2,334
25-29 23.5 [12.7,39.3] 76.5 [60.7,87.3] 3,540
30-39 24.3 [14.6,37.7] 75.7 [62.3,85.4] 7,578
40-49 30.5 [21.0,42.1] 69.5 [57.9,79.0] 5,558
50-64 34.0 [22.8,47.4] 66.0 [52.6,77.2] 6,858
65 and above 65.9 [44.9,82.0] 34.1 [18.0,55.1] 3,206
Total 31.4 [25.6,37.8] 68.6 [62.2,74.4] 30,762

47
A second scale modified the play performance scale developed by Lanksy (26) to assess severity of illness in
children (Table 5.7). Lansky’s (26) 10 category scale (a 100 point scale with 10 point calibration) was originally
used on cancer patients under 16 years of age. For the purposes of this study, these were reduced to 5
categories to more easily assess the severity of health problems. According to parents’ responses, almost 40%
of all children, regardless of age and sex, experienced mild to moderate restriction in their daily activities. Forty
percent of children did not need any special care. More severe functional restriction appear in the 0-5 age group
as compared to children aged 6-14, although it might be expected that younger children would sleep more often
and for longer periods.
Table 5.7 Functional status of children suffering from chronic health problems
Background characteristics
Lansky Scale Total number No special care needed Mild to moderate
restriction Moderate to severe restriction
Fully Active [95% CI]
Active but tires more quickly/ irritable/fussy
[95% CI]
Not very active (sitting and lying around) /passive [95% CI]
Sleeping most of the time [95% CI]
Not interacting or responding to
others [95% CI]
Sex
Male 11.2 [7.7,16.0] 37.0 [31,43.5] 40.0 [31.8,48.8] 5.3 [2.91,9.35] 6.5 [3.78,11.0] 24,544
Female 17.3 [10.5,27.2] 30.6 [24.9,36.8] 40.2 [33.8,46.9] 5.3 [2.97,9.39] 6.5 [4.02,10.2] 17,096
Age
Under 5 10.2 [6.5,15.7] 37.8 [31.2,44.8] 38.7 [32.3,45.6] 5.9 [3.22,10.4] 7.3 [4.5,11.8] 21,196
5-14 17.4 [11.9,24.8] 30.7 [24.8,37.4] 41.5 [32.8,50.8] 4.7 [2.63,8.26] 5.6 [3.12,9.8] 20,444
Total 13.7 [9.92,18.6] 34.4 [30.6,38.4] 40.1 [34.0,46.5] 5.3 [3.5,7.93] 6.5 [4.29,9.7] 41,640
Figure 4 Proportion of cases who sought treatment for their health problems (n=72,365)
93.7 92.7 95.1 92.479.3
93.1 95.2 88 95 95.5 93.2
6.3 7.2 4.7 7.620.7
6.9 4.8 12 5 4.5 6.7
0102030405060708090
100
Male Female under 5 6-14 15-19 20-24 25-29 30-39 40-49 50-64 65 andAbove
Sex Age
Pe
rce
nt
No
Yes

48
5.2 Pattern of healthcare seeking
Figure 7 displays the proportion of respondents who sought care for their chronic health problems. At least 90%
of all groups had sought treatment at least once. The 15-19 and 30-39 age groups reported the lowest
proportions of treatment seeking - 79% and 88% respectively.
Those who did not seek care for their chronic symptoms were asked why. Multiple answers were acceptable for
this question. The most frequent reasons stated by respondents for not seeking care were: lack of money (58%),
and the perception that the health problem would resolve by itself (44%), or that the disease wasn’t severe
enough to warrant treatment (38%) (Table 5.8).
Respondents were also asked who decided whether (or not) treatment should be sought. As shown in Table 5.9,
most respondents with chronic disease stated parents (39%), followed by spouse (29%) and self-decision (28%).
Men stated that treatment decisions were their own to make more often than women (34% vs 22%). Generally,
however, decision-making around healthcare involved family. Thirty-five percent of females said their husbands
made decisions and 24% of men said that their wives made decisions about whether to seek treatment or not.
Parental decision making predominated in 0-5 (60%), 6-14 (63%), 15-19 (66%) age groups. Other family
members (most likely sons/daughters) made decisions for those between 50-64 years of age (31%), and 65 and
above (59%).
Tables 5.10 and 5.11 present data on the type of facility and provider providing treatment for chronic health
problems. Equal proportions of people went to pharmacies and government hospitals around 27%, followed by
doctor’s chambers6 (22%). Although no particular pattern was observed, it is noteworthy that more women
went to private and NGO clinics than men. Sixty-one percent of the respondents mentioned visiting MBBS
doctors, while 26% went to pharmacist/village doctors. Some also went to Homeopath doctors (2.5%),
Traditional Healers (2%), or talked over a mobile phone with homeopath doctor (1%).
Participants were asked why they chose the particular provider or facility for seeking treatment. Multiple
answers were accepted. Effective treatment emerged as the most important factor (41%) for selecting a
facility/provider across all age groups and sexes. Thirty-three percent of respondents indicated that cost was a
factor in selecting treatment. Women mentioned proximity to home and friendly providers more frequently
than men who valued the availability of qualified doctors more (Table 5.12).
6 Private practice by doctor’s not attached with any larger institute like hospital or clinic.

49
Table 5.8 Reasons for not seeking care for a chronic health problem or disability*
Background Characteristics
Lack of money [95% CI]
Thought would resolve by itself
[95% CI]
Not Severe [95% CI]
Not curable [95% CI]
Others [95% CI]
Total number
Sex
Male 53.4 [31.3,74.3] 57.7 [37.3,75.8] 41.7 [23.5,62.5] 4.6 [0.5,29.2] 12.4 [2.3,62.3] 2428
Female 50.1 [31.5,68.7] 29.7 [16.5,47.4] 34.8 [20.4,52.6] 6.0 [1.7,19.8] 17.2 [3.8,77.7] 2438
Age
Under5 65 [43.3,81.8] 45.2 [22.8,69.7] 41.2 [18.8,67.9] -- 5.2 [0.6,32.3] 998
5-14 54.1 [31.2,75.3] 48.6 [27.2,70.6] 22.1 [7.51,49.8] 7.14 [0.9,39.7] 21.5 [5.8,76.6] 1550
15-19 11.6 [1.1,61.3] 68.8 [41.5,87.2] 36.0 [14.5,65.2] -- 19.4 [1.9,75.1] 349
20-24 54.6 [14.2,89.7] 22.0 [3.64,67.8] 6.1 [0.62,39.8] -- -- 161
25-29 68.3 [21.2,94.5] 15.7 [1.62,67.9] 16.0 [1.65,68.4] -- 46.2 [8.6,88.7] 169
30-39 39.6 [15.9,69.4] 51.1 [24.3,77.3] 66.9 [35.4,88.2] -- 9.6 [1.2,60] 909
40-49 28.2 [3.6,80.5] 0 13.6 [1.5,62.3] 52.7 [13.7,88.7] 37.4 [4.4,14] 279
50-64 49.5 [10.1,89.5] 50.5 [10.5,89.9] 50.5 [10.5,89.9] -- -- 306
65 & above -- -- -- -- -- 145
Total 51.8 [38.3,65.0] 43.7 [30.9,57.4] 38.3 [25.4,53.0] 5.3 [1.8,14.4] 14.8 [3.1,70] 4866 *Multiple responses possible
Others include carelessness, family problem, side effect of medicine, too expensive, inconvenient service hours, no one to accompany, didn’t know where to go.
Table 5.9 Decision maker for seeking/not seeking treatment while experiencing health problem for 3 months or more
Background Characteristics
Parent [95% CI]
Spouse [95% CI]
Self [95% CI]
Other family [95% CI]
Mother-in-law [95% CI]
Father-in-law [95% CI]
Others [95% CI]
Total number
Sex
Male 43.6 [35.2,52.4] 23.7 [18.0,30.5] 34.0 [27.4,41.4] 7.6 [5.6, 10.2] 1.6 [0.6, 4.5] 0.8 [0.2,3.1] 0.6 [0.2, 1.8] 3,8491
Female 35.0 [29.0, 41.5] 34.8 [29.7,40.4] 22.1[17.7,27.2] 15.1 [12.4,18.3] 1.7 [1.0, 2.9] 0.3 [0.1,1.2] 0.9 [0.3, 2.3] 3,3911
Age
Under5 60.3 [50.6,69.3] -- -- 4.6 [1.9, 10.7] -- -- 0.4 [0.0, 2.9] 21,196
5-14 62.5 [50.7,72.9] -- -- 4.5 [2.2, 9.2] -- -- 0.4 [0.1, 3.0] 20,444
15-19 65.6 [48.9,79.2] 5.9 [1.4, 22.0] 4.1 [0.8, 17.8] 14.6 [4.6, 37.6] 8.6 [2.6, 24.6] -- -- 1,688
20-24 28.7 [15.5,46.7] 41.6 [23.8,61.9] 28.6 [16.2,45.4] 15.7 [7.3,30.6] -- 1.2[0.2,8.9] -- 2,334
25-29 18.5 [8.3, 36.5] 35.9 [22.6,51.8] 59.8 [42.1,75.2] 2.7 [0.7, 9.5] -- -- 3.2 [0.7,12.8] 3,540
30-39 7.3 [3.5, 14.7] 41.1 [32.6,50.2] 59.3 [49.7,68.3] 7.8 [4.0, 14.7] -- -- 0.5 [0.1,3.8] 7,578
40-49 0.5 [0.1, 3.9] 37.8 [26.8,50.3] 59.4 [48.3,69.6] 14.6 [7.8,25.7] -- -- -- 5,558
50-64 0.8 [0.1, 6.2] 27.3[18.9,41.3] 50.3 [38.6,62.0] 31.2[22.5, 1.4] -- -- 2.7 [0.8, 8.4] 6,858
65 and Above -- 8.7 [2.7, 24.8] 44.7 [29.0,61.5] 58.7 [42.7,73.1] -- -- -- 3,206
Total 39.5 [33.4,46.0] 28.9 [24.5,33.8] 28.4 [24.3,32.9] 11.1 [9.3,13.2] 1.7 [1.0,2.9] 0.6 [0.2,1.6] 0.7 [0.3,1.4] 72,402
Others include: Teacher, Friends.

50
Table 5.10 Type of facility visited for healthcare the last time respondent sought care for a chronic health problem
Background characteristics
Pharmacy [95% CI]
Govt. Hospital [95% CI]
Doctor's chamber [95% CI]
Private clinic [95% CI]
NGO clinic [95% CI]
Others [95% CI]
Total number
Sex
Male 27.6[21.7,34.4] 26.8[22.1,31.9] 14[10.4,18.5] 25.1[19.6,31.5] 0.204[.0519,.8] 4.9 [2.4,11.4] 38,491
Female 24.7[20.2,29.7] 27.3[20.5,35.4] 18[13.4,23.8] 17.3[12.9,22.8] 3.1[1.63,5.81] 6.8 [3.8,12.8] 33,911
Age
Under 5 27.9[20.7,36.3 ] 31.4[24.9,38.6] 14.9[10.5,20.8] 19[74.7,86.1] 0.324[.1,1.4] 6.1 [2.9,13.3] 21,196
5-14 21.8[16.6,28] 30.5[22.8,39.4] 13.4[8.8,19.9] 23.1[15,33.9]] 1.9[.86,4.1] 6.4 [3.9,12.4] 20,444
15-19 24.1[11.3,44.3] 16.3[5.72,38.3] 24.1[10, 47.5]] 6.39[1.51,23.3] 4.38[.6,25.7] 4.1 [0.5,26.2] 1,688
20-24 16.3[8.68,28.4] 42.9[23.9,64.3] 17.4[6.9,37.2] 15.9[6.32,34.5] 1.65[.2,10.7] 5.1 [1,26] 2,334
25-29 40.2[22.6,60.7] 19.7[10.6,33.6] 21.2[11.2,36.3] 17.9[9.1,32.2] 4.23[1,16] 1.3 [0.2,10] 3,540
30-39 28.1[20.7,37] 16.5[10.2,25.6] 13.1[6.4,24.8] 20.9[13.4,31.1] 3.28[1.07,9.6] 7.4 [2.3,28.5] 7,578
40-49 24[15.8,34.7] 18.5[10.1,31.6] 17.5[11.2,26.5] 28.5[16.1,45.3] 1.62[.224,10.8] 8.8 [2.3,35.4] 5,558
50-64 29.7[21.1,40] 25.9[15.2,40.5] 20.2[12.6,30.8] 22.4[14.3,33.5] 1.04[.139,7.4] 4.4 [1.1,17.6] 6,858
65 and Above 28.8[16.7,45.1] 20.7[7.73,44.8] 21[9.9,39.1] 30[19.2,43.6] 3,206
Total 26.2[21.9,31.1] 27[21.9,32.9] 15.9[12.5,19.9] 21.5[16.9,26.8] 1.56[.858,2.81] 5.8 [3.9,9.0] 72,402 Others include: Spiritual, Traditional, and Homeopath
Table 5.11 Type of provider visited for healthcare the last time respondent sought care
Others: religious leader, ayurvedic doctor/pharmacy, kabiraj/traditional healer, neighbor, community health worker, over mobile phone traditional healer
Table 5.12 Reasons behind choosing the facility/provider for seeking care/treatment* for a chronic condition
Background characteristics
MBBS doctor [95% CI]
Pharmacist/ village doctor [95% CI]
Homeopath doctor [95% CI]
Mobile phone (Homeo Dr.) [95% CI]
Self-treatment [95% CI]
Others [95% CI]
Total number
Sex
Male 64.0 [55.8,71.4] 29.6 [22.8,37.3] 2.3 [1.3,4.2] 1.3 [0.2,6.5] 0.9 [0.4,2.5] 3.3 [1.9,5.7] 36,062
Female 66.4 [61.0,71.5] 25.5 [20.3,31.4] 2.7 [1.9,4.7] 1.6 [0.5,4.1] 1.2 [0.5,2.7] 5.0 [3.2,7.7] 31,437
Age
Under5 63.4 [53.4,72.4] 29.5 [21.5,39.0] 2.4 [1.1,5.04] 1.7 [0.4,7.6] 0.5 [0.1,2.3] 3.8 [2.2,6.4] 20,162
5-14 68.1 [61.3,74.1] 22.1 [16.1,29.4] 4.6 [2.5,8.3] 2.3 [0.7,7.6] 1.2 [0.4,4.0] 3.6 [1.9,6.7] 18,893
15-19 59.9 [37.1,79.1] 30.4 [14.1,53.7] 5.1 [0.6,31.4] 4.5 [0.6,26.2] -- -- 1,339
20-24 79.9 [64.4,89.7] 15.3 [8.2,26.6] -- -- -- 4.7 [0.9,20.5] 2,173
25-29 56.1 [36.1,74.4] 42.2 [24.0,62.8] -- -- -- 3.1 [0.6,15.1] 3,372
30-39 59.1 [49.7,67.8] 35.8 [26.7,45.9] 1.3 [0.3,5.9] -- 2.3 [0.7,7.8] 7.4 [3.6,14.7] 6,669
40-49 60.6 [49.6,70.6] 26.3 [17.7,37.1] 4.2 [1.2,14.3] 2.6 [0.4,16.2] 2.6 [0.4,16.2] 4.1 [1.1,14.1] 5,279
50-64 70.8 [57.0,81.7] 26.0 [17.0,37.5] 0.5 [0.1,3.5] -- 1.2 [0.3,5.2] 5.2 [1.8,13.8] 6,552
65 & above 68.7 [52.7,81.2] 30.2 [17.8,46.4] -- -- -- 2.2 [0.5,9.4] 3,061
Total 65.1 [59.5,70.4 ] 27.7 [22.6,33.4] 2.6 [1.7,4.0] 1.4 [0.4,5.3] 1.1 [0.5,2.0] 4.1 [3.0,5.5] 67,499

51
Background characteristics
Effective treatment
Low cost/free
Close to home
Qualified doctors
Prior experience
Recom-mended
Friendly provider
Medicines available
Lack of money
Others Total
number
Sex
Male 41.2 [32.4,50.7]
31.6 [26.5,37.2]
24.3 [19.5,29.9]
23.6 [18.1,30.1]
14.8 [9.5,22.3]
10.0 [7.2,13.8]
8.9 [6.1,12.9]
6.6 [4.4,9.8]
3.6 [2.1,6.3]
5.7 [1.9,16.6]
38,491
Female 41.4 [34.5,48.6]
34.3 [28.4,40.7]
27.9 [23.8,32.5]
17.7 [14.1,21.9]
12.8 [8.9,18.0]
11.3 [8.6,14.7]
11.8 [8.4,16.5]
8.4 [6.0,11.6]
5.1 [2.9,8.6]
3.9 [1.7,9.6]
33,911
Age
Under5 46.0 [36.4,55.9]
32.3 [25.6,39.8]
27.5 [22.0,33.8]
19.9 [13.6,28.0]
18.8 [11.9,28.5]
5.8 [3.8,8.7]
7.5 [4.0,13.5]
7.3 [4.2,12.6]
1.7 [0.6,4.9]
5.9 [0.9,15.3]
21,196
5-14 39.0 [29.5,49.5]
37.5 [29.2,46.6]
21.8 [16.9,27.6]
25.7 [19.5,33.1]
10.8 [6.0,18.6]
14.6 [10.0,20.8]
10.2 [5.6,18.0]
6.5 [3.8,11.0]
4.5 [2.4,8.3]
3.6 [1.4,11.1]
20,444
15-19 42.6 [20.1,68.7]
24.0 [11.4,43.6]
19.3 [8.4,38.3]
11.5 [2.7,38.1]
9.1 [2.3,29.7]
20.6 [8.0,43.5]
13 .0 [3.6,37.5]
9.0 [2.1,31.3]
6.6 [1.0,33.6]
1.8 [0.2,13.2]
1,688
20-24 36.2 [24.3,50.1]
30.2 [16.9,47.8]
24.2 [12.8,41.1]
11.9 [4.7,26.9]
14.5 [7.2,27.1]
7.2 [1.4,30.2]
13.1 [5.5,28.1]
5.5 [1.3,20.6]
2.4 [0.3,15.3]
7.8 [1.6,36.7]
2,334
25-29 40.0 [20.5,63.4]
30.6 [17.0,48.7]
30.4 [18.1,46.3]
17.9 [9.3,31.5]
9.8 [3.6,24.4]
6.6 [2.3,17.5]
6.7 [1.8,21.7]
9.8 [1.8,39.6]
3.0 [0.7,12.0]
4.3 [0.8,22.4]
3,540
30-39 36.4 [26.2,47.8]
30.9 [23.7,39.2]
30.2 [20.5,42.1]
14.8 [9.5,22.4]
13.4 [7.3,23.5]
9.0 [5.5,14.5]
21.9 [13.6,33.4]
8.8 [4.8,15.5]
7.0 [3.6,13.3]
4.9 [1.3,9.8]
7,578
40-49 44.5 [32.1,57.6]
27.3 [14.6,45.1]
20.9 [13.5,30.8]
19.6 [12.5,29.4]
6.6 [2.7,15.4]
13.8 [7.0,25.4]
8.7 [4.0,18.0]
9.1 [4.3,18.4]
5.0 [2.1,11.4]
6.5 [1.1,21.5]
5,558
50-64 38.9 [28.9,50.0]
34.8 [25.6,45.4]
31.4 [23.5,40.6]
23.6 [16.2,33.2]
13.1 [7.4,22.1]
12.2 [7.1,20.2]
6.5 [3.0,13.4]
7.9 [4.2,14.2]
9.9 [4.7,19.5]
5.3 [1.1,17.5]
6,858
65 & Above 40.4 [25.0,58.0]
26.3 [14.3,43.4]
30.6 [15.0,52.3]
21.3 [11.5,36.0]
22.2 [10.7,40.4]
13.9 [6.3,27.9]
12.7 [5.7,26.0]
4.8 [1.4,15.3]
2.2 [0.5,9.4]
2.6 [0.4,16.6]
3,206
Total 41.3 [33.5,49.7]
33.0 [27.5,39.0]
26.1 [21.7,31.2]
20.7 [16.1,26.0]
13.8 [9.2,20.2]
10.7 [7.9,14.3]
10.3 [7.2,14.7]
7.5 [5.2,10.7]
4.3 [2.5,7.4]
4.8 [1.8,10.6]
72,402
*Multiple responses
Others include: known person works in the selected hospital, religious belief, special skills, clean, privacy maintenance, female doctor available.

52
Those who sought treatment also reported the number of times they visited a ‘facility’. The question
was skipped if the respondent mentioned self-treatment. Table 5.13 indicates that that 84% of
respondents experiencing chronic health problems visited health providers once in a month or more,
15.8% visited health providers every 2 to 3 months, and the rest paid visits 1 to 2 time a year. Monthly
visits were reported more frequently among men (85%) than women (83%).
Table 5.13 Frequency of consulting a healthcare provider for chronic health problems.
Background characteristics
Every month or more frequently
Every 2-3 months 1-2 times/Year Total number
Sex
Male 85.1 [74.4,91.8] 14.7 [8.1,25.4] 0.2 [0.0,0.8] 35,498
Female 82.8 [73.3,89.4] 16.8 [10.3,26.3] 0.4 [0.1,1.8] 30,298
Age
Under5 86.1 [72.4,93.7] 13.9 [6.3,27.6] -- 19,879
5-14 82.1 [70.3,89.8] 17.5 [9.8,29.4] 0.4 [0.1,1.9] 18,262
15-19 89.4 [65.1,97.4] 10.6 [2.6,34.9] -- 1,339
20-24 83.2 [62.6,93.6] 13.2 [4.4,33.3] 3.6 [0.5,23.7] 2,173
25-29 87.4 [71.8,95.0] 12.6 [5.0,28.2] -- 3,107
30-39 90.0 [79.3,95.5] 9.7 [4.3,20.5] -- 6,380
40-49 87.4 [77.6,93.3] 12.6 [6.7,22.4] -- 5,089
50-64 75.7 [64.7,84.1] 24.3 [15.9,35.3] -- 6,506
65 and Above 76.3 [59.1,87.7] 23.7 [12.3,40.9] -- 3,061
Total 84.0 [73.9,90.6] 15.8 [9.2,25.9] 0.2 [0.1,1.3] 65,796
5.3 Healthcare cost and coping mechanism Healthcare costs for chronic conditions are considered to be an economic burden regardless of socio-
economic status. To understand the implications of such costs for residents of poor urban settlements in
SCC, questions were asked about healthcare related expenditures during their most recent visit to a
healthcare provider. If the respondent was unable to remember how much was spent for each item
separately or if they bought a package of healthcare, the total expenditure was recorded under the head
“package”. In a separate question, information on their monthly expenses on health was recorded. The
median expenses for each expenditure head during the most recent visit, as well as mean monthly
expenses are shown in Table 5.14. Once again, cost was only reported when there was a minimum of
ten respondents in a given category for each subgroup.
When the median total cost of the most recent visit to a health care provider is examined, it appears
that 50% of respondents had to pay up to 400 taka, with older age groups spending somewhat more -
between 500 and 700 taka. The median cost of drugs for those aged 65 and over was comparatively
higher than all other age groups (600 taka).
On average, people experiencing chronic health problems had to spend approximately 450 taka per
month. The highest monthly expenses were recorded among those aged 65 and older (800 tk/month).

53
Table 5.14 Median health-related expenditure for chronic illness during the most recent visit to a health
provider, and mean monthly expenditure in BDT
Background characteristics
Expenditure in most Recent Visit (median) Monthly expenditure
(mean) Transport Registrat-
ion Consultation/
Hospitalization Test Drug Package Other Total
cost
Sex
Male 40 10 300 660 300 800 625 395 464
Female 50 10 300 500 300 1000 340 370 422
Age
under 5 40 10 200 450 300 1200 330 320 400
5-14 50 10 200 550 300 450 350 340 261
15-19 30 -- -- -- 300 -- -- 450 195
20-24 50 10 300 575 400 -- -- 525 277
25-29 100 20 400 500 400 -- -- 580 372
30-39 45 20 200 600 300 -- -- 340 609
40-49 60 10 400 600 400 -- -- 500 510
50-64 40 10 500 500 500 -- -- 725 693
65 and above 40 20 -- -- 600 -- -- 600 1,214
Total 50 10 300 500 300 1000 360 383 444
The final questions in the chronic illness module asked respondents to report how they paid for chronic
illness treatment. Multiple responses were permitted. Almost 79% of respondents paid using their
household wages. Other possible sources of money were: donation from a neighbor (5.4%), savings
(5%), and borrowing money from lender (2.4%). Males (81%) reported spending household wages more
than females (76%). Women (8%) paid for their treatment using donations from neighbors more often
than men (3%) (Table 5.15).

54
Table 5.15 Ways of meeting health expenditures
Background characteristics
Regular household
wages
Donation from a
neighbor
Savings Borrowing money from
lender
Borrowing money from
NGO
Others Total number
Sex
Male 81.1 [75.5,85.6]
2.9 [1.4,6.0]
4.9 [2.9,8.2]
2.1 [1.0,4.1]
1.1 [0.5,2.5]
2.5 [1.2,6.2]
38,491
Female 76.4 [70.5,81.4]
7.8 [5.3,11.3]
4.8 [2.3,9.7]
2.7 [1.6,4.5]
0.4 [0.2,1.1]
3 [1.4,6.5]
33,911
Age
Under5 83.2 [74.2,89.5]
4.4 [1.8,10.4]
3.5 [1.8,7.0]
2.7 [1.2,5.8]
0.1 [0.0,1.2]
3.0 [1.3,7.4]
21,196
5-14 79.7 [74.5,84.1]
3.3 [1.7,6.5]
3.6 [1.7,7.2]
2.0 [0.8,4.9]
0.2 [0.0,1.3]
2.2 [0.7,9.0]
20,444
15-19 68.7 [44.2,85.9]
1.8 [0.2,13.2]
4.8 [0.7,27.6]
-- -- 4.1 [0.5,26.2]
1,688
20-24 71.1 [57.2,81.9]
1.3 [0.2,9.7]
13.1 [5.5,28.0]
-- 1.2 [0.2,8.9]
5.9 [1.6,22.5]
2,334
25-29 80.0 [63.6,90.1]
7.2 [2.8,17.2]
2.7 [0.7,9.2]
4.0 [1.1,13.7]
2.8 [0.5,13.4]
3.1 [0.7,12.7]
3,540
30-39 76.4 [68.8,82.6]
6.9 [3.6,12.6]
5.1 [1.9,12.9]
2.4 [0.6,8.8]
0.9 [0.1,6.6]
1.8 [0.5,5.8]
7,578
40-49 73.8 [64.4,81.5]
7.5 [3.5,15.1]
9.2 [4.5,18.1]
2.4 [0.5,9.9]
2.2 [0.6,7.1]
3.9 [1.3,12.5]
5,558
50-64 77.8 [67.8,85.3]
6.4 [2.8,14.4]
8.8 [4.3,17.3]
3.2 [1.2,8.0]
2.9 [0.8,10.3]
0.7 [0.1,5.7]
6,858
65 and Above 72.5 [54.8,85.2]
14.3 [6.0,30.5]
1.9 [0.3,12.6]
1.7 [0.4,7.1]
-- 4.7 [1.3,16.2]
3,206
Total 78.8 [73.0,83.5]
5.2 (3.6,7.4)
4.9 [2.6,9.0]
2.4 [1.3,4.3]
0.8 [0.4,1.8]
2.8 [1.4,6.4]
72,402
*Multiple responses possible
Others include: Borrowing money from friend/ relatives/ neighbor, by Begging, Mortgaging valuables, Taking Loan from friend/
relatives/ family members, selling household objects, donation from NGO.

55
Chapter 6. Family Planning
Family planning use in Bangladesh has been widely praised as a success story (13). Despite this success,
low rates of contraceptive prevalence and larger than average family size continue to characterize Sylhet
Division (27). Six hundred and thirty respondents provided information on family planning. Respondents
were all currently married females between the ages of 15-49. Analysis was conducted on weighted data
(weighted to reflect the likelihood of selection at each stage of sampling). Six hundred and twenty-seven
cases were available for analysis. Of these, a very small number (<2.2%, n=14) reported that they were
the head of the household. Nearly 8% of respondents were pregnant at the time of the survey, with an
additional 1% “unsure” (Table 6.1). Those women who were pregnant were not asked questions about
current use of contraceptives, but were asked about experiences with contraceptives as well as
knowledge of contraceptives.
Only 66% women were using some type of contraceptive method to avoid pregnancy. This proportion is
higher than current contraceptive prevalence rates in Sylhet Division (44.8%) as reported in the 2011
BDHS. This proportion is closer to that of urban population (64%) (27), therefore suggesting that
women’s use of contraception in urban Sylhet is more aligned with women’s contraceptive use in urban
Bangladesh than that of rural Sylhet.
Key Findings:
Only 66% of non-pregnant women were currently using some type of contraceptive
method to avoid pregnancy currently, mostly modern methods
Use of modern methods is higher in younger age groups and declines with
increasing age
Use of IUD and implant use was lower than national level
Not all women who wanted to avoid pregnancy were using a contraceptive method
Knowledge of methods was high
Percentage ever used (any contraceptive) was less than the percentage currently
using, indicating high rate of discontinuity
Common reasons for discontinuing a method were side effects and switching to
other methods
Some reported distrust for IUDs, husband’s disapproval for condoms, and difficulty
in obtaining injectables
15.4% of married women of reproductive age (both pregnant and not pregnant)
reported never using contraceptives
Most reported no specific reason (31%) followed by the desire to have children
(30%) for never using any method.

56
Table 6.1 Current pregnancy status of all currently married females of reproductive age
Percent of women [95% CI] Total number
Current pregnancy status
Pregnant 7.9 [5.4,11.4] 2,999
Not pregnant 91.1 [86.6,94.2] 34,571
Not sure 1.0 [0.4,2.0] 385
Total 100 37,955
Non pregnant women currently using contraception
Yes 65.5 [60.7,70.1] 22,658
No 34.5 [29.9,39.3] 11,913
Total 100 34,571
Use of contraceptives was compared by age of respondent and education. The majority of women who
were not using contraceptives at the time of the questionnaire were between the ages of 45-49 years.
Table 6.2 displays analysis for age and contraceptive use. The use of modern methods is higher in the
younger age groups and declines with increasing age although no particular trend emerged for levels of
education. It should be noted that the apparent decline in use of contraception among women with
graduate level education is misleading due to the small sample size for this group.
Table 6.2 Percent distribution of current use of any contraception by education and age among currently married and not pregnant females between the ages of 15-49.
Background characteristics
Any contraceptive Modern method Traditional method
No contraceptive Total women
Age
15-19 66.6 [49.0,80.5] 64.2 [47.7,77.9] 2.3 [0.3,15.3] 33.4 [19.5,51.0] 2,338
20-24 69.7 [59.3,78.4] 66.5 [55.8,75.8] 3.2 [0.6,15.4] 30.3 [21.6,40.7] 6,831
25-34 72.0 [64.0,78.8] 67.9 [59.6,75.2] 4.09 [1.9,8.6] 28.0 [21.2,36.0] 16,308
35-44 57.1 [46.0,67.4] 50.1 [39.3,61.0] 6.9 [3.1,14.8] 42.9 [32.6,54.0] 10,236
45-49 36.1 [19.4,56.9] 24.2 [12.2,42.2] 11.9 [2.9,37.6] 63.9 [43.1,80.6] 2,252
Education
None 62.6 [55.2,69.4] 56.9 [49.2,64.3] 5.7 [2.9,10.8] 37.4 [30.6,44.8] 14,922
Primary 64.4 [54.5,73.2] 59.5 [48.9,69.2] 4.9 [2.4,9.9] 35.6 [26.8,45.5] 13,680
Secondary 70.6 [59.1,80.0] 68.0 [56.9,77.4] 2.6 [0.9,7.6] 29.4 [20.0,40.9] 7,791
Higher Secondary 63.7 [41.7,81.2] 43.5 [23.9,65.5] 20.2 [5.9,50.6] 36.3 [18.8,58.3] 858
Graduation 49.7 [5.15,94.7] 49.7 [5.2, 94.7] -- 50.3 [5.3,94.8] 714
Total 64.8 [60.0,69.4] 59.7 [53.5,65.7] 5.2 [3.3,8.1] 35.2 [30.6,40.0] 37,965
One- third of married and non-pregnant women stated they were not currently using any method to
delay or avoid getting pregnant. Women who weren’t pregnant and weren’t using family planning
methods were asked the reason for not using these methods (Table 6.3). Interviewers coded
respondent’s open-ended responses into pre-defined categories, and more than one response was

57
possible. They were most likely to say that their menstruation had stopped for some reason 7, followed
by not having sex or infrequent sex, wanting more children and postpartum amenorrhea. Other
common reasons included fear of side effects and currently breast-feeding. These reasons for not using
are more detailed than reasons for discontinuation in the BDHS, where the majority of women selected
reasons that were mutually exclusive and could not be tallied.
It should not be assumed that women who are not using do not want to use contraception. The BDHS
suggests that % demand satisfied8 in Sylhet is 72.1% and 80.8% in urban Bangladesh, which would
suggest that there is demand for contraception among the study population.
Table 6.3 Reasons for currently not using contraception* (n=12,297)
Reason for not currently using contraception Percentage [95% CI] Total women
Menstruation stopped 23.5 [16.9,31.6] 2,889
Not having or infrequent sex 19.5 [13.0,28.2] 2,395
Want to have children 18.0 [12.1,25,8] 2,208
Postpartum amenorrhea 14.0 [9.0,21.2] 1,726
Fear of side effects 10.3 [5.5, 18.3] 1,262
Breast feeding 7.2 [3.7, 13.4] 885
No reason given 6.9 [3.4, 13.5] 820
Felt that conception should be left to fate 6.3 [2.5, 11.3] 778
Husband opposed 4.9 [2.3, 10.0] 599
Knows no source 2.3 [0.7, 7.3] 280
Religious reasons 1.4 [0.5, 4.0] 169
Inconvenient to use 1.3 [0.4, 4.0] 155
Others opposed 1.1 [0.3, 4.7] 140
Costs too much 0.5 [0.1, 3.8] 65
Respondent opposed 0.3 [0.0, 2.6] 42 *multiple responses
More than half of the women who used family planning methods reported using oral contraceptives
(hereafter referred to as “the pill”) (53.7%). This is consistent with national-level figures. The next most
common method was injection (15.7%), followed by condoms (9.1%), and female sterilization (8.6%).
The proportions using these methods is higher than the national average, however, IUD and implants
are more widely used nationally. Table 6.4 displays the proportion of women using different methods of
contraceptives.
7 It was unclear whether menstruation stopping was viewed as a side effect of contraceptives, a broader health concern, or due to other factors. 8 The BDHS defines percentage of demand satisfied as total contraceptive use divided by the sum of unmet need plus total contraceptive use. Unmet need refers to the need for spacing plus need for limiting. Total demand for planning is defined as the sum of unmet need plus total contraceptive use.

58
Table 6.4 Type of contraceptive used currently by non-pregnant women of 15-49 age*
Current method Percent of women Total women
Pill (oral contraceptives) 53.7 [48.3,59.1] 12,175
Injection 15.7 [11.5,21.0] 3,552
Condom 9.1 [6.0,13.6] 2,068
Female sterilization 8.6 [5.7,12.8] 1,951
Safe period9 4.8 [2.2,10.2] 1,090
Implants 2.8 [1.6,5.1] 641
Withdrawal 2.3 [1.1,4.7] 516
Male sterilization 1.5 [0.6,3.4] 329
IUD/Cu-T 0.6 [0.2,1.9] 138
No answer 1.0 [0.4,2.7] 227
Other 0.9 [0.3,2.4] 198
Total 100 22,885
When asked where they sourced their current method of contraception from 9excluding sterilization),
they most commonly reported pharmacies (49.2%), followed by NGO clinics (27.3%) and government
hospitals (12.4%) (Table 6.5). These figures were starkly different from BDHS figures in which the
majority of contraceptives came from public sector facilities.
While women are reporting accessing contraceptives at pharmacies, it is unclear whether they receive
proper information about use. In light of the known conservatism of the Division, it is unlikely that a
male pharmacist would comfortably speak with women about appropriate contraceptive use. Indeed, it
is unclear whether it is women who procure contraceptives or rather their husbands.
9 The ‘safe period’ method is also referred to as periodic abstinence. It is a traditional method.

59
Table 6.5 Source of current contraception
Source Percent of women 95% Confidence Interval Total women
lb ub
Pharmacy 49.2 42.1 56.3 8,597
NGO clinic 27.3 20.8 34.9 4,766
Government hospital 12.4 8.6 17.5 2,163
Private clinic/ hospital 3.2 1.6 6.5 562
NGO health worker 2.6 0.8 7.7 452
FWA/FWV/CSB 1.1 0.3 4.4 191
Don’t know 0.6 0.1 2.3 99
Other 3.7 1.5 8.8 654
Total 100 17484
All women of reproductive age were also asked about their future birth plans (Table 6.6). These figures
do not correlate with contraceptive use. Based on desire for more children now, at least 77% of women
should be using some kind of family planning method.
Table 6.6 Future birth plans of all married women age 15-49
Future birth plan
Pregnant [95% CI]
Not pregnant [95% CI]
Not sure [95% CI]
All married women age
15-49 [95% CI]
Total wome
n
Want more children now 3.5 [2.2,5.3] 14.5 [11.6,18.0] 0.8 [0.2,2.8] 18.7 [15.5,
22.3] 7,098
Want no more children 3.2 [1.9,5.1] 61.3 [56.4,66.0] 0.3 [0.1,1.2] 64.7 [60.2,
68.9] 24,557
Want to avoid pregnancy for a certain period
1.3 [0.5,3.3] 15.3 [11.6,19.8] -- 16.6 [12.8,
21.2] 6,300
Total 7.9 [5.5,11.4] 91.0 [86.5,94.1] 1.0 [0.4,2.9] 100 37,955
6.1 Knowledge of and experience with contraceptive methods ever used
Returning to the entire sample of women of reproductive age (both pregnant and not-pregnant), the
research team posed a series of questions about knowledge of, and experience with various
contraceptive methods10. Questions were structured as follows:
1) Respondents were asked if they had heard about the method, and if yes;
2) Whether they knew where to get the method, and finally, if yes;
3) Had ever used the method.
10 Contraceptive methods included in the questionnaire included: pill, IUD, injectable, implants, ECP, condom, sterilization, rhythm method, withdrawal.

60
The results presented below reflect the proportion of all surveyed respondents [pregnant and non-
pregnant] saying YES to any given question.
The most commonly known method of contraception was the pill, followed by injections, female
sterilization, condoms, implants and male sterilization, with at least 4 in 5 respondents aware of all of
these methods (Table 6.6). Women’s high levels of knowledge of the pill and injectable correlated with
current use; more women use pills and injectables than other methods currently.
With each question asked, proportions reduced. For example 99% of women had heard of the pill, 97%
knew where to access it, but only 68% had ever used it (Table 6.7). Seemingly, the challenge for
increasing contraceptive use in urban Sylhet will not be met by increasing knowledge about
contraceptives or knowledge of where to access them. As further example, around three-fourths of
respondents knew about condoms and implants and knew where to get them. But, only 18% had ever
used condoms and only 5% had ever used implants.
Table 6.7 Knowledge on various contraceptive methods and practice * [n=37965]
Methods % heard of
[95% CI]
% know where to find [95% CI]
% ever used
[95% CI]
Total women
Pill 98.7 [97.2, 99.4] 96.7 [94.4, 98.0] 68.1 [63.1,72.7] 37,476
Injections 93.0 [89.9, 95.3] 85.6 [81.4, 88.9] 32.6 [28.9,36.5] 35,315
Female sterilization 92.0 [88.5,94.5] 80.5 [75.9, 84.4] 5.5 [3.5,8.6] 34,911
Condom 87.0 [83.0,90.2] 76.4 [70.9, 81.2] 18.0 [14.9,21.7] 33,020
Implants/norplants 86.3 [82.0,89.7] 71.1 [64.3, 77.0] 5.3 [3.5,7.8] 32,759
Male sterilization 80.0 [75.5,83.8] 67.6 [61.8,72.9] 1.8 [1.0,3.4] 30,346
IUD 63.1 [55.3,70.2] 46.8 [39.9, 53.8] 3.8 [2.2,6.4] 23,942
Safe period, counting days, rhythm method
50.8 [42.6,58.8] -- 13.8 [9.9,18.8] 19,264
Withdrawal 42.5 [35.4, 49.9] -- 8.9 [6.0,13.1] 16,120
Emergency contraceptive pill 19.8 [15.7, 24.7] 16.2 [12.7,21.4] 1.1 [0.5,2.4] 7,531
Other methods 6.4 [3.9,10.1] 4.6 [2.8,7.3] 0.5 [0.2, 1.5] 2,410
* multiple responses
Participants who had ever used a contraception method, but were no longer using it, were asked why
they no longer used it. Interviewers coded responses into one of 12 categories, such as difficulty
obtaining, belief it wasn’t effective, respondent does not trust the source, side effects, forgot to use,
etc11. The top three reasons for stopping the use of each method of contraception appears in Table 6.8.
Proportions reflect the percentage of all women who have ever used a given method.
The most frequently cited reason to stop any hormonal methods, such as the pill, implants and
injections, was side effects. The next most frequently cited reason was switching to another method. For
the barrier methods (male condoms) and traditional methods, (safe period, withdrawal), respondents
cited switching to another method, inefficacy or husband’s disapproval as reasons for stopping use.
11 See the survey questionnaire in annex 1 for the complete list

61
Table 6.8 Top three reasons to stop using a particular contraceptive method
Reasons Percentage of women [95% CI]
Total women
Most common reasons for stopping the pill (n=25840)
Side effects 21.7 [16.5, 27.9] 5,598
Switched to alternative method 11.5 [8.5, 15.5] 2,982
Wanted children 6.6[4.6, 9.4] 1,703
Most common reasons for stopping the IUD (n=1423)
Side effects 59.4 [35.4, 79.6] 845
Switched to alternative method 13.7 [3.8, 38.7] 194
Husband away from home 7.0 [1.0, 39.6] 100
Do not trust 7.0 [1.0, 39.6] 100
Most common reasons for stopping Injections (n=12382)
Side effects 46.0 [34.6, 57.9] 5,695
Switched to alternative method 9.3 [5.2, 16.1] 1,157
Difficult to obtain 5.0 [2.1, 11.2] 616
Most common reasons for stopping implants/norplants (n=2005)
Side effects 28.7 [12.2, 53.9] 576
Switched to alternative method 11.8 [4.5, 27.1] 236
Difficult to obtain 5. 9 [0.7, 36.2] 118
Most common reasons for stopping using condoms (n=6845)
Switched to alternative method 29.1 [19.7, 40.6] 1,990
Disapproved by husband/ family 8.9 [4.3, 17.7] 611
Not effective 7.7 [2.4, 22.5] 529
Most common reasons for stopping safe period/ counting days/ rhythm method (n=5239)
Switched to alternative method 17.7 [10.4, 28.5] 927
Not effective 11.3 [5.0, 23.4] 591
Wanted children 4.3 [1.6, 11.3] 226
Most common reasons for stopping using withdrawal (n=3393)
Switched to alternative method 17.4 [8.0, 33.8] 590
Not effective 12.7 [5.1, 28.4] 432
Disapproved by husband/ family 6.7 [2.2, 18.7] 226
*multiple responses possible
A total of 15.4% of married women of reproductive age (both pregnant and not pregnant) reported
never using contraceptives. When asked why, most respondents reported no specific reason (31%), a
probable indication of their discomfort in discussing this issue, followed by the desire to have children
(30%). Some (11%) did not ever use a contraceptive method because their husbands did not support it
and another 10% were not having intercourse or not regularly doing so. Some of the younger women
who conceived and gave birth soon after marriage said that they never had time to use contraceptives
and were not using it currently as they were still amenorrheic and/or breast-feeding. Figures appear in
Table 6.9. Notably, cost was not mentioned as a reason for not using contraceptives.

62
Women gave multiple responses in this question. It is likely that women do not use contraceptives for
many reasons over their reproductive years, but it is also likely that there would be underlying reasons
for not using them. For example, the literature notes that lack of decision-making power limits women’s
use of contraception (35), while increased use is linked with economic empowerment (36). The study did
not measure these factors specifically, it is reasonable to assume that contextual factors such as
empowerment play a role in contraceptive use among poor urban women in Sylhet.
Table 6.9 Reasons for never using contraception* (n= 5848)
Reason for not ever using contraception
Percent of women 95% Confidence interval Total women
lb ub
No reason given 31.2 22.4 41.6 1,825
Want to have children 30.1 19.0 44.2 1,761
Menstruation stopped 12.1 7.1 20.0 709
Not having or infrequent sex 10.3 5.4 19.0 604
Husband opposed 10.8 5.6 19.8 634
Fatalistic (left on fate) 8.7 4.6 16.1 511
Postpartum amenorrhea 7.6 3.0 18.0 444
Fear of side effects 5.8 2.5 13.0 341
Breast feeding 3.3 1.0 10.7 193
Other family members opposed 2.2 0.5 8.4 127
Don’t want to use 2.0 0.5 8.0 118
Knows no method 0.9 0.1 6.3 51
Inconvenient to use 0.6 0.1 4.9 38
*multiple responses
6.2 Termination of pregnancy and future birth plans The research team asked married women of reproductive age about their experience with termination
of pregnancies. The questionnaire included the following options:
Menstrual Regulation [MR), which is manual vacuum aspiration done within 8-10 weeks of a
missed period to clean the uterus;
Miscarriage, which is the natural and unintentional (spontaneous) expulsion of the product of
conception during the first 24 weeks of pregnancy; and
Abortion, in this study, refers to the induced expulsion of the fetus after 10 weeks.
Menstrual Regulation (MR) is legal in Bangladesh. Abortion is not. According to Guttmacher Institute 12,
653,100 menstrual regulations are conducted annually in Bangladesh, leading to a reduction in abortion-
related mortality (37, 38). MR is reported to cause lower complications than abortions(39), however
unsafe MR from unscrupulous providers also poses considerable mortality and morbidity risks as
reported by Biswas et al. In their study almost 7% of all admissions in Obstetrics & Gynaecology unit
were due to MR complications (40).
12 http://www.guttmacher.org/pubs/FB-Bangladesh-MR.html

63
Table 6.10 displays women’s knowledge and experiences with termination of pregnancy. More than
two-thirds of respondents knew of a method to end an unwanted pregnancy. All respondents were
asked whether they knew where to get (MR). More than two-thirds stated they knew where to have this
performed.
Approximately one in seven respondents (14.7%) reported terminating an unplanned pregnancy. Almost
half of respondents who ended an unplanned pregnancy reported using MR, followed by abortion
(28.3%), and herbal medicine (12.3%). It should be noted that women were able to give multiple
responses when asked about the methods they had used to terminate pregnancies. Thus, one woman
may have terminated multiple pregnancies, indicating multiple methods. Approximately 11% (2843 of
260,277) of women who knew about methods of pregnancy termination had used MR. In the BDHS,
9.4% of currently married women who had heard of MR reported using the method at one point in their
reproductive career.
It is assumed that those pregnancies terminated via methods other than menstrual regulation can be
considered “unsafe” methods. Thus, approximately half of terminated pregnancies may be conducted
unsafely in urban Sylhet. The implications of this are concerning – unsafe termination of pregnancy may
contribute to only 1% of maternal mortality in Bangladesh (41), but complications and morbidities are
common. Just over half a million women suffered complications of unsafe abortions in 2010 (42).
Table 6.10 Knowledge and use of pregnancy termination methods
Proportion [95% CI] Total women
Knowledge of methods to terminate pregnancy (n=37955 )
Yes 68.6 [60.4,75.8 ] 26,037
No 31.4 [24.2,39.6] 11,918
Knows where to get MR (n= 10166)
Yes 61.1 [52.9,68.7] 6,211
No 38.9 [31.3,47.1] 3,955
Ever terminated a pregnancy (n=11918)
Yes 14.7 [11.9,18.0] 1,752
No 85.3 [82.0,88.1] 10,166
Methods used to terminate pregnancies* (n= 1752)
Kabiraj/ Herbal medicine 12.3 [6.4, 22.4] 215
Menstrual Regulation 49.1 [37.4,60.8] 860
Abortion 28.3 [19.4,39.3] 496
Other 13.7 [7.9,22.5] 240
*multiple responses possible

64
Chapter 7. Pregnancy and Delivery
The pregnancy and delivery module explored healthcare seeking patterns of women between the age of
15-49 years, during gestation and childbirth. This chapter does not focus on ANC and PNC visits or
neonatal care in detail as such data is regularly collected by national urban health and demographic
health surveys and various NGOs including BRAC Manoshi and the Smiling Sun Franchise Programs (now
known as The NGO Health Service Delivery Project).
All married women of reproductive age who had delivered within a period of one year from the survey
were eligible for this module. Six hundred and ten complete interviews were available for analysis. The
majority of participating women were between the ages of 20 to 34 years. One-third of them did not
Key Findings:
Most women had their first child between 15-19 years of age
A high rate of still birth was reported: 1010 per ten thousand live births
16% of women never had a prenatal checkup
65% of women received their first checkup only after 3 months
Most women reported seeking services in order to check fetus wellness, confirm
pregnancy and/or because they were feeling sick
Half of the women chose NGO and private clinics for their checkup
Of those who did not get a checkup, 70% did not feel a visit to a medical facility
was required. Other women cited lack of money or disapproval from their husband
as a reason
Nearly all women made plans about the place of delivery; 60% planned a home
deliver
Almost half of women delivered at home
36% of deliveries were attended by traditional birth attendants
Only 39% of births were conducted by skilled attendants
In choosing a provider or place of delivery women look for proximity, provider
friendliness, and low cost
62% of women got an ultrasound, mostly at the advice of their doctors
There was high proportion of C-section; 20%
The top 3 reasons for C-section were: previous C-section, malpresentation of the
baby, and premature rupture of the membrane (PROM)
One-third of women experienced some medical problem after delivery:
about 60% claimed to have pain, while less than 20% reported fever, wound
infections, and anemia.

65
attend school and 40% attended primary school only. The remaining 30% of women had higher
schooling.
Table 7.1 Background Characteristics of respondents
Background characteristics Percent of women 95% Confidence Interval Total women
Lb ub
Age
15-19 11.9 7.9 14.7 607
20-24 36.6 31.9 42.2 2,059
25-34 44.8 40.8 49.6 2,521
35-44 6.6 4.7 9.7 378
45-49 0.2 0.1 2.4 19
Education
No Education 30.5 25.0 35.3 1,669
Primary 38.9 35.8 42.5 1,314
Secondary 27.2 22.8 33.2 871
Higher Secondary 2.5 1.1 4.2 1,223
Graduation 0.9 0.5 2.7 507
Total 100 5,584
Table 7.2 displays age at first marriage; most women were married by the time they turned 19 and 18%
were married at the ages of 9-14. Only 19% of women were older than 20 when they married for the
first time. In BDHS 2011 the median age at first marriage was shown to be 15.5 to 16.6 years. Child
marriage has been linked to negative maternal and child health outcomes; reducing child marriage has
positive health impact on women (43, 44).
Table 7.2 Respondent’s age at first marriage
Age at first marriage Percent of women 95% Confidence Interval Total women
lb ub
9-14 18.0 14.1 22.4 997
15-19 62.8 57.6 68.0 3,514
20-24 15.9 12.1 21.0 898
25-29 2.8 1.4 5.3 153
30-34 0.5 0.1 1.4 22
Total 100 5,584
Table 7.3 indicates that most women had their first child between the ages of 15-19 years of age and, at
the time of the survey, 30% had more than 2 children. Family sizes were larger than average in the study
population – a finding consistent with Sylhet division’s reputation as having the highest fertility rate in

66
the country. Some of the respondents, who must have been pregnant at some point or other, reported
having no children suggestive of a dead child, miscarriage or terminated pregnancy.
Table 7.3 Age at first delivery and number of living children
Percent of women 95% Confidence Interval Total women
Age at first delivery lb ub
10-14 3.9 2.2 6.1 203
15-19 55.4 49.2 58.7 3,014
20-24 33.8 30.1 40.4 1,960
25-29 5.6 4.6 8.6 351
30-35 1.3 0.4 2.2 56
Total 100 5,584
Number of children
0 1.1 0.4 3.3 61
1 36.1 31.6 40.9 2,018
2 31.6 27.3 36.1 1,763
3 16.8 14.0 19.9 936
4 7.5 5.2 10.9 421
5+ 6.9 3.7 13.7 387
Total 100 5,584
Table 7.4 presents the birth outcomes of all pregnancies that respondents reported to have
experienced. Out of every 10 babies delivered, there was one stillborn. This is a rather high count
compared to the reported Sylhet Division statistics on stillbirth which stands at 34 per thousand births.
Some probable reasons for this could be high levels of maternal infections that go unchecked in poorer
urban communities in the absence of proper antenatal checkup, the large number of unskilled
deliveries, and misreporting due to confusion between still birth and early neonatal death. Twelve
percent of women miscarried or experienced spontaneous abortions.

67
Table 7.4 Pregnancy outcomes: live births, stillbirths, miscarriages, MR, and abortions
Pregnancy outcomes Percent of women lb ub Total women
Still birth
None 88.5 85.1 91.2 4,943
Only one 10.1 7.8 12.9 562
More than one 1.4 0.7 2.8 79
Miscarriage/spontaneous abortion
None 88.0 84.7 90.7 4,915
Only one 9.3 7.2 12.1 521
More than one 2.7 1.6 4.5 148
MR/induced abortion
None 95.3 92.8 96.9 5,320
Only one 4.5 2.9 6.9 253
More than one 0.2 0.0 1.5 11
Total 100 5,584
Figure 8 provides information about the place where reported termination of pregnancy occurred.
Women who had an MR/abortion did so mostly in government hospitals (36%), followed by home
(27%), private clinics (21%), and NGOs (9%). The likelihood is that menstrual regulations (legal
procedures) took place more frequently in clinics, whereas abortions (illegal procedures) may have been
more likely to occur in “other” places.
Figure 5 Place of MR or induced abortion (n=28)
36.2
26.821
9.2 6.80
5
10
15
20
25
30
35
40
pe
rce
nt
of
wo
me
n

68
Figure 9 indicates that the majority of women wanted their current or most recent pregnancy as was the
case in BDHS 2011 and 2007. Almost one-quarter indicated wanting to wait, suggesting unmet need for
spacing methods. Fourteen percent of women did not want any more children ever, further suggesting
unmet need for family planning. If unwanted births could be avoided, the TFR would be considerably
lower (27) especially for Sylhet Division where the highest fertility rate of 3.1 in the country prevails.
Figure 6 Preconception Planning (n=5584)
7.1 Prenatal checkups
A series of questions were asked regarding the first checkup during pregnancy. This may or may not
have been an Antenatal Care (ANC) visit as it is unclear whether required antenatal services were
provided .
Around one in six women did not get a checkup of any kind during their pregnancy. Thirty-five percent
of women were 3 to 4 months pregnant during their first visit and another 30% of pregnant women
received their first checkup only after 4 months. Over 50% women said they went for at least 4
checkups. Most women reported seeking services in order to check fetus wellness, confirm pregnancy
and/or because they were feeling sick.
65%
21%
14%
Wanted to conceive Wanted to wait Wanted no more children

69
Table 7.5 Prenatal checkups: time of first visit, number of visits and reasons for checkup
Prenatal checkups Percent of women 95% Confidence Interval Total women
lb ub
Number of checkups (n=5584)
0 15.7 11.5 21.2 879
1 17.4 14.1 21.3 971
2 19.1 14.3 24.9 1,064
3 15.4 12.5 18.9 863
4 11.0 7.1 16.7 615
5 7.4 5.2 10.3 412
6+ 14.0 9.5 20.1 780
Months at 1st checkup (n=5584)
No Checkup 15.7 11.5 21.2 879
1-2 18.8 14.8 23.6 1,051
3-4 35.8 30.3 41.6 1,997
5-6 15.3 11.7 19.8 854
7+ 14.4 10.8 19.0 803
Reason for 1st checkup*(n=4705)
Assure fetus wellness 36.6 30.1 43.6 1,720
Confirm pregnancy 35.0 30.0 40.5 1,648
Felt sick 35.0 30.1 40.3 1,648
Sex determination 2.5 1.3 4.7 117
Advised by neighbor/family/ acquaintance
2.2 0.8 4.9 95
Other 1.9 0.9 3.7 87
*Multiple responses
Many women who received a checkup chose NGO clinics as the place of service (almost 30%) as shown
in Table 7.6, followed by private clinics and government hospitals. Some women had checkups
performed by community health workers (CHWs) in their homes. It is likely that those checkups were
ANC visits as the study population was drawn from a maternal health intervention’s (BRAC MANOSHI)
population whose program model included home ANC visits.

70
Table 7.6 Place of last checkup during pregnancy
Place Percent of women 95% Confidence Interval Total women
lb ub
NGO clinic 29.9 23.6 37.0 1,406
Private clinic / hospital 21.8 17.0 27.5 1,025
Government hospital 21.4 16.0 28.1 1,006
Home (SS, SK, CHW) 15.5 10.1 23.2 731
Doctor’s chamber 9.1 6.7 12.3 429
Others 2.3 1.2 4.3 107
Total 100 4,704
Others: Pharmacy, Village doctor, Homeopath doctor.
Women who reported no ANC during pregnancy were asked to provide reasons why (Table 7.7). The
majority (72% of pregnant or recently pregnant women) did not feel a visit to a medical facility was
required. This viewpoint is consistent with other studies suggesting that women view pregnancy as a
normal condition with no need of medical intervention (45). Other women cited lack of money or
disapproval from their husband as a reason and a few also of them said they were not aware of any
place to go for a checkup. A recent meta-synthesis of qualitative studies from LMICs also revealed that
women do not perceive pregnancy as a risk to their well-being and limited financial resources influence
women’s decision against seeking antenatal care (46). This paper notes that women find ANC services
inadequate in terms of resources available at the facility, although this did not come up in our survey.
Table 7.7. Reasons for not getting checkups during pregnancy (n=879)
Reasons Percent of women 95% Confidence Interval Total women
lb ub
Didn't feel necessary 71.8 61.1 80.5 631
Lack of money 16.8 9.2 28.8 148
Not allowed by husband 8.2 4.3 15.0 72
Didn't know where to go 5.2 1.3 18.8 46
Not allowed by in-laws 1.3 0.3 6.1 12
Other 9.9 4.8 17.9 87
*multiple responses

71
Figure 7 Proportion of women who took ultrasound test during pregnancy (n=5499, missing=85)
Though not part of any official ANC package, many women who seek care during the antenatal phase
received ultrasounds (62%) as seen in figure 10. A clinical guideline prepared for antenatal care by the
National Collaborating Centre for Women’s and Children’s Health recommends including ultrasound in
routine ANC services based on existing evidence (47). They graded ultrasound in category A (highest) of
their recommendation list. Ross et al. found that low cost ultrasound program in rural Uganda boosts
antenatal care visits by pregnant women (48).
Questions were asked about reported use of ultrasound, a useful prenatal test that gives an accurate
due date, assesses the volume of fluid around the fetus, assesses possible risks to the mother
(e.g. miscarriage, blighted ovum, ectopic pregnancy, or a molar pregnancy condition), and determines
whether an intrauterine growth retardation condition exists.
Results suggest that for every 3 women getting the test there were 2 women who did not. Women who
had the ultrasound stated that they were recommended to take the test by doctors [53%), family
members (16%), some Community Health Workers (CHW) such as Shasthya Kormi/Shebika of Brac
Manoshi. Another 13% did so on their own accord.
Table 7.8 Person who advised to get an ultrasound test (n=3412)
Advisor for ultrasound Percent of women 95% Confidence Interval Total women
lb ub
Doctor 53.1 45.5 60.5 1,811
Family member 15.5 11.9 20.0 530
Community Health Worker 13.0 9.9 17.2 443
Self 12.6 8.1 19.2 430
Neighbor 1.8 0.8 3.7 60
Nurse 0.7 0.2 2.3 25
TBA 0.5 0.2 2.5 19
Don’t know 2.8 1.3 5.9 94
Total 100 3,412
62%
38%
Yes No
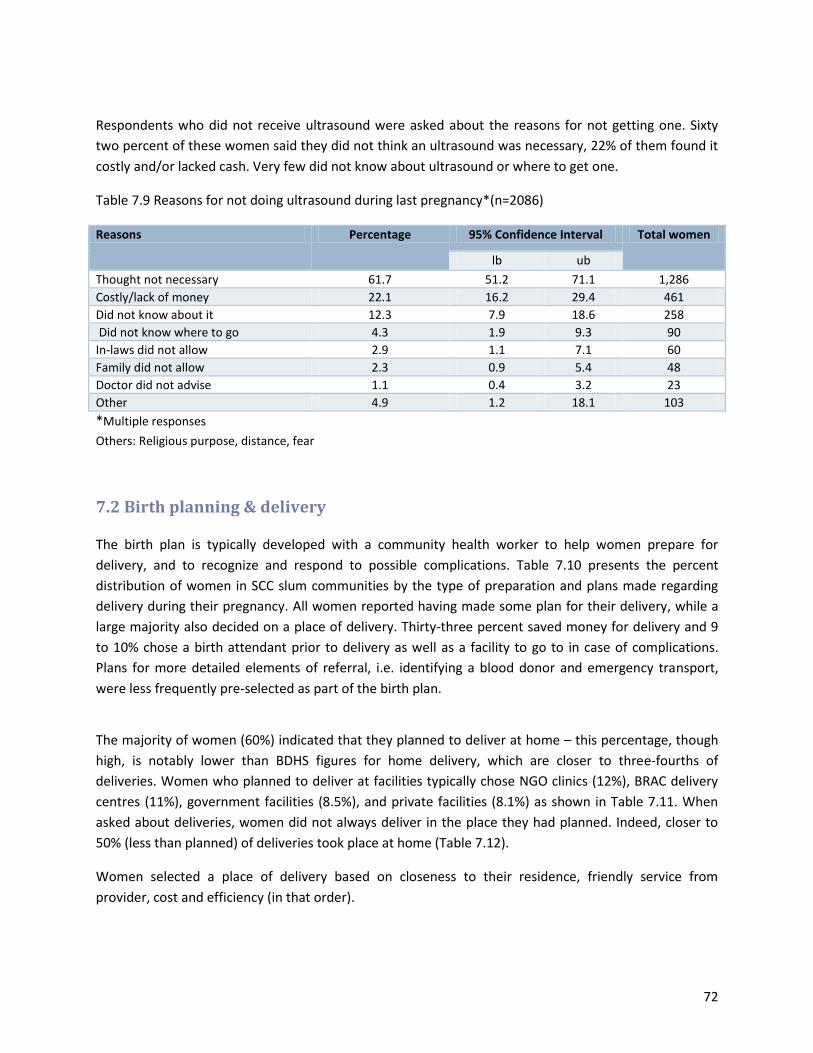
72
Respondents who did not receive ultrasound were asked about the reasons for not getting one. Sixty
two percent of these women said they did not think an ultrasound was necessary, 22% of them found it
costly and/or lacked cash. Very few did not know about ultrasound or where to get one.
Table 7.9 Reasons for not doing ultrasound during last pregnancy*(n=2086)
Reasons Percentage 95% Confidence Interval Total women
lb ub
Thought not necessary 61.7 51.2 71.1 1,286
Costly/lack of money 22.1 16.2 29.4 461
Did not know about it 12.3 7.9 18.6 258
Did not know where to go 4.3 1.9 9.3 90
In-laws did not allow 2.9 1.1 7.1 60
Family did not allow 2.3 0.9 5.4 48
Doctor did not advise 1.1 0.4 3.2 23
Other 4.9 1.2 18.1 103
*Multiple responses
Others: Religious purpose, distance, fear
7.2 Birth planning & delivery
The birth plan is typically developed with a community health worker to help women prepare for
delivery, and to recognize and respond to possible complications. Table 7.10 presents the percent
distribution of women in SCC slum communities by the type of preparation and plans made regarding
delivery during their pregnancy. All women reported having made some plan for their delivery, while a
large majority also decided on a place of delivery. Thirty-three percent saved money for delivery and 9
to 10% chose a birth attendant prior to delivery as well as a facility to go to in case of complications.
Plans for more detailed elements of referral, i.e. identifying a blood donor and emergency transport,
were less frequently pre-selected as part of the birth plan.
The majority of women (60%) indicated that they planned to deliver at home – this percentage, though
high, is notably lower than BDHS figures for home delivery, which are closer to three-fourths of
deliveries. Women who planned to deliver at facilities typically chose NGO clinics (12%), BRAC delivery
centres (11%), government facilities (8.5%), and private facilities (8.1%) as shown in Table 7.11. When
asked about deliveries, women did not always deliver in the place they had planned. Indeed, closer to
50% (less than planned) of deliveries took place at home (Table 7.12).
Women selected a place of delivery based on closeness to their residence, friendly service from
provider, cost and efficiency (in that order).

73
Table 7.10 Percent of women by birth planning during pregnancy Birth plans Percent of women 95% Confidence Interval Total
women lb ub
Made plan (n= 5584)
Yes 99.5 97.4 99.9 5,558
No 0.5 0.1 2.6 26
Types of plans* (n=5558)
Place of delivery 99.7 98.1 100 5,544
Savings 33.0 27.5 39.0 1,833
Assistance during delivery 9.5 5.8 15.1 528
Referral facilities identified for complications 8.5 5.0 14.2 474
Emergency transport 5.5 3.7 8.1 308
Blood donor 3.5 1.9 6.5 195
Companion to facility 2.9 1.5 5.7 166
Collected safe delivery kit 3.4 1.1 10.3 190
Others 1.0 0.4 2.6 57
*multiple responses
Other: Companion, loan money
Table 7. 11 Planned place of delivery
Delivery place Percent of women 95% Confidence Interval Total women
lb ub
Made plans for delivery place (n=5584)
Yes 99.3 97.4 99.8 5,544
No 0.7 0.2 2.6 40
Place planned (n=5544)
Home 60.5 55.1 65.6 3,353
NGO clinic 12.0 9.2 15.7 665
Delivery centre 10.7 7.2 15.7 595
Private clinic / hospital 8.5 5.7 12.4 469
Government hospital 8.1 6.0 10.9 451
Doctor’s chamber 0.2 0.0 1.4 11
Total 100 5,544
The other half of women had institutional deliveries – a figure much higher than the national average.
Out of institutional deliveries, most women delivered in government hospitals, followed by NGO clinics.
Urban access to institutional delivery is higher than in rural areas which may contribute in part to higher
institutional delivery rates. Further, particularly in the BRAC model, community health workers are
trained to recognize complications/situations beyond their skill set and refer, which may have put more
women in facilities.
The presence of skilled attendants during delivery was lower than the national average. Indeed,
traditional birth attendants or a relative attended almost half of all deliveries (49%), while doctors,

74
nurses, and skilled birth attendants attended 39% of deliveries, roughly corresponding to the number of
institutional deliveries. Table 7.13 shows the reasons behind place of delivery which include proximity to
home (39%), friendly provider (32%), low cost (34%), effectiveness (21%), and others’ recommendation
(17%).
The shift towards institutional delivery in the sample may be positive in light of access to emergency
obstetric care. However, the numbers show a high proportion of caesarian sections (Table 7.12). Twenty
percent of deliveries resulted in caesarian sections, much higher than the WHO recommended
caesarean section rate of 10% to 15% (49). Caesarean sections can be life-saving, but also result in
increased morbidity for mothers and higher costs. Thus, while essential when required, their unrequired
use is troubling, particularly for lower income mothers who may have neither the money to pay nor the
luxury of time off to properly recover.
Table 7.12 Delivery Care (n=5584)
Delivery Care Percent of women 95% Confidence Interval Total women
Place of delivery lb ub
Home 48.5 43.0 54.0 2,717
Government hospital 16.7 13.2 21.0 933
NGO clinic 13.7 10.5 17.7 779
Delivery centre 11.2 8.0 15.4 600
Private clinic / hospital 9.8 6.4 14.7 544
Doctor’s chamber 0.2 0.0 1.4 11
Total 100 5,584
Birth attendant
TBA 36.1 29.3 43.6 2,018
Doctor 27.1 22.2 32.6 1,513
Trained TBA 9.4 6.4 13.6 525
Nurse 9.2 6.5 12.9 515
Health Worker 2.1 1.1 3.9 118
Skilled birth attendant (SBA) 2.3 1.2 4.4 126
Neighbor 3.2 1.8 5.6 178
Mother-in-law 1.6 0.7 3.8 90
Other Relative1 9.0 5.0 15.0 501
Total 100 5,584
Mode of Delivery
Normal 79.7 75.1 83.6 4,440
Caesarean 20.3 16.4 24.9 1130
Missing 0.3 0.0 1.9 14
Total 100 5,584
Other relative1 Husband, Mother, Sister, Sister-in-law.

75
Table 7.13 Reasons for choosing place of delivery and birth attendant * (n=5584)
Reasons Percent of women 95% Confidence Interval Total women
lb ub
Close to home 39.0 31.7 46.9 2,179
Provider friendly 35.2 28.3 42.8 1,966
Low cost/ free 34.4 28.3 41.0 1,921
Effective 20.9 16.1 26.6 1,164
Recommended by others 16.9 12.6 22.1 941
Qualified doctor 11.2 7.5 16.4 624
Clean 5.8 3.6 9.4 326
Female doctors 5.1 3.3 7.8 285
Privacy 5.0 2.7 9.1 279
Skilled 2.8 1.4 5.5 158
Medicines available 2.1 1.2 3.8 118
Depend on TBA 1.4 0.5 3.9 78
Others 6.9 3.4 14.7 467
*multiple responses.
Others: Health-card, No other Facility, previous experience, known provider.
Table 7.14 provides more insight into the experience of women who delivered via C-section. The
majority (91%) of women were informed of the reason for the procedure and consented. The top 3
reasons were previous C-section, malpresentation of the baby, and premature rupture of the membrane
(PROM). Other reasons included failure to progress, overdue, and prolonged labor.
Table 7.14 Reasons for getting C-section for last delivery Reasons Percent of women 95% Confidence Interval Total
women lb ub
Informed about the need for C-section (n= 1130)
Yes 91.0 78.6 96.5 1,028
No 9.0 3.5 21.4 102
Indications for C-section (n=1028)
Previous CS 19.4 11.8 30.2 199
Malpresentation 14.2 7.9 24.4 146
Premature rupture of membrane 12.7 7.3 21.1 130
Failed to progress to labor 8.7 4.5 16.1 89
Overdue 8.1 4.2 14.9 83
Prolonged labor 5.8 2.7 12.3 60
Fetal Distress 2.7 0.7 10.7 28
Personal choice 1.7 0.5 5.5 18
Obstructed labor 1.7 0.5 5.5 17
Oligohydramnios 3.5 1.1 10.6 36
Others 21.4 12.6 33.8 222
*Multiple responses

76
All women were asked whether they preferred C-section over normal delivery or not, and reasons for
that. Only 6% of the respondents favored C-section for reasons such as speed of delivery, greater safety
for the baby, less pain, greater safety for the mother. The remaining 94% cited factors like infections,
fear of surgery, high cost, and delayed return to daily activities as reasons for not preferring C-section.
Indeed, Table 7.15 would suggest that women were apprehensive of the C-section process; fears and
uncertainties that would further alienate women from health facilities in the future. Women rarely
recognize C-section as a life-saving intervention. Instead it is perceived as an expensive and invasive
procedure. This is partly justified given the alarming rise in non-indicated C-sections.
Table 7.15 Views on Caesarean Section
Percent of women 95% Confidence Interval Total women lb ub
Preference for C-section (n=5584)
Yes 5.7 4.2 7.7 318
No 94.3 92.4 95.8 5,266
Reasons for preferring C-section* (n=318)
Less pain 55.0 34.3 74.1 175
Fast 23.5 9.5 47.4 75
Predictable Timing 13.6 4.8 32.8 43
Safer for Baby 61.6 38.2 80.6 196
Safer for Mother 30.9 15.9 51.4 98
Previous C/S 19.9 7.3 43.8 63
Reasons against C-section* (n=5266)
Suffering/Infections 58.0 48.4 67.0 3,055
Fear of surgery 52.3 46.0 58.6 2,756
High cost 43.1 36.6 49.9 2,271
Delayed recovery 32.8 26.4 39.9 1,727
Not allowed by religion or culture 3.0 1.2 7.7 160
Others 4.5 2.6 7.6 234
*Multiple responses
7.3 Additional information about accessing services: transport and cost
Part of understanding cost (as well as the 2nd delay in referral) requires knowing how women move
through cities to access care. Questions on transport were asked only to women who reported
delivering outside of their home. They were most likely to take a CNG (54%), followed by rickshaw
(32%), go on foot (9%), and ambulance (2%) (Table 7.16).

77
Table 7.16 Main mode of transport to travel to delivery facility (n=2875)
Transport type Percent of women 95% Confidence Interval Total women
Lb ub
CNG 53.7 44.1 63.1 1538
Rickshaw 31.5 23.2 41.0 900
On foot 8.8 5.0 14.9 250
Ambulance 3.7 2.0 6.6 104
Others 2.9 0.9 10.5 83
Total 100 2,875
The assessment of cost of delivery included cost of transportation, actual cost of the procedure, bed fee,
if any, and any unofficial payments. For normal institutional deliveries, women reported payment of
2400 BD taka (approximately USD 31) with half of women paying less than or 1000 taka. Women who
delivered via C-section paid a mean amount of 17,000 BD taka, with half paying at least 15,000 taka
(Figure 11).
Most families paid these expenses with household income. Others used savings, followed by donations
from neighbors. Around 10% of families relied on loans from acquaintances, NGOs, a money lender or
selling household objects as shown in Table 7.17.
Figure 8 Costs of delivery by type (n=5114)
2375
1000
16686
15000
0
2000
4000
6000
8000
10000
12000
14000
16000
18000
Mean Cost Median Cost
Normal Delivery
C-section

78
Table 7.17 Source of payment*(n=5114)
Source Percent of women 95% Confidence interval Total women
lb ub
Household wages 60.9 53.5 67.9 3,115
Household Savings 24.7 19.1 31.4 1,265
Donation from a neighbor 13.5 10.2 17.6 690
Loan from NGO 3.3 1.9 5.5 169
Loan personal / neighbor /relative 2.9 1.5 5.7 149
Loan from money lender 2.1 1.2 3.7 108
Selling household objects 1.8 0.8 4.0 90
Donation from a NGO 0.4 0.1 1.2 18 *multiple responses
All women delivering at home or in an institution were asked about unofficial payments. More than half
of respondents indicated having been asked to pay an unofficial/illegal payment for services. Notably-
government facilities are supposed to be free, but frequently patients were asked to pay extra fees. The
average unofficial cost was between 500 to 600 taka varying only slightly between normal and
caesarean delivery. Data is shown in Tables 12 a & b. This imposition of informal fees is commonly
practiced in LMICs (50, 51)and considerably raises the cost of services, with negative implications for
service utilization (52).
7.4 Post-delivery health status and care seeking
The postnatal period is critical for mothers and babies. Most women in the sample did rest immediately
following delivery and admitted to some limitations to their daily activity. Figure 13 represents the time
required for women to get back to their normal activities after childbirth. Recovery time was less for
Figure 9a Percent of women paying unofficial payments (n=5114)
Figure 12b Amount of the unofficial payments (n=2914)

79
women having normal delivery i.e. a mean of 21 days and a median of 15, than women getting C-section
i.e. a mean of 42 days and a median of 30.
Figure 10 Length of time to recover after delivery in days (n=5556)
One-third of women experienced some medical problem after delivery. About 60% claimed to have pain,
while less than 20% reported fever, wound infections, and anemia. General weakness, eclampsia,
urinary tract infection, and wound rupture were infrequent and so was depression (Table 7.18).
Table 7.18 Post natal health problems reported by mothers* Post natal health problems Percent of women 95% Confidence Interval Total women
lb ub
Problem after birth (n=5584)
Yes 62.8 56.8 68.4 2,068
No 37.2 31.6 43.2 3,516
Type of problem ** (n=2068)
Pain 60.6 51.0 69.5 1,253
Fever 17.5 12.1 24.4 361
Wound infections 15.8 10.5 23.0 326
Anemia 12.6 8.4 18.6 261
Weakness 6.4 3.8 10.7 133
Eclampsia 4.4 2.1 8.9 90
Urinary tract infection 4.0 1.5 10.0 82
Wound rupture 3.0 1.4 6.6 63
Depression 1.3 0.5 3.7 27
Others 14.2 8.5 22.7 294 *These problems are not clinically diagnosed.**multiple responses. Other: breast tumor, allergy, excessive bleeding, uterine
prolapsed, breathing difficulties, high pressure/low pressure
Almost all women experiencing health problems after childbirth sought treatment; half of whom visited
a pharmacy or a public hospital. NGO clinic, private clinic and private chambers were frequented by 10%
percent of the women each as shown in Table 7.19.
20.7
41.8
15
30
0
5
10
15
20
25
30
35
40
45
Normal C-section
Day
s
Mean day
Median day

80
Table 7.19 Percentage of women who sought treatment for post natal problems and place of treatment
Treatment for postnatal health problems
Percent of women 95% Confidence Interval Total women
lb ub
Sought treatment (n=2068)
Yes 90.7 86.8 93.5 1,875
No 9.3 6.2 12.9 193
Place of treatment (n=1875)
Pharmacy 31.2 22.9 41 585
Government hospital 23.8 16.1 33.7 446
NGO clinic 12.7 7.9 19.6 238
Private clinic 12.1 7.1 20.0 228
Doctors chamber 10.5 6.5 16.4 196
Traditional healer 3.4 1.5 7.4 63
Door step service 1.9 0.6 5.7 35
Homeopathy 1.3 0.3 5.2 23
Others1 4.0 1.4 10.6 74
1 Herbal, Kobiraj, healthline (mobile) advice, home treatment

81
Conclusion A third of the households in poor urban settlements in SCC were living on less than 1.25 dollars a day
and 8% of their median expenditure was used for health related purposes. Approximately one-fifth of
slum inhabitants suffered from some kind of health problem, with widespread complaints of fever and
respiratory problems regardless of age or gender group. The rate of seeking treatment was as high as
70-80% but was mostly sought from a pharmacy in case of acute health problems. More people went to
a qualified provider at public hospitals, doctor’s chambers or private clinics when experiencing chronic
health problems. Although respondents’ believed qualified providers can provide good healthcare,
almost 40% of them were unaware of formal providers in their neighborhood. The fact that many of the
urban poor owned mobile phones provides a potentially useful means of providing information
regarding the location of quality health services in close proximity. Despite the presence of several NGO
clinics across SCC, many of which offer competitive prices for primary health care and special vouchers
for the poor, very few respondents thought they provided quality care and sought healthcare from
them. Since proximity is the most important factor influencing their decision in choosing a health facility,
greater emphasis on locating such clinics close to where the poor reside and greater efforts to
popularize their use, is recommended.
A higher proportion of people expressed that they would visit a private provider again (clinics and
doctor’s chambers) than government facilities or pharmacies. Since people are more satisfied with
private providers it is crucial to ensure that the technical quality of these providers meet optimal levels
and there is a pro-poor mechanism for payment in place. Special attention is needed for the aged
around chronic health problems; people above 50 years have more functional difficulties and also bear
more health-related expenses. Most people were unaware of possible reasons behind their health
problems; they could benefit from health education around the positive health effects of a clean
environment and good hygiene practices with the aim of mobilizing community to ameliorate their own
living space.
Regarding contraceptive use, most women knew about the available options but only two-thirds were
currently using them. Moreover, the percentage of women reporting ever use (any contraceptive) was
less than percentage currently using suggesting a high rate of discontinuation. The most common
reasons for discontinuation were side effects indicating the need for additional family planning
counseling around alternative methods. Husband’s disapproval also came up as one of the reasons for
discontinuation, suggesting the need to include both partners in family planning sessions. Older women
were more prone to use traditional methods. Community health workers night provide more counseling
to this group as opposed to solely emphasizing younger women.
More than half of the women interviewed were pregnant and delivered before 20 years of age in this
population. Early marriage and pregnancies should be brought to focus and the community educated on
the negative consequences through acceptable modes of transferring knowledge. Even though
pregnancy is not considered a health condition, the importance of prenatal checkups and institutional
deliveries should be emphasized through different sources such as CHWs and pharmacists. Finally, there
seemed to be high levels of reported C-sections as well as still births. Whether still birth was properly

82
identified by the reporting mothers remains ambiguous and further qualitative investigation would help
clarify the underlying cause of these deaths in utero.
83
Reference List
1. WENDELL COX CONSULTANCY. Demographia World Urban Areas. 2014 Revision. USA: WENDELL COX CONSULTANCY, 2014.
2. Moreno EL, Warah R. The state of the world’s cities report 2006/2007. 30 Years of Shaping the Habitat Agenda. UK, USA: UN HABITAT, 2006.
3. UN HABITAT. State of the world’s cities 2012/2013. Prosperity of Cities. New York: 2013.
4. Johnston HB. Relationships of exclusion and cohesion with health: the case of Bangladesh. Journal of Health, Population and Nutrition. 2009;27(4):426.
5. The Department of Economic and Social Affairs. United Nations Secretariat. World Statistics Pocketbook. 2013 edition. New York: United Nations Publication 2013.
6. UN ESCAP. 2012 population data sheet. Population and Development Indicators for Asia and the Pacific UN ESCAP, 2012
7. Department of Economic and Social Affairs Population Division. World Urbanization Prospects The 2011 Revision. New York: United Nations, 2012.
8. Urban Development Directorate. Sylhet Master Plan. Volum I Final Plan Report. Government of the People's Republic of Bangladesh, 2009.
9. Ahmed SM. Exploring health-seeking behaviour in disadvantaged populations in rural Bangladesh. Stockholm: Karolinska Institutet; 2005.
10. Ahmed S, Sobhan F, Islam A, Barkat-e-Khuda. Neonatal Morbidity and Care-seeking Behaviour in Rural Bangladesh. Journal of Tropical Pediatrics. 2001;47(2):98-105.
11. Chowdhury RI, Islam MA, Gulshan J, Chakraborty N. Delivery complications and healthcare-seeking behaviour: the Bangladesh Demographic Health Survey, 1999–2000. Health & Social Care in the Community. 2007;15(3):254-64.
12. Moran AC. Maternal morbidity in rural Bangladesh: women's perceptions and care seeking behaviours. Baltimore: Johns Hopkins University; 2006.
13. Rahman SA, Kielmann T, McPake B, Normand C. Healthcare-seeking Behaviour among the Tribal People of Bangladesh: Can the Current Health System Really Meet Their Needs? J Health Popul Nutr. 2012;30(3):353-65.
14. National Institute of Population Research and Training (NIPORT), Mitra and Associates, MEASURE DHS, ICF International. Bangladesh Demographic and Health Survey 2011: Preliminary Report. Dhaka: NIPORT, 2012.
15. Bangladesh Maternal Health Services and Maternal Mortality Survey 2001. Dhaka: NIPORT, ORC, Johns Hopkins University, ICDDRB, 2003.
16. National Institute of Population Research and Training (NIPORT), MEASURE Evaluation, International Centre for Diarrhoeal Disease Research Bangladesh (ICDDR B, Associates for Community and Population Research (ACPR). 2006 Bangladesh Urban Health Survey. Dhaka, Bangladesh and Chapel Hill, NC, USA: NIPORT, MEASURE Evaluation, ICDDR,B, and ACPR, 2008.
17. National Institute of Population Research and Training (NIPORT), ORC (Macro), Universiry JH, ICDDR B. Bangladesh Maternal Health Services and Maternal Mortality Survey 2001. Final Report. Dhaka: National Institute of Population Research and Training (NIPORT), ORC (Macro), Johns Hopkins Universiry and ICDDR, B; 2003.

84
18. Kalim N, Anwar I, Khan J, Blum LS, Moran AC, Botlero R, et al. Postpartum Haemorrhage and Eclampsia: Differences in Knowledge and Care-seeking Behaviour in Two Districts of Bangladesh. J Health Popul Nutr. 2009;27(2):156-69.
19. Islam MM, Azad KMAK. Rural-urban migration and child survival in urban Bangladesh: Are the urban migrants and poor disadvantaged? Journal of Biosocial Science. 2008;40:83-96.
20. Hussain A. Childhood mortality in urban Dhaka city, Bangladesh. Tropical Medicine and International Health. 1999; 4(No- 11):758–64.
21. Rashid SF. Strategies to reduce exclusion among populations living in urban slum settlements in Bangladesh. J Health Popul Nutr. 2009;27:574-86.
22. BHP (BRAC Health Programme). BRAC Health Programme, Annual Report 2006. Breaking New Grounds in Public Health. Dhaka, Bangladesh: BRAC Publication; 2007.
23. Hossain I, Hoque MM. Determinants of choices of delivery care in some urban slums of Dhaka city. Pakistan Journal of Social Science. 2005;3(3):469-75.
24. Ahmed SM. Mapping of the healthcare providers in Bagladesh. Health workforce in Bangladesh: Who constitutes the healthcare system?, Bangladesh Health Watch: The state of health in Bangladesh 2007. Dhaka: Jmaes P. Grant School of Public Health, Centre for Health System Studies, BRAC University; 2008.
25. Bangladesh Bureau of Statistics (BBS). Population and housing census 2011. Socio-economic and demographic report Bangladesh Bureau of Statistics (BBS), 2012.
26. Lansky LL, List MA, Lansky SB, Cohen ME, Sinks LF. Toward the development of a play performance scale for children (PPSC). Cancer. 1985;1(56):1837-40.
27. National Institute of Population Research and Training (NIPORT), Mitra and Associates, MEASURE DHS, ICF International. Bangladesh Demographic and Health Survey 2011. Dhaka, Bangladesh and Calverton, Maryland, USA: NIPORT, Mitra and Associates, and ICF International, 2013.
28. National Institute of Population Research and Training (NIPORT), Associates. Ma, ORC Macro. Bangladesh Demographic and Health Survey 2004 Dhaka, Bangladesh and Calverton, Maryland, USA: National Institute of Population Research and Training, Mitra and Associates, and ORC Macro, 2005.
29. Alam N, Begum D, Ahmed SM, Streatfield PK. Manoshi community health solutions in Bangladesh. Impact Evaluation Surveys in Dhaka Urban Slums 2007, 2009 and 2011. Dhaka, Bangladesh: International Centre for Diarrhoeal Disease Research, Bangladesh (icddr,b) and BRAC in cooperation with Bill & Melinda Gates Foundation, 2011.
30. Deaton A, Zaidi S. Guidelines for Constructing Consumption Aggregates for Welfare Analysis. LSMS Working Paper, No 135. Washington, DC: The World Bank; 2002.
31. National Institute of Population Research and Training (NIPORT), MEASURE Evaluation, icddr b. Bangladesh Urban Health Survey 2013. Preliminary Results. Dhaka: National Institute of Population Research and Training (NIPORT),MEASURE Evaluation, icddr,b, 2014.
32. Ferdous F, Farzana FD, Ahmed S, Das SK, Malek MA, Das J, et al. Mothers’ Perception and Healthcare Seeking Behavior of Pneumonia Children in Rural Bangladesh. ISRN Family Medicine. 2014;2014(2014).
33. Health Economics Unit Ministry of Health and Family Welfare Government of Bangladesh. Public Health Services Utilization Study. Dhaka: Government of Bangladesh, 2003.
34. Bangladesh Bureau of Statistics (BBS), Statistics Division Ministry of Planning Government of the People’s Republic Of Bangladesh, The World Bank. Bangladesh Household Income and Expenditure Survey

85
2010. Dhaka, Bangladesh: Bangladesh Bureau of Statistics (BBS), Statistics Division Ministry of Planning Government of the People’s Republic Of Bangladesh, The World Bank, 2011.
35. Mai D, Kurimoto N. Women’s empowerment and choice of contraceptive methods in selected African countries. International Perspectives on Sexual and Reproductive Health. 2012;38(1):23-33.
36. Schuler, S.R., et al. The influence of women’s changing roles and status in Bangladesh’s fertility transition: Evidence from a study of credit programs and contraceptive use. World Development. 1997;25(4):563-75.
37. Johnston, H.B., et al. Health system costs of menstrual regulation and care for abortion complications in Bangladesh. International Perspectives on Sexual and Reproductive Health. 2010;36(4):197-204.
38. Rahman M, DaVanzo J, Razzaque A. Pregnancy Termination in Matlab, Bangladesh: Maternal Mortality Risks Associated with Menstrual Regulation and Abortion. International Perspectives On Sexual And Reproductive Health. 2014;40(3).
39. Bandewar S. Menstrual regulation as an abortion method : A socio-medical and legal evaluation to explore its promotion in India. The State Level Consultation on Issues Related to Safe and Legal Abortion; Pune , Inia1998.
40. Biswas S, Begum B, Bakshi K. Maternal complications of menstrual regulation Bang Med J (Khulna). 2011;44:11-4.
41. National Institute of Population Research and Training (NIPORT), MEASURE Evaluation, icddr b. Bangladesh Maternal Mortality and Health Care Survey 2010. Dhaka, Bangladesh: NIPORT, MEASURE Evaluation, and icddr,b, 2012.
42. Hossain, A., et al. Menstrual regulation, unsafe abortion and maternal health in Bangladesh. New York: Guttmacher Institute,, 2012.
43. Plan International, icddr b. Child marriage in Bangladesh: Findings from a national survey. Dhaka: Plan International and icddr,b, 2013.
44. Nasrullah, M., et al. Effect of child marriage on use of maternal health care services in Pakistan Journal of Obstetrics and Gynaecology. 2013;122(33):517-24.
45. Ahmed, S.M., et al. Using formative research to develop MNCH programme in urban slums in Bangladesh: experiences from MANOSHI BRAC. BMC Public Health,. 2010;10(663).
46. Finlayson K, Downe S. Why Do Women Not Use Antenatal Services in Low- and Middle-Income Countries? A Meta-Synthesis of Qualitative Studies. Plos medicine. 2013;10(1).
47. National Collaborating Centre for Women’s and Children’s Health. Antenatal care routine care for the healthy pregnant woman. Clinical Guideline. London NICE, 2008.
48. Ross AB, DeStigter KK, Rielly M, Souza S, Morey GE, Nelson M, et al. A Low-Cost Ultrasound Program Leads to Increased Antenatal Clinic Visits and Attended Deliveries at a Health Care Clinic in Rural Uganda. Plos one. 2013;8(10):e78450.
49. World Health Organization. Appropriate technology for birth. Lancet. 1985;2(426-7).
50. Nahar S, Costello A. The hidden cost of ‘free’ maternity care in Dhaka, Bangladesh. Health Policy and Planning. 1998;13(4):417-22.
51. O’Donnell O. Access to health care in developing countries: Breaking down demand side barriers. Cadernos de Saúde Pública 2007;23(12):2820-34.

86
52. McNamee P, LTernent, Hussein J. Barriers in accessing maternal healthcare: Evidence from low- and middle-income countries. Expert Review of Pharmacoeconomics and Outcomes Research. 2009;9(1):41-8.

87
Annex 1 Questionnaire (English)

88
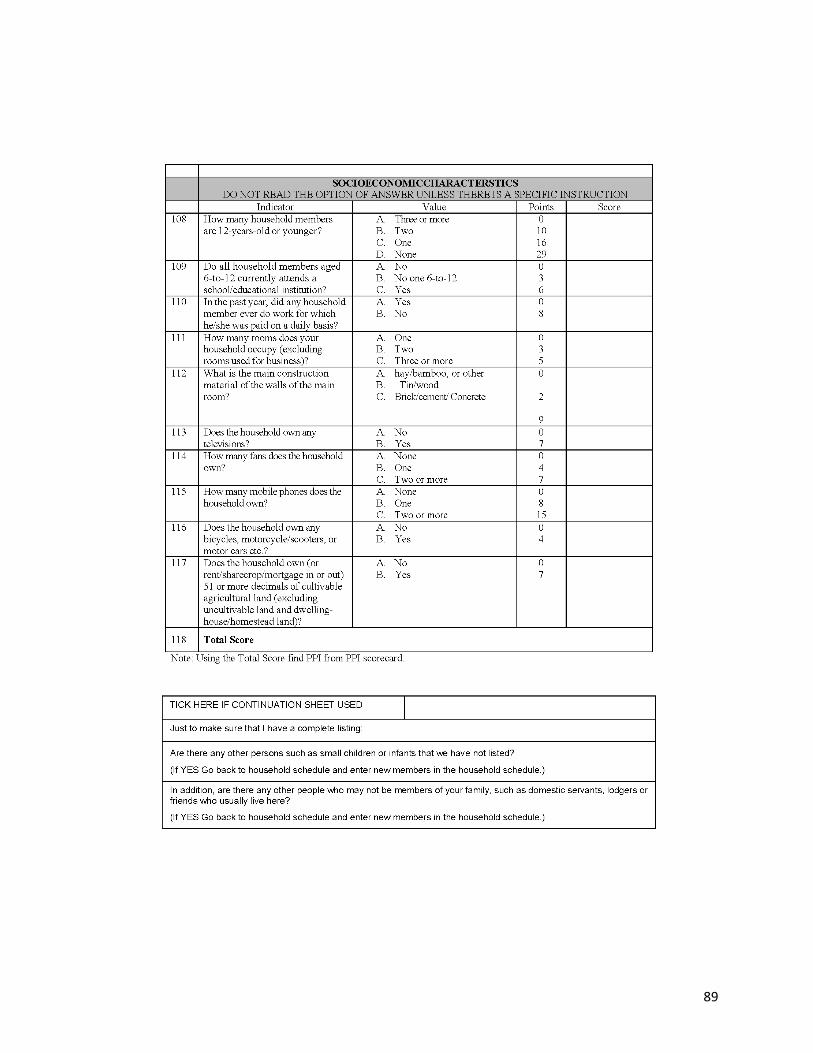
89

90

91

92
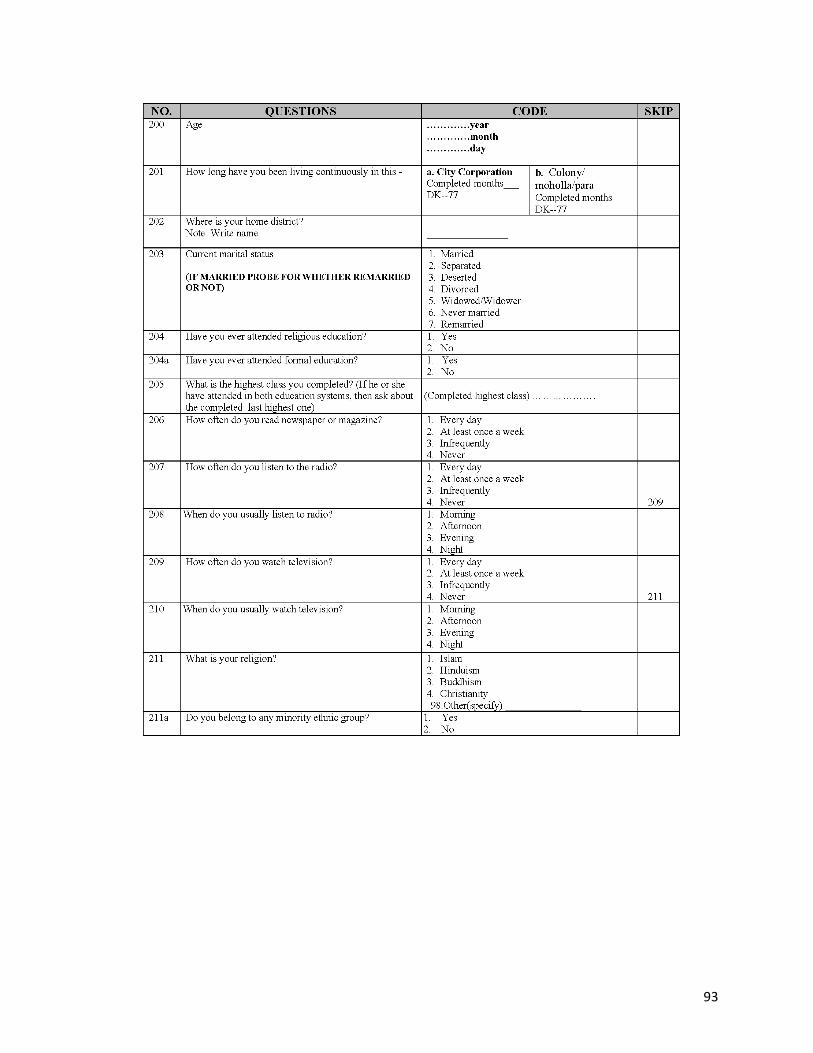
93

94
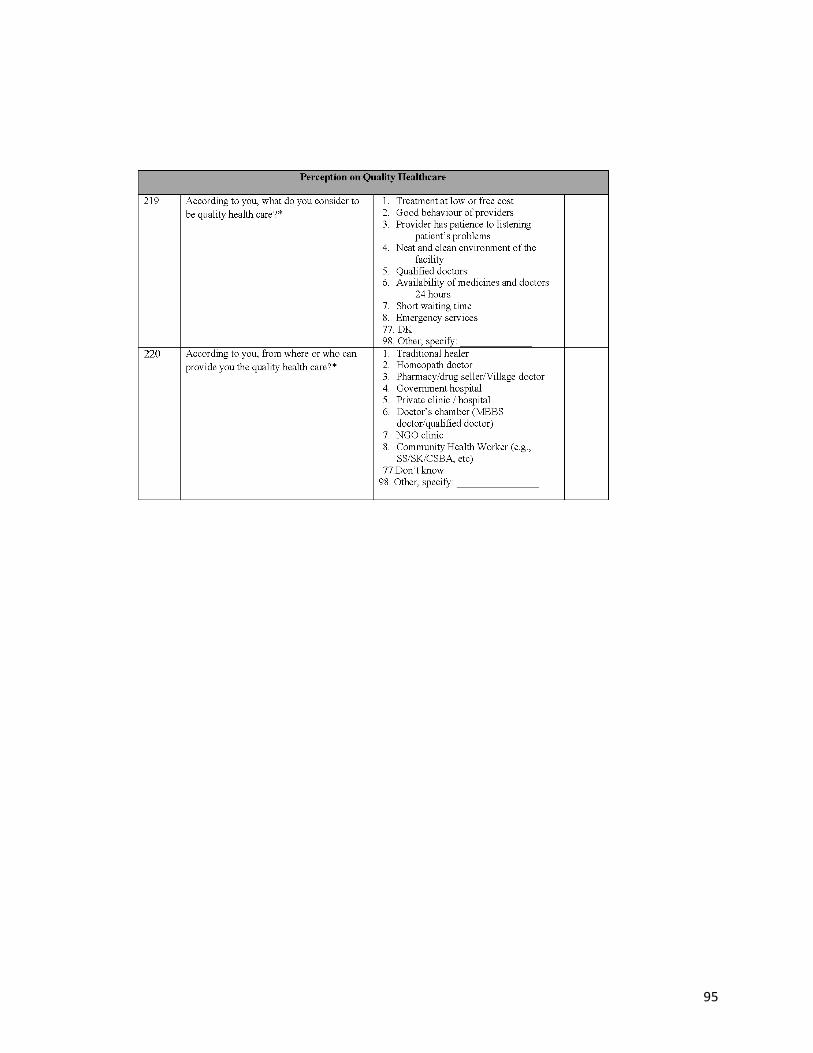
95

96

97

98

99

100

101

102

103

104

105

106

107

108

109

110

111

112

113

114

115