Health Reform for New Health Reform Reporters The Affordable Care

Health Care Reform and Public Health
The Massachusetts Experience and its Possible Implications for Public Health John Auerbach Institute for Urban Health Research and Practice

Noteworthy Successes of Health Care Reform
3
Massachusetts and US Average - 2000-2010 MA Uninsurance rate drops by 67%
†Population estimates are based on estimates of the total civilian non-institutionalized population in Massachusetts from the March Current Population Survey for the relevant year. Sources: DHCFP Household Surveys for 2000, 2002, 2004, 2006, and 2007; surveys from 2000 through 2006 were conducted February through June of the survey year; survey for 2007 was conducted January through July of 2007. Data for 2008, 2009 and 2010 are from the Urban Institute tabulations on the Massachusetts Health Insurance Survey for the respective years. For more information, please visit www.mass.gov/dhcfp. Click on “Publications and Analyses” then go to “Household Health Insurance Survey.” National uninsured rate is as reported by the US Census Bureau in Income, Poverty, and Health Insurance Coverage in the united States, 2008 and 2009 data. Online at http://www.census.gov
5.96.7
7.46.4
5.7
2.6 2.71.9
13.714.7 14.9
15.8 15.3 15.416.7
2000 2002 2004 2006 2007 2008 2009 2010
Perce
nt U
ninsu
rance
MassUS
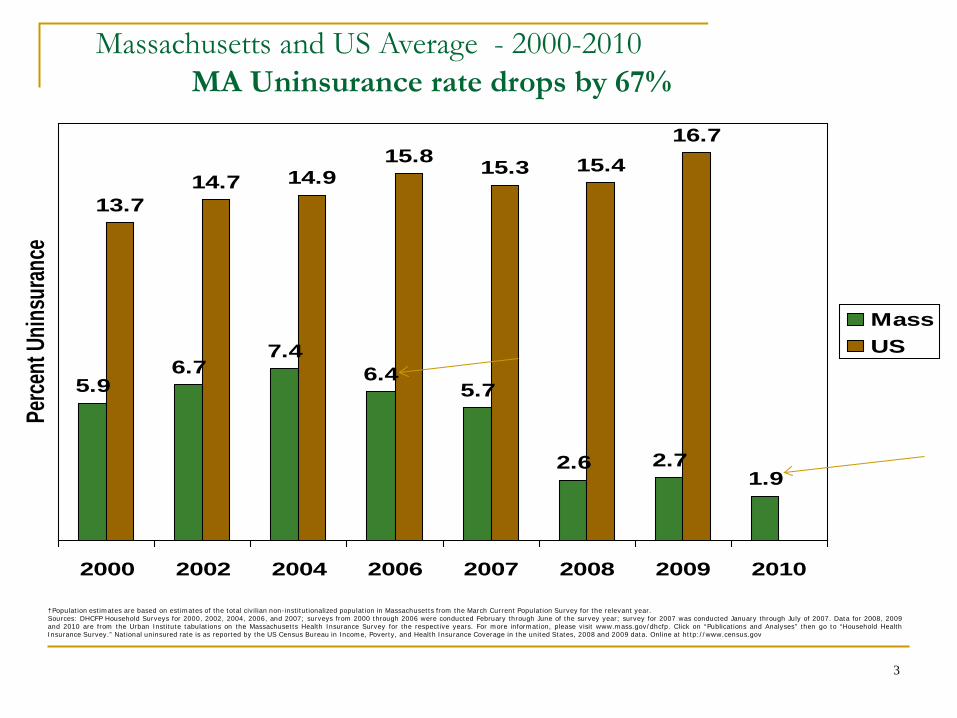
5.96.7
7.46.4
5.7
2.6 2.71.9
13.714.7 14.9
15.8 15.3 15.416.7
2000 2002 2004 2006 2007 2008 2009 2010
Perce
nt U
ninsu
rance
MassUS
Massachusetts and US Average - 2000-2010 US Insurance Rates have much farther to drop— at best on halfway

Health Care Reform Report Card
98% of population insured 91% have a personal health care provider 80% had a routine check-up in past year 81% had a dentist visit in past year 67% approval rating


Massachusetts Division of Health Care Finance and Policy
Non-Elderly Adults with a Doctor Visit in Past 12 Months by Insurance Status Compared with
the insured adults, uninsured non-elderly adults were much less likely to have had a doctor visit in the past 12 months. The 2009 estimates are not significantly different from the estimates for 2008.
Note: In some cases, what appear to be relatively large differences in estimates between 2008 and 2009 are not statistically significant. This arises because estimates based on small subgroups of the overall population have larger variances, making point estimates less precise. Source: Urban Institute tabulations on the 2008 and 2009 Massachusetts HIS
85% 86%
45%
85% 86%
54%
0%
20%
40%
60%
80%
100%
Total Population Insured Uninsured
2008 2009

Massachusetts Division of Health Care Finance and Policy
Non-Elderly Adults with a Preventive Care Visit in Past 12 Mo. by Insurance Status Compared with
the insured adults, uninsured non-elderly adults were much less likely to have had a preventive care visit in the past 12 months. The 2009 estimates are not significantly different from the estimates for 2008.
Note: In some cases, what appear to be relatively large differences in estimates between 2008 and 2009 are not statistically significant. This arises because estimates based on small subgroups of the overall population have larger variances, making point estimates less precise. Source: Urban Institute tabulations on the 2008 and 2009 Massachusetts HIS
73% 74%
31%
73% 74%
37%
0%
20%
40%
60%
80%
100%
Total Population Insured Uninsured
2008 2009
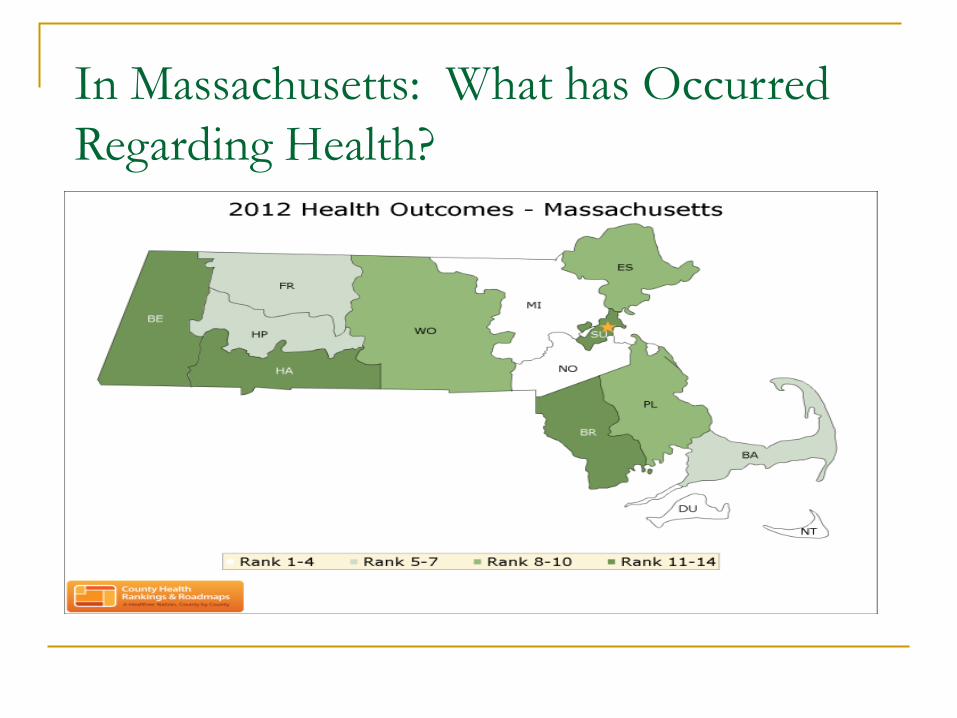
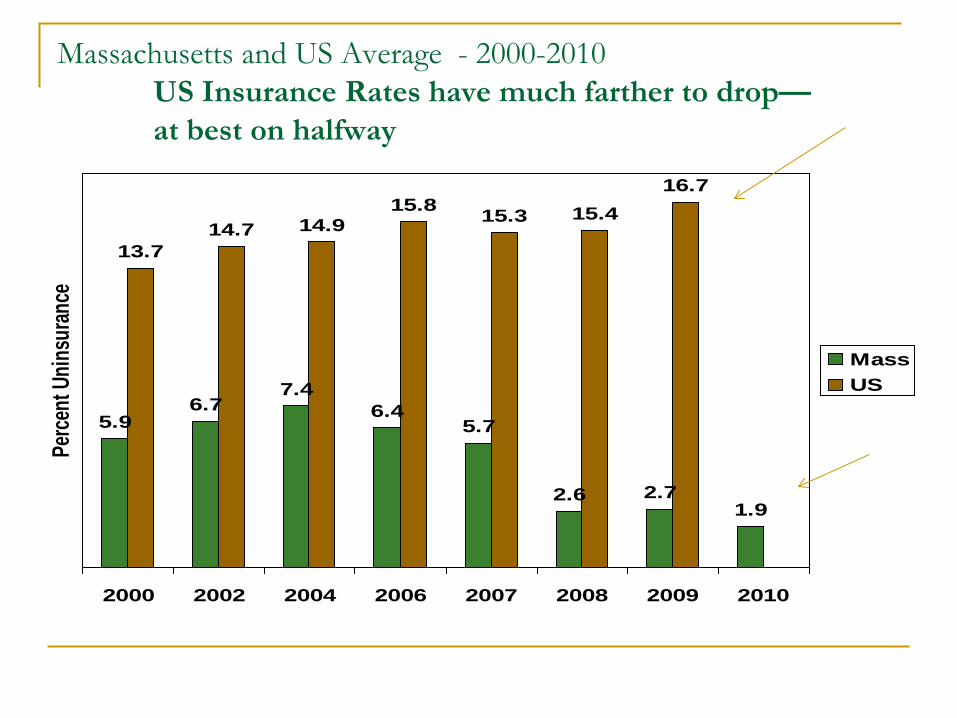
In Massachusetts: What has Occurred Regarding Health?

Increased Preventive Care Among People with Diabetes
The number of people with diabetes who received recommended preventative care (eye exam, foot exam, flu shot and twice annual A1c check) has increased by 7.6 percentage points in the period following health care reform implementation.
Source: MA BRFSS, 2005-2009
12.0%
19.6%*
0%
5%
10%
15%
20%
25%
2005-2006 2007-2009Age
-adj
uste
d %
of p
eopl
e w
ith d
iabe
tes
rece
ivin
g al
l fou
r rec
omm
ende
d pr
even
tive
care
mea
sure
s
Four measures: Annual Eye Exam, Annual Foot Exam for Numbness, Flu Shot, and Twice yearly A1c check
Massachusetts Department of Public Health *Statistically significant increase (p<.05)

Source: MA BRFSS, 2005-2010
93%
15%
36%
96%
14% 11%
48%*
98%*
48%*
0%
25%
50%
75%
100%
Insured Could not see MD dueto cost
Received flu vaccinein the past year
% o
f ad
ults
with
cu
rren
t ast
hm
a
Pre law (Jan. 05 - Jun. 06)Post law (Jul. 07 - Dec. 08)Post law (Jan. 09 - Dec. 10)
Increased Preventive & Other Care for People with Asthma
After the health care reform law was enacted, there was a significant increase in the percentage of MA adults age 18-64 with current asthma who reported having health insurance. There was also a significant increase in the percentage of adults age 18-64 with current asthma who reported that they had received a flu vaccine in the past year during this time period.
Massachusetts Department of Public Health *Statistically significant increase (p<.05)

Improved Screening and Vaccine Rates
54 55
84
43
5763
85
46
30
40
50
60
70
80
90
PSA test pastyear, men age 50-
64
Colonoscopy orsigmoidoscopy
past five years, allrespondents age
50-64
Mammography inpast two years,women 40-64
Flu Vaccine inPast Year, 50-64
%
January 2006-June 2007 July 2007-December 2008
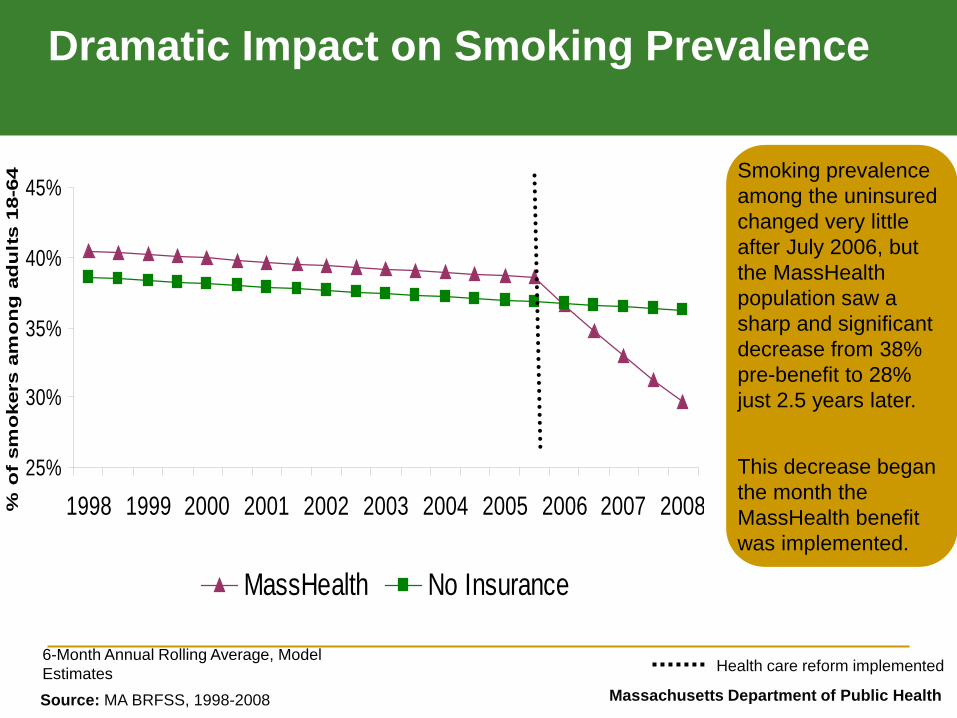
Dramatic Impact on Smoking Prevalence
6-Month Annual Rolling Average, Model Estimates
Massachusetts Department of Public Health
25%
30%
35%
40%
45%
1998 1999 2000 2001 2002 2003 2004 2005 2006 2007 2008% o
f sm
oke
rs a
mo
ng
ad
ult
s 18
-64
MassHealth No Insurance
Smoking prevalence among the uninsured changed very little after July 2006, but the MassHealth population saw a sharp and significant decrease from 38% pre-benefit to 28% just 2.5 years later. This decrease began the month the MassHealth benefit was implemented.
Source: MA BRFSS, 1998-2008
Health care reform implemented
Biggest Impact Was The Combination Of HCR And Robust Public Health
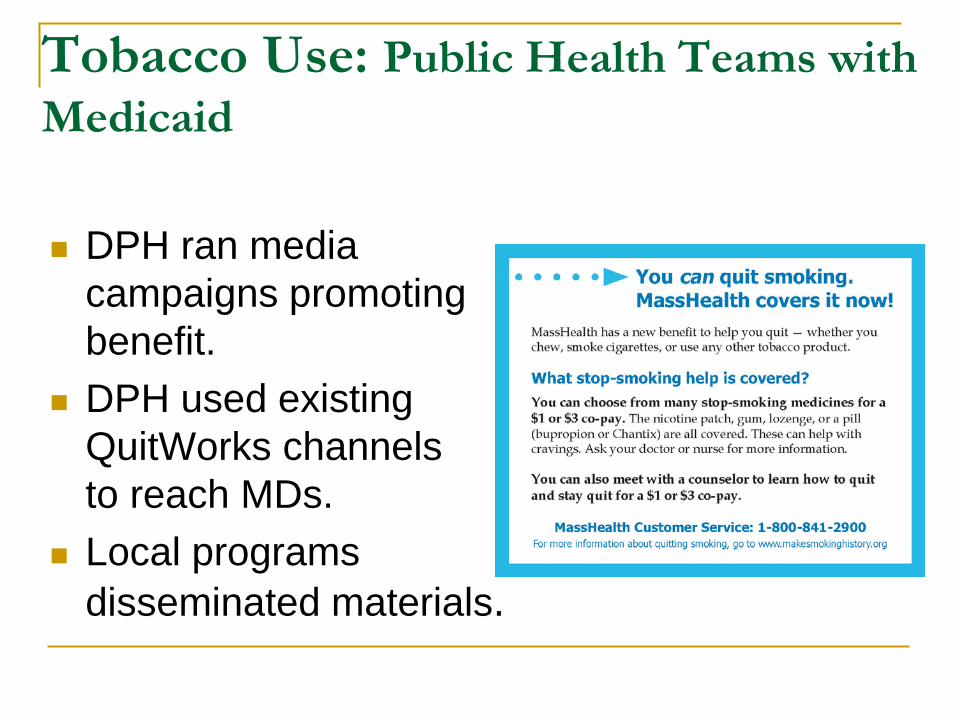
Tobacco Use: Public Health Teams with Medicaid DPH ran media
campaigns promoting benefit.
DPH used existing QuitWorks channels to reach MDs.
Local programs disseminated materials.

0
2,000
4,000
6,000
8,000
10,000
Apr-06 Jul-06 Oct-06 Jan-07 Apr-07 Jul-07 Oct-07 Jan-08 Apr-08 Jul-08 Oct-08 Jan-09 Apr-09
Num
ber o
f Cla
ims
Promotion and Utilization
31% Consumer Awareness
75% Consumer Awareness
More people quit smoking/use benefit during public health
campaign
MTCP Promotions
Began
MTCP Promotions
Ended
Announcement to 20,000 providers 6/06. Announcement to all MassHealth subscribers 6/06. Additional outreach to health centers, hospitals, community agencies, and providers beginning 8/06. Articles placed in over 15 professional and MCO newsletters beginning 9/06. MTCP radio and transit campaign 12/06 – 5/07. MassHealth wellness brochures 7/07. MTCP cessation television campaign 11/07 – 1/08. Consumer awareness surveyed by MTCP in 10/06 and by University of Massachusetts in 1/08.

Did it make a difference? To examine if health improved…
21,656 members who used the benefit studied
Longitudinal design; Pre-post individual’s use of benefit
August 2003-June 2008
Must have used the benefit by Nov 2007
15 diagnostic categories with over 200 hospitalizations

It did! - Cardiovascular Claims Decrease 46% decrease in hospitalization for acute
myocardial infarction
49% decrease in hospitalization for acute coronary heart disease
Controlled for demographics, prior health risks, seasonality, influenza rates, and the implementation date of the Massachusetts Smoke-Free Workplace Law
Health care improved & costs decreased

DPH Patch Promotion for Veterans – For vets with cessation coverage who weren’t using it

Veterans: Promising Results
1 mth. free patch/counseling for vets and family during the 7½ months campaign
Specialized promotion thru veteran services groups
4,000 respond Many transition to their own
insurance after first month
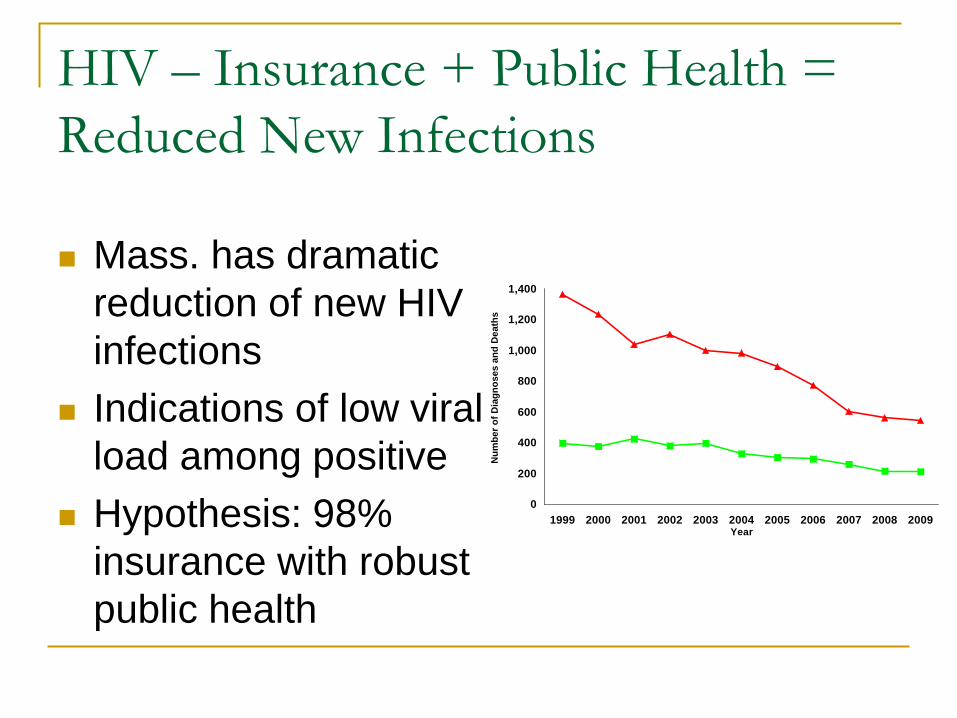
HIV – Insurance + Public Health = Reduced New Infections
Mass. has dramatic
reduction of new HIV infections
Indications of low viral load among positive
Hypothesis: 98% insurance with robust public health
0
200
400
600
800
1,000
1,200
1,400
1999 2000 2001 2002 2003 2004 2005 2006 2007 2008 2009Year
Num
ber o
f Dia
gnos
es a
nd D
eath
s

Smoking Prevalence in Massachusetts Adults (18 - 64):MassHealth vs. No Insurance
25.0%
30.0%
35.0%
40.0%
45.0%
7/1/199
9
7/1/200
0
7/1/200
1
7/1/200
2
7/1/200
3
7/1/200
4
7/1/200
5
7/1/200
6
7/1/200
7
7/1/200
8
Smok
ing
Prev
alen
ce (6
-Mon
th A
nnua
l Rol
ling
Ave
rage
)
MassHealth (Point Estimates) No Insurance (Point Estimates)
MassHealth (Model Estimates) No Insurance (Model Estimates)
Conclusion: Insurance & Robust Public Health Yield Best Results
We need more of these examples
0
200
400
600
800
1,000
1,200
1,400
1999 2000 2001 2002 2003 2004 2005 2006 2007 2008 2009Year
Num
ber o
f Dia
gnos
es a
nd D
eath
s

A Danger: INCORRECT ASSUMPTIONS ABOUT THE NEED FOR PUBLIC HEALTH
Faulty assumptions may be made about what is covered by insurance
Examples: nicotine
replacement therapy, family planning and immunization funds

Learning the Lessons of Health Care Reform for Public Health

#1: Get a Seat at the Table

Possible Ways to Prepare Understand/teach the basics basics
of insurance coverage Learn & appreciate the values & incentives of
insurers Examine key opportunities for input – e.g. SIM
grants Shore up core assumptions insufficiently
substantiated by data

#2: Take an Open-Minded and Critical Look at the Work Public Health Does Now
Possible Ways to Prepare
Identify core Look to the future needs Consider whether
traditional public health roles should be shifted to primary care
Establish billing for services previously funded by public health
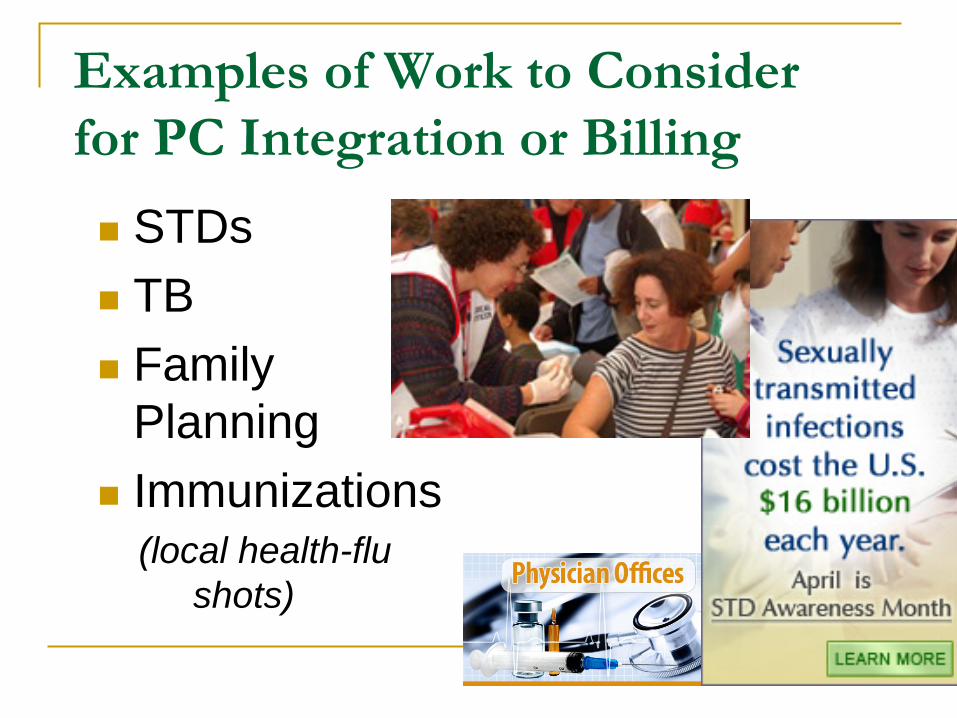
Examples of Work to Consider for PC Integration or Billing STDs TB Family
Planning Immunizations (local health-flu shots)
#3: Defend the Traditional Public Health Approach When Called For

Possible Ways to Prepare
Review ASTHO strategic plan and vision
Undertake assessment
of current and future needs; core vs. non-core activities

And Assist in Efforts to Clarify Vision of PH Departments of the Future Changing health
needs and emerging demographics
Policy focus New data analytics Integration on PH and
Primary Care Community support
and mobilization
We’re off the medical home
And then over to the
community meeting on reducing air
traffic injuries

Join ASTHO Day on the Hill

#4: Keep on the Lookout for Opportunities

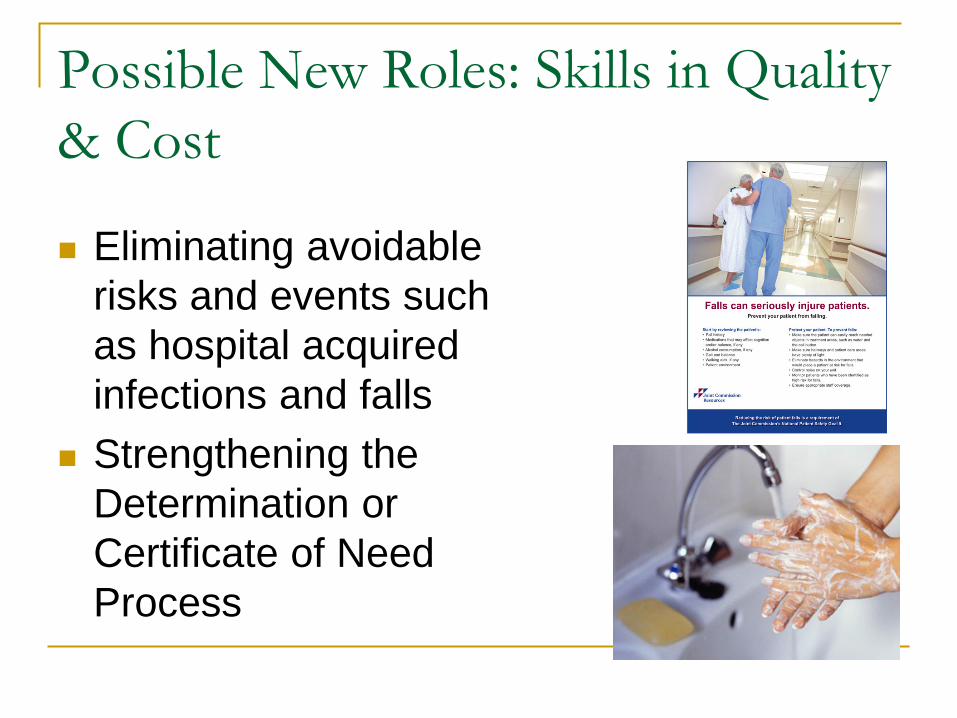
Possible New Roles: Skills in Quality & Cost
Eliminating avoidable risks and events such as hospital acquired infections and falls
Strengthening the Determination or Certificate of Need Process
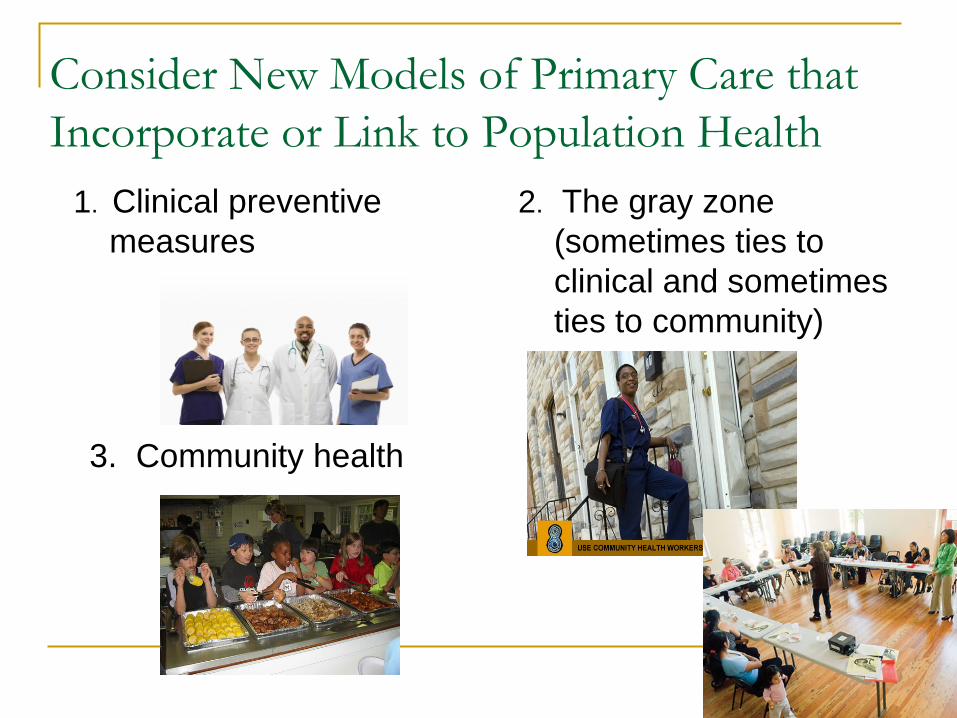
Consider New Models of Primary Care that Incorporate or Link to Population Health
1. Clinical preventive measures
3. Community health
2. The gray zone (sometimes ties to clinical and sometimes ties to community)
Assist in Search for “Population Health” Quality Outcome Measures Payment reform offers opportunities for
making system-wide changes Efforts underway to imbed global payment
with incentivized PH action steps/outcomes But response lags behind – need for
consensus on best evidence-based approach

#5: Envision a Better Model and Take Steps to Make it Real

40
Work at Base of Pyramid
Socioeconomic Factors
Changing the Context to make individuals’ default
decisions healthy
Long-lasting Protective Interventions
Clinical Interventions
Counseling & Education
Largest Impact
Smallest Impact
Examples
Poverty, education, housing, inequality
Immunizations, brief intervention, cessation treatment, colonoscopy Fluoridation, trans fat, smoke-free laws, tobacco tax
Rx for high blood pressure, high cholesterol, diabetes
Eat healthy, be physically active

Examples from Massachusetts The successful creation of a
$60 million Prevention and Wellness Trust Fund to support multiple innovative approaches to population health
The formation of a Community Health Worker (CHW) Certification Board

Examples Nationally
RWJ “Culture of Health”
National Prevention
Strategy CDC Social
Determinants of Health Workgroup

Some Signs This May be Working
Decrease in obesity levels or rate of growth for children in multiple states.
43

This is a Sentinel Moment
We are either part of the change or the change happens to us.

Public Health Departments Can Lead the Change