Health Care is a Complex Industry
27
Health Care is a Complex Industry 1 U.S. Health Care 2014
-
Upload
todd-moore -
Category
Documents
-
view
41 -
download
1
description
Health Care is a Complex Industry. U.S. Health Care 2014. Health Care is Vital to Alaska. “Health care is an indispensable service, just like running water, electricity, public education, police and fire protection, roads and highways, and other hallmarks of developed nations. - PowerPoint PPT Presentation
Transcript of Health Care is a Complex Industry

1
Health Care is a Complex Industry
U.S. Health Care 2014

2
Health Care is Vital to Alaska
“Health care is an indispensable service, just like running water,electricity, public education,police and fire protection, roads and highways, and other hallmarks of developed nations.Because everyone needs a doctor at some point, it’s an industry with a guaranteed customer base.” Alaska DOLWD
>36,000 jobs; >$1.6 billion in wages

3
Growth in Health Care Jobs Continues
2006 2010 2015 2020 2025 203020,000
40,000
60,000
80,000
100,000
120,000
140,000
65 plus population
Fastest Growing Senior Population in U.S.

4
Industry Training/Education Requirements
STOJT MTOJT LTOJT Wk Exp
VOC AA BA BA+0
5
10
15
20
25
30
35
40
Training Levels for Occupationsby Alaska Industry
ConstructionOil and GasHealth
Construction Oil and Gas Health
# Firms 2388 76 1290
# Occupations 108 102 146
# AA+ 14 32 71
% AA+ 13% 31% 49%
DOLWD

5
Chronic Health Workforce Shortages
DOLWD Projected Need for Health Care Workers
Allied Hea
lth
Behav
ioral Hea
lth
Dentists
Health
Care Administ
rators
Medica
l Scie
ntists an
d Engin
eers
All Nurse
s
Physicia
n Assista
nts
Physicia
ns and O
ther Rela
ted0
2000
4000
6000
8000
10000
12000
14000
16000
18000
20000
Vacant Health Care Estimated Positions by Category (2012 Vacancy Study)
Filled Vacant
9%
10%
2% 10%
9%
8%
8%
5%
Overall Vacancy Rate = 8%
Overall Vacancy RateUrban/Rural
7%/10%
Health-Related Occupations*
Employment Openings
2010 2020 % Change Growth Replacement Total
36,139 46,104 28% 9,965 9,356 19,321
*Includes: Health Practitioner and Technical, Healthcare Support, and partial Education/Training/Library, Personal Care and Services, Management, Community and Social Services, Office and Administrative Support, Installation/Maintenance/Repair, Production
Nursing22528%
Allied Health20725%
Behavioral Health
32340%
Other617%
Health Degrees - AY2010

6
% of Workers 50+ Years Old (> 33% over 50)
Surgeons 66.7Psychiatrists 64.5Pediatricians, General 57.4Medical and Health Services Managers 48.0Occupational Health and Safety Specialists (Oil and Gas) 46.0Licensed Practical and Licensed Vocational Nurses 45.5Nurse Practitioners 44.5Nurse Anesthetists 41.9Medical and Clinical Laboratory Technologists 41.7Registered Nurses 41.3Physician Assistants 41.1Obstetricians and Gynecologists 40.0Clinical, Counseling, and School Psychologists 39.4Medical Equipment Repairers 39.3Dietetic Technicians 38.9Medical Transcriptionists 38.9Speech-Language Pathologists 37.8Anesthesiologists 37.5Medical Scientists, Except Epidemiologists 37.0Internists, General 36.8Dentists, General 36.5Optometrists 36.4Family and General Practitioners 36.1Pharmacists 35.8Radiologic Technologists 35.2Dental Hygienists 34.8Home Health Aides 34.3Recreational Therapists 34.1
Facing Retirement WaveOf Health Care Workers
%
7
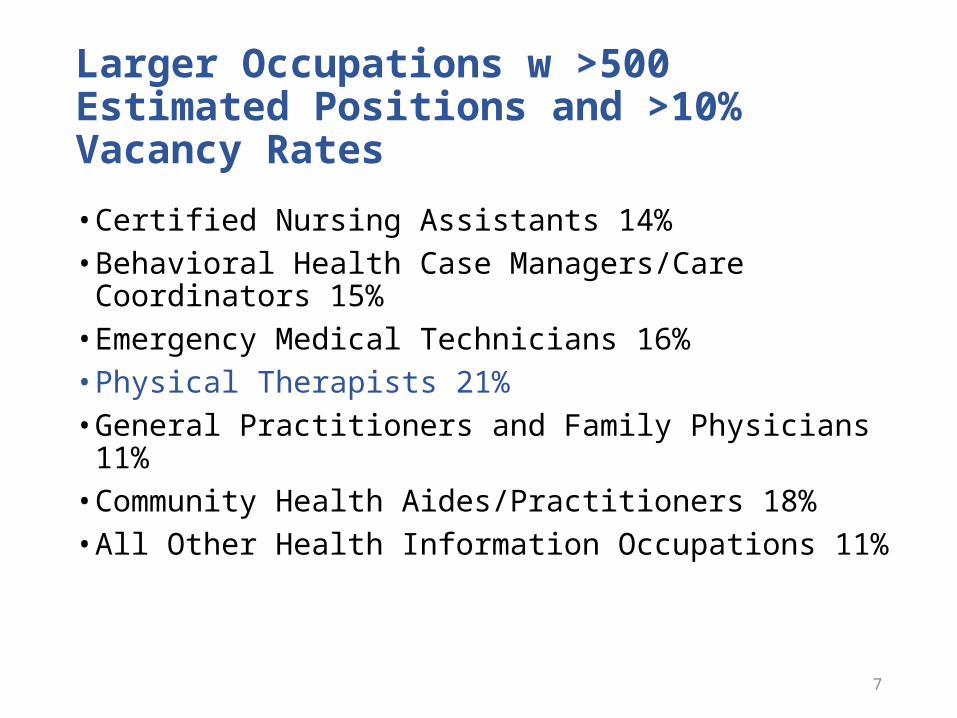
Larger Occupations w >500 Estimated Positions and >10% Vacancy Rates
• Certified Nursing Assistants 14%• Behavioral Health Case Managers/Care Coordinators 15%• Emergency Medical Technicians 16%• Physical Therapists 21%• General Practitioners and Family Physicians 11%• Community Health Aides/Practitioners 18%• All Other Health Information Occupations 11%

8
Highest Vacancy Rates - 20%+ (and # of estimated vacancies)
• Audiologists 21% (7)• Dental Health Aide Therapists 20% (10)• Orthotists and Prosthetists 50% (25)• Physical Therapist Aides 28% (16)• Physical Therapists 21% (142)• Psychiatric and Mental Health Aides 20% (1)• Speech-Language Pathologists 20% (24)• Other Practitioner Support Technicians/Technologist 25% (25)• Other Therapists Support Workers (not T/T) 23% (49)• Nurse Educators (Healthcare Facility or Multi-Site) 22% (33)• Women’s Healthcare Nurse Practitioners 43% (16)• Psychiatrists 22% (20)

9
Shortages are Due to Inadequate Local Supply, Growing Demand, Recruitment and Retention Issues
Major Strategies:• UA “Grow Our Own, Close to Home”• Alaska Area Health Education Center (AHEC) System –
“Pipeline Workers”• Alaska Health Workforce Coalition – Health Workforce Plan
and Action Agenda

10
Health Programs Impact UA
% of Graduates in Health Programs
Enrollment Growth
20%
80%
UA Graduates 2003-2012 (N=34,114)
Health ProgramsOther Programs
26%
74%
UAA Graduates 2003-2012 (N=19,758)
Health ProgramsOther Programs
Fall 0
1Fa
ll 02Fa
ll 03
Falll
04Fa
ll 05Fa
ll 06Fa
ll 07Fa
ll 08Fa
ll 09Fa
ll 10Fa
ll 11
0
500
1,000
1,500
2,000
2,500
3,000
UA Health Students – Fall 01-11
Pre-Majors
MajorsM
ajor
s/Pr
e-M
ajor
s
* Pre-Majors and Majors
2000 2001 2002 2003 2004 2005 2006 2007 2008 2009 2010 2011 2012 2013
2,125 2,2182,478
2,9613,392 3,519 3,602 3,562 3,692
4,1424,595 4,752 4,797 4,841
UA Health STUDENTS* 2000-2013 (128% Increase)

11
UAA Awards in High Demand Health Job Areas FY 2004-2013
FY04 FY05 FY06 FY07 FY08 FY09 FY10 FY11 FY12 FY13200
300
400
500
600
700
800
463 472489
559
594
569582
596
541
688
+27.7%
12
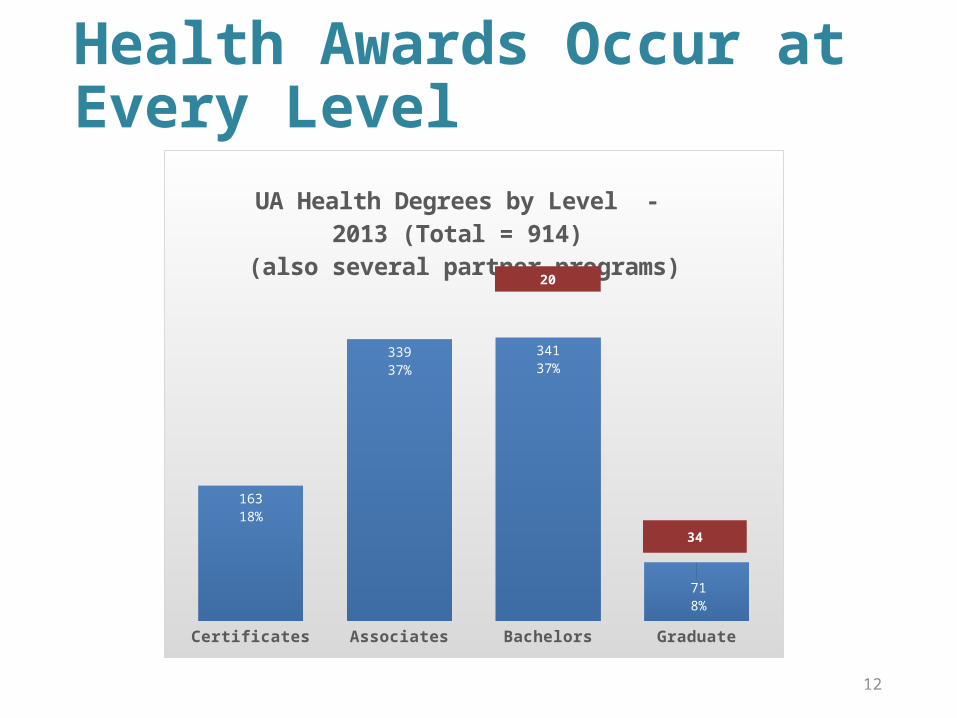
Health Awards Occur at Every Level
Certificates Associates Bachelors Graduate
16318%
33937%
34137%
718%
UA Health Degrees by Level - 2013 (Total = 914) (also several partner programs)
34
20

13
Health Programs Across the State• All campuses provide and/or receive health programs• System-wide Alliances and faculty work groups –
active since 2002; planning/coordination• A wide variety of programs (>80)
• Medicine/primary care/pharmacy• Nursing• Allied health• Therapies• Behavioral health• Public health and wellness• Medical office and health information

14
Our Graduates Make a Vital Contribution to Alaska• Of the 5,378 health graduates between 2003 and 2010, 4,469
were Alaska residents two years after graduation (83%)• Of those residents, 4,060 were working in the state two years
after graduation (91%)*• And 3,553 of those residents were working in occupational
categories where you would expect to find health programs graduates (88%):• Health Practitioner and Technical• Healthcare Support • Community and Social Services• Personal Care Services• Management• Education, Training and Library • Office and Administrative Support
* DOLWD data does not include government employees or the self-employed

15
By Program Category• Allied Health:
• 1014 graduates 2003-2010• 855 residents 2 years after graduation (84%)• 812 working in Alaska (95%) • 635 employed in the 7 fields (78%) and 86 more in Protective
Services (includes firefighters) for a total of 721 (89%)
• Behavioral Health: • 2381 graduates 2003-2010• 1986 residents 2 years after graduation (83%)• 1716 working in Alaska (86%)• 1441 employed in the 7 fields (84%)
• Nursing: • 1568 graduates 2003-2010• 1295 residents 2 years after graduation (83%)• 1247 working in Alaska (96%)• 1210 employed in the 7 fields (97%)
16
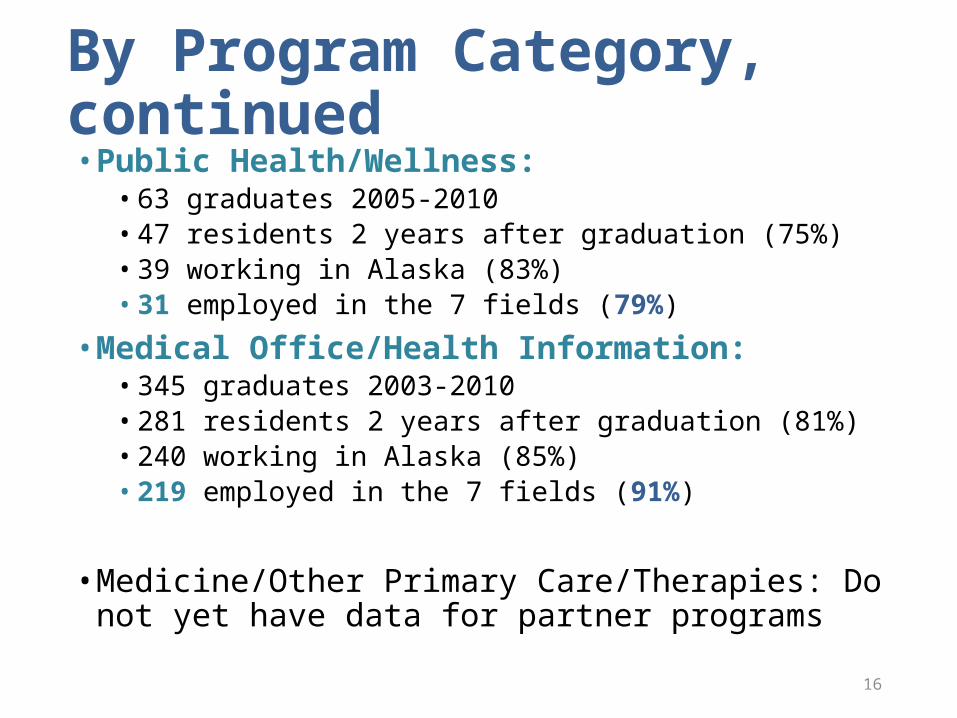
By Program Category, continued• Public Health/Wellness:
• 63 graduates 2005-2010• 47 residents 2 years after graduation (75%)• 39 working in Alaska (83%)• 31 employed in the 7 fields (79%)
• Medical Office/Health Information: • 345 graduates 2003-2010• 281 residents 2 years after graduation (81%)• 240 working in Alaska (85%) • 219 employed in the 7 fields (91%)
• Medicine/Other Primary Care/Therapies: Do not yet have data for partner programs

17
Allied Health Programs• Dental Hygiene (AAS) – 3% vacancy rate:
• 100 graduates 2003-2010• 90 residents 2 years after graduation (90%)• 90 working in Alaska (100%) • 89 employed in the 7 fields (100%)
• Medical Laboratory Technology (AAS) – 5% vacancy rate: • 26 graduates 2003-2010• 21 residents 2 years after graduation (81%)• 20 working in Alaska (95%) • 20 employed in the 7 fields (100%)
• Medical Technology (BS) – 9% vacancy rate• 70 graduates 2003-2010• 58 residents 2 years after graduation (83%)• 53 working in Alaska (91%)• 50 employed in the 7 fields (94%)
0
5
10
15
20Dental Hygiene AAS
0
5
10
15
20
Medical Technology BS
02468
Medical Laboratory Technology AAS

18
Nursing Programs• Nursing (AAS) – 8% vacancy rate:
• 505 graduates 2003-2010• 424 residents 2 years after graduation (84%)• 419 working in Alaska (99%)• 408 employed in the 7 fields (97%)
• Nursing (BS) – 8% vacancy rate: • 824 graduates 2003-2010• 662 residents 2 years after graduation (80%)• 640 working in Alaska (97%)• 627 employed in the 7 fields (98%)
• Nursing (MS) – 13% vacancy rate: • 96 graduates 2003-2010• 87 residents 2 years after graduation (91%)• 78 working in Alaska (90%)• 78 employed in the 7 fields (100%)
020406080
100120
Nursing AAS
020406080
100120140
Nursing BS
05
10152025
Nursing MS

19
Behavioral Health Programs• Psychology (BA/BS): • 789 graduates 2003-2010• 596 residents 2 years after graduation (76%)• 508 working in Alaska (85%)• 389 employed in the 7 fields (77%)
• Social Work (MSW) - ~ 10% vacancy rate:• 175 graduates 2003-2010• 151 residents 2 years after graduation (56%)• 139 working in Alaska (92%)• 128 employed in the 7 fields (92%)
020406080
100120140160
Psychology BA/BS
05
101520253035
Social Work MSW

20
Recent Highlights• Anchorage Dental Mission of Mercy
• 40 UAA Dental Assistant and Hygiene students participated • 1332 volunteers• 1589 patients• Value of care ~$1.157 million• Fairbanks in 2015
• Alaska Child Welfare Workforce Initiative• 5-year ($145k/year) grant to UAA School of Social Work • Recruit students for employment with Office of Children’s Services • With UAF BSW program and SOA OCS
• WWAMI • AHEC placed 15 first-year WWAMI students in rural communities for
summer clinical rotations• UAA’s curriculum proposal was selected, out of 13 submitted, to become
the basis for the new curriculum structure for the Foundations Phase for the UW School of Medicine and the entire WWAMI system beginning fall 2015

21
Highlights, continued• Geriatric Education Series
• Over 250 health providers across Alaska participated via distance• 15 contact hours of continuing education per series; 10 sessions X 2
series/year
• Ikautaq Project • Recruit 80 Alaska Native students to enroll in OEC
• Children’s Behavioral Health Specialist or Direct Service Specialist • In their home villages• Partnership: Center for Human Development, Prince William Sound Community
College, Aqqaluk Trust
• Livable Wage Task Force • To study, define and make recommendations regarding livable wage for
direct service workers
• SHARP Program • Health professional loan repayment/employment incentives• Received legislative funding for FY15

22
Challenges for UA Health Programs • Budgetary Concerns• Facilities Limitations• Faculty/Staff Turnover and Recruitment• Other Issues
23
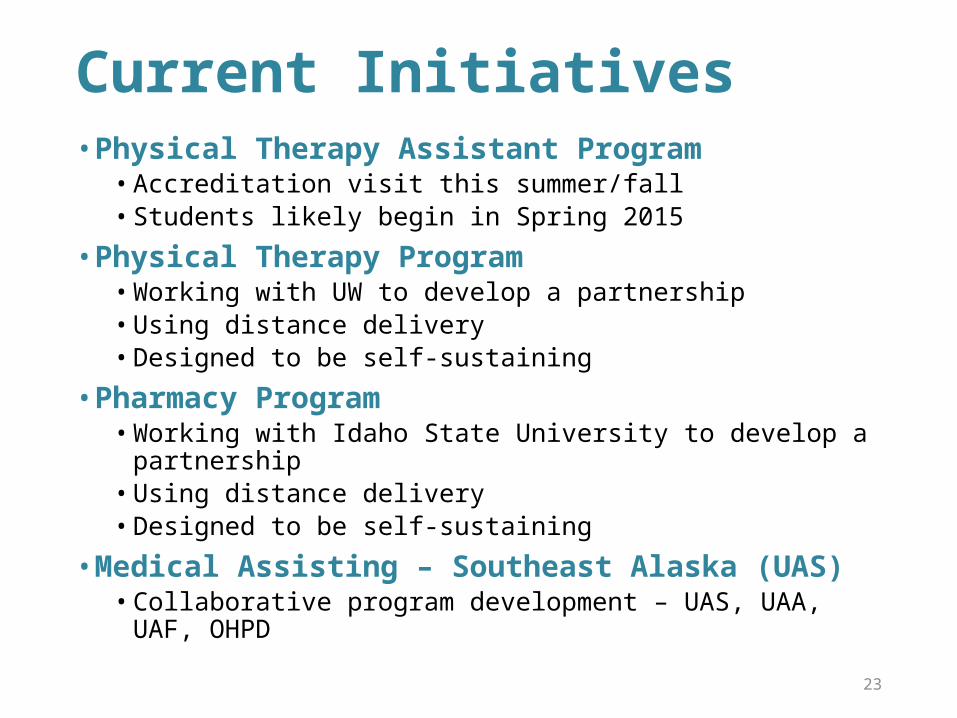
Current Initiatives• Physical Therapy Assistant Program
• Accreditation visit this summer/fall• Students likely begin in Spring 2015
• Physical Therapy Program• Working with UW to develop a partnership • Using distance delivery • Designed to be self-sustaining
• Pharmacy Program• Working with Idaho State University to develop a partnership• Using distance delivery• Designed to be self-sustaining
• Medical Assisting – Southeast Alaska (UAS)• Collaborative program development – UAS, UAA, UAF, OHPD

24
Current Initiatives, continued• UAF TAACCCT grant
• Expand allied health education at rural campuses
• Healing Our Heroes• Train rural providers to improve service to veterans (AHEC)
• Health Program of Study• Prepare rural high school students for post-secondary health
programs (Interior and Southeast AHECs)
• Nursing• Distance BS in Nursing Science – pilot in Fairbanks• Doctorate of Nursing Practice
• Health Information Technology OEC• Collaboration between UAS Sitka and CITC
• Alaska Health Workforce Coalition Action Agenda update

25
FAQ
• Why is there such a long time gap between pre-requisite completion and starting the (BS) nursing program? Is there a solution?
2004 2006 2008 2010 2012 20140
200
400
600
800
1000
Interest is High:
BS Nursing Admission Cohorts
Summer 14
Fall 14
Spring 15
Summer 15
Fall 15
Spring 16
Summer 16
Fall 16
Spring 17
Summer 17
Fall 17
Spring 18
Summer 18
Fall 18
Spring 19
Summer 19
Fall 19
Spring 20
Summer 20
Fall 20
Spring 21
BACKLOG from 12/13 200 40 40 40 40 40 Admitted October 13 80 40 40 Admitted February 14 80 40 40 Admit October 14 60 40 20 Admit October 15 60 20 40 Admit October 16 60 40 20 Admit October 17 60 20 40 Admit October 18 80 40 40 Admit October 19 120 40 40 40 Admit October 20 120 40
120 120 120 120 120 120 120
Note: It won’t take this long to achieve equilibrium, as some students do not take their seats, allowing others to move up.
Nursing Pre-Majors (UAA)

26
FAQ• Why doesn’t Alaska have its own medical school/pharmacy school/…?
High CostFaculty ShortagesSmall Population
Limited (But Important) DemandConsortium/Partner Model
More economicalAlaska-sized cohortsFocus on state need
27
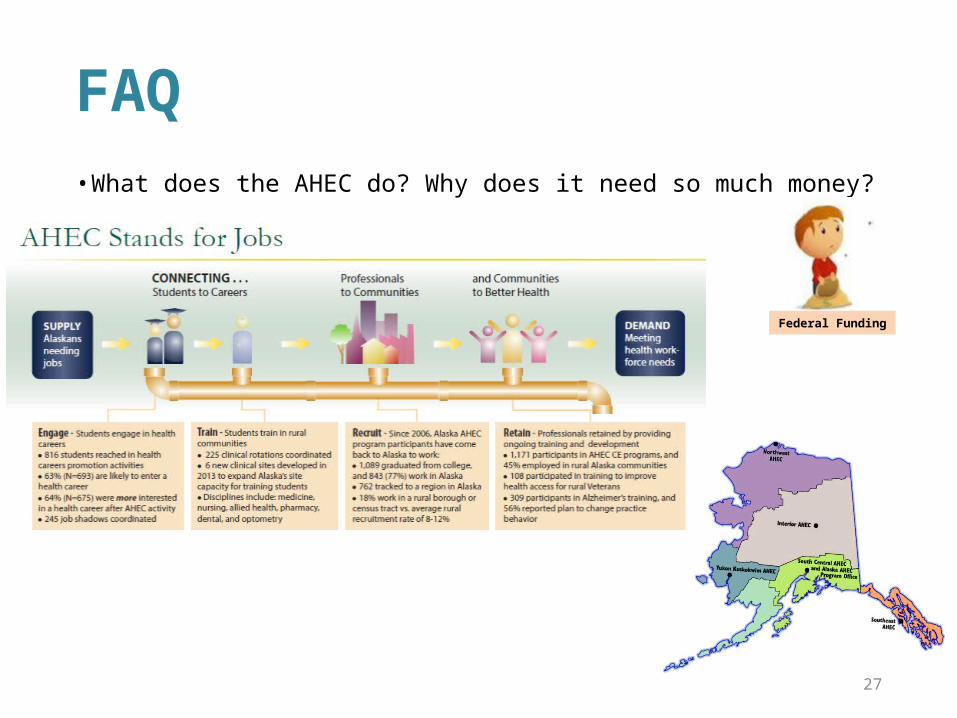
FAQ• What does the AHEC do? Why does it need so much money?
Federal Funding