
Health Care Indicators - Centers for Medicare & Medicaid Services
43
This feature presents highlights from sta- tistics on health care utilization, prices, expenses, employment, and work hours, as well as on national economic activity, with brief analysis of these economic indicators. These statistics provide an early indication of changes occurring in the health care sec- tor and within the general economy. Although most data are for the first quarter of 1999, American Hospital Association data (Tables 1 and 2) refer to the third quarter of 1998. KEY TRENDS • The decline in employment in home health care services has slowed, falling 6.6 percent in the first quarter of 1999 after a fourth-quarter decline of 8.1 per- cent. Non-supervisory employment also declined, down 6.7 percent in the first quarter of 1999, driving a 4.7-percent decrease in this industry’s implied pay- rolls. (Implied payrolls are calculated by multiplying the number of non-supervi- sory workers by their average weekly earnings. Average weekly earnings are average weekly hours times average hourly earnings.) Home health care ser- vice employment and payroll decreases began in the first quarter of 1998, follow- ing public sector actions to control Medicare spending growth and detect fraud and abuse. • Employment in all private and govern- ment hospitals increased by 1.3 percent in the first quarter of 1999, driven by a 1.5-percent growth in private hospital employment and a 1.7-percent increase in local government hospital employment. Employment in Federal Government hospitals continued to decline. • Inpatient days increased by 0.8 percent in the third quarter of 1998, compared with the same period of the previous year. This increase is the second in three quar- ters and only the second in a 6-year peri- od. An increase of 1.2 percent in hospital admissions was tempered by a 0.4-percent decline in the adult length of stay, the 36th consecutive quarterly decline. • Hospital Insurance (HI) Trust Fund assets rose 8.3 percent in the first quar- ter of 1999. Estimates in the 1999 Annual Report of the Board of Trustees of the Federal Hospital Insurance Trust Fund indicate that, given current law and trends, the Part A trust fund will be exhausted in 2015. • Consumer Price Index (CPI) medical price growth, which appeared to have reached a trough in the fourth quarter of 1997 at 2.6 percent, increased 3.5 per- cent for the third consecutive quarter in the first quarter of 1999. • Faster growth in medical prices over the past year was attributable to accelerating drug and hospital price growth. • Producer Price Index (PPI) growth for both skilled nursing facility (SNF) and home health care ser vices fell to near his- torical lows in the first quarter of 1999. HEALTH CARE FINANCING REVIEW/Fall 1999/Volume 21, Number 1 79 The authors are with the Office of the Actuary, Health Care Financing Administration (HCFA). The views expressed are those of the authors and do not necessarily reflect those of HCFA. Hospital, Employment, and Price Indicators for the Health Care Industry: First Quarter 1999 Mary Lee Seifert, Stephen K. Heffler, and Carolyn S. Donham Health Care Indicators
Transcript of Health Care Indicators - Centers for Medicare & Medicaid Services

This feature presents highlights from sta-tistics on health care utilization, prices,expenses, employment, and work hours, aswell as on national economic activity, withbrief analysis of these economic indicators.These statistics provide an early indicationof changes occurring in the health care sec-tor and within the general economy.Although most data are for the first quarterof 1999, American Hospital Associationdata (Tables 1 and 2) refer to the thirdquarter of 1998.
KEY TRENDS
• The decline in employment in homehealth care services has slowed, falling6.6 percent in the first quarter of 1999after a fourth-quarter decline of 8.1 per-cent. Non-supervisory employment alsodeclined, down 6.7 percent in the firstquarter of 1999, driving a 4.7-percentdecrease in this industry’s implied pay-rolls. (Implied payrolls are calculated bymultiplying the number of non-supervi-sory workers by their average weeklyearnings. Average weekly earnings areaverage weekly hours times averagehourly earnings.) Home health care ser-vice employment and payroll decreasesbegan in the first quarter of 1998, follow-ing public sector actions to controlMedicare spending growth and detectfraud and abuse.
• Employment in all private and govern-ment hospitals increased by 1.3 percentin the first quarter of 1999, driven by a1.5-percent growth in private hospitalemployment and a 1.7-percent increase inlocal government hospital employment.Employment in Federal Governmenthospitals continued to decline.
• Inpatient days increased by 0.8 percent inthe third quarter of 1998, compared withthe same period of the previous year.This increase is the second in three quar-ters and only the second in a 6-year peri-od. An increase of 1.2 percent in hospitaladmissions was tempered by a 0.4-percentdecline in the adult length of stay, the36th consecutive quarterly decline.
• Hospital Insurance (HI) Trust Fundassets rose 8.3 percent in the first quar-ter of 1999. Estimates in the 1999 AnnualReport of the Board of Trustees of theFederal Hospital Insurance Trust Fundindicate that, given current law andtrends, the Part A trust fund will beexhausted in 2015.
• Consumer Price Index (CPI) medicalprice growth, which appeared to havereached a trough in the fourth quarter of1997 at 2.6 percent, increased 3.5 per-cent for the third consecutive quarter inthe first quarter of 1999.
• Faster growth in medical prices over thepast year was attributable to acceleratingdrug and hospital price growth.
• Producer Price Index (PPI) growth forboth skilled nursing facility (SNF) andhome health care services fell to near his-torical lows in the first quarter of 1999.
HEALTH CARE FINANCING REVIEW/Fall 1999/Volume 21, Number 1 79
The authors are with the Office of the Actuary, Health CareFinancing Administration (HCFA). The views expressed arethose of the authors and do not necessarily reflect those ofHCFA.
Hospital, Employment, and Price Indicators for the HealthCare Industry: First Quarter 1999
Mary Lee Seifert, Stephen K. Heffler, and Carolyn S. Donham
HHeeaalltthh CCaarree IInnddiiccaattoorrss

HOSPITAL OCCUPANCY RATES
Reversing a second quarter decline, theadult occupancy rate again increased, ris-ing 0.8 percentage points in the third quar-ter of 1998 (Figure 1). Inpatient days rose0.8 percent from the same period of the pre-vious year, and staffed beds decreased only0.6 percent. The adult occupancy rate rep-resents the ratio of the average daily hospi-tal census (inpatient days divided by thenumber of days in the year) to the averagenumber of staffed hospital beds. The adultoccupancy rate has decreased about 14
percentage points over the long term, from73.1 percent in the second quarter of 1983to 58.7 percent in the third quarter of 1998.The number of staffed hospital beds hasfallen about 18 percent, from 1,005,718 inthe second quarter of 1983 to 824,630 in thethird quarter of 1998. With the exceptionof the first and third quarters of 1998, thenumber of inpatient days has decreasedevery quarter since the first quarter of1990. A 33.4-percent decline in inpatientdays since the second quarter of 1983 hasbeen the main reason for the long-termdecline in the adult occupancy rate.
80 HEALTH CARE FINANCING REVIEW/Fall 1999/Volume 21, Number 1
-5.0
-2.0
-1.0
0.0
1.0
-4.0
-3.0
1990 1991 1992 1993 1994
Quarter
1995 1996 1997 1998
Per
cen
t C
han
ge
2.0Staffed Beds
Occupancy Rate
Inpatient Days
SOURCE: American Hospital Association: National Hospital Panel Survey Reports, Chicago. Monthly reports forJanuary 1989-September 1998.
Figure 1
Staffed Beds, Inpatient Days, and Occupancy Rate: Percent Change and Change in Rate fromSame Period of Previous Year: 1990-1998

HOSPITAL ADMISSIONS AND OUT-PATIENT VISITS
Hospital admissions rose 1.2 percent inthe third quarter of 1998, compared withthe same period of the previous year, whileoutpatient visits rose more rapidly, increas-ing 7.7 percent (Figure 2). The pace ofgrowth in outpatient visits picked up fromthe 6.4 percent posted in the second quar-ter of 1998 and appears to be accelerating.
For the third quarter of 1998, operatingexpenses increased 4.0 percent, comparedwith the same period of the previous year,
and hospital revenues were up 3.0 percent.The 1.0-percentage-point difference ingrowth rates is the largest gap betweenexpense and revenue growth rates in morethan 9 years. Inpatient revenues increasedby 1.1 percent but inpatient expenses grewby 1.9 percent. Outpatient revenues grewby 7.2 percent and outpatient expensesrose by 8.0 percent. On a per utilizationbasis, however, the expense per inpatientadmission increased by 0.7 percent, whilethe expense per outpatient visit increasedonly 0.2 percent.
HEALTH CARE FINANCING REVIEW/Fall 1999/Volume 21, Number 1 81
SOURCE: American Hospital Association: National Hospital Panel Survey Reports, Chicago. Monthly reports forJanuary 1989-September 1998.
Figure 2
Outpatient Visits and Inpatient Admissions, Percent Change from Same Period of Previous Year: 1990-1998
-4.0
2.0
4.0
6.0
8.0
-2.0
0.0
Quarter
1990 1991 1992 1993 1994 1995 1996 1997 1998
Per
cen
t C
han
ge
14.0
12.0
10.0
Admissions
Outpatient Visits

MEDICARE TRUST FUND OPERATIONS
Total Medicare outlays (the sum of PartA and Part B outlays) decreased 4.3 per-cent in the first quarter of 1999. AlthoughMedicare Part A outlays rose 1.0 percent,Part B outlays dropped 12.3 percent. TheHI Trust Fund income grew 9.9 percent,and, by the end of the first quarter of 1999,the level of assets in the HI Trust Fundincreased 8.3 percent from the same peri-od 1 year earlier (Figure 3). This was thefourth consecutive quarterly increase inassets and was attributable to the 9.9-per-
cent income increase coupled with only a1.0-percent increase in outlays. A strongeconomy with low unemployment contin-ued to boost HI Trust Fund income, whileoutlays slowed for reasons similar to thoseexplaining lower outlays in 1998: LowerMedicare hospital updates for reimburse-ment rates for 1998 and 1999 under theBalanced Budget Act of 1997 and continu-ing efforts to combat fraud and abuse.Estimates found in the 1999 Annual Reportof the Board of Trustees of the FederalHospital Insurance Trust Fund indicatethat, given current law and trends, the PartA Trust Fund will be exhausted in 2015.
82 HEALTH CARE FINANCING REVIEW/Fall 1999/Volume 21, Number 1
SOURCE: U.S. Treasury: Monthly Treasury Statement, Washington, D.C. January 1992-March 1999.
Figure 3
Medicare Hospital Insurance (HI) Trust Fund, Percent Change in Income, Outlays, and Assetsfrom Same Period of Previous Year: 1992-1999
-10.0
5.0
10.0
15.0
20.0
-5.0
0.0
Quarter1992 1994 1996 1998 1999
Per
cen
t C
han
ge
25.0 HI Income
HI Outcome
Assets

HEALTH SECTOR EMPLOYMENTAND PAYROLLS
A 1.2-percent increase in private healthservices employment in the first quarter of1999 masks a second consecutive drop innursing home employment (-0.6 percent)and a continuing decline in home healthcare services employment (Figure 4).Following nine quarters of deceleration, inthe fourth quarter of 1998, nursing homeemployment growth experienced its firstdecline of the 1990s (-0.4 percent), com-pared with the same period of the previousyear. The home health care employmentdecrease of 6.6 percent in the first quarterof 1999, however, represents a decelerationfrom the declines of the previous two quar-
ters. For home health care services, therapid employment growth of previousyears began to slow after the first quarterof 1994; actual decreases began in the firstquarter of 1998. These declines followedpublic sector actions to control Medicarespending and detect fraud and abuse. Thislatest quarter’s home health care employ-ment decline, along with shrinking averageweekly hours worked (down 1.4 percent)caused a 4.7-percent decrease in impliedpayroll, well below the 3.5-percent increasein payrolls for the health sector overall.Payrolls for health industries other thanhome health care rose between 2.5 and 5.5percent, while total private economy pay-rolls increased 5.2 percent.
HEALTH CARE FINANCING REVIEW/Fall 1999/Volume 21, Number 1 83
SOURCE: Bureau of Labor Statisitics, U.S. Department of Labor: Employment and Earnings. Washington, D.C.January 1989-March 1999.
Figure 4
Employment in Health Services, Nursing, Personal Care Facilities, and Home Health CareServices, Percent Change from Same Period of Previous Year: 1990-1999
-10.0
5.0
10.0
15.0
20.0
-5.0
0.0
Quarter
1990 1992 1994 1996 1998
Per
cen
t C
han
ge
25.0 Nursing Homes
Home Health Agencies
Health Services
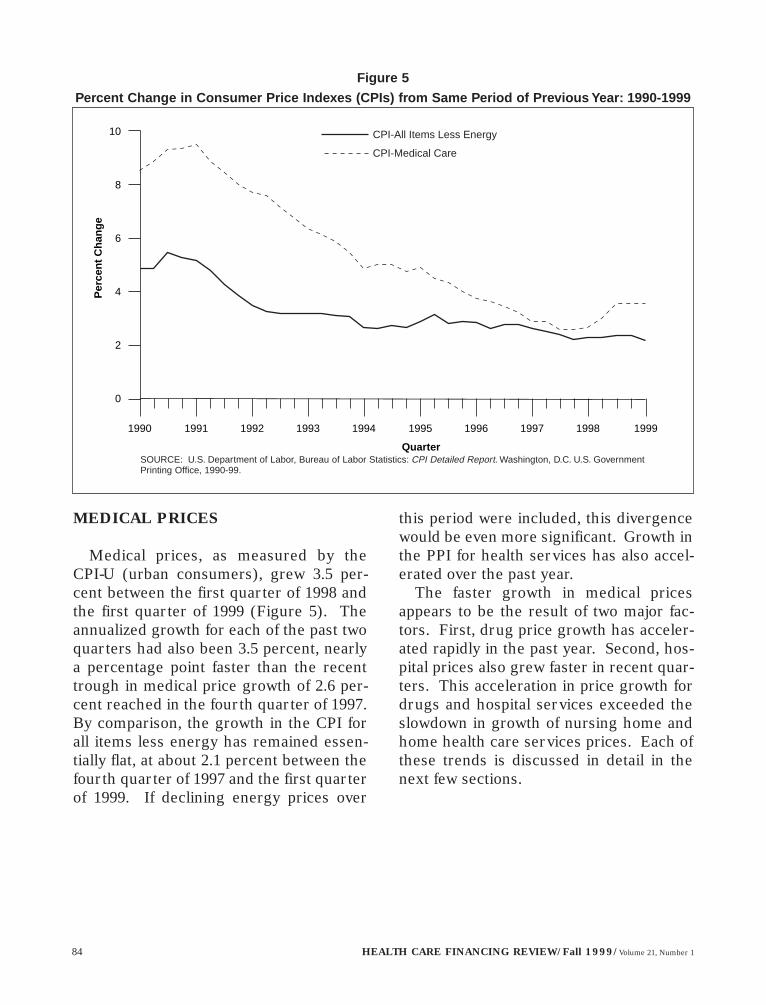
MEDICAL PRICES
Medical prices, as measured by the CPI-U (urban consumers), grew 3.5 per-cent between the first quarter of 1998 andthe first quarter of 1999 (Figure 5). Theannualized growth for each of the past twoquarters had also been 3.5 percent, nearlya percentage point faster than the recenttrough in medical price growth of 2.6 per-cent reached in the fourth quarter of 1997.By comparison, the growth in the CPI forall items less energy has remained essen-tially flat, at about 2.1 percent between thefourth quarter of 1997 and the first quarterof 1999. If declining energy prices over
this period were included, this divergencewould be even more significant. Growth inthe PPI for health services has also accel-erated over the past year.
The faster growth in medical pricesappears to be the result of two major fac-tors. First, drug price growth has acceler-ated rapidly in the past year. Second, hos-pital prices also grew faster in recent quar-ters. This acceleration in price growth fordrugs and hospital services exceeded theslowdown in growth of nursing home andhome health care services prices. Each ofthese trends is discussed in detail in thenext few sections.
84 HEALTH CARE FINANCING REVIEW/Fall 1999/Volume 21, Number 1
SOURCE: U.S. Department of Labor, Bureau of Labor Statistics: CPI Detailed Report. Washington, D.C. U.S. GovernmentPrinting Office, 1990-99.
Figure 5
Percent Change in Consumer Price Indexes (CPIs) from Same Period of Previous Year: 1990-1999
0
6
8
2
4
Quarter
1990 1991 1992 1993 1994 1995 1996 1997 1998 1999
Per
cen
t C
han
ge
10 CPI-All Items Less Energy
CPI-Medical Care

PRESCRIPTION DRUG PRICES
As shown in Figure 6, growth in the CPIfor prescription drugs continued its recentacceleration in the first quarter of 1999.Between the fourth quarter of 1997 andfirst quarter of 1999, consumer prescriptiondrug price growth has increased from a 1.9-percent to a 5.5-percent growth rate, whencompared with the same period 1 year ear-lier. Much of this acceleration is attribut-able to rapid increases in prices of severaltop-selling brands of prescription drugs forallergies, diabetes, acne, and arthritis.
The PPI for ethical (prescription) prepa-rations shows a much faster acceleration ingrowth than the CPI over the past year.The large magnitude of the accelerationcan be traced specifically to large increasesin psychotherapeutic drug prices in thefirst half of 1998 because of sampling vari-ability. However, even excluding psy-chotherapeutics, the PPI for prescriptiondrugs still increased in the 5- to 6-percentrange for 1998, compared with approxi-mately 3 percent for 1997. Given theunusually large increase in this index for1998, overall PPI prescription drug pricegrowth should continue to decelerate in1999 until it reaches a more stable level.
HEALTH CARE FINANCING REVIEW/Fall 1999/Volume 21, Number 1 85
NOTES: CPI is Consumer Price Index. PPI is Producer Price Index.
SOURCE: U.S. Department of Labor, Bureau of Labor Statistics: CPI Detailed Report. Washington, D.C. U.S. GovernmentPrinting Office; U.S. Department of Labor, Bureau of Labor Statistics: Producer Price Indexes, Washington, D.C. U.S.Government Printing Office, 1996-99.
Figure 6
Percent Change in Prescription Drug Price Indexes from Same Period of Previous Year: 1996-1999
0
12
16
4
8
Quarter
1996 1997 1998 1999
Per
cen
t C
han
ge
22
20
10
14
2
6
18
CPI-Prescription Drugs
PPI-Ethical (Prescription) Preparations

HOSPITAL SERVICES, WAGES, ANDPRICES
Both the producer and consumer pricesfor hospital services accelerated in the firstquarter of 1999, continuing the recenttrend. For each of these indexes, the accel-eration has been in both inpatient and out-patient price growth.
An analysis of average hourly earnings(AHE) for private hospital workers pro-vides some insight into why output prices(those measured by the CPI and PPI) areincreasing faster in current quarters. Asshown in Figure 7, growth in the AHE for
private hospital workers has increasedfrom 2.8 percent in the second quarter of1998 to 3.5 percent in the first quarter of1999. The Employment Cost Index (ECI)for hospital workers (part of the occupa-tional wage blend used in the HCFA PPS[prospective payment system] HospitalInput Price Index) has also exhibited a sim-ilar pattern over this period. The decelera-tion in the HCFA PPS Hospital Input PriceIndex over this period is attributable inpart to the slowdown in growth of the PPIfor prescription drugs following thetremendous increases of 1998, asdescribed in the previous section.
86 HEALTH CARE FINANCING REVIEW/Fall 1999/Volume 21, Number 1
NOTES: Q designates quarter of year. PPI is Producer Price Index. CPI is Consumer Price Index. AHE is average hourly earnings. HCFA is Health Care Financing Administration. PPS is prospective payment system.IPI is Input Price Index.
SOURCES: U.S. Department of Labor, Bureau of Labor Statistics: CPI Detailed Report. Washington, D.C.U.S. Government Printing Office; U.S. Department of Labor, Bureau of Labor Statistics: Producer Price Indexes,Washington, D.C. U.S. Government Printing Office; U.S. Department of Labor, Bureau of Labor Statistics:Employment and Earnings, Washington, D.C. U.S. Government Printing Office; HCFA Office of Actuary, 1998-1999.
Figure 7
Percent Change in Hospital Prices and Wages from Same Period of Previous Year: 1998-1999
������yz{{|| �
�
��zz
||��
���yy
{{{
����
����yyzz
{{||
0
1
2
3
4
PPI-Hospitals CPI-Hospital Services AHE-Private Hospitals HCFA PPS Hospital IPI
Per
cen
t C
han
ge
5 1998: Q2
1998: Q3
1998: Q4
1999: Q1
��{|

NURSING HOME SERVICES WAGESAND PRICES
Unlike that for hospitals, nursing homeprice growth has been constant or deceler-ating for the past four quarters. As Figure8 shows, this seems to reflect the deceler-ating growth of hourly earnings in nursinghomes and the relatively constant growthof input prices as measured by the HCFASNF input price index. Standard & Poor’sDRI projects the HCFA SNF input priceindex to continue to grow at similar ratesover the next few quarters, despite thedeceleration in AHE. This is because theHCFA SNF input price index reflects a con-stant skill mix of workers by using the ECI.The deceleration in the AHE for nursing
homes (which does not hold skill mix con-stant) implies a shift to less skilled, lowerpaid workers. Part of this may be theresult of the new PPS for Medicare SNFservices mandated by the BalancedBudget Act (BBA) of 1997. It has beenclaimed by the industry that the paymentsystem is forcing nursing homes to turnaway more complex cases because thepayment rates do not reflect the costs ofproviding these services (Hilzenroth,1999). Growth in the public sector PPI fornursing homes is now at its lowest pointsince its introduction, decelerating from4.7-percent annual growth in the fourthquarter of 1998 to 3.9 percent in the firstquarter of 1999.
HEALTH CARE FINANCING REVIEW/Fall 1999/Volume 21, Number 1 87
NOTES: Q designates quarter of year. PPI is Producer Price Index. CPI is Consumer Price Index. AHE is average hourly earnings. HCFA is Health Care Financing Administration. SNF is skilled nursing facility. IPI isInput Price Index.
SOURCES: U.S. Department of Labor, Bureau of Labor Statistics: CPI Detailed Report. Washington, D.C.U.S. Government Printing Office; U.S. Department of Labor, Bureau of Labor Statistics: Producer Price Indexes,Washington, D.C. U.S. Government Printing Office; U.S. Department of Labor, Bureau of Labor Statistics:Employment and Earnings, Washington, D.C. U.S. Government Printing Office; HCFA Office of Actuary, 1998-1999.
Figure 8
Percent Change in Nursing Home Prices and Wages from Same Period of Previous Year: 1998-1999
����
���
���yyzz
{{{
|||
��
���zz
|||��
���yy
{{{
����
����yyzz
{{||
0
1
2
3
4
5
PPI-Skilled/ICF Facilities CPI-Nursing Homes AHE-Nursing Homes HCFA SNF IPI
Per
cen
t C
han
ge
61998: Q2
1998: Q3
1998: Q4
1999: Q1
�{

88 HEALTH CARE FINANCING REVIEW/Fall 1999/Volume 21, Number 1
HOME HEALTH CARE SERVICES,WAGES, AND PRICES
The BBA, as well as Medicare fraud andabuse initiatives, appear to have had a sig-nificant impact on home health wages andprices. The significance is caused byMedicare’s large portion of total homehealth expenditures. Although input costgrowth has remained stable over the pastfour quarters, home health care prices, asmeasured by the PPI, have deceleratedfrom 2.9 percent in the second quarter of1998 to 0.3 in the first quarter of 1999(Figure 9). The Medicare portion of thisindex has decelerated from 2.3 to -0.6 per-cent over this same period. Yet an analysisof hourly earnings for home health careworkers shows a dramatic acceleration in
growth. Because payrolls and employmenthave declined dramatically in home healthcare agencies (Figure 4), the implication isthat lower skill positions are being elimi-nated, causing a higher average hourlywage that is accelerating.
Overall, the deceleration in price growthand the declines in employment seem tosupport reports that many home healthagencies have cut back on services notcovered by Medicare or have closed ormerged with other agencies in response tochanges in Medicare policies and pay-ments (U.S. General Accounting Office,1998, 1999). With a PPS scheduled to beimplemented on October 1, 2000, theindustry may continue to be transformedover the next year.
NOTES: Q designates quarter of year. PPI is Producer Price Index. AHE is average hourly earnings. HCFA isHealth Care Financing Administration. HHA is home health agency. IPI is Input Price Index.
SOURCES: U.S. Department of Labor, Bureau of Labor Statistics: CPI Detailed Report. Washington, D.C. U.S.Government Printing Office; U.S. Department of Labor, Bureau of Labor Statistics: Producer Price Indexes,Washington, D.C. U.S. Government Printing Office; U.S. Department of Labor, Bureau of Labor Statistics:Employment and Earnings, Washington, D.C. U.S. Government Printing Office; HCFA Office of Actuary, 1998-1999.
Figure 9
Percent Change in Home Health Care Prices and Wages from Same Period of Previous Year: 1998-1999
�{��
��zz
|| �
���
����yyzz
{{||
0
1
2
3
4
5
PPI-Home Health Care Services HCFA HHA IPIAHE-Home Health Care Services
Per
cen
t C
han
ge
61998: Q2
1998: Q3
1998: Q4
1999: Q1
�{

BACKGROUND INFORMATION ONDATA SOURCES AND METHODS
Community Hospital Statistics
Since 1963, the American HospitalAssociation (AHA), in cooperation withmember hospitals, has been collecting dataon the operation of community hospitalsthrough its National Hospital Panel Survey.Community hospitals, which comprisedmore than 80 percent of all hospital facili-ties in the United States in 1997, include allnon-Federal, short-term general, and otherspecial hospitals open to the public. Theyexclude hospital units of institutions; psy-chiatric facilities; tuberculosis, other respi-ratory, and chronic disease hospitals; insti-tutions for the mentally retarded; and alco-hol and chemical-dependency hospitals.
The survey samples approximately one-third of all U.S. community hospitals. Thesample is designed to produce estimates ofcommunity hospital indicators by bed sizeand region (American HospitalAssociation, 1963-98). In Tables 1 and 2,statistics covering expenses, utilization,beds, and personnel depict trends in theoperation of community hospitals annuallyfor 1994 to 1997 and quarterly from 1995through the third quarter 1998, after whichdata collection was discontinued.
For purposes of national health expendi-tures (NHE), survey statistics on revenuesare analyzed in estimating the growth inthe largest component of health carecosts—community hospital expenditures.This one segment of NHE accounted for 30percent of all health spending in 1997(Braden et al., 1998). The survey alsoidentifies important factors influencingexpenditure growth patterns, such aschanges in the number of beds in opera-tion, number of admissions, length of stay,use of outpatient facilities, and number ofsurgeries.
Medicare Trust Fund Operations
Separate trust funds finance the opera-tions of the two parts of the Medicare pro-gram (Table 3). The HI program, orMedicare Part A, helps pay for inpatienthospital, home health, SNF, and hospicecare for the aged and disabled. The HI pro-gram is financed primarily by payroll taxespaid by workers and employers. The taxespaid each year are used mainly to pay ben-efits for current beneficiaries. TheSupplementary Medical Insurance (SMI)program, or Medicare Part B, pays forphysician, outpatient hospital, homehealth, and other services for the aged anddisabled. The SMI program is financed pri-marily by transfers from the general fundof the U.S. Treasury and by monthly pre-miums paid by beneficiaries. For bothMedicare programs, income not currentlyneeded to pay benefits and related expens-es is held in the HI and SMI trust fundsand invested in U.S. Treasury securities(Board of Trustees of the Federal HospitalInsurance Trust Fund, 1999; Board ofTrustees of the Federal SupplementaryMedical Insurance Trust Fund, 1999).
Data on the financial operations of theMedicare trust funds, the HI Trust Fundand the SMI Trust Fund, are available fromtwo sources. The monthly statistics on trustfund operations are published in theMonthly Treasury Statement of Receipts andOutlays of the United States Government,Table 8: Trust Fund Impact on BudgetResults and Investment Holding (U.S.Department of the Treasury, 1998). The1999 annual reports of the HI and SMI trustfunds (Board of Trustees of the FederalHospital Insurance Trust Fund, 1999; Boardof Trustees of the Federal SupplementaryMedical Insurance Trust Fund, 1999) con-tain a detailed accounting of all financialoperations for the prior fiscal year. Thereports also contain actuarial analysis of the
HEALTH CARE FINANCING REVIEW/Fall 1999/Volume 21, Number 1 89

expected operations of the trust funds infuture years and analysis of the actuarial sta-tus of the funds.
Private Health Sector: Employment,Hours, and Earnings
The Bureau of Labor Statistics (BLS)collects monthly information on employ-ment for all workers, and employment,earnings, and work hours for non-supervi-sory workers in a sample of approximately305,000 establishments. Data are collectedthrough cooperative agreements with Stateagencies that also use this information tocreate State and local area statistics. Thesurvey is designed to collect industry-spe-cific information on wage and salary jobs innon-agricultural industries. It excludes sta-tistics on self-employed persons and onthose employed in the military (U.S.Department of Labor, 1998a).
Employment in this survey is defined asnumber of jobs. Persons holding multiplejobs would be counted multiple times.Approximately 5 percent of the populationholds more than one job at any one time.(Other surveys that are household-based,such as the Current Population Survey[CPS], also record employment. In theCPS, however, each person’s employmentstatus is counted only once, as eitheremployed, unemployed, or not in the laborforce, which includes discouraged work-ers.) Once each year, monthly establish-ment-based employment statistics areadjusted to benchmarks created fromannual establishment census information,resulting in revisions to previously pub-lished employment estimates. Tables 4, 5,and 6 present statistics on employment,non-supervisory employment, averageweekly hours, and average hourly earningsfor the private non-farm business sectorand industries in health services.
National Economic Indicators
National economic indicators provide acontext for understanding health-specificindicators and how change in the healthsector relates to change in the economy asa whole. Table 7 presents national indica-tors of output and inflation.
Gross domestic product (GDP) mea-sures the output of the U.S. economy as themarket value of goods and services pro-duced within the geographic boundaries ofthe United States by U.S. or foreign citizensor companies. Constant dollar or “real”GDP removes the effects of price changesfrom the valuation of goods and servicesproduced, so that the growth of real GDPreflects changes in the “physical quantity”of the output of the economy. In the mostrecent comprehensive revision of theNational Income and Product Accounts, themethod for removing the effects of pricechanges was altered. The GDP estimatesare now deflated using “chain-weighted”price indexes. This method replaces theprevious fixed-weight method of deflatingthe GDP estimates (U.S. Department ofCommerce, 1996, 1998).
PRICES
Consumer Price Indexes
BLS publishes monthly information onchanges in prices paid by consumers for afixed market basket of goods and services.Tables 7, 8, and 9 present information onthe all-urban CPI that measures changes inprices faced by 87 percent of the non-insti-tutionalized U.S. population. The morerestrictive wage-earner CPI gauges pricesfaced by wage earners and clerical workers.These workers account for approximately32 percent of the non-institutionalized popu-lation (U.S. Department of Labor, 1998b).
90 HEALTH CARE FINANCING REVIEW/Fall 1999/Volume 21, Number 1

The index reflects changes in pricescharged for the same quality and quantityof goods or services purchased in the baseperiod. For most items, the base period of1982-1984 is used to define the share ofconsumer expenditures purchasing specif-ic services and products. Those shares orweights remain constant in all years, eventhough consumption patterns of the house-hold may change over time. This type ofindex is called a fixed-weight or Laspeyresindex.
CPIs for health care goods and servicesdepict list price changes for out-of-pocketexpenditures. The CPI for medical care ser-vices also includes an indirect measure ofprice change for health insurance coveragepurchased directly by consumers. The com-posite CPI for medical care weights togetherproduct-specific or service-specific CPIs inproportion to household out-of-pocketexpenditures for these items. In addition,some medical care sector indexes measurechanges in list or charged prices, rather thanin prices actually received by providers afterdiscounts are deducted. In several healthcare areas, received or transaction prices aredifficult to capture, although BLS is makingadvances in this area.
In the NHE, a combination of CPIs forselected medical care items, input priceindexes for nursing homes, and the PPI forhospitals are used as measures of inflationfor the health industry. The indexes areused to develop a chain-weighted priceindex for personal health care to depictprice changes affecting the entire healthcare industry more accurately than doesthe overall CPI medical care index (Levit etal., 1998).
Producer Price Indexes
BLS produces monthly information onaverage changes in selling prices received bydomestic producers for their output. These
prices are presented in Tables 7, 8, and 9 asthe PPI. The index is designed to measuretransaction prices and is different from theCPI, which in some cases measures list orfull-charge prices. The PPI is a fixed-weightor Laspeyres index, with base-period weightsdetermined by values of receipts. The baseperiod varies among series.
The PPI consists of indexes in severalmajor classification structures, includingthe industry and commodity classificationsthat are included in the Health CareIndicators. The PPI by industry classifica-tion measures price changes received forthe industry’s output sold outside theindustry. PPI changes for an industry aredetermined by price changes for productsprimarily made by establishments in thatindustry. The industry into which anestablishment is classified is determinedby those products accounting for thelargest share of its total value of shipments.The PPI by commodity classification mea-sures price changes of the end product(end use or material composition). Theclassification system for PPI commoditygroups is unique to the PPI and is dividedinto 15 major commodity groupings.
Although PPIs for medical commoditieshave existed for many years, PPIs forhealth service industries are relativelynew. Most index series began in 1994, andthe index series for the composite healthservices industry does not begin untilDecember 1994. However, the PPI for hos-pitals began in December 1992, providingenough data for a useful time series. ThePPI for hospitals is a measure of transac-tion prices or net prices received by theproducer from out-of-pocket, Medicare,Medicaid, and private third-party payersources. The PPI for hospitals should notbe compared with the CPI for hospital andrelated services. Although other PPI andCPI series are somewhat comparable (forexample, the PPI-Offices and Clinics of
HEALTH CARE FINANCING REVIEW/Fall 1999/Volume 21, Number 1 91

Doctors of Medicine and the CPI-Physicians’ Services), the PPI and CPI forhospitals have important differences insurvey scope and methodology. The PPIfor hospitals measures price changes forthe entire treatment path, measures nettransaction price, includes Medicare andMedicaid, samples both urban and ruralhospitals, and reflects total hospital rev-enue from all sources in its index weights.On the other hand, the CPI for hospitalsmeasures price changes for a discrete sam-ple of hospital services singly, measurespublished charges, excludes Medicare andMedicaid, samples only urban hospitals,and reflects only consumer out-of-pocketexpenses and household health insurancepremium payments in its index weights.These differences make a direct compari-son between the PPI and CPI hospital ser-vices indexes inappropriate.
The PPI for the health services industryis available by detailed industry groupings.For example, general medical and surgicalhospitals consist of inpatient and outpatienttreatments, which in turn consist ofMedicare, Medicaid, and all other patients.These patient categories consist of moredetail, such as diagnosis-related groups(DRGs) for Medicare. Although most ofthe data used to measure PPI pricechanges for health services are collectedthrough a sample, there are specificinstances where data are collected fromboth a sample and from price changes inFederal regulation. This is the case forMedicare hospital inpatient services andMedicare offices and clinics of doctors ofmedicine. The producer price changes inMedicare hospital inpatient services arecomputed from a combination of a nationalsample of DRGs in hospitals, DRG relativeweights from the PPS final rules publishedin the current and historical year, andother adjustments. The producer price
changes in Medicare offices of doctors ofmedicine are computed from a combina-tion of a geographic area sample of pay-ments under the HCFA CommonProcedure Coding System (HCPCS),HCPCS updates from the November 2,1998, Federal Register, and other adjust-ments. Because of different methodolo-gies, these two Medicare PPIs are not com-parable to the national updates computedby HCFA and published in the FederalRegister.
Input Price Indexes
In 1979, HCFA developed the MedicareHospital Input Price Index (hospital mar-ket basket), which was designed to mea-sure the pure price changes associatedwith expenditure changes for hospital ser-vices. In the early 1980s, the SNF andHome Health Agency (HHA) Input PriceIndexes, often referred to as “market bas-kets,” were developed to price a consistentset of goods and services over time. Alsoin the early 1980s, the original MedicareHospital Input Price Index was revised foruse in updating payment rates for routinecosts of Medicare inpatient services. All ofthese indexes have played an importantrole in helping to set Medicare paymentpercent increases and in understandingthe contribution of input price increases togrowing health expenditures.
The Input Price Indexes, or market bas-kets, are Laspeyres or fixed-weight index-es that are constructed in two steps. First,a base period is selected. For example, forthe PPS Hospital Input Price Index, thebase period is 1992. Cost categories, suchas food, fuel, and labor, are identified andtheir 1992 expenditure amounts deter-mined. The proportion or share of totalexpenditures included in specific spendingcategories is calculated. These proportions
92 HEALTH CARE FINANCING REVIEW/Fall 1999/Volume 21, Number 1

are called cost or expenditure weights.There are 26 expenditure categories in the1992-based PPS Hospital Input Price Index.
Second, a price proxy is selected tomatch each expenditure category. Its pur-pose is to measure the rate of price increas-es of the goods or services in that category.The price proxy index for each spendingcategory is multiplied by the expenditureweight for the category. The sum of theseproducts (weights multiplied by the priceindex) over all cost categories yields thecomposite Input Price Index for any giventime period, usually a fiscal year or a calen-dar year. The percent change in the InputPrice Index is an estimate of price changeover time for a fixed quantity of goods andservices purchased by a provider.
The Input Price Indexes are estimated ona historical basis and forecast for severalyears. The HCFA-chosen price proxies areforecast under contract with Standard andPoor’s DRI. Following every calendar yearquarter, in March, June, September, andDecember, DRI updates its macroeconomicforecasts of wages and prices based onupdated historical information and revisedforecast assumptions. Some of the data inTables 10-12 are forecast and are expected tochange as more recent historical databecome available and subsequent quarterlyforecasts are revised. The methodology andprice proxy definitions used in the InputPrice Indexes are described in the FederalRegister notices that accompany the revisionsof the PPS Hospital, HHA, and PPS SNF pay-ment updates. A description of the currentstructure of the PPS Input Price Index is inthe August 29, 1997, Federal Register, and themost recent PPS hospital update for paymentrates was published in the July 31, 1998,Federal Register. The latest HHA regulatoryInput Price Index was published in theAugust 11, 1998, Federal Register. The latestSNF input price index was published in theMay 12, 1998, Federal Register.
Periodically, the Input Price Indexes arerevised to a new base year so that costweights will reflect changes in the mix ofgoods and services that are purchased.Each revision allows for new base weights,a new base year, and changes to certainprice variables used for price proxies.
Each Input Price Index is presented in atable with both an index level and a four-quarter moving-average percent change.The Hospital Input Price Index for PPS isin Table 10, the SNF Input Price Index is inTable 11, and the HHA Input Price Index isin Table 12.
Medicare Economic Index
In 1972, Congress mandated the devel-opment of the Medicare Economic Index(MEI) to measure the changes in costs ofphysicians’ time and operating expenses.The input price change measured by theMEI is considered in connection with theupdate factor for the Medicare Part Bphysician fee schedule under theResource-Based Relative Value Scale(RBRVS, November 22, 1996, FederalRegister) or is used as an advisory indicatorby Congress in updating the fee schedule.The MEI is a fixed-weighted sum of annualprice changes for various inputs needed toproduce physicians’ services with an offsetfor productivity increases. Like a tradition-al Laspeyres index, the MEI is constructedin two steps. First, a base period is select-ed (1996 for the MEI), cost categories areidentified, and the 1996 expenditure sharesby cost category are determined. Second,price proxies are selected to match eachrelative expenditure category. These prox-ies are weighted by the category weightdetermined from expenditure amounts andsummed to produce the composite MEI.Unlike a traditional Laspeyres index, thecompensation portion of the MEI is adjustedfor productivity, so economywide produc-
HEALTH CARE FINANCING REVIEW/Fall 1999/Volume 21, Number 1 93

tivity and physician-practice productivityare not both included in the update, result-ing in a double counting of productivity.
Forecasts of the MEI are made periodi-cally throughout the fiscal year by Standard& Poor’s DRI for HCFA using several dif-ferent sets of economic assumptions.Standard & Poor’s DRI produces four mainforecasts of the MEI: (1) a Presidentialbudget forecast in December; (2) the Mid-session Review in June, based on assump-tions for the Federal budget exercises; (3)the Medicare Trustees’ Report forecast inFebruary, based on assumptions by theMedicare Trustees; and (4) the MedicarePremium Promul-gation forecast in August,based on baseline assumptions by Standard& Poor’s DRI. Standard & Poor’s DRI alsoproduces forecasts of the MEI using theirown economic assumptions forecast. Theforecasts based on Standard & Poor’s DRIassumptions are presented in Health CareIndicators. Much of the forecast datachanges as more recent historical databecome available and the assumptionschange.
The methodology, weights, and price-proxy definitions used in the MEI aredescribed in the November 2, 1998,Federal Register. The MEI data are pre-sented in Table 13 as index levels and four-quarter moving-average percent changes.
REFERENCES
American Hospital Association: Hospital Statistics,1995-96 Edition. Chicago. 1996. American Hospital Association: National HospitalPanel Survey. Unpublished. Chicago. 1963-98.Board of Trustees of the Federal HospitalInsurance Trust Fund: 1999 Annual Report of theBoard of Trustees of the Federal Hospital InsuranceTrust Fund. Washington, DC. March 30, 1999.Board of Trustees of the Federal SupplementaryMedical Insurance Trust Fund: 1999 AnnualReport of the Board of Trustees of the FederalSupplementary Medical Insurance Trust Fund.Washington, DC. March 30, 1999.
Braden, B.R., Cowan, C.A., Lazenby, H.C., et al.:National Health Expenditures, 1997. Health CareFinancing Review 20(1):83-126, Fall 1998.Federal Register: Medicare Program; Revisions toPayment Policies and Adjustments to the RelativeValue Units Under the Physician Fee Schedule forthe Calendar Year 1999; Final Rule and Notice. Vol.63, No. 211, 58845-58849. Office of the FederalRegister, National Archives and RecordsAdministration. Washington, DC. U.S. GovernmentPrinting Office, November 2, 1998.Federal Register: Medicare Program; Schedules ofPer-Visit and Per-Beneficiary Limitations on HomeHealth Agency Costs for Cost Reporting PeriodsBeginning On or After October 1, 1998; Notice. Vol.63, No, 154. 42922. Office of the Federal Register,National Archives and Records Administration.Washington, DC. U.S. Government Printing Office,August 11, 1998. Federal Register: Medicare Program: Changes tothe Hospital Inpatient Prospective PaymentSystems and Fiscal Year 1999 Rates; Final Rule.Vol. 63, No. 147, 41006. Office of the FederalRegister, National Archives and RecordsAdministration. Washington, DC. U.S. GovernmentPrinting Office, July 31, 1998.Federal Register: Medicare Program: ProspectivePayment System and Consolidated Billing for SkilledNursing Facilities; Final Rule. Vol. 63, No. 91, 26291.Office of the Federal Register, National Archives andRecords Administration. Washington, DC. U.S.Government Printing Office, May 12, 1998.Federal Register: Medicare Program; Changes tothe Inpatient Hospital Prospective PaymentSystems and Fiscal Year 1998 Rates; Final Rule.Vol. 62, No. 168, 45993. Office of the FederalRegister, National Archives and RecordsAdministration. Washington, DC. U.S. GovernmentPrinting Office, August 29, 1997.Federal Register: Medicare Program; Revisions toPayment Policies and Five-Year Review of andAdjustments to the Relative Value Unites, Final, andPhysician Fee Schedule Update for Calendar Year1997 and Physician Volume Performance StandardRates of Increase for Federal Fiscal Year 1997;Notice. Vol. 61, No. 227, 59717-59724. Office of theFederal Register, National Archives and RecordsAdministration. Washington, DC. U.S. GovernmentPrinting Office, November 22, 1996.Federal Register: Medicare Program; Schedules ofLimits of Home Health Agency Cost per Visit forCost Reporting Periods Beginning on or After July1, 1996. Vol. 61, No. 127, 34347-34350. Office of the Federal Register, National Archives andRecords Administration. Washington, DC. U.S.Government Printing Office, July 1, 1996.
94 HEALTH CARE FINANCING REVIEW/Fall 1999/Volume 21, Number 1

Federal Register: Medicare Program; Schedule ofLimits for Skilled Nursing Facility Inpatient RoutineService Costs. Vol. 59, No.4, 762-767. Office of theFederal Register, National Archives and RecordsAdministration. Washington, DC. U.S.Government Printing Office, June 6, 1994.Federal Register: Medicare Program; Revision ofthe Medicare Economic Index; Final rule. Vol. 57,No. 228, 55896-56230. Office of the FederalRegister, National Archives and RecordsAdministration. Washington, DC. U.S. GovernmentPrinting Office, November 25, 1992.Federal Register: Medicare Program; Schedules ofLimits of Skilled Nursing Facility Inpatient RoutineService Costs; Final rule. Vol. 57, No. 129, 46177-48187. Office of the Federal Register, NationalArchives and Records Administration. Washington,DC. U.S. Government Printing Office, October 7,1992.Hilzenroth, D.S.: Nursing Homes Shun SomeMedicare Patients. Washington Post. P. A1. June 6,1999.Levit, K., Cowan, C., Braden, B., et al.: NationalHealth Expenditures in 1997: More Slow Growth.Health Affairs 17(6), November/December 1998.U.S. Department of Commerce: National Incomeand Product Accounts. Survey of Current Business.Vol. 78, No. 9. Bureau of Economic Analysis.Washington, DC. U.S. Government Printing Office,September 1998.U.S. Department of Commerce: ImprovedEstimates of the National Income and ProductAccounts for 1959-1995: Results of theComprehensive Revision. Survey of CurrentBusiness. Vol. 76, No.1/2 Bureau of EconomicAnalysis. Washington, DC. U.S. GovernmentPrinting Office, January/February 1996.
U.S. Department of Labor: Employment andEarnings. Vol. 45, No. 9. Bureau of Labor Statistics.Washington, DC. U.S. Government Printing Office,September 1998a.U.S. Department of Labor: Monthly Labor Review.Vol. 121, No. 9. Bureau of Labor Statistics.Washington, DC. U.S. Government Printing Office,September 1998b. U.S. Department of the Treasury: MonthlyTreasury Statement of Receipts and Outlays of theUnited States Government. Monthly Reports,January 1991 - September 1998. FinancialManagement Service. Washington, DC. U.S.Government Printing Office, October 1998.U.S. General Accounting Office: Medicare HomeHealth Benefit: Impact of Interim Payment Systemand Agency Closures on Access to Services. HEHS-98-238. Washington, DC. September 9, 1998.U.S. General Accounting Office: Medicare HomeHealth Agencies: Closures Continue, with LittleEvidence Beneficiary Access Is Impaired. HEHS-99-120. Washington, DC. May 26, 1999.
For inquiries concerning market basketdata, contact Stephen K. Heffler at (410)786-1211 or Mary Lee Seifert at (410) 786-0030. For all other inquiries, contactCarolyn S. Donham at (410) 786-7947.
Reprint Requests: Mary Lee Seifert, Office of Strategic Planning,Health Care Financing Administration, 7500 Security Boulevard,N3-02-02, Baltimore, MD 21244-1850. E-mail: [email protected]
HEALTH CARE FINANCING REVIEW/Fall 1999/Volume 21, Number 1 95

96 HEALTH CARE FINANCING REVIEW/Fall 1999/Volume 21, Number 1
Table 1
Selected Community Hospital Statistics: 1994-1998 1
Calendar Year 1995 1995 1996 1996Item 1994 1995 1996 1997 Q3 Q4 Q1 Q2
UtilizationAll Ages
Admissions in Thousands 32,938 33,389 33,268 33,388 8,213 8,260 8,511 8,267 Admissions per 1,000 Population2 122 122 121 120 120 121 124 120 Inpatient Days in Thousands 196,117 190,377 183,495 181,313 46,239 46,467 48,051 45,532 Adult Length of Stay in Days 6.0 5.7 5.5 5.4 5.6 5.6 5.6 5.5
65 Years of Age or OverAdmissions in Thousands 12,456 12,820 12,870 13,050 3,071 3,184 3,324 3,204 Admissions per 1,000 Population2 368 375 373 375 359 371 386 372 Inpatient Days in Thousands 94,877 91,164 86,431 85,315 21,507 22,056 22,972 21,445 Adult Length of Stay in Days 7.6 7.1 6.7 6.5 7.0 6.9 6.9 6.7
Under 65 Years of AgeAdmissions in Thousands 20,483 20,569 20,398 20,339 5,143 5,077 5,187 5,063 Admissions per 1,000 Population2 87 86 85 84 86 85 86 84 Inpatient Days in Thousands 101,240 99,213 97,064 95,999 24,732 24,411 25,078 24,087 Adult Length of Stay in Days 4.9 4.8 4.8 4.7 4.8 4.8 4.8 4.8
Surgical Operations in Thousands 23,286 23,739 24,165 24,601 5,832 5,915 5,948 6,087 Outpatient Visits in Thousands 417,684 452,558 481,298 507,523 113,332 114,438 116,335 119,874 Adjusted Patient Days in Thousands3 276,209 273,638 270,023 275,864 67,079 67,106 69,232 67,394 Number of Beds in Thousands 891 874 854 833 871 867 862 859 Adult Occupancy Rate4 60.3 59.7 58.7 59.6 57.7 58.2 61.2 58.3
Total Hospital Revenues in Millions5 $309,354 $324,961 $338,118 $349,329 $80,307 $81,842 $84,280 $84,396 Total Patient Revenues in Millions 293,285 307,228 318,183 327,938 75,956 77,238 79,710 79,349
Inpatient Revenues in Millions 208,262 213,771 216,242 215,558 52,358 53,483 55,322 53,609Outpatient Revenues in Millions 85,023 93,457 101,941 112,380 23,599 23,755 24,387 25,740
Total ExpensesTotal Hospital Expenses in Millions 292,801 308,411 320,789 331,482 76,808 78,594 79,361 79,958
Labor in Millions 156,826 163,842 168,796 173,047 40,857 41,688 41,873 41,935Non-Labor in Millions 135,975 144,569 151,993 158,435 35,951 36,906 37,488 38,023
Inpatient Expense in Millions6 207,897 214,570 217,994 217,869 52,945 54,421 55,081 54,020Amount per Patient Day 1,060 1,127 1,188 1,202 1,145 1,171 1,146 1,186Amount per Admission 6,312 6,426 6,553 6,525 6,446 6,588 6,472 6,534
Outpatient Expense in Millions6 84,903 93,841 102,796 113,614 23,863 24,172 24,281 25,937Amount per Outpatient Visit 203 207 214 224 211 211 209 216
1 Collection of American Hospital Association (AHA) data used in this table was discontinued after third quarter 1998.2 Admissions per 1,000 population is calculated using population estimates prepared by the Social Security Administration.3 Adjusted patient days is an aggregate figure reflecting the number of days of inpatient care, plus an estimate of the volume of outpatient services, expressed in units equivalent to an inpatient day in terms of level of effort. It is derived by multiplying the number of outpatient visits by the ratio of outpatient revenue per outpatient visit to inpatient revenue per inpatient day, and adding the product to the number of inpatient days4 The adult occupancy rate is calculated by the National Health Statistics Group, Office of the Actuary, Health Care Financing Administration. The AHAdoes not publish this statistic. Adult occupancy rate is the ratio of average daily census to average number of beds maintained during the reporting period.5 Total hospital revenue is the sum of total patient revenue and all other operating revenue. Total patient revenue is the sum of inpatient revenue and outpatient revenue.6 Inpatient expense and outpatient expense are calculated by the National Health Statistics Group, Office of the Actuary, Health Care Financing Administration. These statistics are calculated by applying the ratio of inpatient or outpatient revenue to total patient revenue multiplied by total hospital expenses.
NOTES: Q designates quarter of year. Quarterly data are not seasonally adjusted.
SOURCE: American Hospital Association; Trend Analysis Group: National Hospital Panel Survey Reports. Chicago. Monthly reports for January 1995-September 1998.

HEALTH CARE FINANCING REVIEW/Fall 1999/Volume 21, Number 1 97
Table 1—Continued
Selected Community Hospital Statistics: 1994-1998 1
1996 1996 1997 1997 1997 1997 1998 1998 1998 Q3 Q4 Q1 Q2 Q3 Q4 Q1 Q2 Q3
8,159 8,331 8,500 8,342 8,265 8,281 8,640 8,326 8,361 118 121 123 120 119 119 124 119 119
44,349 45,563 47,177 45,177 44,193 44,766 47,553 44,607 44,545 5.4 5.5 5.5 5.4 5.3 5.4 5.5 5.4 5.3
3,090 3,252 3,374 3,253 3,173 3,250 3,479 3,260 3,193 357 375 389 374 364 373 398 373 365
20,448 21,566 22,661 21,179 20,431 21,044 22,941 20,859 20,295 6.6 6.6 6.7 6.5 6.4 6.5 6.6 6.4 6.4
5,070 5,078 5,126 5,089 5,092 5,032 5,162 5,066 5,168 84 84 85 84 84 82 84 83 84
23,902 23,997 24,516 23,999 23,762 23,722 24,712 23,748 24,251 4.7 4.7 4.8 4.7 4.7 4.7 4.8 4.7 4.7
6,028 6,102 6,047 6,245 6,197 6,111 6,200 6,405 6,461 122,232 122,857 123,270 127,607 128,285 128,361 131,411 135,812 138,222
66,247 67,087 70,050 68,813 68,258 68,682 72,261 69,196 70,246 849 844 842 832 829 830 829 827 825 56.8 58.7 62.3 59.7 57.9 58.7 63.8 59.3 58.7
$83,449 $85,993 $86,941 $87,073 $87,092 $88,223 $91,024 $89,187 $89,695 78,461 80,664 81,998 81,781 81,441 82,717 85,391 83,583 84,10252,526 54,784 55,223 53,692 52,728 53,914 56,194 53,882 53,33125,934 25,880 26,774 28,090 28,713 28,803 29,197 29,701 30,770
79,593 81,877 82,092 82,694 82,835 83,862 85,251 86,155 86,16941,925 43,063 42,888 42,958 43,326 43,875 44,502 44,576 44,81237,668 38,814 39,204 39,735 39,509 39,986 40,749 41,580 41,357
53,284 55,608 55,287 54,291 53,631 54,660 56,102 55,540 54,6431,201 1,220 1,172 1,202 1,214 1,221 1,180 1,245 1,2276,530 6,675 6,504 6,508 6,489 6,600 6,493 6,671 6,535
26,309 26,269 26,805 28,403 29,204 29,201 29,149 30,615 31,527215 214 217 223 228 227 222 225 228

98 HEALTH CARE FINANCING REVIEW/Fall 1999/Volume 21, Number 1
Table 2
Percent Change in Selected Community Hospital Statistics: 1994-1998
Calendar Year 1995 1995 1996 1996Item 1994 1995 1996 1997 Q3 Q4 Q1 Q2
Annual Percent ChangeUtilizationAll Ages
Admissions in Thousands 0.9 1.4 -0.4 0.4 0.7 0.3 -1.4 -0.2 Admissions per 1,000 Population -0.1 0.4 -1.3 -0.6 -0.2 -0.6 -2.3 -1.1 Inpatient Days in Thousands -2.9 -2.9 -3.6 -1.2 -3.0 -3.4 -4.6 -3.7 Adult Length of Stay in Days -3.8 -4.2 -3.3 -1.5 -3.7 -3.7 -3.2 -3.6
65 Years of Age or OverAdmissions in Thousands 2.0 2.9 0.4 1.4 1.6 1.9 -1.6 0.5 Admissions per 1,000 Population 0.8 1.8 -0.5 0.6 0.6 0.9 -2.6 -0.4 Inpatient Days in Thousands -2.2 -3.9 -5.2 -1.3 -5.0 -4.9 -7.3 -6.0 Adult Length of Stay in Days -4.2 -6.6 -5.6 -2.7 -6.5 -6.7 -5.8 -6.5
Under 65 Years of AgeAdmissions in Thousands 0.2 0.4 -0.8 -0.3 0.2 -0.7 -1.3 -0.6 Admissions per 1,000 Population -0.7 -0.5 -1.7 -1.2 -0.7 -1.5 -2.2 -1.5 Inpatient Days in Thousands -3.6 -2.0 -2.2 -1.1 -1.2 -2.0 -2.0 -1.6 Adult Length of Stay in Days -3.8 -2.4 -1.3 -0.8 -1.4 -1.3 -0.7 -1.0
Surgical Operations in Thousands 2.5 1.9 1.8 1.8 -0.1 -0.1 -1.3 2.1 Outpatient Visits in Thousands 7.0 8.3 6.4 5.4 5.9 5.7 4.7 5.4 Adjusted Patient Days in Thousands -1.0 -0.9 -1.3 2.2 -0.9 -1.8 -2.8 -1.1 Number of Beds in Thousands -1.2 -1.8 -2.4 -2.4 -1.9 -2.1 -2.1 -2.1 Adult Occupancy Rate1 -1.1 -0.7 -0.9 0.9 -0.6 -0.8 -2.3 -1.0
Total Hospital Revenues in Millions 4.9 5.0 4.0 3.3 4.2 3.6 3.0 4.2 Total Patient Revenues in Millions 4.6 4.8 3.6 3.1 4.0 3.4 2.9 3.6
Inpatient Revenues in Millions 2.5 2.6 1.2 -0.3 1.9 1.8 1.0 0.9 Outpatient Revenues in Millions 10.1 9.9 9.1 10.2 9.1 7.3 7.5 9.9
Operating ExpensesTotal in Millions 5.0 5.3 4.0 3.3 4.5 4.7 4.1 4.2
Labor in Millions 4.7 4.5 3.0 2.5 3.7 3.8 3.3 2.9 Non-Labor in Millions 5.3 6.3 5.1 4.2 5.6 5.8 4.9 5.7
Inpatient Expense in Millions 2.9 3.2 1.6 -0.1 2.4 3.1 2.1 1.4 Amount per Patient Day 6.0 6.3 5.4 1.1 5.5 6.7 7.1 5.3 Amount per Admission 2.0 1.8 2.0 -0.4 1.7 2.8 3.6 1.6
Outpatient Expense 10.5 10.5 9.5 10.5 9.7 8.7 8.8 10.5 Amount per Outpatient Visit 3.2 2.0 3.0 4.8 3.6 2.8 3.9 4.8
1 Change in rate, rather than percent change.
NOTES: Q designates quarter of year. Quarterly data are not seasonally adjusted.
SOURCE: American Hospital Association; Trend Analysis Group: National Hospital Panel Survey Reports. Chicago. Monthly reports for January 1995-September 1998.

HEALTH CARE FINANCING REVIEW/Fall 1999/Volume 21, Number 1 99
Table 2—Continued
Percent Change in Selected Community Hospital Statistics: 1994-1998
1996 1996 1997 1997 1997 1997 1998 1998 1998 Q3 Q4 Q1 Q2 Q3 Q4 Q1 Q2 Q3
Percent Change from the SamePeriod of Previous Year
-0.7 0.9 -0.1 0.9 1.3 -0.6 1.6 -0.2 1.2 -1.6 -0.1 -1.1 0.0 0.4 -1.5 0.7 -1.1 0.3 -4.1 -1.9 -1.8 -0.8 -0.4 -1.7 0.8 -1.3 0.8 -3.5 -2.8 -1.7 -1.7 -1.6 -1.2 -0.8 -1.1 -0.4
0.6 2.2 1.5 1.5 2.7 -0.1 3.1 0.2 0.7 -0.3 1.2 0.6 0.7 1.9 -0.7 2.5 -0.4 0.1 -4.9 -2.2 -1.4 -1.2 -0.1 -2.4 1.2 -1.5 -0.7 -5.5 -4.3 -2.8 -2.7 -2.7 -2.3 -1.8 -1.7 -1.3
-1.4 0.0 -1.2 0.5 0.4 -0.9 0.7 -0.5 1.5 -2.3 -0.9 -2.1 -0.4 -0.5 -1.8 -0.3 -1.4 0.6 -3.4 -1.7 -2.2 -0.4 -0.6 -1.1 0.8 -1.0 2.1 -2.0 -1.7 -1.1 -0.9 -1.0 -0.2 0.1 -0.6 0.6
3.4 3.2 1.7 2.6 2.8 0.2 2.5 2.6 4.3 7.9 7.4 6.0 6.5 5.0 4.5 6.6 6.4 7.7
-1.2 0.0 1.2 2.1 3.0 2.4 3.2 0.6 2.9 -2.6 -2.6 -2.4 -3.1 -2.3 -1.7 -1.6 -0.7 -0.6 -0.9 0.4 1.0 1.4 1.1 0.0 1.5 -0.4 0.8
3.9 5.1 3.2 3.2 4.4 2.6 4.7 2.4 3.0 3.3 4.4 2.9 3.1 3.8 2.5 4.1 2.2 3.3 0.3 2.4 -0.2 0.2 0.4 -1.6 1.8 0.4 1.1 9.9 8.9 9.8 9.1 10.7 11.3 9.0 5.7 7.2
3.6 4.2 3.4 3.4 4.1 2.4 3.8 4.2 4.0 2.6 3.3 2.4 2.4 3.3 1.9 3.8 3.8 3.4 4.8 5.2 4.6 4.5 4.9 3.0 3.9 4.6 4.7
0.6 2.2 0.4 0.5 0.6 -1.7 1.5 2.3 1.9 4.9 4.2 2.2 1.3 1.0 0.0 0.7 3.6 1.1 1.3 1.3 0.5 -0.4 -0.6 -1.1 -0.2 2.5 0.7
10.2 8.7 10.4 9.5 11.0 11.2 8.7 7.8 8.0 2.2 1.2 4.2 2.9 5.8 6.4 2.0 1.3 0.2

100 HEALTH CARE FINANCING REVIEW/Fall 1999/Volume 21, Number 1
Table 3
Hospital Insurance and Supplementary Medical Insurance (SMI) Trust Fund Operations: 1995-1999
Calendar Year 1996 1996 1996 1996Indicator 1995 1996 1997 1998 Q1 Q2 Q3 Q4
Total Medicare OutlaysIn Millions of Dollars $184,203 $200,337 $213,600 $213,228 $47,456 $49,642 $50,599 $52,639
Hospital Insurance Trust Fund 117,604 129,929 139,475 133,671 31,288 32,160 32,615 33,866 SMI Trust Fund 66,599 70,408 74,125 79,557 16,168 17,482 17,984 18,773
Hospital Insurance Trust FundOperations: In Millions of DollarsIncome 115,027 124,603 130,107 140,546 26,293 37,000 27,840 33,470 Outlays 117,604 129,929 139,475 133,671 31,288 32,160 32,615 33,866 Difference (2,577) (5,325) (9,368) 6,875 (4,995) 4,840 (4,774) (396)
Assets at End of Period1 130,267 124,942 115,573 122,448 125,272 130,112 125,338 124,942
SMI Trust Fund Operations:In Millions of DollarsIncome 60,306 85,609 81,924 87,712 26,596 19,653 19,208 20,152 Outlays 66,599 70,408 74,125 79,557 16,168 17,482 17,984 18,773 Difference (6,293) 15,202 7,799 8,155 10,428 2,171 1,224 1,378
Assets at End of Period1 13,130 28,332 36,131 44,286 23,558 25,729 26,953 28,332
Annual Percent Change
Total Medicare Outlays 11.7 8.8 6.6 -0.2 7.0 6.2 8.7 13.0 Hospital Insurance Trust Fund 12.5 10.5 7.3 -4.2 9.3 5.4 11.7 15.8 SMI Trust Fund 10.4 5.7 5.3 7.3 2.9 7.8 3.6 8.4
Hospital Insurance Trust FundOperationsIncome 5.0 8.3 4.4 8.0 4.3 4.0 14.8 11.6 Outlays 12.5 10.5 7.3 -4.2 9.3 5.4 11.7 15.8
Assets at End of Period -1.9 -4.1 -7.5 5.9 -3.2 -3.2 -3.2 -4.1
SMI Trust Fund OperationsIncome 8.5 42.0 -4.3 7.1 61.4 14.3 90.7 21.6 Outlays 10.4 5.7 5.3 7.3 2.9 7.8 3.6 8.4
Assets at End of Period -32.4 115.8 27.5 22.6 16.7 21.6 94.3 115.8
1 As shown in the Monthly Treasury Statement. Excludes undisbursed balance.
NOTES: Q designates quarter of year. Quarterly data are not seasonally adjusted.
SOURCES: U.S. Department of the Treasury, Financial Management Service: Monthly Treasury Statement of Receipts and Outlays of the United States Government. (Board of Trustees of the Hospital Insurance Trust Fund, 1999; Board of Trustees of the Supplementary Medical Insurance Trust Fund, 1999); Office of the Actuary, Health Care Financing Administration.

HEALTH CARE FINANCING REVIEW/Fall 1999/Volume 21, Number 1 101
Table 3—Continued
Hospital Insurance and Supplementary Medical Insurance (SMI) Trust Fund Operations: 1995-1999
1997 1997 1997 1997 1998 1998 1998 1998 1999Q1 Q2 Q3 Q4 Q1 Q2 Q3 Q4 Q1
$50,084 $53,696 $53,922 $55,897 $50,818 $53,692 $53,165 $55,553 $48,626 33,407 35,307 35,208 35,552 30,526 33,942 35,230 33,973 30,834 16,677 18,389 18,714 20,345 20,292 19,750 17,935 21,580 17,792
29,535 36,644 28,852 35,075 31,551 41,080 30,496 37,419 34,678 33,407 35,307 35,208 35,552 30,526 33,942 35,230 33,973 30,834 (3,873) 1,337 (6,356) (477) 1,025 7,138 (4,734) 3,446 3,844
121,069 122,406 116,050 115,573 116,598 123,736 119,002 122,448 126,292
19,906 20,855 19,893 21,270 19,803 20,998 19,884 27,027 15,389 16,677 18,389 18,714 20,345 20,292 19,750 17,935 21,580 17,792
3,229 2,466 1,179 925 (489) 1,248 1,949 5,447 (2,403)31,561 34,027 35,206 36,131 35,642 56,640 76,524 103,551 118,940
Percent Change from the Same Period of Previous Year
5.5 8.2 6.6 6.2 1.5 0.0 -1.4 -0.6 -4.3 6.8 9.8 8.0 5.0 -8.6 -3.9 0.1 -4.4 1.0 3.1 5.2 4.1 8.4 21.7 7.4 -4.2 6.1 -12.3
12.3 -1.0 3.6 4.8 6.8 12.1 5.7 6.7 9.9 6.8 9.8 8.0 5.0 -8.6 -3.9 0.1 -4.4 1.0
-3.4 -5.9 -7.4 -7.5 -3.7 1.1 2.5 5.9 8.3
-25.2 6.1 3.6 5.5 -0.5 0.7 0.0 27.1 -22.3 3.1 5.2 4.1 8.4 21.7 7.4 -4.2 6.1 -12.3
34.0 32.2 30.6 27.5 12.9 66.5 117.4 186.6 233.7

102 HEALTH CARE FINANCING REVIEW/Fall 1999/Volume 21, Number 1
Table 4
Employment, Hours, and Earnings in Private 1 Health Service Establishments, by Selected Type of Establishment: 1995-1999
Calendar Year 1996 1996 1996 1996Type of Establishment 1995 1996 1997 1998 Q1 Q2 Q3 Q4
Total Employment in ThousandsNon-Farm Private Sector 97,885 100,189 103,133 106,007 97,534 100,073 101,379 101,769
Health Services 9,230 9,478 9,703 9,846 9,364 9,451 9,521 9,576Offices and Clinics of Physicians 1,609 1,678 1,739 1,803 1,649 1,672 1,692 1,700Offices and Clinics of Dentists 592 611 629 646 601 608 614 619Nursing Homes 1,691 1,730 1,756 1,762 1,713 1,725 1,740 1,745Private Hospitals 3,772 3,812 3,860 3,926 3,794 3,806 3,818 3,829Home Health Care Services 629 675 710 672 654 671 679 694
Non-Supervisory Employment in ThousandsNon-Farm Private Sector 80,125 82,092 84,541 86,762 79,667 82,022 83,167 83,512
Health Services 8,178 8,405 8,599 8,724 8,303 8,381 8,442 8,492Offices and Clinics of Physicians 1,314 1,377 1,428 1,486 1,351 1,372 1,389 1,396Offices and Clinics of Dentists 517 535 550 563 527 534 538 543Nursing Homes 1,526 1,559 1,579 1,585 1,543 1,554 1,567 1,570Private Hospitals 3,450 3,489 3,537 3,598 3,471 3,484 3,496 3,507Home Health Care Services 582 624 655 618 605 621 628 642
Average Weekly HoursNon-Farm Private Sector 34.5 34.4 34.6 34.6 33.9 34.4 34.8 34.6
Health Services 32.8 32.7 33.0 33.1 32.5 32.6 32.8 32.8 Offices and Clinics of Physicians 32.5 32.9 33.2 33.0 32.6 32.8 32.9 33.2 Offices and Clinics of Dentists 28.0 28.2 28.4 28.3 27.9 28.2 28.2 28.4 Nursing Homes 32.5 32.4 32.4 32.6 32.2 32.3 32.7 32.3 Private Hospitals 34.5 34.4 34.9 35.0 34.4 34.3 34.3 34.4 Home Health Care Services 28.6 28.1 28.9 29.0 27.7 27.8 28.3 28.3
Average Hourly EarningsNon-Farm Private Sector $11.43 $11.81 $12.28 $12.78 $11.69 $11.74 $11.82 $12.01
Health Services 12.45 12.85 13.26 13.73 12.74 12.78 12.87 13.01Offices and Clinics of Physicians 12.54 13.17 13.79 14.31 12.95 13.08 13.22 13.44Offices and Clinics of Dentists 12.40 12.88 13.63 14.16 12.69 12.77 12.92 13.17Nursing Homes 8.77 9.01 9.34 9.77 8.95 8.95 9.02 9.10Private Hospitals 14.30 14.70 15.03 15.46 14.62 14.63 14.73 14.81Home Health Care Services 10.91 11.18 11.35 11.49 11.11 11.13 11.22 11.28
Hospital Employment in ThousandsTotal 5,069 5,067 5,077 5,132 5,068 5,068 5,066 5,065Private 3,772 3,812 3,860 3,926 3,794 3,806 3,818 3,829Federal 233 232 224 223 234 233 231 229State 395 376 360 348 385 378 372 368Local 669 648 632 635 656 651 646 640
1 Excludes hospitals, clinics, and other health-related establishments run by all governments.
NOTES: Data presented here conform to the 1987 Standard Industrial Classification. Q designates quarter of year. Quarterly data are not seasonally adjusted.
SOURCE: U.S. Department of Labor, Bureau of Labor Statistics: Employment and Earnings. Washington. U.S. Government Printing Office.Monthly reports for January 1995-March 1999.

HEALTH CARE FINANCING REVIEW/Fall 1999/Volume 21, Number 1 103
Table 4—Continued
Employment, Hours, and Earnings in Private 1 Health Service Establishments, by Selected Type of Establishment: 1995-1999
1997 1997 1997 1997 1998 1998 1998 1998 1999Q1 Q2 Q3 Q4 Q1 Q2 Q3 Q4 Q1
100,362 103,027 104,261 104,882 103,432 105,972 107,129 107,495 105,8799,607 9,684 9,739 9,781 9,779 9,831 9,872 9,901 9,8961,712 1,732 1,747 1,765 1,773 1,792 1,815 1,832 1,840
623 628 631 634 636 643 649 655 6571,742 1,753 1,764 1,767 1,760 1,763 1,765 1,760 1,7503,836 3,852 3,870 3,883 3,893 3,917 3,943 3,952 3,952
701 713 714 714 692 678 660 656 646
82,071 84,505 85,556 86,032 84,495 86,762 87,754 88,035 86,4188,512 8,585 8,632 8,668 8,668 8,713 8,749 8,765 8,7621,404 1,423 1,435 1,450 1,462 1,478 1,498 1,506 1,513
545 549 552 553 555 561 565 570 5741,567 1,576 1,586 1,588 1,583 1,586 1,588 1,581 1,5723,513 3,529 3,547 3,560 3,568 3,590 3,614 3,620 3,621
646 657 657 657 638 624 608 604 595
34.3 34.6 34.9 34.8 34.4 34.5 34.8 34.7 34.2 32.9 33.0 33.1 33.1 33.2 33.0 33.1 33.0 32.9 33.2 33.2 33.1 33.3 33.3 32.9 32.8 32.9 32.7 28.4 28.6 28.2 28.5 28.4 28.2 28.3 28.3 27.9 32.3 32.3 32.7 32.5 32.4 32.4 32.9 32.6 32.2 34.6 34.8 34.9 35.1 35.2 34.9 34.9 34.9 34.9 28.6 28.9 29.0 29.1 29.2 29.0 29.1 28.9 28.8
$12.15 $12.18 $12.27 $12.51 $12.65 $12.70 $12.78 $12.98 $13.1113.13 13.17 13.29 13.46 13.57 13.65 13.77 13.91 14.0513.61 13.67 13.83 14.03 14.19 14.26 14.29 14.50 14.6213.46 13.58 13.62 13.85 13.98 14.08 14.18 14.39 14.53
9.20 9.26 9.40 9.51 9.63 9.71 9.82 9.90 10.0114.91 14.94 15.05 15.22 15.28 15.36 15.54 15.67 15.8211.36 11.29 11.33 11.40 11.40 11.41 11.53 11.63 11.81
5,060 5,069 5,085 5,092 5,096 5,121 5,152 5,160 5,1643,836 3,852 3,870 3,883 3,893 3,917 3,943 3,952 3,952
225 224 225 224 224 224 224 221 221366 362 358 354 349 347 348 348 349633 631 632 631 631 633 637 640 642
104 HEALTH CARE FINANCING REVIEW/Fall 1999/Volume 21, Number 1
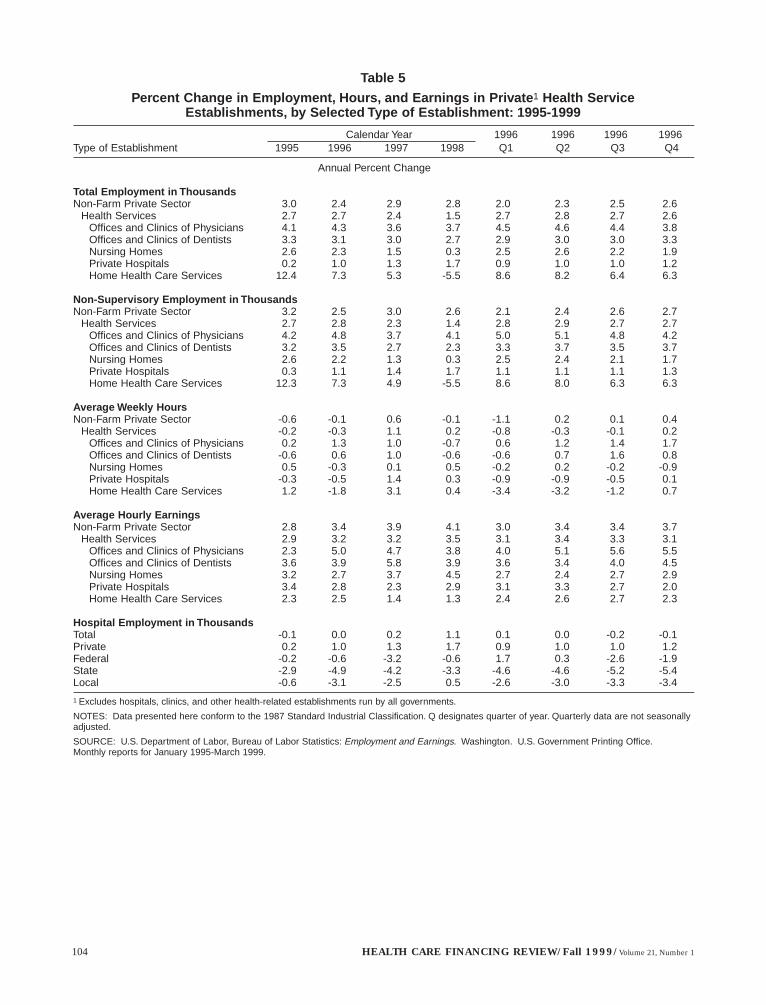
Table 5
Percent Change in Employment, Hours, and Earnings in Private 1 Health Service Establishments, by Selected Type of Establishment: 1995-1999
Calendar Year 1996 1996 1996 1996Type of Establishment 1995 1996 1997 1998 Q1 Q2 Q3 Q4
Annual Percent Change
Total Employment in ThousandsNon-Farm Private Sector 3.0 2.4 2.9 2.8 2.0 2.3 2.5 2.6
Health Services 2.7 2.7 2.4 1.5 2.7 2.8 2.7 2.6 Offices and Clinics of Physicians 4.1 4.3 3.6 3.7 4.5 4.6 4.4 3.8 Offices and Clinics of Dentists 3.3 3.1 3.0 2.7 2.9 3.0 3.0 3.3 Nursing Homes 2.6 2.3 1.5 0.3 2.5 2.6 2.2 1.9 Private Hospitals 0.2 1.0 1.3 1.7 0.9 1.0 1.0 1.2 Home Health Care Services 12.4 7.3 5.3 -5.5 8.6 8.2 6.4 6.3
Non-Supervisory Employment in ThousandsNon-Farm Private Sector 3.2 2.5 3.0 2.6 2.1 2.4 2.6 2.7
Health Services 2.7 2.8 2.3 1.4 2.8 2.9 2.7 2.7 Offices and Clinics of Physicians 4.2 4.8 3.7 4.1 5.0 5.1 4.8 4.2 Offices and Clinics of Dentists 3.2 3.5 2.7 2.3 3.3 3.7 3.5 3.7 Nursing Homes 2.6 2.2 1.3 0.3 2.5 2.4 2.1 1.7 Private Hospitals 0.3 1.1 1.4 1.7 1.1 1.1 1.1 1.3 Home Health Care Services 12.3 7.3 4.9 -5.5 8.6 8.0 6.3 6.3
Average Weekly HoursNon-Farm Private Sector -0.6 -0.1 0.6 -0.1 -1.1 0.2 0.1 0.4
Health Services -0.2 -0.3 1.1 0.2 -0.8 -0.3 -0.1 0.2 Offices and Clinics of Physicians 0.2 1.3 1.0 -0.7 0.6 1.2 1.4 1.7 Offices and Clinics of Dentists -0.6 0.6 1.0 -0.6 -0.6 0.7 1.6 0.8 Nursing Homes 0.5 -0.3 0.1 0.5 -0.2 0.2 -0.2 -0.9 Private Hospitals -0.3 -0.5 1.4 0.3 -0.9 -0.9 -0.5 0.1 Home Health Care Services 1.2 -1.8 3.1 0.4 -3.4 -3.2 -1.2 0.7
Average Hourly EarningsNon-Farm Private Sector 2.8 3.4 3.9 4.1 3.0 3.4 3.4 3.7
Health Services 2.9 3.2 3.2 3.5 3.1 3.4 3.3 3.1 Offices and Clinics of Physicians 2.3 5.0 4.7 3.8 4.0 5.1 5.6 5.5 Offices and Clinics of Dentists 3.6 3.9 5.8 3.9 3.6 3.4 4.0 4.5 Nursing Homes 3.2 2.7 3.7 4.5 2.7 2.4 2.7 2.9 Private Hospitals 3.4 2.8 2.3 2.9 3.1 3.3 2.7 2.0 Home Health Care Services 2.3 2.5 1.4 1.3 2.4 2.6 2.7 2.3
Hospital Employment in ThousandsTotal -0.1 0.0 0.2 1.1 0.1 0.0 -0.2 -0.1 Private 0.2 1.0 1.3 1.7 0.9 1.0 1.0 1.2 Federal -0.2 -0.6 -3.2 -0.6 1.7 0.3 -2.6 -1.9 State -2.9 -4.9 -4.2 -3.3 -4.6 -4.6 -5.2 -5.4 Local -0.6 -3.1 -2.5 0.5 -2.6 -3.0 -3.3 -3.4
1 Excludes hospitals, clinics, and other health-related establishments run by all governments.
NOTES: Data presented here conform to the 1987 Standard Industrial Classification. Q designates quarter of year. Quarterly data are not seasonally adjusted.
SOURCE: U.S. Department of Labor, Bureau of Labor Statistics: Employment and Earnings. Washington. U.S. Government Printing Office.Monthly reports for January 1995-March 1999.

HEALTH CARE FINANCING REVIEW/Fall 1999/Volume 21, Number 1 105
Table 5—Continued
Percent Change in Employment, Hours, and Earnings in Private 1 Health Service Establishments, by Selected Type of Establishment: 1995-1999
1997 1997 1997 1997 1998 1998 1998 1998 1999Q1 Q2 Q3 Q4 Q1 Q2 Q3 Q4 Q1
Percent Change from the Same Period of Previous Year
2.9 3.0 2.8 3.1 3.1 2.9 2.8 2.5 2.4 2.6 2.5 2.3 2.1 1.8 1.5 1.4 1.2 1.2 3.8 3.6 3.3 3.8 3.6 3.5 3.9 3.8 3.8 3.6 3.1 2.8 2.4 2.2 2.5 2.9 3.3 3.3 1.7 1.6 1.4 1.3 1.1 0.6 0.1 -0.4 -0.6 1.1 1.2 1.4 1.4 1.5 1.7 1.9 1.8 1.5 7.2 6.3 5.1 2.8 -1.3 -4.9 -7.5 -8.1 -6.6
3.0 3.0 2.9 3.0 3.0 2.7 2.6 2.3 2.3 2.5 2.4 2.2 2.1 1.8 1.5 1.4 1.1 1.1 3.9 3.8 3.3 3.8 4.2 3.8 4.4 3.9 3.5 3.4 2.8 2.6 2.0 1.8 2.0 2.4 3.0 3.5 1.5 1.4 1.2 1.1 1.0 0.6 0.1 -0.4 -0.7 1.2 1.3 1.5 1.5 1.6 1.7 1.9 1.7 1.5 6.8 5.9 4.7 2.4 -1.4 -5.1 -7.5 -8.1 -6.7
1.3 0.5 0.3 0.4 0.3 -0.3 -0.3 -0.3 -0.8 1.1 1.2 0.9 1.1 1.0 -0.1 0.1 -0.3 -1.1 1.8 1.2 0.6 0.2 0.2 -0.8 -1.1 -1.2 -1.7 2.0 1.4 0.0 0.6 -0.1 -1.4 0.2 -0.9 -1.9 0.2 -0.2 -0.1 0.6 0.4 0.3 0.8 0.3 -0.7 0.7 1.5 1.7 1.8 1.6 0.4 -0.1 -0.6 -0.9 3.2 3.8 2.5 2.8 2.0 0.3 0.1 -0.8 -1.4
4.0 3.8 3.8 4.1 4.1 4.2 4.2 3.8 3.6 3.0 3.1 3.2 3.5 3.4 3.6 3.6 3.3 3.6 5.1 4.5 4.6 4.4 4.2 4.3 3.4 3.3 3.0 6.1 6.4 5.5 5.2 3.8 3.7 4.1 3.9 3.9 2.8 3.4 4.2 4.5 4.6 4.9 4.5 4.1 3.9 2.0 2.1 2.2 2.7 2.5 2.8 3.2 2.9 3.5 2.3 1.4 1.0 1.1 0.4 1.1 1.7 2.0 3.6
-0.2 0.0 0.4 0.5 0.7 1.0 1.3 1.3 1.3 1.1 1.2 1.4 1.4 1.5 1.7 1.9 1.8 1.5
-4.1 -3.7 -2.6 -2.2 -0.5 0.0 -0.6 -1.3 -1.3 -5.0 -4.4 -3.7 -3.9 -4.5 -4.1 -2.9 -1.6 0.0 -3.4 -3.1 -2.1 -1.3 -0.4 0.3 0.8 1.4 1.7

106 HEALTH CARE FINANCING REVIEW/Fall 1999/Volume 21, Number 1
Table 6
Percent Change in Implied Non-Supervisory Payrolls, Employment, Average Weekly Hours,and Average Hourly Earnings in Private 1 Health Service Establishments, by Selected Type
of Establishment: 1995-1999
Calendar Year 1996 1996 1996 1996Type of Establishment 1995 1996 1997 1998 Q1 Q2 Q3 Q4
Annual Percent Change
Health ServicesPayrolls 5.5 5.8 6.7 5.2 5.1 6.0 6.0 6.1
Employment 2.7 2.8 2.3 1.4 2.8 2.9 2.7 2.7 Average Weekly Hours -0.2 -0.3 1.1 0.2 -0.8 -0.3 -0.1 0.2 Average Hourly Earnings 2.9 3.2 3.2 3.5 3.1 3.4 3.3 3.1
Offices and Clinics of PhysiciansPayrolls 6.8 11.4 9.6 7.2 9.8 11.8 12.3 11.8
Employment 4.2 4.8 3.7 4.1 5.0 5.1 4.8 4.2 Average Weekly Hours 0.2 1.3 1.0 -0.7 0.6 1.2 1.4 1.7 Average Hourly Earnings 2.3 5.0 4.7 3.8 4.0 5.1 5.6 5.5
Offices and Clinics of DentistsPayrolls 6.3 8.2 9.7 5.7 6.3 8.0 9.3 9.2
Employment 3.2 3.5 2.7 2.3 3.3 3.7 3.5 3.7 Average Weekly Hours -0.6 0.6 1.0 -0.6 -0.6 0.7 1.6 0.8 Average Hourly Earnings 3.6 3.9 5.8 3.9 3.6 3.4 4.0 4.5
Nursing HomesPayrolls 6.5 4.6 5.3 5.4 5.0 5.2 4.6 3.6
Employment 2.6 2.2 1.3 0.3 2.5 2.4 2.1 1.7 Average Weekly Hours 0.5 -0.3 0.1 0.5 -0.2 0.2 -0.2 -0.9 Average Hourly Earnings 3.2 2.7 3.7 4.5 2.7 2.4 2.7 2.9
Private HospitalsPayrolls 3.3 3.4 5.2 5.0 3.3 3.5 3.4 3.5
Employment 0.3 1.1 1.4 1.7 1.1 1.1 1.1 1.3 Average Weekly Hours -0.3 -0.5 1.4 0.3 -0.9 -0.9 -0.5 0.1 Average Hourly Earnings 3.4 2.8 2.3 2.9 3.1 3.3 2.7 2.0
Home Health Care ServicesPayrolls 16.2 8.1 9.7 -4.0 7.5 7.3 7.9 9.5
Employment 12.3 7.3 4.9 -5.5 8.6 8.0 6.3 6.3 Average Weekly Hours 1.2 -1.8 3.1 0.4 -3.4 -3.2 -1.2 0.7 Average Hourly Earnings 2.3 2.5 1.4 1.3 2.4 2.6 2.7 2.3
Non-Farm Private SectorPayrolls 5.5 5.8 7.7 6.6 4.0 6.1 6.2 6.9
Employment 3.2 2.5 3.0 2.6 2.1 2.4 2.6 2.7 Average Weekly Hours -0.6 -0.1 0.6 -0.1 -1.1 0.2 0.1 0.4 Average Hourly Earnings 2.8 3.4 3.9 4.1 3.0 3.4 3.4 3.7
1 Excludes hospitals, clinics, and other health-related establishments run by all governments.
NOTES: Data presented here conform to the 1987 Standard Industrial Classification. Q designates quarter of year. Quarterly data are not seasonally adjusted.
SOURCE: U.S. Department of Labor, Bureau of Labor Statistics: Employment and Earnings. Washington. U.S. Government Printing Office.Monthly reports for January 1995-March 1999.

HEALTH CARE FINANCING REVIEW/Fall 1999/Volume 21, Number 1 107
Table 6—Continued
Percent Change in Implied Non-Supervisory Payrolls, Employment, Average Weekly Hours,and Average Hourly Earnings in Private 1 Health Service Establishments, by Selected Type
of Establishment: 1995-1999
1997 1997 1997 1997 1998 1998 1998 1998 1999Q1 Q2 Q3 Q4 Q1 Q2 Q3 Q4 Q1
Percent Change from the Same Period of Previous Year
6.8 6.9 6.5 6.8 6.3 5.1 5.1 4.2 3.5 2.5 2.4 2.2 2.1 1.8 1.5 1.4 1.1 1.1 1.1 1.2 0.9 1.1 1.0 -0.1 0.1 -0.3 -1.1 3.0 3.1 3.2 3.5 3.4 3.6 3.6 3.3 3.6
11.2 9.8 8.8 8.6 8.8 7.4 6.7 6.0 4.8 3.9 3.8 3.3 3.8 4.2 3.8 4.4 3.9 3.5 1.8 1.2 0.6 0.2 0.2 -0.8 -1.1 -1.2 -1.7 5.1 4.5 4.6 4.4 4.2 4.3 3.4 3.3 3.0
12.0 10.9 8.2 7.8 5.6 4.3 6.9 6.1 5.5 3.4 2.8 2.6 2.0 1.8 2.0 2.4 3.0 3.5 2.0 1.4 0.0 0.6 -0.1 -1.4 0.2 -0.9 -1.9 6.1 6.4 5.5 5.2 3.8 3.7 4.1 3.9 3.9
4.6 4.6 5.4 6.3 6.1 5.9 5.4 4.0 2.5 1.5 1.4 1.2 1.1 1.0 0.6 0.1 -0.4 -0.7 0.2 -0.2 -0.1 0.6 0.4 0.3 0.8 0.3 -0.7 2.8 3.4 4.2 4.5 4.6 4.9 4.5 4.1 3.9
3.9 5.0 5.5 6.2 5.8 5.0 5.1 4.1 4.1 1.2 1.3 1.5 1.5 1.6 1.7 1.9 1.7 1.5 0.7 1.5 1.7 1.8 1.6 0.4 -0.1 -0.6 -0.9 2.0 2.1 2.2 2.7 2.5 2.8 3.2 2.9 3.5
12.7 11.6 8.3 6.4 1.0 -3.7 -5.8 -7.0 -4.7 6.8 5.9 4.7 2.4 -1.4 -5.1 -7.5 -8.1 -6.7 3.2 3.8 2.5 2.8 2.0 0.3 0.1 -0.8 -1.4 2.3 1.4 1.0 1.1 0.4 1.1 1.7 2.0 3.6
8.5 7.4 7.1 7.7 7.5 6.7 6.5 5.9 5.2 3.0 3.0 2.9 3.0 3.0 2.7 2.6 2.3 2.3 1.3 0.5 0.3 0.4 0.3 -0.3 -0.3 -0.3 -0.8 4.0 3.8 3.8 4.1 4.1 4.2 4.2 3.8 3.6

108 HEALTH CARE FINANCING REVIEW/Fall 1999/Volume 21, Number 1
Table 7
Selected National Economic Indicators: 1995-1999
Calendar Year 1996 1996 1996 1996Type of Establishment 1995 1996 1997 1998 Q1 Q2 Q3 Q4
Gross Domestic ProductBillions of Dollars 7,270 7,662 8,111 8,511 7,495 7,629 7,703 7,818Billions of 1992 Chain-Weighted Dollars 6,762 6,995 7,270 7,552 6,882 6,984 7,020 7,093Implicit Price Deflator (1992 = 100.0) 107.5 109.5 111.6 112.7 108.9 109.2 109.7 110.2
Personal IncomePersonal Income in Billions 6,072 6,426 6,784 7,126 6,284 6,390 6,479 6,550Disposable Income in Billions 5,277 5,535 5,795 6,028 5,435 5,497 5,577 5,630
Prices 1
Consumer Price Index, All Items 152.4 156.9 160.5 163.0 155.0 156.5 157.4 158.5 All Items Less Medical Care 148.6 152.8 156.3 158.6 151.0 152.5 153.3 154.4
Energy 105.2 110.1 111.5 102.9 105.3 112.0 111.9 111.3 Food and Beverages 148.9 153.7 157.7 161.1 151.6 152.8 154.3 156.2
Medical Care 220.5 228.2 234.6 242.1 226.0 227.4 229.1 230.4
Producer Price Index 2 FinishedConsumer Goods 125.6 129.5 130.2 128.9 127.4 129.3 130.2 131.2 Energy 78.1 83.2 83.4 75.1 78.8 84.2 84.7 85.1 Food 129.0 133.6 134.5 134.3 131.1 132.1 134.9 136.1 Finished Goods Except Food and Energy 141.9 144.3 145.1 147.7 144.0 144.2 144.0 145.0
Annual Percent ChangeGross Domestic ProductBillions of Dollars 4.6 5.4 5.9 4.9 4.5 5.8 5.5 5.8 Billions of 1992 Chain-Weighted Dollars 2.3 3.4 3.9 3.9 2.4 3.9 3.5 3.9 Implicit Price Deflator (1992 = 100.0) 2.3 1.9 1.9 1.0 2.0 1.9 1.8 1.8
Personal IncomePersonal Income in Billions 5.5 5.8 5.6 5.0 5.1 6.0 6.3 5.9 Disposable Income in Billions 5.1 4.9 4.7 4.0 4.3 5.0 5.3 4.9
Prices 1
Consumer Price Index, All Items 2.8 2.9 2.3 1.6 2.7 2.8 2.9 3.2 All Items Less Medical Care 2.7 2.9 2.3 1.4 2.7 2.8 2.9 3.1
Energy 0.6 4.6 1.3 -7.7 1.6 5.2 4.4 7.5 Food and Beverages 2.8 3.3 2.6 2.1 2.5 2.8 3.6 4.2
Medical Care 4.5 3.5 2.8 3.2 3.8 3.7 3.4 3.1
Producer Price Index 2 FinishedConsumer Goods 1.9 3.1 0.5 -1.0 2.3 2.9 3.4 3.8 Energy 1.4 6.5 0.2 -9.8 2.8 5.2 6.6 11.5 Food 1.8 3.5 0.7 -0.2 2.2 3.2 4.5 4.1 Finished Goods Except Food and Energy 2.1 1.7 0.5 1.8 2.3 1.8 1.6 0.9
1 Base period = 1982-1984, unless otherwise noted.2 Formerly called the "Wholesale Price Index."
NOTES: Q designates quarter of year. Unlike Tables 1-5, quarterly data on gross domestic product, personal income, and disposable personal income are seasonally adjusted at annual rates.
SOURCES: U.S. Department of Commerce, Bureau of Economic Analysis: Survey of Current Business. Washington. U.S. Government Printing Office.Monthly reports for January 1995-March 1999; U.S. Department of Labor, Bureau of Labor Statistics.

HEALTH CARE FINANCING REVIEW/Fall 1999/Volume 21, Number 1 109
Table 7—Continued
Selected National Economic Indicators: 1995-1999
1997 1997 1997 1997 1998 1998 1998 1998 1999Q1 Q2 Q3 Q4 Q1 Q2 Q3 Q4 Q1
7,955 8,063 8,171 8,255 8,384 8,441 8,538 8,681 8,8007,167 7,237 7,311 7,365 7,465 7,499 7,567 7,678 7,755111.0 111.4 111.8 112.1 112.3 112.6 112.8 113.1 113.5
6,667 6,744 6,821 6,905 7,004 7,082 7,161 7,258 7,3515,711 5,768 5,822 5,879 5,937 5,989 6,052 6,133 6,215
159.6 160.2 160.8 161.5 161.9 162.8 163.4 164.0 164.6 155.5 156.0 156.7 157.2 157.5 158.4 159.0 159.5 160.1 112.5 110.7 112.6 110.2 103.6 103.8 103.9 100.2 97.9 157.0 157.1 158.0 158.9 160.1 160.5 161.3 162.5 163.8 232.6 234.1 235.1 236.4 239.1 241.4 243.4 244.7 247.5
130.7 129.9 130.2 130.1 128.2 128.8 129.2 129.4 129.5 84.9 82.5 84.2 81.8 75.9 76.1 75.9 72.7 71.1
134.4 134.5 134.5 134.7 133.4 133.7 135.1 135.0 134.7 145.2 145.0 144.4 145.8 146.3 147.3 147.4 149.9 151.4
Percent Change from the Same Period of Previous Year
6.1 5.7 6.1 5.6 5.4 4.7 4.5 5.2 5.0 4.1 3.6 4.1 3.8 4.2 3.6 3.5 4.2 3.9 1.9 2.0 1.8 1.7 1.2 1.0 0.9 0.9 1.1
6.1 5.5 5.3 5.4 5.1 5.0 5.0 5.1 5.0 5.1 4.9 4.4 4.4 4.0 3.8 4.0 4.3 4.7
2.9 2.3 2.2 1.9 1.5 1.6 1.6 1.5 1.7 3.0 2.3 2.2 1.8 1.3 1.5 1.5 1.4 1.6 6.8 -1.1 0.6 -1.0 -8.0 -6.3 -7.7 -9.0 -5.4 3.5 2.8 2.4 1.7 2.0 2.2 2.1 2.3 2.3 2.9 3.0 2.6 2.6 2.8 3.1 3.5 3.5 3.5
2.6 0.5 -0.1 -0.8 -1.9 -0.8 -0.7 -0.5 1.0 7.7 -2.0 -0.6 -4.0 -10.6 -7.8 -9.9 -11.0 -6.3 2.5 1.8 -0.3 -1.0 -0.7 -0.6 0.4 0.2 1.0 0.8 0.6 0.3 0.5 0.8 1.6 2.1 2.9 3.5

110 HEALTH CARE FINANCING REVIEW/Fall 1999/Volume 21, Number 1
Table 8
Index Levels of Medical Prices: 1995-1999
Calendar Year 1996 1996 1996Type of Establishment 1995 1996 1997 1998 Q1 Q2 Q3
Consumer Price Indexes, All Urban Consumers 1
Medical Care Services2 224.2 232.4 239.1 246.8 230.1 231.5 233.3 Professional Services 201.0 208.3 215.4 222.2 205.9 207.5 209.2
Physician Services 208.8 216.4 222.9 229.5 214.3 215.8 217.1 Dental Services 206.8 216.5 226.6 236.2 212.5 215.1 218.0
Hospital and Related Services 257.8 269.5 278.4 287.5 266.1 267.7 271.0 Hospital Services (12/96 = 100) — — 101.7 105.0 — — —
Inpatient Hospital Services (12/96 =100) — — 101.3 104.0 — — —Outpatient Hospital Services (12/86 =100) 204.6 215.1 224.9 233.2 211.7 213.9 216.5
Nursing Home Services (12/96 =100) — — 102.3 107.1 — — —
Medical Care Commodities 204.5 210.4 215.3 221.8 208.4 209.9 211.1 Prescription Drugs 235.0 242.9 249.3 258.6 240.1 242.3 243.7 Non-Prescription Drugs and Medical Supplies (1986 =100) 140.5 143.1 145.4 147.7 142.5 142.9 143.6
Internal and Respiratory Over-the-Counter Drugs 167.0 170.2 173.1 175.4 169.3 169.5 170.6 Non-Prescription Medical Equipment and Supplies 166.3 169.1 171.5 174.9 168.7 169.3 169.8
Producer Price Indexes 3
Industry Groupings 4
Health Services (12/94 = 100) 102.4 104.6 106.1 107.7 104.1 104.4 104.7 Offices and Clinics of Doctors of Medicine (12/93 =100) 106.8 107.6 109.0 111.3 107.4 107.5 107.5
Medicare Treatments (12/93 =100) 109.6 105.5 105.8 110.5 105.5 105.5 105.5 Non-Medicare Treatments (12/93 =100) 105.9 107.8 109.6 111.4 107.5 107.7 107.8
Hospitals (12/92 = 100) 110.0 112.6 113.6 114.4 112.2 112.3 112.7 General Medical and Surgical Hospitals (12/92 =100) 109.9 112.5 113.6 114.6 112.2 112.2 112.5
Inpatient Treatments (12/92 =100) 109.2 111.8 112.8 113.6 111.5 111.6 111.6 Medicare Patients (12/92 =100) 104.7 108.1 108.8 108.1 107.8 107.8 107.8 Medicaid Patients (12/92 =100) 109.8 112.2 110.9 110.2 111.7 112.5 111.9 All Other Patients (12/92 =100) 111.7 113.7 115.6 117.8 113.6 113.4 113.6
Outpatient Treatments (12/92 =100) 113.3 116.2 117.4 118.6 115.6 115.8 116.6 Medicare Patients (12/92 =100) 111.2 113.1 116.1 118.8 112.3 112.5 113.4 Medicaid Patients (12/92 =100) 106.4 106.1 105.0 105.9 107.1 107.1 105.9 All Other Patients (12/92 =100) 114.2 117.7 118.8 119.8 116.9 117.1 118.1
Skilled and Intermediate Care Facilities (12/94 =100) 103.6 110.0 114.7 119.6 108.2 109.5 110.7 Public Payers (12/94 =100) 103.8 110.5 115.4 120.4 108.6 110.1 111.2 Private Payers (12/94 =100) 103.6 109.8 114.3 119.1 108.2 109.1 110.4
Medical Laboratories (6/94 =100) 104.0 105.3 106.1 106.4 105.3 105.2 105.3 Home Health Care Services (12/96 =100) — — 103.4 106.2 — — —
Medicare Payers (12/96 =100) — — 102.2 103.6 — — —Non-Medicare Payers (12/96 =100) — — 100.3 103.0 — — —
Commodity GroupingsDrugs and Pharmaceuticals 210.9 214.7 219.1 242.6 213.8 214.6 215.2
Ethical (Prescription) Preparations 257.0 265.4 273.5 322.9 262.5 265.1 266.8 Proprietary (Over-the-Counter) Preparations 186.6 185.1 184.8 184.5 188.3 184.5 183.3
Medical, Surgical, and Personal Aid Devices 141.3 143.1 143.1 143.4 143.5 143.4 142.6 Personal Aid Equipment 133.7 139.3 140.3 143.4 136.8 139.8 140.2 Medical Instruments and Equipment (6/82 =100) 128.3 130.1 128.1 126.7 130.3 130.1 129.7 Surgical Appliances and Supplies (6/83 =100) 154.8 156.9 158.8 160.6 157.4 158.1 156.3 Ophthalmic Goods (12/83 =100) 122.2 120.3 119.8 119.6 122.2 119.7 119.8 Dental Equipment and Supplies (6/85 =100) 137.5 141.0 146.6 151.2 140.7 140.7 141.0
1 Unless otherwise noted, base year is 1982-1984 = 100.2 Includes the net cost of private health insurance, not shown separately.3 Unless otherwise noted, base year is 1982 = 100. Producer Price Indexes are classified by industry (price changes received for the industry's output sold outside the industry) and commodity (price changes by similarity of end-use or material composition).4 Further detail for Producer Price Industry groupings, such as types of physician practices, hospital diagnosis-related groups, are available from the Bureau of Labor Statistics.
NOTES: Q designates quarter of year. Quarterly data are not seasonally adjusted.
SOURCES: U.S. Department of Labor, Bureau of Labor Statistics: CPI Detailed Report. Washington. U.S. Government Printing Office.Monthly reports for January 1995-March 1999. U.S. Department of Labor, Bureau of Labor Statistics: Producer Price Indexes. Washington.U.S. Government Printing Office. Monthly reports for January 1995-March 1999.

HEALTH CARE FINANCING REVIEW/Fall 1999/Volume 21, Number 1 111
Table 8—Continued
Index Levels of Medical Prices: 1995-1999
1996 1997 1997 1997 1997 1998 1998 1998 1998 1999Q4 Q1 Q2 Q3 Q4 Q1 Q2 Q3 Q4 Q1
234.7 237.0 238.4 239.7 241.2 244.0 245.9 248.0 249.3 252.3 210.7 213.2 215.1 216.2 217.1 219.5 221.8 223.3 224.4 226.7 218.3 220.8 222.8 223.7 224.2 226.6 228.8 230.8 231.7 233.7 220.5 223.4 225.8 227.6 229.6 232.6 235.1 237.3 239.7 243.7 273.1 276.3 277.2 278.8 281.3 284.6 285.7 289.0 290.8 295.7
— 101.0 101.3 101.8 102.7 103.9 104.3 105.5 106.2 108.0 — 100.8 101.0 101.5 102.1 103.1 103.3 104.4 105.0 106.7
218.1 222.6 223.7 225.4 227.7 230.0 231.6 234.4 236.7 241.1 — 101.0 101.8 102.9 103.5 105.5 106.7 107.8 108.2 110.0
212.1 213.8 215.6 215.6 216.1 218.2 221.3 223.1 224.8 226.8 245.3 247.6 249.8 249.6 250.1 253.3 257.6 260.6 263.0 267.2 143.6 144.5 145.4 145.8 146.1 146.5 147.7 148.0 148.6 147.8 171.3 172.4 173.3 173.3 173.4 173.2 175.6 176.4 176.4 174.8 168.8 169.7 171.2 172.2 173.1 175.1 174.5 173.9 176.0 176.5
105.2 105.8 105.9 106.2 106.3 107.1 107.5 107.9 108.3 109.2 107.9 108.7 108.8 109.3 109.2 110.7 111.2 111.5 112.0 113.2 105.5 105.8 105.8 105.8 105.8 110.5 110.5 110.5 110.5 113.2 108.2 109.2 109.4 109.9 109.8 110.6 111.2 111.6 112.2 113.1 113.4 113.5 113.6 113.5 113.5 114.0 114.2 114.4 115.0 115.7 113.2 113.4 113.4 113.8 113.8 114.1 114.4 114.6 115.2 115.8 112.4 112.5 112.5 113.2 113.0 113.3 113.4 113.6 114.1 114.8 109.1 109.1 109.1 109.1 108.0 108.0 108.0 108.0 108.4 108.4 112.5 110.7 110.0 111.4 111.5 110.9 110.6 109.6 109.7 109.8 114.2 114.8 115.1 116.0 116.3 117.0 117.4 118.1 118.8 120.0 117.0 117.4 117.5 117.1 117.5 118.0 118.4 118.6 119.3 120.0 114.4 115.3 115.9 116.7 116.4 117.4 118.3 119.0 120.6 122.2 104.4 104.8 104.9 105.0 105.2 105.2 105.3 105.3 107.8 107.8 118.6 119.0 119.0 118.4 118.9 119.3 119.7 119.9 120.2 120.7
111.6 113.3 113.9 115.5 116.1 117.7 118.6 120.6 121.4 122.5 112.1 113.7 114.4 116.3 117.0 118.4 119.0 121.5 122.6 123.1 111.4 113.3 113.8 114.9 115.4 117.4 118.7 120.0 120.3 122.4 105.3 105.8 106.1 106.2 106.2 106.3 106.5 106.4 106.4 106.2
— 101.6 103.4 103.7 104.7 105.7 106.4 106.3 106.6 106.0 — 101.5 101.5 102.5 103.1 103.2 103.8 103.2 104.3 102.5 — 100.2 100.0 99.9 101.2 102.6 103.1 103.2 103.0 103.1
215.2 218.1 218.2 219.2 221.0 229.8 244.5 247.4 248.7 251.1 267.0 271.0 272.5 273.6 276.8 295.3 328.3 332.9 335.3 337.2 184.2 186.1 183.9 184.3 184.9 184.7 184.3 184.4 184.7 185.3 142.7 142.9 143.2 143.2 143.1 143.3 143.0 143.3 144.0 144.2 140.3 140.3 140.4 139.4 141.1 142.0 143.9 143.9 143.9 146.6 130.1 127.8 128.1 128.6 127.8 127.0 126.4 126.6 126.9 127.3 155.8 158.5 158.9 158.6 159.2 160.7 160.1 160.3 161.3 161.3 119.5 120.4 119.9 119.4 119.5 119.2 119.1 119.6 120.7 120.2 141.7 145.9 146.5 146.8 147.0 148.8 150.8 152.1 153.0 153.7

112 HEALTH CARE FINANCING REVIEW/Fall 1999/Volume 21, Number 1
Table 9
Percent Change in Medical Prices from Same Period a Year Ago: 1995-1999
Calendar Year 1996 1996 1996Type of Establishment 1995 1996 1997 1998 Q1 Q2 Q3
Consumer Price Indexes, All Urban Consumers 1 Annual ChangeMedical Care Services2 5.0 3.7 2.9 3.2 4.1 3.8 3.5
Professional Services 4.4 3.7 3.4 3.2 3.8 3.7 3.5 Physician Services 4.5 3.6 3.0 3.0 4.2 3.7 3.3 Dental Services 4.9 4.7 4.7 4.2 4.2 4.6 4.9
Hospital and Related Services 5.0 4.5 3.3 3.3 4.7 4.7 4.6 Hospital Services (12/96 =100) — — — — — — —
Inpatient Hospital Services (12/96 =100) — — — — — — —Outpatient Hospital Services (12/86 =100) 4.9 5.1 4.6 3.7 5.0 5.7 5.4
Nursing Home Services (12/96 =100) — — — — — — —
Medical Care Commodities 1.9 2.9 2.3 3.0 2.4 3.1 3.2 Prescription Drugs 1.9 3.3 2.6 3.8 2.9 3.6 3.5 Non-Prescription Drugs and Medical Supplies (1986 =100) 1.8 1.9 1.6 1.6 1.5 2.0 2.3
Internal and Respiratory Over-the-Counter Drugs 0.6 1.9 1.7 1.3 1.3 2.1 1.9 Non-Prescription Medical Equipment and Supplies 3.9 1.7 1.4 2.0 1.7 1.8 2.8
Producer Price Indexes 3
Industry Groupings 4
Health Services (12/94 =100) — 2.2 1.4 1.5 2.5 2.4 2.1 Offices and Clinics of Doctors of Medicine (12/93 =100) 3.9 0.7 1.3 2.1 1.0 0.7 0.4
Medicare Treatments (12/93 =100) 4.7 -3.7 0.3 4.4 -3.7 -3.7 -3.7 Non-Medicare Treatments (12/93 =100) 3.6 1.8 1.7 1.6 1.9 1.5 1.6
Hospitals (12/92 =100) 3.5 2.4 0.8 0.7 2.7 2.7 2.5 General Medical and Surgical Hospitals (12/92 =100) 3.7 2.4 1.0 0.8 2.9 2.8 2.3
Inpatient Treatments (12/92 =100) 3.1 2.3 0.9 0.7 2.8 2.8 2.3 Medicare Patients (12/92 =100) 2.0 3.3 0.6 -0.7 4.1 4.1 4.1 Medicaid Patients (12/92 =100) 2.5 2.2 -1.1 -0.7 2.1 2.6 2.4 All Other Patients (12/92 =100) 3.7 1.8 1.7 1.9 2.3 2.0 1.4
Outpatient Treatments (12/92 =100) 6.2 2.6 1.0 1.0 3.3 2.9 2.2 Medicare Patients (12/92 =100) 4.0 1.7 2.6 2.4 1.9 1.3 1.4 Medicaid Patients (12/92 =100) 2.9 -0.2 -1.1 0.9 1.3 1.2 0.1 All Other Patients (12/92 =100) 6.9 3.0 1.0 0.8 3.7 3.4 2.6
Skilled and Intermediate Care Facilities (12/94 =100) — 6.1 4.3 4.3 6.1 6.5 6.2 Public Payers (12/94 =100) — 6.5 4.4 4.3 6.6 7.2 6.5 Private Payers (12/94 =100) — 5.9 4.1 4.2 5.9 5.8 6.0
Medical Laboratories (6/94 =100) — 1.3 0.8 0.3 3.7 1.8 -0.6 Home Health Care Services (12/96 =100) — — — 2.8 — — —
Medicare Payers (12/96 =100) — — — 1.4 — — —Non-Medicare Payers (12/96 =100) — — — 2.7 — — —
Commodity GroupingsDrugs and Pharmaceuticals 2.4 1.8 2.1 10.7 2.5 2.0 1.9
Ethical (Prescription) Preparations 2.8 3.3 3.1 18.1 3.9 3.6 3.6 Proprietary (Over-the-Counter) Preparations 1.8 -0.8 -0.1 -0.1 1.5 -1.1 -1.8
Medical, Surgical, and Personal Aid Devices 0.7 1.3 0.0 0.2 2.0 1.8 0.8 Personal Aid Equipment 2.7 4.2 0.7 2.2 4.3 6.1 3.8 Medical Instruments and Equipment (6/82 =100) 1.3 1.4 -1.5 -1.1 2.0 1.6 0.8 Surgical Appliances and Supplies (6/83 =100) -0.6 1.4 1.2 1.1 2.0 2.6 1.1 Ophthalmic Goods (12/83 =100) 2.2 -1.6 -0.4 -0.1 0.4 -1.8 -2.5 Dental Equipment and Supplies (6/85 =100) 1.7 2.5 3.9 3.2 3.2 2.0 2.8
1 Unless otherwise noted, base year is 1982-1984 = 100.2 Includes the net cost of private health insurance, not shown separately.3 Unless otherwise noted, base year is 1982 = 100. Producer Price Indexes are classified by industry (price changes received for the industry's output sold outside the industry) and commodity (price changes by similarity of end-use or material composition).4 Further detail for Producer Price Industry groupings, such as types of physician practices, hospital diagnosis-related groups, etc., are available from the Bureau of Labor Statistics.
NOTES: Q designates quarter of year. Quarterly data are not seasonally adjusted.
SOURCES: U.S. Department of Labor, Bureau of Labor Statistics: CPI Detailed Report. Washington. U.S. Government Printing Office. Monthly reports for January 1995-March 1999; U.S. Department of Labor, Bureau of Labor Statistics: Producer Price Indexes. Washington. U.S. Government Printing Office. Monthly reports for January 1995-March 1999.

HEALTH CARE FINANCING REVIEW/Fall 1999/Volume 21, Number 1 113
Table 9—Continued
Percent Change in Medical Prices from Same Period a Year Ago: 1995-1999
1996 1997 1997 1997 1997 1998 1998 1998 1998 1999Q4 Q1 Q2 Q3 Q4 Q1 Q2 Q3 Q4 Q1
Percent Change from the Same Period of Previous Year
3.2 3.0 3.0 2.7 2.8 2.9 3.1 3.5 3.4 3.4 3.6 3.6 3.7 3.4 3.1 3.0 3.1 3.3 3.3 3.2 3.2 3.0 3.3 3.0 2.7 2.6 2.7 3.2 3.3 3.1 5.1 5.2 4.9 4.4 4.1 4.1 4.1 4.3 4.4 4.8 4.2 3.8 3.5 2.9 3.0 3.0 3.0 3.6 3.4 3.9 — — — — — 2.9 3.0 3.6 3.3 3.9 — — — — — 2.3 2.3 2.9 2.8 3.5
4.4 5.2 4.6 4.1 4.4 3.3 3.5 4.0 3.9 4.8 — — — — — 4.4 4.8 4.8 4.5 4.3
2.9 2.6 2.7 2.1 1.9 2.0 2.6 3.5 4.0 4.0 3.3 3.1 3.1 2.4 1.9 2.3 3.1 4.4 5.2 5.5 1.7 1.4 1.8 1.5 1.7 1.4 1.6 1.5 1.7 0.9 2.4 1.8 2.2 1.6 1.3 0.5 1.3 1.8 1.7 0.9 0.6 0.6 1.1 1.4 2.5 3.2 2.0 1.0 1.7 0.8
1.8 1.6 1.5 1.5 1.0 1.3 1.4 1.6 1.9 1.9 0.8 1.3 1.2 1.6 1.2 1.8 2.1 2.0 2.5 2.2
-3.7 0.3 0.3 0.3 0.3 4.4 4.4 4.4 4.4 2.4 2.0 1.6 1.6 2.0 1.5 1.3 1.6 1.5 2.1 2.3 1.8 1.2 1.2 0.8 0.1 0.4 0.5 0.8 1.3 1.5 1.5 1.1 1.1 1.2 0.6 0.7 0.8 0.7 1.2 1.5 1.4 0.8 0.9 1.4 0.5 0.7 0.8 0.4 1.0 1.4 1.2 1.2 1.2 1.2 -1.0 -1.0 -1.0 -1.0 0.4 0.4 1.7 -0.9 -2.2 -0.5 -0.9 0.2 0.5 -1.6 -1.6 -1.0 1.4 1.1 1.5 2.2 1.9 1.9 2.0 1.8 2.1 2.6 1.9 1.6 1.5 0.5 0.5 0.5 0.8 1.3 1.5 1.6 2.3 2.7 3.0 2.9 1.8 1.9 2.0 2.0 3.5 4.0
-3.4 -2.1 -2.1 -0.8 0.8 0.4 0.3 0.3 2.5 2.5 2.4 1.8 1.6 0.3 0.3 0.3 0.6 1.3 1.1 1.1
5.7 4.7 4.0 4.3 4.1 3.9 4.1 4.5 4.6 4.1 5.5 4.7 4.0 4.6 4.4 4.2 4.0 4.5 4.7 3.9 6.0 4.7 4.2 4.0 3.6 3.6 4.4 4.4 4.3 4.3 0.3 0.5 0.9 0.9 0.9 0.4 0.3 0.2 0.2 -0.1 — — — — — 4.0 2.9 2.4 1.8 0.3 — — — — — 1.6 2.3 0.6 1.1 -0.6 — — — — — 2.5 3.1 3.3 1.7 0.5
0.8 2.0 1.7 1.9 2.7 5.4 12.0 12.8 12.5 9.3 2.0 3.2 2.8 2.5 3.6 8.9 20.5 21.7 21.2 14.2
-1.8 -1.2 -0.3 0.6 0.4 -0.7 0.2 0.1 -0.1 0.3 0.4 -0.4 -0.2 0.4 0.3 0.3 -0.1 0.0 0.6 0.6 2.6 2.6 0.4 -0.6 0.6 1.2 2.5 3.2 2.0 3.2 1.1 -1.9 -1.5 -0.9 -1.7 -0.7 -1.4 -1.5 -0.7 0.2
-0.3 0.7 0.5 1.5 2.2 1.4 0.7 1.1 1.3 0.4 -2.5 -1.5 0.1 -0.3 0.0 -1.0 -0.7 0.2 1.0 0.9 2.2 3.6 4.1 4.1 3.8 2.0 3.0 3.6 4.0 3.3

114 HEALTH CARE FINANCING REVIEW/Fall 1999/Volume 21, Number 1
Table 10
Quarterly Index Levels and Four-Quarter Moving Average Percent Change in the Prospective Payment System (PPS) Hospital Input Price Index,
by Expense Category: 1997-2001
Base YearWeights 1997 1997 1997 1998
Expense Category1 Price/Wage Variable FY 19922 Q2 Q3 Q4 Q1
Index LevelsTotal — 100.000 114.2 115.1 115.9 116.7
Compensation — 61.390 116.1 117.1 118.1 119.0 Wages and Salaries HCFA Occupational Wage Index4 50.244 115.7 116.9 117.9 118.9 Employee Benefits HCFA Occupational Benefits Index4 11.146 117.6 118.1 119.0 119.6
Other Professional Fees ECI-W/S: Professional/Technical (Private) 2.127 117.3 117.9 118.9 119.8 Energy and Utilities3 — 1.542 109.3 113.6 111.3 109.0 Professional Liability Insurance HCFA-Professional Liability Premium 1.189 96.1 95.9 96.0 96.1 All Other — 33.752 111.5 112.1 112.5 113.4
Other Products3 — 24.825 110.5 110.8 111.0 112.0 Pharmaceuticals PPI-Prescription Drugs 4.162 119.3 119.7 121.1 129.2 Food: Direct Purchase PPI-Processed Foods 2.314 110.5 109.9 109.4 107.7 Food: Contract Service CPI-Food Away from Home 1.072 111.6 112.3 113.2 113.8 Chemicals PPI-Industrial Chemicals 3.666 115.3 115.9 115.7 114.0 Medical Instruments PPI-Medical Instruments/Equipment 3.080 104.5 104.9 104.2 103.6 Rubber and Plastics PPI-Rubber/Plastic Products 4.750 107.3 107.4 107.3 107.2 Paper Products PPI-Converted Paper and Paperboard 2.078 109.2 109.3 111.6 113.6 Miscellaneous Products PPI-Finished Goods 2.236 107.2 107.2 107.3 106.1
Other Services3 — 8.927 114.3 115.8 116.6 117.5 All Other: Labor-Intensive ECI-Comp: Service Workers 7.277 115.0 116.9 117.8 118.8
Four-Quarter Moving-Average Percent ChangeTotal — 100.000 2.1 2.0 2.1 2.3
Compensation — 61.390 2.6 2.6 2.7 2.9 Wages and Salaries HCFA Occupational Wage Index4 50.244 2.9 2.8 3.0 3.2 Employee Benefits HCFA Occupational Benefits Index4 11.146 1.7 1.5 1.6 1.7
Other Professional Fees ECI-W/S: Professional/Technical (Private) 2.127 2.7 2.6 2.6 2.8 Energy and Utilities3 — 1.542 2.6 2.3 2.0 0.7 Professional Liability Insurance HCFA-Professional Liability Premium 1.189 -1.1 -1.5 -1.8 -1.5 All Other — 33.752 1.1 1.1 1.0 1.2
Other Products3 — 24.825 0.5 0.3 0.2 0.3 Pharmaceuticals PPI-Prescription Drugs 4.162 2.9 2.6 3.1 4.5
Food: Direct Purchase PPI-Processed Foods 2.314 3.7 1.8 0.5 -0.6 Food: Contract Service CPI-Food Away From Home 1.072 2.9 2.9 2.8 2.7 Chemicals PPI-Industrial Chemicals 3.666 0.0 0.3 -0.2 -1.3 Medical Instruments PPI-Medical Instruments/Equipment 3.080 -0.4 -0.8 -1.5 -1.2
Rubber and Plastics PPI-Rubber/Plastic Products 4.750 -0.7 -0.6 -0.5 -0.3 Paper Products PPI-Converted Paper and Paperboard 2.078 -5.8 -4.9 -3.3 -1.3 Miscellaneous Products PPI-Finished Goods 2.236 2.1 1.3 0.4 -0.5
Other Services3 — 8.927 2.8 3.2 3.4 3.6 All Other: Labor-Intensive ECI-Comp: Service Workers 7.277 2.9 3.5 3.8 4.1
1 For data sources used to estimate the Input Price Index relative weights and choice of price proxies, refer to the August 29, 1997, Federal Register.For the most recent PPS update for payment rates, refer to the July 31, 1998, Federal Register.2 Category weights may not sum to total or subtotals because of detail not included.3 Represents a subtotal. Detailed categories not shown are listed below by subtotal, detailed category, and base-year weight: Energy and Utilities:Fuel Oil, Coal, and Other Fuel (0.369), Electricity (0.927), andWater and Sewage (0.246). Other Products: Photographic Supplies (0.391), Apparel (0.869), and Machinery and Equipment (0.207). Other Services: Telephone (0.581), Postage (0.272), and Other Non-Labor Intensive (0.796).4 The HCFA Occupational Wage and Occupational Benefit Indexes are computed as the weighted-average of 10 ECI categories (ECI for Hospital workers and 9 ECI occupational categories).
NOTES: A dash (—) in the Price/Wage Variable column denotes a total or subtotal produced by adding two or more categories. FY is fiscal year.Q designates quarter of year. HCFA is Health Care Financing Administration. ECI is Employment Cost Index. W/S is wages and salaries. PPI is Producer Price Index. CPI is Consumer Price Index. Comp is compensation. The four-quarter moving-average percent change for the quarter indicated by the column heading is the rate of change in the average index level for four quarters ending in that quarter over the same period of the previous year. The four-quarter moving-average index level for the quarter indicated by the column heading is computed by summing the index level for that quarter and the prior three quarters and dividing by 4. The process is repeated to compute the four-quarter moving-average index level for the same quarter a year ago. The average index level for the quarter indicated by the column heading is divided by the average index level of the same quarter a year ago, and the quotient is subtracted from 1 and multiplied by 100 to determine the four-quarter moving-average percent change in the index.
SOURCES: Health Care Financing Administration, Office of the Actuary: Data from the National Health Statistics Group. Second quarter 1999forecasts were produced under contract to HCFA by Standard & Poor's DRI.

HEALTH CARE FINANCING REVIEW/Fall 1999/Volume 21, Number 1 115
Table 10—Continued
Quarterly Index Levels and Four-Quarter Moving Average Percent Change in the Prospective Payment System (PPS) Hospital Input Price Index,
by Expense Category: 1997-2001
Forecast1998 1998 1998 1999 1999 1999 1999 2000 2000 2000 2000 2001Q2 Q3 Q4 Q1 Q2 Q3 Q4 Q1 Q2 Q3 Q4 Q1
117.9 118.9 119.3 119.9 120.9 122.0 122.8 123.6 124.3 125.3 126.1 127.0 119.9 121.2 121.8 122.7 123.9 125.0 125.9 126.9 127.6 128.8 129.7 130.8 119.8 121.1 121.8 122.8 123.9 125.0 126.0 126.9 127.7 128.9 129.8 130.8 120.6 121.4 122.1 122.5 123.6 124.7 125.6 126.6 127.2 128.3 129.4 130.7 120.9 122.2 123.0 123.3 124.5 125.7 126.6 127.7 128.6 129.8 130.7 131.9 109.8 113.4 109.6 109.3 110.5 114.3 112.0 112.6 112.8 116.7 114.0 114.9
96.2 96.4 96.8 97.5 97.9 98.1 98.1 97.8 97.8 98.0 98.3 98.6 115.1 115.5 115.6 116.0 116.7 117.5 118.3 118.9 119.5 120.0 120.7 121.5 114.0 114.2 114.1 114.2 114.8 115.6 116.2 116.7 117.2 117.4 118.0 118.6 143.7 145.7 146.8 148.8 150.3 151.2 152.6 154.3 155.6 156.2 157.7 159.8 107.6 108.4 107.9 107.6 105.8 105.9 105.8 106.1 106.8 107.1 107.2 107.6 114.5 115.3 116.0 116.9 117.7 118.6 119.7 120.8 121.7 122.8 123.8 124.7 111.7 110.3 109.2 108.3 108.7 110.6 111.2 111.0 110.8 110.5 111.3 111.1 103.1 103.3 103.5 103.9 104.0 104.2 104.3 104.6 104.7 104.7 104.9 105.6 106.9 106.6 106.5 106.1 107.0 107.5 108.0 108.4 108.6 108.8 108.8 108.8 113.3 113.3 112.1 111.5 112.9 115.0 115.9 116.6 117.2 118.1 119.2 120.0 106.4 106.6 106.9 106.9 107.7 108.0 108.5 108.9 109.3 109.5 110.1 110.6 118.1 119.1 119.6 120.8 121.9 123.0 124.1 125.0 126.1 127.2 128.2 129.3 119.4 120.6 121.2 122.5 123.8 124.9 126.2 127.2 128.4 129.7 130.8 131.9
2.6 2.9 3.0 3.0 2.9 2.7 2.7 2.8 2.9 2.9 2.8 2.7 3.1 3.3 3.3 3.3 3.3 3.2 3.2 3.3 3.2 3.2 3.1 3.1 3.4 3.5 3.5 3.4 3.4 3.3 3.4 3.4 3.3 3.2 3.1 3.1 2.0 2.4 2.5 2.6 2.6 2.5 2.6 2.9 3.0 3.0 3.0 3.0 3.0 3.2 3.3 3.3 3.3 3.1 2.9 3.1 3.2 3.3 3.4 3.3 0.6 0.3 -0.7 -0.2 -0.2 0.1 1.0 1.6 2.0 2.3 2.3 2.0
-1.0 -0.4 0.2 0.7 1.1 1.4 1.6 1.3 0.9 0.4 0.1 0.2 1.8 2.3 2.7 2.8 2.3 2.0 1.9 2.0 2.3 2.4 2.3 2.2 1.1 1.9 2.5 2.8 2.1 1.7 1.4 1.5 1.8 1.9 1.9 1.7 9.0 13.7 18.1 19.5 15.1 10.6 6.6 4.0 3.8 3.6 3.5 3.4
-1.6 -1.7 -1.8 -1.4 -1.1 -1.3 -1.5 -1.8 -1.2 -0.3 0.5 1.2 2.6 2.6 2.6 2.6 2.6 2.7 2.9 3.0 3.2 3.4 3.4 3.4
-1.7 -2.8 -4.0 -4.6 -4.5 -3.3 -1.5 0.4 1.6 1.6 1.1 0.5 -1.2 -1.3 -1.1 -0.8 -0.2 0.4 0.7 0.8 0.7 0.6 0.6 0.7 -0.4 -0.4 -0.5 -0.8 -0.6 -0.2 0.4 1.2 1.5 1.6 1.4 0.9 0.8 2.3 2.5 1.5 0.4 -0.1 0.7 2.3 3.3 3.6 3.5 3.0
-0.8 -0.9 -0.9 -0.3 0.2 0.7 1.2 1.5 1.6 1.6 1.6 1.5 3.6 3.3 3.1 2.9 2.9 3.0 3.3 3.4 3.5 3.5 3.4 3.4 4.2 3.8 3.5 3.3 3.2 3.3 3.6 3.8 3.8 3.9 3.8 3.7

116 HEALTH CARE FINANCING REVIEW/Fall 1999/Volume 21, Number 1
Table 11
Quarterly Index Levels and Four-Quarter Moving-Average Percent Change in the Skilled Nursing Facility Input Price Index, by Expense Category: 1997-2001
Base YearWeights 1997 1997 1997 1998
Expense Category1 Price/Wage Variable CY 19922 Q2 Q3 Q4 Q1
Index LevelsTotal — 100.000 116.1 116.8 117.5 118.4
Compensation — 67.059 118.1 118.9 119.8 120.9 Wages and Salaries ECI-W/S: Nursing Homes (Private) 54.262 118.6 119.6 120.5 122.1 Employee Benefits ECI-Ben: Nursing Homes (Private) 12.797 116.0 115.9 116.8 115.9
Non-Medical Professional Fees ECI-Comp: Professional and Technical Workers (Private) 1.916 117.3 117.9 118.9 119.8
Utilities3 — 2.500 110.1 114.7 110.8 109.1 Other Expenses — 18.747 111.7 112.2 112.5 113.3
Other Products3 — 10.964 111.8 111.9 112.3 113.7 Other Services3 — 7.783 114.6 115.7 116.3 117.0
Capital-Related Expenses — 9.777 109.2 109.7 109.7 109.9 Depreciation3 — 5.915 115.7 116.7 117.2 118.1 Interest3 — 3.189 96.1 95.6 94.7 93.4 Other Capital-Related Expenses CPI(U)-Residential Rent 0.674 113.6 114.6 115.5 116.3
Four-Quarter Moving-Average Percent ChangeTotal — 100.000 2.4 2.4 2.4 2.4
Compensation — 67.059 2.7 2.7 2.7 2.7 Wages and Salaries ECI-W/S: Nursing Homes (Private) 54.262 2.9 3.1 3.1 3.2 Employee Benefits ECI-Benefits: Nursing Homes (Private) 12.797 1.7 1.3 1.0 0.8
Non-Medical Professional Fees ECI-Comp: Professional and Technical Workers (Private) 1.916 2.7 2.6 2.6 2.8
Utilities3 — 2.500 1.8 1.6 1.5 0.7 Other Expenses — 18.747 1.8 1.7 1.6 1.5
Other Products3 — 10.964 1.4 0.9 0.7 0.8 Other Services3 — 7.783 2.9 3.0 3.0 2.9
Capital-Related Expenses — 9.777 1.4 1.4 1.3 1.3 Depreciation3 — 5.915 2.6 2.6 2.6 2.5 Interest3 — 3.189 -1.4 -1.5 -1.7 -1.9 Other Capital-Related Expenses CPI(U)-Residential Rent 0.674 2.8 2.8 2.9 3.0
1 For data sources used to estimate the Input Price Index relative weights and choice of price proxies, refer to the May 12, 1998, Federal Register.2 Category weights may not sum to total because of rounding.3 Represents a subtotal. Detailed categories not shown are listed below by subtotal, detailed category, and base year weight: Utilities:Electricity (1.626), Fuels non-highway (0.332), and Water and Sewage (0.542). Other Products: Pharmaceuticals (2.531), Food (3.353), Chemicals (0.720), Rubber and Plastics (1.529), Paper Products (1.005), and Miscellaneous Products (1.826). Other Services: Telephone Services (0.385), Labor-Intensive Services (3.686), and Non-Labor Intensive Services (3.713). Depreciation: Building and Fixed Equipment (4.118) and Movable Equipment (1.797). Interest: Government and Non-Profit SNFs (1.658) and For-Profit SNFs (1.531).
NOTES: A dash (—) in the Price/Wage Variable column denotes a total or subtotal produced by adding two or more categories. CY is calendar year.Q designates quarter of year. ECI is Employment Cost Index. W/S is wages and salaries. Comp is compensation. CPI(U) represents Consumer Price Index for all urban consumers. SNFs is skilled nursing facilities. The four-quarter moving-average percent change for the quarter indicated by the column heading is the rate of change in the average index level for four quarters ending in that quarter over the same period of the previous year. The four-quarter moving-average index level for the quarter indicated by the column heading is computed by summing the index level for that quarter and the prior three quarters and dividing by 4. The process is repeated to compute the four-quarter moving-average index level for the same quarter a year ago. The average index level for the quarter indicated by the column heading is divided by the average index level of the same quarter a year ago, and the quotient is subtracted from 1 and multiplied by 100 to determine the four-quarter moving-average percent change in the index.
SOURCES: Health Care Financing Administration, Office of the Actuary: Data from the National Health Statistics Group. Second quarter 1999 forecasts were produced under contract to the Health Care Financing Administration by Standard & Poor's DRI.

HEALTH CARE FINANCING REVIEW/Fall 1999/Volume 21, Number 1 117
Table 11—Continued
Quarterly Index Levels and Four-Quarter Moving-Average Percent Change in the Skilled Nursing Facility Input Price Index, by Expense Category: 1997-2001
Forecast1998 1998 1998 1999 1999 1999 1999 2000 2000 2000 2000 2001Q2 Q3 Q4 Q1 Q2 Q3 Q4 Q1 Q2 Q3 Q4 Q1
119.6 120.5 120.9 122.1 123.1 124.1 124.9 125.9 126.8 127.6 128.4 129.5 121.9 122.8 123.5 125.1 126.2 127.2 128.3 129.4 130.4 131.2 132.3 133.6 123.1 124.3 124.8 126.6 127.7 128.9 129.9 131.2 132.2 133.0 134.1 135.6 116.8 116.6 117.7 118.8 119.9 120.3 121.5 121.8 123.1 123.5 124.9 125.3
120.9 122.2 123.0 123.3 124.5 125.7 126.6 127.7 128.6 129.8 130.7 131.9 110.6 114.7 110.1 109.7 111.2 115.5 112.1 112.5 113.7 118.2 114.7 115.2 114.9 115.5 115.6 116.0 116.7 117.4 117.9 118.5 119.2 119.8 120.3 121.0 116.9 117.5 117.5 117.8 118.2 119.0 119.6 120.3 121.0 121.4 122.1 122.9 117.6 118.3 118.8 119.6 120.9 121.9 122.8 123.8 124.8 125.9 126.8 127.8 110.4 110.9 110.9 111.1 111.6 112.0 112.1 112.2 112.7 113.1 113.2 113.3 118.5 119.4 119.9 120.7 121.1 122.0 122.4 123.2 123.6 124.4 124.8 125.6
94.0 93.4 92.5 91.3 92.1 91.3 90.5 89.2 90.0 89.3 88.6 87.4 117.2 118.3 119.4 120.3 121.1 122.4 123.7 124.5 125.4 126.6 127.5 128.2
2.6 2.8 2.9 3.0 3.0 3.0 3.1 3.1 3.1 3.1 2.9 2.9 2.9 3.0 3.1 3.2 3.3 3.4 3.6 3.6 3.6 3.5 3.3 3.2 3.4 3.5 3.6 3.7 3.7 3.7 3.8 3.8 3.7 3.6 3.4 3.3 0.8 0.8 0.7 1.2 1.6 2.3 2.9 2.9 2.9 2.8 2.7 2.7
3.0 3.2 3.3 3.3 3.3 3.1 2.9 3.1 3.2 3.3 3.4 3.3 0.7 0.5 -0.2 0.1 0.1 0.3 0.9 1.4 1.8 2.3 2.4 2.3 1.9 2.3 2.6 2.7 2.4 2.1 1.9 1.8 2.0 2.1 2.1 2.1 1.8 3.0 4.0 4.5 3.6 2.6 1.9 1.6 1.9 2.1 2.2 2.1 2.8 2.6 2.5 2.4 2.4 2.6 2.9 3.2 3.3 3.4 3.3 3.3 1.2 1.1 1.1 1.1 1.1 1.1 1.1 1.0 1.0 1.0 1.0 1.0 2.5 2.4 2.4 2.3 2.2 2.2 2.2 2.1 2.1 2.0 2.0 2.0
-2.1 -2.2 -2.3 -2.2 -2.2 -2.2 -2.1 -2.2 -2.2 -2.2 -2.2 -2.2 3.1 3.2 3.2 3.3 3.4 3.4 3.4 3.5 3.5 3.5 3.4 3.3

118 HEALTH CARE FINANCING REVIEW/Fall 1999/Volume 21, Number 1
Table 12
Quarterly Index Levels and Four-Quarter Moving-Average Percent Change of the Home Health Agency (HHA) Input Price Index, by Expense Category: 1997-2001
Base YearWeights 1997 1997 1997 1998
Expense Category1 Price/Wage Variable FY 19934 Q2 Q3 Q4 Q1
Index LevelsTotal — 100.000 112.0 113.1 113.9 114.6
Compensation2 — 77.668 112.0 113.2 114.2 115.1 Wages and Salaries2 HHA Occupational Wage Index5 64.226 112.2 113.6 114.6 115.5 Employee Benefits2 HHA Occupational Benefits Index5 13.442 110.7 111.5 112.3 112.9
Operations and Maintenance CPI(U)-Fuel and Other Utilities 0.832 107.8 109.4 108.4 106.0 Administrative and General3 — 9.569 113.3 114.1 114.5 115.2
Telephone CPI(U)-Telephone Services 0.725 106.2 105.7 105.6 105.8 Paper and Printing CPI(U)-Household Paper Products 0.529 114.4 114.2 114.6 115.6 Postage CPI(U)-Postage 0.724 110.3 110.3 110.3 110.3 Other Administrative Costs3 CPI(U)-Services 7.591 114.2 115.3 115.7 116.6
Transportation CPI(U)-Private Transportation 3.405 111.1 110.8 110.7 109.1 Capital-Related — 3.204 110.2 111.0 111.5 112.0
Insurance CPI(U)-Household Insurance 0.560 113.1 114.3 114.8 115.1 Fixed Capital CPI(U)-Owner's Equivalent Rent 1.764 113.6 114.6 115.6 116.4 Movable Capital PPI-Machinery and Equipment 0.880 101.8 101.6 101.3 101.2
Other Expenses3 CPI(U)-All Items less Food and Energy 5.322 112.1 112.4 113.1 113.9
Four-Quarter Moving-Average Percent ChangeTotal — 100.000 2.7 2.8 2.9 2.9
Compensation2 — 77.668 2.8 2.9 3.1 3.3 Wages and Salaries2 HHA Occupational Wage Index5 64.226 3.0 3.1 3.3 3.5 Employee Benefits2 HHA Occupational Benefits Index5 13.442 1.6 1.7 2.0 2.2
Operations and Maintenance CPI(U)-Fuel and Other Utilities 0.832 3.6 3.3 2.5 0.9 Administrative and General3 — 9.569 2.8 2.7 2.6 2.4
Telephone CPI(U)-Telephone Services 0.725 2.2 1.9 1.5 0.9 Paper and Printing CPI(U)-Household Paper Products 0.529 1.2 0.6 0.5 0.7 Postage CPI(U)-Postage 0.724 0.0 0.0 0.0 0.0 Other Administrative Costs3 CPI(U)-Services 7.591 3.2 3.1 3.0 2.9
Transportation CPI(U)-Private Transportation 3.405 2.3 1.7 0.7 -0.6 Capital-Related — 3.204 2.0 2.0 2.0 2.0
Insurance CPI(U)-Household Insurance 0.560 3.0 3.0 2.6 2.6 Fixed Capital CPI(U)-Owner's Equivalent Rent 1.764 2.9 2.9 2.9 3.0 Movable Capital PPI-Machinery and Equipment 0.880 -0.5 -0.5 -0.5 -0.5
Other Expenses3 CPI(U)-All Items less Food and Energy 5.322 2.6 2.5 2.4 2.3
1 For data sources used to estimate the Input Price Index relative weights and choice of price proxies, refer to the July 1, 1996, Federal Register.2 Includes allocated Contract Services' Labor.3 Includes allocated Contract Services' Non-Labor.4 Category weights may not sum to total because of rounding.5 The HHA Occupational Wage and Occupational Benefit Indexes are computed as weighted-averages of five ECI categories (ECI for Civilian Hospital Workers and four ECI occupational categories).
NOTES: A dash (—) in the Price/Wage Variable column denotes a total or subtotal produced by adding two or more categories. FY is fiscal year.Q designates quarter of year. CPI(U) represents Consumer Price Index for all urban consumers. PPI is Producer Price Index. ECI is Employment Cost Index. The four-quarter moving-average percent change for the quarter indicated by the column heading is the rate of change in the average index level for four quarters ending in that quarter over the same period of the previous year. The four-quarter moving-average index level for the quarter indicated by the column heading is computed by summing the index level for that quarter and the prior three quarters and dividing by 4. The process is repeated to compute the four-quarter moving-average index level for the same quarter a year ago. The average index level for the quarter indicated by the column heading is divided by the average index level of the same quarter a year ago, and the quotient is subtracted from 1 and multiplied by 100 to determine the four-quarter moving-average percent change in the index.
SOURCES: Health Care Financing Administration, Office of the Actuary: Data from the National Health Statistics Group. Second quarter 1999 forecasts were produced under contract to the Health Care Financing Administration by Standard & Poor's DRI.
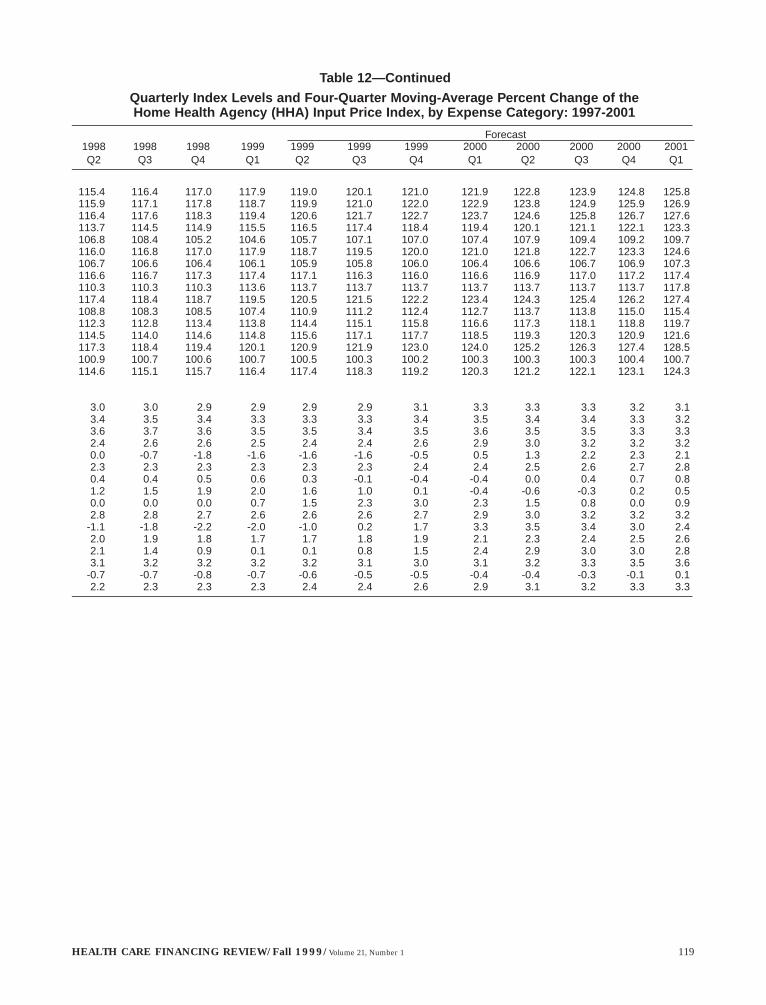
HEALTH CARE FINANCING REVIEW/Fall 1999/Volume 21, Number 1 119
Table 12—Continued
Quarterly Index Levels and Four-Quarter Moving-Average Percent Change of theHome Health Agency (HHA) Input Price Index, by Expense Category: 1997-2001
Forecast1998 1998 1998 1999 1999 1999 1999 2000 2000 2000 2000 2001Q2 Q3 Q4 Q1 Q2 Q3 Q4 Q1 Q2 Q3 Q4 Q1
115.4 116.4 117.0 117.9 119.0 120.1 121.0 121.9 122.8 123.9 124.8 125.8 115.9 117.1 117.8 118.7 119.9 121.0 122.0 122.9 123.8 124.9 125.9 126.9 116.4 117.6 118.3 119.4 120.6 121.7 122.7 123.7 124.6 125.8 126.7 127.6 113.7 114.5 114.9 115.5 116.5 117.4 118.4 119.4 120.1 121.1 122.1 123.3 106.8 108.4 105.2 104.6 105.7 107.1 107.0 107.4 107.9 109.4 109.2 109.7 116.0 116.8 117.0 117.9 118.7 119.5 120.0 121.0 121.8 122.7 123.3 124.6 106.7 106.6 106.4 106.1 105.9 105.8 106.0 106.4 106.6 106.7 106.9 107.3 116.6 116.7 117.3 117.4 117.1 116.3 116.0 116.6 116.9 117.0 117.2 117.4 110.3 110.3 110.3 113.6 113.7 113.7 113.7 113.7 113.7 113.7 113.7 117.8 117.4 118.4 118.7 119.5 120.5 121.5 122.2 123.4 124.3 125.4 126.2 127.4 108.8 108.3 108.5 107.4 110.9 111.2 112.4 112.7 113.7 113.8 115.0 115.4 112.3 112.8 113.4 113.8 114.4 115.1 115.8 116.6 117.3 118.1 118.8 119.7 114.5 114.0 114.6 114.8 115.6 117.1 117.7 118.5 119.3 120.3 120.9 121.6 117.3 118.4 119.4 120.1 120.9 121.9 123.0 124.0 125.2 126.3 127.4 128.5 100.9 100.7 100.6 100.7 100.5 100.3 100.2 100.3 100.3 100.3 100.4 100.7 114.6 115.1 115.7 116.4 117.4 118.3 119.2 120.3 121.2 122.1 123.1 124.3
3.0 3.0 2.9 2.9 2.9 2.9 3.1 3.3 3.3 3.3 3.2 3.1 3.4 3.5 3.4 3.3 3.3 3.3 3.4 3.5 3.4 3.4 3.3 3.2 3.6 3.7 3.6 3.5 3.5 3.4 3.5 3.6 3.5 3.5 3.3 3.3 2.4 2.6 2.6 2.5 2.4 2.4 2.6 2.9 3.0 3.2 3.2 3.2 0.0 -0.7 -1.8 -1.6 -1.6 -1.6 -0.5 0.5 1.3 2.2 2.3 2.1 2.3 2.3 2.3 2.3 2.3 2.3 2.4 2.4 2.5 2.6 2.7 2.8 0.4 0.4 0.5 0.6 0.3 -0.1 -0.4 -0.4 0.0 0.4 0.7 0.8 1.2 1.5 1.9 2.0 1.6 1.0 0.1 -0.4 -0.6 -0.3 0.2 0.5 0.0 0.0 0.0 0.7 1.5 2.3 3.0 2.3 1.5 0.8 0.0 0.9 2.8 2.8 2.7 2.6 2.6 2.6 2.7 2.9 3.0 3.2 3.2 3.2
-1.1 -1.8 -2.2 -2.0 -1.0 0.2 1.7 3.3 3.5 3.4 3.0 2.4 2.0 1.9 1.8 1.7 1.7 1.8 1.9 2.1 2.3 2.4 2.5 2.6 2.1 1.4 0.9 0.1 0.1 0.8 1.5 2.4 2.9 3.0 3.0 2.8 3.1 3.2 3.2 3.2 3.2 3.1 3.0 3.1 3.2 3.3 3.5 3.6
-0.7 -0.7 -0.8 -0.7 -0.6 -0.5 -0.5 -0.4 -0.4 -0.3 -0.1 0.1 2.2 2.3 2.3 2.3 2.4 2.4 2.6 2.9 3.1 3.2 3.3 3.3

120 HEALTH CARE FINANCING REVIEW/Fall 1999/Volume 21, Number 1
Table 13
Quarterly Index Levels and Four-Quarter Moving-Average Percent Change in the HCFA Medicare Economic Index (MEI) with DRI Forecast Assumptions,
by Expense Category: 1997-2001
Base YearWeights 1997 1997 1997 1998
Expense Category1 Price/Wage Variable CY 19962 Q2 Q3 Q4 Q1
Index LevelsTotal — 100.000 101.8 102.3 103.3 104.1
Physician Earnings — 54.460 102.0 102.4 103.8 104.6 Wages and Salaries AHE-Private3 44.197 102.2 102.6 104.4 105.2 Benefits ECI-Benefits, Private3 10.263 100.9 101.1 101.6 101.8
Practice Expenses — 45.540 101.6 102.2 102.6 103.4 Non-Physician Compensation — 16.812 101.8 102.4 103.1 103.8
Wages and Salaries — 12.424 102.0 102.8 103.5 104.3 Professional/Technical ECI-W/S: Professional/Technical3 5.662 101.7 102.5 103.0 103.6 Managers ECI-W/S: Administrative/Managerial3 2.410 102.5 103.4 104.8 106.1 Clerical ECI-W/S: Clerical3 3.830 102.1 102.8 103.3 104.0 Services ECI-W/S: Service Occupations3 0.522 102.2 103.8 104.5 105.0
Employee Benefits ECI-Benefits, Private White Collar3 4.388 101.1 101.1 101.9 102.5 Office Expenses CPI(U)-Housing 11.581 102.2 103.2 103.2 103.9 Medical Materials/Supplies PPI-Drugs/PPI-Surgical/CPI-Medical Supplies 4.516 102.7 103.0 103.7 106.8 Professional Liability Insurance HCFA-Professional Liability Premiums 3.152 97.5 98.2 98.7 98.9 Medical Equipment PPI-Medical Instruments/Equipment 1.878 98.8 99.1 98.5 98.0 Other Professional Expenses — 7.601 102.0 102.1 102.7 103.0
Automobile CPI(U)-Private Transportation 1.300 100.7 100.4 100.3 98.8 All Other CPI(U)-All Items less Food/Energy 6.301 102.3 102.5 103.1 103.9
Four-Quarter Moving-Average Percent ChangeTotal — 100.000 2.4 2.3 2.2 2.2
Physician Earnings — 54.460 2.4 2.5 2.5 2.5 Wages and Salaries AHE-Private3 44.197 2.7 2.8 2.9 2.9 Benefits ECI-Benefits, Private3 10.263 1.0 1.0 1.1 1.1
Practice Expenses — 45.540 2.3 2.0 1.9 1.9 Non-Physician Compensation — 16.812 2.1 2.0 2.1 2.3
Wages and Salaries — 12.424 2.3 2.3 2.4 2.6 Professional/Technical ECI-W/S: Professional/Technical3 5.662 2.0 1.9 2.0 2.3 Managers ECI-W/S: Administrative/Managerial3 2.410 3.2 3.0 3.2 3.4 Clerical ECI-W/S: Craft3 3.830 2.3 2.3 2.4 2.5 Services ECI-W/S: Service Occupations3 0.522 2.4 2.9 3.0 3.2
Employee Benefits ECI-Benefits, Private White Collar3 4.388 1.3 1.1 1.2 1.3 Office Expenses CPI(U)-Housing 11.581 2.9 2.7 2.6 2.4 Medical Materials/Supplies PPI-Drugs/PPI-Surgical/CPI-Medical Supplies 4.516 4.5 3.4 2.9 2.7 Professional Liability Insurance HCFA-Professional Liability Premiums 3.152 -0.9 -1.6 -2.0 -1.1 Medical Equipment PPI-Medical Instruments/Equipment 1.878 0.1 -0.5 -1.3 -1.1 Other Professional Expenses — 7.601 2.5 2.3 2.1 1.8
Automobile CPI(U)-Private Transportation 1.300 2.3 1.7 0.7 -0.6 All Other CPI(U)-All Items less Food/Energy 6.301 2.6 2.5 2.4 2.3
1 For data sources used to estimate the Input Price Index relative weights and choice of price proxies, refer to the November 2, 1998, Federal Register.2 Category weights may not sum to total because of rounding.3 Series are adjusted for productivity using 10-year moving average of output per hour for the non-farm business sector. All series in the compensationportion of the MEI are adjusted for productivity so both economywide productivity and physician practice productivity are not included in the update.
NOTES: A dash (—) in the Price/Wage Variable column denotes a total or subtotal produced by adding two or more categories. HCFA is Health Care Financing Administration. CY is calendar year. Q designates quarter of year. AHE is average hourly earnings. ECI is Employment Cost Index. W/S is wages and salaries. CPI(U) represents Consumer Price Index for all urban consumers. PPI is Producer Price Index. The four-quarter moving-average percent change for the quarter indicated by the column heading is the rate of change in the average index level for four quarters ending in that quarter over the same period of the previous year. The four-quarter moving-average index level for the quarter indicated by the column heading is computed by summing the index level for that quarter and the prior three quarters and dividing by 4. The process is repeated to compute the four-quarter moving-average index level for the same quarter a year ago. The average index level for the quarter indicated by the column heading is divided by the average index level of the same quarter a year ago, and the quotient is subtracted from 1 and multiplied by 100 to determine the four-quarter moving-average percent change in the index.
SOURCES: Health Care Financing Administration, Office of the Actuary: Data from the National Health Statistics Group. Second quarter 1999 forecasts were produced under contract to HCFA by Standard & Poor's DRI.

HEALTH CARE FINANCING REVIEW/Fall 1999/Volume 21, Number 1 121
Table 13—Continued
Quarterly Index Levels and Four-Quarter Moving-Average Percent Change in the HCFA Medicare Economic Index (MEI) with DRI Forecast Assumptions,
by Expense Category: 1997-2001
Forecast1998 1998 1998 1999 1999 1999 1999 2000 2000 2000 2000 2001Q2 Q3 Q4 Q1 Q2 Q3 Q4 Q1 Q2 Q3 Q4 Q1
104.4 104.9 105.7 106.3 106.8 107.3 108.1 108.8 109.2 109.7 110.4 111.1 104.7 105.0 106.2 106.8 107.0 107.5 108.5 109.0 109.3 109.6 110.5 111.0 105.3 105.6 107.0 107.7 107.9 108.3 109.5 110.0 110.3 110.6 111.6 112.0 102.3 102.6 102.8 103.3 103.4 103.9 104.2 104.8 105.1 105.6 105.9 106.6 104.1 104.8 105.1 105.7 106.4 107.1 107.6 108.4 109.1 109.8 110.2 111.1 104.3 105.1 105.3 106.0 106.5 107.2 107.6 108.2 108.7 109.2 109.6 110.2 104.9 105.8 106.0 106.7 107.3 108.0 108.4 109.1 109.6 110.2 110.6 111.2 104.2 105.1 105.5 106.2 106.6 107.2 107.6 108.2 108.7 109.4 109.6 110.1 106.5 107.8 107.2 108.2 108.8 109.8 110.3 111.2 111.8 112.4 113.3 114.0 104.8 105.4 105.8 106.3 107.3 107.9 108.3 108.9 109.3 109.9 110.2 110.8 105.4 106.2 106.5 107.2 108.1 108.8 109.6 110.1 110.7 111.5 112.1 112.5 102.8 103.2 103.5 104.1 104.1 104.7 105.0 105.8 106.1 106.5 106.8 107.7 104.7 105.6 105.6 106.2 107.1 108.1 108.4 109.4 110.2 111.4 111.6 112.7 111.1 111.6 112.4 113.2 114.0 114.4 115.2 116.1 116.8 117.0 117.8 119.0
96.5 97.1 97.6 98.2 98.7 99.3 99.9 100.6 101.2 101.8 102.4 103.1 97.6 97.9 98.1 98.4 98.5 98.7 98.8 99.1 99.2 99.2 99.4 100.0
103.5 103.8 104.3 104.6 106.0 106.7 107.6 108.4 109.3 110.0 111.0 111.9 98.6 98.2 98.3 97.4 100.5 100.8 101.9 102.1 103.1 103.2 104.3 104.6
104.5 105.0 105.6 106.1 107.1 107.9 108.7 109.7 110.5 111.4 112.3 113.4
2.4 2.5 2.5 2.4 2.3 2.2 2.2 2.3 2.3 2.3 2.2 2.2 2.6 2.6 2.5 2.4 2.3 2.2 2.2 2.2 2.2 2.1 2.0 2.0 2.9 2.9 2.8 2.7 2.5 2.5 2.4 2.4 2.3 2.2 2.1 2.0 1.2 1.3 1.3 1.4 1.3 1.2 1.3 1.3 1.4 1.5 1.6 1.7 2.1 2.3 2.4 2.4 2.4 2.3 2.3 2.4 2.4 2.5 2.5 2.4 2.4 2.6 2.5 2.4 2.3 2.1 2.1 2.1 2.1 2.1 2.0 1.9 2.7 2.9 2.7 2.6 2.5 2.3 2.3 2.3 2.2 2.2 2.1 2.0 2.5 2.6 2.5 2.5 2.5 2.3 2.2 2.1 2.0 2.0 1.9 1.9 3.6 4.0 3.6 3.1 2.7 2.1 2.2 2.4 2.6 2.7 2.6 2.6 2.5 2.6 2.5 2.5 2.4 2.4 2.3 2.4 2.3 2.1 2.0 1.8 3.3 2.9 2.6 2.4 2.3 2.3 2.5 2.7 2.6 2.6 2.4 2.3 1.4 1.8 1.8 1.7 1.6 1.5 1.5 1.5 1.6 1.7 1.7 1.7 2.3 2.3 2.3 2.3 2.3 2.3 2.4 2.6 2.7 2.9 3.0 3.0 4.4 6.0 7.4 7.7 6.3 4.8 3.4 2.5 2.5 2.4 2.4 2.4
-0.8 -0.5 -0.5 -1.0 -0.2 0.7 1.6 2.3 2.4 2.4 2.5 2.5 -1.0 -1.1 -0.8 -0.6 -0.1 0.5 0.7 0.8 0.7 0.6 0.6 0.7 1.7 1.6 1.5 1.6 1.8 2.1 2.5 3.0 3.1 3.2 3.2 3.1
-1.1 -1.8 -2.2 -2.0 -1.0 0.2 1.7 3.3 3.5 3.4 3.0 2.4 2.2 2.3 2.3 2.3 2.4 2.4 2.6 2.9 3.1 3.2 3.3 3.3