
Health Care Finance, the Performance of Public … Care Finance, the Performance of Public Hospitals...
14
European Research Studies, Volume XII, Issue (4), 2009 *Panayiotis Curtis, Associate Professor, Department of Accounting, Technological Educational Institute of Chalkida, e-mail: [email protected] ** Theodore A. Roupas, Part-time Assistant Professor,University of Patras, Department of Business Administration, P.C. 265 00 Rio, Patras, Greece, e-mail: [email protected] Health Care Finance, the Performance of Public Hospitals and Financial Statement Analysis Panayiotis Curtis* Theodore A. Roupas** Abstract Regional form of Organization of the health care that are called today DyPE, have as a main goal to promote more rational resource allocation through decentralization in the decision making process. The concern for more effective and efficient use of resources devoted into the health care sector renders hospitals a critical vehicle of the quest for superior economic performance, especially if we take into our consideration their mounting over time deficits. Economic performance is primarily traced through a set of specific financial ratios, which embrace important elements that constitute the substance of the financial well-being of hospitals as economic units. An array of financial ratios is critically reviewed and a combination of them is proposed as a means of effective financial management. The later is necessary to ameliorate the funding strain imposed on the health care system and especially on hospitals. The financial performance is determined by the return on capital (profitability) in connection with the risk involved. Both factors determine the value created, which in turn affects the amount of financing attracted in the sector. The financial information available to the supervising regional bodies (DyPE), don’t considered sufficient for their management to assess financial management of hospitals effectively. The lack of the appropriate economic data is due to the fact that double entry accounting has not yet fully adopted by the economic units that report to the corresponding DyPE. So, double entry accounting is prerequisite for reporting and monitoring acceptable financial performance. The later is vital in securing that the financial needs of the health sector that are growing at an ever accelerating pace, are met. Key Words: Hospitals, Financial Management, Ratio Analysis, Economic Performance, Double Entry Accounting 1. Introduction What is reflected on the health system -and does not seem to be easily reversible- is the discrepancy between expenses and available resources. The rising trend of costs seems to be primarily due to, apart from the deterioration of demographics, the introduction of modern technology, bureaucracy, etc., and the ineffective financial management of hospital units. The problem is complex and multi-dimensional, and calls for large-scale and long-term structural changes in order to be solved, given that hospital units are the top and largest national business.
Transcript of Health Care Finance, the Performance of Public … Care Finance, the Performance of Public Hospitals...

European Research Studies, Volume XII, Issue (4), 2009
*Panayiotis Curtis, Associate Professor, Department of Accounting, Technological Educational Institute of Chalkida, e-mail: [email protected]
** Theodore A. Roupas, Part-time Assistant Professor,University of Patras, Department of
Business Administration, P.C. 265 00 Rio, Patras, Greece, e-mail: [email protected]
Health Care Finance, the Performance of Public Hospitals and
Financial Statement Analysis Panayiotis Curtis* Theodore A. Roupas**
Abstract
Regional form of Organization of the health care that are called today DyPE, have as a main goal to promote more rational resource allocation through decentralization in the decision
making process. The concern for more effective and efficient use of resources devoted into
the health care sector renders hospitals a critical vehicle of the quest for superior economic performance, especially if we take into our consideration their mounting over time deficits.
Economic performance is primarily traced through a set of specific financial ratios, which
embrace important elements that constitute the substance of the financial well-being of hospitals as economic units. An array of financial ratios is critically reviewed and a
combination of them is proposed as a means of effective financial management. The later is
necessary to ameliorate the funding strain imposed on the health care system and especially on hospitals. The financial performance is determined by the return on capital (profitability)
in connection with the risk involved. Both factors determine the value created, which in turn affects the amount of financing attracted in the sector. The financial information available
to the supervising regional bodies (DyPE), don’t considered sufficient for their management
to assess financial management of hospitals effectively. The lack of the appropriate economic data is due to the fact that double entry accounting has not yet fully adopted by the economic
units that report to the corresponding DyPE. So, double entry accounting is prerequisite for
reporting and monitoring acceptable financial performance. The later is vital in securing that the financial needs of the health sector that are growing at an ever accelerating pace,
are met.
Key Words: Hospitals, Financial Management, Ratio Analysis, Economic Performance,
Double Entry Accounting
1. Introduction
What is reflected on the health system -and does not seem to be easily
reversible- is the discrepancy between expenses and available resources. The rising
trend of costs seems to be primarily due to, apart from the deterioration of
demographics, the introduction of modern technology, bureaucracy, etc., and the
ineffective financial management of hospital units. The problem is complex and
multi-dimensional, and calls for large-scale and long-term structural changes in
order to be solved, given that hospital units are the top and largest national business.

European Research Studies, Volume XII, Issue (4), 2009200
The legislative intervention of establishing 17 Health Regional Councils
(PESY) in 2001 and the corrective legislation renaming and merging them into 7
Health Regional Administrations (DYPE) in 2005 do not seem to have contributed
substantially to more efficient financial management of hospitals. This ambitious
project with the segmentation of 140 hospitals and 95 welfare agencies per
geographic region remains a theoretic administration model, which has failed to
achieve even minimum operational and economic efficiency.
Since 2001, PESY or DYPE are supposed to have assumed systematic
control of hospital finances at regional level (budget approvals, amendments and
execution), assets monitoring and management, introduction and roll-out of the
double-entry system and analytical accounting, integrated IT systems for the
implementation of the double-entry system, financial control and statistics on a
single basis with inter-clinic and inter-hospital comparisons, collection of annual
action plans of individual hospitals with target growth analysis and financing
proposals for new programs, systematic supplies control (single procedures aimed at
higher quality and lower costs) and on-site control of the above.
Reality, however, has hardly vindicated the initial plans. Hospitals and
DYPE are restricted by the central administration and little room for actions. The
Ministry of Health is not limited to a merely executive role but rather a tightly
bureaucratic role. The staffing, opening and closing of clinics, industrial relations,
high technology equipment and the recent establishment of the Health Supplies
Committee (EPY) are all subject to decisions of the Ministry of Health. All bills
following Law 2889/01 and Law 3329/05 provide for ministerial decisions and
presidential decrees, i.e. Ministerial supervision and control. Nothing is judged by
the outcome but based on central bureaucratic intervention. Thus, DYPE are formal
administrative units for hospital control and coordination without having a say in
any major operating issue.
2. Hospitals
The questionable viability of the Health System in our country is reflected in
the present economic situation of the Public Hospitals. The total operating cost of
hospital units has been estimated to be made up of payroll expenses for staff of all
categories by approx. 65%, considered to be largely inelastic, and of operating costs
by 35% (N. Polyzos, 2007). The latter are considered to be elastic in their
overwhelming majority, whereof the key characteristic are supplies of all kinds
(medicines, medical materials, chemical reagents, etc.). In Table 1 (expenses and
revenues of hospitals), the expenses column does not include staff payroll which
accounts for the largest part, because they are paid directly by the state budget.
According to annual report data of the Ministry of Finance, payroll expenses for
NHS hospitals amounted to € 2.24 billion at the end of 2006. Of the expenses shown
in Table 1, operating costs account for 82.19% of total hospital costs.

Health Care Finance, the Performance of Public Hospitals and Financial Statement
Analysis
201
Chart 1
PUBLIC HOSPITALS DEBT ANALYSIS FROM 1-1-2005 TO 30-9-2007
MEDICAL MATERIALS
28%
MEDICINES
43%
ORTHOPEDICS
10%
REAGENTS
12%
OTHER
7%
Source: Ministry of Health and Social Solidarity
(PER CATEGORY) PUBLIC HOSPITALS DEBT ANALYSIS FROM 01-01-2005
TO 31-12-2007
Hospital supplies make up the largest part of operating (elastic) costs and
are the key source of debts. The debt distribution at the end of 2007 was as follows:
43% medicines, 28% medical materials, 12% chemical reagents, 10% orthopaedic
materials and 8% other, according to the analysis of Chart 1.
One of the core reasons why hospital debts are generated (estimated1 at 35%
of total debt) is that hospitals do not pay their suppliers immediately; as result not
only do they fail to benefit from any price reductions on products during
negotiations, but are also further charged with the cost of payment delays.
This lack of liquidity is also attributed to the difference between actual and
agreed hospitalization fees paid by insurance funds (N. Polyzos 1999, Yfantorpoulos
2006). The actual daily operating cost per hospitalization day has been estimated to
1 General Accounting Office

European Research Studies, Volume XII, Issue (4), 2009202
be three times higher than the agreed hospitalization fee (K. Souliotis., G.
Kyriakopoulos 2001, N. Polyzos 2007).
An additional problem is the long delayed collection of
hospitalization fees from insurance funds, which are the key revenue of the
hospital budgets (Table 1). A large part of such hospitalization fees are
collected in instalments in different financial periods and up to 90% of the
total. The remaining 10 % is not paid to set off the unpaid obligations of the
central government to such funds. The above are structural operating
problems of the broader health system and hence hospitals.
Table 1
Revenues – Expenses of Hospitals per category (in € million)
Potent
ial
Cash
Balan
ce
31.12.
06
Hospita
li-
zation
fees
State
Budget
subsidy
Grants
from
Public Inv.
Programs
Return
on assets
Other
reven
ues
Total
reven
ues
233.32 2,948.4
0104.80 87.71 20.93 345.20
3,740.3
6
RE
VE
NU
ES
6.24% 78.83% 2.80% 2.34% 0.56% 9.23%
Opera
ting
costs
Purcha
ses of
propert
y
Building
improve
ments
Equipment Other
expenses
_ Total
expen
se
3,074.
352.28 86.21 168.37 409.15 3,740.36
EX
PE
NS
ES
82.19
%0.06% 2.30% 4.50% 10.95%
Source: Social Budget 2007
To alleviate the deficits problem, the state has performed three settlements
of public hospitals debts to suppliers in the past decade, in 1997 (€ 578 million),
2001 (€ 1.02 billion) and 2004 (€ 2.5 billion). These amounts are paid from the state
budget, on top of the payroll cost, annually. According to data of the Ministry of
Health as at 30.09.2007, amounts due amounted to € 3.15 billion. This amount had
accumulated since 01.01.2005 following the last settlement of € 2.5 billion. It is
evident that it is a problem reproduced immediately after the solution found by the

Health Care Finance, the Performance of Public Hospitals and Financial Statement
Analysis
203
central administration at the expense of the state budget. Based on available data, it
is also manifest that it is reproduced at an increasing rate. While debts increased by
€ 56.80 million per month between 2001 and 2004, they have risen by € 95.45 per
month since 2004, i.e. 70% higher pro rata (Table 2).
Table 2
Debt Settlement
2004 Settlement Amount Months Amount per
month
€ 2.5 bn. 44 € 56.80 mil.
Accumulated
deficit 2007
Amount Months Amount per
month
€ 3.15 bn 33 € 95.45 mil.
Such increase does not signal any aggravation in the system operation,
because it mainly comes from increases in medicine prices, which is the highest
expense, and VAT rate increase by one per cent on almost all products. However,
another settlement will not only perpetuate the problem, but also aggravate it
immensely.
Unpaid debts of hospitals as at 31-12-07 were as follows:
PUBLIC HOSPITALS DEBT ANALYSIS PER CATEGORY AND HEALTH REGION
D.Y.PE. ( 31-12-2007)
0,00
50.000.000,00
100.000.000,00
150.000.000,00
200.000.000,00
250.000.000,00
300.000.000,00
350.000.000,00
400.000.000,00
450.000.000,00
1st DYPE AT TICA 2nd DYPE PIRAEUS & AEGEAN 3rd DYPE M ACEDONIA 4th DYPE MACEDONIA & THRACE 5th DYPE T HESSALY & STEREA
ELLADA
6th DYPE PELOPONESE, IONIAN
ISLANDS, EPIRUS & WEST ERN
GREECE
7th DYPE CRET E
MEDICAL MATERIAL MEDICINES ORTHOPEDIC MATERIAL REAGENTS OTHER

European Research Studies, Volume XII, Issue (4), 2009204
3. Ratio Analysis of Financial Statements - Review of the Literature
Ratios have been used for a long time in the analysis of financial statements.
Ratios are simple and readily comprehensible measures of financial performance
that are calculated using data from published financial statements. Their popularity
is due to their simplicity in measurement that expresses valid and very important
relations among the economic data of the companies involved. “Financial ratio
analysis is an accepted approach to hospital performance evaluation” (Zeller et al
1996, 161). The late adoption of ratios in the analysis of the financial soundness of
hospitals at the end of 1970s was attributed to “the possibility that financial
pressures to the hospital industry were not as pervasive as they were in other
industries and the lack of availability of comparable financial statement
information” (Watkins 2000, 75).
Ratios are used in tracing specific aspects of financial performance and
especially in estimating liquidity, evaluating profitability, performing competitor
analysis and forecasting corporate bankruptcy.
Financial ratios as a means of analysis were used initially in the US. In
1985 Cleverley and Rohleder examined the financial aspects of 29 ratios based on
data gathered by Health-care Financial Management Association for the period
1978-80. They reached the conclusion that all these ratios refer to ten dimensions of
financial performance related to long term, as well as to short-term period. Counte et
al. (1988) three year later, applied the factor analysis to data from homogeneous
group of hospitals and reached the conclusion that 25 ratios reflecting five (5)
dimensions of financial health are suitable for that reason. The dimensions concern
liquidity, debt structure, profitability, cash flow management and utilization of
assets. Liquidity, debt structure and cash flow management determine risk. Assets
utilization affects profitability. Profitability and risk determine value, which in turn
is the ultimate goal of management and the final arbiter of successful strategy. So
these factors are means of achieving the predetermined goal of value creation that
keep stakeholders happy and secure the survival of the economic unit.
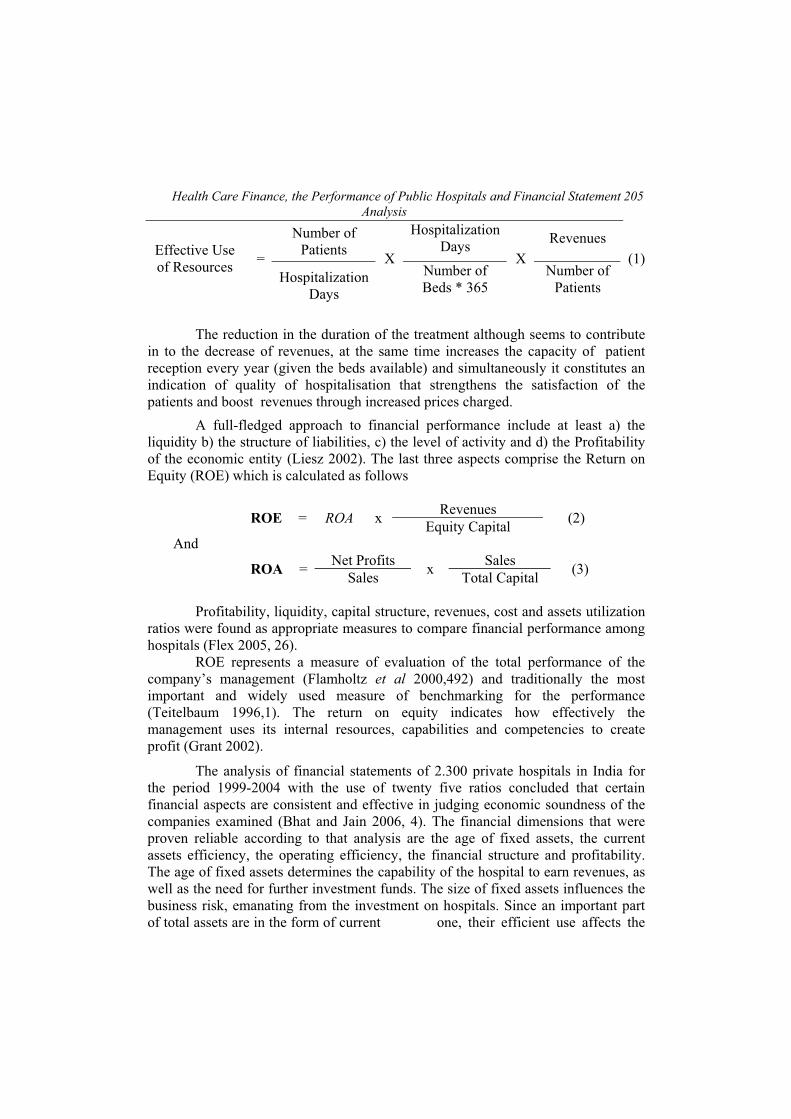
Hospitals are considered as capital intensive with regard to the configuration
of their assets that appear in the balanced sheet and labour intensive with regard to
their daily operations. The effectiveness with which their assets are used, determines
their economic viability. Revenues are determined by the average duration of
hospitalisation each patient, the number of the total beds available at the hospital
that are utilized on daily basis through out the year and the revenues per patient
received.
Health Care Finance, the Performance of Public Hospitals and Financial Statement
Analysis
205
Number of
Patients
Hospitalization
Days Revenues
Effective Use
of Resources =
Hospitalization
Days
XNumber of
Beds * 365
XNumber of
Patients
(1)
The reduction in the duration of the treatment although seems to contribute
in to the decrease of revenues, at the same time increases the capacity of patient
reception every year (given the beds available) and simultaneously it constitutes an
indication of quality of hospitalisation that strengthens the satisfaction of the
patients and boost revenues through increased prices charged.
A full-fledged approach to financial performance include at least a) the
liquidity b) the structure of liabilities, c) the level of activity and d) the Profitability
of the economic entity (Liesz 2002). The last three aspects comprise the Return on
Equity (ROE) which is calculated as follows
RevenuesROE = ROA x
Equity Capital (2)
And
Net Profits SalesROA =
Salesx
Total Capital (3)
Profitability, liquidity, capital structure, revenues, cost and assets utilization
ratios were found as appropriate measures to compare financial performance among
hospitals (Flex 2005, 26).
ROE represents a measure of evaluation of the total performance of the
company’s management (Flamholtz et al 2000,492) and traditionally the most
important and widely used measure of benchmarking for the performance
(Teitelbaum 1996,1). The return on equity indicates how effectively the
management uses its internal resources, capabilities and competencies to create
profit (Grant 2002).
The analysis of financial statements of 2.300 private hospitals in India for
the period 1999-2004 with the use of twenty five ratios concluded that certain
financial aspects are consistent and effective in judging economic soundness of the
companies examined (Bhat and Jain 2006, 4). The financial dimensions that were
proven reliable according to that analysis are the age of fixed assets, the current
assets efficiency, the operating efficiency, the financial structure and profitability.
The age of fixed assets determines the capability of the hospital to earn revenues, as
well as the need for further investment funds. The size of fixed assets influences the
business risk, emanating from the investment on hospitals. Since an important part
of total assets are in the form of current one, their efficient use affects the

European Research Studies, Volume XII, Issue (4), 2009206
return on capital. The amount of current assets in conjunction with short term
liabilities defines liquidity. Asset turnover measures how effectively total assets are
used to generate revenues. As concern as the dimension of financial structure it has
to do with the debt to equity ratio. It affects the return to equity capital and financial
risk. Finally, profitability refers to the result of income statement. Low profitability
and unsatisfactory operating efficiency in the sample of private hospitals of India,
don’t allow them to serve debt cost. As a result it increases the risk emanating from
debt financing and creates impediments in attracting equity capital, which seeks
value for the amount of money invested. The difficulty in attracting equity capital,
that doesn’t carry interest expenses, is of strategic importance for hospitals. That is
why is so crucial the effective and efficient use of the invested funds (Bhat and Jain
2006, 4).
A composite indicator that is particularly useful for the analysis of the
financial statements of hospitals is the following one (Cleverley and Associates,
2004).
Net profit
margin-4.0
cash-
50
financing with
debt%-50
Average age of
hospitals-9.0
4.0
+
50
+
50
+
9.0
(4)
This indicator includes a measure of efficiency with respect to sales, another
assessing liquidity, a third estimating the capital structure and finally one reflecting
the age of the fixed assets. When the sum is bigger than three (3), it is considered
excellent, between zero (0) and three (3), it is considered good, from zero (0) to
minus two (-2) is characterized as bearable and in case it is smaller than minus two
(-2), it is considered as bad (The Financial Effect 2005, 5).
These areas of operation may determine the "core competencies" which can
apply to different activities. To the extent that they are unique, valuable, difficult or
costly to be imitated, they create a sustainable competitive advantage and lead to
superior profitability. Superior performance lasts only if a company is positioned
accordingly, given its strength and weakness, in order to exploit opportunities and
neutralize or abate the vigor of threats (SWOT analysis) emanating from the external
environment. The degree of attractiveness of the industry is determined by the
degree of which five forces affect the competition.
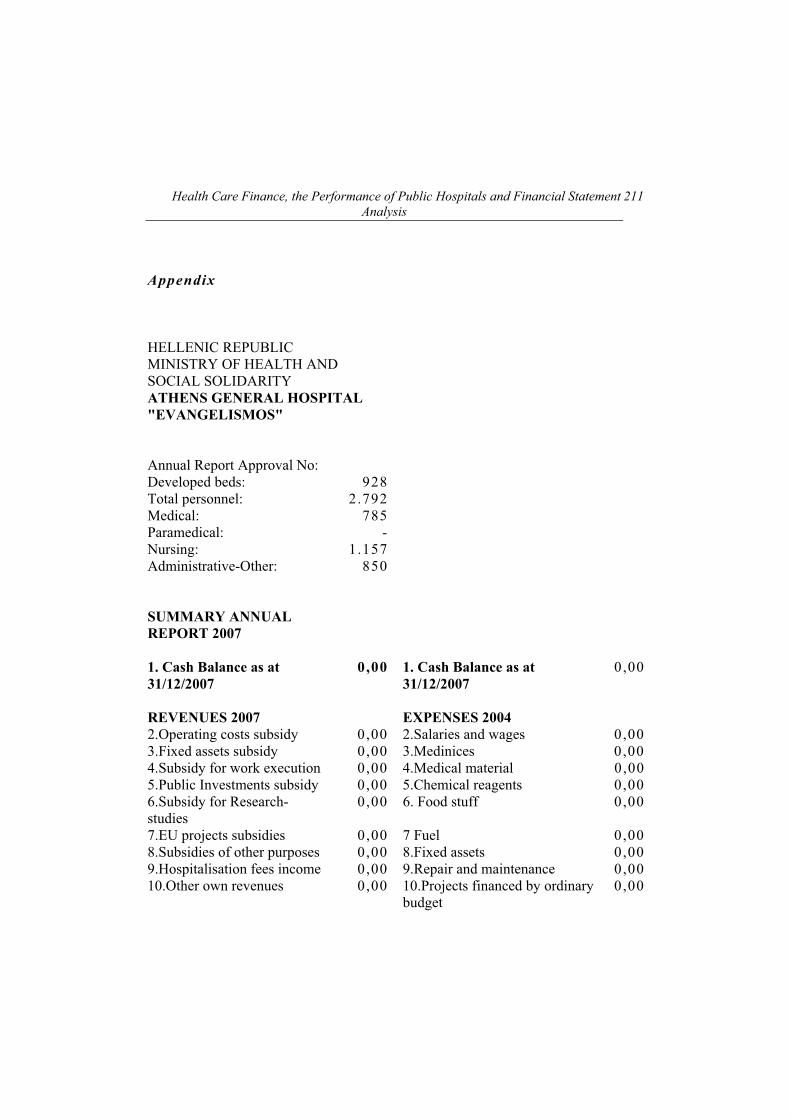
4. The Existing Reporting System and Analysis
Hospitals up to day are obliged to submit each year to the Ministry of
Economics a standardized report (appendix) with specific type of economic
information. The data provided by the hospitals don’t include (among other things)
the total capital invested. The lack of this important element limits the value of
revenues the amount of which depends heavily on the amount invested for that
purpose in order to be able to calculate the degree of their effective use. It
constitutes a critical element of the financial viability of the hospital. It determines
also the need for investment funds, their source, their cost and the depreciation

Health Care Finance, the Performance of Public Hospitals and Financial Statement
Analysis
207
expenses. The change in capital invested can only indirectly be derived through the
change in the number of the available beds, which of course doesn’t capture
investments on medical equipments or any type of renovations which upgrade the
facilities of the hospital.
Based on the information provided
a) Profitability and return to capital ratios, which are means of satisfying
ultimately al stakeholders can’t be measured, since the amount of capital
(total and equity) employed, as well as the result of income statement, are
not available.
b) activity ratio that combines revenues and capital invested are not feasible to
be estimated
c) debt – equity ratios can’t be also accurately measured
d) Finally, the only types of ratios that can satisfactorily be computed are the
ones that refer to liquidity.
On the other hand, based on the data that are reported yearly some other
categories of ratios, mainly quantity and quality (as opposed to value which
presuppose the prices involved) can be produced. More specifically, a useful ratio is
the following:
staff
number of beds
It is a measure that affects the quality of service rendered at the specific
hospital. The number of beds in connection with the number of staff available in
general (doctors, medical technicians, nurses and administrative staff), are factors
reflecting the capacity of the hospital. The degree of their utilization is a primary
determinant of the revenues of hospitals. Revenues divided by the number of doctors
or the number of staff in general measures is a measure of the degree of the efficient
utilization of human factor. The maximization of revenues per employee (and
especially patients served per doctor) is a critical factor reflecting operational
effectiveness and is a critical factor of success. In the public hospitals the amount of
revenues reported can not be measured accurately, given that prices of medical
services are arbitrarily appointed by the state.
As far as the expenses are concerned, the average cost of funds used is not reflected.
The ratio
drug expenses
total expenses
and its development over time is crucial for the control of the overall expenses of a
hospital.

European Research Studies, Volume XII, Issue (4), 2009208
With respect to liquidity the following ratio is important:
Accounts and notes Receivables
Current Liabilities
The above ratio shall be considered in two respects a) as a percentage of
values and b) the date of expiration of the items reflected in the ratio, since the
same value worth more if the date of expiration of receivables is shorter
compare to the one o liabilities, that must be met using the cash emanating from
the collection of receivables. Values greater than one enhance liquidity. It
should be noted that great amount of receivables that are transferred from a year
to the next (increasing the receivables of the year), may mean that their quality
is not good enough or that their probability to be collected by the company is
low. The greater the value of the following ratio is the greater the probability
that the quality of receivables is deteriorating.
Uncollected Accounts Receivables
Account Receivables
As the value of the following ratio
Accounts and notes Receivables
Revenues from medical treatment
is increasing, especially in comparison to the one of the previous year, it is
considered as a sign of financial data manipulation when it is accompanied by a
great increase in revenues of that year compare to previous one, since it is attributed
to the excessive and rather abnormal rise in receivables (Beneish 1997).
The existing data allow comparisons from year to year using 2001 as the
basis for evaluation through the horizontal analysis. Also, through vertical analysis it
can examine the relative value of each particular item to the total it belongs. So, it
can be observed the relative value of certain important expenses as it is drug
expenses, food, compared to the total expenses of the corresponding year. At the
same time it can be seen the change of total expenses or a particular part of it from
year to year. Also it can be compare with the corresponding item of a specific
hospital.
5. Conclusion
The viability of the health care system depends on the financial soundness
of the hospitals, which represent the basis of the system. Competent and robust
financial management of hospitals is necessary towards that end. Financial ratios
indicate that exist some crucial and consistent, for the financial health of hospitals,
relationships among the financial data of the economic units (including hospitals).

Health Care Finance, the Performance of Public Hospitals and Financial Statement
Analysis
209
Ratio analysis emphasizes the need for achieving efficiency (internally) and
effectiveness (externally) in operation dimensions which determine the competitive
advantage that result in return to equity above the average for the specific level of
risk. The later is affected by the capital structure and the liquidity conditions on one
hand (the financial point of view) and the investment in fixed assets (for the
operational side of risk) on the other.
Financing capability represents a vital element of competitive advantage.
The later is reflected in superior ROE which ”is the most comprehensive measure of
profitability of a firm and it takes into account the operating and investing
decisions”(Liesz 2002) and represents the criterion of attracting investment funds in
the hospital sector.
The lacks of appropriate financial data, due to the fact that double entry
accounting has not been applied yet by the hospitals, do not allow the supervising
bodies (PESYs-DyPE) and the economic units under scrutiny to monitor their
economic performance effectively.
6 References
Bain J. (1991), “Firm Resources and Sustained Competitive Advantage,” Journal of
Management, Vol. 17, p.p. 99-120.
Bhat R. and Jain N. (2006), “Financial Performance of Private Sector Hospitals in
India: Some Future Evidence,” Indian Institute of Management, Ahmadabad.
California Healthcare Foundation (2001), ”Financial challenges for California
Hospitals.”
Cleverley & Associates (2004), “State of the Hospital Industry,” Financing the
Future.
Counte M., Glandon G., Hollowman K. and Kowalezyk J. (1988), “Using ratios
to measure hospital financial performance: Can the process be simplified?” Health
Services Management Research, 1(3), 172-180.
Curtis P. and Roupas Th. (2007), "Health care financing and the economic
performance of the hospitals," pp. 341-354 in K.Kioulafas (ed.), 4th International
Conference on Applied Financial Economics, Research and Training Institute of
East Aegean, an Institution of National & Kapodistrian University of Athens,
Samos.
Curtis P. and Roupas Th. (2006), "Strategy, Performance Measurement and
Quality Improvement in the Hospital Sector," pp. 335-357 in K. Kioulafas (ed.), 3rd
International Conference on Applied Financial Economics, Research

European Research Studies, Volume XII, Issue (4), 2009210
and Training Institute of East Aegean, an Institution of National & Kapodistrian
University of Athens, Samos.
Flamholtz, E.G. and Aksehirli, Z. (2000), “Organizational success and failure: An
empirical Test of Holistic Model,” European Management Journal, Vol. 18, No. 5,
p.p. 488-98.
Flex Monitoring Team (2005), ”Select Performance Dimensions for Critical
Access Hospitals,” University of Minnesota North Caroline at Chapel Hill.
KPMG Peat Marwick LLP. (1996), “Financial Ratio Analysis Project,” Final
Report, US Department of Education.
Liesz T. (2002), ”Really Modified Du Pont Analysis: Five Ways to Improve Return
on Equity.”
Polyzos N. (1999), “Hospital Efficiency based on Patient Classification” (in Greek)
(Diagnostic Related Groups); TYPET editions, Athens.
Polyzos N. (2007), “Financial Management of Health Units" (in Greek); Dionikos
Editions, Athens.
Souliotis K. and Kyriopoulos G. (2001), “Pricing Policy and Impact on Health
Services” (in Greek), in Kyriopolos et al. “Health Insurance in Greece" (in Greek);
Themelio Editions, Athens.
Teitelbaum, R. S. (1996), “What's driving return on equity,” Fortune Magazine,
April 29.
Watkins A. (2000), ”Hospital Financial ratio classification patterns revisited: Upon
considering non financial information,” Vol. 19, 73-95.
Zeller T., Stanko B., and Cleverley W. (1996), ”A Revised Classification Pattern
of Hospital Financial Ratios,” Vol. 15, 161-182.
Yfantorpoulos G. (2007), “Health Economics” (in Greek); Typothito G. Dardanos
Editions, Athens.
Health Care Finance, the Performance of Public Hospitals and Financial Statement
Analysis
211
Appendix
HELLENIC REPUBLIC
MINISTRY OF HEALTH AND
SOCIAL SOLIDARITY
ATHENS GENERAL HOSPITAL
"EVANGELISMOS"
Annual Report Approval No:
Developed beds: 928
Total personnel: 2.792
Medical: 785
Paramedical: -
Nursing: 1.157
Administrative-Other: 850
SUMMARY ANNUAL
REPORT 2007
1. Cash Balance as at
31/12/2007
0,00 1. Cash Balance as at
31/12/2007
0,00
REVENUES 2007 EXPENSES 2004
2.Operating costs subsidy 0,00 2.Salaries and wages 0,00
3.Fixed assets subsidy 0,00 3.Medinices 0,00
4.Subsidy for work execution 0,00 4.Medical material 0,00
5.Public Investments subsidy 0,00 5.Chemical reagents 0,00
6.Subsidy for Research-
studies
0,00 6. Food stuff 0,00
7.EU projects subsidies 0,00 7 Fuel 0,00
8.Subsidies of other purposes 0,00 8.Fixed assets 0,00
9.Hospitalisation fees income 0,00 9.Repair and maintenance 0,00
10.Other own revenues 0,00 10.Projects financed by ordinary
budget
0,00

European Research Studies, Volume XII, Issue (4), 2009212
11. Revenues from third party 11.Projects financed by Public
Inv.
0,00
deductions 0,00 12.Research and studies 0,00
13.EU projects 0,00
14.Other expenses 0,00
15.Payment of third party
deductions
0,00
TOTAL REVENUES 2-11 0,00 TOTAL EXPENSES 2-15 0,00
TOTAL1-11 0,00 TOTAL 1-15 0,00
Accounts receivable 0,00 Accounts payable 0,00
HOSPITALISATION
DATA 2007
Examined outpatients
Hospitalised patients
Hospitalisation days
Surgical operations
Laboratory tests
Average Bed Occupancy
Average Hospitalisation
Period