Health Care Chief Compliance Officers and Staff Salary … · Health Care Chief Compliance Officers...
92
Health Care Compliance Association | 6500 Barrie Road, Suite 250 | Minneapolis, MN 55435-2358 hcca-info.org | [email protected] | 888-580-8373 2015 Health Care Chief Compliance Officers and Staff Salary Survey
-
Upload
vuongkhanh -
Category
Documents
-
view
218 -
download
0
Transcript of Health Care Chief Compliance Officers and Staff Salary … · Health Care Chief Compliance Officers...
Health Care Compliance Association | 6500 Barrie Road, Suite 250 | Minneapolis, MN 55435-2358hcca-info.org | [email protected] | 888-580-8373
2015Health Care Chief Compliance Officers and Staff Salary Survey
50+ conferences a year to choose from, all with special members-only rates.
12 issues of Compliance Today, the exclusive HCCA member magazine.
10,000 healthcare compliance professionals joined in one community.
Tired of 24 / 7 / 365
compliance issues?
Try 10,000 / 50 / 12 instead.
Visit www.hcca-info.org to learn how you can enjoy the educational opportunities, networking, and support of the Health Care Compliance Association.
Join the Health Care Compliance Association.
hcca-2015-membership-1page-ad.indd 1 4/13/16 10:58 AM
The Health Care Compliance Association (HCCA)® is pleased to be able to provide you with the 2015 Health Care Chief Compliance Officers and Staff Salary Survey report. As you will see, we have included data on compensation for both the chief compliance officer as well as for the compliance staff, giving a fuller picture of the compliance profession in one document.
The survey results will equip HCCA members and their employers with the data they need to understand and evaluate elements of compliance professionals’ compensation packages.
The results of this survey are based on data from compliance professionals across the U.S., and even a few internationally. Ours is a fast-growing profession, and this data reflects its increasing importance and HCCA’s commitment to meet our members’ needs. We hope you find the data from this survey to be useful.
Sincerely,
Adam Turteltaub, CCEP, CHC Vice President of Membership Development Health Care Compliance Association

CONFIDENTIALITY ASSURANCEThe 2015 Health Care Chief Compliance Officers and Staff Salary Survey is based on a strictly confidential survey conducted of individuals working in the compliance health care profession. Upon receipt, all survey responses are assigned a confidential code number by Industry Insights, Inc., and any name or company identification is removed. Survey processing is then conducted on an absolutely anonymous basis. No HCCA staff member nor any industry company or individual, nor anyone else other than a select few Industry Insights, Inc. associates ever see any firm’s results.

Table of Contents
2015 Health Care Chief Compliance Officers Salary Survey 1
Health Care Chief Compliance Officer Salary Survey
Page
Introduction .............................................................................................................................................................................................. 4 About This Report .................................................................................................................................................................................. 4 Survey Methodology .............................................................................................................................................................................. 5 Definitions .............................................................................................................................................................................................. 5
Respondent Profile .................................................................................................................................................................................. 6 Percentage of Company’s Legal and Regulatory Risk That You are Involved in ................................................................................... 7 Annual Compliance Budget Managed.................................................................................................................................................... 7 Number of Employees in Organization as a Whole................................................................................................................................ 8 Number of Employees in Organization that CCO Runs Compliance for ................................................................................................ 8 Annual Revenues of the Organization as a Whole................................................................................................................................. 9 Annual Revenues of the Organization that CCO Runs compliance for.................................................................................................. 9 Number of Countries in Which Compliance is Managed...................................................................................................................... 10 Number of Years Managing the Compliance Department.................................................................................................................... 10 Certifications ........................................................................................................................................................................................ 11 Type of Organization............................................................................................................................................................................ 11 Geographic Region .............................................................................................................................................................................. 12
Executive Summary ............................................................................................................................................................................... 13 Average Total Compensation by Percentage of Company’s Legal and Regulatory Risk Areas CCO Involved in ............................... 14 Average Total Compensation by Number of Employees in the Compliance and Ethics Group Managed ........................................... 14 Average Total Compensation by Annual Compliance Budget Managed.............................................................................................. 15 Average Total Compensation by Number of Employees that CCO Runs Compliance for ................................................................... 15 Average Total Compensation by Revenue that CCO Runs Compliance for ........................................................................................ 16 Average Total Compensation by Number of Years Managing the Compliance Department ............................................................... 16 Average Total Compensation by Type of Organization........................................................................................................................ 17 Average Total Compensation and Average Base Salary by Geographic Region ................................................................................ 17 Average Total Compensation by Certification...................................................................................................................................... 18 Amount of Bonus Eligible ..................................................................................................................................................................... 18 Do you have a Contract? ..................................................................................................................................................................... 19
Salary Data.............................................................................................................................................................................................. 20
Detailed Results ..................................................................................................................................................................................... 23 By All Respondents and Annual Compliance Budget .......................................................................................................................... 24 By Number of Employees in Organization as a Whole ........................................................................................................................ 29
Health Care Chief Compliance Officers Salary Survey

Table of Contents
2015 Health Care Chief Compliance Officers Salary Survey 2
Health Care Staff Salary Survey
Introduction ............................................................................................................................................................................................ 36 About This Report ................................................................................................................................................................................ 36 Survey Methodology ............................................................................................................................................................................ 37 Definitions ............................................................................................................................................................................................ 37
Respondent Profile ................................................................................................................................................................................ 38 Title/Level............................................................................................................................................................................................. 39 Number of Employees in Organization as a Whole.............................................................................................................................. 39 Number of Employees in the Portion of the Organization that the Compliance Program Oversees .................................................... 40 Annual Revenues of the Organization as a Whole............................................................................................................................... 40 Annual Revenues of the Portion of the Organization that the Compliance Program Oversees ........................................................... 41 Number of Countries in Which Compliance is Managed...................................................................................................................... 41 Number of Years in the Compliance Department................................................................................................................................. 42 Type of Organization............................................................................................................................................................................ 42 Geographic Region .............................................................................................................................................................................. 43 Percentage indicating the elements of the compliance program that they are primarily involved in: ................................................... 44 How many people report up through to the individual? ........................................................................................................................ 44 How much of your company's legal and regulatory risk areas would you estimate the compliance department is responsible
for managing?................................................................................................................................................................................ 45 Percentage holding the following certifications: ................................................................................................................................... 45 Highest education level attained .......................................................................................................................................................... 46 Do you have a contract? ...................................................................................................................................................................... 46
Executive Summary ............................................................................................................................................................................... 47 Average Total Compensation by Title/Level ........................................................................................................................................ 48 Average Total Compensation by Annual Revenues in the Portion of the Organization that the Individual Works in
Compliance for .............................................................................................................................................................................. 48 Average Total Compensation by Number of Employees in the Portion of the Organization that the Individual Works in
Compliance for .............................................................................................................................................................................. 49 Average Total Compensation by Number of People that Report up through to Individual ................................................................... 49 Average Total Compensation by Title/Level and Type of Organization ............................................................................................... 50 Average Total Compensation by Title/Level and Certifications Held ................................................................................................... 50 Average Total Compensation by Title/Level and Number of Elements of a Compliance Program the Individual is Involved in........... 51 Average Total Compensation by Title/Level and Whether the Individual has a Contract..................................................................... 51 Amount of bonus eligible:..................................................................................................................................................................... 51
Salary Data.............................................................................................................................................................................................. 52
Detailed Results ..................................................................................................................................................................................... 62 By All Respondents and Title/Level ..................................................................................................................................................... 63 By Annual Compliance Budget ............................................................................................................................................................ 69
Health Care Compliance Staff Salary Survey

Health Care Chief Compliance Officers
Salary Survey


2015 Health Care Chief Compliance Officers Salary Survey 3
Introduction

Introduction
2015 Health Care Chief Compliance Officers Salary Survey 4
Introduction
About This Report
The 2015 Health Care Chief Compliance Officers Salary Survey is another important service provided by the Health Care Compliance Association (HCCA) and the Society of Corporate Compliance and Ethics (SCCE). The information contained in this report represents complete and accurate compensation data on individuals working in the health care compliance profession. The report is designed to allow organizations and individuals to compare their salary to their peers. The salary data have been aggregated in the following groupings so organizations and individuals can compare their own data to the results of similar operations. These aggregations include:
• All Respondents • Percentage of Company’s Legal and Regulatory Risk Areas the Chief Compliance Officer (CCO) is Involved in • Number of Employees in the compliance and Ethics Group Managed • Annual Compliance Budget Managed • Number of Employees in Portion of the Organization that CCO runs Compliance for • Annual Revenues in Portion of the Organization that CCO Runs Compliance for • Number of Countries in Which Compliance is Managed • Number of Years Managing the Compliance Department • Certifications Held • Type of Organization • Number of Compliance Program Elements the CCO is Involved in • Geographic Region
Because the goal of this survey was to determine salaries for Chief Compliance Officers for an organization or division within it, and not for leaders of specialized areas of compliance, individuals who indicated they were responsible for less than 26% of an organization’s legal and regulatory risk were eliminated. These individuals accounted for 15.3% of all respondents. As an organization or individual compares their salary information to that of the profession, it is important to remember that the statistics published in this report should be regarded as “guidelines” rather than “absolute standards.” Since organizations will differ, depending upon their location, size, and other factors, any two organizations may offer their employees a reasonably attractive compensation package and yet be very different. For example, duration of employment and nature of prior experience will obviously influence the compensation offering for a particular individual. Thus, a deviation between any one organization’s figures and a number appearing on a table in this report is not necessarily good or bad; it is merely an indication that additional scrutiny may be warranted. A minimum of five responses was required to show data. This study was conducted for HCCA/SCCE by Industry Insights, Inc., an independent professional survey research firm located in Dublin, Ohio. The company specializes in conducting industry operating surveys, compensation and benefits studies, and member attitude surveys for trade and professional associations. The HCCA/SCCE is proud to present the enclosed insights into the salary levels in the compliance industry. We wish to thank the professionals who submitted data for the study. Your support was essential in making this study a success.

Introduction
2015 Health Care Chief Compliance Officers Salary Survey 5
Survey Methodology In June 2015, an email invitation was sent to approximately 45,000 individuals. In total, 1,646 completed online submissions were received by late July. Of the 1,646 responses, 679 were selected based on the following criteria:
• They worked for a health care provider • They were responsible for at least 26% of an organization’s legal and regulatory risk
This report is based solely on this group. Upon receipt, all submissions were assigned a confidential identification number. All data were checked both manually and by a specially designed computer editing procedure. Strict confidence of survey responses was maintained throughout the course of the project. Final results were tabulated by Industry Insights, Inc., and the report was completed in September 2015. Definitions Average (mean): the arithmetic average obtained by adding the individual values for all responses to a particular question and dividing by the total number answering; a measure of central value that can be distorted by extreme high or low values. Median: a measure of central value that is not affected by extreme values; calculated by arranging all responses in numerical order and selecting the value that falls exactly in the middle, with half higher and half lower. 25th Percentile: when responses are ordered from lowest to highest, the lower quartile is the response 25% from the bottom. In other words, 75% of the responses are higher than this measure. 75th Percentile: when responses are ordered from the lowest to highest, the upper quartile is the response 25% from the top. In other words, 25% of the responses are higher than this measure.


2015 Health Care Chief Compliance Officers Salary Survey 6
Respondent Profile
Respondent Profile
2015 Health Care Chief Compliance Officers Salary Survey 7
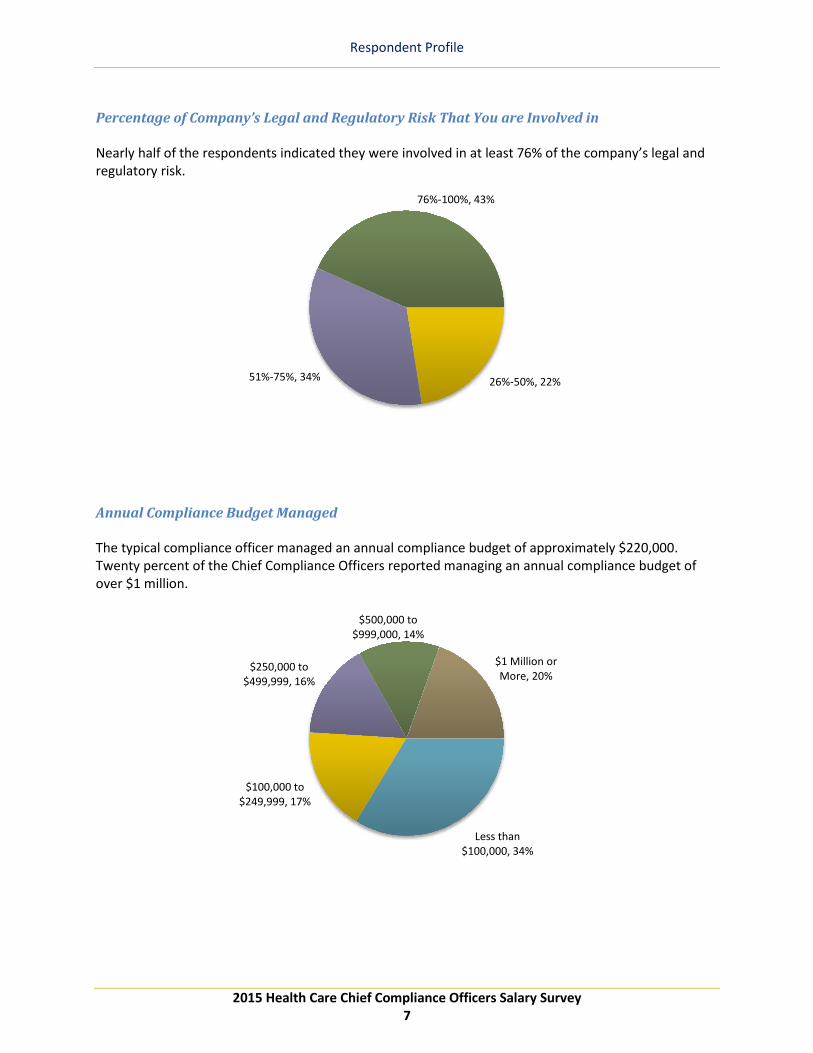
Percentage of Company’s Legal and Regulatory Risk That You are Involved in Nearly half of the respondents indicated they were involved in at least 76% of the company’s legal and regulatory risk.
Annual Compliance Budget Managed The typical compliance officer managed an annual compliance budget of approximately $220,000. Twenty percent of the Chief Compliance Officers reported managing an annual compliance budget of over $1 million.
26%-50%, 22%51%-75%, 34%
76%-100%, 43%
Less than $100,000, 34%
$100,000 to $249,999, 17%
$250,000 to $499,999, 16%
$500,000 to $999,000, 14%
$1 Million or More, 20%
Respondent Profile
2015 Health Care Chief Compliance Officers Salary Survey 8
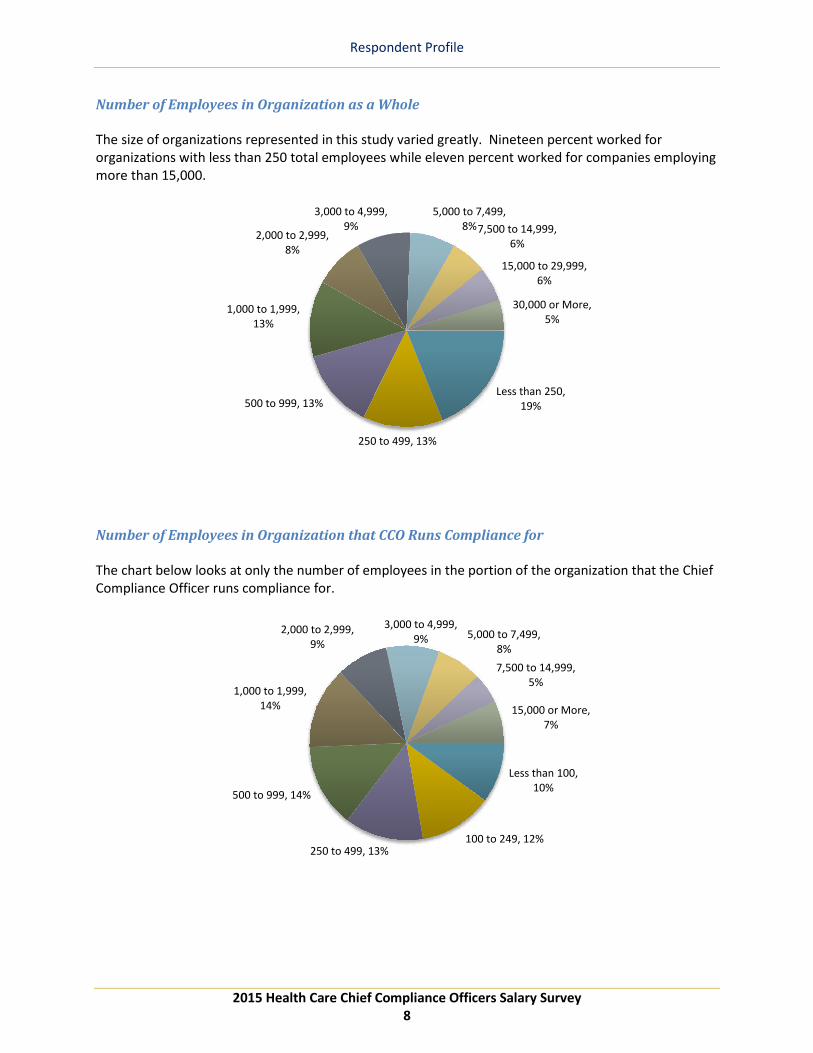
Number of Employees in Organization as a Whole The size of organizations represented in this study varied greatly. Nineteen percent worked for organizations with less than 250 total employees while eleven percent worked for companies employing more than 15,000.
Number of Employees in Organization that CCO Runs Compliance for The chart below looks at only the number of employees in the portion of the organization that the Chief Compliance Officer runs compliance for.
Less than 250, 19%
250 to 499, 13%
500 to 999, 13%
1,000 to 1,999, 13%
2,000 to 2,999, 8%
3,000 to 4,999, 9%
5,000 to 7,499, 8%7,500 to 14,999,
6%
15,000 to 29,999, 6%
30,000 or More, 5%
Less than 100, 10%
100 to 249, 12%250 to 499, 13%
500 to 999, 14%
1,000 to 1,999, 14%
2,000 to 2,999, 9%
3,000 to 4,999, 9% 5,000 to 7,499,
8%7,500 to 14,999,
5%
15,000 or More, 7%

Respondent Profile
2015 Health Care Chief Compliance Officers Salary Survey 9
Annual Revenues of the Organization as a Whole The size of organizations responding by annual revenue also varied greatly. Nearly a one-quarter of the respondents reported annual revenue of entire organization of less than $15 million, while another quarter of the respondents reported annual revenue of over $500 million.
Annual Revenues of the Organization that CCO Runs compliance for The chart below looks at only the annual revenues of the portion of the organization that the Chief Compliance Officer runs compliance for.
Less than $5 Million, 8%
$5 to $15 Million, 16%$15 to $30 Million,
11%
$30 to $50 Million, 11%
$50 to $100 Million, 12%
$100 to $500 Million, 17%
$500 Million to $1 Billion, 6%
$1 to $3 Billion, 11%
More than $3 Billion, 8%
Less than $5 Million, 12%
$5 to $15 Million, 15%
$15 to $30 Million, 11%
$30 to $50 Million, 11%
$50 to $100 Million, 13%
$100 to $500 Million, 17%
$500 Million to $1 Billion, 7%
$1 to $3 Billion, 10%
More than $3 Billion, 5%
Respondent Profile
2015 Health Care Chief Compliance Officers Salary Survey 10
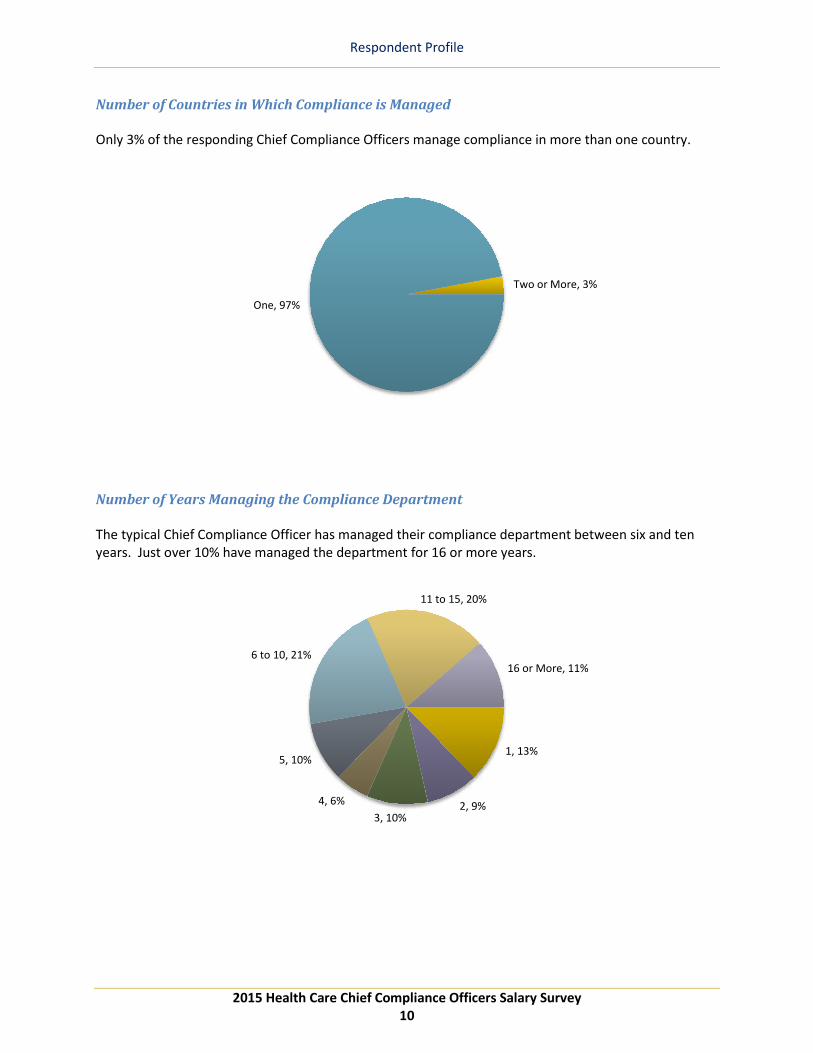
Number of Countries in Which Compliance is Managed Only 3% of the responding Chief Compliance Officers manage compliance in more than one country.
Number of Years Managing the Compliance Department The typical Chief Compliance Officer has managed their compliance department between six and ten years. Just over 10% have managed the department for 16 or more years.
One, 97%
Two or More, 3%
1, 13%
2, 9%3, 10%
4, 6%
5, 10%
6 to 10, 21%
11 to 15, 20%
16 or More, 11%
Respondent Profile
2015 Health Care Chief Compliance Officers Salary Survey 11
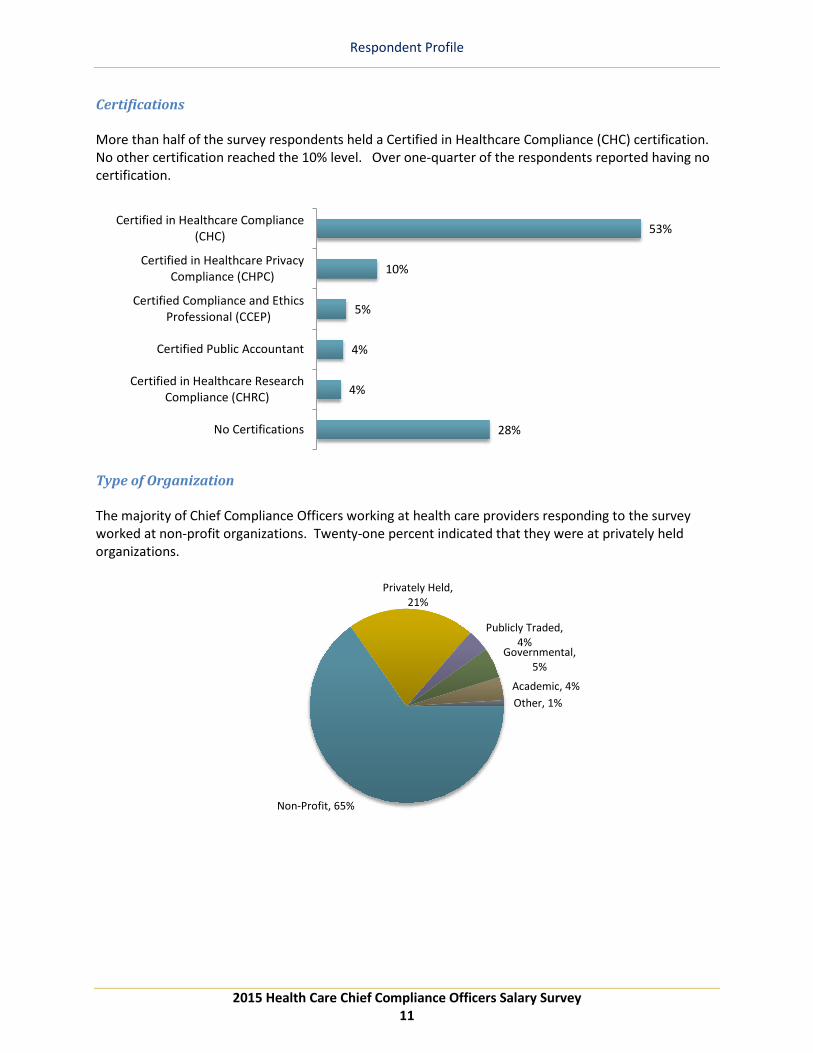
Certifications More than half of the survey respondents held a Certified in Healthcare Compliance (CHC) certification. No other certification reached the 10% level. Over one-quarter of the respondents reported having no certification.
Type of Organization The majority of Chief Compliance Officers working at health care providers responding to the survey worked at non-profit organizations. Twenty-one percent indicated that they were at privately held organizations.
53%
10%
5%
4%
4%
28%
Certified in Healthcare Compliance(CHC)
Certified in Healthcare PrivacyCompliance (CHPC)
Certified Compliance and EthicsProfessional (CCEP)
Certified Public Accountant
Certified in Healthcare ResearchCompliance (CHRC)
No Certifications
Non-Profit, 65%
Privately Held, 21%
Publicly Traded, 4%
Governmental, 5%
Academic, 4%Other, 1%

Respondent Profile
2015 Health Care Chief Compliance Officers Salary Survey 12
Geographic Region The highest concentration of respondents were from the Middle Atlantic, East North Central, South Atlantic and Pacific regions. The lowest concentration of respondents were from the New England region.
New England: NH, VT, ME, MA, RI, CT West North Central: ND, SD, NE, KS, MN, IA, MO Mid-Atlantic: NJ, NY, PA West South Central: TX, OK, AR, LA South Atlantic: DE, MD, DC, WV, VA, NC, SC, GA, FL Mountain: MT, ID, WY, NV, UT, CO, AZ, NM East North Central: WI, IL, IN, MI, OH Pacific: WA, OR, CA, AK, HI East South Central: KY, TN, MS, AL
New England, 5%
Middle Atlantic, 18%
South Atlantic, 15%
East North Centra, 16%
East South Central, 7%
West North Central, 9%
West South Central, 8%
Mountain, 8%
Pacific, 13%

2015 Health Care Chief Compliance Officers Salary Survey 13
Executive Summary

Executive Summary
2015 Health Care Chief Compliance Officers Salary Survey 14
Average Total Compensation+ by Percentage of Company’s Legal and Regulatory Risk Areas CCO Involved in Chief Compliance Officers reporting that they were involved in 26%-50% of the company’s legal and regulatory risk earned more than those with higher levels of involvement. Chief Compliance Officers that reported being involved in 26% to 50% of the company’s legal and regulatory risk areas worked for larger organizations, on average, than those that reported 51% to 100% involvement which factored into their higher compensation. Those reporting to be involved in 51%-75% of the company’s legal and regulatory risk earned the lowest compensation at $127,896.
Average Total Compensation+ by Number of Employees in the Compliance and Ethics Group Managed Salaries of Chief Compliance Officers showed a direct correlation to the number of employees in the compliance and ethics group managed. Chief Compliance Officers managing one employee earned average total cash compensation of $100,160 while those managing more than 20 employees earned $262,326.
+ Total compensation is the sum of base salary and cash bonus.
$142,612
$127,896
$133,723
26%-50%
51%-75%
76%-100%
$100,160
$128,730
$160,044
$192,007
$262,326
1
2 to 5
6 to 10
11 to 20
More Than 20

Executive Summary
2015 Health Care Chief Compliance Officers Salary Survey 15
Average Total Compensation+ by Annual Compliance Budget Managed A direct correlation also existed between CCO total cash compensation and the annual compliance budget managed. Chief Compliance Officers managing an annual compliance budget of less than $100,000 earned $96,356 while those managing budgets of $1 million or more earned $231,167.
Average Total Compensation+ by Number of Employees that CCO Runs Compliance for CCOs managing compliance for company units with 15,000 or more employees reported compensation nearly three times higher than those in organizations with less than 100 employees. It should be noted that CCOs at organizations with less than 100 employees may have had a higher executive level position or more than one position, which led to a higher average salary, than those working at organization with 100 to 499 employees.
+ Total compensation is the sum of base salary and cash bonus.
$96,356
$111,248
$135,930
$163,304
$231,167
Less Than $100,000
$100,000 to $249,999
$250,000 to $499,999
$500,000 to $999,999
$1 Million or More
$98,803
$79,228
$96,049
$113,516
$120,845
$146,532
$149,154
$200,454
$195,142
$281,875
Less Than 100
100-249
250-499
500-999
1,000-1,999
2,000-2,999
3,000-4,999
5,000-7,499
7,500-14,999
15,000 or More

Executive Summary
2015 Health Care Chief Compliance Officers Salary Survey 16
Average Total Compensation+ by Revenue that CCO Runs Compliance for A correlation existed between CCO salaries and annual revenue of the organizational unit that the CCO was responsible for, especially when those revenues surpassed $30 million.
Average Total Compensation+ by Number of Years Managing the Compliance Department The number of years managing the compliance department made a difference once the Chief Compliance Officer surpassed 5 years on the job. Chief Compliance Officers with one year of experience managing the compliance department earned less than $100,000 in compensation, on average. Those managing the compliance department for 16 or more years earned an average compensation of $177,465.
+ Total compensation is the sum of base salary and cash bonus.
$90,487
$87,175
$92,181
$116,934
$127,639
$141,741
$169,896
$207,951
$297,604
Less Than $5 Million
$5 to $15 Million
$15 to $30 Million
$30 to $50 Million
$50 to $100 Million
$100 to $500 Million
$500 Million to $1 Billion
$1 to $3 Billion
More than $3 Billion
$91,057
$107,757
$109,441
$106,914
$106,097
$145,057
$167,968
$177,465
1
2
3
4
5
6 to 10
11 to 15
16 or More
Executive Summary
2015 Health Care Chief Compliance Officers Salary Survey 17
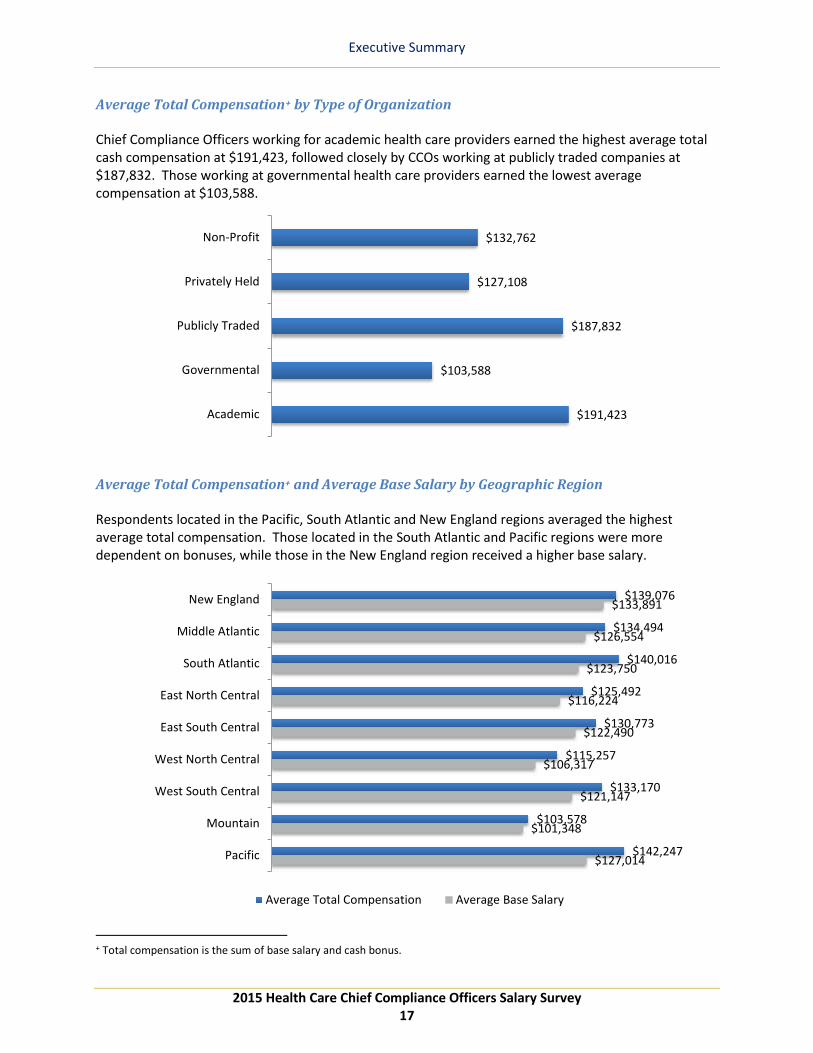
Average Total Compensation+ by Type of Organization Chief Compliance Officers working for academic health care providers earned the highest average total cash compensation at $191,423, followed closely by CCOs working at publicly traded companies at $187,832. Those working at governmental health care providers earned the lowest average compensation at $103,588.
Average Total Compensation+ and Average Base Salary by Geographic Region Respondents located in the Pacific, South Atlantic and New England regions averaged the highest average total compensation. Those located in the South Atlantic and Pacific regions were more dependent on bonuses, while those in the New England region received a higher base salary.
+ Total compensation is the sum of base salary and cash bonus.
$132,762
$127,108
$187,832
$103,588
$191,423
Non-Profit
Privately Held
Publicly Traded
Governmental
Academic
$139,076
$134,494
$140,016
$125,492
$130,773
$115,257
$133,170
$103,578
$142,247
$133,891
$126,554
$123,750
$116,224
$122,490
$106,317
$121,147
$101,348
$127,014
New England
Middle Atlantic
South Atlantic
East North Central
East South Central
West North Central
West South Central
Mountain
Pacific
Average Total Compensation Average Base Salary
Executive Summary
2015 Health Care Chief Compliance Officers Salary Survey 18
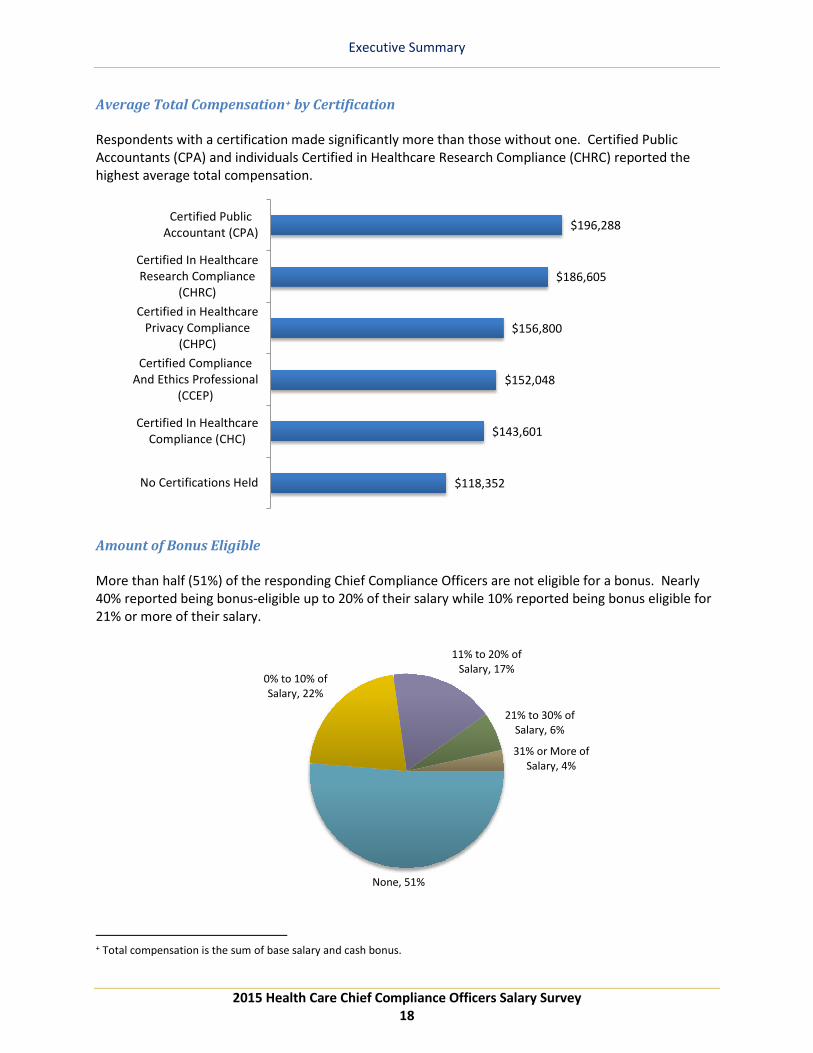
Average Total Compensation+ by Certification Respondents with a certification made significantly more than those without one. Certified Public Accountants (CPA) and individuals Certified in Healthcare Research Compliance (CHRC) reported the highest average total compensation.
Amount of Bonus Eligible
More than half (51%) of the responding Chief Compliance Officers are not eligible for a bonus. Nearly 40% reported being bonus-eligible up to 20% of their salary while 10% reported being bonus eligible for 21% or more of their salary.
+ Total compensation is the sum of base salary and cash bonus.
$196,288
$186,605
$156,800
$152,048
$143,601
$118,352
Certified PublicAccountant (CPA)
Certified In HealthcareResearch Compliance
(CHRC)Certified in Healthcare
Privacy Compliance(CHPC)
Certified ComplianceAnd Ethics Professional
(CCEP)
Certified In HealthcareCompliance (CHC)
No Certifications Held
None, 51%
0% to 10% of Salary, 22%
11% to 20% of Salary, 17%
21% to 30% of Salary, 6%
31% or More of Salary, 4%

Executive Summary
2015 Health Care Chief Compliance Officers Salary Survey 19
Do you have a Contract?
Only 10% of the responding Chief Compliance Officers have a contract. CCOs with a contract earned significantly more than those without one ($165,843 vs. $129,694 in total compensation).
Yes, 10%
No, 90%


2015 Health Care Chief Compliance Officers Salary Survey 20
Salary Data
Salary Data
2015 Health Care Chief Compliance Officers Salary Survey 21
Chief Compliance Officer
# of Resp.
Base Salary Total Compensation
Average Median25th
Percentile75th
Percentile Average Median25th
Percentile75th
Percentile
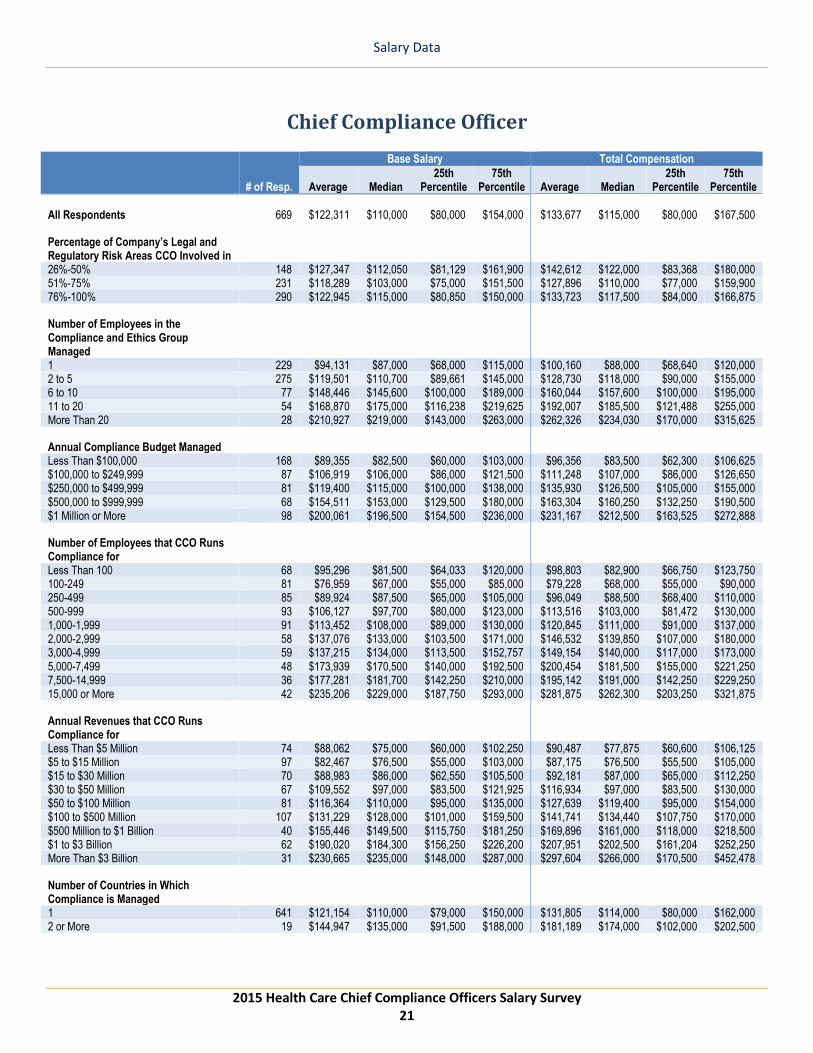
All Respondents 669 $122,311 $110,000 $80,000 $154,000 $133,677 $115,000 $80,000 $167,500
Percentage of Company’s Legal and Regulatory Risk Areas CCO Involved in26%-50% 148 $127,347 $112,050 $81,129 $161,900 $142,612 $122,000 $83,368 $180,00051%-75% 231 $118,289 $103,000 $75,000 $151,500 $127,896 $110,000 $77,000 $159,90076%-100% 290 $122,945 $115,000 $80,850 $150,000 $133,723 $117,500 $84,000 $166,875
Number of Employees in the Compliance and Ethics Group Managed1 229 $94,131 $87,000 $68,000 $115,000 $100,160 $88,000 $68,640 $120,0002 to 5 275 $119,501 $110,700 $89,661 $145,000 $128,730 $118,000 $90,000 $155,0006 to 10 77 $148,446 $145,600 $100,000 $189,000 $160,044 $157,600 $100,000 $195,00011 to 20 54 $168,870 $175,000 $116,238 $219,625 $192,007 $185,500 $121,488 $255,000More Than 20 28 $210,927 $219,000 $143,000 $263,000 $262,326 $234,030 $170,000 $315,625
Annual Compliance Budget ManagedLess Than $100,000 168 $89,355 $82,500 $60,000 $103,000 $96,356 $83,500 $62,300 $106,625$100,000 to $249,999 87 $106,919 $106,000 $86,000 $121,500 $111,248 $107,000 $86,000 $126,650$250,000 to $499,999 81 $119,400 $115,000 $100,000 $138,000 $135,930 $126,500 $105,000 $155,000$500,000 to $999,999 68 $154,511 $153,000 $129,500 $180,000 $163,304 $160,250 $132,250 $190,500$1 Million or More 98 $200,061 $196,500 $154,500 $236,000 $231,167 $212,500 $163,525 $272,888
Number of Employees that CCO Runs Compliance forLess Than 100 68 $95,296 $81,500 $64,033 $120,000 $98,803 $82,900 $66,750 $123,750100-249 81 $76,959 $67,000 $55,000 $85,000 $79,228 $68,000 $55,000 $90,000250-499 85 $89,924 $87,500 $65,000 $105,000 $96,049 $88,500 $68,400 $110,000500-999 93 $106,127 $97,700 $80,000 $123,000 $113,516 $103,000 $81,472 $130,0001,000-1,999 91 $113,452 $108,000 $89,000 $130,000 $120,845 $111,000 $91,000 $137,0002,000-2,999 58 $137,076 $133,000 $103,500 $171,000 $146,532 $139,850 $107,000 $180,0003,000-4,999 59 $137,215 $134,000 $113,500 $152,757 $149,154 $140,000 $117,000 $173,0005,000-7,499 48 $173,939 $170,500 $140,000 $192,500 $200,454 $181,500 $155,000 $221,2507,500-14,999 36 $177,281 $181,700 $142,250 $210,000 $195,142 $191,000 $142,250 $229,25015,000 or More 42 $235,206 $229,000 $187,750 $293,000 $281,875 $262,300 $203,250 $321,875
Annual Revenues that CCO Runs Compliance forLess Than $5 Million 74 $88,062 $75,000 $60,000 $102,250 $90,487 $77,875 $60,600 $106,125$5 to $15 Million 97 $82,467 $76,500 $55,000 $103,000 $87,175 $76,500 $55,500 $105,000$15 to $30 Million 70 $88,983 $86,000 $62,550 $105,500 $92,181 $87,000 $65,000 $112,250$30 to $50 Million 67 $109,552 $97,000 $83,500 $121,925 $116,934 $97,000 $83,500 $130,000$50 to $100 Million 81 $116,364 $110,000 $95,000 $135,000 $127,639 $119,400 $95,000 $154,000$100 to $500 Million 107 $131,229 $128,000 $101,000 $159,500 $141,741 $134,440 $107,750 $170,000$500 Million to $1 Billion 40 $155,446 $149,500 $115,750 $181,250 $169,896 $161,000 $118,000 $218,500$1 to $3 Billion 62 $190,020 $184,300 $156,250 $226,200 $207,951 $202,500 $161,204 $252,250More Than $3 Billion 31 $230,665 $235,000 $148,000 $287,000 $297,604 $266,000 $170,500 $452,478
Number of Countries in Which Compliance is Managed1 641 $121,154 $110,000 $79,000 $150,000 $131,805 $114,000 $80,000 $162,0002 or More 19 $144,947 $135,000 $91,500 $188,000 $181,189 $174,000 $102,000 $202,500
Salary Data
2015 Health Care Chief Compliance Officers Salary Survey 22
# of Resp.
Base Salary Total Compensation
Average Median25th
Percentile75th
Percentile Average Median25th
Percentile75th
Percentile
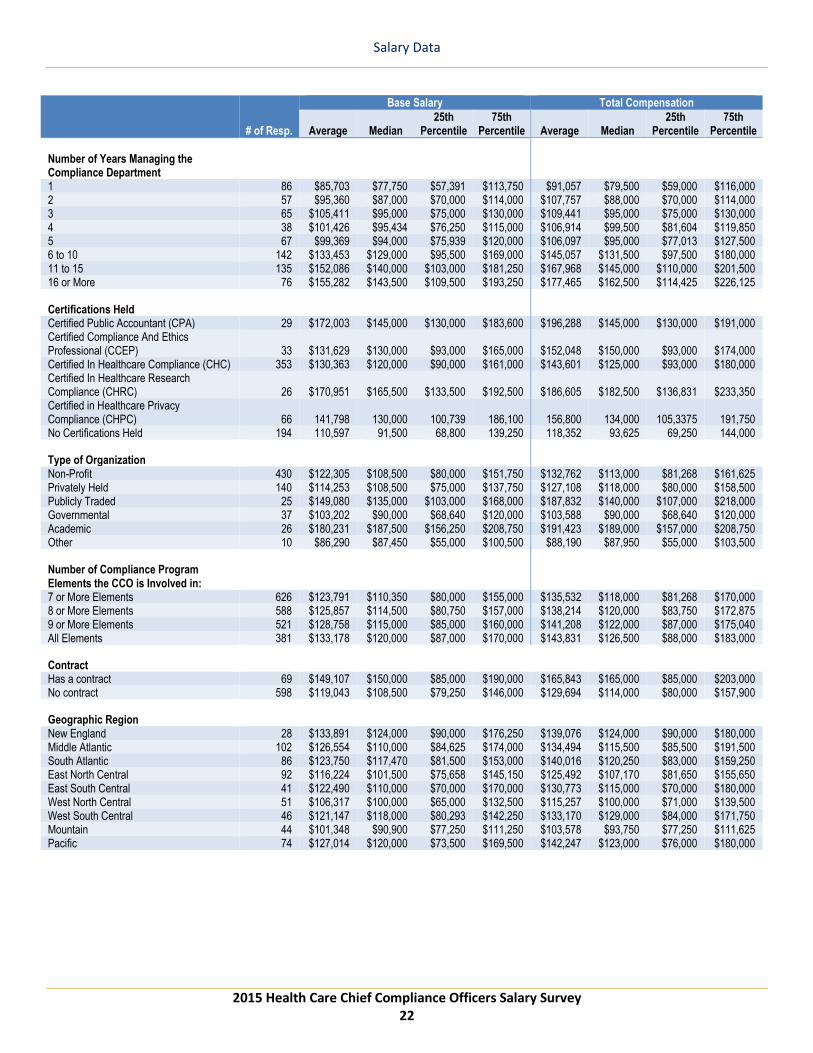
Number of Years Managing the Compliance Department1 86 $85,703 $77,750 $57,391 $113,750 $91,057 $79,500 $59,000 $116,0002 57 $95,360 $87,000 $70,000 $114,000 $107,757 $88,000 $70,000 $114,0003 65 $105,411 $95,000 $75,000 $130,000 $109,441 $95,000 $75,000 $130,0004 38 $101,426 $95,434 $76,250 $115,000 $106,914 $99,500 $81,604 $119,8505 67 $99,369 $94,000 $75,939 $120,000 $106,097 $95,000 $77,013 $127,5006 to 10 142 $133,453 $129,000 $95,500 $169,000 $145,057 $131,500 $97,500 $180,00011 to 15 135 $152,086 $140,000 $103,000 $181,250 $167,968 $145,000 $110,000 $201,50016 or More 76 $155,282 $143,500 $109,500 $193,250 $177,465 $162,500 $114,425 $226,125
Certifications HeldCertified Public Accountant (CPA) 29 $172,003 $145,000 $130,000 $183,600 $196,288 $145,000 $130,000 $191,000Certified Compliance And Ethics Professional (CCEP) 33 $131,629 $130,000 $93,000 $165,000 $152,048 $150,000 $93,000 $174,000Certified In Healthcare Compliance (CHC) 353 $130,363 $120,000 $90,000 $161,000 $143,601 $125,000 $93,000 $180,000Certified In Healthcare Research Compliance (CHRC) 26 $170,951 $165,500 $133,500 $192,500 $186,605 $182,500 $136,831 $233,350Certified in Healthcare Privacy Compliance (CHPC) 66 141,798 130,000 100,739 186,100 156,800 134,000 105,3375 191,750No Certifications Held 194 110,597 91,500 68,800 139,250 118,352 93,625 69,250 144,000
Type of OrganizationNon-Profit 430 $122,305 $108,500 $80,000 $151,750 $132,762 $113,000 $81,268 $161,625Privately Held 140 $114,253 $108,500 $75,000 $137,750 $127,108 $118,000 $80,000 $158,500Publicly Traded 25 $149,080 $135,000 $103,000 $168,000 $187,832 $140,000 $107,000 $218,000Governmental 37 $103,202 $90,000 $68,640 $120,000 $103,588 $90,000 $68,640 $120,000Academic 26 $180,231 $187,500 $156,250 $208,750 $191,423 $189,000 $157,000 $208,750Other 10 $86,290 $87,450 $55,000 $100,500 $88,190 $87,950 $55,000 $103,500
Number of Compliance Program Elements the CCO is Involved in:7 or More Elements 626 $123,791 $110,350 $80,000 $155,000 $135,532 $118,000 $81,268 $170,0008 or More Elements 588 $125,857 $114,500 $80,750 $157,000 $138,214 $120,000 $83,750 $172,8759 or More Elements 521 $128,758 $115,000 $85,000 $160,000 $141,208 $122,000 $87,000 $175,040All Elements 381 $133,178 $120,000 $87,000 $170,000 $143,831 $126,500 $88,000 $183,000
ContractHas a contract 69 $149,107 $150,000 $85,000 $190,000 $165,843 $165,000 $85,000 $203,000No contract 598 $119,043 $108,500 $79,250 $146,000 $129,694 $114,000 $80,000 $157,900
Geographic RegionNew England 28 $133,891 $124,000 $90,000 $176,250 $139,076 $124,000 $90,000 $180,000Middle Atlantic 102 $126,554 $110,000 $84,625 $174,000 $134,494 $115,500 $85,500 $191,500South Atlantic 86 $123,750 $117,470 $81,500 $153,000 $140,016 $120,250 $83,000 $159,250East North Central 92 $116,224 $101,500 $75,658 $145,150 $125,492 $107,170 $81,650 $155,650East South Central 41 $122,490 $110,000 $70,000 $170,000 $130,773 $115,000 $70,000 $180,000West North Central 51 $106,317 $100,000 $65,000 $132,500 $115,257 $100,000 $71,000 $139,500West South Central 46 $121,147 $118,000 $80,293 $142,250 $133,170 $129,000 $84,000 $171,750Mountain 44 $101,348 $90,900 $77,250 $111,250 $103,578 $93,750 $77,250 $111,625Pacific 74 $127,014 $120,000 $73,500 $169,500 $142,247 $123,000 $76,000 $180,000


2015 Health Care Chief Compliance Officers Salary Survey 23
Detailed Results

Detailed Results
2015 Health Care Chief Compliance Officers Salary Survey 24
By All Respondents and Annual Compliance Budget
All Respondents
Annual Compliance Budget Less than $100,000
$100,000 to $249,999
$250,000 to $499,999
$500,000 to $999,999
$1 Million or More
Are you the Chief Compliance Officer for:Responses 679 171 88 81 69 99Your organization as a whole 80% 82% 88% 84% 81% 78%A division or operating unit of the organization 20% 18% 13% 16% 19% 22%
Percentage indicating involvement in the following compliance program elements:Responses 679 171 88 81 69 99Compliance/auditing/monitoring 95% 88% 95% 99% 100% 98%Compliance education 98% 98% 99% 99% 99% 97%Compliance investigations 98% 98% 98% 99% 97% 99%Hot line/anonymous reporting 91% 85% 91% 98% 96% 93%Reporting to the board 86% 82% 90% 88% 94% 90%Compliance risk assessments 94% 90% 94% 98% 94% 97%Compliance discipline/incentives 75% 66% 78% 77% 81% 82%Code of conduct 89% 85% 95% 90% 94% 92%Policies and procedures 97% 97% 99% 96% 99% 97%Measuring program effectiveness 86% 77% 93% 91% 93% 95%
How much of your company's legal and regulatory risk areas are you responsible for managing?Responses 679 171 88 81 69 9926%-50% 22% 25% 19% 23% 26% 21%51%-75% 34% 35% 39% 26% 23% 39%76%-100% 43% 41% 42% 51% 51% 39%
How many employees, including yourself, are there in the compliance and ethics group you manage?Responses 673 170 87 81 69 981 35% 67% 44% 21% 1% 1%2 to 5 41% 29% 52% 64% 65% 19%6 to 10 12% 2% 3% 14% 23% 27%11 to 15 4% 1% 0% 1% 4% 18%16 to 20 4% 1% 0% 0% 6% 14%21 to 30 2% 0% 0% 0% 0% 10%31 to 40 1% 0% 0% 0% 0% 3%41 to 50 0% 0% 1% 0% 0% 2%More than 50 1% 0% 0% 0% 0% 5%
Annual compliance budget managed:Responses 508 171 88 81 69 99Average $709,728 $18,940 $162,030 $316,449 $623,348 $2,771,730Median $220,000 $3,000 $160,000 $300,000 $580,000 $1,500,00025th percentile $30,000 $0 $125,000 $250,000 $500,000 $1,200,00075th percentile $650,000 $30,000 $200,000 $350,000 $700,000 $2,500,000
Detailed Results
2015 Health Care Chief Compliance Officers Salary Survey 25
All Respondents
Annual Compliance Budget Less than $100,000
$100,000 to $249,999
$250,000 to $499,999
$500,000 to $999,999
$1 Million or More
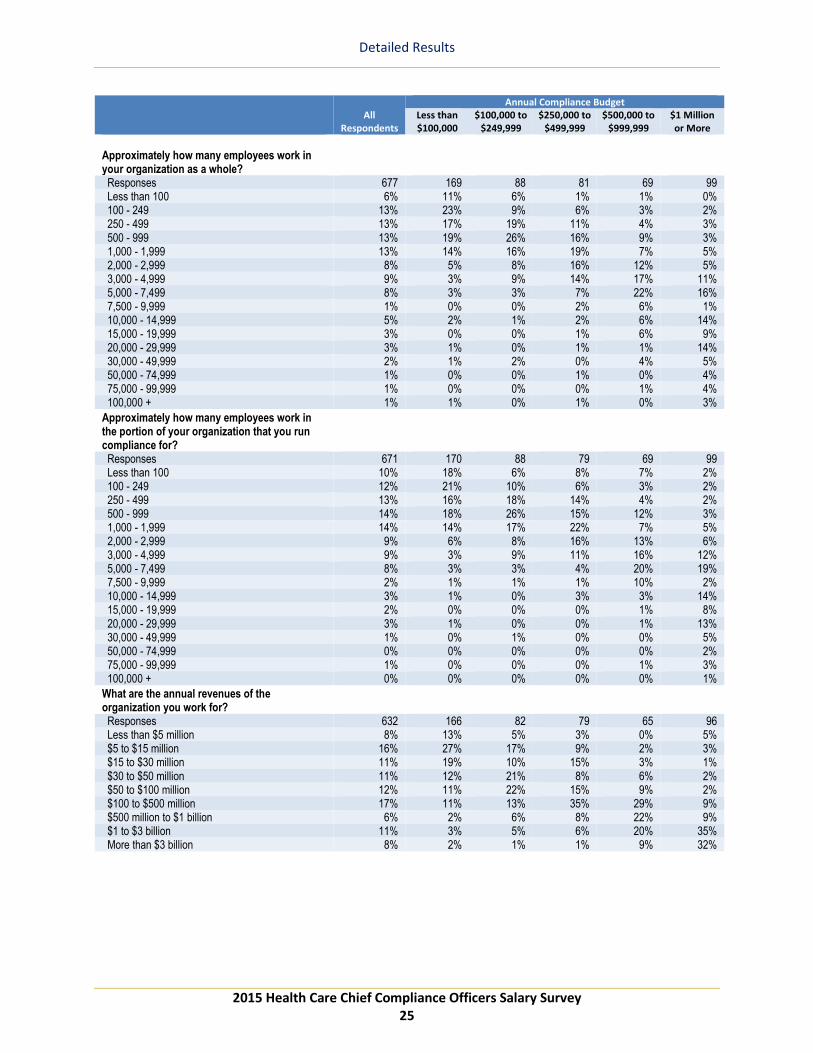
Approximately how many employees work in your organization as a whole?Responses 677 169 88 81 69 99Less than 100 6% 11% 6% 1% 1% 0%100 - 249 13% 23% 9% 6% 3% 2%250 - 499 13% 17% 19% 11% 4% 3%500 - 999 13% 19% 26% 16% 9% 3%1,000 - 1,999 13% 14% 16% 19% 7% 5%2,000 - 2,999 8% 5% 8% 16% 12% 5%3,000 - 4,999 9% 3% 9% 14% 17% 11%5,000 - 7,499 8% 3% 3% 7% 22% 16%7,500 - 9,999 1% 0% 0% 2% 6% 1%10,000 - 14,999 5% 2% 1% 2% 6% 14%15,000 - 19,999 3% 0% 0% 1% 6% 9%20,000 - 29,999 3% 1% 0% 1% 1% 14%30,000 - 49,999 2% 1% 2% 0% 4% 5%50,000 - 74,999 1% 0% 0% 1% 0% 4%75,000 - 99,999 1% 0% 0% 0% 1% 4%100,000 + 1% 1% 0% 1% 0% 3%
Approximately how many employees work in the portion of your organization that you run compliance for?Responses 671 170 88 79 69 99Less than 100 10% 18% 6% 8% 7% 2%100 - 249 12% 21% 10% 6% 3% 2%250 - 499 13% 16% 18% 14% 4% 2%500 - 999 14% 18% 26% 15% 12% 3%1,000 - 1,999 14% 14% 17% 22% 7% 5%2,000 - 2,999 9% 6% 8% 16% 13% 6%3,000 - 4,999 9% 3% 9% 11% 16% 12%5,000 - 7,499 8% 3% 3% 4% 20% 19%7,500 - 9,999 2% 1% 1% 1% 10% 2%10,000 - 14,999 3% 1% 0% 3% 3% 14%15,000 - 19,999 2% 0% 0% 0% 1% 8%20,000 - 29,999 3% 1% 0% 0% 1% 13%30,000 - 49,999 1% 0% 1% 0% 0% 5%50,000 - 74,999 0% 0% 0% 0% 0% 2%75,000 - 99,999 1% 0% 0% 0% 1% 3%100,000 + 0% 0% 0% 0% 0% 1%
What are the annual revenues of the organization you work for?Responses 632 166 82 79 65 96Less than $5 million 8% 13% 5% 3% 0% 5%$5 to $15 million 16% 27% 17% 9% 2% 3%$15 to $30 million 11% 19% 10% 15% 3% 1%$30 to $50 million 11% 12% 21% 8% 6% 2%$50 to $100 million 12% 11% 22% 15% 9% 2%$100 to $500 million 17% 11% 13% 35% 29% 9%$500 million to $1 billion 6% 2% 6% 8% 22% 9%$1 to $3 billion 11% 3% 5% 6% 20% 35%More than $3 billion 8% 2% 1% 1% 9% 32%

Detailed Results
2015 Health Care Chief Compliance Officers Salary Survey 26
All Respondents
Annual Compliance Budget Less than $100,000
$100,000 to $249,999
$250,000 to $499,999
$500,000 to $999,999
$1 Million or More
What are the annual revenues for the portion of the organization that your part of the compliance and ethics program oversees?Responses 639 169 85 79 66 94Less than $5 million 12% 17% 6% 6% 2% 10%$5 to $15 million 15% 25% 16% 9% 3% 2%$15 to $30 million 11% 19% 11% 14% 3% 1%$30 to $50 million 11% 11% 18% 9% 8% 2%$50 to $100 million 13% 11% 24% 19% 9% 3%$100 to $500 million 17% 12% 12% 33% 32% 13%$500 million to $1 billion 7% 2% 8% 6% 21% 10%$1 to $3 billion 10% 2% 5% 4% 18% 35%More than $3 billion 5% 1% 1% 0% 5% 24%
For how many countries do you manage compliance?Responses 670 168 87 80 66 991 97% 98% 99% 96% 97% 98%2 to 5 2% 2% 1% 3% 3% 1%6 to 10 0% 0% 0% 0% 0% 0%11 or more 1% 0% 0% 1% 0% 1%
Highest level of education attained:Responses 678 171 87 81 69 99Some college 10% 15% 7% 7% 6% 1%Bachelor's degree 31% 34% 36% 25% 32% 26%MBA 14% 16% 15% 15% 16% 15%Master's degree (non-MBA) 26% 22% 30% 26% 29% 24%JD 18% 13% 9% 25% 17% 31%PhD 2% 1% 3% 2% 0% 2%
Where do you work?Responses 654 165 85 78 68 93United States 99% 100% 98% 100% 99% 99%North America (outside US) 0% 0% 2% 0% 1% 0%South America 0% 0% 0% 0% 0% 1%Europe 0% 0% 0% 0% 0% 0%Asia 0% 0% 0% 0% 0% 0%Africa 0% 0% 0% 0% 0% 0%Australia 0% 0% 0% 0% 0% 0%

Detailed Results
2015 Health Care Chief Compliance Officers Salary Survey 27
All Respondents
Annual Compliance Budget Less than $100,000
$100,000 to $249,999
$250,000 to $499,999
$500,000 to $999,999
$1 Million or More
Percentage holding the following certifications:Responses 679 171 88 81 69 99Leading Professional in Ethics & Compliance
(LPEC) 0% 0% 0% 0% 0% 0%Certified Public Accountant (CPA) 4% 2% 2% 5% 13% 8%Certified Compliance and Ethics Professional
(CCEP) 5% 4% 2% 2% 9% 7%Certified Compliance and Ethics Professional
International (CCEP-I) 0% 0% 0% 0% 0% 1%Certified in Healthcare Compliance (CHC) 53% 45% 53% 60% 71% 58%Certified in Healthcare Research Compliance
(CHRC) 4% 0% 1% 1% 12% 11%Certified in Healthcare Privacy Compliance
(CHPC) 10% 6% 10% 9% 20% 14%Advanced Practitioner in Ethics and Compliance
Certification (APEX) 0% 0% 0% 0% 0% 0%Certified Fraud Examiner (CFE) 1% 2% 0% 0% 1% 4%Certified Internal Auditor (CIA) 2% 1% 2% 2% 6% 3%Certified Information Privacy Professional (CIPP) 1% 1% 0% 1% 0% 2%Professional in Human Resources (PHR) 0% 1% 0% 1% 0% 0%Senior Professionals in Human Resources
(SPHR) 2% 3% 3% 1% 0% 3%Health Ethics Trust Certified Compliance
Professional (CCP) 0% 0% 0% 0% 0% 0%Health Ethics Trust Certified Compliance
Executive (CCE) 1% 0% 0% 0% 3% 1%Accredited Healthcare Fraud Investigator (AHFI) 0% 1% 0% 0% 0% 0%Other 24% 22% 25% 19% 23% 30%
How many years have you managed a compliance department?Responses 676 171 88 79 69 991 13% 19% 10% 6% 3% 3%2 9% 13% 8% 8% 1% 5%3 10% 14% 10% 6% 12% 6%4 6% 8% 7% 8% 6% 1%5 10% 11% 13% 9% 6% 9%6 to 10 21% 18% 19% 28% 23% 30%11 to 15 20% 11% 24% 23% 33% 25%16 or more 11% 6% 9% 13% 16% 20%
Type of organization:Responses 678 171 88 81 68 99Non-profit 65% 65% 66% 73% 76% 64%Privately held 21% 25% 20% 17% 12% 10%Publicly traded 4% 2% 5% 1% 1% 7%Governmental 5% 6% 8% 7% 3% 4%Academic 4% 1% 0% 0% 6% 15%Other 1% 2% 1% 1% 1% 0%
Amount of bonus eligible:Responses 655 167 83 79 68 97None 51% 63% 58% 49% 41% 28%0-10% of salary 22% 19% 24% 22% 22% 18%11%-20% of salary 17% 15% 14% 22% 24% 18%21%-30% of salary 6% 2% 1% 6% 9% 22%31%-40% of salary 4% 1% 2% 1% 4% 15%41% or more of salary 0% 0% 0% 0% 0% 0%
Detailed Results
2015 Health Care Chief Compliance Officers Salary Survey 28
All Respondents
Annual Compliance Budget Less than $100,000
$100,000 to $249,999
$250,000 to $499,999
$500,000 to $999,999
$1 Million or More
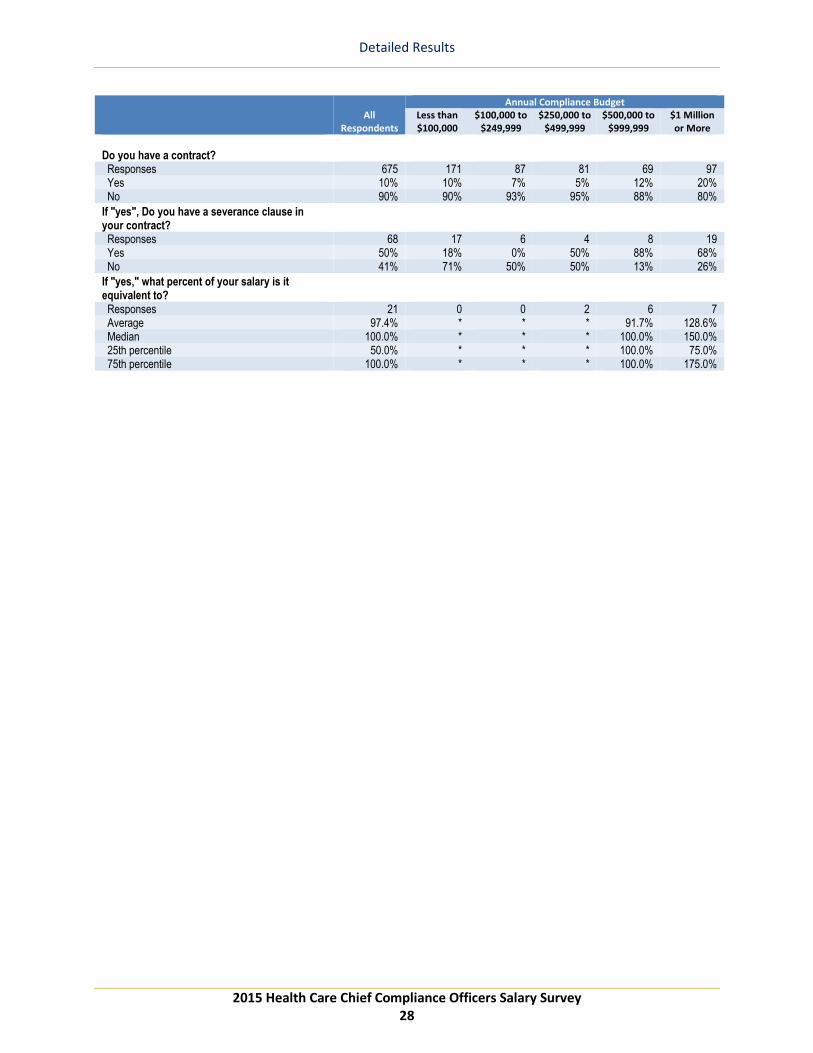
Do you have a contract?Responses 675 171 87 81 69 97Yes 10% 10% 7% 5% 12% 20%No 90% 90% 93% 95% 88% 80%
If "yes", Do you have a severance clause in your contract?Responses 68 17 6 4 8 19Yes 50% 18% 0% 50% 88% 68%No 41% 71% 50% 50% 13% 26%
If "yes," what percent of your salary is it equivalent to?Responses 21 0 0 2 6 7Average 97.4% * * * 91.7% 128.6%Median 100.0% * * * 100.0% 150.0%25th percentile 50.0% * * * 100.0% 75.0%75th percentile 100.0% * * * 100.0% 175.0%
I

Detailed Results
2015 Health Care Chief Compliance Officers Salary Survey 29
By Number of Employees in Organization as a Whole
Number of Employees in Organization as a Whole Less than
250 250 to
499 500 to
999 1,000 to
1,999 2,000 to
4,999 5,000 to 14,499
15,000 or More
Are you the Chief Compliance Officer for:Responses 123 90 90 86 118 92 78Your organization as a whole 89% 89% 88% 93% 81% 71% 44%A division or operating unit of the organization 11% 11% 12% 7% 19% 29% 56%
Percentage indicating involvement in the following compliance program elements:Responses 123 90 90 86 118 92 78Compliance/auditing/monitoring 93% 97% 92% 93% 95% 99% 100%Compliance education 98% 93% 99% 98% 100% 98% 97%Compliance investigations 94% 99% 98% 98% 98% 99% 100%Hot line/anonymous reporting 81% 90% 91% 95% 97% 96% 91%Reporting to the board 83% 84% 84% 86% 91% 88% 83%Compliance risk assessments 93% 94% 92% 92% 94% 98% 94%Compliance discipline/incentives 67% 77% 73% 71% 79% 83% 73%Code of conduct 87% 87% 87% 90% 92% 93% 88%Policies and procedures 98% 98% 97% 94% 100% 98% 95%Measuring program effectiveness 78% 87% 87% 87% 87% 89% 91%
How much of your company's legal and regulatory risk areas are you responsible for managing?Responses 123 90 90 86 118 92 7826%-50% 18% 22% 17% 27% 20% 25% 32%51%-75% 32% 34% 30% 38% 37% 38% 31%76%-100% 50% 43% 53% 35% 42% 37% 37%
How many employees, including yourself, are there in the compliance and ethics group you manage?Responses 122 90 90 85 117 91 771 57% 41% 41% 49% 22% 14% 10%2 to 5 31% 51% 51% 39% 54% 35% 25%6 to 10 7% 4% 4% 7% 16% 22% 23%11 to 15 2% 2% 1% 2% 5% 12% 8%16 to 20 2% 0% 0% 0% 2% 10% 16%21 to 30 0% 0% 0% 0% 1% 3% 9%31 to 40 1% 0% 0% 1% 0% 1% 1%41 to 50 0% 0% 0% 0% 0% 0% 4%More than 50 1% 1% 2% 1% 0% 2% 4%
Annual compliance budget managed:Responses 82 61 77 62 89 76 59Average $458,348 $496,123 $223,948 $278,139 $518,204 $929,420 $2,397,429Median $27,500 $100,000 $150,000 $155,000 $350,000 $700,000 $1,500,00025th percentile $1,250 $5,000 $10,000 $20,000 $200,000 $430,000 $625,00075th percentile $100,000 $230,000 $250,000 $347,500 $700,000 $1,200,000 $2,550,000

Detailed Results
2015 Health Care Chief Compliance Officers Salary Survey 30
Number of Employees in Organization as a Whole Less than
250 250 to
499 500 to
999 1,000 to
1,999 2,000 to
4,999 5,000 to 14,499
15,000 or More
Approximately how many employees work in your organization as a whole?Responses 123 90 90 86 118 92 78Less than 100 31% 0% 0% 0% 0% 0% 0%100 - 249 69% 0% 0% 0% 0% 0% 0%250 - 499 0% 100% 0% 0% 0% 0% 0%500 - 999 0% 0% 100% 0% 0% 0% 0%1,000 - 1,999 0% 0% 0% 100% 0% 0% 0%2,000 - 2,999 0% 0% 0% 0% 48% 0% 0%3,000 - 4,999 0% 0% 0% 0% 52% 0% 0%5,000 - 7,499 0% 0% 0% 0% 0% 55% 0%7,500 - 9,999 0% 0% 0% 0% 0% 11% 0%10,000 - 14,999 0% 0% 0% 0% 0% 34% 0%15,000 - 19,999 0% 0% 0% 0% 0% 0% 24%20,000 - 29,999 0% 0% 0% 0% 0% 0% 26%30,000 - 49,999 0% 0% 0% 0% 0% 0% 19%50,000 - 74,999 0% 0% 0% 0% 0% 0% 10%75,000 - 99,999 0% 0% 0% 0% 0% 0% 8%100,000 + 0% 0% 0% 0% 0% 0% 13%
Approximately how many employees work in the portion of your organization that you run compliance for?Responses 122 89 88 83 118 92 77Less than 100 37% 4% 3% 1% 6% 3% 5%100 - 249 63% 1% 0% 0% 1% 2% 1%250 - 499 0% 94% 0% 1% 1% 2% 0%500 - 999 0% 0% 95% 1% 2% 4% 3%1,000 - 1,999 0% 0% 0% 96% 4% 5% 3%2,000 - 2,999 0% 0% 0% 0% 42% 2% 8%3,000 - 4,999 0% 0% 0% 0% 44% 3% 5%5,000 - 7,499 0% 0% 0% 0% 0% 46% 12%7,500 - 9,999 0% 0% 0% 0% 0% 12% 4%10,000 - 14,999 0% 0% 0% 0% 0% 20% 6%15,000 - 19,999 0% 0% 0% 0% 0% 0% 16%20,000 - 29,999 0% 0% 1% 0% 1% 0% 21%30,000 - 49,999 0% 0% 0% 0% 0% 0% 8%50,000 - 74,999 0% 0% 0% 0% 0% 0% 3%75,000 - 99,999 0% 0% 0% 0% 0% 0% 5%100,000 + 0% 0% 0% 0% 0% 0% 1%
What are the annual revenues of the organization you work for?Responses 119 85 86 78 104 83 75Less than $5 million 24% 14% 6% 4% 2% 2% 0%$5 to $15 million 42% 16% 15% 10% 9% 2% 1%$15 to $30 million 20% 25% 15% 8% 8% 0% 0%$30 to $50 million 4% 31% 16% 13% 7% 7% 3%$50 to $100 million 6% 12% 27% 24% 11% 5% 0%$100 to $500 million 3% 2% 16% 32% 42% 10% 11%$500 million to $1 billion 0% 0% 2% 6% 13% 22% 4%$1 to $3 billion 0% 0% 1% 1% 8% 46% 29%More than $3 billion 0% 0% 1% 1% 2% 6% 52%

Detailed Results
2015 Health Care Chief Compliance Officers Salary Survey 31
Number of Employees in Organization as a Whole Less than
250 250 to
499 500 to
999 1,000 to
1,999 2,000 to
4,999 5,000 to 14,499
15,000 or More
What are the annual revenues for the portion of the organization that your part of the compliance and ethics program oversees?Responses 119 88 87 78 105 86 74Less than $5 million 28% 17% 9% 5% 7% 5% 5%$5 to $15 million 40% 14% 15% 13% 9% 5% 1%$15 to $30 million 18% 26% 11% 8% 9% 0% 1%$30 to $50 million 4% 28% 16% 10% 6% 6% 5%$50 to $100 million 6% 13% 28% 23% 10% 10% 3%$100 to $500 million 3% 2% 16% 35% 40% 10% 15%$500 million to $1 billion 0% 0% 2% 6% 13% 17% 8%$1 to $3 billion 0% 0% 1% 0% 4% 42% 28%More than $3 billion 0% 0% 1% 0% 3% 5% 32%
For how many countries do you manage compliance?Responses 122 90 90 84 117 88 771 98% 98% 93% 96% 98% 97% 99%2 to 5 2% 2% 6% 1% 2% 2% 1%6 to 10 0% 0% 0% 0% 0% 0% 0%11 or more 0% 0% 1% 2% 0% 1% 0%
Highest level of education attained:Responses 122 90 90 86 118 92 78Some college 25% 7% 10% 13% 5% 2% 4%Bachelor's degree 34% 33% 39% 38% 23% 26% 23%MBA 6% 18% 12% 10% 20% 12% 23%Master's degree (non-MBA) 25% 31% 24% 27% 23% 26% 26%JD 10% 8% 12% 12% 25% 34% 22%PhD 1% 3% 2% 0% 3% 0% 3%
Where do you work?Responses 118 88 87 82 114 89 75United States 99% 99% 98% 100% 100% 99% 99%North America (outside US) 0% 1% 1% 0% 0% 0% 1%South America 0% 0% 1% 0% 0% 0% 0%Europe 0% 0% 0% 0% 0% 0% 0%Asia 0% 0% 0% 0% 0% 1% 0%Africa 1% 0% 0% 0% 0% 0% 0%Australia 0% 0% 0% 0% 0% 0% 0%
Detailed Results
2015 Health Care Chief Compliance Officers Salary Survey 32
Number of Employees in Organization as a Whole Less than
250 250 to
499 500 to
999 1,000 to
1,999 2,000 to
4,999 5,000 to 14,499
15,000 or More
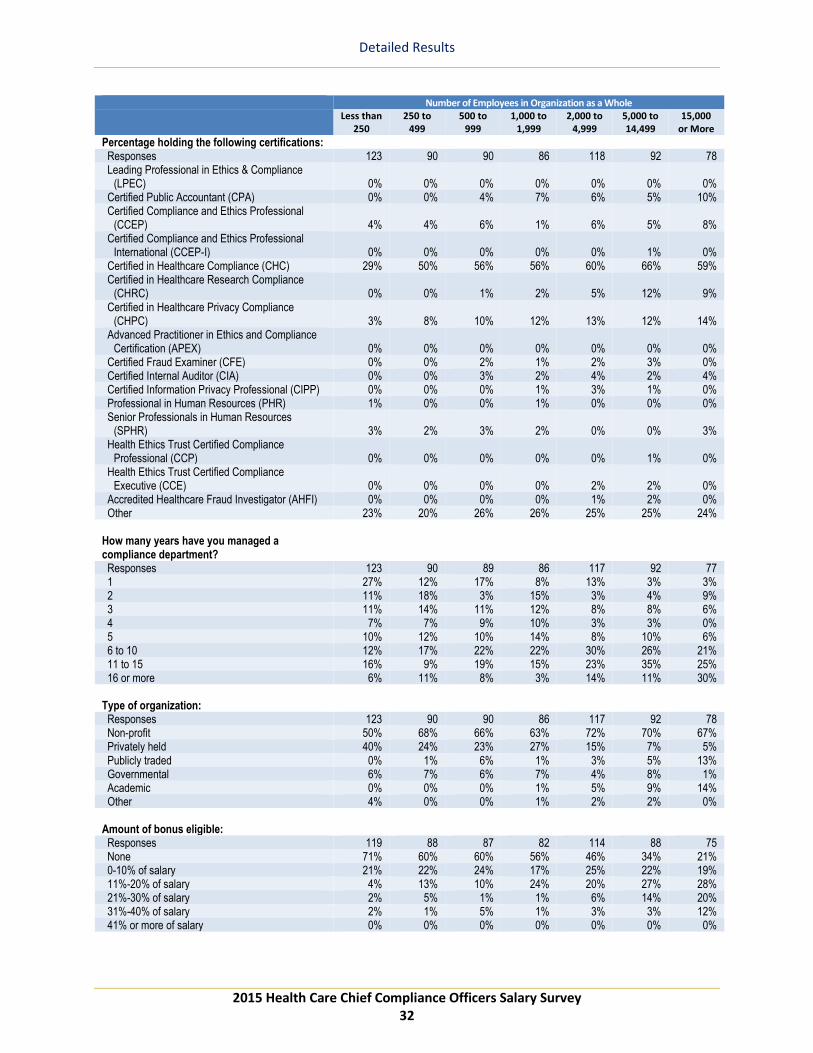
Percentage holding the following certifications:Responses 123 90 90 86 118 92 78Leading Professional in Ethics & Compliance
(LPEC) 0% 0% 0% 0% 0% 0% 0%Certified Public Accountant (CPA) 0% 0% 4% 7% 6% 5% 10%Certified Compliance and Ethics Professional
(CCEP) 4% 4% 6% 1% 6% 5% 8%Certified Compliance and Ethics Professional
International (CCEP-I) 0% 0% 0% 0% 0% 1% 0%Certified in Healthcare Compliance (CHC) 29% 50% 56% 56% 60% 66% 59%Certified in Healthcare Research Compliance
(CHRC) 0% 0% 1% 2% 5% 12% 9%Certified in Healthcare Privacy Compliance
(CHPC) 3% 8% 10% 12% 13% 12% 14%Advanced Practitioner in Ethics and Compliance
Certification (APEX) 0% 0% 0% 0% 0% 0% 0%Certified Fraud Examiner (CFE) 0% 0% 2% 1% 2% 3% 0%Certified Internal Auditor (CIA) 0% 0% 3% 2% 4% 2% 4%Certified Information Privacy Professional (CIPP) 0% 0% 0% 1% 3% 1% 0%Professional in Human Resources (PHR) 1% 0% 0% 1% 0% 0% 0%Senior Professionals in Human Resources
(SPHR) 3% 2% 3% 2% 0% 0% 3%Health Ethics Trust Certified Compliance
Professional (CCP) 0% 0% 0% 0% 0% 1% 0%Health Ethics Trust Certified Compliance
Executive (CCE) 0% 0% 0% 0% 2% 2% 0%Accredited Healthcare Fraud Investigator (AHFI) 0% 0% 0% 0% 1% 2% 0%Other 23% 20% 26% 26% 25% 25% 24%
How many years have you managed a compliance department?Responses 123 90 89 86 117 92 771 27% 12% 17% 8% 13% 3% 3%2 11% 18% 3% 15% 3% 4% 9%3 11% 14% 11% 12% 8% 8% 6%4 7% 7% 9% 10% 3% 3% 0%5 10% 12% 10% 14% 8% 10% 6%6 to 10 12% 17% 22% 22% 30% 26% 21%11 to 15 16% 9% 19% 15% 23% 35% 25%16 or more 6% 11% 8% 3% 14% 11% 30%
Type of organization:Responses 123 90 90 86 117 92 78Non-profit 50% 68% 66% 63% 72% 70% 67%Privately held 40% 24% 23% 27% 15% 7% 5%Publicly traded 0% 1% 6% 1% 3% 5% 13%Governmental 6% 7% 6% 7% 4% 8% 1%Academic 0% 0% 0% 1% 5% 9% 14%Other 4% 0% 0% 1% 2% 2% 0%
Amount of bonus eligible:Responses 119 88 87 82 114 88 75None 71% 60% 60% 56% 46% 34% 21%0-10% of salary 21% 22% 24% 17% 25% 22% 19%11%-20% of salary 4% 13% 10% 24% 20% 27% 28%21%-30% of salary 2% 5% 1% 1% 6% 14% 20%31%-40% of salary 2% 1% 5% 1% 3% 3% 12%41% or more of salary 0% 0% 0% 0% 0% 0% 0%

Detailed Results
2015 Health Care Chief Compliance Officers Salary Survey 33
Number of Employees in Organization as a Whole Less than
250 250 to
499 500 to
999 1,000 to
1,999 2,000 to
4,999 5,000 to 14,499
15,000 or More
Do you have a contract?Responses 122 90 90 86 118 90 77Yes 12% 7% 9% 8% 8% 13% 14%No 88% 93% 91% 92% 92% 87% 86%
If "yes", Do you have a severance clause in your contract?Responses 15 6 8 7 9 12 11Yes 33% 0% 38% 43% 67% 75% 73%No 60% 50% 50% 57% 33% 17% 27%
If "yes," what percent of your salary is it equivalent to?Responses 3 0 3 2 4 5 4Average * * * * * 90.0% *Median * * * * * 100.0% *25th percentile * * * * * 100.0% *75th percentile * * * * * 100.0% *

Health Care Compliance Staff Salary Survey


2015 Health Care Staff Salary Survey 35
Introduction
Introduction
2015 Health Care Staff Salary Survey 36
Introduction
About This Report
The 2015 Health Care Staff Salary Survey is another important service provided by the Health Care Compliance Association (HCCA) and the Society of Corporate Compliance and Ethics (SCCE). The information contained in this report represents complete and accurate compensation data on individuals working in the health care compliance profession. The report is designed to allow organizations and individuals to compare their salary to their peers. The salary data have been aggregated in the following groupings so organizations and individuals can compare their own data to the results of similar operations. These aggregations include:
• Title/Level • Compliance Responsibilities • Number of People that Report up through to Individual • Annual Compliance Budget for the Organization • Number of Employees in Portion of the Organization that Person Works in Compliance for • Annual Revenues in Portion of the Organization that Person Works in Compliance for • Number of Countries the Individual Works in • Number of Years Working in the Compliance Department • Type of Organization • Certifications Held • Advanced Degrees
As an organization or individual compares their salary information to that of the profession, it is important to remember that the statistics published in this report should be regarded as “guidelines” rather than “absolute standards.” Since organizations will differ, depending upon their location, size, and other factors, any two organizations may offer their employees a reasonably attractive compensation package and yet be very different. For example, duration of employment and nature of prior experience will obviously influence the compensation offering for a particular individual. Thus, a deviation between any one individual’s figures and a number appearing on a table in this report is not necessarily good or bad; it is merely an indication that additional scrutiny may be warranted. A minimum of five responses was required to show data. This study was conducted for HCCA/SCCE by Industry Insights, Inc., an independent professional survey research firm located in Dublin, Ohio. The company specializes in conducting industry operating surveys, compensation and benefits studies, and member attitude surveys for trade and professional associations. The HCCA/SCCE is proud to present the enclosed insights into the salary levels in the compliance industry. We wish to thank the professionals who submitted data for the study. Your support was essential in making this study a success.
Introduction
2015 Health Care Staff Salary Survey 37
Survey Methodology In June 2015, an email invitation was sent to approximately 45,000 individuals. In total, 1,489 completed online submissions were received by mid-August. Of the 1,489 responses, 658 worked for a healthcare provider organization. This report is based solely on this group. Upon receipt, all submissions were assigned a confidential identification number. All data were checked both manually and by a specially designed computer editing procedure. Strict confidence of survey responses was maintained throughout the course of the project. Final results were tabulated by Industry Insights, Inc., and the report was completed in October 2015. Definitions Average (mean): the arithmetic average obtained by adding the individual values for all responses to a particular question and dividing by the total number answering; a measure of central value that can be distorted by extreme high or low values. Median: a measure of central value that is not affected by extreme values; calculated by arranging all responses in numerical order and selecting the value that falls exactly in the middle, with half higher and half lower. 25th Percentile: when responses are ordered from lowest to highest, the lower quartile is the response 25% from the bottom. In other words, 75% of the responses are higher than this measure. 75th Percentile: when responses are ordered from the lowest to highest, the upper quartile is the response 25% from the top. In other words, 25% of the responses are higher than this measure.


2015 Health Care Staff Salary Survey 38
Respondent Profile
Respondent Profile
2015 Health Care Staff Salary Survey 39
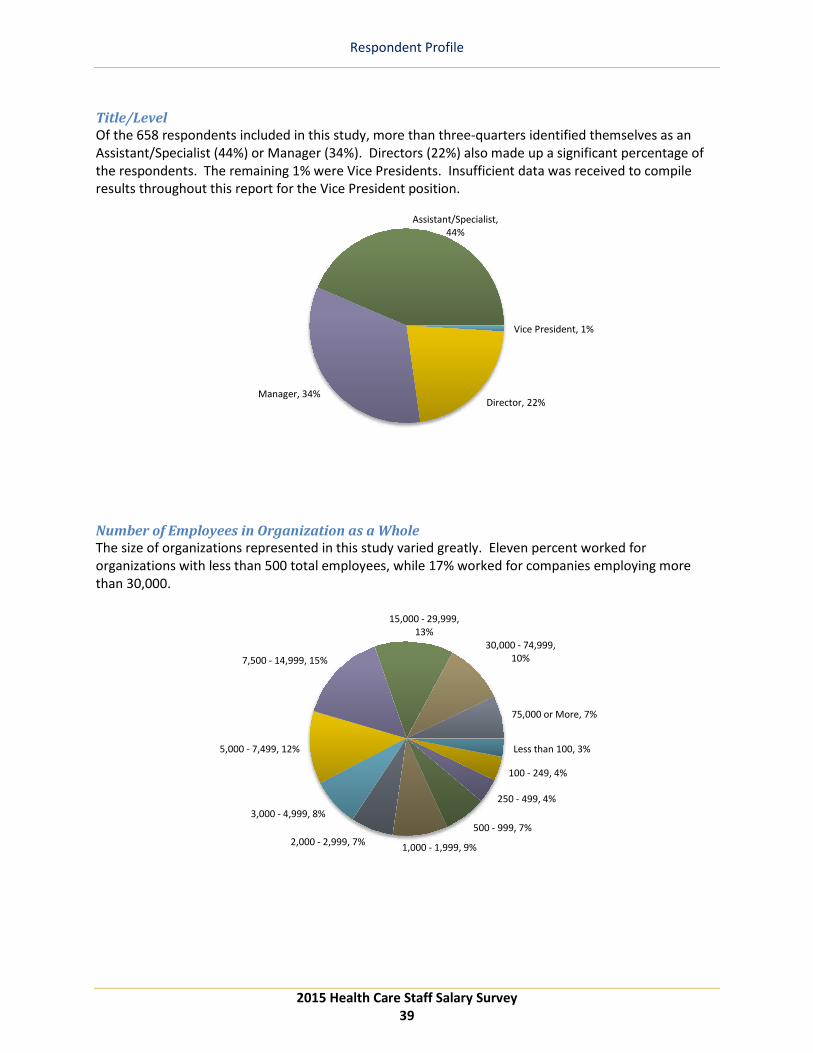
Title/Level Of the 658 respondents included in this study, more than three-quarters identified themselves as an Assistant/Specialist (44%) or Manager (34%). Directors (22%) also made up a significant percentage of the respondents. The remaining 1% were Vice Presidents. Insufficient data was received to compile results throughout this report for the Vice President position.
Number of Employees in Organization as a Whole The size of organizations represented in this study varied greatly. Eleven percent worked for organizations with less than 500 total employees, while 17% worked for companies employing more than 30,000.
Vice President, 1%
Director, 22%Manager, 34%
Assistant/Specialist, 44%
Less than 100, 3%
100 - 249, 4%
250 - 499, 4%
500 - 999, 7%
1,000 - 1,999, 9%2,000 - 2,999, 7%
3,000 - 4,999, 8%
5,000 - 7,499, 12%
7,500 - 14,999, 15%
15,000 - 29,999, 13%
30,000 - 74,999, 10%
75,000 or More, 7%

Respondent Profile
2015 Health Care Staff Salary Survey 40
Number of Employees in the Portion of the Organization that the Compliance Program Oversees The chart below looks at only the number of employees in the portion of the organization that the compliance program oversees. One fifth (19%) of the respondents reported that there were less than 100 employees in the portion of the organization that the compliance program oversees, while nearly another one fifth (18%) reported over 15,000 employees.
Annual Revenues of the Organization as a Whole The size of organizations responding by annual revenue also varied greatly. Nearly one-third (30%) of the respondents reported annual revenue of entire organization of less than $30 million, while one out of five (21%) respondents reported working for an organization with annual revenue of over $3 billion.
Less than 100, 19%
100 - 249, 5%250 - 999, 5%
1,000 - 1,999, 12%
2,000 - 2,999, 8%
3,000 - 4,999, 8%
5,000 - 7,499, 11%
7,500 - 14,999, 13%15,000 - 29,999, 9%
30,000 or More, 9%
Less than $5 million, 7%
$5 to $15 million, 14%
$15 to $30 million, 9%
$30 to $50 million, 6%
$50 to $100 million, 6%$100 to $500 million,
11%
$500 million to $1 billion, 10%
$1 billion to $3 billion, 16%
More than $3 billion, 21%

Respondent Profile
2015 Health Care Staff Salary Survey 41
Annual Revenues of the Portion of the Organization that the Compliance Program Oversees The chart below looks at only the annual revenues of the portion of the organization that the compliance program oversees.
Number of Countries in Which Compliance is Managed The vast majority respondents work in compliance in only one country.
Less than $5 million, 15%
$5 to $15 million, 13%
$15 to $30 million, 8%
$30 to $100 million, 15%
$100 to $500 million, 12%
$500 million to $1 billion, 10%
$1 billion to $3 billion, 15%
More than $3 billion, 13%
1, 98%2 or more, 2%
Respondent Profile
2015 Health Care Staff Salary Survey 42
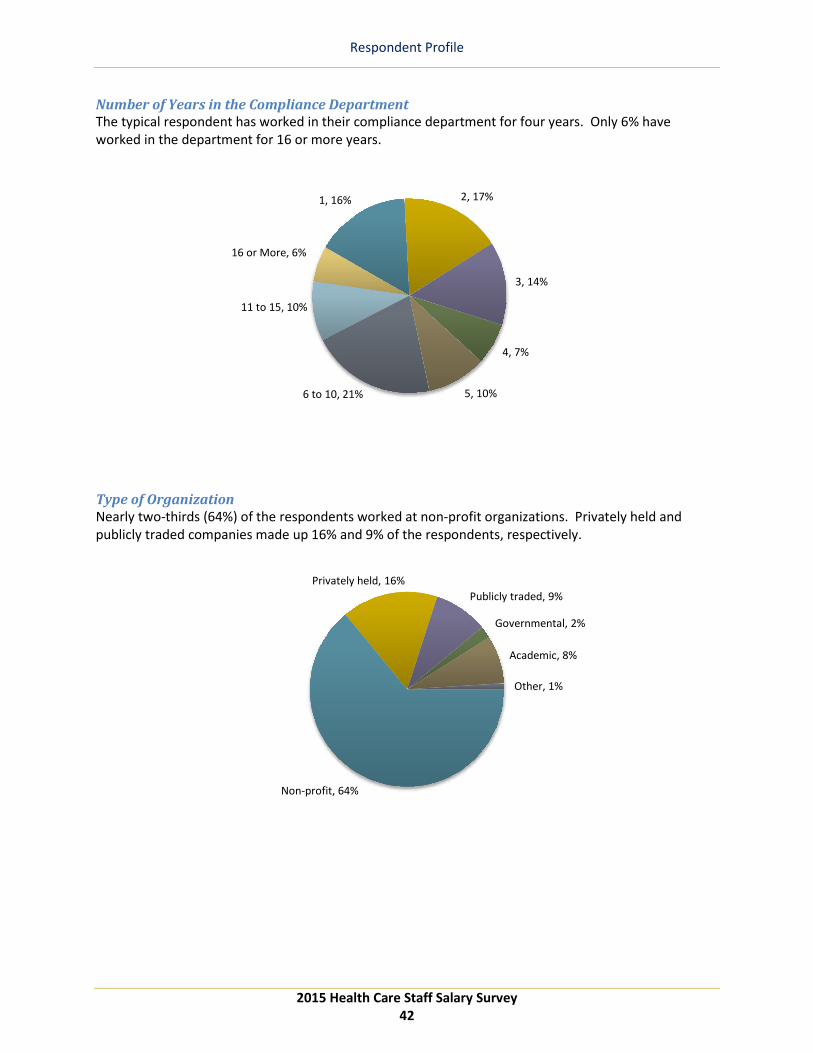
Number of Years in the Compliance Department The typical respondent has worked in their compliance department for four years. Only 6% have worked in the department for 16 or more years.
Type of Organization Nearly two-thirds (64%) of the respondents worked at non-profit organizations. Privately held and publicly traded companies made up 16% and 9% of the respondents, respectively.
1, 16% 2, 17%
3, 14%
4, 7%
5, 10%6 to 10, 21%
11 to 15, 10%
16 or More, 6%
Non-profit, 64%
Privately held, 16%Publicly traded, 9%
Governmental, 2%
Academic, 8%
Other, 1%

Respondent Profile
2015 Health Care Staff Salary Survey 43
Geographic Region The largest percentage of respondents were located in the South Atlantic (21%), Pacific (17%), and East North Central (16%) regions.
New England: NH, VT, ME, MA, RI, CT West North Central: ND, SD, NE, KS, MN, IA, MO Mid-Atlantic: NJ, NY, PA West South Central: TX, OK, AR, LA South Atlantic: DE, MD, DC, WV, VA, NC, SC, GA, FL Mountain: MT, ID, WY, NV, UT, CO, AZ, NM East North Central: WI, IL, IN, MI, OH Pacific: WA, OR, CA, AK, HI East South Central: KY, TN, MS, AL
New England, 5%
Middle Atlantic, 11%South Atlantic, 21%
East North Central, 16%
East South Central, 7%West North Central, 9%
West South Central, 8%
Mountain, 6%
Pacific, 17%

Respondent Profile
2015 Health Care Staff Salary Survey 44
Percentage indicating the elements of the compliance program that they are primarily involved in: A large percentage of respondents indicated that they were primarily involved in policies and procedures, compliance education, compliance investigations and compliance/auditing/monitoring.
Director Manager Assistant/ Specialist
Compliance/auditing/monitoring 89% 85% 84%
Compliance education 91% 87% 77%
Compliance investigations 91% 80% 73%
Hot line/anonymous reporting 71% 59% 43%
Reporting to the board 53% 32% 21%
Compliance risk assessments 82% 67% 55%
Compliance discipline/incentives 57% 35% 23%
Code of conduct 68% 50% 31%
Policies and procedures 91% 84% 74%
Measuring program effectiveness 70% 56% 38%
How many people report up through to the individual? The number of people reporting up through to the respondent varied widely by title/level. More than one-third (35%) of the Directors reported that three or more people reported to them, while only 2% of the responding Assistant/Specialists reported three or more people reporting to them.
Director Manager Assistant/ Specialist
0 38% 54% 91%
1 to 2 27% 26% 7%
3 to 5 19% 13% 1%
6 to 10 12% 5% 1%
11 or more 4% 3% 0%

Respondent Profile
2015 Health Care Staff Salary Survey 45
How much of your company's legal and regulatory risk areas would you estimate the compliance department is responsible for managing? More than two-thirds of the respondents indicated that their compliance department is responsible for managing over 50% of the company’s legal and regulatory risk.
Director Manager Assistant/ Specialist
0-25% 9% 10% 11%
26%-50% 18% 20% 19%
51%-75% 29% 31% 29%
76%-100% 44% 39% 41%
Percentage holding the following certifications: Across all levels, the Certified Healthcare Compliance (CHC) designation was held by at least one-third of all survey respondent.
Director Manager Assistant/ Specialist
Leading Professional in Ethics & Compliance (LPEC) 0% 0% 0%
Certified Public Accountant (CPA) 3% 1% 1%
Certified Compliance and Ethics Professional (CCEP) 4% 1% 1%
Certified Compliance and Ethics Professional International (CCEP-I) 1% 0% 0%
Certified in Healthcare Compliance (CHC) 55% 47% 34%
Certified in Healthcare Research Compliance (CHRC) 6% 3% 3%
Certified in Healthcare Privacy Compliance (CHPC) 18% 11% 5%
Advanced Practitioner in Ethics and Compliance Certification (APEX) 0% 0% 0%
Certified Fraud Examiner (CFE) 2% 2% 1%
Certified Internal Auditor (CIA) 1% 1% 1%
Certified Information Privacy Professional (CIPP) 1% 1% 0%
Professional in Human Resources (PHR) 1% 0% 0%
Senior Professionals in Human Resources (SPHR) 1% 0% 0%
Health Ethics Trust Certified Compliance Professional (CCP) 1% 0% 1%
Health Ethics Trust Certified Compliance Executive (CCE) 0% 0% 0%
Accredited Healthcare Fraud Investigator (AHFI) 0% 1% 0%

Respondent Profile
2015 Health Care Staff Salary Survey 46
Highest education level attained The vast majority of all respondents have at least a bachelor’s degree. More than half of responding Directors have an advanced degree.
Director Manager Assistant/ Specialist
Some college 8% 16% 21%
Bachelor's degree 26% 35% 44%
MBA 19% 11% 7%
Master's degree (non-MBA) 25% 22% 16%
JD 20% 13% 11%
PhD 1% 3% 1%
Do you have a contract? The vast majority of respondents do not have an employment contract.
Director Manager Assistant/ Specialist
Yes 4% 4% 4%
No 96% 96% 96%

2015 Health Care Staff Salary Survey 47
Executive Summary
Executive Summary
2015 Health Care Staff Salary Survey 48
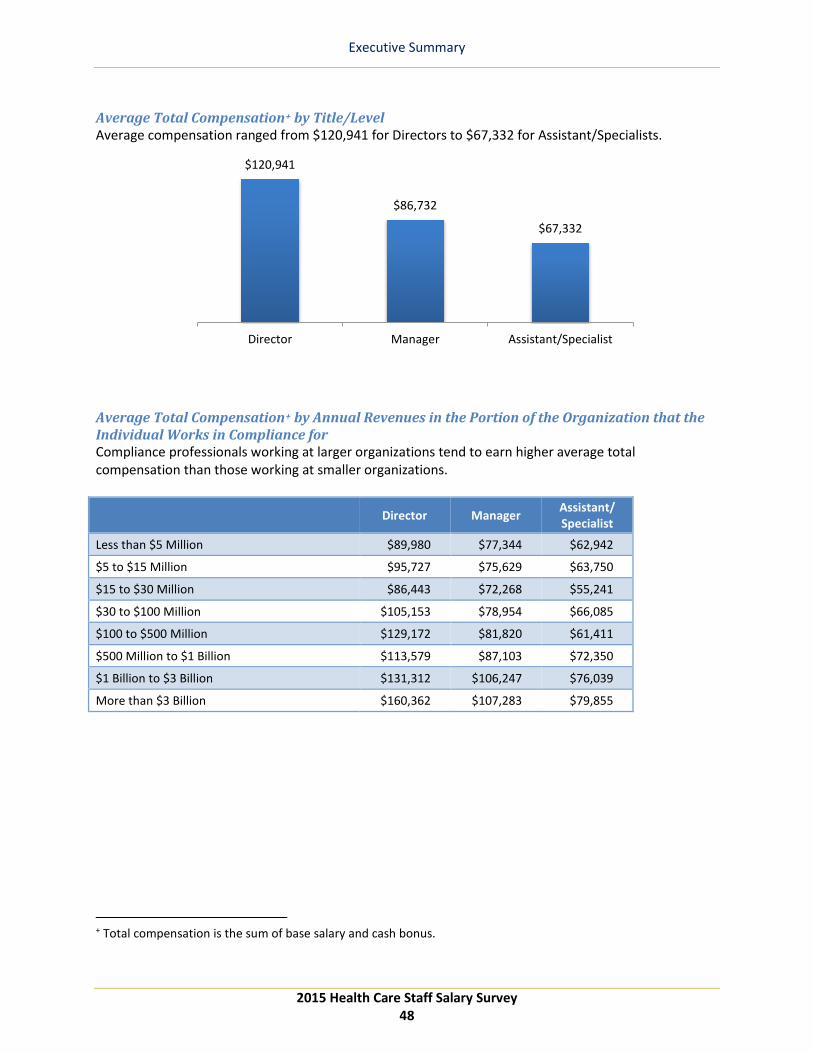
Average Total Compensation+ by Title/Level Average compensation ranged from $120,941 for Directors to $67,332 for Assistant/Specialists.
Average Total Compensation+ by Annual Revenues in the Portion of the Organization that the Individual Works in Compliance for Compliance professionals working at larger organizations tend to earn higher average total compensation than those working at smaller organizations.
Director Manager Assistant/ Specialist
Less than $5 Million $89,980 $77,344 $62,942
$5 to $15 Million $95,727 $75,629 $63,750
$15 to $30 Million $86,443 $72,268 $55,241
$30 to $100 Million $105,153 $78,954 $66,085
$100 to $500 Million $129,172 $81,820 $61,411
$500 Million to $1 Billion $113,579 $87,103 $72,350
$1 Billion to $3 Billion $131,312 $106,247 $76,039
More than $3 Billion $160,362 $107,283 $79,855
+ Total compensation is the sum of base salary and cash bonus.
$120,941
$86,732
$67,332
Director Manager Assistant/Specialist
Executive Summary
2015 Health Care Staff Salary Survey 49
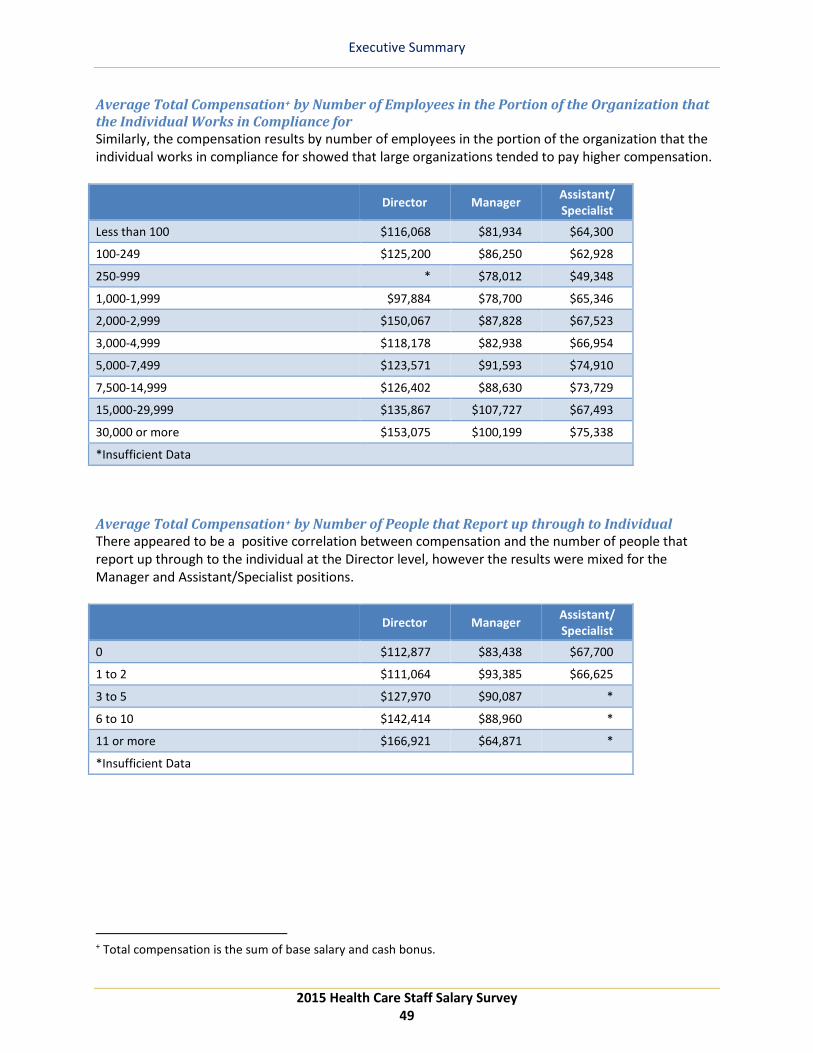
Average Total Compensation+ by Number of Employees in the Portion of the Organization that the Individual Works in Compliance for Similarly, the compensation results by number of employees in the portion of the organization that the individual works in compliance for showed that large organizations tended to pay higher compensation.
Director Manager Assistant/ Specialist
Less than 100 $116,068 $81,934 $64,300
100-249 $125,200 $86,250 $62,928
250-999 * $78,012 $49,348
1,000-1,999 $97,884 $78,700 $65,346
2,000-2,999 $150,067 $87,828 $67,523
3,000-4,999 $118,178 $82,938 $66,954
5,000-7,499 $123,571 $91,593 $74,910
7,500-14,999 $126,402 $88,630 $73,729
15,000-29,999 $135,867 $107,727 $67,493
30,000 or more $153,075 $100,199 $75,338
*Insufficient Data
Average Total Compensation+ by Number of People that Report up through to Individual There appeared to be a positive correlation between compensation and the number of people that report up through to the individual at the Director level, however the results were mixed for the Manager and Assistant/Specialist positions.
Director Manager Assistant/ Specialist
0 $112,877 $83,438 $67,700
1 to 2 $111,064 $93,385 $66,625
3 to 5 $127,970 $90,087 *
6 to 10 $142,414 $88,960 *
11 or more $166,921 $64,871 *
*Insufficient Data
+ Total compensation is the sum of base salary and cash bonus.

Executive Summary
2015 Health Care Staff Salary Survey 50
Average Total Compensation+ by Title/Level and Type of Organization When looking at type of organization, privately held companies paid lower total compensation than non-profit, publicly held, governmental and academic organizations.
Director Manager Assistant/ Specialist
Non-Profit $124,062 $86,429 $68,307
Privately Held $105,415 $73,341 $62,522
Publicly Traded $121,976 $96,571 $64,062
Governmental $124,055 $112,833 *
Academic $123,336 $98,376 $70,935
*Insufficient Data
Average Total Compensation+ by Title/Level and Certifications Held Respondents with a certification earned more than those without one. Nearly half of the respondents to the survey held a Certified in Healthcare Compliance (CHC) designation.
Director Manager Assistant/ Specialist
Certified Compliance and Ethics Professional (CCEP) $141,260 * *
Certified In Healthcare Compliance (CHC) $123,716 $93,549 $70,858 Certified In Healthcare Privacy Compliance (CHPC) $135,133 $93,513 $71,976
No Certifications $112,881 $77,430 $63,717
*Insufficient Data
+ Total compensation is the sum of base salary and cash bonus.

Executive Summary
2015 Health Care Staff Salary Survey 51
Average Total Compensation+ by Title/Level and Number of Elements of a Compliance Program the Individual is Involved in No clear correlation existed between compensation and the number of elements of the compliance program the individual is involved in.
Director Manager Assistant/ Specialist
1 to 3 $129,769 $84,049 $66,830
4 to 6 $108,059 $87,007 $66,650
7 to 9 $126,793 $89,360 $66,733
All 10 $118,214 $81,453 $83,850
Average Total Compensation+ by Title/Level and Whether the Individual has a Contract Respondents with no contract tended to earn the same or more than those with a contract.
Director Manager Assistant/ Specialist
Has Contract $110,700 $87,489 $61,049
No Contract $120,919 $86,699 $67,585
Amount of bonus eligible: More than half of the responding Directors indicated that they were bonus eligible. One-third of responding Managers and one-quarter Assistant/Specialists indicated they were bonus eligible. Directors also reported higher percentage of their salaries as being bonus eligible.
Director Manager Assistant/ Specialist
None 46% 66% 75%
0-10% of salary 22% 25% 21%
11%-20% of salary 25% 8% 4%
21%-30% of salary 7% 0% 0%
31%-40% of salary 1% 1% 0%
41% or more of salary 0% 0% 0%


2015 Health Care Staff Salary Survey 52
Salary Data
Salary Data
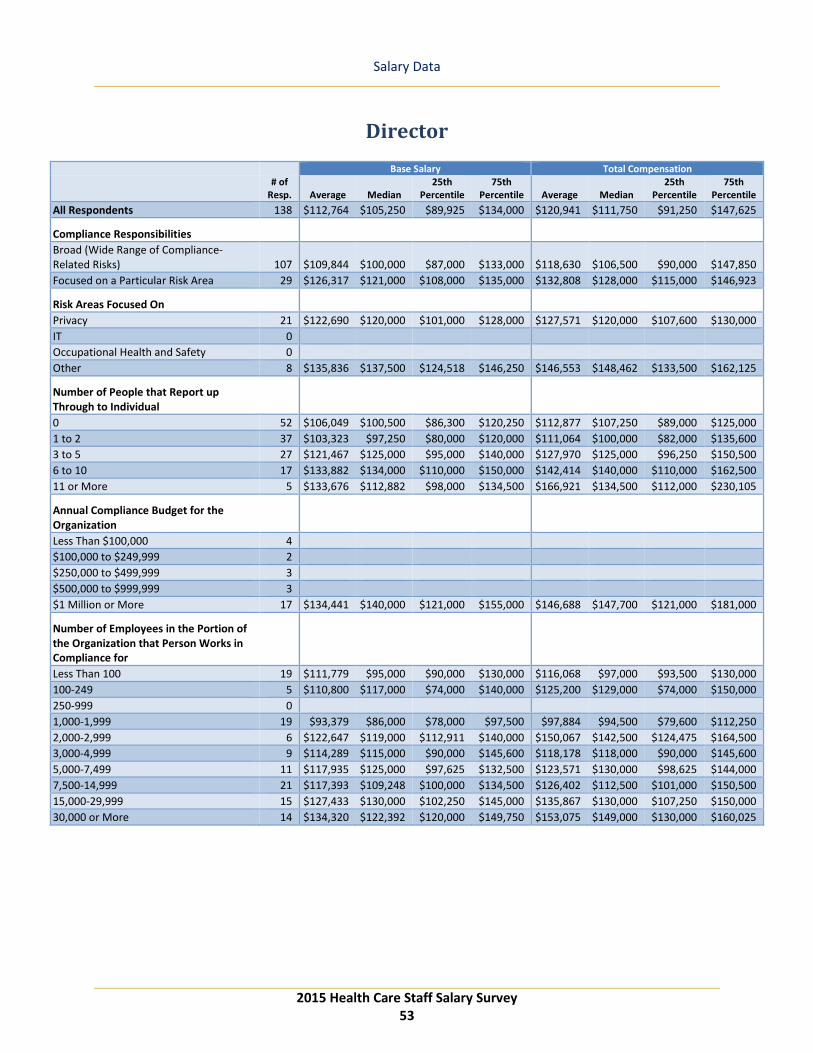
2015 Health Care Staff Salary Survey 53
Director
Base Salary Total Compensation
# of
Resp. Average Median 25th
Percentile 75th
Percentile Average Median 25th
Percentile 75th
Percentile All Respondents 138 $112,764 $105,250 $89,925 $134,000 $120,941 $111,750 $91,250 $147,625
Compliance Responsibilities Broad (Wide Range of Compliance-Related Risks) 107 $109,844 $100,000 $87,000 $133,000 $118,630 $106,500 $90,000 $147,850 Focused on a Particular Risk Area 29 $126,317 $121,000 $108,000 $135,000 $132,808 $128,000 $115,000 $146,923
Risk Areas Focused On Privacy 21 $122,690 $120,000 $101,000 $128,000 $127,571 $120,000 $107,600 $130,000 IT 0 Occupational Health and Safety 0 Other 8 $135,836 $137,500 $124,518 $146,250 $146,553 $148,462 $133,500 $162,125
Number of People that Report up Through to Individual 0 52 $106,049 $100,500 $86,300 $120,250 $112,877 $107,250 $89,000 $125,000 1 to 2 37 $103,323 $97,250 $80,000 $120,000 $111,064 $100,000 $82,000 $135,600 3 to 5 27 $121,467 $125,000 $95,000 $140,000 $127,970 $125,000 $96,250 $150,500 6 to 10 17 $133,882 $134,000 $110,000 $150,000 $142,414 $140,000 $110,000 $162,500 11 or More 5 $133,676 $112,882 $98,000 $134,500 $166,921 $134,500 $112,000 $230,105
Annual Compliance Budget for the Organization Less Than $100,000 4 $100,000 to $249,999 2 $250,000 to $499,999 3 $500,000 to $999,999 3 $1 Million or More 17 $134,441 $140,000 $121,000 $155,000 $146,688 $147,700 $121,000 $181,000
Number of Employees in the Portion of the Organization that Person Works in Compliance for Less Than 100 19 $111,779 $95,000 $90,000 $130,000 $116,068 $97,000 $93,500 $130,000 100-249 5 $110,800 $117,000 $74,000 $140,000 $125,200 $129,000 $74,000 $150,000 250-999 0 1,000-1,999 19 $93,379 $86,000 $78,000 $97,500 $97,884 $94,500 $79,600 $112,250 2,000-2,999 6 $122,647 $119,000 $112,911 $140,000 $150,067 $142,500 $124,475 $164,500 3,000-4,999 9 $114,289 $115,000 $90,000 $145,600 $118,178 $118,000 $90,000 $145,600 5,000-7,499 11 $117,935 $125,000 $97,625 $132,500 $123,571 $130,000 $98,625 $144,000 7,500-14,999 21 $117,393 $109,248 $100,000 $134,500 $126,402 $112,500 $101,000 $150,500 15,000-29,999 15 $127,433 $130,000 $102,250 $145,000 $135,867 $130,000 $107,250 $150,000 30,000 or More 14 $134,320 $122,392 $120,000 $149,750 $153,075 $149,000 $130,000 $160,025

Salary Data
Director (continued)
2015 Health Care Staff Salary Survey 54
Base Salary Total Compensation
# of
Resp. Average Median 25th
Percentile 75th
Percentile Average Median 25th
Percentile 75th
Percentile
Annual Revenues in the Portion of the Organization that Person Works in Compliance for Less Than $5 Million 10 $88,180 $91,500 $69,000 $96,500 $89,980 $93,000 $69,000 $96,500 $5 to $15 Million 11 $94,136 $90,000 $79,000 $103,250 $95,727 $90,000 $82,250 $108,250 $15 to $30 Million 7 $83,571 $75,000 $69,000 $91,000 $86,443 $83,000 $70,000 $93,250 $30 to $100 Million 17 $99,853 $100,000 $78,000 $118,000 $105,153 $100,000 $83,000 $124,300 $100 to $500 Million 18 $116,177 $110,241 $88,500 $140,000 $129,172 $122,500 $96,750 $150,250 $500 Million to $1 Billion 14 $108,543 $100,500 $95,750 $118,750 $113,579 $100,500 $96,500 $129,250 $1 to $3 Billion 30 $122,814 $118,500 $96,250 $147,500 $131,312 $125,500 $103,500 $150,875 More Than $3 Billion 18 $141,249 $127,845 $120,446 $167,750 $160,362 $145,962 $125,000 $202,250
Number of Countries the Individual Works in 1 134 $111,683 $103,500 $89,225 $131,500 $119,543 $110,750 $90,250 $146,592 2 to 5 2 6 to 10 0 11 or More 1
Number of Employees in Compliance and Ethics Group 1 to 5 49 $102,753 $95,000 $81,200 $115,000 $109,582 $96,000 $82,000 $125,000 6 to 10 35 $103,557 $98,000 $80,000 $121,500 $110,640 $98,000 $84,000 $129,500 11 to 20 29 $128,926 $130,000 $107,600 $140,000 $136,424 $132,000 $110,000 $150,000 21 to 50 15 $115,132 $120,000 $101,000 $123,737 $125,268 $121,000 $101,000 $150,000 More than 50 9 $140,916 $153,000 $109,248 $155,000 $159,950 $155,000 $115,000 $205,000
Number of Years Working in the Compliance Department 1 9 $103,289 $92,000 $74,000 $140,000 $105,011 $97,500 $81,000 $140,000 2 13 $101,346 $102,500 $78,000 $120,000 $105,854 $110,000 $78,000 $125,000 3 17 $110,781 $110,000 $78,000 $125,690 $120,943 $116,000 $81,200 $149,000 4 5 $102,100 $95,000 $78,000 $106,500 $105,800 $106,500 $78,000 $108,500 5 14 $98,714 $95,000 $88,500 $117,000 $104,750 $97,500 $90,750 $119,500 6 to 10 37 $117,659 $113,000 $94,000 $134,500 $127,503 $118,000 $95,000 $150,000 11 to 15 26 $120,671 $114,624 $95,000 $143,750 $128,113 $119,500 $95,250 $149,425 16 or More 17 $120,458 $120,000 $95,000 $145,000 $133,441 $128,000 $98,000 $155,000
Type of Organization Non-Profit 75 $116,172 $110,000 $91,000 $140,000 $124,062 $112,548 $93,000 $150,000 Privately Held 23 $100,480 $90,000 $80,000 $119,000 $105,415 $95,000 $86,250 $122,150 Publicly Traded 20 $108,324 $110,500 $93,000 $122,088 $121,976 $118,000 $95,000 $147,442 Governmental 6 $121,822 $115,000 $92,425 $133,000 $124,055 $115,000 $92,425 $143,050 Academic 11 $112,282 $107,600 $95,000 $125,500 $123,336 $107,600 $95,000 $135,050 Other 1

Salary Data
Director (continued)
2015 Health Care Staff Salary Survey 55
Base Salary Total Compensation
# of
Resp. Average Median 25th
Percentile 75th
Percentile Average Median 25th
Percentile 75th
Percentile
Certifications Held Certified Compliance and Ethics Professional (CCEP) 5 $134,400 $140,000 $113,000 $151,000 $141,260 $140,000 $124,300 $151,000 Certified Compliance and Ethics Professional-International (CCEP-I) 1 Certified In Healthcare Compliance (CHC) 76 $116,064 $110,000 $90,000 $134,625 $123,716 $113,774 $91,750 $150,000 Certified In Healthcare Privacy Compliance (CHPC) 26 $127,713 $120,000 $100,250 $134,000 $135,133 $122,500 $107,700 $149,000 Certified Fraud Examiner (CFE) 2 Certified Internal Auditor (CIA) 2 Certified Public Accountant (CPA) 4 No Certifications 35 $107,076 $100,000 $83,000 $127,500 $112,881 $100,000 $88,000 $130,000
Highest Level of Education Some College 11 $105,545 $94,000 $85,000 $112,000 $116,409 $95,000 $89,750 $128,000 Bachelor’s Degree 37 $107,240 $97,000 $81,200 $125,690 $111,692 $97,000 $82,000 $144,500 MBA 27 $115,420 $107,600 $96,500 $128,000 $125,144 $112,548 $99,000 $137,500 Master’s Degree (non-MBA) 35 $102,594 $101,000 $78,000 $125,000 $107,589 $110,000 $81,500 $128,500 JD 25 $137,184 $135,000 $113,000 $155,000 $148,564 $149,000 $128,000 $155,000 PhD 2
Number of Elements of a Compliance Program the Individual is Involved in 1 to 3 11 $123,066 $125,000 $97,000 $131,000 $129,769 $125,000 $102,500 $145,712 4 to 6 27 $99,192 $100,000 $79,000 $118,500 $108,059 $100,000 $82,100 $121,000 7 to 9 61 $117,580 $113,000 $92,000 $140,000 $126,793 $120,000 $95,000 $150,000 All 10 39 $111,724 $108,000 $87,500 $133,250 $118,214 $110,000 $89,950 $140,000
Do You Have A Contract? Yes 5 $105,000 $100,000 $95,000 $100,000 $110,700 $112,500 $95,000 $116,000 No 132 $112,587 $107,050 $88,750 $134,000 $120,919 $111,250 $90,750 $147,775
Geographic Region New England 5 $125,320 $145,600 $121,000 $150,000 $125,420 $145,600 $121,000 $150,000 Middle Atlantic 14 $110,074 $97,500 $75,750 $115,250 $120,667 $97,500 $75,750 $172,099 South Atlantic 25 $106,416 $101,000 $89,000 $132,000 $110,100 $110,000 $89,900 $132,000 East North Central 10 $116,900 $108,500 $92,000 $145,000 $127,050 $117,000 $98,500 $154,375 East South Central 12 $105,894 $110,000 $91,500 $122,088 $120,606 $130,000 $91,500 $149,250 West North Central 10 $102,233 $106,624 $89,250 $112,970 $121,085 $115,774 $97,500 $129,250 West South Central 8 $103,500 $98,500 $82,250 $123,750 $108,938 $98,500 $85,625 $127,750 Mountain 11 $105,909 $100,000 $90,000 $115,000 $109,455 $108,000 $95,250 $118,000 Pacific 10 $144,760 $147,500 $118,500 $167,250 $159,563 $155,000 $123,500 $197,000
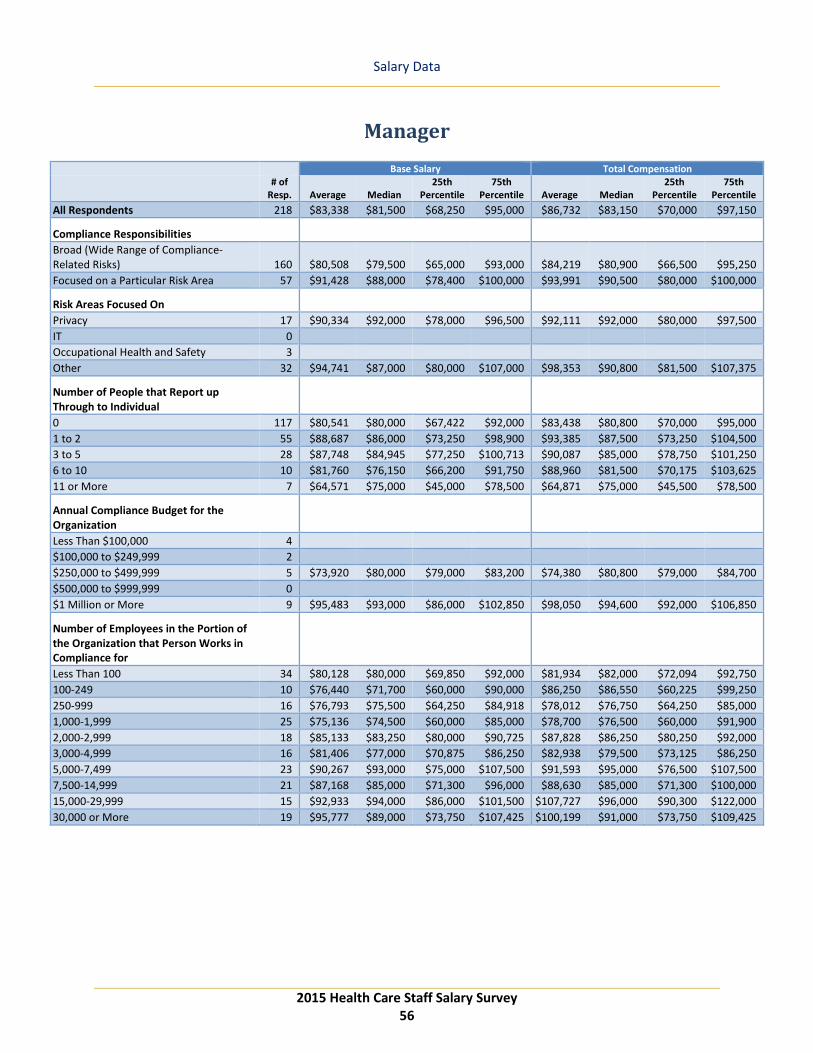
Salary Data
2015 Health Care Staff Salary Survey 56
Manager
Base Salary Total Compensation
# of
Resp. Average Median 25th
Percentile 75th
Percentile Average Median 25th
Percentile 75th
Percentile All Respondents 218 $83,338 $81,500 $68,250 $95,000 $86,732 $83,150 $70,000 $97,150
Compliance Responsibilities Broad (Wide Range of Compliance-Related Risks) 160 $80,508 $79,500 $65,000 $93,000 $84,219 $80,900 $66,500 $95,250 Focused on a Particular Risk Area 57 $91,428 $88,000 $78,400 $100,000 $93,991 $90,500 $80,000 $100,000
Risk Areas Focused On Privacy 17 $90,334 $92,000 $78,000 $96,500 $92,111 $92,000 $80,000 $97,500 IT 0 Occupational Health and Safety 3 Other 32 $94,741 $87,000 $80,000 $107,000 $98,353 $90,800 $81,500 $107,375
Number of People that Report up Through to Individual 0 117 $80,541 $80,000 $67,422 $92,000 $83,438 $80,800 $70,000 $95,000 1 to 2 55 $88,687 $86,000 $73,250 $98,900 $93,385 $87,500 $73,250 $104,500 3 to 5 28 $87,748 $84,945 $77,250 $100,713 $90,087 $85,000 $78,750 $101,250 6 to 10 10 $81,760 $76,150 $66,200 $91,750 $88,960 $81,500 $70,175 $103,625 11 or More 7 $64,571 $75,000 $45,000 $78,500 $64,871 $75,000 $45,500 $78,500
Annual Compliance Budget for the Organization Less Than $100,000 4 $100,000 to $249,999 2 $250,000 to $499,999 5 $73,920 $80,000 $79,000 $83,200 $74,380 $80,800 $79,000 $84,700 $500,000 to $999,999 0 $1 Million or More 9 $95,483 $93,000 $86,000 $102,850 $98,050 $94,600 $92,000 $106,850
Number of Employees in the Portion of the Organization that Person Works in Compliance for Less Than 100 34 $80,128 $80,000 $69,850 $92,000 $81,934 $82,000 $72,094 $92,750 100-249 10 $76,440 $71,700 $60,000 $90,000 $86,250 $86,550 $60,225 $99,250 250-999 16 $76,793 $75,500 $64,250 $84,918 $78,012 $76,750 $64,250 $85,000 1,000-1,999 25 $75,136 $74,500 $60,000 $85,000 $78,700 $76,500 $60,000 $91,900 2,000-2,999 18 $85,133 $83,250 $80,000 $90,725 $87,828 $86,250 $80,250 $92,000 3,000-4,999 16 $81,406 $77,000 $70,875 $86,250 $82,938 $79,500 $73,125 $86,250 5,000-7,499 23 $90,267 $93,000 $75,000 $107,500 $91,593 $95,000 $76,500 $107,500 7,500-14,999 21 $87,168 $85,000 $71,300 $96,000 $88,630 $85,000 $71,300 $100,000 15,000-29,999 15 $92,933 $94,000 $86,000 $101,500 $107,727 $96,000 $90,300 $122,000 30,000 or More 19 $95,777 $89,000 $73,750 $107,425 $100,199 $91,000 $73,750 $109,425

Salary Data
Manager (continued)
2015 Health Care Staff Salary Survey 57
Base Salary Total Compensation
# of
Resp. Average Median 25th
Percentile 75th
Percentile Average Median 25th
Percentile 75th
Percentile
Annual Revenues in the Portion of the Organization that Person Works in Compliance for Less Than $5 Million 30 $75,588 $70,980 $60,500 $91,500 $77,344 $70,980 $60,500 $92,750 $5 to $15 Million 24 $75,083 $76,250 $67,875 $85,750 $75,629 $76,750 $69,375 $85,750 $15 to $30 Million 22 $70,755 $72,000 $60,000 $82,750 $72,268 $75,000 $60,225 $82,750 $30 to $100 Million 23 $77,117 $80,000 $65,500 $84,945 $78,954 $81,000 $65,500 $86,250 $100 to $500 Million 20 $80,720 $76,500 $69,950 $92,000 $81,820 $77,750 $69,950 $92,000 $500 Million to $1 Billion 18 $82,769 $86,000 $63,750 $96,000 $87,103 $91,950 $77,500 $100,000 $1 to $3 Billion 20 $99,152 $94,500 $83,000 $113,250 $106,247 $97,250 $84,575 $125,750 More Than $3 Billion 30 $99,677 $94,500 $80,250 $117,250 $107,283 $98,600 $80,250 $123,750
Number of Countries the Individual Works in 1 213 $83,282 $81,000 $69,000 $95,000 $86,545 $83,000 $70,000 $97,000 2 to 5 2 6 to 10 2 11 or More 1
Number of Employees in Compliance and Ethics Group 1 to 5 103 $76,972 $75,000 $65,000 $87,450 $80,271 $78,000 $65,000 $90,500 6 to 10 43 $80,191 $80,000 $65,500 $93,000 $82,458 $80,000 $65,500 $97,500 11 to 20 38 $91,803 $91,300 $82,000 $100,600 $96,089 $94,650 $83,000 $100,950 21 to 50 22 $91,512 $88,500 $72,500 $105,213 $94,026 $90,000 $74,250 $106,763 More than 50 12 $107,458 $98,750 $88,750 $123,750 $114,500 $102,500 $92,000 $135,875
Number of Years Working in the Compliance Department 1 22 $77,636 $78,500 $63,000 $90,250 $78,068 $79,500 $63,000 $90,250 2 41 $81,734 $80,000 $67,500 $95,000 $85,157 $84,500 $71,959 $100,000 3 35 $75,594 $74,500 $68,000 $83,750 $79,649 $75,000 $68,900 $85,000 4 10 $82,560 $73,500 $61,750 $91,200 $86,440 $75,750 $62,425 $94,225 5 24 $80,625 $81,500 $66,750 $93,250 $83,471 $84,000 $68,250 $97,275 6 to 10 50 $85,404 $83,600 $71,254 $92,000 $89,104 $84,795 $71,254 $99,750 11 to 15 20 $95,625 $93,000 $83,750 $101,250 $98,055 $94,850 $84,500 $103,250 16 or More 13 $100,538 $96,000 $85,000 $120,000 $108,808 $105,000 $95,000 $131,000
Type of Organization Non-Profit 137 $83,962 $82,000 $70,000 $95,000 $86,429 $84,500 $70,000 $97,000 Privately Held 36 $70,791 $71,980 $60,000 $80,000 $73,341 $74,500 $60,000 $82,325 Publicly Traded 19 $90,624 $86,000 $79,500 $103,925 $96,571 $94,600 $80,500 $106,325 Governmental 5 $109,993 $110,000 $92,000 $137,000 $112,833 $110,000 $94,700 $138,500 Academic 15 $90,903 $90,000 $72,650 $101,500 $98,376 $91,100 $72,650 $108,000 Other 2

Salary Data
Manager (continued)
2015 Health Care Staff Salary Survey 58
Base Salary Total Compensation
# of
Resp. Average Median 25th
Percentile 75th
Percentile Average Median 25th
Percentile 75th
Percentile
Certifications Held Certified Compliance and Ethics Professional (CCEP) 3 Certified Compliance and Ethics Professional-International (CCEP-I) 0 Certified In Healthcare Compliance (CHC) 103 $89,645 $86,000 $75,000 $100,900 $93,549 $89,000 $76,000 $105,000 Certified In Healthcare Privacy Compliance (CHPC) 24 $89,280 $88,750 $72,000 $99,125 $93,513 $91,500 $79,625 $107,250 Certified Fraud Examiner (CFE) 4 Certified Internal Auditor (CIA) 2 Certified Public Accountant (CPA) 2 No Certifications 58 $73,660 $72,500 $60,750 $84,668 $77,430 $75,750 $61,500 $85,000
Highest Level of Education Some College 36 $73,464 $65,000 $52,825 $91,250 $76,518 $70,000 $52,825 $94,149 Bachelor’s Degree 75 $81,909 $80,000 $69,900 $92,000 $85,048 $80,800 $70,000 $95,000 MBA 23 $90,116 $85,000 $76,500 $102,900 $93,877 $85,000 $77,750 $106,500 Master’s Degree (non-MBA) 49 $86,654 $82,500 $71,959 $100,000 $89,743 $85,000 $72,500 $103,000 JD 29 $87,621 $89,000 $75,000 $96,500 $89,559 $89,000 $76,000 $97,000 PhD 6 $86,667 $91,000 $78,750 $94,250 $103,417 $91,250 $78,875 $94,250
Number of Elements of a Compliance Program the Individual is Involved in 1 to 3 34 $81,861 $80,500 $68,500 $90,000 $84,049 $80,500 $72,500 $93,950 4 to 6 76 $84,270 $84,500 $69,100 $96,197 $87,007 $85,000 $69,600 $97,899 7 to 9 81 $84,952 $84,890 $71,000 $99,000 $89,360 $86,500 $74,000 $103,000 All 10 27 $77,731 $75,000 $65,000 $82,000 $81,453 $79,000 $66,250 $83,750
Do You Have A Contract? Yes 9 $86,556 $88,000 $60,000 $108,000 $87,489 $88,000 $60,000 $108,000 No 209 $83,199 $81,000 $69,800 $95,000 $86,699 $83,000 $71,000 $97,000
Geographic Region New England 7 $93,214 $92,000 $76,500 $108,750 $96,500 $92,000 $76,500 $111,750 Middle Atlantic 19 $88,016 $85,000 $67,900 $105,000 $88,647 $85,000 $67,900 $105,000 South Atlantic 29 $77,409 $78,000 $67,000 $91,000 $78,271 $81,000 $67,500 $93,000 East North Central 26 $79,448 $75,000 $65,000 $93,000 $83,967 $77,500 $65,000 $96,875 East South Central 14 $78,324 $75,500 $71,600 $86,000 $81,046 $77,750 $72,500 $92,450 West North Central 14 $90,264 $84,945 $76,000 $96,375 $91,371 $84,945 $76,500 $97,125 West South Central 12 $88,716 $82,500 $75,500 $102,072 $98,450 $92,048 $79,750 $113,500 Mountain 13 $68,523 $68,000 $47,000 $80,000 $69,135 $74,000 $47,250 $80,800 Pacific 31 $93,209 $83,200 $71,000 $111,000 $97,438 $86,500 $72,000 $111,000

Salary Data
2015 Health Care Staff Salary Survey 59
Assistant/Specialist
Base Salary Total Compensation
# of
Resp. Average Median 25th
Percentile 75th
Percentile Average Median 25th
Percentile 75th
Percentile All Respondents 281 $66,143 $65,000 $53,240 $76,850 $67,332 $65,000 $54,000 $77,700
Compliance Responsibilities Broad (Wide Range of Compliance-Related Risks) 204 $64,826 $63,000 $52,600 $76,000 $66,251 $63,000 $53,000 $76,863 Focused on a Particular Risk Area 77 $69,630 $70,000 $58,000 $78,000 $70,196 $70,000 $58,000 $78,000
Risk Areas Focused On Privacy 32 $66,354 $62,000 $57,111 $75,750 $66,733 $62,000 $57,250 $75,750 IT 1 Occupational Health and Safety 2 Other 36 $72,030 $71,750 $57,750 $78,500 $72,773 $72,000 $60,750 $78,665
Number of People that Report up Through to Individual 0 253 $66,463 $64,916 $54,000 $77,500 $67,700 $65,000 $54,000 $78,000 1 to 2 20 $65,593 $65,000 $54,250 $80,000 $66,625 $65,000 $54,688 $80,000 3 to 5 4 6 to 10 2 11 or More 1
Annual Compliance Budget for the Organization Less Than $100,000 1 $100,000 to $249,999 0 $250,000 to $499,999 4 $500,000 to $999,999 3 $1 Million or More 1
Number of Employees in the Portion of the Organization that Person Works in Compliance for Less Than 100 57 $63,710 $60,300 $54,000 $75,000 $64,300 $60,500 $54,000 $75,000 100-249 15 $61,778 $61,774 $53,000 $76,150 $62,928 $62,000 $53,000 $79,950 250-999 11 $48,512 $52,000 $39,625 $54,500 $49,348 $52,000 $39,725 $57,000 1,000-1,999 26 $65,163 $62,500 $49,700 $77,250 $65,346 $62,500 $50,000 $77,250 2,000-2,999 21 $67,061 $63,290 $53,000 $78,000 $67,523 $63,290 $53,000 $78,000 3,000-4,999 23 $66,715 $65,000 $57,040 $73,000 $66,954 $65,000 $57,040 $73,000 5,000-7,499 28 $71,401 $72,000 $57,680 $78,000 $74,910 $75,000 $57,755 $78,750 7,500-14,999 38 $70,728 $70,620 $59,250 $79,425 $73,729 $70,620 $60,000 $79,425 15,000-29,999 22 $67,380 $67,100 $55,704 $75,500 $67,493 $67,100 $55,750 $75,550 30,000 or More 16 $73,678 $75,500 $60,750 $83,000 $75,338 $75,925 $62,000 $83,125

Salary Data
Assistant/Specialist (continued)
2015 Health Care Staff Salary Survey 60
Base Salary Total Compensation
# of
Resp. Average Median 25th
Percentile 75th
Percentile Average Median 25th
Percentile 75th
Percentile
Annual Revenues in the Portion of the Organization that Person Works in Compliance for Less Than $5 Million 43 $61,031 $58,000 $48,500 $70,000 $62,942 $58,000 $49,250 $72,000 $5 to $15 Million 34 $63,376 $61,827 $50,810 $77,825 $63,750 $62,027 $51,748 $77,825 $15 to $30 Million 17 $55,191 $53,000 $40,000 $62,000 $55,241 $53,250 $40,100 $62,000 $30 to $100 Million 37 $65,484 $65,000 $54,000 $75,000 $66,085 $65,000 $54,000 $75,000 $100 to $500 Million 27 $60,885 $60,000 $52,500 $70,000 $61,411 $62,000 $52,500 $71,000 $500 Million to $1 Billion 20 $71,955 $68,600 $55,952 $81,528 $72,350 $68,600 $55,952 $83,778 $1 to $3 Billion 29 $72,038 $71,365 $61,000 $77,700 $76,039 $72,000 $62,500 $77,700 More Than $3 Billion 22 $77,169 $75,500 $68,250 $81,501 $79,855 $76,000 $68,250 $81,501
Number of Countries the Individual Works in 1 270 $66,000 $64,458 $53,000 $76,453 $67,188 $64,958 $53,060 $77,650 2 to 5 6 $70,142 $68,925 $55,750 $79,963 $71,558 $69,675 $59,875 $79,963 6 to 10 0 11 or More 2
Number of Employees in Compliance and Ethics Group 1 to 5 115 $61,088 $60,000 $46,505 $71,000 $61,575 $60,000 $46,580 $72,000 6 to 10 65 $70,076 $71,300 $55,000 $80,000 $71,857 $71,300 $55,000 $80,660 11 to 20 63 $68,248 $66,000 $57,500 $75,500 $69,756 $66,200 $58,850 $76,000 21 to 50 28 $69,031 $69,000 $58,704 $75,750 $70,210 $69,750 $58,834 $75,750 More than 50 10 $77,350 $75,500 $62,750 $82,375 $80,800 $77,500 $63,500 $83,125
Number of Years Working in the Compliance Department 1 73 $63,694 $61,774 $52,000 $75,000 $63,910 $62,000 $52,300 $75,000 2 51 $60,234 $60,000 $52,500 $68,950 $60,450 $60,000 $52,500 $68,950 3 35 $61,951 $57,000 $50,250 $74,500 $62,940 $57,600 $52,500 $74,600 4 27 $63,672 $68,800 $52,500 $75,500 $66,672 $69,000 $54,684 $78,750 5 21 $67,049 $62,300 $56,430 $78,000 $67,840 $62,300 $56,430 $78,000 6 to 10 47 $74,989 $75,000 $63,000 $86,556 $78,485 $76,900 $63,250 $88,350 11 to 15 21 $76,976 $72,000 $69,000 $80,000 $77,500 $72,000 $69,250 $80,000 16 or More 5 $69,202 $76,850 $62,500 $78,000 $69,202 $76,850 $62,500 $78,000
Type of Organization Non-Profit 189 $67,274 $65,000 $55,000 $77,500 $68,307 $65,000 $55,952 $77,700 Privately Held 39 $59,797 $55,000 $42,750 $70,000 $62,522 $55,000 $42,750 $74,450 Publicly Traded 17 $62,918 $60,000 $52,000 $70,000 $64,062 $60,000 $52,000 $70,000 Governmental 3 Academic 23 $70,481 $71,240 $56,500 $81,002 $70,935 $71,240 $58,500 $81,002 Other 6 $62,715 $64,145 $61,573 $68,000 $63,215 $64,145 $61,573 $70,250

Salary Data
Assistant/Specialist (continued)
2015 Health Care Staff Salary Survey 61
Base Salary Total Compensation
# of
Resp. Average Median 25th
Percentile 75th
Percentile Average Median 25th
Percentile 75th
Percentile
Certifications Held Certified Compliance and Ethics Professional (CCEP) 2 Certified Compliance and Ethics Professional-International (CCEP-I) 1 Certified In Healthcare Compliance (CHC) 98 $70,269 $70,000 $58,000 $80,000 $70,858 $70,250 $58,060 $80,000 Certified In Healthcare Privacy Compliance (CHPC) 14 $71,467 $73,910 $60,611 $81,750 $71,976 $75,000 $61,003 $81,750 Certified Fraud Examiner (CFE) 2 Certified Internal Auditor (CIA) 4 Certified Public Accountant (CPA) 4 No Certifications 114 $62,666 $62,000 $51,000 $72,000 $63,717 $62,337 $51,063 $72,000
Highest Level of Education Some College 58 $62,518 $61,387 $53,250 $70,930 $63,400 $62,000 $53,250 $70,993 Bachelor’s Degree 124 $64,492 $61,390 $52,000 $78,000 $65,862 $61,940 $52,000 $78,000 MBA 19 $70,144 $63,000 $57,500 $78,250 $71,944 $63,000 $59,500 $78,250 Master’s Degree (non-MBA) 44 $72,485 $71,400 $64,437 $80,253 $72,807 $71,400 $64,437 $81,250 JD 30 $70,131 $70,000 $57,700 $75,000 $72,291 $70,000 $57,700 $75,000 PhD 2
Number of Elements of a Compliance Program the Individual is Involved in 1 to 3 73 $66,234 $62,000 $52,000 $76,604 $66,830 $63,000 $53,000 $77,000 4 to 6 118 $65,810 $63,958 $53,250 $78,000 $66,650 $63,958 $53,250 $78,000 7 to 9 80 $65,523 $65,000 $54,000 $75,250 $66,733 $65,000 $54,000 $76,213 All 10 10 $74,350 $75,000 $68,000 $77,875 $83,850 $75,000 $68,000 $77,875
Do You Have A Contract? Yes 12 $60,904 $63,500 $48,250 $74,473 $61,049 $63,500 $48,500 $74,848 No 267 $66,342 $65,000 $53,620 $76,727 $67,585 $65,000 $54,000 $77,600
Geographic Region New England 14 $60,159 $56,215 $50,500 $66,000 $60,302 $56,715 $51,250 $66,000 Middle Atlantic 26 $70,327 $75,000 $52,250 $79,750 $74,604 $75,000 $52,250 $79,750 South Atlantic 49 $63,612 $62,000 $52,800 $72,300 $64,140 $62,000 $52,800 $75,000 East North Central 46 $64,348 $65,000 $55,500 $72,740 $64,888 $65,000 $55,513 $73,115 East South Central 10 $60,960 $62,500 $50,750 $73,500 $62,195 $62,500 $51,688 $74,250 West North Central 20 $57,237 $57,000 $47,250 $66,000 $57,630 $59,500 $47,250 $66,063 West South Central 17 $68,210 $68,800 $54,080 $78,000 $68,225 $68,800 $54,080 $78,000 Mountain 8 $72,977 $71,850 $64,250 $82,278 $72,977 $71,850 $64,250 $82,278 Pacific 40 $71,344 $67,500 $57,592 $85,250 $74,417 $72,500 $57,592 $87,375

2015 Health Care Staff Salary Survey 62
Detailed Results

Detailed Results
2015 Health Care Staff Salary Survey 63
By All Respondents and Title/Level
Title/Level
All Respondents Director Manager
Assistant/ Specialist
Are your compliance responsibilities:
Responses 656 141 220 287 Broad, covering a range of compliance-
related risks 74% 78% 73% 72% Focused on a particular risk area 26% 21% 26% 28% If focused, which legal and regulatory risk
areas are you primarily focused on? Responses 158 29 53 73
Privacy 46% 72% 34% 47% IT 1% 0% 0% 1% Occupational health and safety 3% 0% 6% 3% Other 50% 28% 60% 49% Percentage indicating the elements of the compliance program that they are primarily involved in:
Responses 656 141 220 287 Compliance/auditing/monitoring 86% 89% 85% 84% Compliance education 83% 91% 87% 77% Compliance investigations 79% 91% 80% 73% Hot line/anonymous reporting 54% 71% 59% 43% Reporting to the board 32% 53% 32% 21% Compliance risk assessments 65% 82% 67% 55% Compliance discipline/incentives 34% 57% 35% 23% Code of conduct 45% 68% 50% 31% Policies and procedures 81% 91% 84% 74% Measuring program effectiveness 51% 70% 56% 38% Which of the following best describes your title or level?
Responses 652 141 220 287 Vice President 1% 0% 0% 0% Director 22% 100% 0% 0% Manager 34% 0% 100% 0% Assistant/Specialist 44% 0% 0% 100% How many people report up through to you?
Responses 654 141 219 286 0 66% 38% 54% 91% 1-2 18% 27% 26% 7% 3-5 9% 19% 13% 1% 6-10 5% 12% 5% 1% 11 or more 2% 4% 3% 0%

Detailed Results
2015 Health Care Staff Salary Survey 64
Title/Level
All Respondents Director Manager
Assistant/ Specialist
How much of your company's legal and regulatory risk areas would you estimate the compliance department is responsible for managing?
Responses 638 139 214 278 0-25% 10% 9% 10% 11% 26%-50% 19% 18% 20% 19% 51%-75% 30% 29% 31% 29% 76%-100% 41% 44% 39% 41% How many employees, including yourself, are there in the compliance and ethics group you manage?
Responses 654 140 220 287 1 4% 4% 5% 2% 2 to 5 38% 33% 42% 39% 6 to 10 23% 26% 20% 23% 11 to 15 10% 9% 10% 10% 16 to 20 11% 12% 8% 12% 21 to 30 5% 6% 5% 5% 31 to 40 4% 3% 3% 4% 41 to 50 1% 2% 2% 1% More than 50 5% 6% 5% 3% Do you know the budget for your compliance department?
Responses 653 140 219 286 Yes 12% 25% 11% 6% No 88% 75% 89% 94% Annual compliance budget for the organization as a whole:
Responses 59 29 20 9 Average $1,729,068 $2,253,379 $988,600 $766,111 Median $750,000 $1,400,000 $407,500 $375,000 25th percentile $260,000 $400,000 $196,000 $270,000 75th percentile $1,750,000 $2,000,000 $1,625,000 $700,000

Detailed Results
2015 Health Care Staff Salary Survey 65
Title/Level
All Respondents Director Manager
Assistant/ Specialist
Approximately how many employees work in your organization as a whole?
Responses 648 141 217 282 Less than 100 3% 4% 2% 3% 100 - 249 4% 4% 5% 3% 250 - 499 4% 1% 6% 4% 500 - 999 7% 9% 6% 7% 1,000 - 1,999 9% 11% 11% 7% 2,000 - 2,999 7% 5% 8% 9% 3,000 - 4,999 8% 8% 9% 9% 5,000 - 7,499 12% 11% 10% 14% 7,500 - 9,999 5% 4% 5% 5% 10,000 - 14,999 10% 13% 8% 11% 15,000 - 19,999 6% 5% 5% 6% 20,000 - 29,999 7% 8% 5% 9% 30,000 - 49,999 7% 7% 6% 7% 50,000 - 74,999 3% 5% 4% 2% 75,000 - 99,999 1% 1% 2% 1% 100,000 + 6% 6% 9% 4% Approximately how many employees work in the portion of your organization that you work in compliance for?
Responses 591 122 199 263 Less than 100 19% 16% 17% 22% 100 - 249 5% 5% 5% 6% 250 - 499 5% 0% 8% 4% 500 - 999 0% 0% 0% 0% 1,000 - 1,999 12% 16% 13% 11% 2,000 - 2,999 8% 5% 10% 8% 3,000 - 4,999 8% 7% 8% 9% 5,000 - 7,499 11% 10% 12% 11% 7,500 - 9,999 5% 5% 5% 6% 10,000 - 14,999 8% 12% 6% 9% 15,000 - 19,999 4% 5% 4% 4% 20,000 - 29,999 5% 7% 4% 5% 30,000 - 49,999 4% 6% 4% 2% 50,000 - 74,999 3% 2% 4% 2% 75,000 - 99,999 0% 0% 1% 0% 100,000 + 2% 3% 2% 2% What are the annual revenues of the organization you work for?
Responses 552 128 190 229 Less than $5 million 7% 5% 8% 7% $5 to $15 million 14% 9% 13% 18% $15 to $30 million 9% 5% 11% 8% $30 to $50 million 6% 9% 4% 7% $50 to $100 million 6% 4% 9% 5% $100 to $500 million 11% 11% 11% 12% $500 million to $1 billion 10% 13% 11% 7% $1 to $3 billion 16% 23% 12% 15% More than $3 billion 21% 21% 22% 20%

Detailed Results
2015 Health Care Staff Salary Survey 66
Title/Level
All Respondents Director Manager
Assistant/ Specialist
What are the annual revenues for the portion of the organization that your part of the compliance and ethics program oversees?
Responses 553 127 188 233 Less than $5 million 15% 8% 16% 18% $5 to $15 million 13% 9% 13% 15% $15 to $30 million 8% 6% 12% 7% $30 to $50 million 7% 9% 4% 8% $50 to $100 million 8% 5% 9% 8% $100 to $500 million 12% 15% 11% 12% $500 million to $1 billion 10% 11% 10% 9% $1 to $3 billion 15% 24% 11% 12% More than $3 billion 13% 14% 16% 10% For how many countries do you work in compliance?
Responses 651 139 220 284 1 98% 98% 98% 97% 2 to 5 2% 1% 1% 2% 6 to 10 0% 0% 1% 0% 11 or more 1% 1% 0% 1% Where do you work?
Responses 633 135 211 279 United States 100% 100% 100% 100% North America (outside US) 0% 0% 0% 0% South America 0% 0% 0% 0% Europe 0% 0% 0% 0% Asia 0% 0% 0% 0% Africa 0% 0% 0% 0% Australia 0% 0% 0% 0% How many years have you worked in the compliance department?
Responses 652 141 217 286 1 16% 7% 10% 26% 2 17% 10% 19% 18% 3 14% 12% 17% 13% 4 7% 4% 5% 9% 5 10% 11% 11% 8% 6 to 10 21% 26% 23% 17% 11 to 15 10% 18% 9% 8% 16 or more 6% 12% 6% 2% Type of organization:
Responses 646 139 216 283 Non-profit 64% 56% 64% 68% Privately held 16% 17% 17% 14% Publicly traded 9% 14% 9% 6% Governmental 2% 4% 2% 1% Academic 8% 8% 7% 8% Other 1% 1% 1% 2%
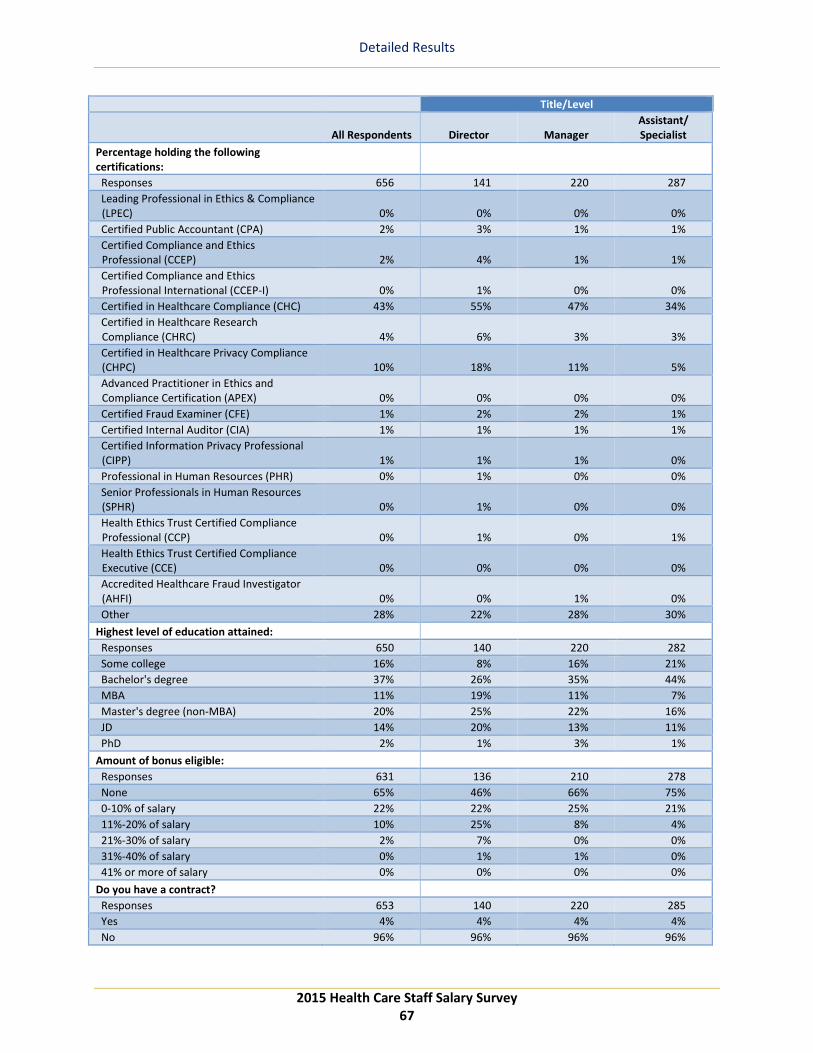
Detailed Results
2015 Health Care Staff Salary Survey 67
Title/Level
All Respondents Director Manager
Assistant/ Specialist
Percentage holding the following certifications:
Responses 656 141 220 287 Leading Professional in Ethics & Compliance
(LPEC) 0% 0% 0% 0% Certified Public Accountant (CPA) 2% 3% 1% 1% Certified Compliance and Ethics
Professional (CCEP) 2% 4% 1% 1% Certified Compliance and Ethics
Professional International (CCEP-I) 0% 1% 0% 0% Certified in Healthcare Compliance (CHC) 43% 55% 47% 34% Certified in Healthcare Research
Compliance (CHRC) 4% 6% 3% 3% Certified in Healthcare Privacy Compliance
(CHPC) 10% 18% 11% 5% Advanced Practitioner in Ethics and
Compliance Certification (APEX) 0% 0% 0% 0% Certified Fraud Examiner (CFE) 1% 2% 2% 1% Certified Internal Auditor (CIA) 1% 1% 1% 1% Certified Information Privacy Professional
(CIPP) 1% 1% 1% 0% Professional in Human Resources (PHR) 0% 1% 0% 0% Senior Professionals in Human Resources
(SPHR) 0% 1% 0% 0% Health Ethics Trust Certified Compliance
Professional (CCP) 0% 1% 0% 1% Health Ethics Trust Certified Compliance
Executive (CCE) 0% 0% 0% 0% Accredited Healthcare Fraud Investigator
(AHFI) 0% 0% 1% 0% Other 28% 22% 28% 30% Highest level of education attained:
Responses 650 140 220 282 Some college 16% 8% 16% 21% Bachelor's degree 37% 26% 35% 44% MBA 11% 19% 11% 7% Master's degree (non-MBA) 20% 25% 22% 16% JD 14% 20% 13% 11% PhD 2% 1% 3% 1% Amount of bonus eligible:
Responses 631 136 210 278 None 65% 46% 66% 75% 0-10% of salary 22% 22% 25% 21% 11%-20% of salary 10% 25% 8% 4% 21%-30% of salary 2% 7% 0% 0% 31%-40% of salary 0% 1% 1% 0% 41% or more of salary 0% 0% 0% 0% Do you have a contract?
Responses 653 140 220 285 Yes 4% 4% 4% 4% No 96% 96% 96% 96%

Detailed Results
2015 Health Care Staff Salary Survey 68
Title/Level
All Respondents Director Manager
Assistant/ Specialist
If "yes," Do you have a severance clause in your contract? Responses 621 131 211 271 Yes 2% 2% 2% 2% No 98% 98% 98% 98%
I

Detailed Results
2015 Health Care Staff Salary Survey 69
By Annual Compliance Budget
Number of Employees in Compliance and Ethics Group
1 to 5 6 to 10 11 to 20 21 to 50
More Than 50
Are your compliance responsibilities: Responses 273 149 133 67 32 Broad, covering a range of compliance-
related risks 85% 67% 64% 69% 63% Focused on a particular risk area 15% 32% 36% 30% 38%
If focused, which legal and regulatory risk areas are you primarily focused on?
Responses 40 44 45 19 10 Privacy 53% 52% 42% 37% 30% IT 0% 0% 2% 0% 0% Occupational health and safety 8% 5% 0% 0% 0% Other 40% 43% 56% 63% 70%
Percentage indicating the elements of the compliance program that they are primarily involved in: Responses 273 149 133 67 32 Compliance/auditing/monitoring 87% 87% 84% 79% 84% Compliance education 87% 81% 92% 66% 63% Compliance investigations 84% 72% 83% 67% 75% Hot line/anonymous reporting 59% 48% 56% 46% 41% Reporting to the board 36% 30% 32% 13% 38% Compliance risk assessments 65% 62% 74% 49% 69% Compliance discipline/incentives 34% 31% 39% 27% 47% Code of conduct 52% 40% 44% 34% 38% Policies and procedures 87% 79% 80% 66% 69% Measuring program effectiveness 54% 51% 52% 34% 59%
Which of the following best describes your title or level? Responses 273 148 130 67 32 Vice President 0% 1% 0% 1% 3% Director 19% 24% 22% 22% 28% Manager 38% 30% 29% 33% 38% Assistant/Specialist 43% 45% 48% 43% 31%
How many people report up through to you? Responses 273 149 131 67 32 0 72% 62% 65% 67% 47% 1-2 18% 21% 15% 15% 22% 3-5 7% 12% 8% 12% 16% 6-10 1% 4% 10% 4% 13% 11 or more 2% 1% 3% 1% 3%

Detailed Results
2015 Health Care Staff Salary Survey 70
Number of Employees in Compliance and Ethics Group
1 to 5 6 to 10 11 to 20 21 to 50
More Than 50
How much of your company's legal and regulatory risk areas would you estimate the compliance department is responsible for managing? Responses 267 146 128 65 30 0-25% 10% 5% 10% 20% 7% 26%-50% 15% 23% 26% 17% 20% 51%-75% 30% 23% 29% 42% 40% 76%-100% 45% 49% 35% 22% 33%
How many employees, including yourself, are there in the compliance and ethics group you manage? Responses 273 149 133 67 32 1 9% 0% 0% 0% 0% 2 to 5 91% 0% 0% 0% 0% 6 to 10 0% 100% 0% 0% 0% 11 to 15 0% 0% 47% 0% 0% 16 to 20 0% 0% 53% 0% 0% 21 to 30 0% 0% 0% 52% 0% 31 to 40 0% 0% 0% 34% 0% 41 to 50 0% 0% 0% 13% 0% More than 50 0% 0% 0% 0% 100%
Do you know the budget for your compliance department? Responses 271 149 133 67 31 Yes 13% 8% 14% 12% 16% No 87% 92% 86% 88% 84%
Annual compliance budget for the organization as a whole: Responses 27 10 13 7 2 Average $638,704 $1,200,000 $1,843,846 $2,971,429 * Median $270,000 $1,150,000 $1,545,000 $2,500,000 * 25th percentile $71,500 $1,000,000 $1,500,000 $1,000,000 * 75th percentile $407,500 $1,700,000 $2,200,000 $2,900,000 *
* Insufficient Data

Detailed Results
2015 Health Care Staff Salary Survey 71
Number of Employees in Compliance and Ethics Group
1 to 5 6 to 10 11 to 20 21 to 50
More Than 50
Approximately how many employees work in your organization as a whole? Responses 269 149 130 66 32 Less than 100 6% 2% 0% 0% 0% 100 - 249 8% 3% 0% 0% 0% 250 - 499 7% 3% 0% 0% 0% 500 - 999 12% 6% 2% 0% 3% 1,000 - 1,999 16% 5% 4% 3% 0% 2,000 - 2,999 10% 9% 5% 3% 0% 3,000 - 4,999 11% 10% 5% 3% 3% 5,000 - 7,499 10% 19% 13% 3% 3% 7,500 - 9,999 4% 3% 8% 6% 3% 10,000 - 14,999 5% 20% 8% 17% 3% 15,000 - 19,999 1% 7% 14% 5% 3% 20,000 - 29,999 3% 4% 22% 9% 0% 30,000 - 49,999 3% 2% 10% 21% 19% 50,000 - 74,999 0% 2% 5% 9% 9% 75,000 - 99,999 1% 1% 0% 5% 6% 100,000 + 3% 3% 3% 17% 47%
Approximately how many employees work in the portion of your organization that you work in compliance for? Responses 237 135 124 64 31 Less than 100 24% 13% 15% 23% 16% 100 - 249 8% 4% 2% 0% 13% 250 - 499 7% 4% 1% 2% 6% 500 - 999 0% 0% 0% 0% 0% 1,000 - 1,999 19% 9% 10% 2% 6% 2,000 - 2,999 9% 9% 7% 5% 0% 3,000 - 4,999 12% 11% 5% 0% 0% 5,000 - 7,499 10% 20% 7% 8% 3% 7,500 - 9,999 3% 4% 8% 6% 10% 10,000 - 14,999 3% 16% 9% 13% 3% 15,000 - 19,999 1% 5% 10% 5% 0% 20,000 - 29,999 1% 1% 15% 11% 0% 30,000 - 49,999 1% 1% 6% 14% 6% 50,000 - 74,999 1% 1% 5% 8% 6% 75,000 - 99,999 0% 0% 0% 0% 3% 100,000 + 0% 0% 1% 5% 26%

Detailed Results
2015 Health Care Staff Salary Survey 72
Number of Employees in Compliance and Ethics Group
1 to 5 6 to 10 11 to 20 21 to 50
More Than 50
What are the annual revenues of the organization you work for? Responses 237 121 111 51 31 Less than $5 million 12% 5% 3% 2% 3% $5 to $15 million 21% 17% 5% 4% 0% $15 to $30 million 12% 12% 3% 0% 0% $30 to $50 million 8% 5% 5% 6% 3% $50 to $100 million 8% 8% 6% 0% 0% $100 to $500 million 14% 11% 10% 10% 0% $500 million to $1 billion 10% 14% 9% 4% 6% $1 to $3 billion 8% 19% 24% 29% 16% More than $3 billion 8% 9% 35% 45% 71%
What are the annual revenues for the portion of the organization that your part of the compliance and ethics program oversees? Responses 235 118 119 51 29 Less than $5 million 20% 11% 13% 8% 10% $5 to $15 million 18% 16% 4% 6% 7% $15 to $30 million 13% 8% 4% 2% 0% $30 to $50 million 9% 5% 4% 6% 3% $50 to $100 million 9% 8% 6% 2% 7% $100 to $500 million 14% 16% 11% 8% 0% $500 million to $1 billion 8% 12% 13% 8% 7% $1 to $3 billion 6% 19% 22% 29% 14% More than $3 billion 3% 4% 23% 31% 52%
For how many countries do you work in compliance? Responses 270 149 133 66 32 1 99% 97% 98% 98% 88% 2 to 5 1% 2% 2% 2% 3% 6 to 10 0% 0% 0% 0% 3% 11 or more 0% 1% 0% 0% 6%
Where do you work? Responses 265 142 128 65 31 United States 100% 100% 100% 100% 100% North America (outside US) 0% 0% 0% 0% 0% South America 0% 0% 0% 0% 0% Europe 0% 0% 0% 0% 0% Asia 0% 0% 0% 0% 0% Africa 0% 0% 0% 0% 0% Australia 0% 0% 0% 0% 0%

Detailed Results
2015 Health Care Staff Salary Survey 73
Number of Employees in Compliance and Ethics Group
1 to 5 6 to 10 11 to 20 21 to 50
More Than 50
How many years have you worked in the compliance department? Responses 271 147 133 67 32 1 20% 14% 18% 7% 9% 2 18% 16% 15% 18% 13% 3 15% 15% 10% 16% 16% 4 7% 4% 6% 10% 9% 5 10% 10% 8% 12% 6% 6 to 10 18% 25% 20% 22% 22% 11 to 15 8% 11% 14% 9% 19% 16 or more 4% 5% 8% 4% 6%
Type of organization: Responses 266 149 131 66 32 Non-profit 64% 70% 66% 55% 50% Privately held 26% 11% 8% 2% 6% Publicly traded 4% 5% 8% 23% 38% Governmental 2% 3% 5% 0% 3% Academic 2% 9% 11% 20% 3% Other 2% 1% 2% 2% 0%
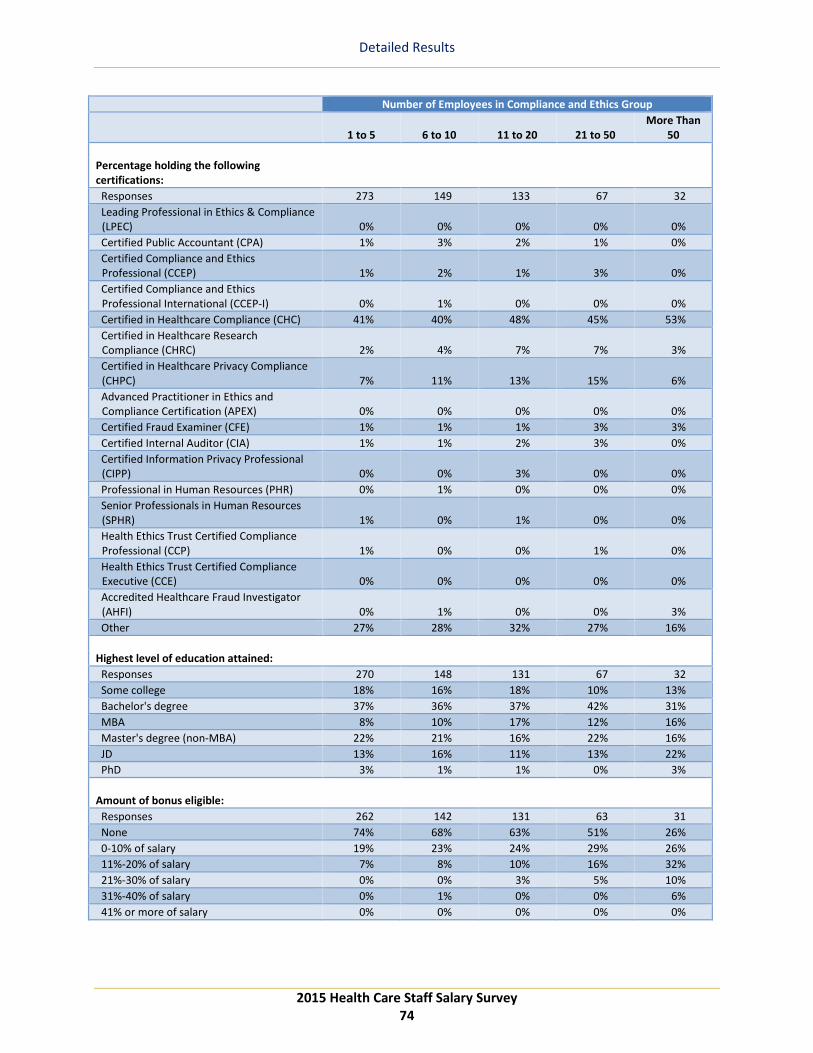
Detailed Results
2015 Health Care Staff Salary Survey 74
Number of Employees in Compliance and Ethics Group
1 to 5 6 to 10 11 to 20 21 to 50
More Than 50
Percentage holding the following certifications: Responses 273 149 133 67 32 Leading Professional in Ethics & Compliance
(LPEC) 0% 0% 0% 0% 0% Certified Public Accountant (CPA) 1% 3% 2% 1% 0% Certified Compliance and Ethics
Professional (CCEP) 1% 2% 1% 3% 0% Certified Compliance and Ethics
Professional International (CCEP-I) 0% 1% 0% 0% 0% Certified in Healthcare Compliance (CHC) 41% 40% 48% 45% 53% Certified in Healthcare Research
Compliance (CHRC) 2% 4% 7% 7% 3% Certified in Healthcare Privacy Compliance
(CHPC) 7% 11% 13% 15% 6% Advanced Practitioner in Ethics and
Compliance Certification (APEX) 0% 0% 0% 0% 0% Certified Fraud Examiner (CFE) 1% 1% 1% 3% 3% Certified Internal Auditor (CIA) 1% 1% 2% 3% 0% Certified Information Privacy Professional
(CIPP) 0% 0% 3% 0% 0% Professional in Human Resources (PHR) 0% 1% 0% 0% 0% Senior Professionals in Human Resources
(SPHR) 1% 0% 1% 0% 0% Health Ethics Trust Certified Compliance
Professional (CCP) 1% 0% 0% 1% 0% Health Ethics Trust Certified Compliance
Executive (CCE) 0% 0% 0% 0% 0% Accredited Healthcare Fraud Investigator
(AHFI) 0% 1% 0% 0% 3% Other 27% 28% 32% 27% 16%
Highest level of education attained: Responses 270 148 131 67 32 Some college 18% 16% 18% 10% 13% Bachelor's degree 37% 36% 37% 42% 31% MBA 8% 10% 17% 12% 16% Master's degree (non-MBA) 22% 21% 16% 22% 16% JD 13% 16% 11% 13% 22% PhD 3% 1% 1% 0% 3%
Amount of bonus eligible: Responses 262 142 131 63 31 None 74% 68% 63% 51% 26% 0-10% of salary 19% 23% 24% 29% 26% 11%-20% of salary 7% 8% 10% 16% 32% 21%-30% of salary 0% 0% 3% 5% 10% 31%-40% of salary 0% 1% 0% 0% 6% 41% or more of salary 0% 0% 0% 0% 0%

Detailed Results
2015 Health Care Staff Salary Survey 75
Number of Employees in Compliance and Ethics Group
1 to 5 6 to 10 11 to 20 21 to 50
More Than 50
Do you have a contract? Responses 272 148 132 67 32 Yes 6% 3% 1% 7% 3% No 94% 97% 99% 93% 97%
If "yes," Do you have a severance clause in your contract? Responses 261 141 129 59 30 Yes 2% 2% 0% 7% 3% No 98% 98% 100% 93% 97%

Certified in Healthcare Compliance
(CHC)®
Certified in Healthcare Privacy
Compliance (CHPC®)
Certified in Healthcare Research
Compliance (CHRC)®
Certified in Healthcare
Compliance-Fellow (CHC-F)®
Showcase your specifi c healthcare compliance
knowledge and experience by earning
your certifi cation
A few letters after your name can make a big diff erenceWhy do people add JD, MPA, MD, or RN after their name? They know those initials instantly identify them as experts in their fi eld.
Now’s the time to add CHC, CHRC, CHPC, or CHC-F after your name. Just a few initials will help show your colleagues that what you say isn’t just your opinion, but a product of your expertise as a Certified in Healthcare Compliance (CHC)®, Certified in Healthcare Privacy Compliance (CHPC®), Certified in Healthcare Research Compliance (CHRC)® or Certified in Healthcare Compliance-Fellow (CHC-F)®.
Applying to become certifi ed is likely easier than you think.To learn more about what it takes to earn the CHC, CHRC, CHPC, or CHC-F designation, visit compliancecertification.org. And you could soon be joining the more than 5,200 professionals who have already earned their CHC, CHRC, CHPC, or CHC-F.
Become Certifi ed
ccb-2016-all-healthcare-certifications-1pgad.indd 1 9/16/15 10:20 AM

HCCA’S MISSIONHCCA exists to champion ethical practice and compliance standards in the healthcare community and to provide the necessary resources for compliance professionals and others who share these principles.
hcca-info.org