Health Care and the Budget: Issues and Challenges for Reform€¦ · · 2017-07-14Health Care and...
30
CBO TESTIMONY Statement of Peter R. Orszag Director Health Care and the Budget: Issues and Challenges for Reform before the Committee on the Budget United States Senate June 21, 2007 CONGRESSIONAL BUDGET OFFICE SECOND AND D STREETS, S.W. WASHINGTON, D.C. 20515 This document is embargoed until it is delivered at 10:00 a.m. (EDT), Thursday, June 21, 2007. The contents may not be published, transmitted, or otherwise communicated by any print, broad- cast, or electronic media before that time.
Transcript of Health Care and the Budget: Issues and Challenges for Reform€¦ · · 2017-07-14Health Care and...

CBOTESTIMONY
Statement ofPeter R. Orszag
Director
Health Care and the Budget:Issues and Challenges for Reform
before theCommittee on the Budget
United States Senate
June 21, 2007
CONGRESSIONAL BUDGET OFFICESECOND AND D STREETS, S.W.
WASHINGTON, D.C. 20515
This document is embargoed until it is deliveredat 10:00 a.m. (EDT), Thursday, June 21, 2007.The contents may not be published, transmitted,or otherwise communicated by any print, broad-cast, or electronic media before that time.


Chairman Conrad, Ranking Member Gregg, and other Members of the Committee,thank you for inviting me to testify this morning on the U.S. health care systemand the major budgetary and policy issues associated with that system. Risinghealth care costs and their consequences for federal health insurance programsconstitute the nation’s central fiscal challenge. Rising costs also represent a criticalissue for employers—who sponsor most private health insurance coverage—andfor the enrollees and patients who ultimately bear the costs of health insurance andhealth care. At the same time, substantial concerns exist about the number of indi-viduals who lack health insurance, about the quality of care that is provided both tothe uninsured and to the insured, and about trends in health such as the growingprevalence of obesity.
In light of those challenges, my testimony today makes four main points:
B Health Care Costs. The nation’s long-term fiscal balance will be determinedprimarily by the future rate of health care cost growth. If health care costs con-tinued growing at the same rate over the next four decades as they did over thepast four decades, federal spending on Medicare and Medicaid alone would riseto about 20 percent of gross domestic product (GDP) by 2050—roughly theshare of the economy now accounted for by the entire federal budget. Further-more, controlling those federal costs over the long term will be very difficultwithout addressing the underlying forces that are also causing private costs forhealth care to rise. A variety of evidence, however, suggests that opportunitiesexist to constrain health care costs both in the public programs and in the rest ofthe health care system without adverse health consequences. Capturing thoseopportunities to reduce costs without harming health outcomes involves manychallenges, including the time that may be necessary to generate significant sav-ings—but even if reforms take time to generate savings, acting sooner ratherthan later can ultimately make a substantial difference.
B Employer-Sponsored Insurance. Most Americans get their primary healthinsurance through an employer—either their own or that of a family member.Many employers have expressed serious concerns about rising health care costs;to date, however, aggregate data indicate that any reductions in employers’offers of insurance or the scope of coverage they provide have been modest. Anemployer-based system has both advantages (for example, workers’ risks arepooled together) and disadvantages (for example, workers often have to changetheir health plan when they change jobs). A key issue for broad health reformproposals is whether they are based upon an employer-sponsored system: if so,whether they retain the significant existing tax incentives for employer-basedinsurance, and if not, how they create the pooling mechanisms essential foreffective health insurance markets.

B Lack of Insurance. The most recent estimates indicate that about 45 millionpeople were uninsured at any given point in 2005. Both the high cost of healthcare and the evolution of employer-based health insurance affect the number ofpeople who have coverage. Higher premiums discourage people—especiallythose who have lower income and who perceive themselves as healthy—frompurchasing insurance. People who are not employed or who choose to work at afirm not offering insurance may have to seek coverage in the individual market,where policy terms and tax benefits are generally much less attractive thanthose for employer-sponsored plans. Federal and state expansions of coverageover the past 25 years—particularly through Medicaid and the State Children’sHealth Insurance Program (SCHIP)—have significantly reduced uninsurancerates among eligible populations. Many proposals aim to reduce the number ofuninsured further, through either direct spending or tax credits, but such propos-als typically generate budgetary costs that must ultimately be financed byhigher revenues or offset by lower spending elsewhere—and almost invariablycause at least some substitution of public funds for private funds.
B Prevention and Healthy Living. The ultimate objective of the health caresystem is to improve health. Despite the resources that the nation devotes totreating diseases, the results in terms of health gains are mixed, and manyinvestments that can foster better health—such as preventive medicine—are underused. At the same time, various types of unhealthy behavior—such assmoking, poor diets, and a lack of regular exercise—remain relatively common.Although proposals that encourage more prevention and healthy living can helpto promote better health outcomes, their effects on federal and total healthspending are uncertain.
Rising Health Care CostsOver the past four decades, Medicare’s and Medicaid’s costs per beneficiary haveincreased about 2.5 percentage points faster per year than has per capita grossdomestic product (GDP).1 If those costs continued growing at the same rate overthe next four decades, federal spending on those two programs alone would risefrom 4.5 percent of GDP today to about 20 percent by 2050 (see Figure 1); thatamount would represent roughly the same share of the economy as the entire fed-eral budget does today. If, instead, those costs grew at the same rate as income—ascenario that illustrates the pure effect of demographic changes on the two pro-grams—then the change in spending by 2050 would be much smaller. Indeed, thatchange would be substantially smaller than the difference between the two scenar-ios. That observation underscores that the rate at which health care costs grow rel-ative to income is the most important determinant of the long-term fiscal balance;
1. See Congressional Budget Office, The Long-Term Budget Outlook (December 2005), pp. 6–7and 31–32.
2

Figure 1.
Total Federal Spending for Medicare and MedicaidUnder Assumptions About the Health CostGrowth Differential(Percentage of gross domestic product)
Source: Congressional Budget Office.
Note: The health cost growth differential refers to the number of percentage points by which the growth of annual health care spending per beneficiary is assumed to exceed the growth of nominal gross domestic product per capita, after an adjustment for the growth and aging of the Medicare and Medicaid populations.
it exerts a significantly larger influence on the budget over the long term than othercommonly cited factors, such as the aging of the population.
Rising health care costs represent a challenge not only for the federal governmentbut also for private payers. Indeed, the trends for both largely reflect the sameunderlying forces—the spread of costly new medical technologies, limited cost-sharing requirements, and other factors—and cost growth per beneficiary in Medi-care and Medicaid has tracked that in the rest of the health system over long peri-ods of time (see Figure 2). Total health care spending, which consumed about8 percent of the U.S. economy in 1975, currently accounts for about 16 percent ofGDP, and that share is projected to reach nearly 20 percent by 2016. About half ofthat spending is now publicly financed, and half is privately financed.
1966 1972 1978 1984 1990 1996 2002 2008 2014 2020 2026 2032 2038 2044 2050
0
5
10
15
20
25Actual Projection
2.5 Percentage Points
1 Percentage Point
Zero
Differential of:
3

Figure 2.
Annual Growth Rates of Private and Public HealthCare Spending(Change in total nominal spending from previous year)
Source: Congressional Budget Office based on Centers for Medicare and Medicaid Services’ data on national health expenditures.
Reasons for Cost Growth and the Relationship BetweenCost and QualityIn order to see what options may exist to limit future cost growth, it is useful toreview the main factors contributing to that growth—as well as past efforts at costcontrol. Many analysts attribute the bulk of the growth in health care spending tothe development and diffusion of new medical technology, or, as one leadingobserver has described it, “the increased capabilities of medicine.”2 Recent medi-cal advances have made a wealth of new medical therapies available to physiciansand patients. Some advances permit the treatment of previously untreatable condi-tions, which can confer substantial benefits but also introduces new categories ofspending. Others advances may improve medical outcomes (compared with thoseprovided by older treatments) but at added costs. Some studies have found that thespread of new medical technology has yielded benefits that clearly justify theadded costs on average, but other evidence also strongly suggests that additional
2. Joseph P. Newhouse, “An Iconoclastic View of Health Cost Containment,” Health Affairs, vol.12, Supplement (1993), pp. 152–171.
1970 1973 1976 1979 1982 1985 1988 1991 1994 1997 2000 2003
0
2
4
6
8
10
12
14
16
18
20
Private
Public
4

Figure 3.
Medicare Spending per Capita in the United States, byHospital Referral Region, 2003
Source: The Dartmouth Atlas of Health Care.
Note: Numbers in parentheses refer to the number of hospital referral regions with per capita spending in each interval.
treatments and services are being provided broadly to patients who could do just aswell with less-expensive care.3
Significant evidence exists that more-expensive care need not mean higher-qualitycare—suggesting an opportunity to reduce costs without impairing health out-comes. Perhaps the most compelling evidence of that opportunity comes from thesubstantial geographic differences in spending on health care within the UnitedStates—and the fact that they do not translate into higher life expectancy or mea-sured advantages in other health statistics in the higher-spending regions.4 Forexample, Medicare’s costs per enrollee vary significantly from regions to region:from as low as $4,000 to more than $11,000 in 2003 (see Figure 3). Research has
3. See David M. Cutler, Your Money or Your Life: Strong Medicine for America’s Health CareSystem (New York: Oxford University Press, 2004).
4. Comparisons among countries also support that conclusion. For a recent comparison of healthspending and outcomes in the United States and other countries, see McKinsey Global Institute,Accounting for the Cost of Health Care in the United States (San Francisco: McKinsey & Com-pany, January 2007).
$7,000 to $11,352 (64)
$6,500 to <$7,000 (53)
$6,000 to <$6,500 (56)
$5,500 to <$6,000 (64)
$4,272 to <$5,500 (70)
Not Populated
5

Figure 4.
The Relationship Between Quality and MedicareSpending, by State, 2004(Composite measure of quality of care)
Source: Congressional Budget Office based on data from Agency for Healthcare Research and Quality, National Healthcare Quality Report, 2005, Appendix: Data Tables, available at www.ahrq.gov/qual/nhqr05/index.html, and data from the Centers for Medicare and Medicaid Services' Continuous Medicare History Sample.
Note: The composite measure of the quality of care, based on Medicare beneficiaries in the fee-for-service program who were hospitalized in 2004, conveys the percentage who received recommended care for myocardial infarction, heart failure, and pneumonia.
Spending figures convey average amounts by state.
shown that much of that variation in spending cannot be explained by differencesin the population or medical prices and that the higher-spending regions do notgenerate better health outcomes than the lower-spending regions.5 Furthermore,differences in spending are not correlated with measures of the quality of care thatenrollees receive (see Figure 4). Concerns about that regional variation are but-tressed by the fact that hard evidence is often unavailable about which treatmentswork best for which patients or whether the added benefits of more-effective butmore-expensive services are sufficient to warrant their added costs—and in many
5. See John E. Wennberg, Elliot S. Fisher, and Jonathan S. Skinner, “Geography and the DebateOver Medicare Reform,” Health Affairs, Web Exclusive (February 13, 2002), pp. w96–w114;and Elliot S. Fisher and others, “The Implications of Regional Variations in Medicare Spend-ing, Part 1: The Content, Quality, and Accessibility of Care,” Annals of Internal Medicine, vol.38, no. 4 (February 18, 2003), pp. 273–287.
73
78
83
88
4,000 5,000 6,000 7,000 8,000
Spending per Beneficiary (Dollars)
6
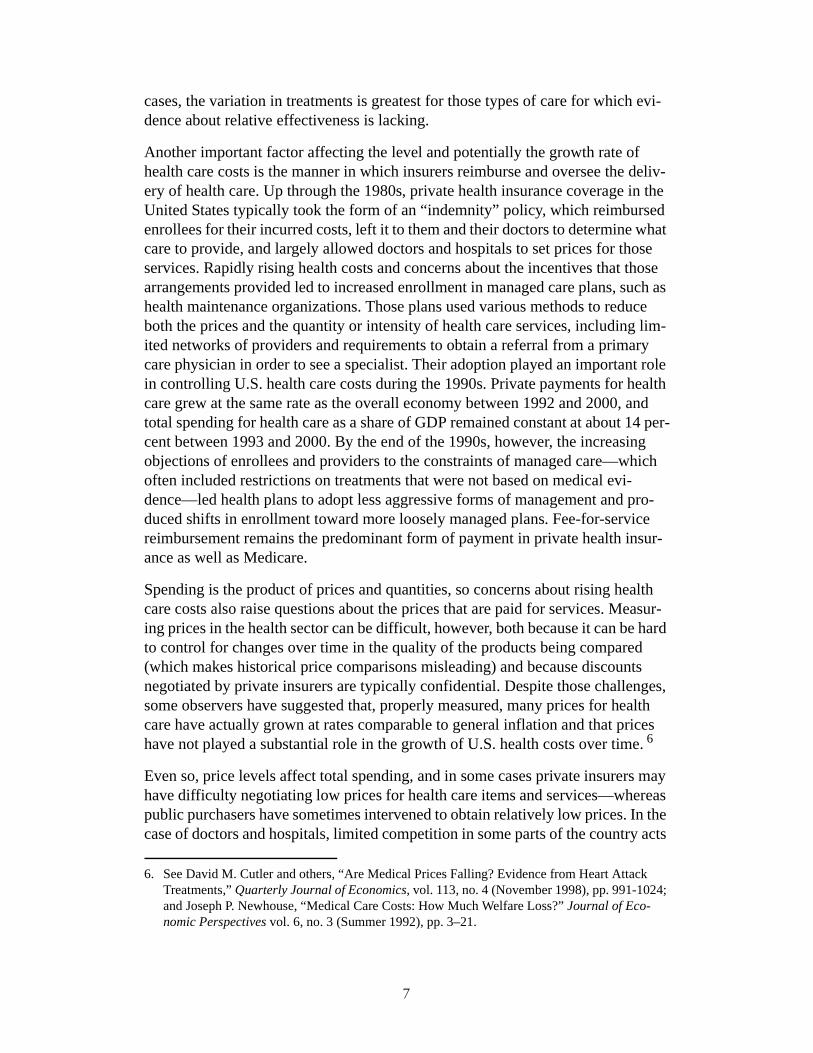
cases, the variation in treatments is greatest for those types of care for which evi-dence about relative effectiveness is lacking.
Another important factor affecting the level and potentially the growth rate ofhealth care costs is the manner in which insurers reimburse and oversee the deliv-ery of health care. Up through the 1980s, private health insurance coverage in theUnited States typically took the form of an “indemnity” policy, which reimbursedenrollees for their incurred costs, left it to them and their doctors to determine whatcare to provide, and largely allowed doctors and hospitals to set prices for thoseservices. Rapidly rising health costs and concerns about the incentives that thosearrangements provided led to increased enrollment in managed care plans, such ashealth maintenance organizations. Those plans used various methods to reduceboth the prices and the quantity or intensity of health care services, including lim-ited networks of providers and requirements to obtain a referral from a primarycare physician in order to see a specialist. Their adoption played an important rolein controlling U.S. health care costs during the 1990s. Private payments for healthcare grew at the same rate as the overall economy between 1992 and 2000, andtotal spending for health care as a share of GDP remained constant at about 14 per-cent between 1993 and 2000. By the end of the 1990s, however, the increasingobjections of enrollees and providers to the constraints of managed care—whichoften included restrictions on treatments that were not based on medical evi-dence—led health plans to adopt less aggressive forms of management and pro-duced shifts in enrollment toward more loosely managed plans. Fee-for-servicereimbursement remains the predominant form of payment in private health insur-ance as well as Medicare.
Spending is the product of prices and quantities, so concerns about rising healthcare costs also raise questions about the prices that are paid for services. Measur-ing prices in the health sector can be difficult, however, both because it can be hardto control for changes over time in the quality of the products being compared(which makes historical price comparisons misleading) and because discountsnegotiated by private insurers are typically confidential. Despite those challenges,some observers have suggested that, properly measured, many prices for healthcare have actually grown at rates comparable to general inflation and that priceshave not played a substantial role in the growth of U.S. health costs over time. 6
Even so, price levels affect total spending, and in some cases private insurers mayhave difficulty negotiating low prices for health care items and services—whereaspublic purchasers have sometimes intervened to obtain relatively low prices. In thecase of doctors and hospitals, limited competition in some parts of the country acts
6. See David M. Cutler and others, “Are Medical Prices Falling? Evidence from Heart AttackTreatments,” Quarterly Journal of Economics, vol. 113, no. 4 (November 1998), pp. 991-1024;and Joseph P. Newhouse, “Medical Care Costs: How Much Welfare Loss?” Journal of Eco-nomic Perspectives vol. 6, no. 3 (Summer 1992), pp. 3–21.
7

Figure 5.
Share of Personal Health Care Expenditures PaidOut of Pocket(Percentage)
Source: Congressional Budget Office based on the Centers for Medicare and Medicaid Services’ data on national health expenditures.
Note: Spending on personal health care excludes administrative costs for health insurance, public and private spending for medical research and construction of facilities, and government spending for public health agencies, such as the Centers for Disease Control and Prevention and state health departments.
as a constraint on private negotiations; in the case of prescription drugs, publicpolicy (through patents) gives manufacturers monopoly power—which leads tohigher drug prices but also encourages the development of new drugs that can bepatented. Federal and state purchasers have established mechanisms that yieldprices that are below private-sector levels for drugs (under Medicaid and thehealth program for military veterans) and for doctors and hospitals (under Medi-care and particularly Medicaid), but such approaches can also raise various con-cerns (including concerns about access to providers).
Another important factor that both reflects and has contributed to rising healthcosts is the declining proportion of those costs that are paid out of pocket. Out-of-pocket payments accounted for 33 percent of all personal health care expendituresin 1975, but by 2005, that share had fallen to 15 percent (see Figure 5). It is pro-jected to decline a little more in the future, reaching 13 percent in 2015. Consum-ers facing lower out-of-pocket costs tend to demand more health care services thanconsumers facing higher out-of-pocket costs. At the same time, rising health carecosts (as a share of income) have probably led individuals to seek more extensive
1975 1985 1995 2005 2015
0
5
10
15
20
25
30
35
33%
26%
17%15%
13%
8

insurance in order to keep the variability of their out-of-pocket expenses fromincreasing.
Options for Controlling Health Care CostsA number of programmatic changes within Medicare and Medicaid, includingchanges in payments to providers and eligibility rules, could be implemented toreduce federal spending.7 Those options have different implications for overallhealth spending, however. Some would simply result in a reallocation of total costsamong different sectors (the federal government, the corporate sector, households,and state and local governments) rather than a reduction in overall costs; otherswould involve some combination of shifting among sectors and reduction in totalcosts; and still others would reduce both federal and total health spending in paral-lel. Many analysts believe that significantly constraining the growth of costs forMedicare and Medicaid over long periods of time, while maintaining broad accessto health providers under those programs, can occur only in conjunction withslowing cost growth in the health care sector as a whole.
Ultimately, therefore, restraining costs in Medicare and Medicaid requires restrain-ing overall health care costs. Two potentially complementary approaches to reduc-ing total health spending—rather than simply reallocating spending among differ-ent sectors of the economy—involve generating more information about therelative effectiveness of medical treatments and changing the incentives forproviders and consumers in the supply and demand of health care.
The current financial incentives facing both providers and patients tend to encour-age or at least facilitate the adoption of expensive treatments and procedures, evenif evidence about their effectiveness relative to existing therapies is limited. Fordoctors and hospitals, those incentives stem from fee-for-service reimbursement.Such payments can encourage health care providers to deliver a given service in anefficient manner but also provide an incentive to supply additional services—aslong as the payment exceeds the costs of the services. For their part, insured indi-viduals generally face only a portion of the costs of their care and, consequently,have only limited financial incentives to seek a lower-cost treatment—a trade-offinherent in having insurance protection. Private health insurers have incentives tolimit the use of ineffective care but are also constrained by a lack of informationabout what treatments work best for which patients.
7. See Congressional Budget Office, Budget Options (February 2007); and Statement of DonaldB. Marron, Acting Director, Congressional Budget Office, Medicaid Spending Growth andOptions for Controlling Costs, before the Senate Special Committee on Aging (July 13, 2006).
9

Many analysts believe that expanded research on “comparative effectiveness”offers a promising mechanism to address some of those concerns.8 Analysis ofcomparative effectiveness is simply a comparison of the impact of differentoptions that are available for treating a given medical condition for a particular setof patients. Such studies may compare similar treatments, such as competingdrugs, or they may analyze very different approaches, such as surgery and drugtherapy. The analysis may focus only on the relative medical benefits and risks ofeach option, or it may go on to weigh both the costs and the benefits of thoseoptions. In some cases, a given treatment may be found more effective for all typesof patients, but more commonly a key issue is determining which specific typeswould benefit most from it. An expanded research effort could be organized invarious different ways. In response to a request from the Senate Budget andFinance Committees, the Congressional Budget Office (CBO) will issue a reporton those options in the near future.
Comparative effectiveness research could be facilitated by having more healthrecords available in electronic form, assuming privacy concerns were appropri-ately addressed.9 That format makes it easier to collect detailed data on the healthstatus and the clinical characteristics of patients, which in some cases could beused to compare treatments in a rigorous way without having to conduct full-scaleclinical trials. Indeed, despite somewhat exaggerated claims about direct cost sav-ings from investments in health information technology, one reason those invest-ments might have a long-term impact on health costs is because of their potentialto expand and improve comparative effectiveness research.
To affect medical treatment and reduce health care spending, the results of com-parative effectiveness analyses would ultimately have to change the behavior ofdoctors and patients—that is, to get them to use fewer services or less intensiveand less expensive services than are currently projected. Bringing about thosechanges would probably require action by public and private insurers to incorpo-rate the results into their coverage and payment policies in order to affect theincentives facing doctors and patients.
Although private insurers could choose not to cover drugs, devices, or proceduresthat were found to be less effective or less cost-effective, the insurers would have anumber of additional options as well. They could simply provide more informationto patients and doctors, which could improve compliance with treatment guide-lines. Alternatively, insurers could adjust payments to doctors and hospitals to
8. For an analysis of the issue, see Statement of Peter R. Orszag, Director, Congressional BudgetOffice, Research on the Comparative Effectiveness of Medical Treatments: Options for anExpanded Federal Role, before the Subcommittee on Health, House Committee on Ways andMeans (June 12, 2007).
9. See Jean R. Slutsky, “Moving Closer to a Rapid-Learning Health Care System,” Health Affairs,Web Exclusive (January 26, 2007), pp. w122-w124; and related articles in that issue on rapidlearning and electronic medical records.
10

encourage the use of more-effective care. Or insurers could require enrollees topay some or all of the additional costs of more-expensive treatments that wereshown to be less effective or less cost-effective (in which case enrollees wouldhave to decide whether the added benefits were worth the added costs). Indeed,some recent proposals call for “value-based” insurance design that encourages theuse of services when the clinical benefits exceed the costs and likewise discour-ages the use of services when the benefits do not justify the costs.10 Althoughinsurance plans generally vary cost sharing by the type of service provided—with lower cost-sharing requirements for hospital care and higher obligations foroutpatient services—that new approach would be tailored to the patient and thetreatment.
The Medicare program has not taken costs into account in determining what ser-vices are covered and has made only limited use of comparative effectiveness datain its payment policies—but if statutory changes permitted it, Medicare could useinformation about comparative effectiveness to promote higher-value care. Forexample, Medicare could tie its payments to providers to the cost of the mosteffective or most efficient treatment. If that payment was less than the cost of pro-viding a more expensive service, then doctors and hospitals would probably electnot to provide it—so the change in Medicare’s payment policy would have thesame practical effect as a coverage decision. Alternatively, enrollees could berequired to pay for the additional costs of less effective procedures (although theimpact on incentives for patients and their use of care would depend on whetherand to what extent they had supplemental insurance coverage that paid some or allof Medicare’s cost-sharing requirements).
More modest steps that Medicare could be authorized to take would includesmaller-scale financial inducements to doctors and patients to encourage the use ofcost-effective care. Doctors and hospitals could receive modest bonuses for prac-ticing effective care or modest cuts in their payments for using less effective treat-ments. Likewise, enrollees could be asked to pay a portion of the additional costsof less efficient procedures (rather than the full difference in costs). Or Medicarecould provide information to doctors and their patients about doctors’ treatmentpatterns, which would create some pressure for doctors to use more-efficientapproaches. Adopting more modest measures to incorporate the findings of com-parative effectiveness research, however, is likely to yield smaller savings for theprogram.
Even in the absence of more information about comparative effectiveness, changesin incentives could help to control health care costs—but such measures would bemore likely to maximize the health gains obtained for a given level of spending ifthey were combined with improved information. On the provider side, greater
10. Michael E. Chernew, Allison B. Rosen, and A. Mark Fendrick, “Value-Based InsuranceDesign,” Health Affairs, Web Exclusive (January 30, 2007), pp. w195–w203.
11

bundling of payments to cover all of the services associated with a treatment, dis-ease, or patient could reduce or eliminate incentives to provide additional servicesthat might be of low value. Such approaches, however, can raise concerns aboutthe financial risk that providers face and about their incentives to provide too littlecare. On the consumer side, a landmark health insurance experiment by RANDshowed that higher cost sharing reduces spending—particularly when compared toa plan offering free care—with little or no adverse effects on health.11 However,compared with more typical health insurance plans (which do not offer free care),high-deductible designs have more modest effects on health care spending; suchapproaches also raise concerns about the financial burden on individuals withmore health problems (again reflecting trade-offs between providing insuranceprotection and maintaining incentives to control costs).12
The broad options of generating more information and of changing incentives donot represent an exhaustive list of proposals intended to reduce health costs. Someanalysts have advocated significant expansions of disease management and carecoordination as mechanisms for reducing costs—proposals that reflect the increas-ing prevalence of many chronic conditions, the large share of health care spendingthat is incurred by individuals with those conditions, and lack of care coordinationsystems in many public and private health insurance plans. The top 25 percent ofMedicare beneficiaries, for example, account for 85 percent of Medicare costs (seeFigure 6), and more than three-quarters of those expensive beneficiaries had oneor more of seven prominent chronic conditions (including coronary artery disease,diabetes, and congestive heart failure).13 However, the evidence to date—includ-ing the findings of several demonstration projects conducted under Medicare—suggests that disease management and care coordination may raise the quality ofhealth care provided but do not significantly reduce costs among a broad array ofpatients.14 As more empirical evidence on the approaches develops, identifyingspecific ways to reduce costs, especially for targeted subsets of beneficiaries, maybecome possible; for now, the possibility and scope of savings remain unclear. In
11. See Willard G. Manning and others, “Health Insurance and the Demand for Medical Care: Evi-dence from a Randomized Experiment,” American Economic Review, vol. 77, no. 3 (June1987), pp. 251–277.
12. See Congressional Budget Office, Consumer-Directed Health Plans: Potential Effects onHealth Care Spending and Outcomes (December 2006).
13. See Congressional Budget Office, High-Cost Medicare Beneficiaries (May 2005).
14. See Congressional Budget Office, An Analysis of the Literature on Disease Management Pro-grams (October 13, 2004); Randall Brown and others, “The Evaluation of the Medicare Coordi-nated Care Demonstration: Findings for the First Two Years,” (Mathematica Policy Research,Inc., March 21, 2007), available at www.mathematica-mpr.com/publications; and Statement ofStuart Guterman, Senior Program Director, Program on Medicare’s Future, The Common-wealth Fund, Enhancing Value in Medicare: Chronic Care Initiatives to Improve the Program,before the Senate Special Committee on Aging (May 9, 2007).
12

Figure 6.
Concentration of Total Annual Medicare ExpendituresAmong Beneficiaries, 2001(Percent)
Source: Congressional Budget Office based on data from the Centers for Medicare and Medicaid Services.
future months and years, CBO will be expanding its work to provide the Congresswith more analysis of various options for controlling health care costs.
Whichever approaches are taken, the overall impact of steps to control costs willbe greater the sooner that they are taken—particularly if they reduce the growthrate of health care costs and not just the level of those costs. For example, if costsper beneficiary in Medicare and Medicaid grew 1 percentage point faster than percapita GDP starting in 2025—rather than growing at the long-term historical rateof 2.5 percentage points faster—then the share of the economy devoted to thosetwo programs in 2050 would shrink by nearly 7 percent of GDP, from 21 percentto about 14 percent (see Figure 7). If that slower growth rate were instead obtainedstarting in 2015, the projected spending for those programs in 2050 would bereduced by nearly 9 percent of GDP (from 21 percent to about 13 percent).15
15. Similarly, if costs per enrollee continued to grow 2.5 percentage points faster than per capitaGDP, the present value of Medicare and Medicaid spending over the next 50 years would equalalmost 11 percent of the present value of GDP over that period. If that difference in growthrates were reduced to 1 percentage point starting in 2025, the present value of outlays woulddecline to about 9 percent of GDP. And if the slower growth rate were obtained starting in 2015,the present value of outlays would fall to about 8 percent of GDP.
Beneficiaries Expenditures
0
10
20
30
40
50
60
70
80
90
100
3.8
11.2
23.5
18.4
43.1
55
15
25
50
13

Figure 7.
Effects of Slowing the Growth of Spending forMedicare and Medicaid(Percentage of gross domestic product)
Source: Congressional Budget Office.
Note: The health cost growth differential refers to the number of percentage points by which the growth of annual health care spending per beneficiary is assumed to exceed the growth of nominal gross domestic product per capita, after an adjustment for the growth and aging of the Medicare and Medicaid populations.
In considering those potential savings, it is important to note that they are merelyillustrative and do not represent CBO’s estimates of the effects that any specificproposal or combination of options would have. As the challenges touched on inthe preceding discussion suggest, reducing the growth rate of health costs over anextended period of time will be a complicated endeavor.
Employer-Sponsored InsuranceConcerns about the operation of private insurance markets have given rise to vari-ous proposals that seek to improve the efficiency of those markets and that couldalso affect health care spending. Because of the central role that employer-spon-sored coverage currently plays, a key issue for broad health reform proposals iswhether they are based upon an employer-sponsored system, and if not, how theycreate the pooling mechanisms essential for effective health insurance markets.Other key budgetary and policy issues include any requirements for employers’contributions and the treatment of existing tax subsidies for employer-sponsoredinsurance.
1963 1970 1977 1984 1991 1998 2005 2012 2019 2026 2033 2040 2047
0
5
10
15
20
25Actual Projection
2.5 Percentage Points
Differential of:
1 Percentage PointBeginning in 2025
1 Percentage PointBeginning in 2015
14

Issues with Current SystemMost Americans get their primary health insurance through an employer—eithertheir own or that of a family member. By CBO’s estimates, 165 million nonelderlyindividuals are currently covered by employer-based insurance, with 140 millionobtaining that coverage through a large or medium-sized employer (one with 50 ormore workers) and 25 million obtaining that coverage through a small employer.Although employer-based insurance has advantages, particularly when providedthrough a larger employer, that arrangement also has limitations, and manyemployers have expressed serious concerns about the rising costs of providingcoverage. Employers’ concerns are presumably a proxy for the underlying issue,which is how well the employer-based system functions for the American public:Ultimately, workers pay for their coverage directly or through reduced wages, andthe advantages and disadvantages of that system accrue to them.
One advantage of employer-based insurance is that it can facilitate the pooling ofrisks. Although employees will vary in their use of health services from year toyear, the average health costs of a large group of employees tend to be quite sta-ble—because higher-than-expected costs for some workers are offset by lower-than-expected costs for others. As a result, employees can be offered insurancethat reduces their exposure to high medical costs without posing substantial finan-cial risks for their employer (and, indeed, many large employers choose to assumethose risks themselves rather than contracting with an insurance company to bearthem). Employers typically foster risk pooling by offering to cover a majority ofthe total premiums; even though a firm’s workers (as a group) ultimately pay forthat subsidy, employers’ contributions lower the price of insurance that individualworkers see and thus encourage broad participation. Another advantage ofemployer-based coverage is its reduced administrative costs—compared withthose that would be incurred if employees purchased their own policies in the indi-vidual insurance market—which in turn lower the premiums.
At the same time, several concerns about employer-based coverage have beenraised. For one, the advantages related to risk pooling and administrative costs areless evident for smaller firms, which employ about one-fourth of all workers. As aresult, premiums for small employers are typically higher (for the same level ofcoverage) and can also be more volatile—factors which contribute to the lowerlikelihood that small employers offer insurance. In addition, the link betweenemployment and insurance coverage typically means that when workers changejobs, they also have to change their insurance plan. Over time, the resulting turn-over of enrollees may discourage insurers from subsidizing health investments thattake a long time to pay off, because the initial insurers may not be the ones to real-ize the benefits from them. Finally, other observers object to the limited range ofchoices provided by many employers—at least a third of workers have no choiceof health plan—and to the role that employers play in selecting which types ofcoverage are made available (even though over the long term, employers’ offer-ings presumably evolve to reflect the collective preferences of their workers).
15

Another key feature of the U.S. health care system is that insurance purchasedthrough employers receives favorable treatment under the tax code—whichencourages enrollment in such coverage but also tends to drive up health costs.Employers may deduct the costs of providing that coverage as a business expense(just as they deduct employees’ wages and other forms of compensation), and thusthose payments avoid corporate taxes on profits. But unlike wages, the costs thatemployers pay for health insurance are excluded from the taxable income of thepolicyholders (and most employee contributions are similarly excluded). As aresult, that portion of employees’ compensation avoids individual income and pay-roll taxes as well. For a typical worker, those tax preferences amount to a subsidyfrom the government of more than 30 percent toward the costs of health care ser-vices covered by employer-sponsored insurance. By reducing the price of thatinsurance, the tax subsidy also encourages workers to secure more extensive poli-cies through their employers, increasing the share of costs that is covered anddecreasing the share that is paid out of pocket. In turn, that more extensive cover-age puts upward pressure on total health spending.
Rising health costs in recent years have generated concerns that employers willcease offering coverage or make their coverage less comprehensive. However,aggregate data indicate that such effects have been modest to date. The share ofworkers who have employer-sponsored health insurance has decreased somewhatsince 2000, but according to surveys of employers, that development largelyreflects a decline in the percentage of smaller firms that are offering insurance;coverage rates at larger firms have fluctuated over time but were comparable in2000 and 2006.16 There is also some evidence that in recent years, employmenthas shifted somewhat to smaller firms and to industries that are less likely to offercoverage. Even with the recent decline in smaller firms’ rates of offering insur-ance, their overall “offer rate” remains comparable to that in 1996.
Amounts that enrollees have to pay out of pocket in premiums and cost-sharinghave risen significantly in absolute terms, but for the most part those increases arein line with rising health costs overall. On average, the share of health costs thatenrollees pay directly has not changed much (and the longer-term trend in theshare of health care paid out of pocket, as indicated above, has been a substantialdecline). Between 2000 and 2006, employees’ average contributions to healthinsurance premiums—the amount they pay directly, net of any employers’ contri-butions—rose about 85 percent. The overall costs of their insurance plans roseabout 75 percent over that same period, yielding only slight changes in the share ofpremiums paid directly by enrollees.
16. Kaiser Family Foundation and Health Research and Educational Trust, Employer Health Bene-fits: 2006 Annual Survey (Washington, D.C., September 2006).
16

Options for Reforming Employer-Sponsored InsuranceProposals to replace or significantly modify the current system of employer-spon-sored insurance vary widely in their design. Some would establish a single-payersystem in which all workers and dependents would participate, as under proposalsto allow or require all individuals to enroll in Medicare. Others would move inessentially the opposite direction, shifting to a system in which insurance was typ-ically purchased in the individual market (perhaps accompanied by additional reg-ulation of that market). Still others would build on the existing employment-basedsystem but use subsidies or mandates to increase the number of workers anddependents who had insurance, such as “pay or play” proposals that would requiremost employers either to offer health insurance or to contribute to a fund thatwould subsidize insurance purchases.
A full analysis of those options is beyond the scope of my testimony today, but afew key considerations can be highlighted. One is the impact each option mighthave on the pooling of risks. By their nature, single-payer systems pool all partici-pants together. By contrast, options that emphasize the individual insurance mar-ket may require further regulation—such as limits on the degree to which premi-ums may vary and on the factors (such as age) that may affect premiums—tomaintain current levels of pooling, as most supporters of such options recognize.In principle, all enrollees in a given insurer’s policy are pooled together eventhough they purchased their coverage individually. In practice, however, thosewho have health problems will generally find changing insurers or plans more dif-ficult, so, over time, as healthier enrollees gravitate toward less expensive policies,the degree of pooling that occurs will tend to decline.
Another significant issue involved in any reform of the employer-provided systemis the short- and medium-term impact on employers’ contributions to health insur-ance. Over time, any changes in those contributions, which are substantial, shouldbe reflected in workers’ wages or other benefits, but the speed of that adjustmentcould vary. Alternative systems for employers’ payments—including new taxes orother mandatory contributions—could also have significant macroeconomiceffects on incentives to work and on the formation and organization of businesses(if, for example, contributions were tied to the size of firms). The specific effectsof any proposal, however, would depend importantly on the details of the new sys-tem that would be established.
A closely related question is whether proposals modify or repeal the tax exclusionfor employer-sponsored insurance. Replacing the tax exclusion for employment-based health plans with a deduction or tax credit that could be used in either theemployment-based or individual market would make employment-based plansless attractive (relative to individually purchased plans) than they are now. As aresult, the number of people insured through employment-based plans woulddecline. Although some of the people losing coverage in the employment-basedmarket would become uninsured, the bulk of them would be insured through the
17
individual market instead. Moving from the current system—in which the taxexclusion creates a bigger tax subsidy for larger health insurance expenditures—to a fixed deduction or credit independent of the cost of a health plan would causepeople to buy plans with less extensive benefits, on average.17
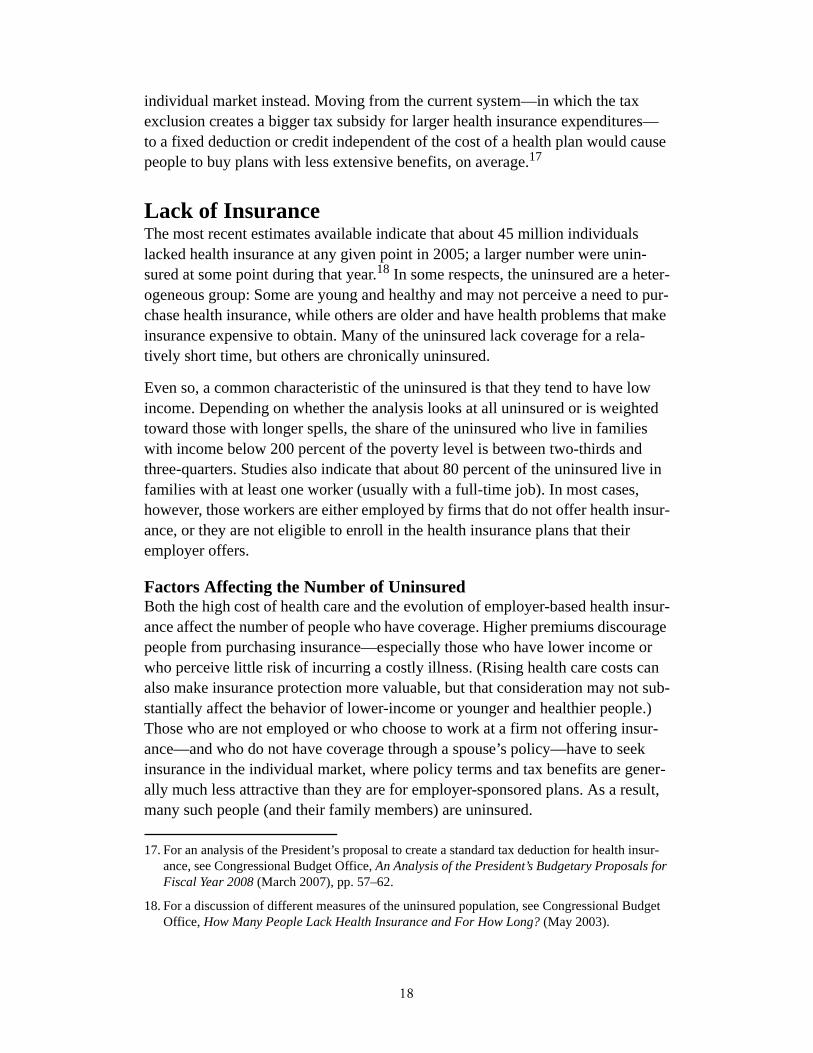
Lack of InsuranceThe most recent estimates available indicate that about 45 million individualslacked health insurance at any given point in 2005; a larger number were unin-sured at some point during that year.18 In some respects, the uninsured are a heter-ogeneous group: Some are young and healthy and may not perceive a need to pur-chase health insurance, while others are older and have health problems that makeinsurance expensive to obtain. Many of the uninsured lack coverage for a rela-tively short time, but others are chronically uninsured.
Even so, a common characteristic of the uninsured is that they tend to have lowincome. Depending on whether the analysis looks at all uninsured or is weightedtoward those with longer spells, the share of the uninsured who live in familieswith income below 200 percent of the poverty level is between two-thirds andthree-quarters. Studies also indicate that about 80 percent of the uninsured live infamilies with at least one worker (usually with a full-time job). In most cases,however, those workers are either employed by firms that do not offer health insur-ance, or they are not eligible to enroll in the health insurance plans that theiremployer offers.
Factors Affecting the Number of UninsuredBoth the high cost of health care and the evolution of employer-based health insur-ance affect the number of people who have coverage. Higher premiums discouragepeople from purchasing insurance—especially those who have lower income orwho perceive little risk of incurring a costly illness. (Rising health care costs canalso make insurance protection more valuable, but that consideration may not sub-stantially affect the behavior of lower-income or younger and healthier people.)Those who are not employed or who choose to work at a firm not offering insur-ance—and who do not have coverage through a spouse’s policy—have to seekinsurance in the individual market, where policy terms and tax benefits are gener-ally much less attractive than they are for employer-sponsored plans. As a result,many such people (and their family members) are uninsured.
17. For an analysis of the President’s proposal to create a standard tax deduction for health insur-ance, see Congressional Budget Office, An Analysis of the President’s Budgetary Proposals forFiscal Year 2008 (March 2007), pp. 57–62.
18. For a discussion of different measures of the uninsured population, see Congressional BudgetOffice, How Many People Lack Health Insurance and For How Long? (May 2003).
18

Federal programs have reduced significantly the number of people who would oth-erwise be uninsured. The Medicare program provides nearly universal coverage tothe elderly, a substantial share of whom lacked health insurance (or had very lim-ited coverage) at the time of its enactment. Medicaid offers health insurance cover-age to a variety of low-income individuals—primarily poor children and theirmothers, pregnant women, the disabled, and the elderly. In 2006, about 30 millionnondisabled children in low-income families were enrolled in Medicaid. At thesame time, surveys indicate that several million people are eligible for Medicaidand otherwise uninsured but not enrolled in the program. Such individuals maysimply be unaware of Medicaid or their eligibility for it, or they may be dissuadedfrom enrolling by various factors, including the stigma that is sometimes associ-ated with means-tested programs. In many cases, individuals may be enrolled intoMedicaid when they need expensive services; thus, those who are eligible for butnot enrolled in the program have some protection against financial loss but do notobtain the full benefits of participation.
The State Children’s Health Insurance Program (SCHIP), enacted in 1997, alsoprovides health insurance coverage to uninsured children living in families withincome that is relatively low—but too high to qualify for Medicaid. During 2006,nearly 7 million children were enrolled in SCHIP at a total cost to the federal gov-ernment of about $5 billion.19
SCHIP has significantly reduced the number of low-income children who areuninsured. CBO estimates that, among children living in families with incomebetween 100 percent and 200 percent of the poverty threshold, the uninsurancerate fell from 22.5 percent in 1996 (the year before SCHIP was enacted) to16.9 percent in 2005, a reduction of 25 percent. In contrast, the uninsurance rateamong children in higher-income families remained relatively stable during thatperiod (see Figure 8). As with Medicaid, estimates indicate that a substantial num-ber of children are eligible for SCHIP but not enrolled in it. Although SCHIP andMedicaid have significantly reduced the number of uninsured children in low-income families, the net effect on the extent of coverage is smaller than the num-ber of children who have been enrolled in public coverage because the increase inpublic coverage has been partially offset by a reduction in private coverage.
Concerns about the uninsured include the financial risk they face and the prospectthat their health will be adversely affected. According to one recent study, peoplewho are uninsured for a full year receive about half as much care as continuouslyinsured individuals—partly reflecting the fact that many uninsured individuals arerelatively young and healthy but also a result of the higher costs they face for
19. See Congressional Budget Office, The State Children’s Health Insurance Program (May 2007).The figure for the number of people enrolled in 2006 reflects enrollment at any time during theyear. The number of people enrolled in an average month would be about 60 percent of thattotal.
19

Figure 8.
Percentage of Children Who Were Uninsured, byFamily Income as a Percentage of the Federal PovertyLevel(Percent)
Source: Congressional Budget Office based on data from the Current Population Survey for 1996 to 2005.
Note FPL = federal poverty level.
services.20 Several studies have found that, when they have a serious disease, theuninsured are less likely to have received a prompt diagnosis of their condition andare less likely to receive expensive treatments.21 The majority of the care that theuninsured do receive is provided free of charge or at a substantially reduced cost,either because they receive services from clinics or other sources that are subsi-dized by the government or because private providers are unable to collectpayment.
To address such concerns, several states have taken or are contemplating their owninitiatives targeting the uninsured. For example, Massachusetts enacted a programin 2006 aimed at providing nearly universal health insurance coverage for its resi-dents. The legislation generally requires individuals to purchase insurance andincludes increasing penalties for those who do not obtain coverage (in 2008, they
20. Jack Hadley and John Holahan, “How Much Medical Care Do the Uninsured Use, and WhoPays for It?” Health Affairs, Web Exclusive (February 12, 2003), pp. W3-66–W3-81.
21. For a review of those studies, see Institute of Medicine, Care Without Coverage: Too Little, TooLate (Washington, D.C.: National Academy Press, 2002), available at www.iom.edu/Object.File/Master/4/160/Uninsured2FINAL.pdf.
1996 1999 2002 2005
0
5
10
15
20
25
30
Less Than FPL
100% to 199% of FPL
200% to 299% of FPL
300% of FPL or More
20

will have to pay roughly half of the cost of the least expensive health plan offeredin their region); additional penalties apply to employers who do not offer cover-age. To make it easier for individuals without access to employer-based plans toobtain coverage, an insurance exchange (known as the Connector) has been estab-lished. To help lower-income individuals obtain coverage, the state will fully sub-sidize insurance for those with income below 150 percent of the poverty level andwill offer smaller subsidies to those with somewhat higher income. Even so, someindividuals have been exempted from the coverage mandate because they havebeen deemed unable to find low-cost sources of coverage. Other states, includingCalifornia (which has a much larger uninsured population), are considering similarapproaches.
Options for Expanding Insurance CoverageAlthough reductions in overall health costs would tend to lower health insurancepremiums—and thus could reduce the number of people without insurance—asubstantial number of people were uninsured even when health care costs werelower. Substantially reducing the number of uninsured individuals would thereforeprobably require a mandate to purchase insurance (or similar penalties for not hav-ing coverage), a set of subsidies for low-income people, or some combination ofthose approaches. The share of people who are uninsured tends to decline as theirincome rises, so subsidies of premiums could be set on a sliding scale. A tradeoffexists in the size of the subsidy: larger subsidies would increase voluntary pur-chases of insurance but would also be more costly to provide. A mandate to pur-chase insurance combined with a penalty for not doing so also provides an impetusto obtain coverage, but in the form of a stick rather than a carrot.
Subsidies could take the form of tax rebates or credits or direct support through agovernment program like Medicaid (in which the enrollee’s premiums cover lessthan the average cost of the policy). Because the uninsured tend to have lowerincome and therefore face lower marginal income tax rates, tax credits tend to be amore effective means of providing subsidies than tax deductions (whose valueincreases with the marginal tax rate). For the same reason, tax credits are evenmore valuable to low- and moderate-income recipients if they are refundable,because that feature makes the full value of the credit available even if it exceedsrecipients’ income tax liability. An inevitable trade-off is that providing new gov-ernment subsidies to expand insurance coverage will displace some private spend-ing—because it is difficult to prevent people with low-income who already havehealth insurance from qualifying for the newly offered subsidies.
Here too a full consideration of the advantages and disadvantages of those optionswould require much more extensive analysis than can be presented in this testi-mony, but a few key points can be covered regarding administrative costs andoverall health care costs. Administrative costs could be affected if options forexpanding insurance coverage also included reforms of the individual insurancemarket (as discussed above in connection with changes to the employer-sponsored
21

insurance system) as well as mechanisms to oversee the insurance policies offeredand to facilitate enrollment in a plan (as under the Massachusetts initiative). Insur-ance market reforms have the potential to reduce or eliminate some administrativecosts now incurred by private insurers. For example, community rating require-ments—under which all enrollees pay the same premium, at least within an agerange—or limits on the factors that can be used to adjust premiums could reducecosts that insurers now incur to enroll beneficiaries and underwrite their policies.At the same time, providing information and conducting outreach to individualsinvolves administrative costs that may be difficult to avoid under any system thatprovides a choice of insurance plans. Administrative costs could be reduced fur-ther under a single-payer system, but trade-offs would arise between achievingthose savings, running the plan efficiently, and limiting choices for enrollees.
Several factors would affect the overall impact that expanding insurance coveragewould have on total health care spending—first and foremost being the netincrease in coverage and the type and extent of insurance provided. Health spend-ing associated with individuals who were newly covered would be expected toincrease because coverage would encourage greater use of services (indeed, thatwould be one of the objectives of expanding coverage). A shift in measured spend-ing would also occur, because the services used by newly covered beneficiarieswould be paid for by their insurer rather than becoming uncompensated care.Some of that increase would be offset by reductions in government spending thatnow goes to provide free or subsidized care, and it is also possible that reductionsin uncompensated care could reduce costs for other private payers (if doctors andhospitals lowered their fees to private insurers as a result of receiving higher pay-ments on behalf of formerly uninsured individuals). The extent of such effects ishighly uncertain, however.
Prevention and Healthy LivingThe ultimate objective of any health care system is to promote health, whether bytreating diseases that arise or by preventing them from occurring in the first place.Despite the cost of the nation’s health care system, many concerns exist about thedegree to which it is attaining that objective. Indeed, concerns about rising healthcare costs might not be so prominent if more evidence showed that those expendi-tures were yielding commensurate gains in health. In part, those shortcomings inthe system’s performance relate to the questions noted above about whetherpatients are receiving the most effective or most cost-effective treatments—reflecting a lack of information, among other factors. Concerns also exist, though,about steps that are not being taken today to prevent the onset of disease, evenwhen clear evidence is available about their benefits. In that context, proposalsthat encourage more prevention and healthy living can help to promote betterhealth outcomes, although their net effects on federal and total health spending areuncertain. Moreover, bringing about substantial changes in behavior could require
22

actions outside the formal health care sector, and even then might be very difficultto achieve.
Issues Regarding Preventive Care and People’s BehaviorThe health of the American public, on average, is lower than it could be becausesteps that can foster better health—such as preventive medicine—appear to beunderused, and various types of unhealthy behavior—in particular, those contrib-uting to recent increases in obesity—remain relatively common.
Preventive services encompass several distinct types of care: immunizations andother interventions that actually prevent diseases from arising; screening tests thatcan determine the presence of a disease; and counseling to encourage healthybehavior or discourage unhealthy habits. The U.S. Preventive Services Task Force,an arm of the Department of Health and Human Services, has analyzed the cost-effectiveness of many preventive services and has developed a recommended listof interventions that should be routinely provided. (In some cases, the evidencenecessary to make a recommendation is not available—a situation analogous tothe uncertainties about which treatments work best.) According to one study, how-ever, adults receive only about half of the recommended preventive services.22
Various reasons have been cited for the low use of preventive services, including alack of awareness about their benefits among consumers and a focus on treatmentrather than prevention among doctors. Another source of concern has been theextent to which insurance plans cover preventive care and the cost-sharing require-ments for that care. The majority of private insurers appear to cover immuniza-tions and various screening tests—and about half of the plans that require adeductible exempt at least some preventive services from it—but coverage ofcounseling services is much more limited; low reimbursements to physicians forcounseling services also discourage their provision.23 Coverage of preventive careunder Medicare requires specific legislative authority, and thus varies from ser-vices to service. Medicaid covers childhood immunizations on a consistent basis,but coverage for screening and diagnostic services for children and adults variesfrom state to state. To address that situation, some health researchers have recentlyput forward proposals to expand the use of preventive care using federal subsi-dies.24
22. See Elizabeth A. McGlynn and others, “The Quality of Health Care Delivered to Adults in theUnited States,” New England Journal of Medicine, vol. 348, no. 26 (June 26, 2003), pp. 2635–2645. That study also found that adults receive about half of the recommended services foracute and chronic health problems.
23. See Eileen Salinsky, Clinical Preventive Services: When Is the Juice Worth the Squeeze? IssueBrief No. 806 (Washington, D.C.: National Health Policy Forum, August 24, 2005); and KaiserFamily Foundation, Employer Health Benefits: 2006 Annual Survey.
24. See, for example, Jeanne M. Lambrew, A Wellness Trust to Prioritize Disease Prevention,Hamilton Project Discussion Paper 2007-04 (Washington, D.C.: Brookings Institution, April2007).
23

Such steps could improve health, but the net effect of greater use of preventivecare on health spending is uncertain. In some cases, preventive care can help avoidmore costly treatments that may be required after a disease has developed further.In other cases, though, increased use of preventive care could increase other healthcare spending—to treat newly discovered diseases or to address complicationsarising from testing, for example. Additional costs are associated with treatingpeople who have received “false positives”—that is, who are incorrectly identifiedas having a given disease. Furthermore, screening tests are typically performed onpeople with no symptoms, so the number of people tested may be quite large com-pared with the number who will have a disease discovered. As a result, one olderstudy found, the use of preventive care usually adds to overall medical spending,once the cumulative costs of screening individuals who are found not to have thedisease in question are included.25 A more recent review of the evidence con-cluded that, “with the exception of some immunizations, most preventive servicesdo not ‘save’ money.”26 The extent to which electronic health records and otherinformation technology advances could allow more precise targeting of screeningtests remains unclear.
Perhaps an even more important determinant of health than the health care systemis an individual’s behavior. In particular, obesity and smoking have substantialhealth consequences.
Obesity. The share of Americans who are overweight or obese has risen dramati-cally over the past three decades, from about one-half to roughly two-thirds—withthe share who are obese accounting for the entire increase (see Figure 9). Accord-ing to one recent study, the rise in obesity rates in the United States is relatedmostly to an increase in caloric intake—and in particular, an increase in caloriesfrom snacks—rather than a decline in caloric expenditures—that is, reducedactivity.27
Obesity is associated with many serious medical conditions, including diabetes,heart disease, and high blood pressure. According to another recent study, obesepeople incurred medical costs in 2001 that were 37 percent higher than those forpeople of normal weight—a difference of about $1,000 per person.28 That studyalso found that the increased prevalence of obesity between 1987 and 2001accounted for 12 percent of the overall growth in real (inflation-adjusted) medicalspending per capita that occurred over that period. Another study found even more
25. Louise B. Russell, Is Prevention Better Than Cure? (Washington, D.C.: Brookings Institution,1986).
26. Salinsky, Clinical Preventive Services, p. 7.
27. David M. Cutler, Edward L. Glaeser, and Jesse M. Shapiro, “Why Have Americans BecomeMore Obese?” Journal of Economic Perspectives, vol. 17, no. 33 (Summer 2003), pp. 93–118.
28. Kenneth E. Thorpe and others, “The Impact of Obesity on Rising Medical Spending,” HealthAffairs, Web Exclusive (October 20, 2004), pp. W4-480–W4-486.
24

Figure 9.
Percentage of Individuals Ages 20 to 74 Who AreOverweight or Obese
Source: Congressional Budget Office based on Department of Health and Human Services, Centers for Disease Control and Prevention, National Center for Health Statistics, Health, United States, 2006.
Note: Individuals who are overweight are defined as having a body mass index (BMI) of 25 or more but less than 30; obese, a BMI of 30 or more. By comparison, people with a healthy weight have a BMI of 18.5 to less than 25.
significant implications for Medicare: The share of spending attributable to obeseenrollees increased from about 9 percent in 1987 to about 25 percent in 2002, asubstantially larger increase than was seen in the obesity rate for the Medicarepopulation.29
Smoking. Smoking rates have declined in the United States, but roughly one-fifthof the population still smokes. Smoking rates among pregnant women have alsoshown a steady decline, but about 10 percent of expectant mothers still smokedespite the substantial health risks that smoking poses to their babies (seeFigure 10).
Smoking rates began to fall following the Surgeon General’s 1964 report on smok-ing, which stated definitively that smoking causes cancer. Since that time, addi-tional information about the adverse health effects of smoking has been developedand disseminated—which has probably contributed to the steady decline in smok-
29. Medicare Payment Advisory Commission, Report to the Congress: Promoting Greater Effi-ciency in Medicare (June 2007), p. 9.
1960–1962 1971–1974 1976–1980 1988–1994 1999–2002
0
10
20
30
40
50
60
70
Overweight
Obese
25

Figure 10.
Cigarette Smoking by Various Groups(Percentage)
Source: Congressional Budget Office based on Department of Health and Human Services, Centers for Disease Control and Prevention, National Center for Health Statistics, Health, United States, 2006.
ing rates. (For example, smoking is associated with a significantly increased riskof developing heart disease and emphysema and of having a stroke) Other factorsaffecting smoking rates are regulations such as bans on smoking in certain areasand limits on how cigarettes can be sold and, more importantly, the rise in the realprice of cigarettes. Federal excise taxes and most state taxes on tobacco have beenraised periodically over the years, and those increases are passed on to consumers,boosting the retail price of cigarettes. Each 10 percent increase in price, researchhas shown, causes the use of cigarettes to fall by 2.5 percent to 5 percent.
In general, the fact that taxing an item can cause consumers to buy less of it thanthey might otherwise can result in a less efficient allocation of society’s resources(unless some of the costs associated with the taxed item are not reflected in itsprice). But the use of cigarettes creates “external costs” for society that are notpaid by smokers or tobacco producers, such as higher costs for health insurance (tocover the higher medical expenses incurred by smokers) and the damaging effectsof cigarette smoke on the health of nonsmokers. Furthermore, people may under-estimate the harm they do to themselves by smoking or the addictive power of nic-otine. Teenagers in particular may not be capable of evaluating the long-termeffects of beginning to smoke. For reasons that are not entirely clear, the smokingrate for teens (which had been comparable to the rate for adult men) increased inthe early 1990s. But that rate fell substantially following the significant increases
1983 1985 1987 1989 1991 1993 1995 1997 1999 2001 2003 2005
0
5
10
15
20
25
30
35
40
Adults
Pregnant Women
High School Seniors
26

in cigarette prices that accompanied a multibillion-dollar settlement agreementbetween major tobacco companies and the states.
Options Regarding Prevention and Healthy LivingReform proposals could encompass preventive measures and efforts to encouragehealthier lifestyles. Broadly speaking, three basic policy approaches could beadopted. First, more information about the consequences of unhealthy behavior orthe factors contributing to it could be made available, in forms that could affectindividual behavior or even social norms. (Nutritional information, for example, isreadily available for packaged foods but more difficult to come by for othersources—such as restaurant meals). Second, financial incentives could be modi-fied to encourage healthier living and to discourage unhealthy activities. Forexample, cigarette taxes could be increased, which would discourage smoking,especially among teenagers. In addition, an increase in the federal tax on cigarettesof 50 cents per pack would raise about $5 billion per year, according to the JointCommittee on Taxation. Third, regulatory steps could be taken to encouragehealthy behavior and discourage poor health habits. For example, recent effortshave been aimed at improving the nutrition and reducing the calories of schoollunches and snacks available in schools. Some research suggests that changing thepresentation of food choices can encourage healthy eating.30
In considering those options, it is important to recognize that there are costs toimposing regulations and levying taxes and that in many cases the benefits of spe-cific options to promote healthy living are uncertain. For example, no consensusexists about the size of smoking’s external costs, which makes determining theappropriate level of tobacco taxes difficult. Some analysts estimate that those costsare significantly lower than the taxes and settlement fees now levied. Others main-tain that the external costs are greater or that the failure of people to anticipate thefuture effects on themselves (rather than on other people) justifies a higher tax rateon cigarettes. Technical issues complicate the debate; for example, the effects ofsecondhand smoke are uncertain. An argument against raising cigarette taxes istheir regressivity: Such taxes take up a larger percentage of the earnings of low-income families than of middle- and upper-income families. Similarly, providingadditional information about the caloric content of restaurant meals could beexpensive, and it is not clear how much that information would change people’sbehavior or whether the benefits of those changes would exceed the costs of pro-ducing them.
More broadly, information about the benefits of eating right, exercising, and notsmoking is widely available, and bringing about changes in people’s behavior rep-resents a substantial challenge. The growing field of behavioral economics isbeginning to examine how the combination of information, incentives, and regula-
30. See Brian Wansink, Mindless Eating: Why We Eat More Than We Think (New York: BantamDell, 2006).
27

tions—as well as people’s inertia and biases—affects their behavior. That researchmay ultimately help inform efforts to make various policy changes to promotehealth. As the nation struggles to address the cost, quality, and access to its healthcare system, developments and policy changes outside the system itself will con-tinue to exert an important influence on Americans’ health, which in turn willaffect the system.
28