HEALTH AND WELL-BEING AT WORK€¦ · approach to employee well-being by having a standalone...
45
HEALTH AND WELL-BEING AT WORK Survey report March 2020 in partnership with
Transcript of HEALTH AND WELL-BEING AT WORK€¦ · approach to employee well-being by having a standalone...
HEALTH AND WELL-BEING AT WORK
Survey report March 2020
in partnership with
The CIPD is the professional body for HR and people development. The registered charity champions better work and working lives and has been setting the benchmark for excellence in people and organisation development for more than 100 years. It has more than 150,000 members across the world, provides thought leadership through independent research on the world of work, and offers professional training and accreditation for those working in HR and learning and development.

1
Health and Well-being at Work
Report
Health and Well-being at Work
Contents Foreword from the CIPD 2
Foreword from Simplyhealth 3
Summary of key findings 5
What do the findings mean for people professionals? 7
How do employers manage employee health and well-being? 10
The role of occupational health 16
Level of employee absence 19
Causes of sickness absence 21
Managing absence and attendance 23
Work-related stress and mental health 25
‘Presenteeism’ and ‘leaveism’ are widespread 32
The impact of technology on employee well-being 34
Background to the survey 37
Notes/additional reading 39
Appendix 1: Well-being benefits on offer, by sector 40
Appendix 2: Average level of employee absence, by sector and industry 42
2
Health and Well-being at Work
AcknowledgementsThe CIPD is very grateful to those organisations and individuals who gave their time to support this research. In particular we would like to thank Annette Sinclair, research consultant, for analysing the findings, and Nick Pahl, CEO Society of Occupational Medicine, for expert input on occupational health issues. A big thank you to our sponsor Simplyhealth for their support and commitment throughout the project. This report was written by Annette Sinclair and Rachel Suff, Senior Policy Adviser for Employment Relations, CIPD.
1 Foreword from the CIPDOver the past decade or more, responsibility for employee health has shifted towards voluntary action on the part of good employers. UK workplaces can play an important role in improving people’s well-being through health promotion and ill health prevention activities, through early detection of some symptoms and by encouraging lifestyle changes. A culture of well-being, driven by great people management, is good for employees and good for business. It makes the workplace a more productive, attractive and socially responsible place to work.
This is the twentieth annual CIPD survey to explore issues of health, well-being and absence in UK workplaces, and the tenth report in partnership with our sponsor Simplyhealth. This survey of over 1,000 people professionals provides valuable benchmarking data to help organisations evaluate and improve their health and well-being practices. It also aims to get under the skin of workplace policy and culture to give the profession greater insight into what’s really driving employee absence, attendance and behaviour.
Last year, we reported the lowest-ever average absence rate (5.9 days per employee per year) in the history of this survey. This year it’s even lower, albeit marginally (5.8 days). In some organisations a reduced absence rate could partly be the result of a strong framework to support people’s well-being. That would be a positive outcome. But other findings suggest that a low sickness absence level is not always the sign of a healthy workplace. For example, the vast majority of respondents (89%) have observed ‘presenteeism’ (people working when unwell) in their organisation over the last 12 months and over a quarter (27%) say it has increased. This trend alone casts a serious shadow over the authenticity of this historically low absence rate. People working when ill are not adding value to their organisation and could be exposing themselves and those around them to more serious health issues.
We also find that three-quarters (73%) of respondents have observed some form of ‘leaveism’, such as employees working when on annual leave or working outside contracted hours, over the past 12 months. We’re not surprised, therefore, that nearly two-fifths (37%) have seen an increase in stress-related absence over the last year, while three-fifths (60%) report an increase in common mental health conditions.
To look at the positive, the increase in poor mental well-being cases may partly be contributed to by greater willingness on the part of some people to talk about psychological ill health and seek support. Over the past few years our findings show that more employers are indeed taking mental health seriously and stepping up their efforts to increase awareness about it across their workforces. But the fact remains that levels of
Foreword from the CIPD
3
Health and Well-being at Work
mental distress and stress remain far too high in many workplaces, and more concerted action is needed to affect the necessary cultural change. Far too few employers think their efforts are effective, and that’s partly because they aren’t addressing the deeper organisational factors that are having an adverse impact on people’s health. For example, heavy workloads and ‘management style’ are once again the top two causes of stress at work. A huge proportion of respondents (86%) cite the inability to switch off out of work hours as the main negative impact of technology on employee well-being.
To bring about long-term change and build healthy workplaces, organisations need to look beyond top-line statistics like sickness absence and fully assess current and future health risks – including those which may be rooted in less tangible cultural expectations and working practices. This means taking a systematic approach. There are various methods and tools available to employers, but a key approach that is seriously underused is carrying out a stress risk assessment or similar audit. Conducting employee focus groups with managers and employees can help to complete the picture and build a strategic, holistic strategy to target action where it’s most needed.
An effective well-being programme needs to be specific and based on employee need, but there are some elements that are prerequisites for success in any organisation. This includes a senior team that makes a serious and visible commitment to health and well-being. It also means placing good people management at the heart of well-being, ensuring that managers build healthy relationships with their teams and have the courage and competence to support people’s well-being. We know from our research that much greater attention is needed in these areas to effect the cultural change needed to build truly healthy workplaces.
2 Foreword from SimplyhealthAn unhealthy workforce means an unhealthy businessA growing concern for employers is the state of people’s mental health, and this year’s survey findings again confirm that the main risks to people’s health at work are psychological. When we focus on employee health in the workplace, things may appear to be looking up in terms of absence rates, as they’re the lowest they have been since this survey began 20 years ago. However, this is masked by an increase in unhealthy practices like ‘presenteeism’ and ‘leaveism’, which we know can breed illness, fatigue and lower productivity. Knowing that poor mental health is the biggest cause of long-term absence at work, our aim at Simplyhealth is to nurture a culture of well-being from the inside out.
Stress remains a big problem for workforces and is one of the main causes of short- and long-term absence. Organisations need to address the underlying causes of work-related
Foreword from Simplyhealth
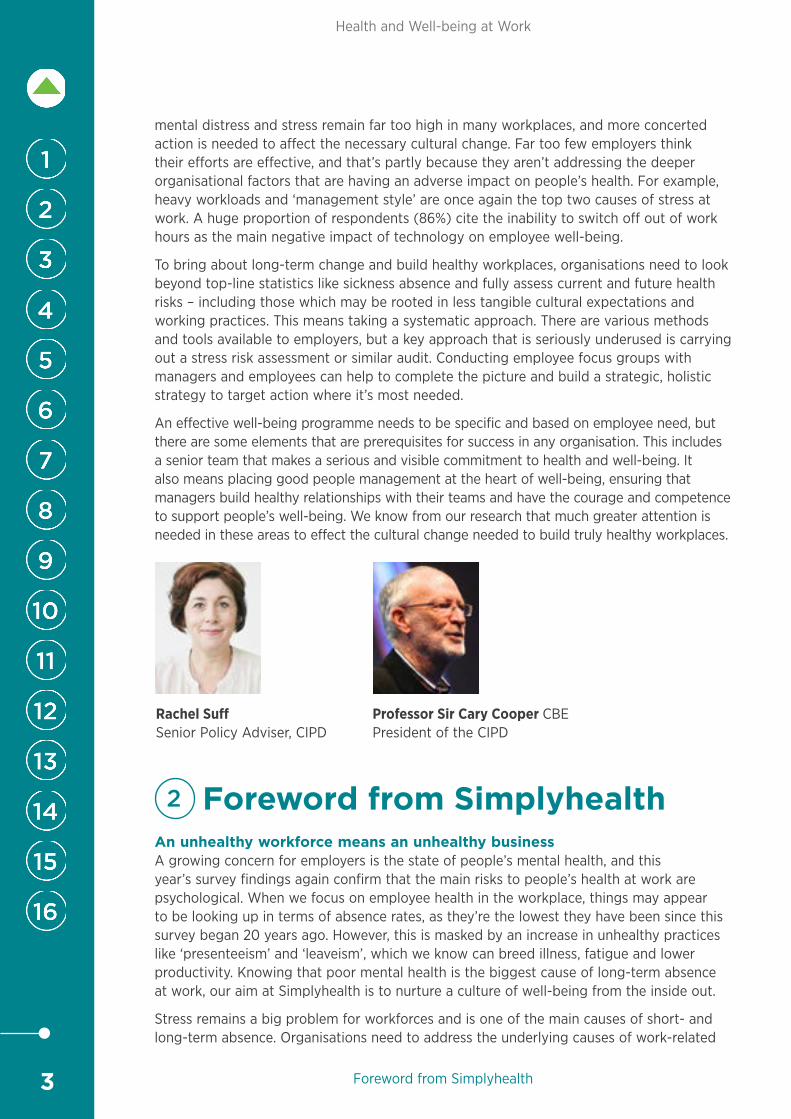
Professor Sir Cary Cooper CBE President of the CIPD
Rachel Suff Senior Policy Adviser, CIPD
4
Health and Well-being at Work
Foreword from Simplyhealth
stress to ensure a bigger problem doesn’t emerge. The two top causes of stress at work are heavy workloads and an ineffective management style. Businesses need people – they can’t succeed without a healthy, willing and able workforce.
Step up preventive health support at workGradually we are seeing more organisations taking a proactive approach to supporting their employees’ well-being. Initiatives like employee assistance programmes offer counselling and quick access to a GP around the clock, or a physiotherapist, giving employees the best chance of staying fit and well for work. Embracing a preventive model should be in every UK business’s best interest because of the positive rewards it reaps. It can help build a resilient, productive workforce.
As with many things in life, it’s about finding a happy medium. For example, using technology to our advantage, but not letting it negatively impact our health and well-being. The use of mobiles and other technological advances to make jobs more convenient, flexible and accessible is great. But when it’s allowed to steal attention during a day off or out of hours, that’s when we must learn to switch-off and call it a day. The world of business needs to re-establish technology as a tool that enables, not a device which dictates.
Training managers is keyWe seem to accept that stress and exhaustion is the new normal – we shouldn’t. Reports show that the UK workforce is working some of the longest hours in Europe, but it’s not reaping any rewards in terms of health, quality of work and productivity. Leaders and line managers need to deliver well-being strategies which ensure people feel looked after by their employers to help them engage and have the best quality of working life possible. However, it’s unfair to expect managers to support a solid well-being strategy without receiving the support they need to deliver it in the first place. Managers need training and guidance to have the confidence to deal with often difficult and personal health conversations with their team members.
Training managers on the importance of well-being can help them recognise the effect of stress on their teams. Managers must have the ability to empathise with different people and different issues and they need the tools to support this approach. Only then can they effectively help address issues with the right precision and empathy to help a well-being culture thrive.
That is why surveys like this one from the CIPD and Simplyhealth help to fill in the well-being gaps in the workplace. By addressing these gaps, I’m confident that Simplyhealth and other like-minded organisations can go a long way in helping the UK workforce access the healthcare they need – quickly, easily and affordably – and enable businesses to have an engaged, productive and healthy workforce.
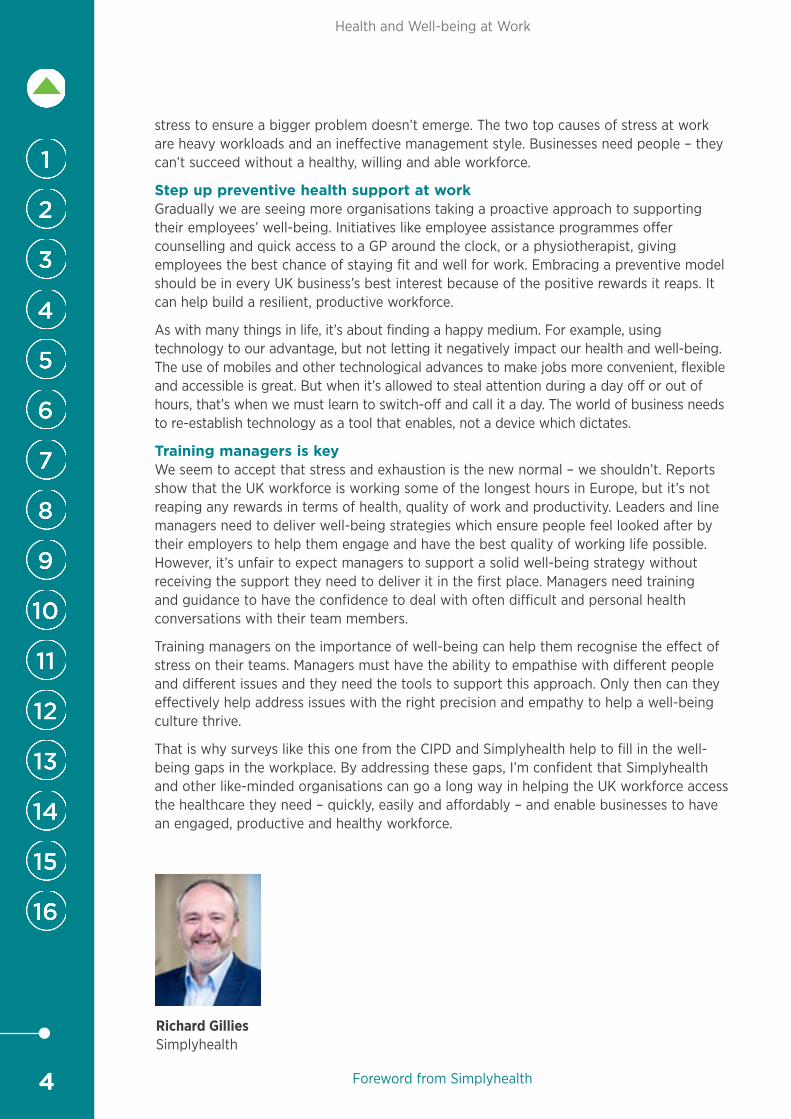
Richard Gillies Simplyhealth
5
Health and Well-being at Work
Summary of key findings
3 Summary of key findingsDo employers take a strategic approach to well-being?• It’s encouraging that this year slightly more organisations are taking a strategic
approach to employee well-being by having a standalone well-being strategy in support of their wider organisational strategy (44%, up from 40% in 2019) and fewer report they are much more reactive than proactive (41%, down from 44% in 2019).
• Disappointingly, the same proportion of respondents believe that employee well-being is on senior leaders’ agendas this year as last year (61%), but more report that line managers have bought in to the importance of well-being (58%, up from 51% in 2019).
• More organisations are trying to take a holistic approach to supporting people’s health and well-being, with mental health the most common priority, but financial well-being is still neglected as a priority area by most employers.
It’s clear that an increasing number of employers are paying serious attention to health and well-being, but more concerted action is needed to ensure their efforts pay off. To create healthy workplaces, senior leaders need to lead by example and ensure line managers have the skills and confidence to implement the right policies and signpost employees to support pathways when necessary. The organisation’s well-being framework needs to assess the main risks to people’s health and focus on prevention.
What’s the role of occupational health (OH)?• Occupational health (OH) services are included among organisations’ most common and
effective methods of managing long-term absence. • Just under three-quarters (72%) of organisations provide OH services to employees,
mostly through outsourcing arrangements that most commonly focus on assessing fitness to work (80%) and providing professional diagnosis and prognosis for those off sick (77%).
• Just under half (45%) agree/strongly agree that their organisation doesn’t make enough use of the specialist knowledge of their OH provision to promote ‘good work’.
People professionals obviously value the specialist services offered by OH professionals, but too few organisations are making the most of this valuable medical expertise. Instead of primarily viewing OH as a referral service for challenging sickness absence cases, more organisations could benefit from tapping into OH at an earlier, preventative stage to help develop their health and well-being programmes.
How do organisations manage absence?• The average rate of employee absence (5.8 days per employee) is very similar this year
to last year, when we reported the lowest-ever rate recorded in this survey. • Minor illness remains by far the most common cause of short-term absence, while
mental ill health remains the most common cause of long-term absence.• Encouragingly, most organisations use a combination of methods to manage sickness
absence and promote attendance. Return-to-work interviews and trigger mechanisms are the most common methods used to manage both short- and long-term absence.
In some organisations lower absence will indeed reflect a more effective approach to well-being, but organisations need to look much deeper than sickness absence levels to understand health risks and the factors driving people’s behaviour, attendance and well-being. More organisations need to take a proactive approach to managing absence through focusing on promoting health and well-being.
6
Health and Well-being at Work
Summary of key findings
How well do employers manage mental well-being?• Nearly two-fifths (37%) of respondents have seen an increase in stress-related absence
over the last year, while three-fifths (60%) report an increase in common mental health conditions.
• The top two causes of stress are heavy workloads and management style, the same as last year.
• More organisations are taking steps to identify and reduce stress at work, as well as to manage employee mental health. However, a third (33%) of people professionals who report that stress-related absence has increased over the past year say their organisation isn’t taking any steps to address it.
More employers are stepping up their efforts to foster mentally healthy workplaces, but there needs to be a more systematic approach to preventing and managing psychological risk. Organisations need to identify the key risks to people’s mental well-being, for example by conducting stress risk audits, and develop effective action plans to address them. Not enough organisations are equipping line managers with the knowledge and skills to support good mental health. This is why people professionals are still more likely to disagree than agree that managers have the skills and confidence required to manage mental health effectively.
How common are ‘presenteeism’ and ‘leaveism’?• The vast majority of people professionals have observed ‘presenteeism’ (working when
unwell) in their organisation over the last 12 months (89%) and over a quarter of these report it has increased.
• Nearly three-quarters (73%) of respondents have observed some form of ‘leaveism’ (such as taking annual leave to work, or working on sick leave) over the past 12 months.
• Just under a third of organisations are taking steps to address these concerning trends.
Our findings show that organisations are making little progress in identifying and tackling the unhealthy working practices of ‘presenteeism’ and ‘leaveism’, despite their prevalence in organisations. There are approaches that could help, such as providing guidance for line managers on how to identify and deal with this behaviour, identifying the underlying causes and senior managers role-modelling healthy behaviour, like using annual leave appropriately and not working when ill.
How does technology affect employee well-being?• Most respondents believe that technology has both positive and negative effects
on employee well-being. But more report the overall impact is positive (42%) than negative (30%).
• Technology most commonly benefits well-being through the facilitation of flexible working and enabling more effective communication.
• The most common negative effects include employees’ inability to switch off during out-of-work hours and the stress that results when technology fails.
There have been few changes in the reported positive or negative effects on well-being compared with 2018, when we previously surveyed people professionals on this issue. This raises questions as to whether organisations could do more to address the potentially negative effects of technology on well-being or exploit its potential benefits.
7
Health and Well-being at Work
4 What do the findings mean for people professionals?
As the obligation for addressing employee health focuses increasingly on employers, public policy drivers like the ageing workforce and poor productivity performance add weight to the business case to improve workforce well-being. It’s clear many employers have recognised their responsibility and are making significant progress in managing attendance and supporting people’s health and well-being. But our findings show that too few are reaping the full benefits of their investment. So are employers taking the right, or enough, steps to manage employee well-being? It’s essential that organisations base their approach on the fundamental building blocks of effective leadership, good people management and a supportive culture. This means taking a strategic and holistic approach to health and well-being.
However, our survey results indicate that organisations are still more likely to take a reactive rather than a proactive approach to well-being, and there’s too little focus on risk prevention. And so it’s not surprising that reported common mental health conditions and work-related stress are on the increase and that unhealthy trends like ‘presenteeism’ and ‘leaveism’ remain widespread. The term ‘employee well-being’ has often been translated by employers into one-off initiatives that aren’t necessarily part of a cohesive well-being strategy or linked to the organisation’s wider corporate goals. But health and well-being should be a continuous thread that runs through every operational decision and a cultural lens that guides everything we do and how we do it.
The people profession should guide the health and well-being agenda in organisations by ensuring that senior managers regard it as a priority and people managers are equipped to support people on a day-to-day basis. People professionals need to ensure that people practices are aligned with health and well-being priorities and that effective support pathways are in place. They should also have the strategic insight to understand the difference that good health and well-being can make to employee engagement and organisational success. As such, they can be powerful advocates of the business case for action.
Therefore, we focus on three key insights that we believe HR needs to act on as part of their organisation’s holistic health and well-being approach:
Build mentally healthy workplaces based on preventionEvery year, these survey results show that organisations put more emphasis on providing support when people become ill rather than helping to prevent poor health and well-being in the first place. This year two respondents in five (41%) say their organisation is much more reactive than proactive in their approach to employee well-being, for example. This is a gradual improvement compared with 2019 (44%) and 2018 (47%), but we want to see every organisation taking a predominantly proactive, as opposed to reactive, approach.
Of course, not all health conditions are preventable and organisations should provide a range of support when needed, such as good rehabilitation practices to aid an effective return to work. Support pathways are very important and there will undoubtedly be times when an employee needs to take time off because of a health condition. But we also need to see more organisations taking stronger preventative steps to promote good mental well-being and help employees to avoid work-related stress in particular. It’s clear we have some way to go before the majority of workplaces achieve parity of esteem in the attention that good mental health receives compared with physical health, and the confidence and openness with which this aspect of health is treated.
What do the findings mean for people professionals?
8
Health and Well-being at Work
The measures that employers take to identify and reduce stress at work need to reflect a stronger organisational framework with a sharper focus on risk prevention. For example, just half (52%) carry out risk assessments or stress audits, three in ten (30%) carry out stress management training for the whole workforce, and just one in five (20%) use the Health and Safety Executive’s Management Standards.
Early intervention is an important part of prevention. Where possible, employees experiencing stress or mental ill health should be able to access support before problems escalate. The aim should be to promote an open and inclusive culture, so that employees feel confident to disclose stress or a mental health issue and discuss any challenges they are experiencing. If there’s a supportive dialogue between the employee and their line manager, the organisation can hopefully implement preventative measures, such as adjustments to workload or a small change in working hours, that could make all the difference in some cases. Early access to specialist support is also vital.
It’s encouraging that this year we report an increase in the number of workplaces raising awareness of mental health, and more people professionals say their organisation is training line managers to manage stress (60% compared with 50% in 2019). But if we are to increase the proportion reporting that their organisation’s efforts to tackle stress are effective above the halfway mark, more employers need to adopt a much wider range of preventative steps.
Invest in managers to boost employee well-beingOn a day-to-day basis, it’s typically line managers who are at the forefront of managing the complex range of organisational factors affecting people’s well-being at work. For example, unmanageable workloads and ‘management style’ are by far the two most common causes of work-related stress (cited by 60% and 41% of respondents, respectively), both of which fall within a manager’s remit. But managers are often the ‘squeezed middle’ and under pressure from above to deliver to tight deadlines and targets. Organisations need to be aware of the operational demands placed on their managers and have effective feedback mechanisms to ascertain whether or not it’s possible to balance these demands with looking after employees’ well-being.
It’s clear that employers are increasingly placing more responsibility on managers to support people’s health and well-being, but this expectation is not always matched by adequate investment in their skills and capability. Managers should not be expected to be health experts, but they do need to recognise the value of health and well-being at work, be able to spot early warning signs of ill health, have the competence and confidence to have sensitive conversations, direct employees to appropriate sources of help, and actively promote attendance and well-being.
Our findings show that too few employers provide an effective framework to ensure that managers can play the positive role that’s needed to support well-being: for example, less than three-fifths (56%) of organisations train their line managers in absence-handling, and around the same proportion provide them with tailored support. Only half (51%) train managers to support staff with mental ill health. Therefore, it’s not surprising that less than a third (31%) agree managers are ‘confident to have sensitive discussions and signpost staff to expert sources of help if needed’ and only a quarter (25%) that they ‘are confident and competent to spot the early warning signs of mental ill health’.
Our findings also show the tangible difference it makes when managers are committed to employee well-being: for example, organisations where line managers are bought in
What do the findings mean for people professionals?
9
Health and Well-being at Work
to the importance of well-being are much more likely to be taking steps to address both ‘presenteeism’ and ‘leaveism’, and their efforts to tackle work-related stress are also more effective.
Managing people, and their health and well-being, is a big job – and an important one. Managers’ own health and well-being could be at risk if they are being charged with responsibilities they are not competent to carry out, such as dealing with complex ill health issues, preventing work-related stress, sensitively managing a return to work, and implementing effective workplace adjustments. To carry out their role effectively, managers need the behaviours, education and capability they will only gain from receiving the right training, support and expert guidance. It’s the people profession that needs to ensure this happens.
Make more of occupational health (OH)Year on year, our research shows that HR regards occupational health (OH) services as one of the most effective methods of addressing long-term health conditions and absence in their organisation. This year, we explored this area further to examine the types of OH arrangements and services provided and the role they play in promoting health and reducing sickness.
Not surprisingly, over two-thirds (68%) of respondents agree that their organisation’s OH services are primarily used for referral in case of long-term sickness absence. Far fewer report that OH is used for more strategic or preventative purposes: for example, less than three in ten (29%) agree that HR and OH work closely at a strategic level to help prevent ill health, and less than one in five (18%) agree that OH plays a key role in developing health and well-being-related policies and practices.
There could be clear benefits to involving OH in employee health issues at an earlier and more strategic stage of an organisation’s approach.
Working together with HR, OH practitioners could provide organisations with a wealth of specialist expertise that could be invaluable in developing a health and well-being strategy, as well as the policies and practices to help manage the main risks to people’s health. Our research shows there’s increasing responsibility on line managers to implement health-related policies in areas such as managing return to work, rehabilitation, making reasonable adjustments, spotting the early signs of mental ill health and having supportive conversations with employees.
Managers, and people professionals, may be reluctant to approach OH because of concerns about patient confidentiality, but it’s possible to develop approaches for HR and managers to access specialist advice from OH without compromising patient confidentiality. Conversations between managers and OH about individual employees should of course focus on the employee’s fitness to work and any workplace adjustments they may need, rather than on confidential medical information. There’s scope for managers (and HR) to benefit from OH’s medical expertise to gain more general understanding about health-related issues and how to promote ‘good work’, for example.
In recent years the CIPD has been working with the Society of Occupational Medicine (SOM) to encourage greater collaboration between the two professions at a national level.1 This experience shows there could be tangible benefits if HR takes the initiative to work more closely with OH to develop a holistic health and well-being strategy that supports line managers more effectively on a day-to-day basis.
What do the findings mean for people professionals?
10
Health and Well-being at Work
5 How do employers manage employee health and well-being?
Key findingsYear on year, our findings show employee well-being is slowly creeping up the corporate agenda, with more employers focusing on an increasing number of health-related issues in an attempt to be holistic. However, organisations vary considerably in how strategic and proactive they are, and there’s too little focus on identifying and managing the main risks to people’s health. We also need to see more organisations building an effective organisational framework based on committed leadership and good people management:
• Just over two-fifths have a well-being strategy that supports their wider organisation strategy (44%, up from 40% in 2019), but a similar proportion are much more reactive than proactive (41%, down from 44% in 2019).
• Three-fifths believe that well-being is on senior leaders’ agendas (61%, the same as in 2019).
• Just under three-fifths report that line managers are bought in to the importance of well-being (58%, up from 51% in 2019).
• Mental health remains the most common focus of well-being initiatives and we are seeing a gradual increase in the proportion of organisations including counselling services and employee assistance programmes among their well-being benefits.
• Financial well-being remains further down the agenda, but we are seeing a gradual increase in the proportion of organisations that include financial education among their well-being programmes.
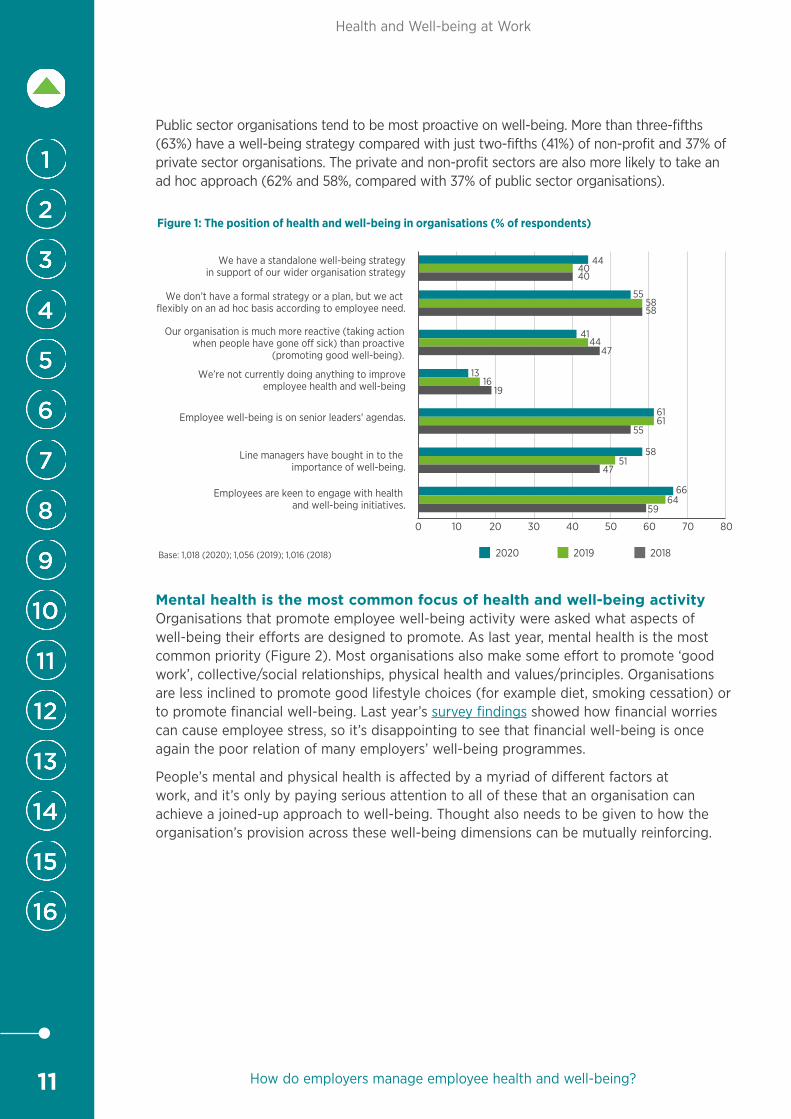
Organisations are divided in how proactive they are when it comes to employee health and well-being (see Figure 1). There are indications, however, that the issue is gradually receiving increased recognition. Slightly more organisations are taking a strategic approach by having a standalone well-being strategy, for example, and fewer report they are ‘much more reactive than proactive’.
Overall, a minority agree that their organisation isn’t currently doing anything to improve employee health and well-being. This reflects a small improvement on previous years, but every employer should be mindful of its statutory duty of care for people’s health, safety and welfare. Every organisation should prevent and manage the main risks to people’s health and have in place effective support pathways to help people if they do become unwell.
The same proportion of respondents believe that employee well-being is on senior leaders’ agendas this year as last year (61%). There’s a moderate increase this year in the proportion reporting that line managers have bought in to the importance of well-being (from 51% in 2019 to 58%), but it’s disappointing that both these figures aren’t higher. Senior leaders and line managers play distinct and crucial roles in creating a healthy workplace and the organisation’s ability to reap the benefit of its investment in this area will be undermined if either management group is not fully on board.
How do employers manage employee health and well-being?
11
Health and Well-being at Work
Public sector organisations tend to be most proactive on well-being. More than three-fifths (63%) have a well-being strategy compared with just two-fifths (41%) of non-profit and 37% of private sector organisations. The private and non-profit sectors are also more likely to take an ad hoc approach (62% and 58%, compared with 37% of public sector organisations).
70 802010 4030 6050
We have a standalone well-being strategyin support of our wider organisation strategy
Our organisation is much more reactive (taking action when people have gone o� sick) than proactive
(promoting good well-being).
We’re not currently doing anything to improve employee health and well-being
Employee well-being is on senior leaders’ agendas.
We don’t have a formal strategy or a plan, but we act flexibly on an ad hoc basis according to employee need.
Line managers have bought in to the importance of well-being.
Employees are keen to engage with health and well-being initiatives.
2020 2019 2018Base: 1,018 (2020); 1,056 (2019); 1,016 (2018)
0
444040
555858
41
4744
1316
19
6161
55
5851
47
6664
59
Figure 1: The position of health and well-being in organisations (% of respondents)
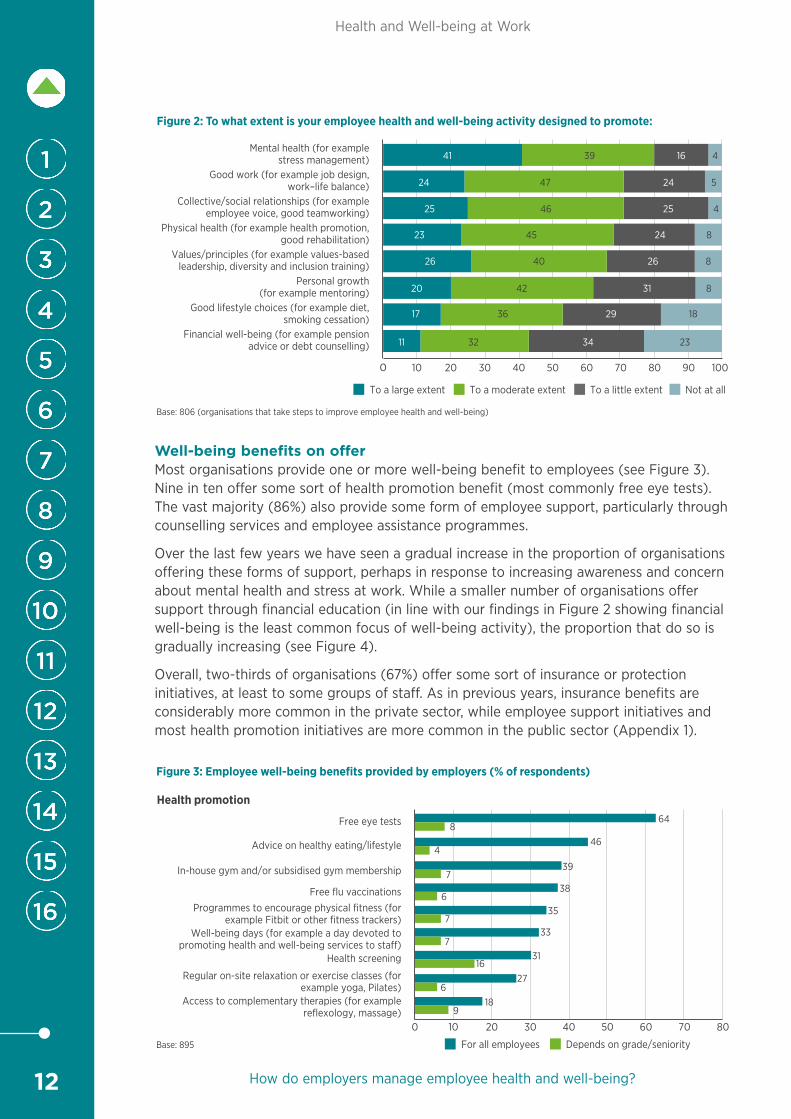
Mental health is the most common focus of health and well-being activityOrganisations that promote employee well-being activity were asked what aspects of well-being their efforts are designed to promote. As last year, mental health is the most common priority (Figure 2). Most organisations also make some effort to promote ‘good work’, collective/social relationships, physical health and values/principles. Organisations are less inclined to promote good lifestyle choices (for example diet, smoking cessation) or to promote financial well-being. Last year’s survey findings showed how financial worries can cause employee stress, so it’s disappointing to see that financial well-being is once again the poor relation of many employers’ well-being programmes.
People’s mental and physical health is affected by a myriad of different factors at work, and it’s only by paying serious attention to all of these that an organisation can achieve a joined-up approach to well-being. Thought also needs to be given to how the organisation’s provision across these well-being dimensions can be mutually reinforcing.
How do employers manage employee health and well-being?
12
Health and Well-being at Work
9080 1002010 4030 706050
Mental health (for example stress management)
Good work (for example job design, work–life balance)
Collective/social relationships (for example employee voice, good teamworking)
Physical health (for example health promotion, good rehabilitation)
Values/principles (for example values-based leadership, diversity and inclusion training)
Personal growth (for example mentoring)
Good lifestyle choices (for example diet, smoking cessation)
Financial well-being (for example pension advice or debt counselling)
To a large extent To a moderate extent To a little extent Not at all
Base: 806 (organisations that take steps to improve employee health and well-being)
0
Figure 2: To what extent is your employee health and well-being activity designed to promote:
41 39 16 4
5244724
25 46 25 4
8244523
26 40 26 8
20 42 31 8
18293617
11 32 34 23
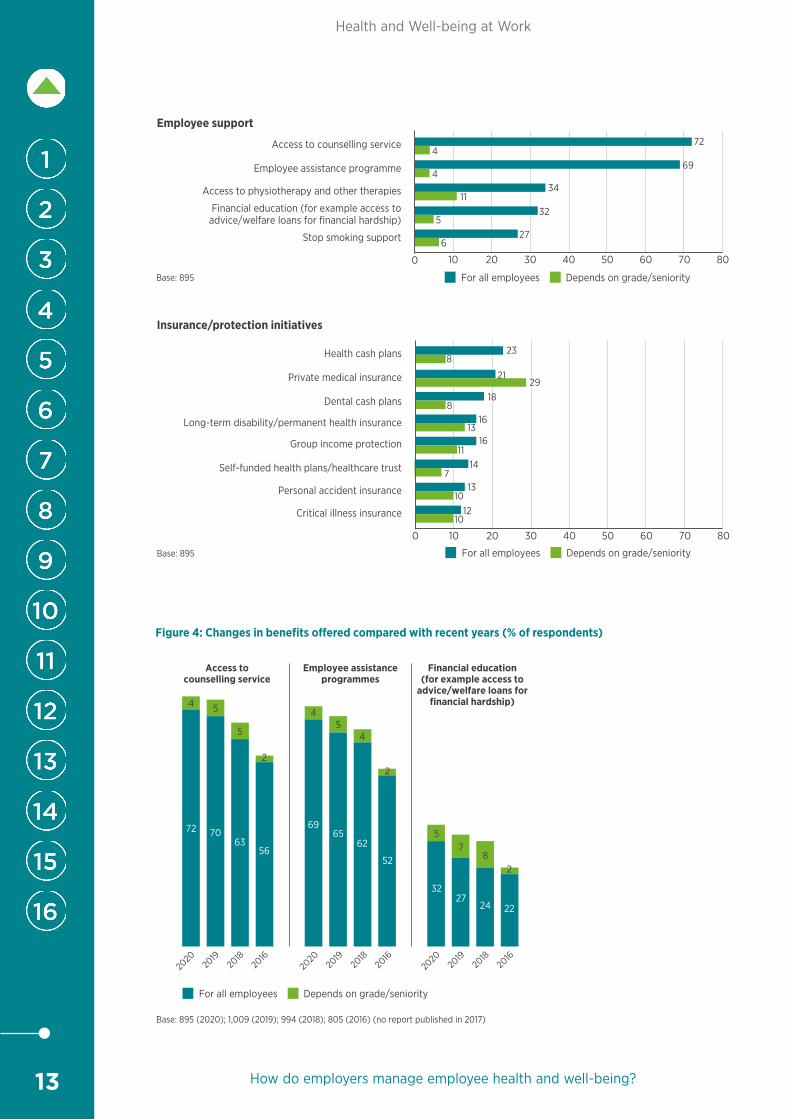
Well-being benefits on offerMost organisations provide one or more well-being benefit to employees (see Figure 3). Nine in ten offer some sort of health promotion benefit (most commonly free eye tests). The vast majority (86%) also provide some form of employee support, particularly through counselling services and employee assistance programmes.
Over the last few years we have seen a gradual increase in the proportion of organisations offering these forms of support, perhaps in response to increasing awareness and concern about mental health and stress at work. While a smaller number of organisations offer support through financial education (in line with our findings in Figure 2 showing financial well-being is the least common focus of well-being activity), the proportion that do so is gradually increasing (see Figure 4).
Overall, two-thirds of organisations (67%) offer some sort of insurance or protection initiatives, at least to some groups of staff. As in previous years, insurance benefits are considerably more common in the private sector, while employee support initiatives and most health promotion initiatives are more common in the public sector (Appendix 1).
70 802010 4030 6050
70 802010 4030 6050
70 802010 4030 6050
Free eye tests
Advice on healthy eating/lifestyle
In-house gym and/or subsidised gym membership
Free flu vaccinationsProgrammes to encourage physical fitness (for
example Fitbit or other fitness trackers)Well-being days (for example a day devoted to
promoting health and well-being services to sta�)Health screening
Regular on-site relaxation or exercise classes (for example yoga, Pilates)
Access to complementary therapies (for example reflexology, massage)
For all employees Depends on grade/seniorityBase: 895
Health cash plans
Private medical insurance
Dental cash plans
Long-term disability/permanent health insurance
Group income protection
Self-funded health plans/healthcare trust
Personal accident insurance
Critical illness insurance
For all employees Depends on grade/seniorityBase: 895
Access to counselling service
Employee assistance programme
Access to physiotherapy and other therapies
Financial education (for example access to advice/welfare loans for financial hardship)
Stop smoking support
For all employees Depends on grade/seniorityBase: 895
Insurance/protection initiatives
0
648
464
38
35
7
7
39
7
6
33
1631
276
189
238
18
16
29
13
21
11
8
16
714
13
1210
10
4
4
72
69
3411
325
276
Figure 3: Employee well-being benefits provided by employers (% of respondents)
Employee support
Health promotion
0
0
How do employers manage employee health and well-being?
13
Health and Well-being at Work
70 802010 4030 6050
70 802010 4030 6050
70 802010 4030 6050
Free eye tests
Advice on healthy eating/lifestyle
In-house gym and/or subsidised gym membership
Free flu vaccinationsProgrammes to encourage physical fitness (for
example Fitbit or other fitness trackers)Well-being days (for example a day devoted to
promoting health and well-being services to sta�)Health screening
Regular on-site relaxation or exercise classes (for example yoga, Pilates)
Access to complementary therapies (for example reflexology, massage)
For all employees Depends on grade/seniorityBase: 895
Health cash plans
Private medical insurance
Dental cash plans
Long-term disability/permanent health insurance
Group income protection
Self-funded health plans/healthcare trust
Personal accident insurance
Critical illness insurance
For all employees Depends on grade/seniorityBase: 895
Access to counselling service
Employee assistance programme
Access to physiotherapy and other therapies
Financial education (for example access to advice/welfare loans for financial hardship)
Stop smoking support
For all employees Depends on grade/seniorityBase: 895
Insurance/protection initiatives
0
648
464
38
35
7
7
39
7
6
33
1631
276
189
238
18
16
29
13
21
11
8
16
714
13
1210
10
4
4
72
69
3411
325
276
Figure 3: Employee well-being benefits provided by employers (% of respondents)
Employee support
Health promotion
0
0
Access tocounselling service
Employee assistanceprogrammes
Financial education(for example access to
advice/welfare loans forfinancial hardship)
Base: 895 (2020); 1,009 (2019); 994 (2018); 805 (2016) (no report published in 2017)
For all employees Depends on grade/seniority
2020
2019
2018
2016
2020
2019
2018
2016
2020
2019
2018
2016
4 5
70
5
63
2
56
4
69
5
65
4
62
2
52
5
32
7
27
8
24
2
22
72
Figure 4: Changes in benefits o�ered compared with recent years (% of respondents)
How do employers manage employee health and well-being?
14
Health and Well-being at Work
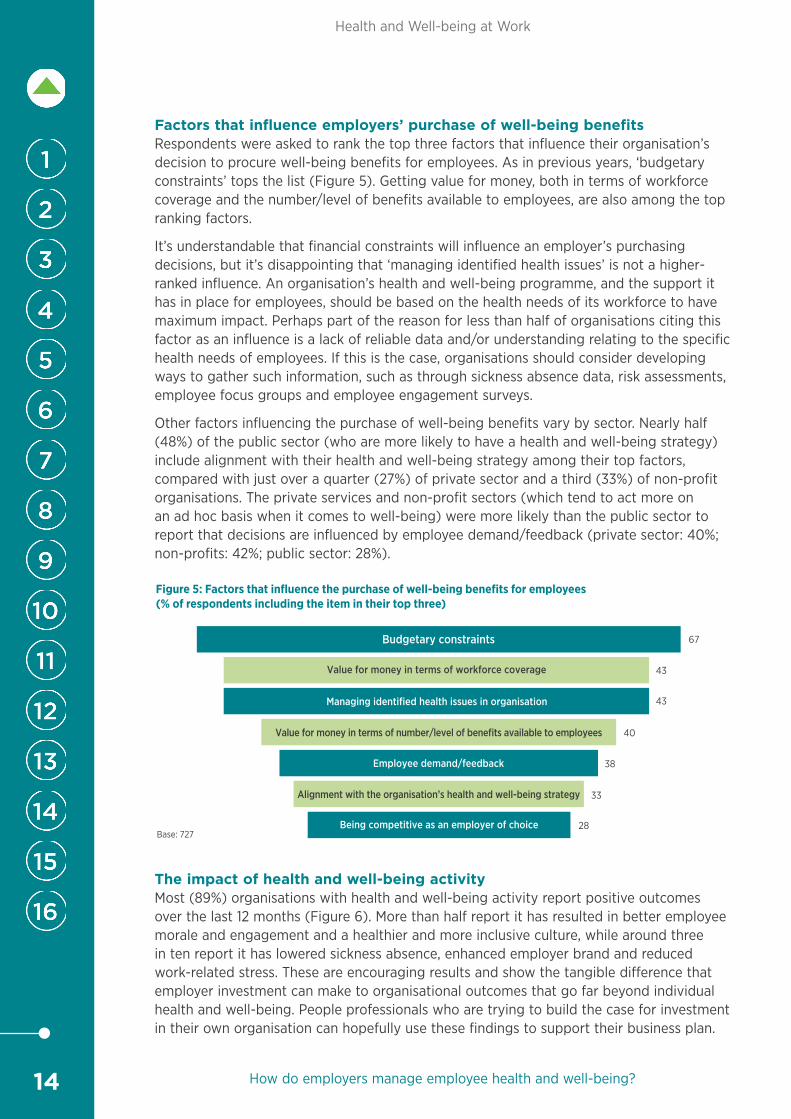
Factors that influence employers’ purchase of well-being benefits Respondents were asked to rank the top three factors that influence their organisation’s decision to procure well-being benefits for employees. As in previous years, ‘budgetary constraints’ tops the list (Figure 5). Getting value for money, both in terms of workforce coverage and the number/level of benefits available to employees, are also among the top ranking factors.
It’s understandable that financial constraints will influence an employer’s purchasing decisions, but it’s disappointing that ‘managing identified health issues’ is not a higher-ranked influence. An organisation’s health and well-being programme, and the support it has in place for employees, should be based on the health needs of its workforce to have maximum impact. Perhaps part of the reason for less than half of organisations citing this factor as an influence is a lack of reliable data and/or understanding relating to the specific health needs of employees. If this is the case, organisations should consider developing ways to gather such information, such as through sickness absence data, risk assessments, employee focus groups and employee engagement surveys.
Other factors influencing the purchase of well-being benefits vary by sector. Nearly half (48%) of the public sector (who are more likely to have a health and well-being strategy) include alignment with their health and well-being strategy among their top factors, compared with just over a quarter (27%) of private sector and a third (33%) of non-profit organisations. The private services and non-profit sectors (which tend to act more on an ad hoc basis when it comes to well-being) were more likely than the public sector to report that decisions are influenced by employee demand/feedback (private sector: 40%; non-profits: 42%; public sector: 28%).
Base: 727
Figure 5: Factors that influence the purchase of well-being benefits for employees (% of respondents including the item in their top three)
67Budgetary constraints
43Value for money in terms of workforce coverage
43Managing identified health issues in organisation
38Employee demand/feedback
40Value for money in terms of number/level of benefits available to employees
33Alignment with the organisation’s health and well-being strategy
28Being competitive as an employer of choice
The impact of health and well-being activityMost (89%) organisations with health and well-being activity report positive outcomes over the last 12 months (Figure 6). More than half report it has resulted in better employee morale and engagement and a healthier and more inclusive culture, while around three in ten report it has lowered sickness absence, enhanced employer brand and reduced work-related stress. These are encouraging results and show the tangible difference that employer investment can make to organisational outcomes that go far beyond individual health and well-being. People professionals who are trying to build the case for investment in their own organisation can hopefully use these findings to support their business plan.
How do employers manage employee health and well-being?

15
Health and Well-being at Work
Of the 11% who did not report any benefits from their health and well-being activity, 3% reported it was too early to tell, 7% that their activity had not been beneficial, and the remainder reported it was hard to tell, some because their activity was not measured or evaluated.
‘Whatever initiatives we take have at best a moderate impact on staff well-being, given that the income we receive does not enable us to pay staff at a level which supports them to make optimal lifestyle choices. The work is hard, and as a consequence stress is high.’
Respondent from a not-for-profit organisation with 900 employees
Better employee morale and engagement
A healthier and more inclusive culture
Lower sickness absence
Enhanced employer brand
Reduced work-related stress
Better sta� retention
Improved productivity
Better customer service
No achievements
Positive e�ects
52
32
31
2924
22
15
11
56
Base: 802
Figure 6: What has your organisation’s employee health and well-being activity achieved in the past 12 months? (% of respondents whose organisations make some e�ort to improve employee health and well-being)
How do employers manage employee health and well-being?
16
Health and Well-being at Work
The role of occupational health
6 The role of occupational health
Key findingsOur previous surveys have shown that occupational health (OH) services are included among organisations’ most common and effective methods of addressing long-term health conditions and absence. This year we explored this area further to examine the types of occupational health arrangements and services provided and the role they play in promoting employee health and reducing sickness absence. Our findings show there’s scope for HR to make more of the valuable medical expertise of OH professionals, for example by working in partnership to develop an effective health and well-being strategy and developing guidance for managers:
• Just under three-quarters of organisations provide occupational health (OH) services to employees, mostly through outsourcing arrangements.
• The services provided most commonly focus on assessing fitness to work regarding ill health capability (80%) and providing professional diagnosis and prognosis for those off sick (77%).
• Fewer organisations use OH services and expertise in a more proactive way to prevent and remove health risks, promote good work or develop health and well-being-related policies and practices.
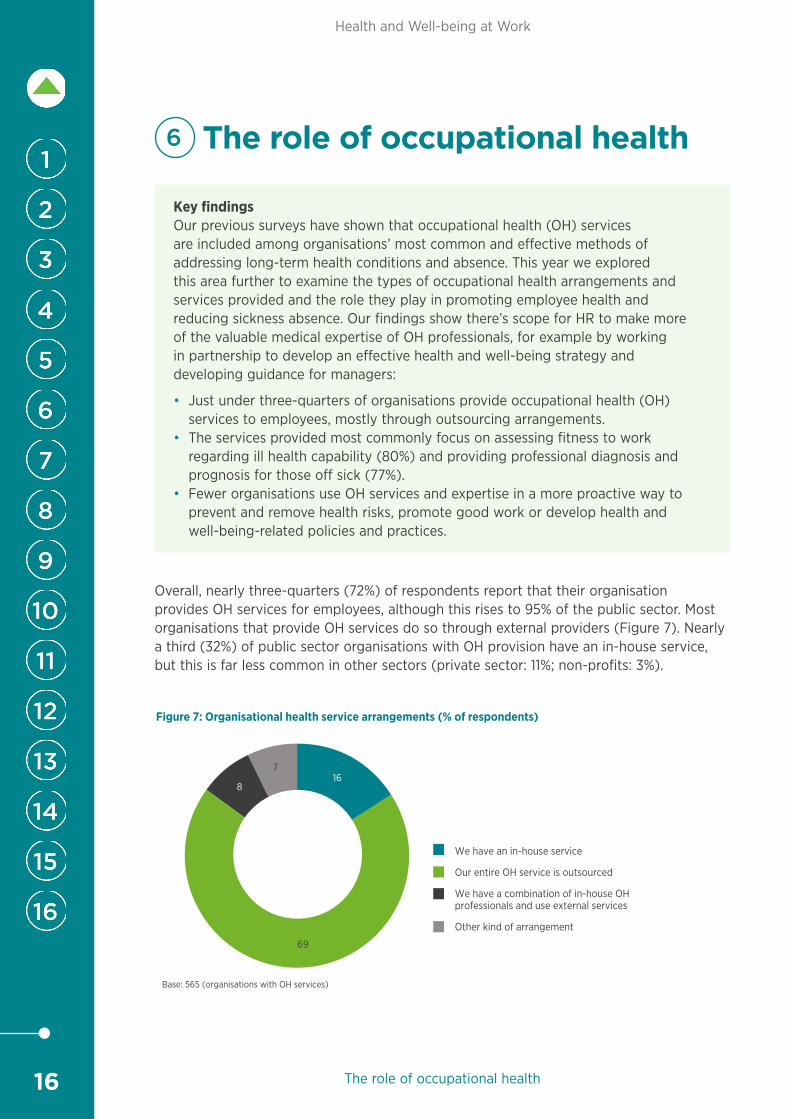
Overall, nearly three-quarters (72%) of respondents report that their organisation provides OH services for employees, although this rises to 95% of the public sector. Most organisations that provide OH services do so through external providers (Figure 7). Nearly a third (32%) of public sector organisations with OH provision have an in-house service, but this is far less common in other sectors (private sector: 11%; non-profits: 3%).
Base: 565 (organisations with OH services)
We have an in-house service
Our entire OH service is outsourced
We have a combination of in-house OH professionals and use external services
Other kind of arrangement
Figure 7: Organisational health service arrangements (% of respondents)
16
69
8
7
17
Health and Well-being at Work
The role of occupational health
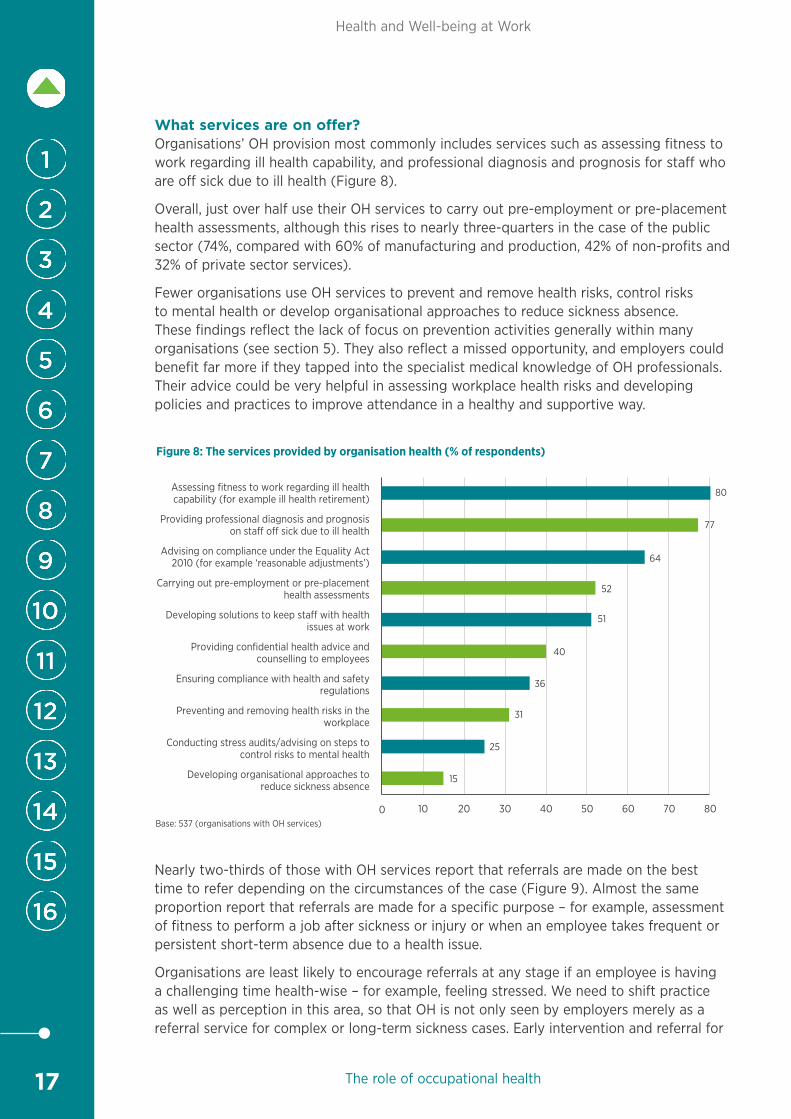
What services are on offer?Organisations’ OH provision most commonly includes services such as assessing fitness to work regarding ill health capability, and professional diagnosis and prognosis for staff who are off sick due to ill health (Figure 8).
Overall, just over half use their OH services to carry out pre-employment or pre-placement health assessments, although this rises to nearly three-quarters in the case of the public sector (74%, compared with 60% of manufacturing and production, 42% of non-profits and 32% of private sector services).
Fewer organisations use OH services to prevent and remove health risks, control risks to mental health or develop organisational approaches to reduce sickness absence. These findings reflect the lack of focus on prevention activities generally within many organisations (see section 5). They also reflect a missed opportunity, and employers could benefit far more if they tapped into the specialist medical knowledge of OH professionals. Their advice could be very helpful in assessing workplace health risks and developing policies and practices to improve attendance in a healthy and supportive way.
70 802010 4030 6050
Assessing fitness to work regarding ill health capability (for example ill health retirement)
Providing professional diagnosis and prognosis on sta o sick due to ill health
Advising on compliance under the Equality Act 2010 (for example ‘reasonable adjustments’)
Carrying out pre-employment or pre-placement health assessments
Developing solutions to keep sta with health issues at work
Providing confidential health advice and counselling to employees
Ensuring compliance with health and safety regulations
Preventing and removing health risks in the workplace
Conducting stress audits/advising on steps to control risks to mental health
Developing organisational approaches to reduce sickness absence
Base: 537 (organisations with OH services)0
80
77
64
52
51
40
36
31
25
15
Figure 8: The services provided by organisation health (% of respondents)
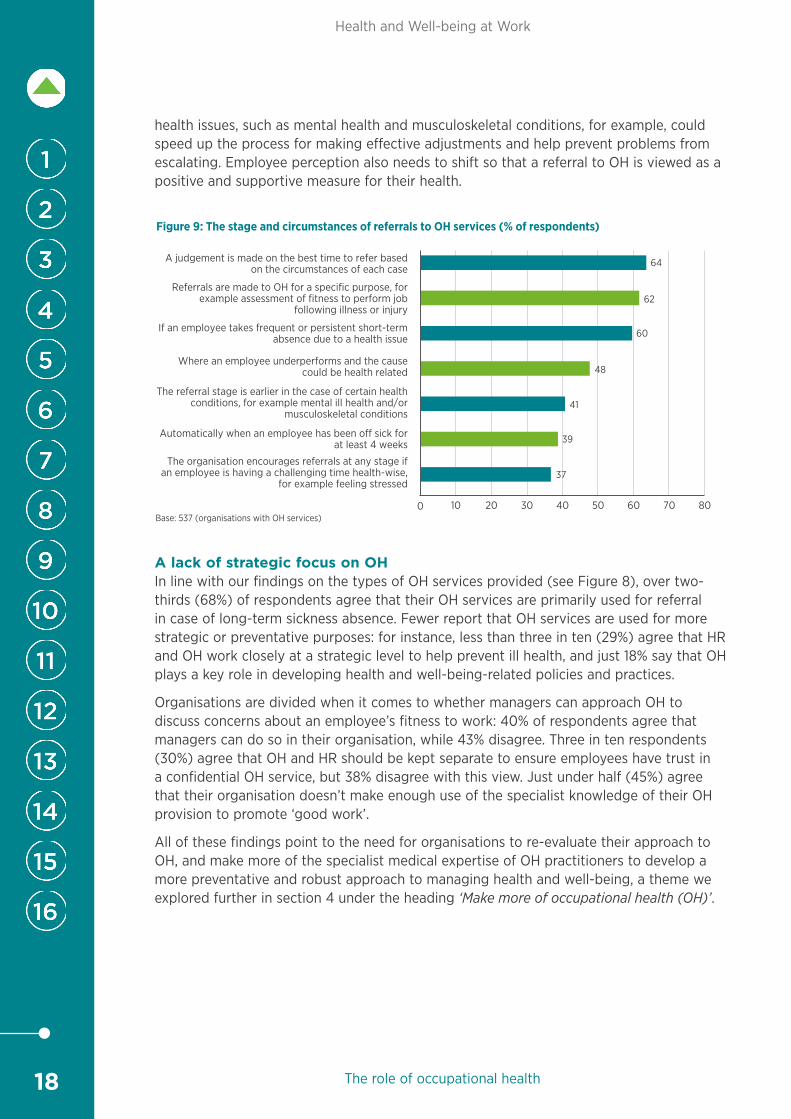
Nearly two-thirds of those with OH services report that referrals are made on the best time to refer depending on the circumstances of the case (Figure 9). Almost the same proportion report that referrals are made for a specific purpose – for example, assessment of fitness to perform a job after sickness or injury or when an employee takes frequent or persistent short-term absence due to a health issue.
Organisations are least likely to encourage referrals at any stage if an employee is having a challenging time health-wise – for example, feeling stressed. We need to shift practice as well as perception in this area, so that OH is not only seen by employers merely as a referral service for complex or long-term sickness cases. Early intervention and referral for
18
Health and Well-being at Work
The role of occupational health
health issues, such as mental health and musculoskeletal conditions, for example, could speed up the process for making effective adjustments and help prevent problems from escalating. Employee perception also needs to shift so that a referral to OH is viewed as a positive and supportive measure for their health.
70 802010 4030 6050
A judgement is made on the best time to refer based on the circumstances of each case
Referrals are made to OH for a specific purpose, for example assessment of fitness to perform job
following illness or injury
If an employee takes frequent or persistent short-term absence due to a health issue
Where an employee underperforms and the cause could be health related
The referral stage is earlier in the case of certain health conditions, for example mental ill health and/or
musculoskeletal conditions
Automatically when an employee has been o� sick for at least 4 weeks
The organisation encourages referrals at any stage if an employee is having a challenging time health-wise,
for example feeling stressed
Base: 537 (organisations with OH services)0
62
64
60
48
41
39
37
Figure 9: The stage and circumstances of referrals to OH services (% of respondents)
A lack of strategic focus on OHIn line with our findings on the types of OH services provided (see Figure 8), over two-thirds (68%) of respondents agree that their OH services are primarily used for referral in case of long-term sickness absence. Fewer report that OH services are used for more strategic or preventative purposes: for instance, less than three in ten (29%) agree that HR and OH work closely at a strategic level to help prevent ill health, and just 18% say that OH plays a key role in developing health and well-being-related policies and practices.
Organisations are divided when it comes to whether managers can approach OH to discuss concerns about an employee’s fitness to work: 40% of respondents agree that managers can do so in their organisation, while 43% disagree. Three in ten respondents (30%) agree that OH and HR should be kept separate to ensure employees have trust in a confidential OH service, but 38% disagree with this view. Just under half (45%) agree that their organisation doesn’t make enough use of the specialist knowledge of their OH provision to promote ‘good work’.
All of these findings point to the need for organisations to re-evaluate their approach to OH, and make more of the specialist medical expertise of OH practitioners to develop a more preventative and robust approach to managing health and well-being, a theme we explored further in section 4 under the heading ‘Make more of occupational health (OH)’.
19
Health and Well-being at Work
Level of employee absence
7 Level of employee absence
Key findingsThis year we reported the lowest-ever average sickness absence rate in the 20-year history of this survey, which could be interpreted as a positive finding if employers are building healthier workplaces to support employee well-being. This is not necessarily the case in every organisation, however, and people professionals need to look at a much wider range of measures beyond sickness absence to assess employee health, including levels of stress and mental ill health:
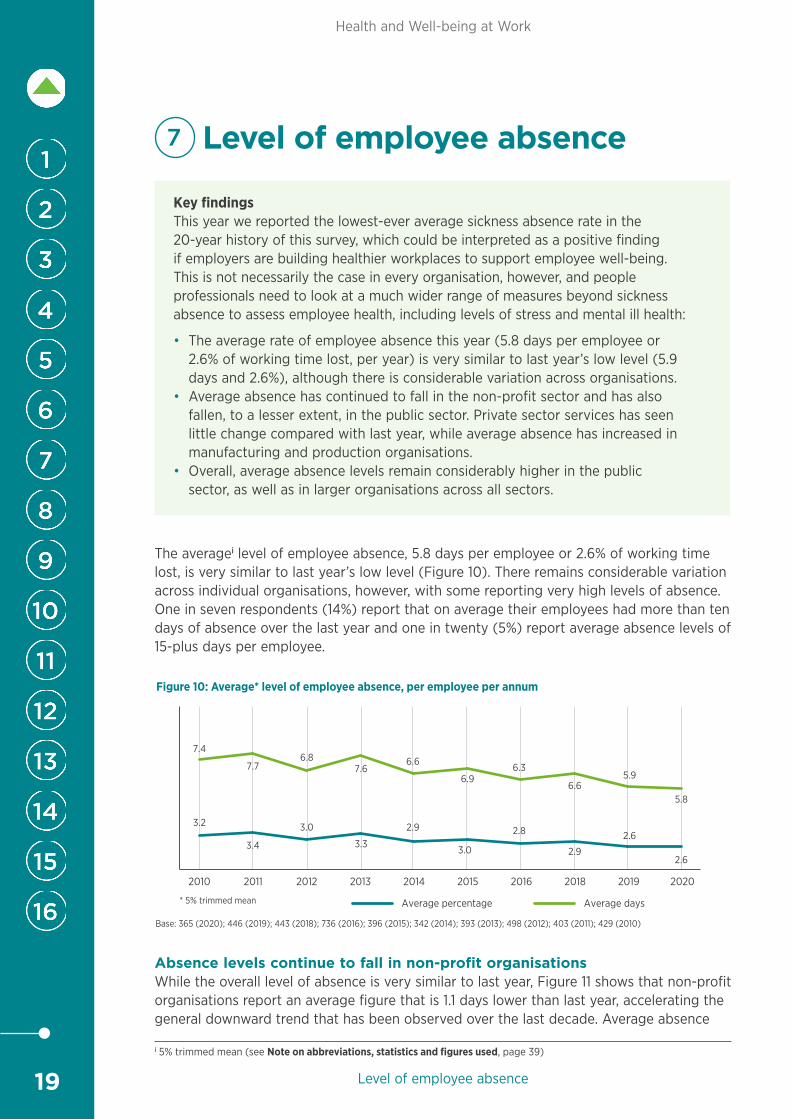
• The average rate of employee absence this year (5.8 days per employee or 2.6% of working time lost, per year) is very similar to last year’s low level (5.9 days and 2.6%), although there is considerable variation across organisations.
• Average absence has continued to fall in the non-profit sector and has also fallen, to a lesser extent, in the public sector. Private sector services has seen little change compared with last year, while average absence has increased in manufacturing and production organisations.
• Overall, average absence levels remain considerably higher in the public sector, as well as in larger organisations across all sectors.
The averagei level of employee absence, 5.8 days per employee or 2.6% of working time lost, is very similar to last year’s low level (Figure 10). There remains considerable variation across individual organisations, however, with some reporting very high levels of absence. One in seven respondents (14%) report that on average their employees had more than ten days of absence over the last year and one in twenty (5%) report average absence levels of 15-plus days per employee.
2018 2019 2020201620112010 20132012 20152014
* 5% trimmed mean
Base: 365 (2020); 446 (2019); 443 (2018); 736 (2016); 396 (2015); 342 (2014); 393 (2013); 498 (2012); 403 (2011); 429 (2010)
Average percentage Average days
Figure 10: Average* level of employee absence, per employee per annum
3.2
3.4
3.0
3.3
2.9
3.0
2.8
2.9
2.6
2.6
7.4
7.76.8
7.66.6
6.96.3
6.65.9
5.8
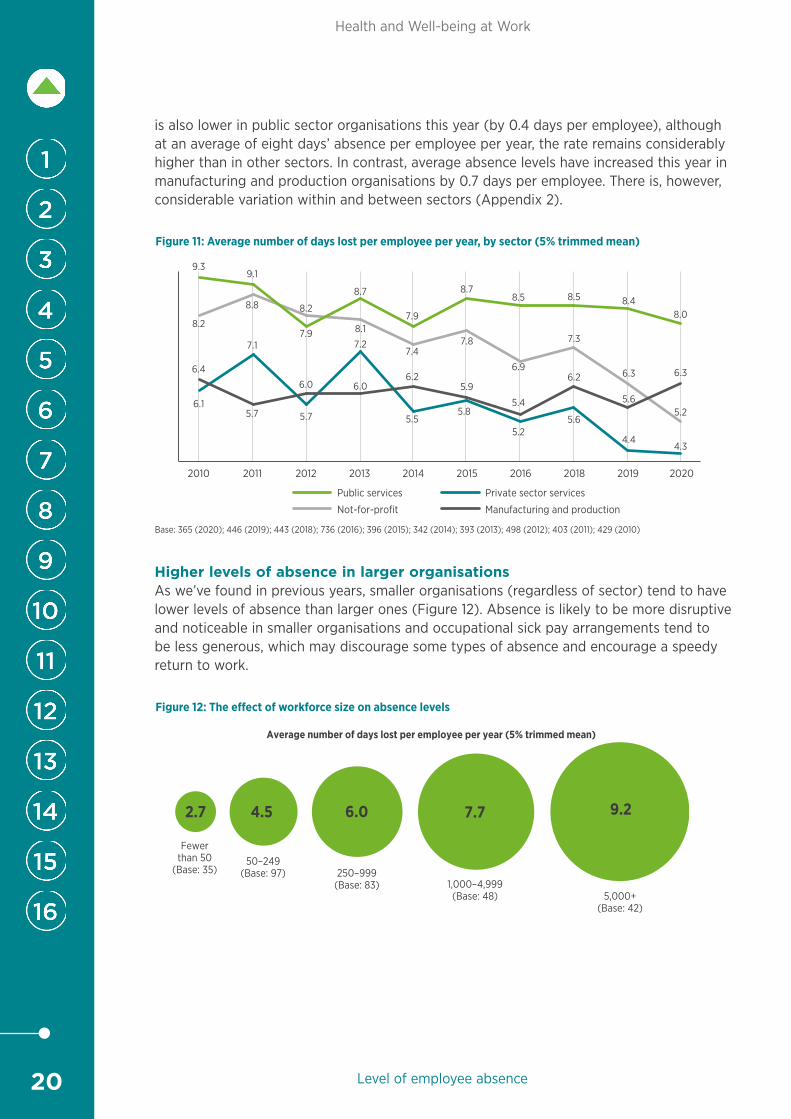
Absence levels continue to fall in non-profit organisationsWhile the overall level of absence is very similar to last year, Figure 11 shows that non-profit organisations report an average figure that is 1.1 days lower than last year, accelerating the general downward trend that has been observed over the last decade. Average absence
i 5% trimmed mean (see Note on abbreviations, statistics and figures used, page 39)
20
Health and Well-being at Work
is also lower in public sector organisations this year (by 0.4 days per employee), although at an average of eight days’ absence per employee per year, the rate remains considerably higher than in other sectors. In contrast, average absence levels have increased this year in manufacturing and production organisations by 0.7 days per employee. There is, however, considerable variation within and between sectors (Appendix 2).
2018 2019 2020201620112010 20132012 20152014
Base: 365 (2020); 446 (2019); 443 (2018); 736 (2016); 396 (2015); 342 (2014); 393 (2013); 498 (2012); 403 (2011); 429 (2010)
Manufacturing and productionNot-for-profit
Private sector servicesPublic services
Figure 11: Average number of days lost per employee per year, by sector (5% trimmed mean)
6.1
7.1
8.8
5.7
7.2
8.1
5.55.8
5.25.6
4.44.3
9.3
6.4
8.2
9.1
5.7
7.9
8.2
6.0
8.7
6.0
7.9
6.2
7.4
8.7
5.9
7.8
8.5
5.4
6.9
8.5
6.2
7.3
8.4
5.6
6.3
8.0
6.3
5.2
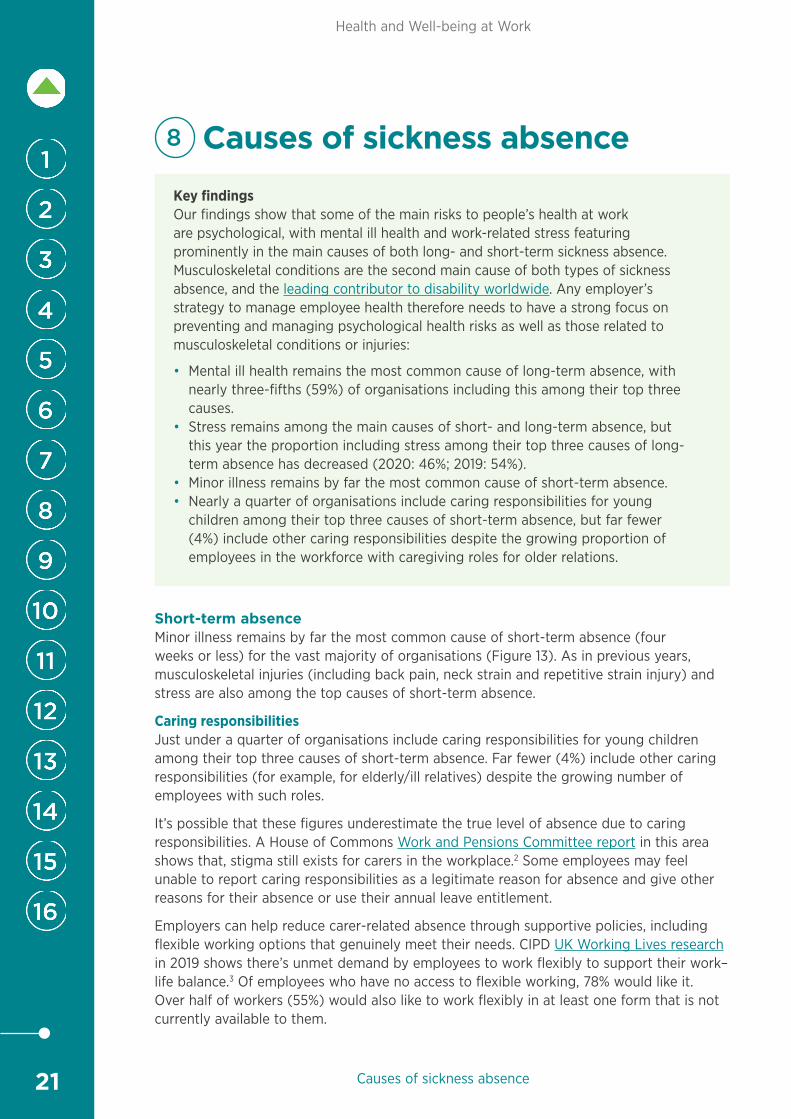
Higher levels of absence in larger organisationsAs we’ve found in previous years, smaller organisations (regardless of sector) tend to have lower levels of absence than larger ones (Figure 12). Absence is likely to be more disruptive and noticeable in smaller organisations and occupational sick pay arrangements tend to be less generous, which may discourage some types of absence and encourage a speedy return to work.
Fewerthan 50
(Base: 35)50–249
(Base: 97) 250–999 (Base: 83)
Average number of days lost per employee per year (5% trimmed mean)
1,000–4,999 (Base: 48) 5,000+
(Base: 42)
Figure 12: The e�ect of workforce size on absence levels
2.7 4.5 6.0 7.7 9.2
Level of employee absence
21
Health and Well-being at Work
Causes of sickness absence
8 Causes of sickness absence Key findingsOur findings show that some of the main risks to people’s health at work are psychological, with mental ill health and work-related stress featuring prominently in the main causes of both long- and short-term sickness absence. Musculoskeletal conditions are the second main cause of both types of sickness absence, and the leading contributor to disability worldwide. Any employer’s strategy to manage employee health therefore needs to have a strong focus on preventing and managing psychological health risks as well as those related to musculoskeletal conditions or injuries:
• Mental ill health remains the most common cause of long-term absence, with nearly three-fifths (59%) of organisations including this among their top three causes.
• Stress remains among the main causes of short- and long-term absence, but this year the proportion including stress among their top three causes of long-term absence has decreased (2020: 46%; 2019: 54%).
• Minor illness remains by far the most common cause of short-term absence.• Nearly a quarter of organisations include caring responsibilities for young
children among their top three causes of short-term absence, but far fewer (4%) include other caring responsibilities despite the growing proportion of employees in the workforce with caregiving roles for older relations.
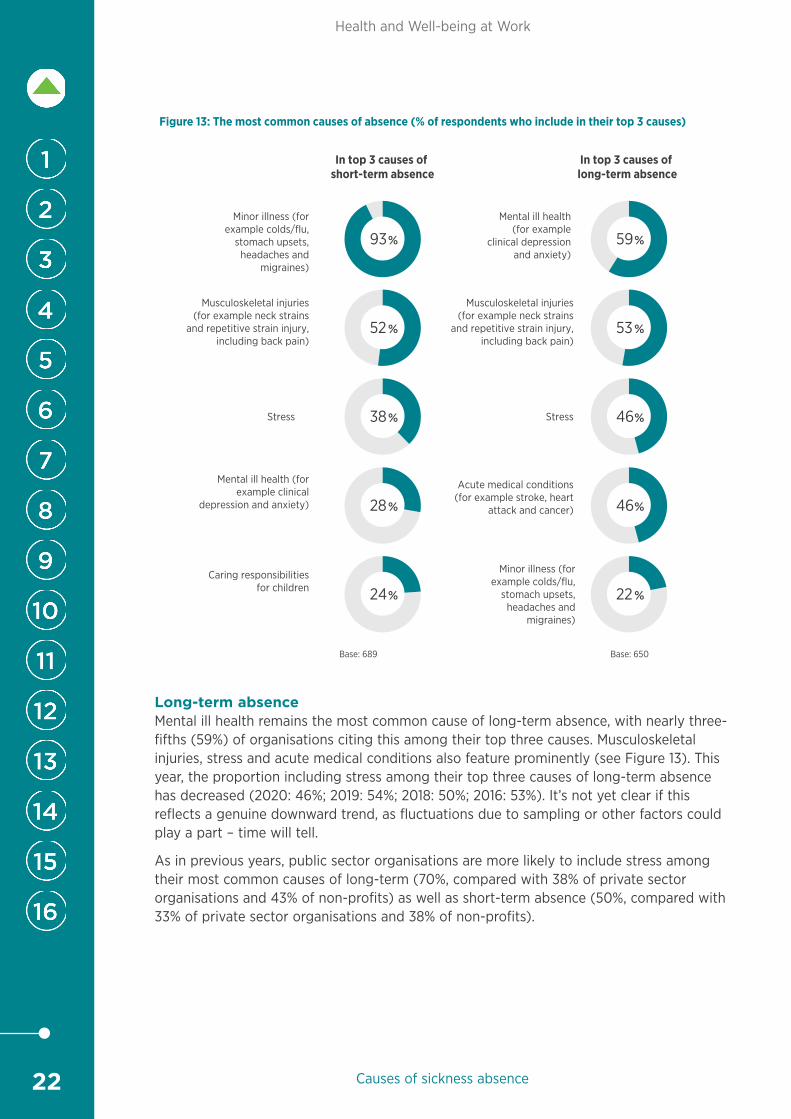
Short-term absenceMinor illness remains by far the most common cause of short-term absence (four weeks or less) for the vast majority of organisations (Figure 13). As in previous years, musculoskeletal injuries (including back pain, neck strain and repetitive strain injury) and stress are also among the top causes of short-term absence.
Caring responsibilities Just under a quarter of organisations include caring responsibilities for young children among their top three causes of short-term absence. Far fewer (4%) include other caring responsibilities (for example, for elderly/ill relatives) despite the growing number of employees with such roles.
It’s possible that these figures underestimate the true level of absence due to caring responsibilities. A House of Commons Work and Pensions Committee report in this area shows that, stigma still exists for carers in the workplace.2 Some employees may feel unable to report caring responsibilities as a legitimate reason for absence and give other reasons for their absence or use their annual leave entitlement.
Employers can help reduce carer-related absence through supportive policies, including flexible working options that genuinely meet their needs. CIPD UK Working Lives research in 2019 shows there’s unmet demand by employees to work flexibly to support their work–life balance.3 Of employees who have no access to flexible working, 78% would like it. Over half of workers (55%) would also like to work flexibly in at least one form that is not currently available to them.
22
Health and Well-being at Work
Causes of sickness absence
Figure 13: The most common causes of absence (% of respondents who include in their top 3 causes)
Base: 689 Base: 650
15
In top 3 causes of short-term absence
In top 3 causes of long-term absence
Minor illness (for example colds/flu,
stomach upsets, headaches and
migraines)
Minor illness (for example colds/flu,
stomach upsets, headaches and
migraines)
Mental ill health (for example
clinical depression and anxiety)
Musculoskeletal injuries (for example neck strains
and repetitive strain injury, including back pain)
Musculoskeletal injuries (for example neck strains
and repetitive strain injury, including back pain)
Acute medical conditions (for example stroke, heart
attack and cancer)
Mental ill health (for example clinical
depression and anxiety)
Caring responsibilities for children
Stress Stress
93% 59%
52% 53%
38% 46%
28% 46%
24% 22%
Long-term absenceMental ill health remains the most common cause of long-term absence, with nearly three-fifths (59%) of organisations citing this among their top three causes. Musculoskeletal injuries, stress and acute medical conditions also feature prominently (see Figure 13). This year, the proportion including stress among their top three causes of long-term absence has decreased (2020: 46%; 2019: 54%; 2018: 50%; 2016: 53%). It’s not yet clear if this reflects a genuine downward trend, as fluctuations due to sampling or other factors could play a part – time will tell.
As in previous years, public sector organisations are more likely to include stress among their most common causes of long-term (70%, compared with 38% of private sector organisations and 43% of non-profits) as well as short-term absence (50%, compared with 33% of private sector organisations and 38% of non-profits).
23
Health and Well-being at Work
Managing absence and attendance
9 Managing absence and attendance
Key findingsMost organisations use a combination of methods to manage sickness absence and promote attendance, which is good. Our findings reveal little change in the most common methods used year on year. This includes a stubborn gap between the expectation that’s placed on managers to manage attendance on a day-to-day basis and the investment employers make in ensuring they’re trained and supported in their role. Managing absence effectively requires a wide range of skills, including how to implement people management policies, how to be consistent and yet flexible in the case of long-term health conditions and disability, how to have sensitive conversations about health issues, and how to discuss and make effective adjustments for people:
• Less than three-fifths of organisations train their line managers in handling short-term absence and around the same proportion provide them with tailored support.
• Return-to-work interviews and trigger mechanisms are the most common methods used to manage both short- and long-term absence.
• Just under half of organisations take a proactive approach to managing absence through focusing on promoting health and well-being, although this is an increase on previous years.
Most organisations (86%) take some steps to manage absence and promote attendance. Overall, the most common methods used to manage absence are similar to previous years, with many organisations using a combination of methods to deter absence as well as support employees. Public sector organisations (which have the highest levels of absence) are particularly likely to use a range of approaches to absence management (although private sector organisations are more likely to use private medical insurance and just as likely to restrict sick pay).
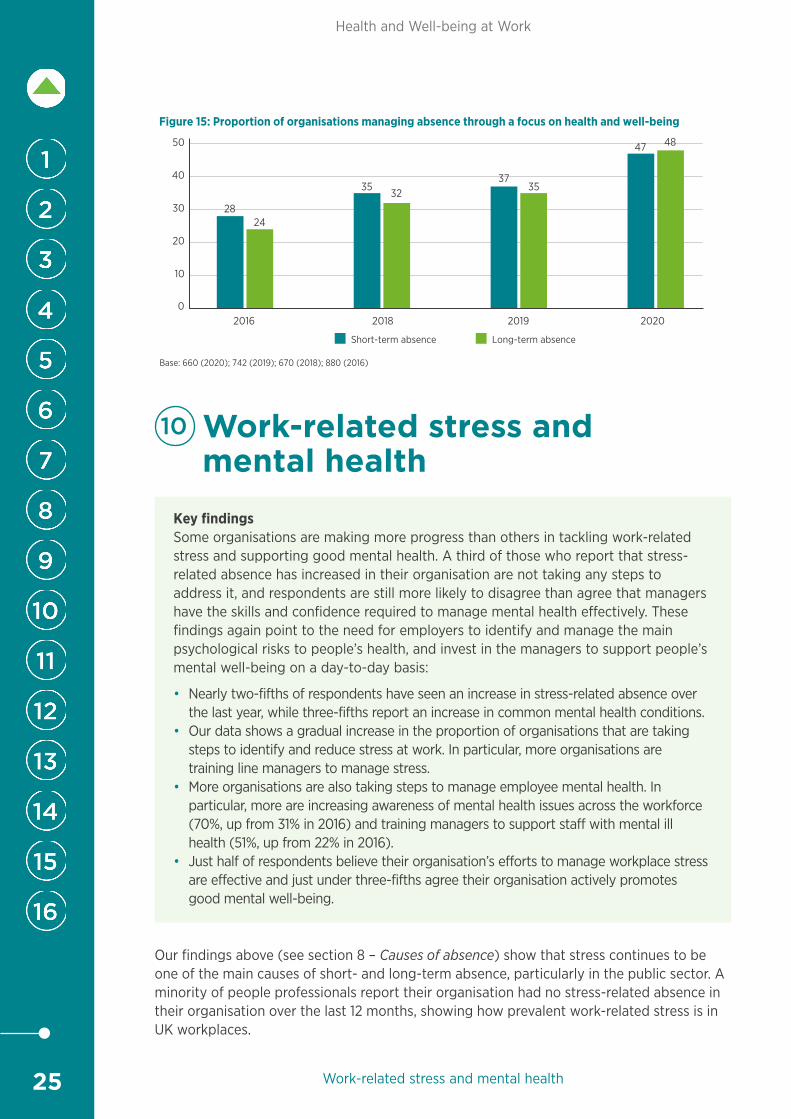
Efforts to manage absence more proactively through focusing on health and well-being (for example, health promotion) are less common, although it’s encouraging that our findings year on year suggest that the proportion of organisations doing so is increasing (Figure 15).
Encouraging effective return-to-work interviewsAs in previous years, the most common method used (for both short- and long-term absence) is return-to-work interviews (see Figure 14). These can help deter non-genuine absence by sending a clear message that absence is actively managed, but they are also an important opportunity to ensure the employee is fit to return to work, and whether or not any adjustments and/or ongoing support are required.
The effectiveness of return-to-work interviews depends on the skills and attitude of the manager who conducts them. As in previous years, less than three-fifths of organisations train their line managers in absence-handling, and even fewer provide them with tailored support (for short-term absence). More positive findings for well-being this year (Figure 1) suggest that more organisations have line managers who have bought in to the importance of well-being, but this proportion could be higher still if more organisations made a serious investment in line manager training. Effective training that highlights the importance of well-being and includes how to conduct return-to-work interviews consistently and sensitively can help promote healthy working practices, encourage genuine absence reporting, support employees, and improve employee engagement.

24
Health and Well-being at Work
Managing absence and attendance
Figure 14: Top ten most commonly used approaches for managing short- and long-term absence
Base: 660
Short-term absence Long-term absence
75% 79%
73% 68%
73% 68%
67% 66%
63% 63%
61 % 60%
58% 60%
56% 60%
54% 59%
52% 56%
Return-to-work interviews
Line managers takeprimary responsibilityfor managing absence
(for example receive and acton absence information)
Providing leave forfamily circumstances
(for example carer/emergency/dependant/
bereavement leave)
Changes to workingpatterns or environment
(for example flexible working)
Trigger mechanismsto review attendance
Managers are trainedin absence-handling
Tailored support for linemanagers (for example
case conference with HR)
Disciplinary and/orcapability procedures for
unacceptable absence
Employee assistanceprogramme
Case management approach(for example involvingHR/OH/line manager)
Return-to-work interviews
Changes to working patterns or environment (for example flexible working)
Providing leave for family circumstances (for example carer/emergency/ dependant/bereavement leave)
Case management approach (for example involving HR/OH/line manager)
Trigger mechanismsto review attendance
Occupational health involvement
Employee assistance programme
Disciplinary and/orcapability procedures forunacceptable absence
Tailored support for line managers (for example case conference with HR)
Risk assessment to aid return to work
25
Health and Well-being at Work
Work-related stress and mental health
40
20
10
30
50
Short-term absence Long-term absence
Base: 660 (2020); 742 (2019); 670 (2018); 880 (2016)
Figure 15: Proportion of organisations managing absence through a focus on health and well-being
02016 2018 2019 2020
2824
3532
3735
4847
10 Work-related stress and mental health
Key findingsSome organisations are making more progress than others in tackling work-related stress and supporting good mental health. A third of those who report that stress-related absence has increased in their organisation are not taking any steps to address it, and respondents are still more likely to disagree than agree that managers have the skills and confidence required to manage mental health effectively. These findings again point to the need for employers to identify and manage the main psychological risks to people’s health, and invest in the managers to support people’s mental well-being on a day-to-day basis:
• Nearly two-fifths of respondents have seen an increase in stress-related absence over the last year, while three-fifths report an increase in common mental health conditions.
• Our data shows a gradual increase in the proportion of organisations that are taking steps to identify and reduce stress at work. In particular, more organisations are training line managers to manage stress.
• More organisations are also taking steps to manage employee mental health. In particular, more are increasing awareness of mental health issues across the workforce (70%, up from 31% in 2016) and training managers to support staff with mental ill health (51%, up from 22% in 2016).
• Just half of respondents believe their organisation’s efforts to manage workplace stress are effective and just under three-fifths agree their organisation actively promotes good mental well-being.
Our findings above (see section 8 – Causes of absence) show that stress continues to be one of the main causes of short- and long-term absence, particularly in the public sector. A minority of people professionals report their organisation had no stress-related absence in their organisation over the last 12 months, showing how prevalent work-related stress is in UK workplaces.
26
Health and Well-being at Work
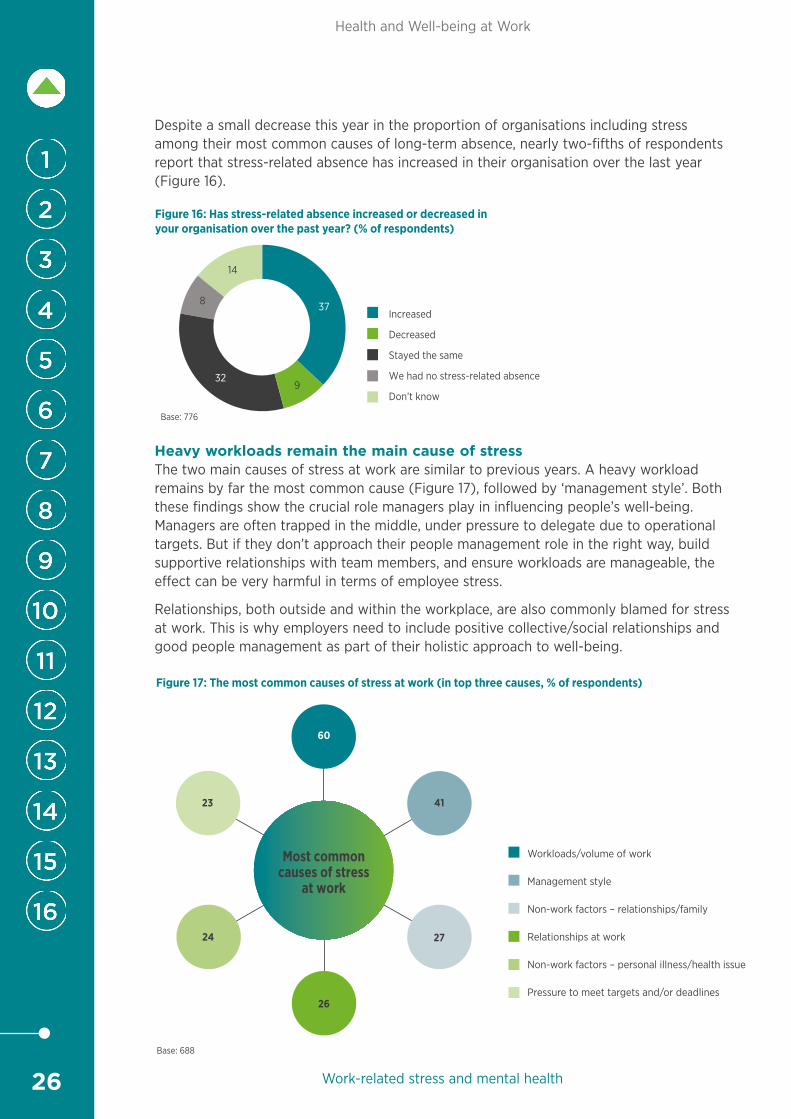
Despite a small decrease this year in the proportion of organisations including stress among their most common causes of long-term absence, nearly two-fifths of respondents report that stress-related absence has increased in their organisation over the last year (Figure 16).
Base: 776
Increased
Decreased
Stayed the same
We had no stress-related absence
Don’t know9
32
8
14
37
Figure 16: Has stress-related absence increased or decreased in your organisation over the past year? (% of respondents)
Heavy workloads remain the main cause of stressThe two main causes of stress at work are similar to previous years. A heavy workload remains by far the most common cause (Figure 17), followed by ‘management style’. Both these findings show the crucial role managers play in influencing people’s well-being. Managers are often trapped in the middle, under pressure to delegate due to operational targets. But if they don’t approach their people management role in the right way, build supportive relationships with team members, and ensure workloads are manageable, the effect can be very harmful in terms of employee stress.
Relationships, both outside and within the workplace, are also commonly blamed for stress at work. This is why employers need to include positive collective/social relationships and good people management as part of their holistic approach to well-being.
Base: 688
Figure 17: The most common causes of stress at work (in top three causes, % of respondents)
60
Most common causes of stress
at work
Workloads/volume of work
Management style
Non-work factors – relationships/family
Relationships at work
Non-work factors – personal illness/health issue
Pressure to meet targets and/or deadlines26
24
23 41
27
Work-related stress and mental health
27
Health and Well-being at Work
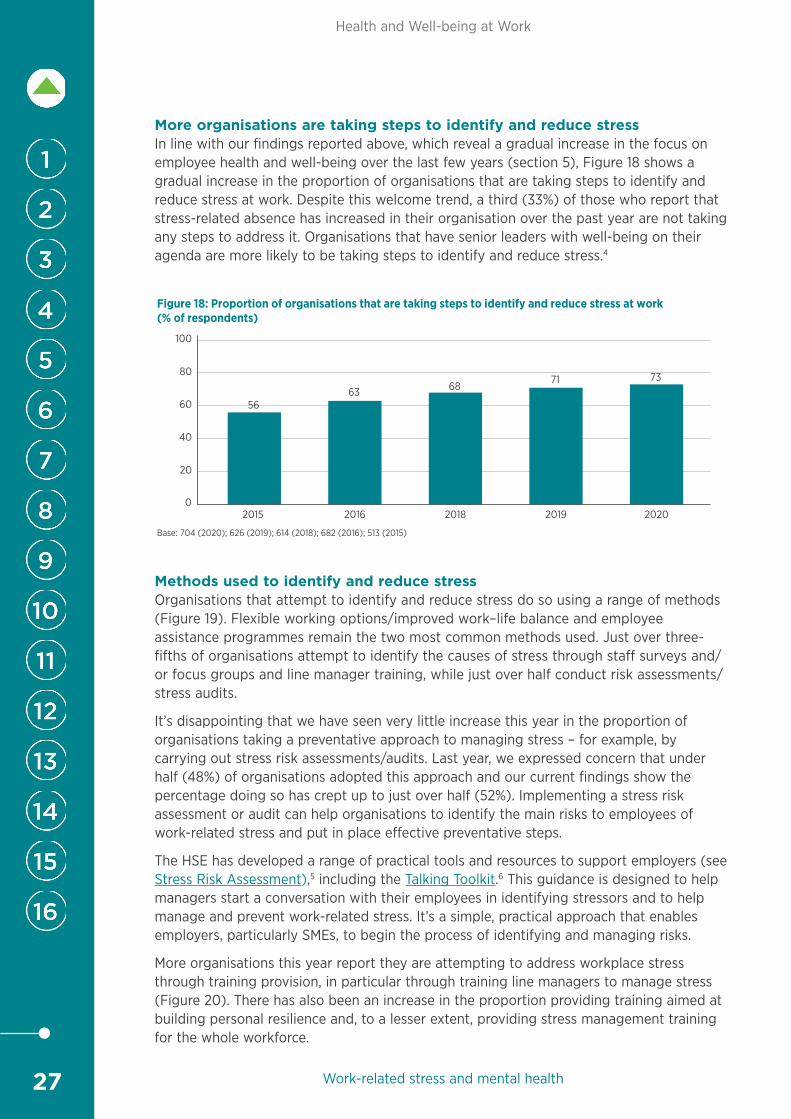
More organisations are taking steps to identify and reduce stressIn line with our findings reported above, which reveal a gradual increase in the focus on employee health and well-being over the last few years (section 5), Figure 18 shows a gradual increase in the proportion of organisations that are taking steps to identify and reduce stress at work. Despite this welcome trend, a third (33%) of those who report that stress-related absence has increased in their organisation over the past year are not taking any steps to address it. Organisations that have senior leaders with well-being on their agenda are more likely to be taking steps to identify and reduce stress.4
80
40
20
60
100
Base: 704 (2020); 626 (2019); 614 (2018); 682 (2016); 513 (2015)
Figure 18: Proportion of organisations that are taking steps to identify and reduce stress at work (% of respondents)
02015
56
2016
63
2018
68
2019
71
2020
73
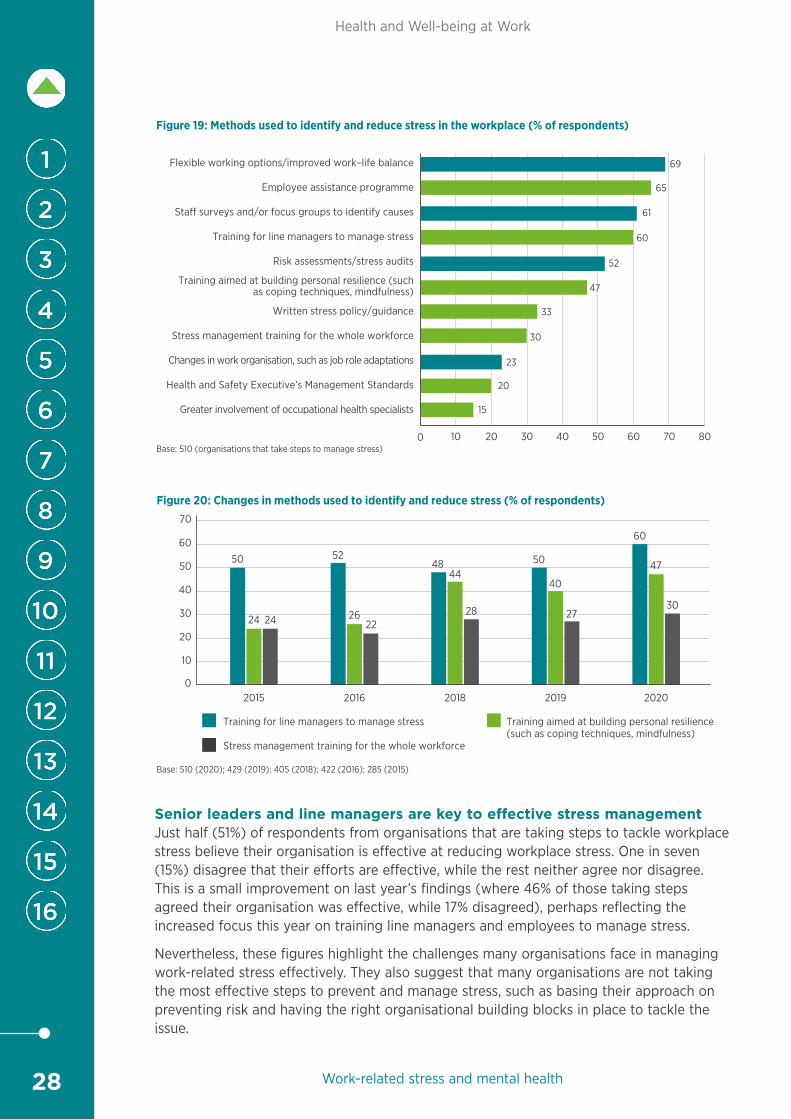
Methods used to identify and reduce stressOrganisations that attempt to identify and reduce stress do so using a range of methods (Figure 19). Flexible working options/improved work–life balance and employee assistance programmes remain the two most common methods used. Just over three-fifths of organisations attempt to identify the causes of stress through staff surveys and/or focus groups and line manager training, while just over half conduct risk assessments/stress audits.
It’s disappointing that we have seen very little increase this year in the proportion of organisations taking a preventative approach to managing stress – for example, by carrying out stress risk assessments/audits. Last year, we expressed concern that under half (48%) of organisations adopted this approach and our current findings show the percentage doing so has crept up to just over half (52%). Implementing a stress risk assessment or audit can help organisations to identify the main risks to employees of work-related stress and put in place effective preventative steps.
The HSE has developed a range of practical tools and resources to support employers (see Stress Risk Assessment),5 including the Talking Toolkit.6 This guidance is designed to help managers start a conversation with their employees in identifying stressors and to help manage and prevent work-related stress. It’s a simple, practical approach that enables employers, particularly SMEs, to begin the process of identifying and managing risks.
More organisations this year report they are attempting to address workplace stress through training provision, in particular through training line managers to manage stress (Figure 20). There has also been an increase in the proportion providing training aimed at building personal resilience and, to a lesser extent, providing stress management training for the whole workforce.
Work-related stress and mental health
28
Health and Well-being at Work
70 802010 4030 6050
Flexible working options/improved work–life balance
Employee assistance programme
Sta� surveys and/or focus groups to identify causes
Training for line managers to manage stress
Risk assessments/stress audits
Training aimed at building personal resilience (such as coping techniques, mindfulness)
Written stress policy/guidance
Stress management training for the whole workforce
Changes in work organisation, such as job role adaptations
Health and Safety Executive’s Management Standards
Greater involvement of occupational health specialists
Base: 510 (organisations that take steps to manage stress)0
69
65
61
60
52
47
33
30
15
20
23
Figure 19: Methods used to identify and reduce stress in the workplace (% of respondents)
50
60
40
20
10
30
70
Base: 510 (2020); 429 (2019); 405 (2018); 422 (2016); 285 (2015)
Figure 20: Changes in methods used to identify and reduce stress (% of respondents)
02015
Training for line managers to manage stress
Stress management training for the whole workforce
Training aimed at building personal resilience (such as coping techniques, mindfulness)
50
24 24
52
2622
4844
28
50
40
27
60
47
30
2016 2018 2019 2020
Senior leaders and line managers are key to effective stress managementJust half (51%) of respondents from organisations that are taking steps to tackle workplace stress believe their organisation is effective at reducing workplace stress. One in seven (15%) disagree that their efforts are effective, while the rest neither agree nor disagree. This is a small improvement on last year’s findings (where 46% of those taking steps agreed their organisation was effective, while 17% disagreed), perhaps reflecting the increased focus this year on training line managers and employees to manage stress.
Nevertheless, these figures highlight the challenges many organisations face in managing work-related stress effectively. They also suggest that many organisations are not taking the most effective steps to prevent and manage stress, such as basing their approach on preventing risk and having the right organisational building blocks in place to tackle the issue.
Work-related stress and mental health
29
Health and Well-being at Work
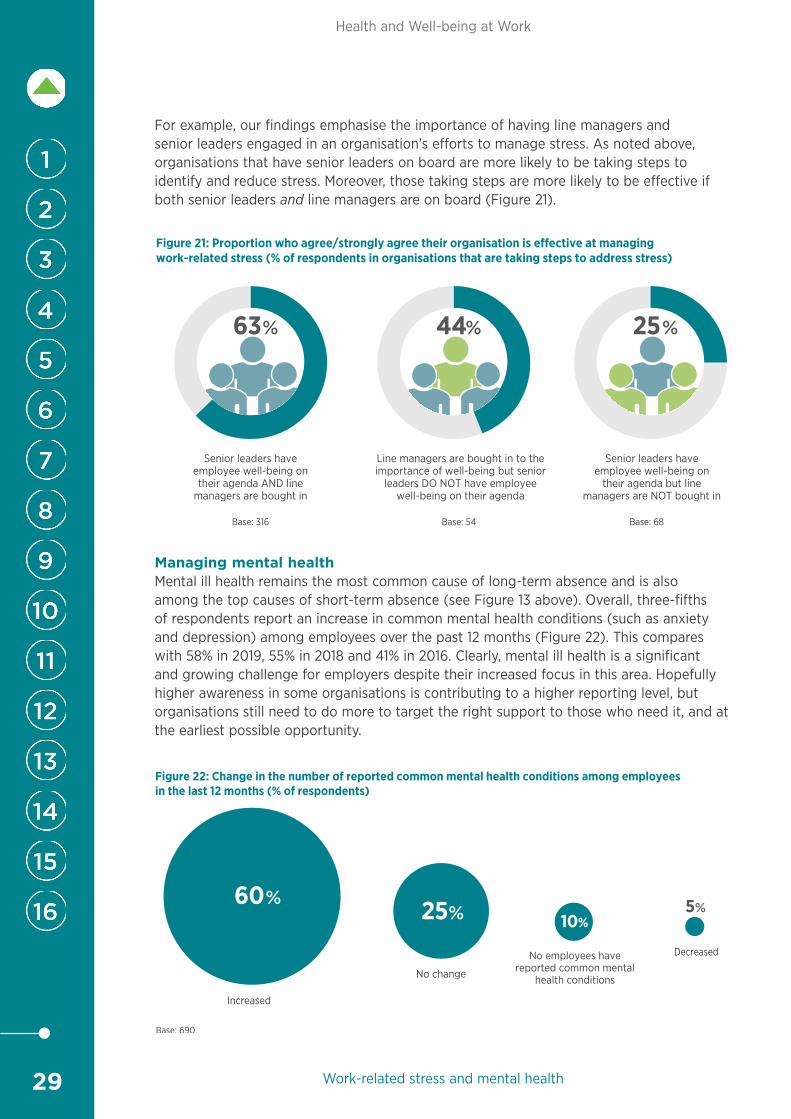
For example, our findings emphasise the importance of having line managers and senior leaders engaged in an organisation’s efforts to manage stress. As noted above, organisations that have senior leaders on board are more likely to be taking steps to identify and reduce stress. Moreover, those taking steps are more likely to be effective if both senior leaders and line managers are on board (Figure 21).
Base: 316
Figure 21: Proportion who agree/strongly agree their organisation is eective at managing work-related stress (% of respondents in organisations that are taking steps to address stress)
Senior leaders have employee well-being on their agenda AND line
managers are bought in
Base: 68
Senior leaders have employee well-being on
their agenda but line managers are NOT bought in
Base: 54
Line managers are bought in to the importance of well-being but senior
leaders DO NOT have employee well-being on their agenda
63% 25%44%
Managing mental healthMental ill health remains the most common cause of long-term absence and is also among the top causes of short-term absence (see Figure 13 above). Overall, three-fifths of respondents report an increase in common mental health conditions (such as anxiety and depression) among employees over the past 12 months (Figure 22). This compares with 58% in 2019, 55% in 2018 and 41% in 2016. Clearly, mental ill health is a significant and growing challenge for employers despite their increased focus in this area. Hopefully higher awareness in some organisations is contributing to a higher reporting level, but organisations still need to do more to target the right support to those who need it, and at the earliest possible opportunity.
Base: 690
Figure 22: Change in the number of reported common mental health conditions among employees in the last 12 months (% of respondents)
Increased
Decreased
No change
No employees have reported common mental
health conditions
5%60% 25% 10% %
Work-related stress and mental health
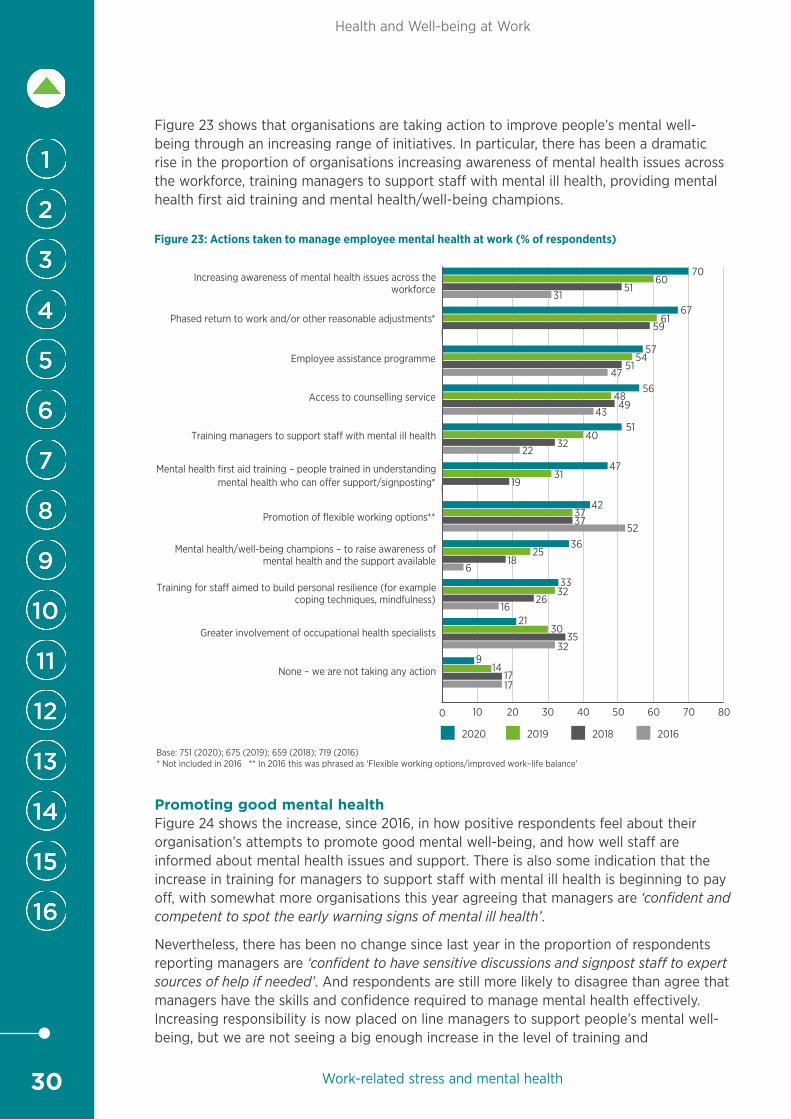
30
Health and Well-being at Work
Figure 23 shows that organisations are taking action to improve people’s mental well-being through an increasing range of initiatives. In particular, there has been a dramatic rise in the proportion of organisations increasing awareness of mental health issues across the workforce, training managers to support staff with mental ill health, providing mental health first aid training and mental health/well-being champions.
70 802010 4030 6050
Increasing awareness of mental health issues across the workforce
Phased return to work and/or other reasonable adjustments*
Employee assistance programme
Access to counselling service
Training managers to support sta� with mental ill health
Mental health first aid training – people trained in understanding mental health who can o�er support/signposting*
Promotion of flexible working options**
Mental health/well-being champions – to raise awareness of mental health and the support available
Training for sta� aimed to build personal resilience (for example coping techniques, mindfulness)
Greater involvement of occupational health specialists
None – we are not taking any action
Base: 751 (2020); 675 (2019); 659 (2018); 719 (2016)* Not included in 2016 ** In 2016 this was phrased as ‘Flexible working options/improved work–life balance’
0
Figure 23: Actions taken to manage employee mental health at work (% of respondents)
7060
5131
6761
59
5754
5147
564849
4351
4032
2247
3119
423737
5236
2518
6
3226
33
1621
3035
329
141717
2020 2019 2018 2016
Promoting good mental healthFigure 24 shows the increase, since 2016, in how positive respondents feel about their organisation’s attempts to promote good mental well-being, and how well staff are informed about mental health issues and support. There is also some indication that the increase in training for managers to support staff with mental ill health is beginning to pay off, with somewhat more organisations this year agreeing that managers are ‘confident and competent to spot the early warning signs of mental ill health’.
Nevertheless, there has been no change since last year in the proportion of respondents reporting managers are ‘confident to have sensitive discussions and signpost staff to expert sources of help if needed’. And respondents are still more likely to disagree than agree that managers have the skills and confidence required to manage mental health effectively. Increasing responsibility is now placed on line managers to support people’s mental well-being, but we are not seeing a big enough increase in the level of training and
Work-related stress and mental health
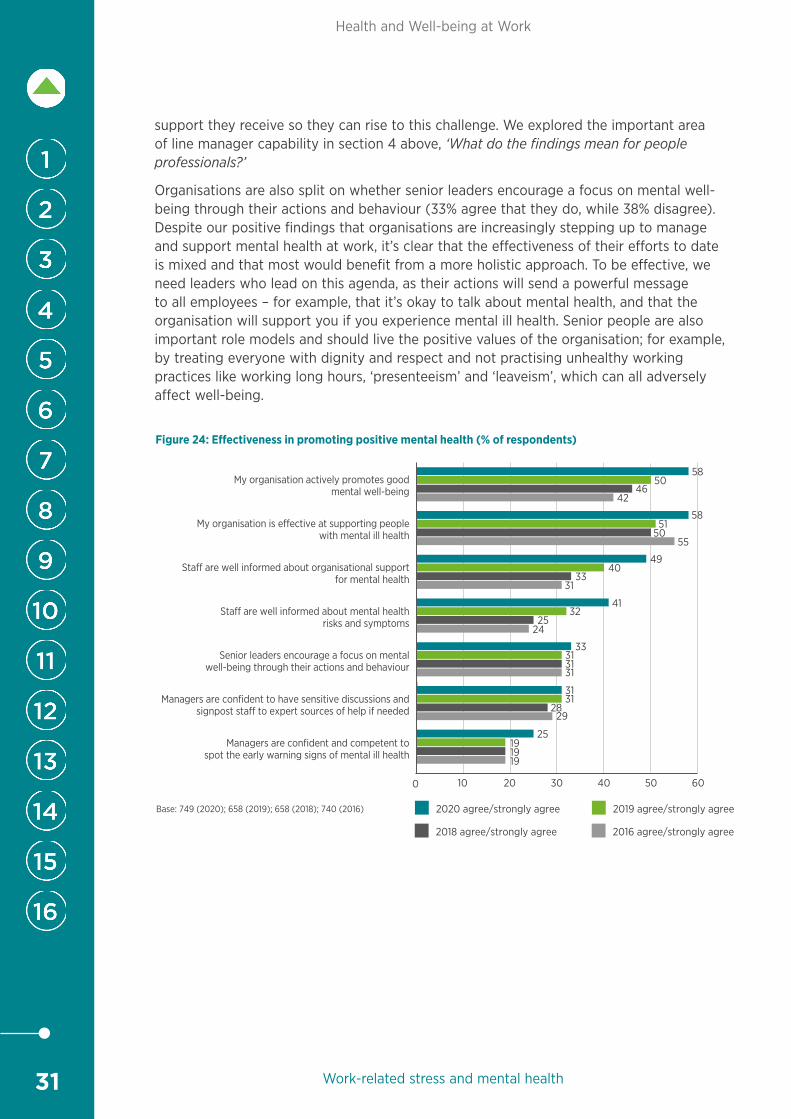
31
Health and Well-being at Work
support they receive so they can rise to this challenge. We explored the important area of line manager capability in section 4 above, ‘What do the findings mean for people professionals?’
Organisations are also split on whether senior leaders encourage a focus on mental well-being through their actions and behaviour (33% agree that they do, while 38% disagree). Despite our positive findings that organisations are increasingly stepping up to manage and support mental health at work, it’s clear that the effectiveness of their efforts to date is mixed and that most would benefit from a more holistic approach. To be effective, we need leaders who lead on this agenda, as their actions will send a powerful message to all employees – for example, that it’s okay to talk about mental health, and that the organisation will support you if you experience mental ill health. Senior people are also important role models and should live the positive values of the organisation; for example, by treating everyone with dignity and respect and not practising unhealthy working practices like working long hours, ‘presenteeism’ and ‘leaveism’, which can all adversely affect well-being.
2010 4030 6050
My organisation actively promotes good mental well-being
My organisation is e�ective at supporting people with mental ill health
Sta� are well informed about organisational support for mental health
Sta� are well informed about mental health risks and symptoms
Senior leaders encourage a focus on mental well-being through their actions and behaviour
Managers are confident to have sensitive discussions and signpost sta� to expert sources of help if needed
Managers are confident and competent tospot the early warning signs of mental ill health
Base: 749 (2020); 658 (2019); 658 (2018); 740 (2016)
0
Figure 24: E�ectiveness in promoting positive mental health (% of respondents)
58
5850
4642
5150
55
4940
3331
4132
2524
33313131
3131
2829
25191919
2020 agree/strongly agree 2019 agree/strongly agree
2018 agree/strongly agree 2016 agree/strongly agree
Work-related stress and mental health
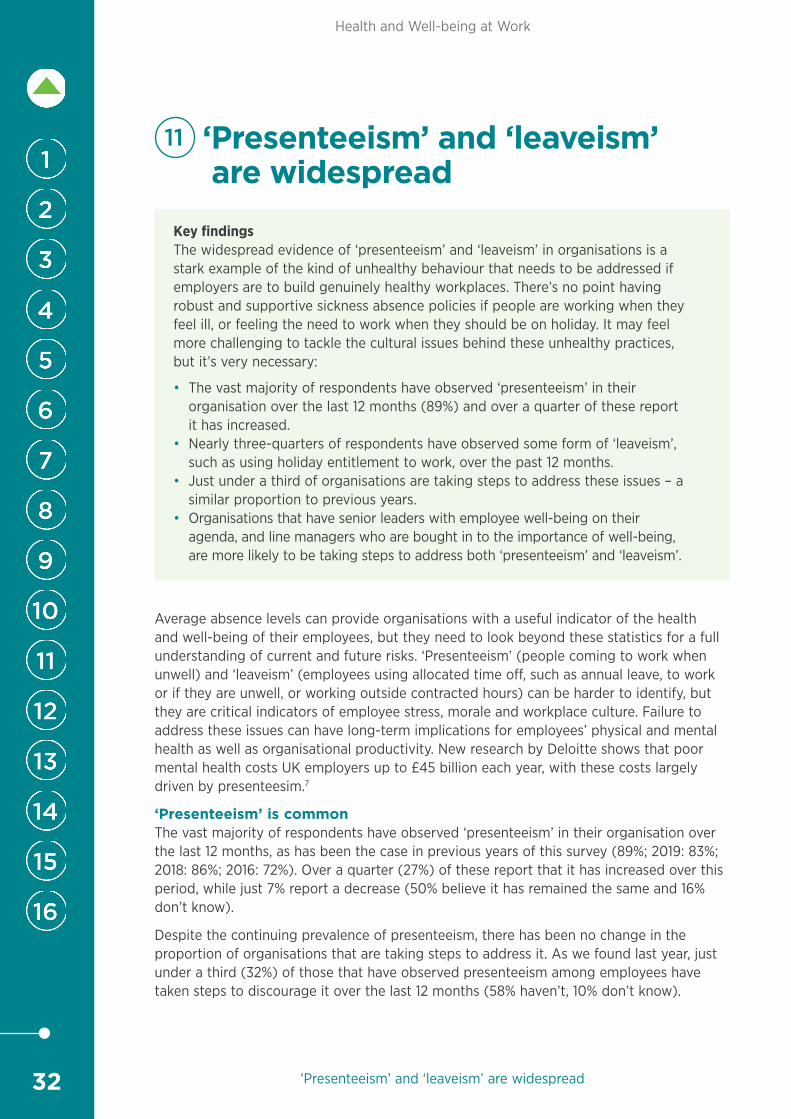
32
Health and Well-being at Work
11 ‘Presenteeism’ and ‘leaveism’ are widespread
Key findingsThe widespread evidence of ‘presenteeism’ and ‘leaveism’ in organisations is a stark example of the kind of unhealthy behaviour that needs to be addressed if employers are to build genuinely healthy workplaces. There’s no point having robust and supportive sickness absence policies if people are working when they feel ill, or feeling the need to work when they should be on holiday. It may feel more challenging to tackle the cultural issues behind these unhealthy practices, but it’s very necessary:
• The vast majority of respondents have observed ‘presenteeism’ in their organisation over the last 12 months (89%) and over a quarter of these report it has increased.
• Nearly three-quarters of respondents have observed some form of ‘leaveism’, such as using holiday entitlement to work, over the past 12 months.
• Just under a third of organisations are taking steps to address these issues – a similar proportion to previous years.
• Organisations that have senior leaders with employee well-being on their agenda, and line managers who are bought in to the importance of well-being, are more likely to be taking steps to address both ‘presenteeism’ and ‘leaveism’.
Average absence levels can provide organisations with a useful indicator of the health and well-being of their employees, but they need to look beyond these statistics for a full understanding of current and future risks. ‘Presenteeism’ (people coming to work when unwell) and ‘leaveism’ (employees using allocated time off, such as annual leave, to work or if they are unwell, or working outside contracted hours) can be harder to identify, but they are critical indicators of employee stress, morale and workplace culture. Failure to address these issues can have long-term implications for employees’ physical and mental health as well as organisational productivity. New research by Deloitte shows that poor mental health costs UK employers up to £45 billion each year, with these costs largely driven by presenteesim.7
‘Presenteeism’ is commonThe vast majority of respondents have observed ‘presenteeism’ in their organisation over the last 12 months, as has been the case in previous years of this survey (89%; 2019: 83%; 2018: 86%; 2016: 72%). Over a quarter (27%) of these report that it has increased over this period, while just 7% report a decrease (50% believe it has remained the same and 16% don’t know).
Despite the continuing prevalence of presenteeism, there has been no change in the proportion of organisations that are taking steps to address it. As we found last year, just under a third (32%) of those that have observed presenteeism among employees have taken steps to discourage it over the last 12 months (58% haven’t, 10% don’t know).
‘Presenteeism’ and ‘leaveism’ are widespread
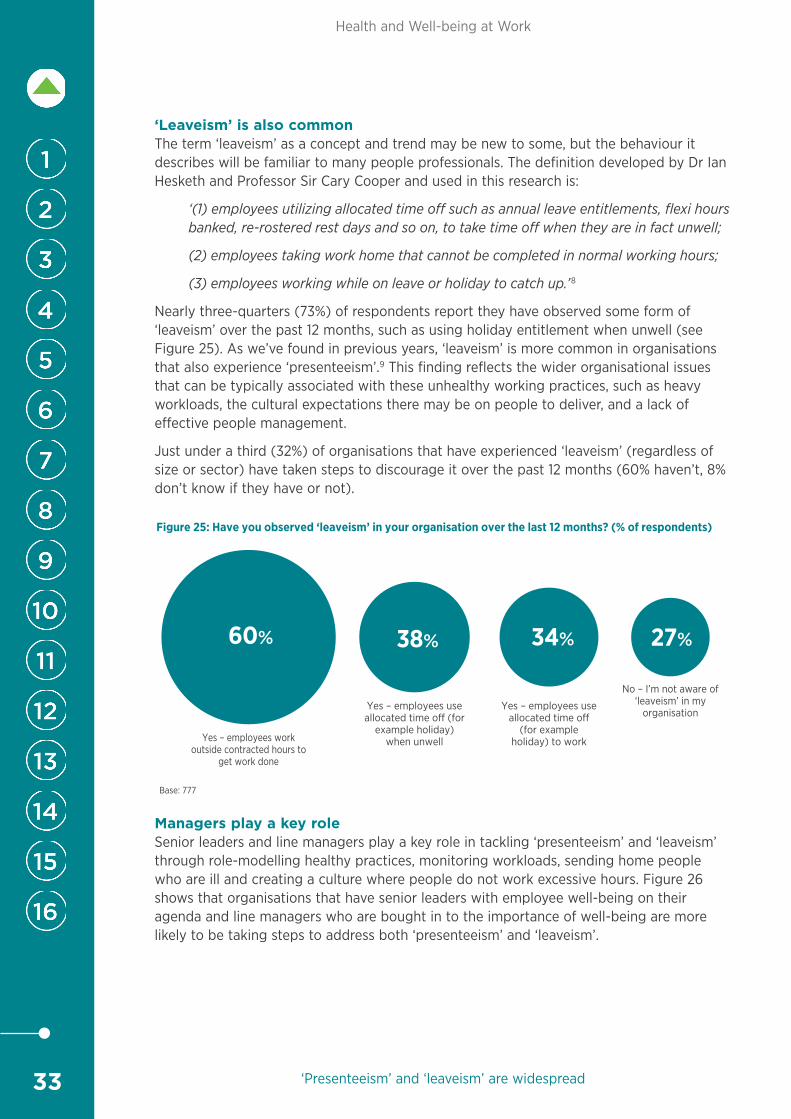
33
Health and Well-being at Work
‘Leaveism’ is also commonThe term ‘leaveism’ as a concept and trend may be new to some, but the behaviour it describes will be familiar to many people professionals. The definition developed by Dr Ian Hesketh and Professor Sir Cary Cooper and used in this research is:
‘(1) employees utilizing allocated time off such as annual leave entitlements, flexi hours banked, re-rostered rest days and so on, to take time off when they are in fact unwell;
(2) employees taking work home that cannot be completed in normal working hours;
(3) employees working while on leave or holiday to catch up.’8
Nearly three-quarters (73%) of respondents report they have observed some form of ‘leaveism’ over the past 12 months, such as using holiday entitlement when unwell (see Figure 25). As we’ve found in previous years, ‘leaveism’ is more common in organisations that also experience ‘presenteeism’.9 This finding reflects the wider organisational issues that can be typically associated with these unhealthy working practices, such as heavy workloads, the cultural expectations there may be on people to deliver, and a lack of effective people management.
Just under a third (32%) of organisations that have experienced ‘leaveism’ (regardless of size or sector) have taken steps to discourage it over the past 12 months (60% haven’t, 8% don’t know if they have or not).
Figure 25: Have you observed ‘leaveism’ in your organisation over the last 12 months? (% of respondents)
No – I’m not aware of ‘leaveism’ in my
organisation
Yes – employees work outside contracted hours to
get work done
Yes – employees use allocated time o� (for
example holiday) when unwell
Yes – employees use allocated time o�
(for example holiday) to work
27%38% 34%60%
Base: 777
Managers play a key roleSenior leaders and line managers play a key role in tackling ‘presenteeism’ and ‘leaveism’ through role-modelling healthy practices, monitoring workloads, sending home people who are ill and creating a culture where people do not work excessive hours. Figure 26 shows that organisations that have senior leaders with employee well-being on their agenda and line managers who are bought in to the importance of well-being are more likely to be taking steps to address both ‘presenteeism’ and ‘leaveism’.
‘Presenteeism’ and ‘leaveism’ are widespread
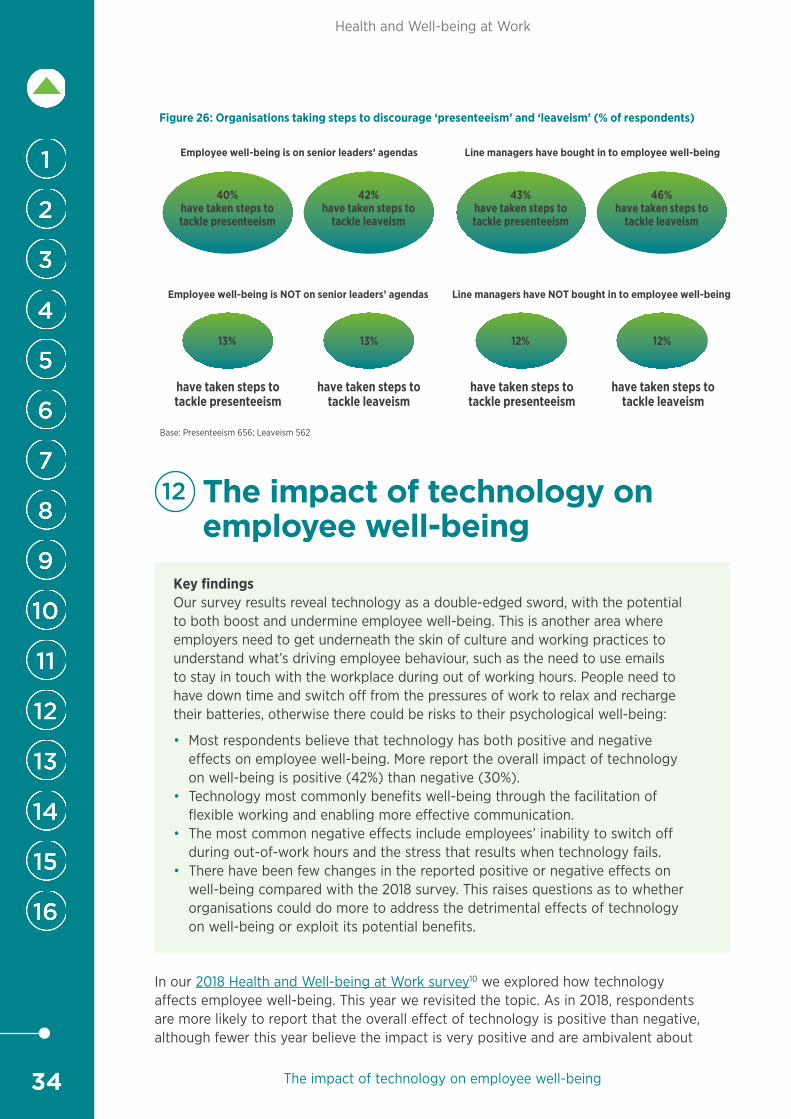
34
Health and Well-being at Work
The impact of technology on employee well-being
Base: Presenteeism 656; Leaveism 562
Figure 26: Organisations taking steps to discourage ‘presenteeism’ and ‘leaveism’ (% of respondents)
40%have taken steps to tackle presenteeism
42%have taken steps to
tackle leaveism
have taken steps to tackle presenteeism
have taken steps to tackle leaveism
13% 13%
43%have taken steps to tackle presenteeism
46%have taken steps to
tackle leaveism
have taken steps to tackle presenteeism
have taken steps to tackle leaveism
12% 12%
Employee well-being is on senior leaders’ agendas
Employee well-being is NOT on senior leaders’ agendas
Line managers have bought in to employee well-being
Line managers have NOT bought in to employee well-being
12 The impact of technology on employee well-being
Key findingsOur survey results reveal technology as a double-edged sword, with the potential to both boost and undermine employee well-being. This is another area where employers need to get underneath the skin of culture and working practices to understand what’s driving employee behaviour, such as the need to use emails to stay in touch with the workplace during out of working hours. People need to have down time and switch off from the pressures of work to relax and recharge their batteries, otherwise there could be risks to their psychological well-being:
• Most respondents believe that technology has both positive and negative effects on employee well-being. More report the overall impact of technology on well-being is positive (42%) than negative (30%).
• Technology most commonly benefits well-being through the facilitation of flexible working and enabling more effective communication.
• The most common negative effects include employees’ inability to switch off during out-of-work hours and the stress that results when technology fails.
• There have been few changes in the reported positive or negative effects on well-being compared with the 2018 survey. This raises questions as to whether organisations could do more to address the detrimental effects of technology on well-being or exploit its potential benefits.
In our 2018 Health and Well-being at Work survey10 we explored how technology affects employee well-being. This year we revisited the topic. As in 2018, respondents are more likely to report that the overall effect of technology is positive than negative, although fewer this year believe the impact is very positive and are ambivalent about
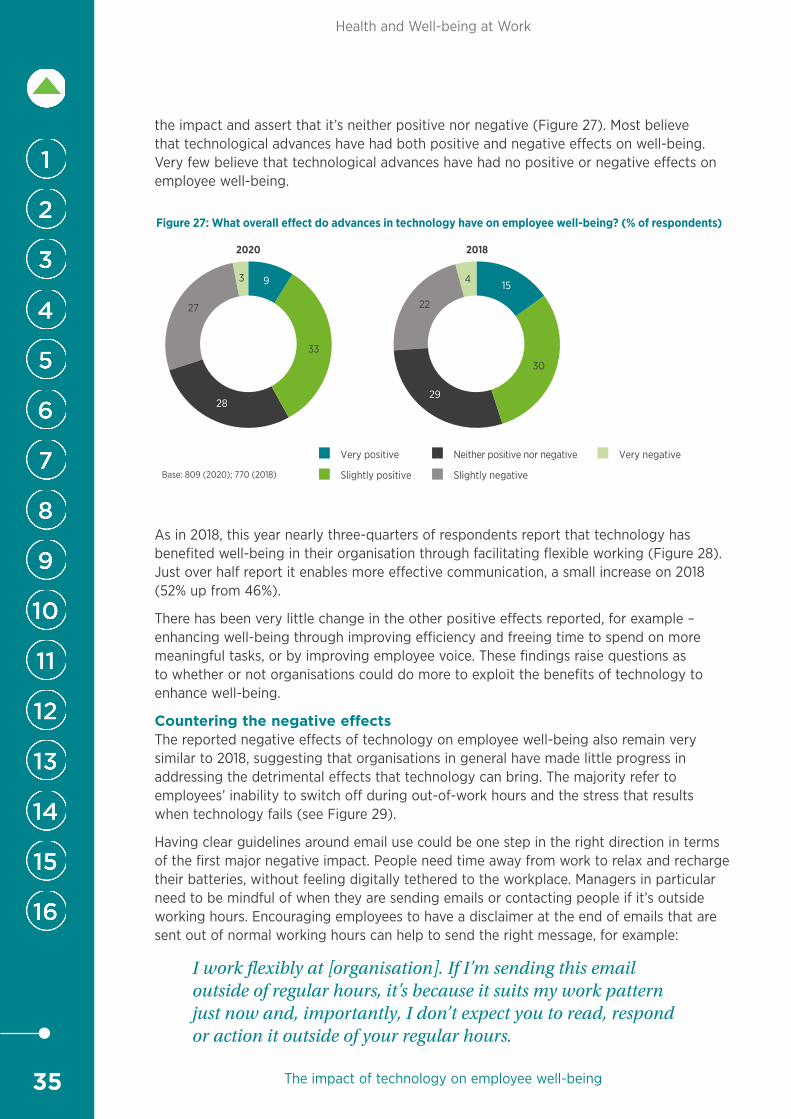
35
Health and Well-being at Work
The impact of technology on employee well-being
the impact and assert that it’s neither positive nor negative (Figure 27). Most believe that technological advances have had both positive and negative effects on well-being. Very few believe that technological advances have had no positive or negative effects on employee well-being.
Base: 809 (2020); 770 (2018)
Very positive
Slightly positive
2020 2018
Neither positive nor negative
Slightly negative
Very negative
Figure 27: What overall e�ect do advances in technology have on employee well-being? (% of respondents)
33
3
28
27
9
30
4
29
22
15
As in 2018, this year nearly three-quarters of respondents report that technology has benefited well-being in their organisation through facilitating flexible working (Figure 28). Just over half report it enables more effective communication, a small increase on 2018 (52% up from 46%).
There has been very little change in the other positive effects reported, for example – enhancing well-being through improving efficiency and freeing time to spend on more meaningful tasks, or by improving employee voice. These findings raise questions as to whether or not organisations could do more to exploit the benefits of technology to enhance well-being.
Countering the negative effectsThe reported negative effects of technology on employee well-being also remain very similar to 2018, suggesting that organisations in general have made little progress in addressing the detrimental effects that technology can bring. The majority refer to employees’ inability to switch off during out-of-work hours and the stress that results when technology fails (see Figure 29).
Having clear guidelines around email use could be one step in the right direction in terms of the first major negative impact. People need time away from work to relax and recharge their batteries, without feeling digitally tethered to the workplace. Managers in particular need to be mindful of when they are sending emails or contacting people if it’s outside working hours. Encouraging employees to have a disclaimer at the end of emails that are sent out of normal working hours can help to send the right message, for example:
I work flexibly at [organisation]. If I’m sending this email outside of regular hours, it’s because it suits my work pattern just now and, importantly, I don’t expect you to read, respond or action it outside of your regular hours.
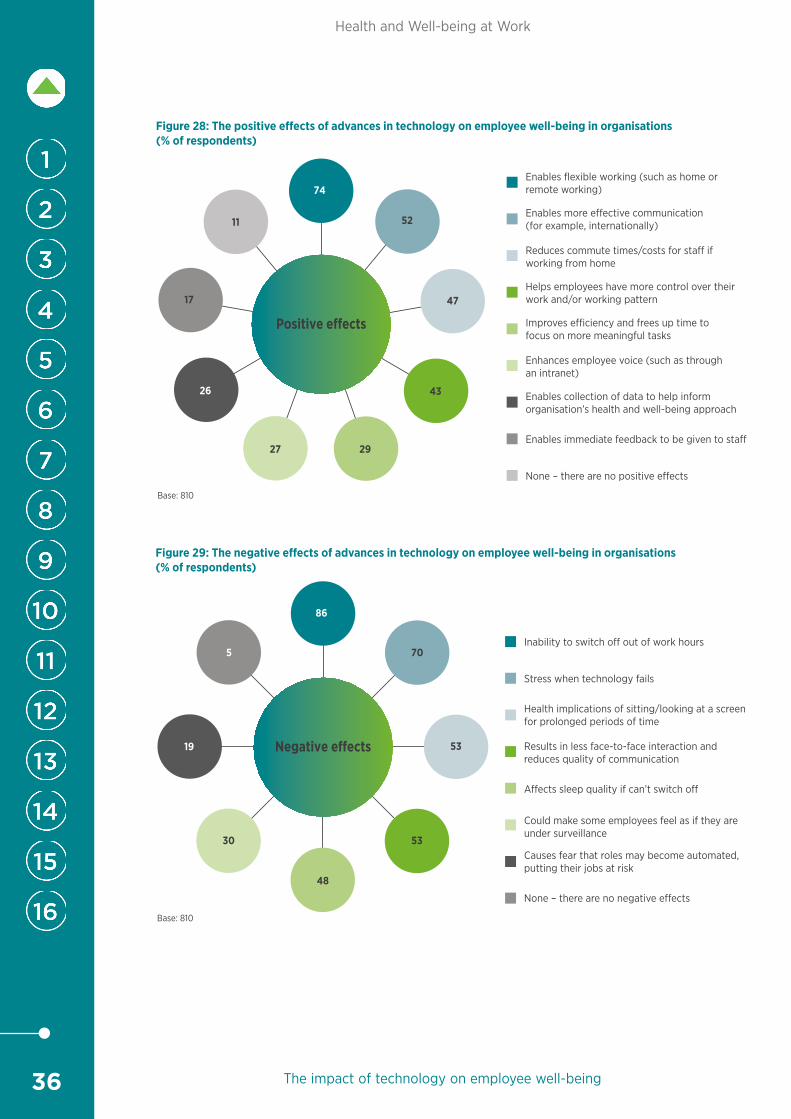
36
Health and Well-being at Work
The impact of technology on employee well-being
Enables flexible working (such as home or remote working)
Enables more e�ective communication (for example, internationally)
Reduces commute times/costs for sta� if working from home
Helps employees have more control over their work and/or working pattern
Improves e�ciency and frees up time to focus on more meaningful tasks
Enhances employee voice (such as through an intranet)
Enables collection of data to help inform organisation’s health and well-being approach
Enables immediate feedback to be given to sta�
None – there are no positive e�ects
Positive e�ects
52
47
43
2927
26
17
11
74
Base: 810
Figure 28: The positive e�ects of advances in technology on employee well-being in organisations (% of respondents)
Inability to switch o� out of work hours
Stress when technology fails
Health implications of sitting/looking at a screen for prolonged periods of time
Results in less face-to-face interaction and reduces quality of communication
A�ects sleep quality if can’t switch o�
Could make some employees feel as if they are under surveillance
Causes fear that roles may become automated, putting their jobs at risk
None – there are no negative e�ects
86
Base: 810
Figure 29: The negative e ects of advances in technology on employee well-being in organisations (% of respondents)
5
19
30 53
70
53
48
Negative e ects
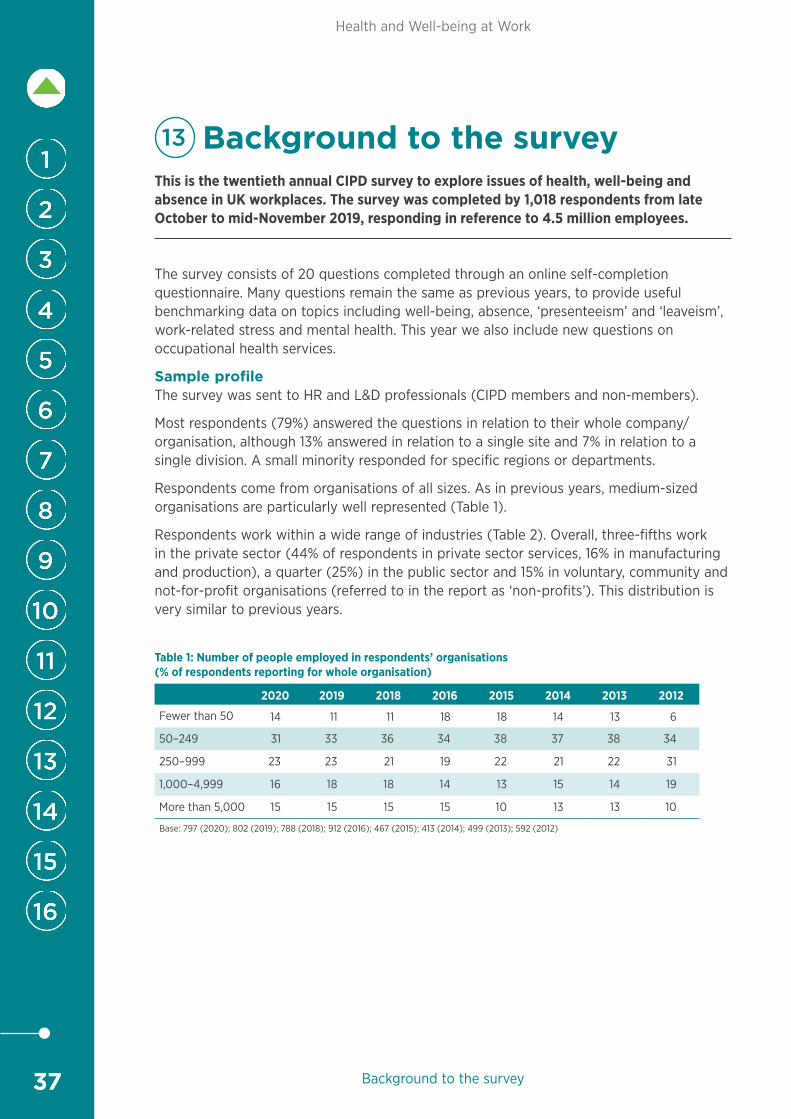
37
Health and Well-being at Work
Background to the survey
13 Background to the surveyThis is the twentieth annual CIPD survey to explore issues of health, well-being and absence in UK workplaces. The survey was completed by 1,018 respondents from late October to mid-November 2019, responding in reference to 4.5 million employees.
The survey consists of 20 questions completed through an online self-completion questionnaire. Many questions remain the same as previous years, to provide useful benchmarking data on topics including well-being, absence, ‘presenteeism’ and ‘leaveism’, work-related stress and mental health. This year we also include new questions on occupational health services.
Sample profileThe survey was sent to HR and L&D professionals (CIPD members and non-members).
Most respondents (79%) answered the questions in relation to their whole company/organisation, although 13% answered in relation to a single site and 7% in relation to a single division. A small minority responded for specific regions or departments.
Respondents come from organisations of all sizes. As in previous years, medium-sized organisations are particularly well represented (Table 1).
Respondents work within a wide range of industries (Table 2). Overall, three-fifths work in the private sector (44% of respondents in private sector services, 16% in manufacturing and production), a quarter (25%) in the public sector and 15% in voluntary, community and not-for-profit organisations (referred to in the report as ‘non-profits’). This distribution is very similar to previous years.
Table 1: Number of people employed in respondents’ organisations (% of respondents reporting for whole organisation)
2020 2019 2018 2016 2015 2014 2013 2012
Fewer than 50 14 11 11 18 18 14 13 6
50–249 31 33 36 34 38 37 38 34
250–999 23 23 21 19 22 21 22 31
1,000–4,999 16 18 18 14 13 15 14 19
More than 5,000 15 15 15 15 10 13 13 10
Base: 797 (2020); 802 (2019); 788 (2018); 912 (2016); 467 (2015); 413 (2014); 499 (2013); 592 (2012)
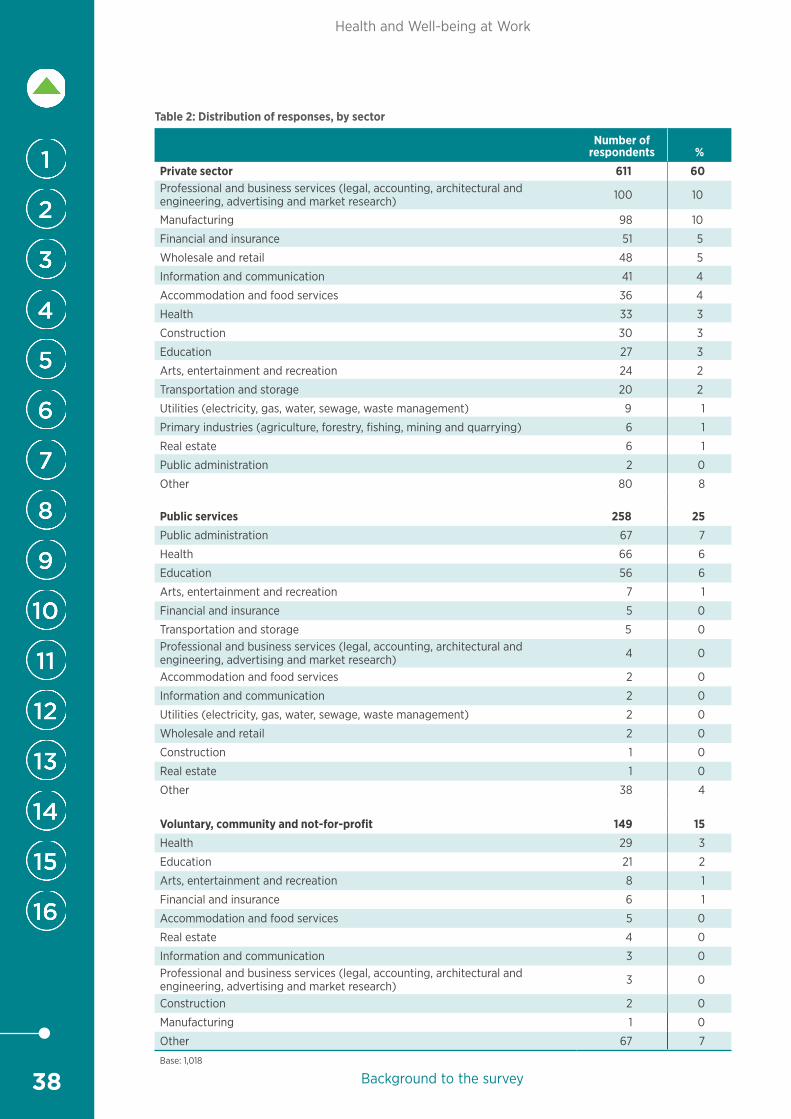
38
Health and Well-being at Work
Background to the survey
Table 2: Distribution of responses, by sector
Number of respondents %
Private sector 611 60Professional and business services (legal, accounting, architectural and engineering, advertising and market research) 100 10
Manufacturing 98 10
Financial and insurance 51 5
Wholesale and retail 48 5
Information and communication 41 4
Accommodation and food services 36 4
Health 33 3
Construction 30 3
Education 27 3
Arts, entertainment and recreation 24 2
Transportation and storage 20 2
Utilities (electricity, gas, water, sewage, waste management) 9 1
Primary industries (agriculture, forestry, fishing, mining and quarrying) 6 1
Real estate 6 1
Public administration 2 0
Other 80 8
Public services 258 25Public administration 67 7
Health 66 6
Education 56 6
Arts, entertainment and recreation 7 1
Financial and insurance 5 0
Transportation and storage 5 0Professional and business services (legal, accounting, architectural and engineering, advertising and market research) 4 0
Accommodation and food services 2 0
Information and communication 2 0
Utilities (electricity, gas, water, sewage, waste management) 2 0
Wholesale and retail 2 0
Construction 1 0
Real estate 1 0
Other 38 4
Voluntary, community and not-for-profit 149 15Health 29 3
Education 21 2
Arts, entertainment and recreation 8 1
Financial and insurance 6 1
Accommodation and food services 5 0
Real estate 4 0
Information and communication 3 0Professional and business services (legal, accounting, architectural and engineering, advertising and market research) 3 0
Construction 2 0
Manufacturing 1 0
Other 67 7
Base: 1,018
39
Health and Well-being at Work
Notes/additional reading
Note on abbreviations, statistics and figures usedVoluntary, community and not-for-profit organisations are referred to throughout the report as ‘non-profit organisations’.
The ‘private sector’ is used to describe organisations from manufacturing and production and private sector services. These two groups are combined for reporting purposes where there are no significant differences between their responses.
SMEs refers to organisations with fewer than 250 employees.
Where we report on figures by organisation size, the analysis is based on the responses of those who report for the whole organisation. Those reporting only for employees in a single site/division/region are excluded for comparison purposes.
Some respondents did not answer all questions, so where percentages are reported in tables or figures, the respondent ‘base’ for that question is given.
The 5% trimmed mean is used in calculations of average employee absence levels in order to avoid a few extreme cases skewing the results. The 5% trimmed mean is the arithmetic mean calculated when the largest 5% and the smallest 5% of the cases have been eliminated. Eliminating extreme cases from the computation of the mean results is a better estimate of central tendency when extreme outliers exist.
With the exception of average working time and days lost, all figures in graphs have been rounded to the nearest percentage point. Due to rounding, percentages may not always total 100.
Different statistical tests have been used, depending on the type of analysis and the measures used in the questionnaire, to examine whether differences between groups are significantly different than could be expected by chance and to examine associations between measures.
14 Notes/additional reading 1 CIPD. (2019) OH and HR: let’s get it together. London: Chartered Institute of Personnel
and Development.
2 House of Commons Work and Pensions Committee. (2018) Employment support for carers: Thirteenth report of Session 2017–19. London: House of Commons.
3 CIPD. (2019) UK working lives research. London: Chartered Institute of Personnel and Development.
4 rs =.50, p<.001, n=699.
5 HSE. Stress risk assessment. Webpage. Bootle: Health and Safety Executive.
6 HSE. Talking Toolkit. Bootle: Health and Safety Executive.
7 Deloitte. (2019) Mental health and employers: refreshing the case for investment. London: Deloitte.
8 Hesketh, I. and Cooper, C.L. (2014) Leaveism at work. Occupational Medicine. Vol 64, No 3. pp146-7.
9 76% of respondents who have observed ‘presenteeism’ in their organisations have also observed ‘leaveism’. 57% of those who haven’t observed ‘presenteeism’ have observed ‘leaveism’.
10 CIPD. (2018) Health and well-being at work. London: Chartered Institute of Personnel and Development.
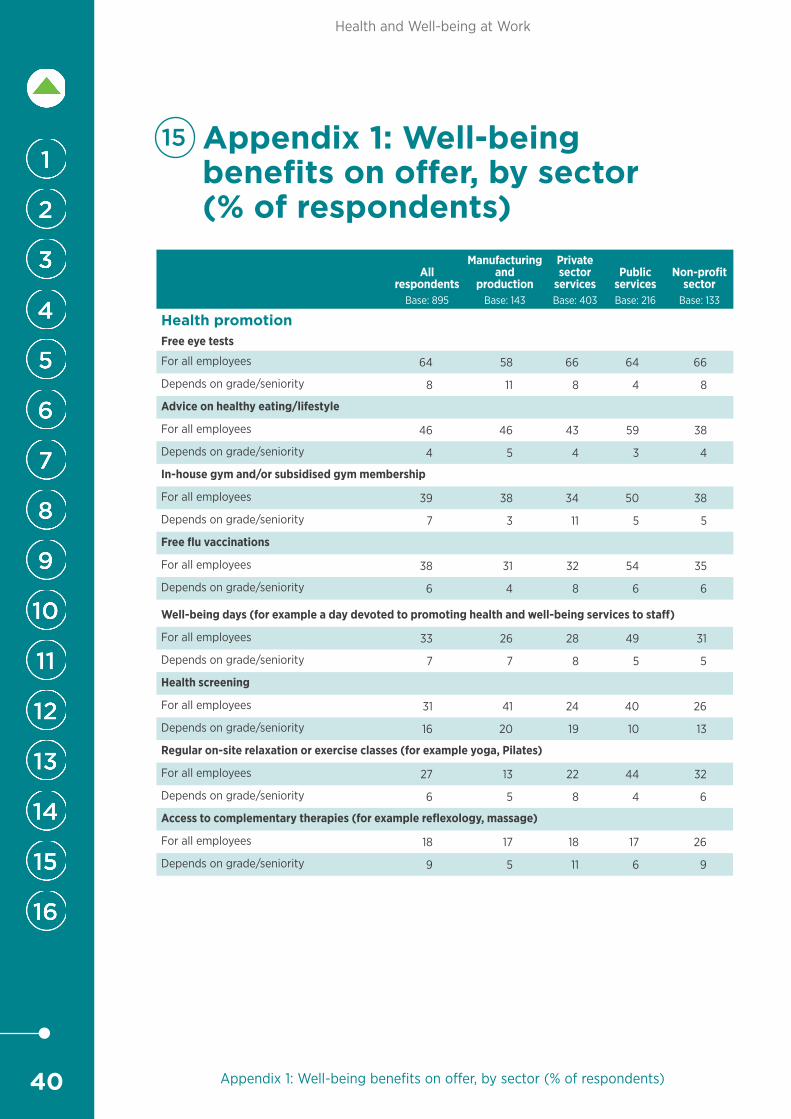
40
Health and Well-being at Work
Appendix 1: Well-being benefits on offer, by sector (% of respondents)
15 Appendix 1: Well-being benefits on offer, by sector (% of respondents)
All respondents
Base: 895
Manufacturing and
productionBase: 143
Privatesector
servicesBase: 403
PublicservicesBase: 216
Non-profit sector
Base: 133
Health promotionFree eye tests
For all employees 64 58 66 64 66
Depends on grade/seniority 8 11 8 4 8
Advice on healthy eating/lifestyle
For all employees 46 46 43 59 38
Depends on grade/seniority 4 5 4 3 4
In-house gym and/or subsidised gym membership
For all employees 39 38 34 50 38
Depends on grade/seniority 7 3 11 5 5
Free flu vaccinations
For all employees 38 31 32 54 35
Depends on grade/seniority 6 4 8 6 6
Well-being days (for example a day devoted to promoting health and well-being services to staff)
For all employees 33 26 28 49 31
Depends on grade/seniority 7 7 8 5 5
Health screening
For all employees 31 41 24 40 26
Depends on grade/seniority 16 20 19 10 13
Regular on-site relaxation or exercise classes (for example yoga, Pilates)
For all employees 27 13 22 44 32
Depends on grade/seniority 6 5 8 4 6
Access to complementary therapies (for example reflexology, massage)
For all employees 18 17 18 17 26
Depends on grade/seniority 9 5 11 6 9
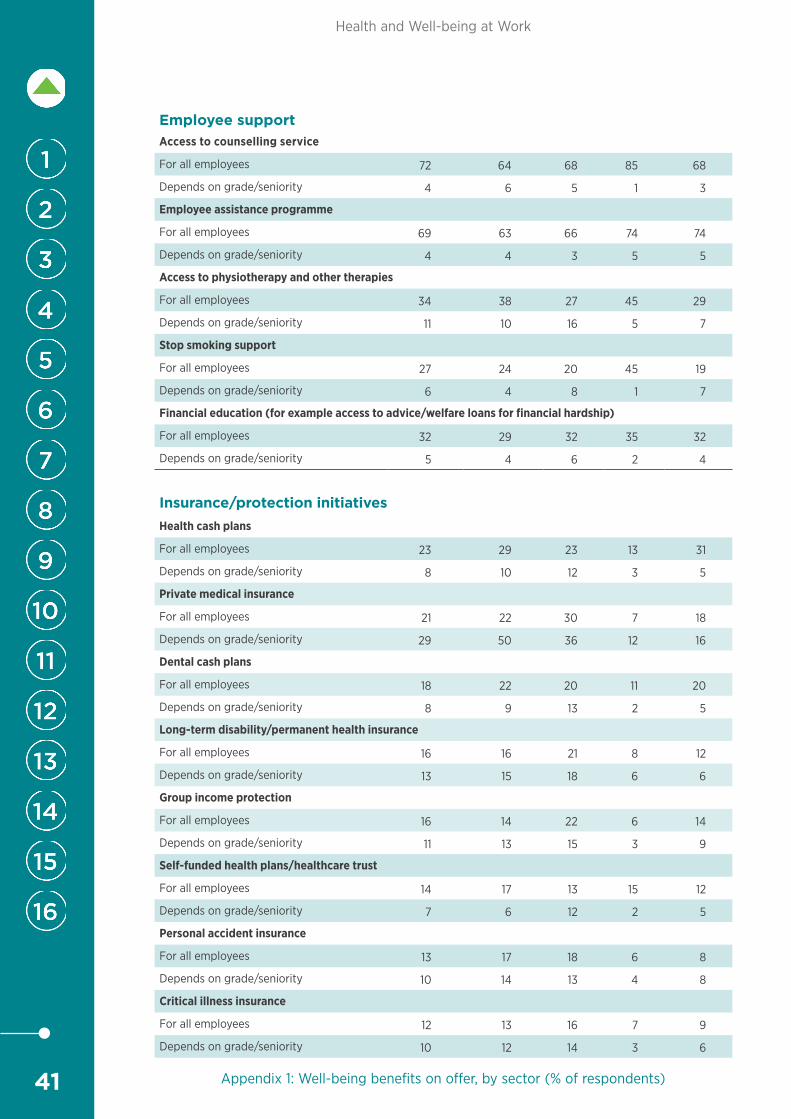
41
Health and Well-being at Work
Appendix 1: Well-being benefits on offer, by sector (% of respondents)
Employee supportAccess to counselling service
For all employees 72 64 68 85 68
Depends on grade/seniority 4 6 5 1 3
Employee assistance programme
For all employees 69 63 66 74 74
Depends on grade/seniority 4 4 3 5 5
Access to physiotherapy and other therapies
For all employees 34 38 27 45 29
Depends on grade/seniority 11 10 16 5 7
Stop smoking support
For all employees 27 24 20 45 19
Depends on grade/seniority 6 4 8 1 7
Financial education (for example access to advice/welfare loans for financial hardship)
For all employees 32 29 32 35 32
Depends on grade/seniority 5 4 6 2 4
Insurance/protection initiativesHealth cash plans
For all employees 23 29 23 13 31
Depends on grade/seniority 8 10 12 3 5
Private medical insurance
For all employees 21 22 30 7 18
Depends on grade/seniority 29 50 36 12 16
Dental cash plans
For all employees 18 22 20 11 20
Depends on grade/seniority 8 9 13 2 5
Long-term disability/permanent health insurance
For all employees 16 16 21 8 12
Depends on grade/seniority 13 15 18 6 6
Group income protection
For all employees 16 14 22 6 14
Depends on grade/seniority 11 13 15 3 9
Self-funded health plans/healthcare trust
For all employees 14 17 13 15 12
Depends on grade/seniority 7 6 12 2 5
Personal accident insurance
For all employees 13 17 18 6 8
Depends on grade/seniority 10 14 13 4 8
Critical illness insurance
For all employees 12 13 16 7 9
Depends on grade/seniority 10 12 14 3 6
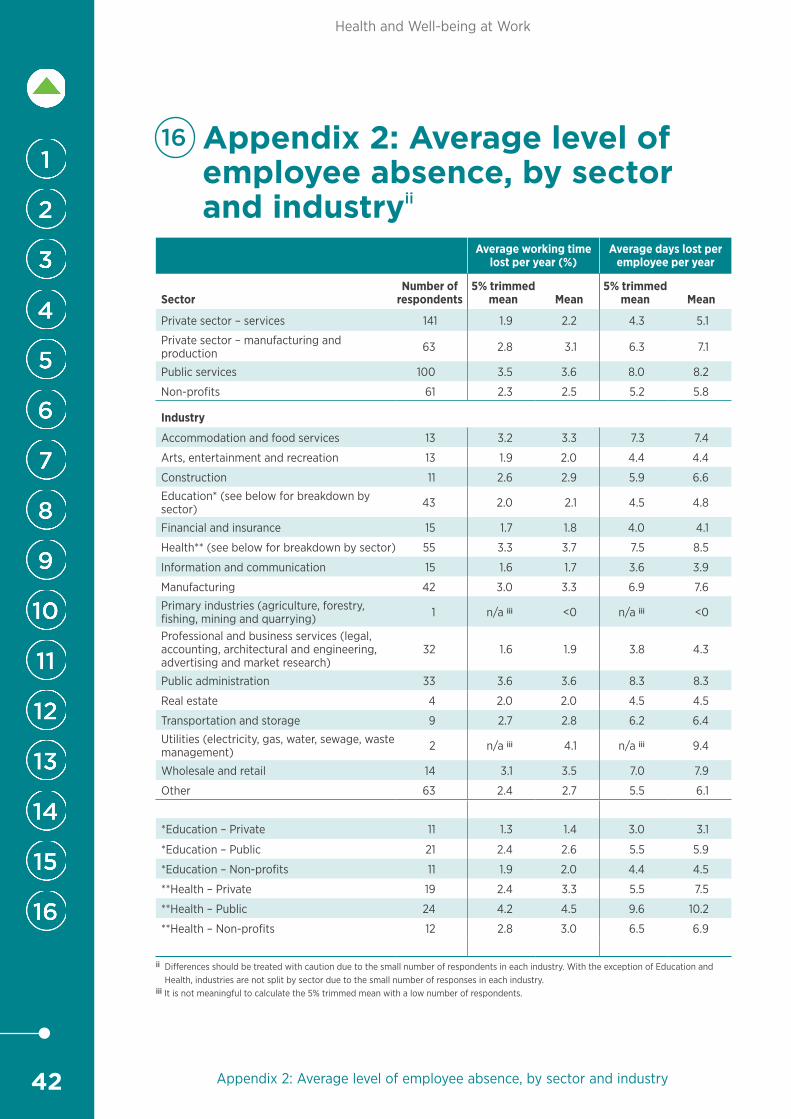
42
Health and Well-being at Work
Appendix 2: Average level of employee absence, by sector and industry
16 Appendix 2: Average level of employee absence, by sector and industryii
Average working time lost per year (%)
Average days lost per employee per year
SectorNumber of
respondents5% trimmed
mean Mean5% trimmed
mean Mean
Private sector – services 141 1.9 2.2 4.3 5.1
Private sector – manufacturing and production 63 2.8 3.1 6.3 7.1
Public services 100 3.5 3.6 8.0 8.2
Non-profits 61 2.3 2.5 5.2 5.8
Industry
Accommodation and food services 13 3.2 3.3 7.3 7.4
Arts, entertainment and recreation 13 1.9 2.0 4.4 4.4
Construction 11 2.6 2.9 5.9 6.6
Education* (see below for breakdown by sector) 43 2.0 2.1 4.5 4.8
Financial and insurance 15 1.7 1.8 4.0 4.1
Health** (see below for breakdown by sector) 55 3.3 3.7 7.5 8.5
Information and communication 15 1.6 1.7 3.6 3.9
Manufacturing 42 3.0 3.3 6.9 7.6
Primary industries (agriculture, forestry, fishing, mining and quarrying) 1 n/a iii <0 n/a iii <0
Professional and business services (legal, accounting, architectural and engineering, advertising and market research)
32 1.6 1.9 3.8 4.3
Public administration 33 3.6 3.6 8.3 8.3
Real estate 4 2.0 2.0 4.5 4.5
Transportation and storage 9 2.7 2.8 6.2 6.4
Utilities (electricity, gas, water, sewage, waste management) 2 n/a iii 4.1 n/a iii 9.4
Wholesale and retail 14 3.1 3.5 7.0 7.9
Other 63 2.4 2.7 5.5 6.1
*Education – Private 11 1.3 1.4 3.0 3.1
*Education – Public 21 2.4 2.6 5.5 5.9
*Education – Non-profits 11 1.9 2.0 4.4 4.5
**Health – Private 19 2.4 3.3 5.5 7.5
**Health – Public 24 4.2 4.5 9.6 10.2
**Health – Non-profits 12 2.8 3.0 6.5 6.9
ii Differences should be treated with caution due to the small number of respondents in each industry. With the exception of Education and Health, industries are not split by sector due to the small number of responses in each industry.
iii It is not meaningful to calculate the 5% trimmed mean with a low number of respondents.

Chartered Institute of Personnel and Development151 The Broadway London SW19 1JQ United Kingdom T +44 (0)20 8612 6200 F +44 (0)20 8612 6201E [email protected] W cipd.co.ukIncorporated by Royal Charter Registered as a charity in England and Wales (1079797) Scotland (SC045154) and Ireland (20100827)
Issued: March 2020 Reference: 7998 © CIPD 2020 Simplyhealth.co.uk/businesses
in partnership with