Headwinds on the Road to Zero: ADAS, crashworthiness and ... · Headwinds on the Road to Zero:...
77
iihs.org Headwinds on the Road to Zero: ADAS, crashworthiness and macro effects International Center for Automotive Medicine Ann Arbor, MI October 5, 2017 Adrian Lund, Ph.D. President
Transcript of Headwinds on the Road to Zero: ADAS, crashworthiness and ... · Headwinds on the Road to Zero:...

iihs.org
Headwinds on the Road to Zero: ADAS, crashworthiness and macro effectsInternational Center for Automotive MedicineAnn Arbor, MI
October 5, 2017
Adrian Lund, Ph.D.
President

IIHS is an independent, nonprofit scientific and
educational organization dedicated to reducing the losses — deaths, injuries and property damage — from crashes on the nation’s roads. Established 1959.
HLDI shares this mission by analyzing insurance
data representing human and economic losses from crashes and other events related to vehicle ownership.Established 1972.
Both organizations are wholly supported by auto insurers.
Institute activities We do not lobby, legislate, or litigate
IIHS and HLDI rely on aggressive research and communications to empower people and
policymakers with objective information
Priority 1 – objective research on policy options to reduce injuries and property damage
from motor vehicle crashes
Priority 2 – effective communications to make research information attractive to news
media
– News releases (TV, print, Internet)
– Films
– Testimony at state and federal legislative and regulatory hearings
– Briefings of other stakeholders, including vehicle manufacturers

crash phase
changes in… before during after losses
people
•licensing (GDL, elderly)
•impaired driving laws
•camera enforcement
•restraints use
•helmets
•speed cameras
•alcohol •injuries
•deaths
•income
•hospital costs
vehicles
•driver assistance
•daytime running lights
•electronic control
•restraints effect
•vehicle structure
•bumpers
•crash
notification
•fuel systems
•damage
•insurance costs
environment
•intersections design
•trouble spots treatment
•rumble strips
•roundabouts
•breakaway poles
•crash cushions
•emergency
medicine
•economic
•fuel usage (CAFE)
•congestion
crash phase
changes in… before during after
people
•licensing (GDL, elderly)
•impaired driving laws
•camera enforcement
•restraints (use)
•helmets
•speed cameras
•alcohol
•medical bracelet
•general health
vehicles
•driver assistance
•daytime running lights
•advanced headlights
•restraints (effect)
•vehicle structure
•bumpers
•automatic crash
notification
•fuel systems
•repairability
environment
•intersection design
•trouble-spot treatment
•rumble strips
•roundabouts
•breakaway poles
•crash cushions
•emergency
medicine
electronic stability control
Haddon matrixRecognizing opportunities to make a difference

Motor vehicle
crash deaths have
declined significantly
in the U.S. during
the past 50+ years.
30,000
35,000
40,000
45,000
50,000
55,000
60,000
1950 1960 1970 1980 1990 2000 2010 20150
10
20
30
40
50
60
70
80
Motor vehiclecrash deaths
Crash deaths perbillion vehicle miles traveled
201535,092 deaths
11.2 per billion
U.S. motor vehicle crash deaths and deaths
per billion vehicle miles traveled
1950-2015

Established October 2016450 members

Headwinds on the Road to Zero


Percent U.S. drivers using cellphones at any given daylight time and motor vehicle crash deaths2000-15
0
10,000
20,000
30,000
40,000
50,000
2000 2002 2004 2005 2010 2015
Annual deaths
Estimated hand-held and hands-free phone
conversation
Observed hand-held phone conversation Observed manipulation
of hand-held devices
16%
12%
8%
4%

Crash deaths and their rate are highly correlated with economic conditions.

30,000
35,000
40,000
45,000
50,000
55,000
60,000
1950 1960 1970 1980 1990 2000 2010 2015
Motor vehicle crash deaths
20%
U.S. motor vehicle crash deaths and unemployment rate1950-2015
20155% rate
35,092 deaths
Unemployment rate
10%
15%
0%
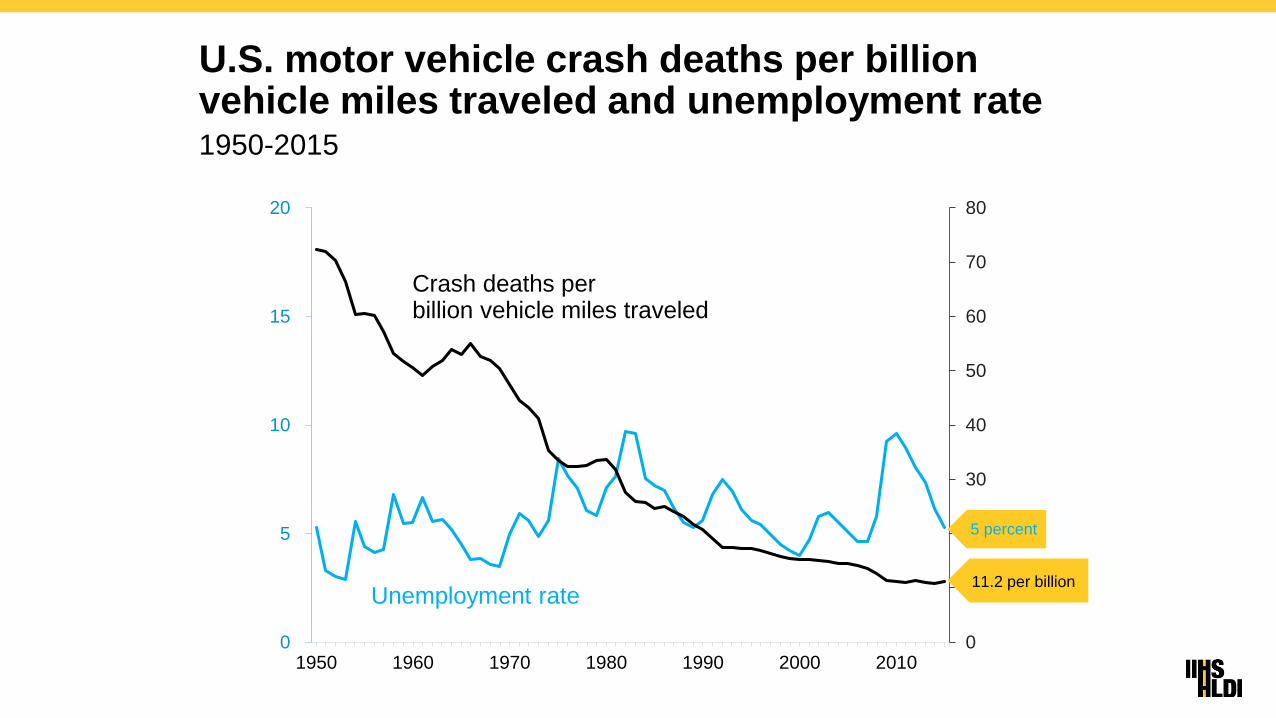
U.S. motor vehicle crash deaths per billion vehicle miles traveled and unemployment rate1950-2015
0
10
20
30
40
50
60
70
80
0
5
10
15
20
1950 1960 1970 1980 1990 2000 2010
Unemployment rate
Crash deaths perbillion vehicle miles traveled
11.2 per billion
5 percent

1950 1960 1970 1980 1990 2000 2010
Crash deaths perbillion vehicle miles traveled
Unemployment rate
Change in U.S. motor vehicle crash deaths per billion miles traveled and unemployment rate1950-2015
20%
15%
10%
5%
0%
-5%
-10%
-15%
-20%
80%
40%
0%
-40%
-80%

Youth are returning to cars after recessionInsurance exposure and unemployment 2006-14
10
11
12
13
14
15
16
17
18
19
20
3.6
3.7
3.8
3.9
4.0
4.1
4.2
2006 2007 2008 2009 2010 2011 2012 2013 2014
un
em
plo
ym
en
t s
pre
ad
(p
erc
en
tag
e p
oin
ts)
tee
n in
su
red
s p
er
10
0 p
rim
e a
ge
in
su
red
s
teen to prime ratio
unemployment spread

Effects of economy on miles traveled and crash deaths1990-2015
Miles traveled
– Increase by 1.5% each year, on average
– Increase by another 1.8% for each 1 percentage point decline in unemployment
Crash deaths
– Decrease by 2% each year, on average
– Increase by 1% for each 1% rise in miles
– Increase by another 2% for each 1 percentage point decline in unemployment
Combined with the effect on miles traveled, each 1 percentage point decline in
unemployment is associated with about a 4% increase in crash deaths

Motor vehicle crash deaths, 1990-2015Actual vs. model containing time trend, miles traveled and unemployment
30,000
35,000
40,000
45,000
1990 1992 1994 1996 1998 2000 2002 2004 2006 2008 2010 2012 2014
motor vehicle crash deaths
model predictions
log D = – 3.2 – 0.022 T + 0.962 log M – 0.021 U
R-Square = 91%

Motor vehicle crash deaths, 1990-2015With projections for 2016-24
30,000
35,000
40,000
45,000
1990 1995 2000 2005 2010 2015 2020
motor vehicle crash deaths
if unemployment remains steady at 4.9
if unemployment declines by 1.7% each year
if unemployment declines by 8.0% each year

40
60
80
100
120
140
160
180
1985 1987 1989 1991 1993 1995 1997 1999 2001 2003 2005 2007 2009 2011
Calendar year
Actual rates
Expected rates
Vehicle and non-vehicle factors and highway safetyPassenger vehicle driver deaths per million vehicles, actual vs. expected for 1985 fleet

Crashworthiness in 1959 and 2009

2016 ratings for registered vehiclesAll registered vehicles
0%
20%
40%
60%
80%
100%
moderate overlap(start year 1995)
side(start year 2003)
roof(start year 2009)
small overlap(start year 2012)
good acceptable marginal poor unrated

Legalizing recreational useof marijuana

Laws legalizing some uses of marijuanaAfter 2016 general election
WY
WV
WI
WA
VT
VA
UT
TX
TN
SD
SC
RI
OR
OK
NY
NV
NM
NJ
NH
NE
ND
NC
MT
MS
MO
MN
MI
ME
MD
MA
LA
KYKS
INIL
ID
IA
HI
GA
FL
DE
DC
CT
CO
CA
AZAR
AL
AK
medical marijuana legal
all uses legal
limited medical
marijuana use
PA
OH
source: National Conference of State Legislatures
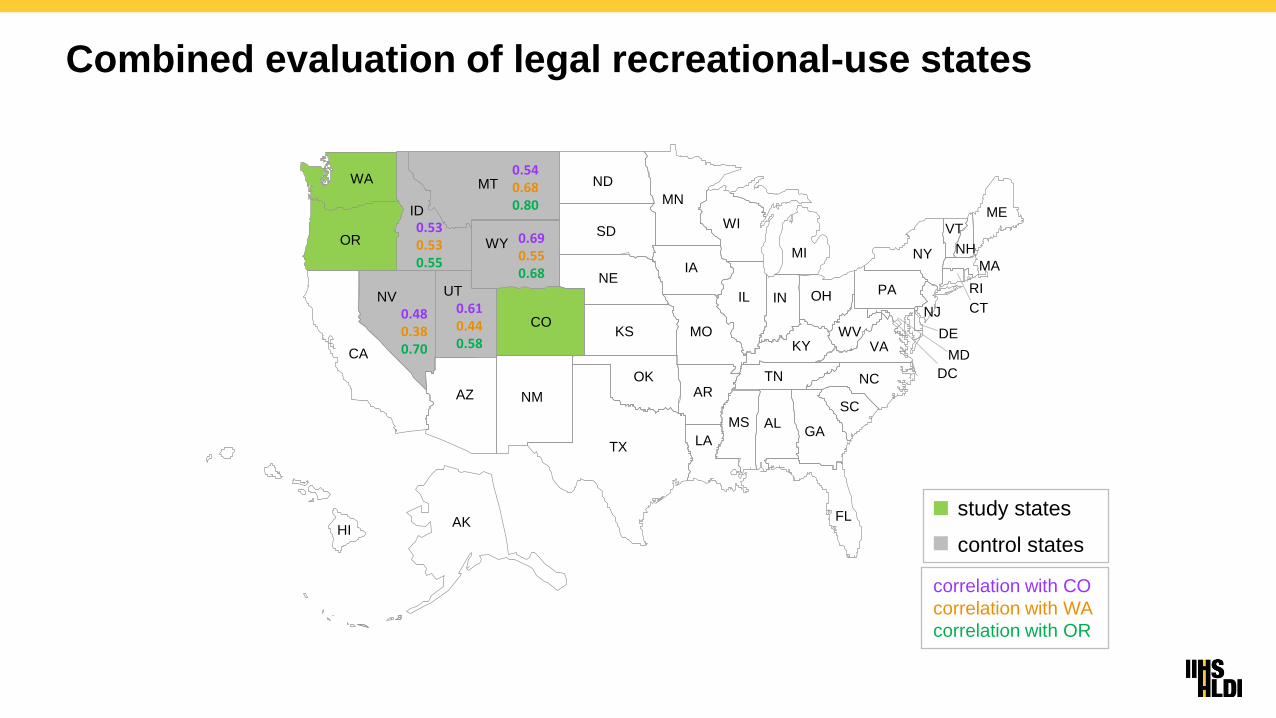
Combined evaluation of legal recreational-use states
MD
DE
DC
MA
OR
RI
NJ
NH
ME
PA
WV
NC
SC
GA
FL
OH
MI
IL
WI
IA
MO
LA
NM
CO
SD
ID
CA
WA
TN
VT
MS
MT ND
NV
AZ
UT
WY
NE
KS
OK
TX
AR
MN
AL
KY VA
NY
CT
AKHI
IN
study states
control states
correlation with CO
correlation with WA
correlation with OR
0.480.380.70
0.610.440.58
0.690.550.68
0.540.680.80
0.530.530.55

Collision claims after legalization of recreational marijuana useCombined analysis of Colorado, Oregon, and Washington – HLDI 2017
study states Colorado, Washington, Oregon
additional control states Idaho, Montana, Nevada, Utah, Wyoming
calendar years January 2012-October 2016
exposure49,225,462 vehicle years
for vehicles up to 33 years of age
total number claims 2,494,668
outcome measurechanges in collision claims per insured
vehicle year
result2.7% increase in collision claims
(statistically significant)
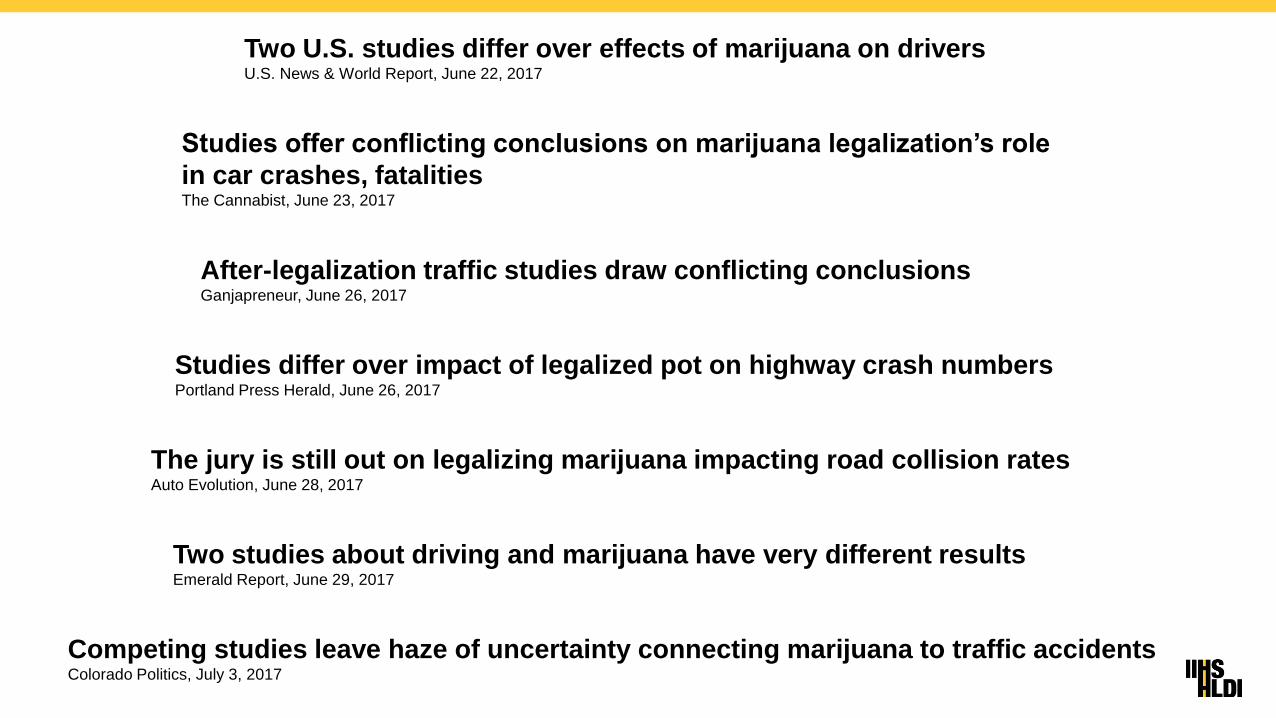
Competing studies leave haze of uncertainty connecting marijuana to traffic accidents Colorado Politics, July 3, 2017
After-legalization traffic studies draw conflicting conclusions Ganjapreneur, June 26, 2017
Two U.S. studies differ over effects of marijuana on drivers U.S. News & World Report, June 22, 2017
Two studies about driving and marijuana have very different results Emerald Report, June 29, 2017
Studies offer conflicting conclusions on marijuana legalization’s role
in car crashes, fatalitiesThe Cannabist, June 23, 2017
Studies differ over impact of legalized pot on highway crash numbers Portland Press Herald, June 26, 2017
The jury is still out on legalizing marijuana impacting road collision rates Auto Evolution, June 28, 2017

Pre-period correlations of collision claim rates between study states and control states used by Aydelotte et al. 2017, AJPH
MD
DE
DC
MA
OR
RI
NJ
NH
ME
PA
WV
NC
SC
GA
FL
OH
MI
IL
WI
IA
MO
LA
NM
CO
SDID
CA
WA
TN
VT
MS
MT ND
NV
AZ
UT
WY
NE
KS
OK
TX
AR
MN
AL
KYVA
NY
CT
AKHI
IN
study states
control states0.03-0.15
correlation with CO
correlation with WA
-0.21-0.13
0.620.62
-0.030.37
0.470.22
0.01-0.07
-0.22-0.17
0.790.32

Crash deaths after legalization of recreational marijuana useColorado and Washington – Aydelotte et al. 2017, AJPH
study states Colorado and Washington
control states
Alabama, Indiana, Kentucky, Missouri,
South Carolina, Tennessee, Texas,
Wisconsin
calendar years January 2009-December 2015
outcome measurechanges in annual motor vehicle crash
fatality rates per billion miles traveled
result2.7% increase in fatalities
(not statistically significant)

Rising speed limits

Effects of National Maximum Speed Limit
55 mph NMSL
– 3,000-5,000 fewer deaths in 1974
– 2,000-4,000 fewer deaths in 1983
Partial repeal
– 19 percent increase in deaths on rural interstates
– 2,000 more deaths during 1987-90
Full repeal
– 17 percent increase in fatality rates on interstates
– 1,000 more deaths during 1996-97
– 12,545 more deaths during 1995-2005

Maximum speed limitsJanuary 1993
MD
DE
DC
MA
OR
RI
NJ
NH
ME
PA
WV
SC
GA
FL
OH
MI
INIL
WI
IA
MO
LA
NM
CO
SD
ID
CA
WA
TN
VT
MS
MT ND
NV
AZ
UT
WY
NE
KS
OK
TX
AR
AL
KY VA
NY
CT
AKHI
NC
MN
70 mph
75 mph
80 mph
85 mph
65 mph
60 mph
55 mph (DC only)
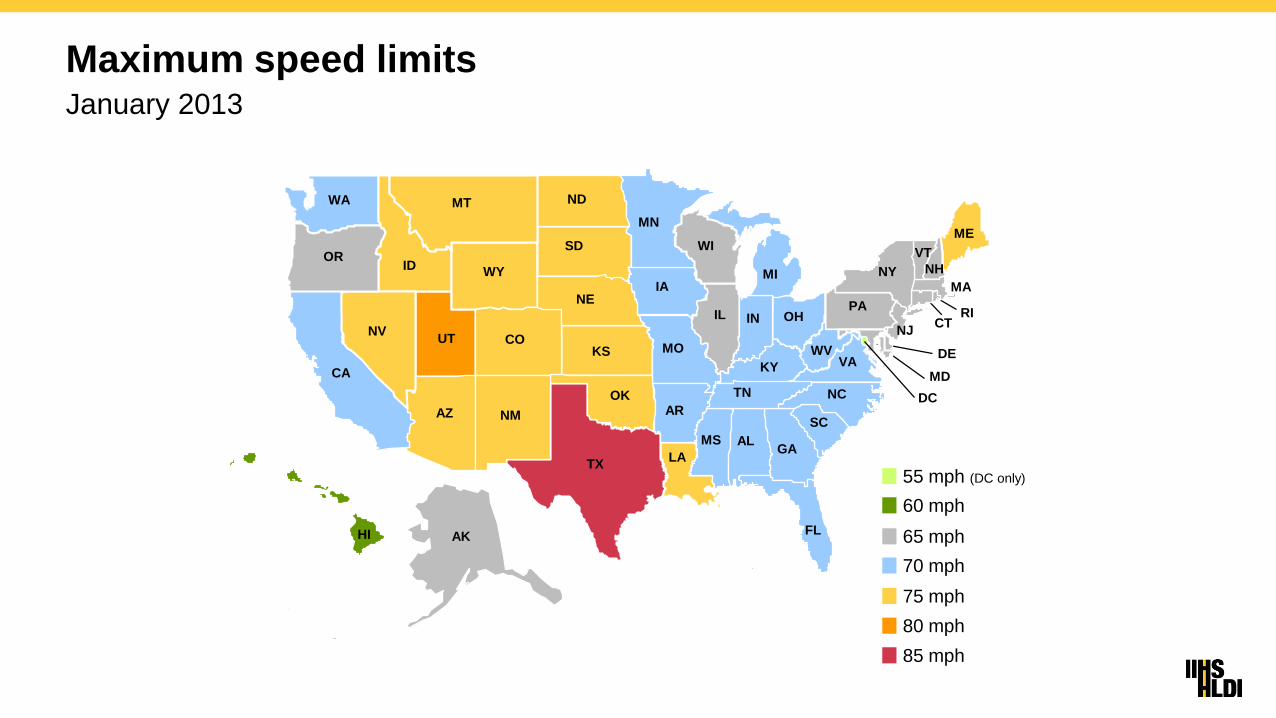
Maximum speed limitsJanuary 2013
MD
DE
DC
MA
OR
RI
NJ
NH
ME
PA
WV
SC
GA
FL
OH
MI
INIL
WI
IA
MO
LA
NM
CO
SD
ID
CA
WA
TN
VT
MS
MT ND
NV
AZ
UT
WY
NE
KS
OK
TX
AR
AL
KY VA
NY
CT
AKHI
NC
MN
70 mph
75 mph
80 mph
85 mph
65 mph
60 mph
55 mph (DC only)

Deaths and expected deaths if maximum speed limits had not increased1993-2013
28,000
32,000
36,000
40,000
44,000
1993 1995 1997 1999 2001 2003 2005 2007 2009 2011 2013
deaths
expected
1,900deaths
33,000 deaths

Summary
Speed limits continue to go up
8 percent increase in traffic fatality rate on interstates and freeways for every 5 mph
increase in maximum speed limits
– 500 additional deaths in 2013
4 percent increase on other types of roads
– 1,400 additional deaths in 2013
Approximately 33,000 lives lost due to post-NMSL speed limit increases
– Three quarters of the 43,000 lives saved by frontal airbags

Maximum speed limitsSeptember 2017
MD
DE
DC
MA
OR
RI
NJ
NH
ME
PA
WV
SC
GA
FL
OH
MI
INIL
WI
IA
MO
LA
NM
CO
SD
ID
CA
WA
TN
VT
MS
MT ND
NV
AZ
UT
WY
NE
KS
OK
TX
AR
AL
KY VA
NY
CT
AKHI
NC
MN
70 mph
75 mph
80 mph
85 mph
65 mph
60 mph
55 mph (DC only)

An unlikely headwind: automated vehicles and unrealistic expectations

Front crash prevention systems arereducing police-reported rear-end strikes
Compared with vehicles without any front crash prevention…
…vehicles with forward collision warning only are
27% less likely to rear-end another vehicle.
…vehicles with forward collision warning AND autobrake are
50% less likely to rear-end another vehicle.
If every vehicle on the road had forward collision warning with
autobrake in 2014, there would have been an estimated
1,000,000 fewer police-reported crashes
400,000 fewer police-reported injuries
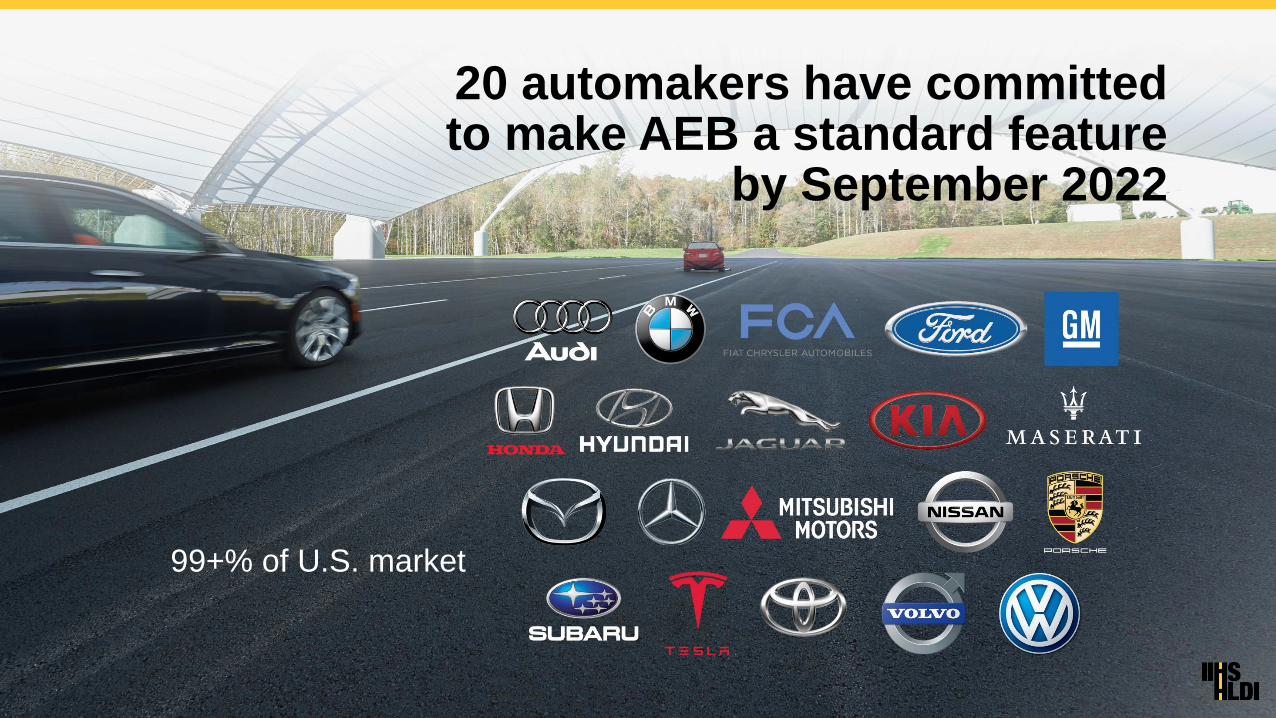
20 automakers have committedto make AEB a standard feature
by September 2022
99+% of U.S. market

Kia plans fully driverless cars by 2030-The Detroit News, January 4, 2016
Two auto suppliers join for self-driving cars by 2019-USA Today, August 23, 2016
BMW Group, Intel and Mobileye team up to bring
fully autonomous driving to streets by 2021-Reuters, July 1, 2016
Ford targets fully autonomous vehicle for ride sharing in 2021;
invests in new tech companies, doubles Silicon Valley team-Ford media center, August 16, 2016
Lyft predicts mostly self-driving cars by 2021-New York Post, September 19, 2016

0%
20%
40%
60%
80%
100%
2000 2002 2004 2006 2008 2010 2012 2014 2016
standard optional not available
New vehicle series with forward collision warningBy model year

0%
20%
40%
60%
80%
100%
2000 2002 2004 2006 2008 2010 2012 2014 2016
standard optional not available equipped
Registered vehicles with forward collision warningBy calendar year
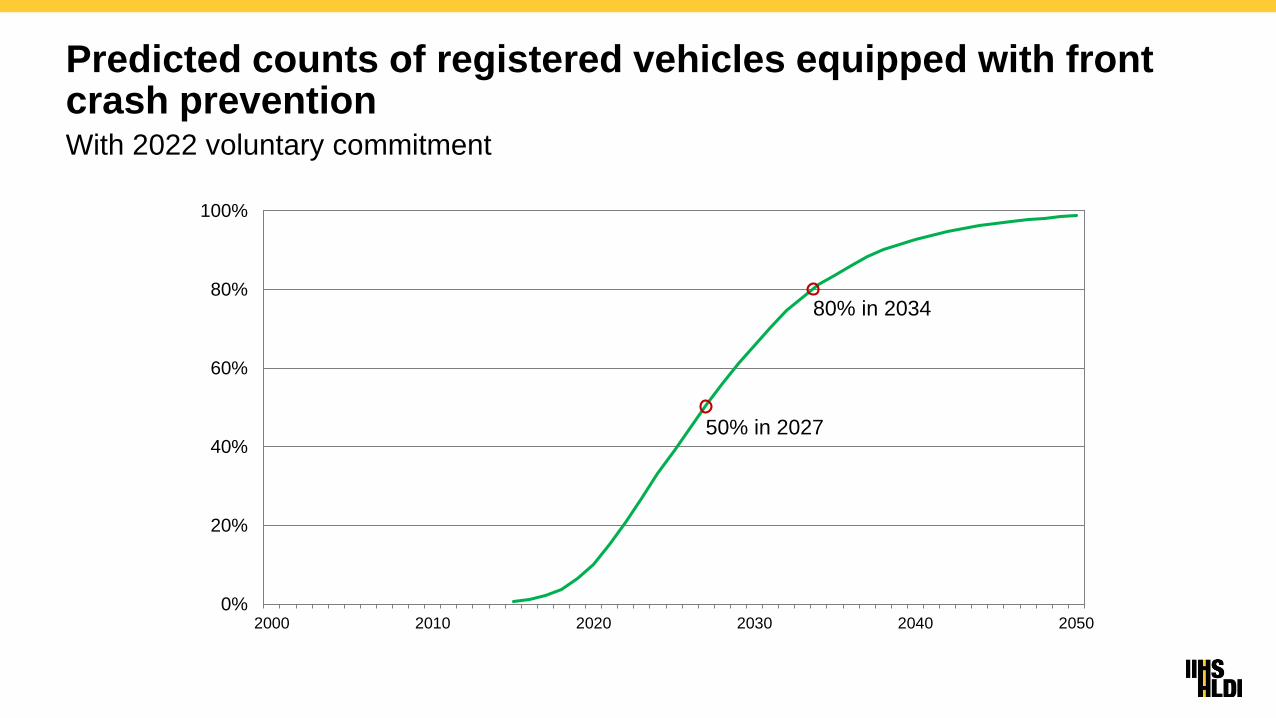
0%
20%
40%
60%
80%
100%
2000 2010 2020 2030 2040 2050
50% in 2027
80% in 2034
Predicted counts of registered vehicles equipped with front crash preventionWith 2022 voluntary commitment

Estimated registered vehicles by featureCalendar years 2016 and 2021
0%
20%
40%
60%
rear camera rear parkingsensors
blind spot lane departurewarning
forward collisionwarning
adaptiveheadlights
automaticemergency
braking
2016
2021
Driver acceptance andsafe use of automated systems

Percent of vehicle owners who reported driving with forward collision warning turned on
0
20
40
60
80
100
Toyota Volvo Dodge and Jeep
unknown
never
sometimes
always

On-off status of front crash prevention systemsBy manufacturer
percent with
system on
number
observed
Cadillac 92 206
Chevrolet 87 142
Honda 98 239
Lexus 50 8
Mazda 95 20
Volvo 94 52
total 93 667

Percent of vehicle owners who reported driving with lane-maintenance systems turned on
0
20
40
60
80
100
Volvolane departure warning
Infinitilane departure warning
Infinitilane departure prevention
Toyotalane departure prevention
unknown
never
sometimes
always

On-off status of lane-maintenance systemsBy manufacturer
percent with
system on
number
observed
Cadillac 57 207
Chevrolet 50 147
Ford/Lincoln 21 115
Honda 36 239
Lexus/Toyota 68 147
Mazda 77 26
Volvo 75 105
total 51 986
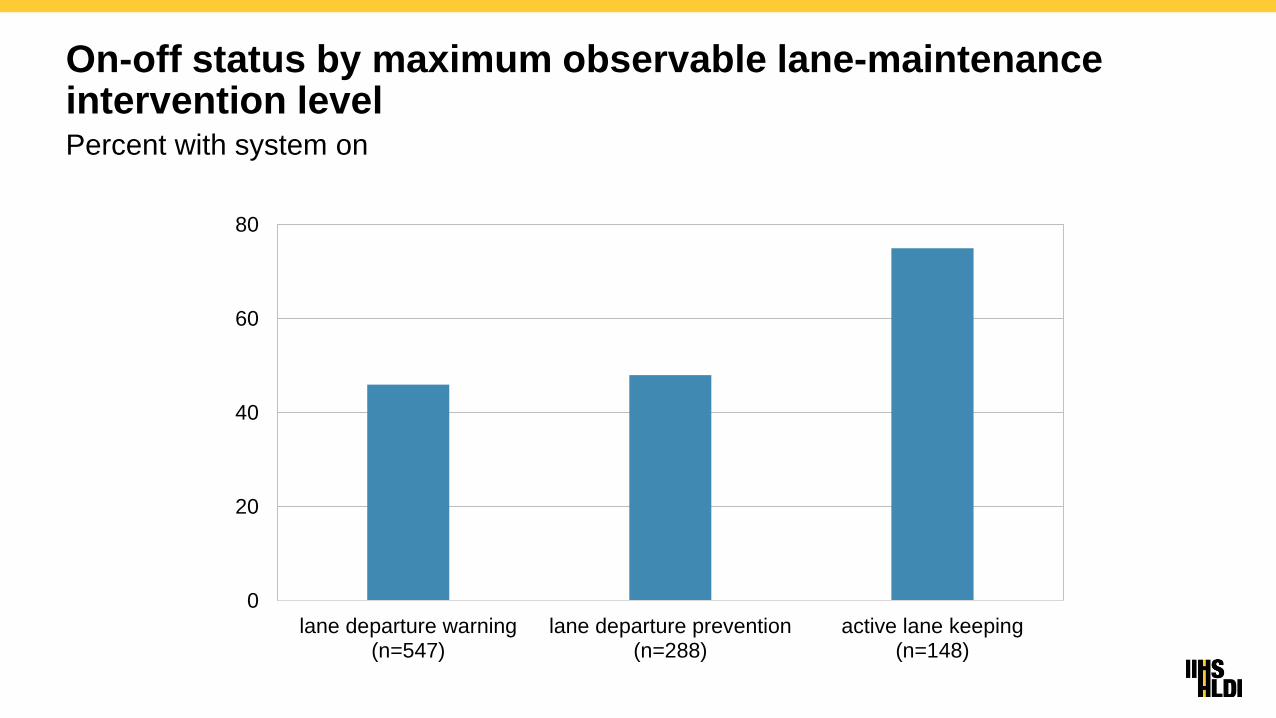
On-off status by maximum observable lane-maintenance intervention levelPercent with system on
0
20
40
60
80
lane departure warning(n=547)
lane departure prevention(n=288)
active lane keeping(n=148)

Active lane keeping ranked least in trustAverage rating and 95% confidence interval by system
side-view assist
(Honda, Audi, Infiniti)
lane departure warning
forward collision warning
active lane keeping
(Honda, Audi)
adaptive cruise control
strongly
disagree
disagree neutral agree strongly
agree
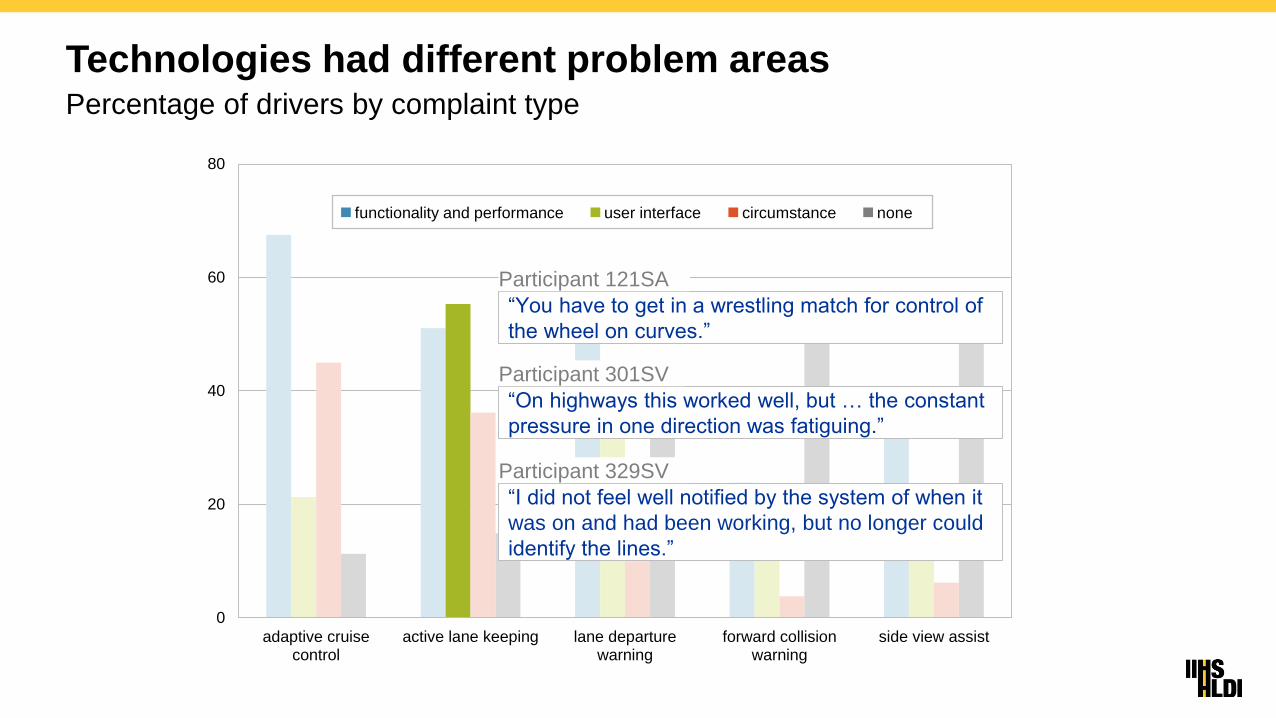
Technologies had different problem areasPercentage of drivers by complaint type
0
20
40
60
80
adaptive cruisecontrol
active lane keeping lane departurewarning
forward collisionwarning
side view assist
“You have to get in a wrestling match for control of
the wheel on curves.”
Participant 121SA
“I did not feel well notified by the system of when it
was on and had been working, but no longer could
identify the lines.”
Participant 329SV
“On highways this worked well, but … the constant
pressure in one direction was fatiguing.”
Participant 301SV
functionality and performance user interface circumstance none

Level 2 automated driving experience - issues
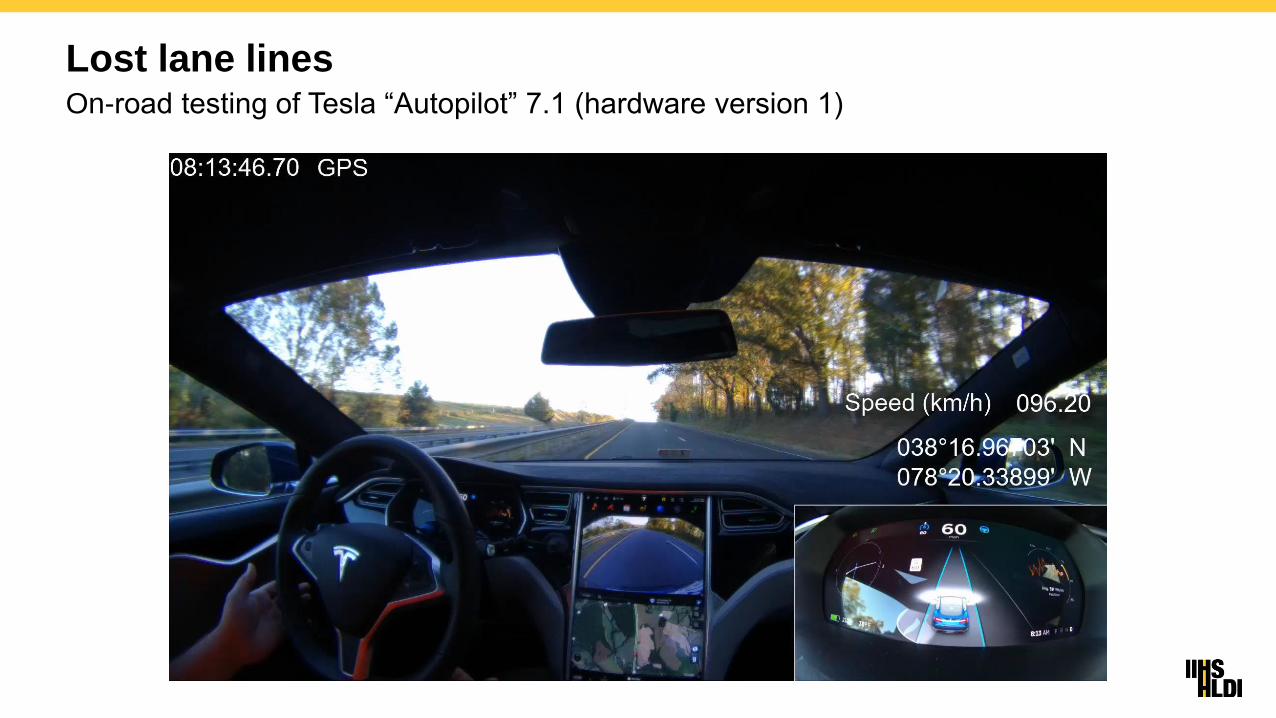
Lost lane linesOn-road testing of Tesla “Autopilot” 7.1 (hardware version 1)

Stopped lead vehicleOn-road testing – 2017 Mercedes-Benz E-Class

Much of the improved highwaysafety picture in the USA in recent decades is due toimproved crashworthiness

2012Front small
overlap
GOOD
First test year 11.5%
2017
65.6%
Roof strength
2009
GOOD
First test year 40.2%
2017
97%
2004Rear
(whiplash mitigation)
GOOD
First test year 6.2%
2017
98.2%
Side impact
2003
GOOD
First test year 7.1%
2017
96.7%
1995Front moderateoverlap
GOOD
First test year 16.2%
2017
100%
IIHS testing programs

Passenger-sidesmall overlap tests

Small overlap countermeasures are not always applied to the passenger-side
Passenger-side moderate overlap tests
of two vehicles
Moderate overlap tests indicate good
protection for the passenger and
performance is not affected by small
overlap countermeasures
Many vehicles sold and tested as
right-hand drive in other markets
Small overlap structure on driver-side

Toyota RAV-4 has driver-side only countermeasures

Driver/passenger small overlap crash ratings
driver-side
impact
passenger-side
impact
visible design
application
2016 Hyundai Tucson symmetric
2015 Buick Encore symmetric
2015 Honda CRV symmetric
2015 Mazda CX-5 symmetric
2014 Subaru Forester symmetric
2015 Nissan Rogue driver-side
2015 Toyota RAV4 driver-side

driver-side
impact
passenger-side
impact
2016 Hyundai Tucson
2015 Buick Encore
2015 Honda CRV
2015 Mazda CX-5
2014 Subaru Forester
2015 Nissan Rogue
2015 Toyota RAV4
G
P
M
M
A
A
A
G
G
G
G
G
G
G

2017 first official ratings test series: midsize cars

Driver- and passenger-side small overlap ratingsMidsize cars
driver-side
impact
passenger-side
impact
2018 Subaru Outback/Legacy
2017 Ford Fusion
2017 Honda Accord
2017 Nissan Altima
2017 Hyundai Sonata/Kia Optima
2018 Toyota Camry
2017 Nissan Maxima
2017 Mazda 6
2017 Volkswagen Jetta
2017 Volkswagen Passat
2017 Chevrolet Malibu
G
G
G
G
G
G
G
M
M
A
G
G
G
G
G
G
G
G
G
G
G
G

Range of structural performance
2017 Ford Fusion 2017 Mazda 6
GOOD ACCEPTABLE

Dummy observations2017 midsize cars
All driver dummies indicated low risk of injury
Range of injury protection for passenger dummies
– Insufficient airbag protection for passengers
In 3 vehicles, passenger dummy’s head contacted
dash and sensors measured high risk of injury
In 2 vehicles, dummy’s head moved into a gap
in airbag protection
– 2 dummies measured high risk of leg injury from
contact with the lower dash/glove box

Range of passenger restraint system performance
2017 Nissan Maxima 2017 Chevrolet Malibu
GOOD MARGINAL

Summary of passenger-side small overlap testing
More vehicles integrating small overlap countermeasures to both driver
and passenger sides
– Countermeasures are improving structural performance
In 2015 small SUV series, 3 vehicles received poor structural ratings
In current midsize car series, the worst structural rating was acceptable
– Remaining deficiencies related to restraint system performance
5 models demonstrated insufficient head protection from the frontal airbag
Results will be published in October 2017
Good or acceptable passenger-side small overlap performance a requirement
for 2018 TOP SAFETY PICK+

Side crashworthiness research

Side impact crashworthiness: what’s next?
Driver side impact fatality rates
in 1-3 year old vehicles:
– 2005: 22 per million RVY
– 2015: 5 per million RVY
5,593 passenger vehicle
occupant side-impact fatalities
in 2015
– Most not rated by IIHS
– When rated, 49% were Good
0%
20%
40%
60%
80%
100%
2003 2005 2007 2009 2011 2013 2015 2017Model Year
Good Acceptable Marginal Poor

Relevance of specific IIHS side test changes109 seriously injured occupants of Good-rated vehicles in NASS-CDS & CIREN
0%
10%
20%
30%
40%
50%
60%
70%
forward impactlocation
increasedseverity
adjust injury criteria(or use different
dummy)
include far-sidedummy
increase severityand forward impact
location
increase severityand include far-side
dummy
ca
se
oc
cu
pa
nts
aff
ec
ted
Driver sustained fatal
injuries from contact
with right door
Driver sustained
skull fracture,
possibly from
contact with
window sill
through or under
the curtain AB.
73 year old passenger sustained serious
chest injuries
Passenger sustained
fatal chest injuries; ~7”
more crush than test
75 year-old belted driver with fatal chest injuries

Research questions
Can modified laboratory test configurations predict real-world injuries that
the current IIHS SICE test does not?
– Forward impacts
– Higher severity
If so, do newer Good-rated
vehicles already perform
better than older Good-rated
vehicles?
– Less than 10% of the
NASS/CIREN case vehicles
were 2010+ models
-20
-18
-16
-14
-12
-10
-8
-6
-4
2002 2006 2010 2014 2018
Ave
rage
cru
shre
lati
ve t
o s
eat
cen
terl
ine
(cm
)
Vehicle model year
SICE B-pillar crush: Good-rated vehicles

Test matrix
Camry vs. 2007 Fit chosen to replicate
NASS-CDS case
WorldSID 50-M with RibEye deflection
measurement system used in all tests
– Better representation than SID-IIs of case
occupant anthropometry
– Ribeye allowed comparison of oblique
thoracic loading33 km/h
88 km/h
Impact configuration for tests A & C
Struck
Honda Fit
model year
Configuration
Fit moving 33 km/h;
striking 1999 Camry @
88 km/h, 19 cm forward
of front axle
Standard SICE
(MDB @ 50 km/h) MDB @ 60 km/h
2007 A B
2015 C D E

Results: real-world case vs. reconstruction test
(All measurements in cm)
0%
20%
40%
60%
80%
100%
Head AIS4+(using HIII
curve)
ShoulderAIS2+
Thorax AIS3+ AbdomenAIS2+
Pelvis AIS2+
WorldSID predicted injury risk for 75 year-old
NASS-CDS case
occupant
75-year-old male, 185 cm, 104 kg, belted, fatally
injured
AIS ≥ 2 injuries AIS 5 Bilateral flail chest
AIS 4 Trachea perforation
AIS 3 Pulmonary artery laceration
AIS 3 Left lung contusion, laceration, hemothorax
AIS 2 Spleen laceration

Results: test comparison(structure)
NASS configuration
– Most intrusion forward of
H-point
– No B-pillar intrusion
– 2015 less intrusion than 2007
SICE tests
– Peak intrusion centered near
H-point and B-pillar
– 2015 less intrusion than 2007
– 2015 less B-pillar intrusion at 60 km/h
than 2007 at 50 km/h
– 2015: 5-10 cm more intrusion at 60
km/h than at 50 km/h
Mid-door side contours B-pillar profiles (inboard edge)
0%
20%
40%
60%
80%
100%
Head AIS4+(using HIII
curve)
Shoulder AIS2+ Thorax AIS3+ AbdomenAIS2+
Pelvis AIS2+
WorldSID predicted injury risk for 45 year-old
A B C D E
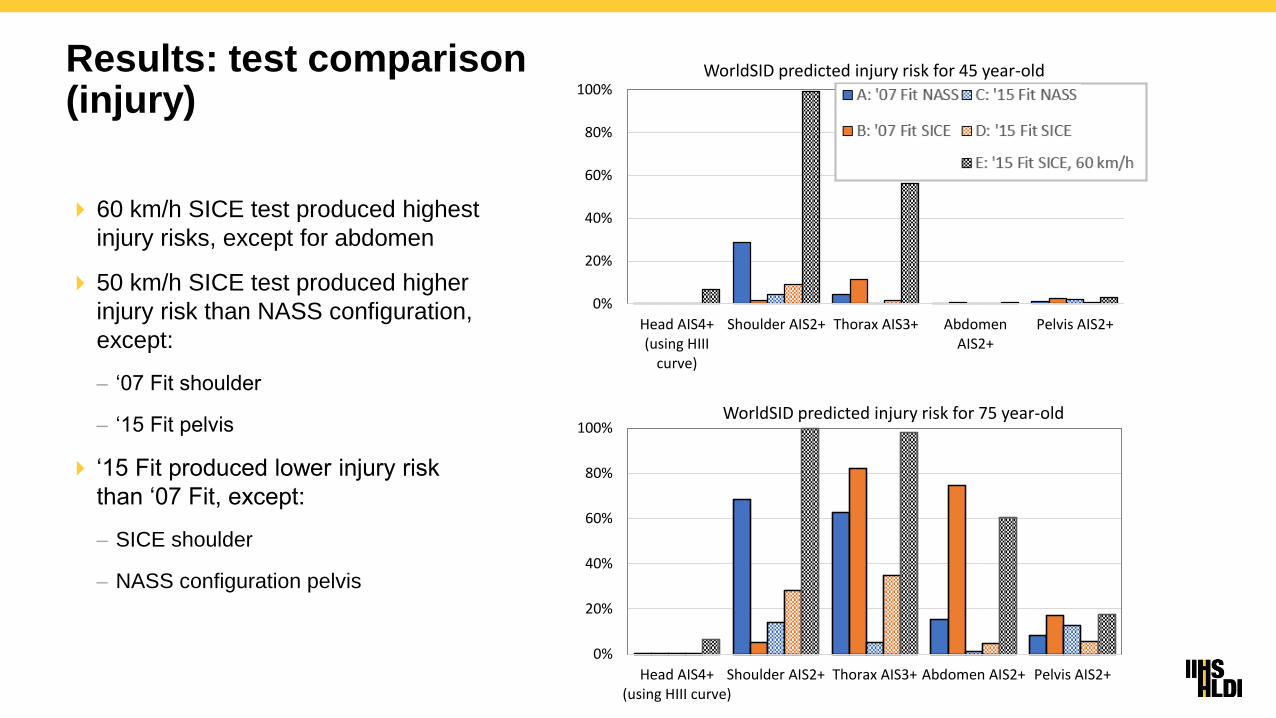
Results: test comparison(injury)
60 km/h SICE test produced highest
injury risks, except for abdomen
50 km/h SICE test produced higher
injury risk than NASS configuration,
except:
– ‘07 Fit shoulder
– ‘15 Fit pelvis
‘15 Fit produced lower injury risk
than ‘07 Fit, except:
– SICE shoulder
– NASS configuration pelvis
0%
20%
40%
60%
80%
100%
Head AIS4+(using HIII curve)
Shoulder AIS2+ Thorax AIS3+ Abdomen AIS2+ Pelvis AIS2+
WorldSID predicted injury risk for 75 year-old

Results: RibEye data
All tests produced overall rib displacement in
oblique posterior-to-anterior direction
NASS configuration tests A & C showed only
slight initial displacement in the anterior-to-
posterior direction
Unknown whether loading direction controlled
by ATD design or rotation around pre-
tensioned belt
Regardless of cause, ATD did not identify
unique injury mechanism in NASS
configuration-20
0
20
40
60
80
100
80100120140160 Lon
gitu
din
al d
ista
nce
fro
m c
ente
r o
f ri
b (
mm
)
Lateral distance from ATD midsagittal plane (mm)
X-Y displacement of middle RibEye LED on thoracic rib with greatest deflection
A B C D E
An
teri
or
→

Conclusions
While NASS reconstruction showed general agreement with real-world case, the injury
risk for most body regions was lower than in the current SICE test
These tests do not justify an evaluation program with a more forward impact location
– The higher impact speed would produce greater injury risks at the current impact location
Vehicle designs continue to improve beyond requirements for Good SICE rating;
the distribution of injury-producing crash configurations likely is different for current
vehicle designs
A higher SICE impact speed would likely drive more restraint system changes than
structural changes; potential tradeoffs would need to be considered

More information and links to our YouTube channel and Twitter feedat iihs.org
iihs.org
Adrian Lund, [email protected]