Heading Goes Here - Home | ANZ Shareholder Centreshareholder.anz.com/sites/default/files/Roadshow...
111
Investor Discussion Pack NOVEMBER 2013
Transcript of Heading Goes Here - Home | ANZ Shareholder Centreshareholder.anz.com/sites/default/files/Roadshow...

Investor Discussion Pack
NOVEMBER 2013
Delivering for shareholders and customers
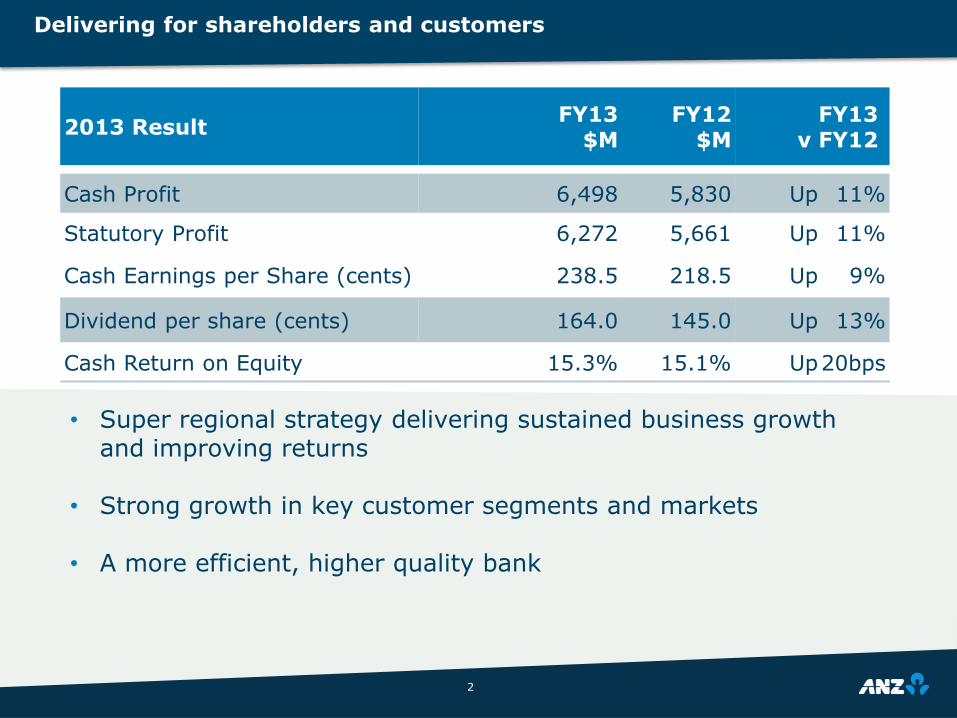
• Super regional strategy delivering sustained business growth and improving returns
• Strong growth in key customer segments and markets
• A more efficient, higher quality bank
2
2013 ResultFY13
$MFY12
$MFY13
v FY12
Cash Profit 6,498 5,830 Up 11%
Statutory Profit 6,272 5,661 Up 11%
Cash Earnings per Share (cents) 238.5 218.5 Up 9%
Dividend per share (cents) 164.0 145.0 Up 13%
Cash Return on Equity 15.3% 15.1% Up20bps

3
SUPER REGIONAL STRATEGY
STRONG CORE
MARKETS
PROFITABLE ASIAN
GROWTH
ENTERPRISE APPROACH
STRONG LIQUIDITY AND CAPITAL MANAGEMENT
DISCIPLINED AND EXPERIENCED MANAGEMENT

1. Includes Asia Private Bank. 2. Total estimated Asia based staff of CBA, Westpac and NAB. 3. The Greenwich Quality Index score is based upon a normalized composite of all qualitative evaluations transformed to a scale of 0 to 1,000 with the difference from the average shown. Note: Cross-hairs are calculated by the average of the banks shown in graph.
A top 4 Corporate Bank in Asia
6% 12%
11%
11%
17%
24%
17%
0%
10%
20%
30%
40%
50%
60%
70%
-75 -50 -25 0 25 50 75
Import
ant
Rela
tionship
s
Bank A
Bank B
Bank C
Bank F
Bank E
Bank D
Bank I
Bank H
Bank G
2012
Greenwich Quality Index3 - Overall Relationship Quality (Difference from the Average)
2011
2010
8,830 ~4,000
7,635
ANZ AustralianDomestic Peers
Asia Staff (FTE)
4
ANZ has built a substantial business in Asia
16,465
Global Hubs
Significantly larger presence than domestic peers
Greenwich Associates Large Corporate Survey Overall Relationship Quality
We have built scale, capability and momentum in Asia
322
622
877
1,257
1,840 2,109
2,243
FY07 FY08 FY09 FY10 FY11 FY12 FY13
Asia Operating Income1 USDm
38% CAGR
2
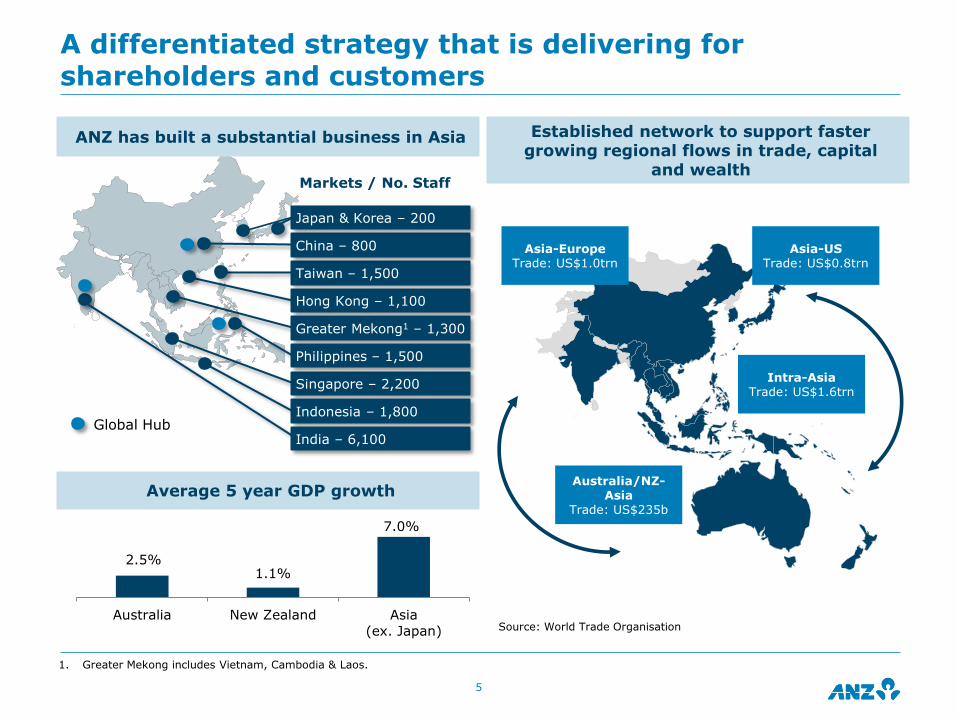
A differentiated strategy that is delivering for shareholders and customers
5
Singapore – 2,200
Indonesia – 1,800
India – 6,100
Hong Kong – 1,100
Taiwan – 1,500
China – 800
Greater Mekong1 – 1,300
Philippines – 1,500
Japan & Korea – 200
Markets / No. Staff
Global Hub
ANZ has built a substantial business in Asia
Average 5 year GDP growth
2.5% 1.1%
7.0%
Australia New Zealand Asia
(ex. Japan)
Established network to support faster growing regional flows in trade, capital
and wealth
Intra-Asia Trade: US$1.6trn
Asia-US Trade: US$0.8trn
Asia-Europe Trade: US$1.0trn
Australia/NZ-Asia
Trade: US$235b
Source: World Trade Organisation
1. Greater Mekong includes Vietnam, Cambodia & Laos.

9% Increase in economic capital allocated to Australia Retail
68% Branch sales staff now accredited to sell home loans
30% Branch sales staff accredited to sell Wealth products
201 Smart ATM‟s installed
16% Increase in branch Home Loan sales
50,000 New Smart Choice superannuation customers
Strengthening Australia – Retail & Wealth
Retail Market Share1
Wealth Products Sold Through Retail Distribution
1. Source: Roy Morgan Research: rolling 12 months, traditional banking consumer market (Deposits, Cards & Loans). All years as at August
6
173
206
FY12 FY13
Thousands+19%
12.4%
13.1%
13.7%
14.4%
2010 2011 2012 2013

85 Products removed as part of simplification
31% Increase in Kiwisaver FUM, 81% of sales via branches
7% Increase in branch coverage since 20101
7% Reduction in branch expenses
60% Auckland sales staff relocated to match market opportunities
10% Total New Zealand FTE
Strengthening New Zealand – Retail & Wealth
7
1. Branch coverage measures the areas in which ANZ is represented relative to where New Zealanders do business
Retail Income per Branch
Retail Income per FTE
3.5
4.7
FY10 FY13
NZDm +34%
269
356
FY10 FY13
NZD
thousands +32%

9% Increase in economic capital allocated to Australia
30,000 Growth in Australia customer numbers1
13% Growth in New Zealand Small Business customers
Strengthening Institutional and Commercial in Australia & New Zealand
8
Corporate & Commercial Banking Australia Combined Lending and Deposit Growth2
5% Reduction in Aust/NZ operating expenses
6% Reduction in FTE Aust/NZ
36% Increase in income referred to Asia
38.0%
Drive productivity in Institutional
Grow Commercial
Institutional Australia & New Zealand Cost to Income Ratio
1. Excludes Esanda; 2. Source: Lending - RBA Lending and Credit Aggregates and Deposits – APRA Monthly Banking Statistics, Non-Financial Corporations
8.5%
16.3%
System ANZ
1.9x
36.3%36.2%
35.7%
FY11 FY12 FY13
Ex-software Impairment

11% Institutional Asia customer growth
35% ANZ Transactive customer growth
96% ANZ Transactive monthly transaction volume growth
24% Increase in capital allocated to Asia Trade
74% % Institutional Asia portfolio with tenor < 1 year
270bps1 Decline in Asia cost to income
Drive Capital Efficiency
Build Scale
Profitable Growth in Asia
9
Asia Customer Growth FY13 v FY12
Asia Volume Growth FY13 v FY12
1. Adjusted for FX and prior period one-off items, unadjusted down 710bps
16%
32%
66%
PCM Deposits Trade Lending FX Turnover
6% 7%
12%
16%19%
Agriculture Financial
Institutions
Resources Global
Diversifieds
Commercial

1. New to bank trade led customers using Markets and Payments & Cash Management Products
Trade a key driver of return
Natural cross sell product for Cash and Markets
10
With strong utilisation by new to bank Trade led customers
What Customers Want
On the ground presence
Risk and liquidity appetite
Processing expertise
What ANZ Likes
Quality multinational customer base
Short duration
High quality, high probability cross-sell
62%
47%
8%
Markets Cash Global Loans
$1.00
$2.08
$0.57
$0.51
Trade
Income
Markets Cash Combined
Income
% New Trade Customers utilising
$1 of Trade income = $1.08 of Cross-Sell1
Cross-Sell Income

Productivity
11
Operations Volume Growth FY13 v FY12
Operations Expense Growth FY13 v FY12
Transaction Quality, Manual Payments Defects Per Million
Straight Through Processing Aust/NZ % of Total Transactions
865
670
495 400
180
2H11 1H12 2H12 1H13 2H13
68%
76%83%
~90-95%
FY11 FY12 FY13 Global BestPractice
5%
7%8%
12%
Australia NewZealand
IIB GlobalWealth
-10%
-6%
-11%
-7%
AustraliaNew
Zealand IIBGlobalWealth

Credit Quality
12
Group Provision Charge
Group Impaired Assets
% Institutional Exposure At Default
48% Exposures < 1 year Tenor
78% Investment Grade Exposures (68% in 2010)
29% Asia Exposures 74% <1 year tenor
39% Global Loans (47% in 2010)
41% Average Credit RWA rate (54% in 2010)1
Institutional diversification delivering improved credit quality
1. Basel 2 basis
5.6
6.6
5.65.2
4.3
Sep 09 Sep 10 Sep 11 Sep 12 Sep 13
$b
3.06
1.82 1.21 1.25 1.20
0.85%
0.50%
0.32% 0.30% 0.27%
FY09 FY10 FY11 FY12 FY13
$b Provision Charge
Provision Charge as % Avg. Net Advances

Capital efficiency
13
Return on Equity Movement FY13 v FY12
Economic Profit Movement FY13 v FY12
$4.5 billion
Organic capital generated in FY13
7bps Return on Risk Weighted Assets increase1
Proactive allocation of resources
200bps Average Credit RWA rate (CRWA/EAD)1
510bps 3 year DPOR increase
Neutralised Dividend Reinvestment Plan
1. Basel 2 basis
15.1%
15.3%
0.25%0.10%
0.60%
0.05%
FY12 FX
Impact
FVA
Impact
Increase
in RoA
Reduced
leverage
FY13
2,370
2,701 284
46
93
FY12 Cash Profit
net of Cost
of Capital
Economic
Credit Cost
Imputation
Credits
FY13
$m

14
CEO Priorities
Improving customer
experience
Diversifying revenue
Improving productivity
Improving returns
Strategic Focus
Proactive capital allocation Further improve productivity in NZ
Build share in Australia Use scale to lower unit cost
Grow Institutional businesses aligned to trade and capital flows
Maintain risk appetite
FY14 Outlook
Revenue Growth ~4-5%
Expense Growth ~2%
Stable Risk Above Peer
EPS Improved
ROE

Operating Income Mix by Line of Business Operating Income Movement FY13 v FY12
Income by Line of Business
* FY12 operating income adjusted to exclude the gain on Visa share sale ($291m)
15
17,557
18,378
655
231
133
68
FY12 N
orm
alised
Fin
ancin
g &
Capital
Managem
ent
Ris
k M
anagem
ent
Paym
ents
& C
ash
Managem
ent
Oth
er
FY13
$m Growth in Mortgages
(margin and volume growth)
and Loans (higher volume)
60% 61%
15% 16%
19% 18%
6% 5%
FY12
Normalised
FY13
Financing & Capital Management
Risk Management
Payments & Cash Management
Other
Lower margin in Cash Management & Term Deposits
Driven by FX turnover
• Term Deposits
• Merchant Acquiring
• Clearing & International Payments
• Cash Management & Savings Accounts
• FX & Commodities
• Life Insurance
• General Insurance
• Wealth Distribution and Advice
• Mortgages
• Personal Loans
• Trade & Supply Chain
$17.6b $18.4b
• Rates & Credit
• Equity Derivatives
• Investments & Superannuation
• Cards
• Business Loans
• SpecialisedFinance
*
*

Income by Division and Geography
16
Operating Income Mix by Division (FY13) Operating Income Mix by Geography (FY13)
1. Network revenue represents income booked in a jurisdiction different from where a client relationship is managed
27%
17%
12%
9%
8%4%
2%1%
6%
6%
3%
3%
1%1%
44%
36%
12%
8%
17%
16%67%
Australia
IIB
Australia Retail
GlobalMarkets
GlobalLoans
New ZealandCommercial
New ZealandRetail
FundsManagement
AustraliaCorporate & Commercial
TransactionBanking Retail Asia
PacificAsia Partnerships
Insurance
Private Wealth
AustraliaNew Zealand
APEA
FY13 Network Revenue1 from APEArepresented 21.4% of Group Operating Income
Other
Other
Global Wealth
NewZealand

Customer Deposits by Geography
Balance Sheet composition by Geography
17
Customer Lending1 by Geography
1. Customer lending represents Net Loans & Advances including acceptances
57%
26%
17%
30%
12%
15%
4%22%
9%
5%
3%68%
13%
19%
42%
2%
14%
10% 2%
11%
11%
7%
1%
Australia
APEA
AustraliaRetail & Wealth
AustraliaInstitutional
NZCommercial
New ZealandRetail & Wealth
New Zealand Institutional
AustraliaCommercial
APEARetail & Wealth
Australia
APEA
NewZealand
Australia Retail Mortgages
AustraliaCommercial
AustraliaInstitutional
NZCommercial
New ZealandRetail & Wealth
New Zealand Institutional
AustraliaOther Retail
APEARetail & Wealth
APEA Commercial& Institutional
APEA Commercial& Institutional
NewZealand

Customer Deposits by Segment
Balance Sheet composition by Segment
18
Customer Lending1 by Segment
1. Customer lending represents Net Loans & Advances including acceptances
43%
17%40%
30%
4%
9%
12%
5%
15%
22%
3%58%
21%
21%
45%
2%
11%
14%7%
10%
10%
1% Retail & Wealth
Commercial
Institutional
Australia Retail & Wealth
New ZealandRetail & Wealth
AustraliaCommercial
APEA Institutional
Australia Institutional
New Zealand Institutional
APEA Retail & Wealth
New ZealandCommercial
Retail & Wealth
Commercial
Institutional
Australia Retail & Wealth
New ZealandRetail & Wealth
AustraliaCommercial
APEA Institutional
Australia Institutional
New Zealand Institutional
APEA Retail & Wealth
New ZealandCommercial
APEACommercial

Return on Equity
1. Capital calculated in accordance with APRA Standards. Capital represents Converted Basel 3 Average RWA plus Average Capital Deductions (i.e. partnership investment)
Basel 3 Capital Usage Mix IIB Return on Equity (Regulatory Capital Basel 3)1
19
Transaction Banking
Global Markets
Global Loans
Partnerships
Retail
Other
11%
14%
10%
20%
16%
10%
11%
12%
14%
11%
18%
17%
11%
7%
IIB Division
Institutional
Global Loans
Transaction Banking
Global Markets
Partnerships
Retail Banking
FY12 Basel 3 Proforma FY13 Basel 3
37% 34%
15%17%
22% 23%
18% 19%
3% 3%
5% 5%
FY12 FY13

ANZ A RECOGNISED LEADER IN SUSTAINABILITY
72% ANZ Employee Engagement up from 70% in FY12
38% Women in management, steady since FY12
5,286 IIB lenders who completed Social & Environmental training since introduction in 2011
49,259 People reached through financial education programs in FY13; 240,000 in the past 10 years
Rated most sustainable bank globally in the 2013 Dow Jones Sustainability Index for the sixth time in seven years
DJSI assesses business management practices including corporate governance, risk management,
customer relations, brand management, human resources policies and practices, corporate community investment, climate change mitigation and environmental performance.
Dow Jones Sustainability Index FY10-FY13
20
92 92 93 93
51 53
59 58
92 91 93 93
FY10 FY11 FY12 FY13
ANZ Global Banks Average Score Lead score

Group Treasury

Strong Balance Sheet profile
47bps APRA Basel 3 CET1
76bps Internationally Harmonised CET1
62% Customer Funded Balance Sheet
$24b Term Wholesale Funding issued, 29% to Domestic investors
Lowest funding gap of Australian major banks
$7b Total Liquidity Portfolio
~60% FX earnings hedges in place for FY14
FY13 v FY12
All growth rates reflect FY13 v FY12 22
8.0% 8.5%
10.0% 10.8%
Sep 12 Sep 13
APRA CET1 Internationally Harmonised CET1
Capital
Stable Funding Mix
8% 8%
61% 62%
12% 12%5% 3%14% 15%
Sep 12 Sep 13
SHE & Hybrid Debt Customer FundingTerm Debt >1yr Term Debt <1yrST Wholesale Funding

Basel 3 CET1
Capital levels remain well positioned
CET1 Tier 1 Total Capital
Sep 13 APRA 8.5% 10.4% 12.2%
10% allowance for investments in insurance subs and ADIs 0.8% 0.8% 0.7%
Mortgage 20% LGD floor and other measures 0.5% 0.6% 0.7%
IRRBB RWA (APRA Pillar 1 approach) 0.5% 0.6% 0.7%
Up to 5% allowance for deferred tax asset 0.3% 0.2% 0.2%
Other capital items 0.2% 0.2% 0.2%
Sep 13 Internationally Harmonised 10.8% 12.8% 14.7%
Capital position reconciliation under Basel 3
Capital Overview
• Capital generation and initiatives in FY13 have lifted capital levels by 47bps (APRA CET1) and 76bps (Internationally Harmonised CET1)
• The group is well placed in regards to capital targets and remains focused on driving further efficiencies
• Dividend Payout to remain towards upper end of 65% - 70% range (Cash Earnings) in the near term, 69.3% in FY13
• DRP/BOP will again be neutralised via on-market buyback
23
4.5%
CET1 Minimum
2.5%
Capital Conservation Buffer7.5% 8.0% 8.5%
9.5%10.0%
10.8%
Sep 11 Sep 12 Sep 13
InternationallyHarmonised
APRA

Capital levels have increased in FY13
1. Cash earnings net of pref shares. 2. Includes impact of expected loss versus eligible provision shortfall 3. Includes capital retention of deconsolidated entities, capitalised software and other intangibles. 4. Includes refinance of ANZ Wealth (1H13) and ANZ LMI (2H13). 5. Includes net FX, Non-Cash NPAT items, net deferred tax assets.
CET1 – APRA (Sep 2013 v Sep 2012)
CET1 – APRA (Sep 2013 v Mar 2013)
24
8.028.49
2.060.24
0.350.27
1.16 0.05
Sep-12 CashNPAT (1)
RWAUsage (2)
Non RWABusinessUsage (3)
CapitalInitiatives (4)
Dividends(net DRP)
Other (5) Sep 13
+47bps
8.188.49
1.03 0.08
0.08 0.110.62
0.01
Mar 13 CashNPAT (1)
RWAUsage (2)
Non RWABusinessUsage (3)
CapitalInitiatives (4)
Dividends Other (5) Sep 13
+31bps

Funding mix has stabilised
Shortened asset tenor
Liquidity position has benefitted from an improvement in both funding mix and asset profile
25
7% 8% 8%
50%
61% 62%
14%
12% 12%7%
5% 3%
22%14% 15%
Sep 08 Sep 12 Sep 13
SHE & Hybrid Debt Customer Funding
Term Debt >1yr Term Debt <1yr
ST Wholesale Funding
29% 19% 18%
4% 3% 3%
80%74% 73%
1%
3% 3%
8%
6% 8%
7%14% 13%
Sep 08 Sep 12 Sep 13
Other Fixed Assets Lending
Trade Loans Other ST Assets
Liquid Assets
16% 23% 24%

Lowest structural funding gap of major domestic peers, providing flexibility
Source: APRA (Aug 13) and latest bank published financial statements
Peer Funding Comparison
ANZ Westpac NAB CBA
Loan – Deposit Ratio (%) 127% 145% 145% 139%
Loan – Deposit Gap ($b) 101 162 153 157
Australia Household Funding Gap ($b) 115 181 129 174
Loan – Deposit Gap Benefits of a lower Funding Gap
● Improved capability to manage periods of market volatility
● Lessens reliance on offshore wholesale markets – a key focus of Rating Agencies
● Enables ANZ to be a regular, but not too frequent, issuer in offshore benchmark markets
● Provides greater flexibility for ANZ to manage changes in system credit growth
26
75
100
125
150
175
200
Mar 12 Sep 12 Mar 13 Sep 13
ANZ Westpac NAB CBA
$b
52b49b

A sustainable term wholesale funding profile
Term Wholesale Funding Profile
Includes transactions with a call date or maturity date greater than 12 months at time of issue. Excludes Hybrids.
27
Maturities Issuance
$b
Annual indicative issuance volume
2624
16
26
24
16
21
18
13 12
11
FY09
FY10
FY11
FY12
FY13
FY14
FY15
FY16
FY17
FY18
FY19+
Senior Unsecured Covered Bonds Government Guaranteed Tier 2

…which is well diversified
28
Term Wholesale Funding Portfolio Cost
FY13 Term Debt Issuance (by Investor Location)
Term Wholesale Funding Portfolio (by Type)
Term Wholesale Funding Portfolio (by Currency)
0bp
50bp
100bp
150bp
Sep 09 Sep 10 Sep 11 Sep 12 Sep 13 Sep 14
Actual portfolio cost
Forecast portfolio cost basedon current market levels
29%
29%
21%
18%
3% Domestic
North America
Europe
Asia
Other
72% 69% 68%
13% 18%20%
9% 6%8% 9% 8%
Sep 11 Sep 12 Sep 13
Tier 2
Government
Guaranteed
Covered
Bonds
Senior
Unsecured
33%
36%
19%
11%1%Domestic(AUD, NZD)
North America
(USD, CAD)
Europe(EUR, GBP, CHF)
Asia (JPY, HKD, SGD,
CNY)
Other

Strong liquid asset position
Basel 3 Liquidity Rules Update
● In August, APRA provided further details on their approach to Basel 3 Liquidity implementation relating to High Quality Liquid Assets (“HQLA”)
● Each ADI needs to hold their relative component of the available HQLA in the system
● The RBA have indicated that the current aggregate holdings of HQLA at an industry level is appropriate
● Final mix of HQLA and Committed Liquidity Facility (CLF) for individual banks is still to be determined by APRA
29
Liquidity Portfolio
47
6267
13
151631
38
39
Sep 11 Sep 12 Sep 13
Internal RMBS
Private Sector Securities & Precious Metals
Cash, Government & Semi-Government Securities
91
$b
115
122

Impact of the lower $A
Funding impact
A lower $A has a favourable impact on ANZ‟s funding activities:
• Results in cash inflows under the cross currency swaps in place for the existing foreign currency wholesale funding
• Future foreign currency wholesale funding requirements are lower to meet the same $A funding task
30
FY14 foreign currency hedging
• The key objective of hedging is to manage short term EPS volatility arising from foreign currency earnings
• Hedging currently in place to meet FY14 foreign currency earnings: ~50% of USD earnings and ~65% of NZD earnings
• At 30 September hedging levels, expected EPS impact on FY14 earnings (inclusive of hedges) is positive ~1% of earnings
• Sensitivity to a 5% appreciation of the AUD would negatively impact FY14 EPS by ~0.7% of earnings
0.7%0.5%
1.9%
0.9%
2H13 v 1H13 FY13 v FY12
Inclusive of Hedging Unhedged
FY13 Earnings Per Share (EPS) impact
Earnings Composition by Currency
AUD
62%
NZD
19%
Other
19%
USD
CNY
IDR
INRPGK
MYRTWD
Other
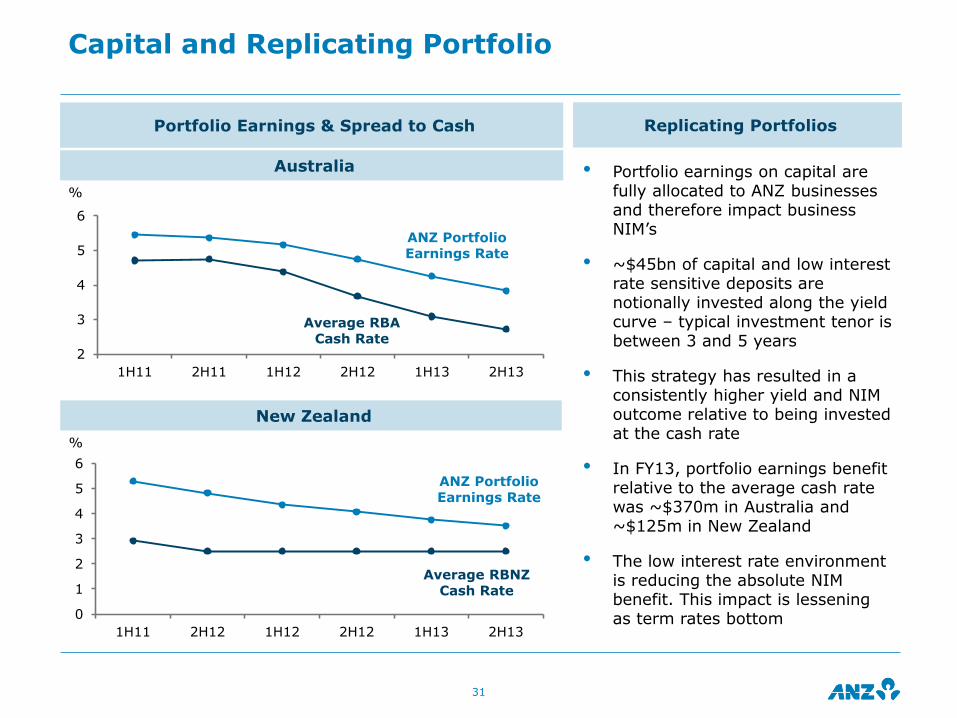
Capital and Replicating Portfolio
Replicating Portfolios
• Portfolio earnings on capital are fully allocated to ANZ businesses and therefore impact business NIM‟s
• ~$45bn of capital and low interest rate sensitive deposits are notionally invested along the yield curve – typical investment tenor is between 3 and 5 years
• This strategy has resulted in a consistently higher yield and NIM outcome relative to being invested at the cash rate
• In FY13, portfolio earnings benefit relative to the average cash rate was ~$370m in Australia and ~$125m in New Zealand
• The low interest rate environment is reducing the absolute NIM benefit. This impact is lessening as term rates bottom
Portfolio Earnings & Spread to Cash
Australia
New Zealand
31
2
3
4
5
6
1H11 2H11 1H12 2H12 1H13 2H13
%
ANZ Portfolio Earnings Rate
Average RBA Cash Rate
0
1
2
3
4
5
6
1H11 2H12 1H12 2H12 1H13 2H13
%
ANZ Portfolio Earnings Rate
Average RBNZ Cash Rate

Risk Management

Strong credit quality
33
Credit Quality Trends FY13 v FY12
Provision Charge
Impaired Assets
100bps Collective Provision coverage1
5% Total Provision charge
18% Gross Impaired Assets
22% New Impaired Assets
200bps Average Credit RWA rate (CRWA/EAD)2
1. Collective Provision coverage on an APRA Basel 3 basis. This ratio is the collective provision balance as a proportion of Credit Risk Weighted Assets 2. Credit RWA measured on a Basel 2 basis
FY09 FY10 FY11 FY12 FY13
New Impaired Assets
0
1,000
2,000
3,000
4,000
5,000
6,000
7,000
Sep
09
Sep
10
Sep
11
Sep
12
Sep
13
$m
Gross Impaired Assets
0.85%
0.50%
0.32% 0.30% 0.27%
-500
500
1,500
2,500
3,500
FY09 FY10 FY11 FY12 FY13
$m Individual Provision Charge (LHS)
Collective provision Charge (LHS)
Total Provision Charge as % Avg. net Advances
Avg. $0.8b decline YOY since Sep 10
34
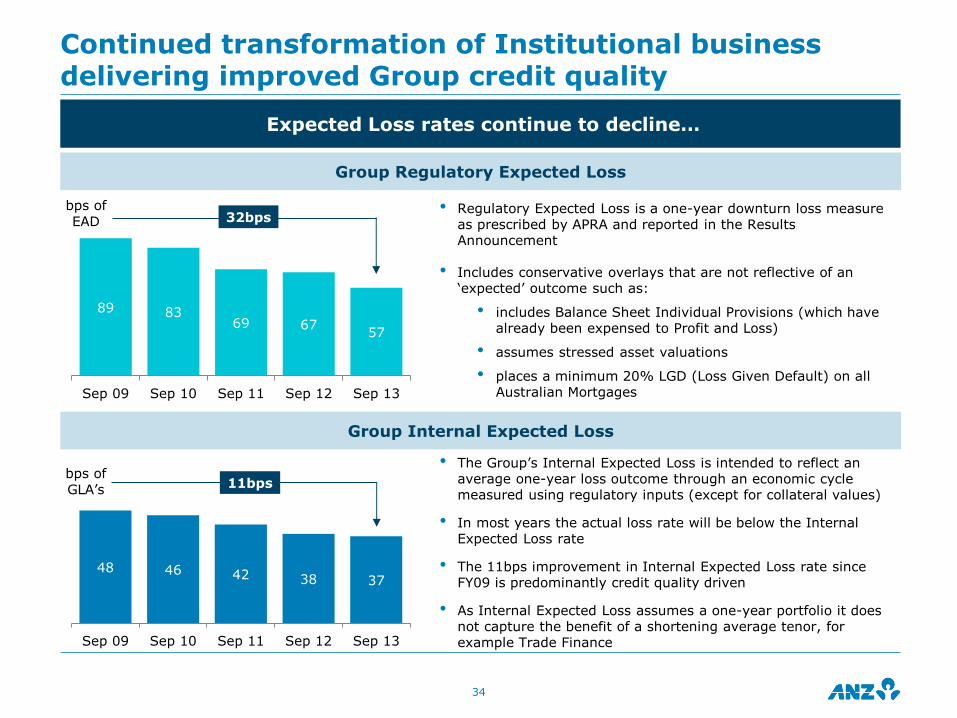
Expected Loss rates continue to decline…
Group Regulatory Expected Loss
Group Internal Expected Loss
Continued transformation of Institutional business delivering improved Group credit quality
• Regulatory Expected Loss is a one-year downturn loss measure as prescribed by APRA and reported in the Results Announcement
• Includes conservative overlays that are not reflective of an „expected‟ outcome such as:
• includes Balance Sheet Individual Provisions (which have already been expensed to Profit and Loss)
• assumes stressed asset valuations
• places a minimum 20% LGD (Loss Given Default) on all Australian Mortgages
• The Group‟s Internal Expected Loss is intended to reflect an average one-year loss outcome through an economic cycle measured using regulatory inputs (except for collateral values)
• In most years the actual loss rate will be below the Internal Expected Loss rate
• The 11bps improvement in Internal Expected Loss rate since FY09 is predominantly credit quality driven
• As Internal Expected Loss assumes a one-year portfolio it does not capture the benefit of a shortening average tenor, for example Trade Finance
48 46 42 38 37
Sep 09 Sep 10 Sep 11 Sep 12 Sep 13
bps of
GLA‟s
89 8369 67
57
Sep 09 Sep 10 Sep 11 Sep 12 Sep 13
bps of
EAD 32bps
11bps
35
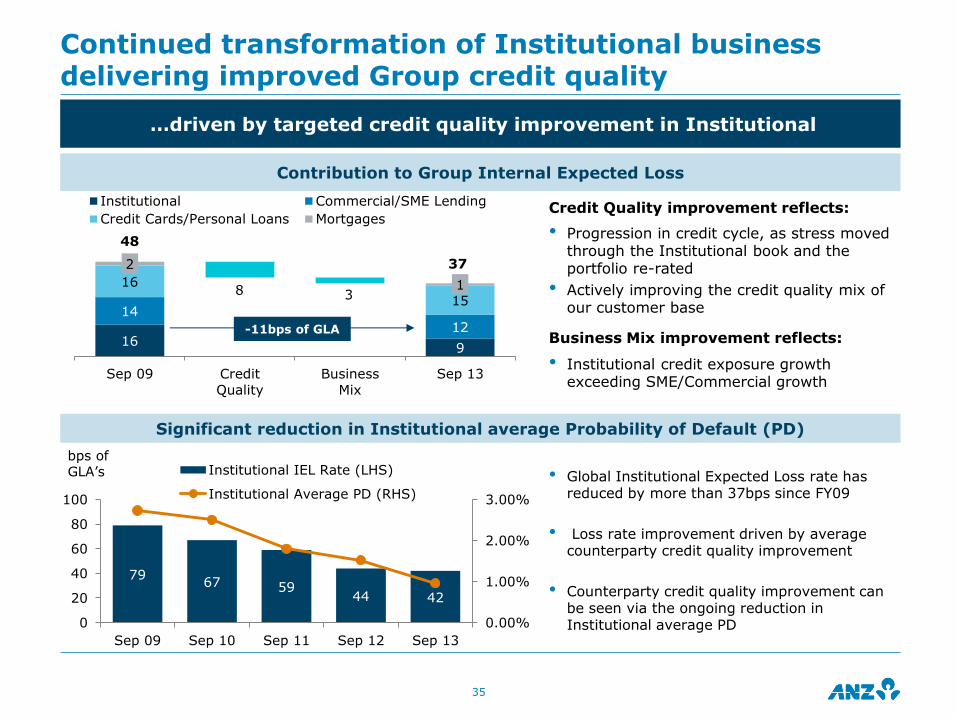
…driven by targeted credit quality improvement in Institutional
Significant reduction in Institutional average Probability of Default (PD)
Continued transformation of Institutional business delivering improved Group credit quality
Contribution to Group Internal Expected Loss
Credit Quality improvement reflects:
• Progression in credit cycle, as stress moved through the Institutional book and the portfolio re-rated
• Actively improving the credit quality mix of our customer base
Business Mix improvement reflects:
• Institutional credit exposure growth exceeding SME/Commercial growth
• Global Institutional Expected Loss rate has reduced by more than 37bps since FY09
• Loss rate improvement driven by average counterparty credit quality improvement
• Counterparty credit quality improvement can be seen via the ongoing reduction in Institutional average PD
7967 59
44 42
0.00%
1.00%
2.00%
3.00%
0
20
40
60
80
100
Sep 09 Sep 10 Sep 11 Sep 12 Sep 13
Institutional IEL Rate (LHS)
Institutional Average PD (RHS)
169
1412
16
15
2
18 3
Sep 09 Credit
Quality
Business
Mix
Sep 13
Institutional Commercial/SME Lending
Credit Cards/Personal Loans Mortgages
48
-11bps of GLA
bps of GLA‟s
37

Continued improvement in Credit RWA rate
36
Group Exposure at Default and Credit Risk Weighted Assets
Global Institutional Exposure at Default and Credit Risk Weighted Assets
511
550
615
658
741
230 234 249 255
274
45%
42%40%
39%37%
39%
Sep 09 Sep 10 Sep 11 Sep 12 Sep 13
Exposure at Default ($b)
Basel 2 Credit Risk Weighted Assets ($b)
CRWA / EAD (%) - Basel 2
CRWA / EAD (%) - Basel 3
187 206
239 265
298
110 110 112 115 124
59%
54%
47%
43%
41%
46%
Sep 09 Sep 10 Sep 11 Sep 12 Sep 13
Exposure at Default ($b)
Basel 2 Credit Risk Weighted Assets ($b)
CRWA / EAD (%) - Basel 2
CRWA / EAD (%) - Basel 3
288Basel 3 CRWAs
136Basel 3 CRWAs
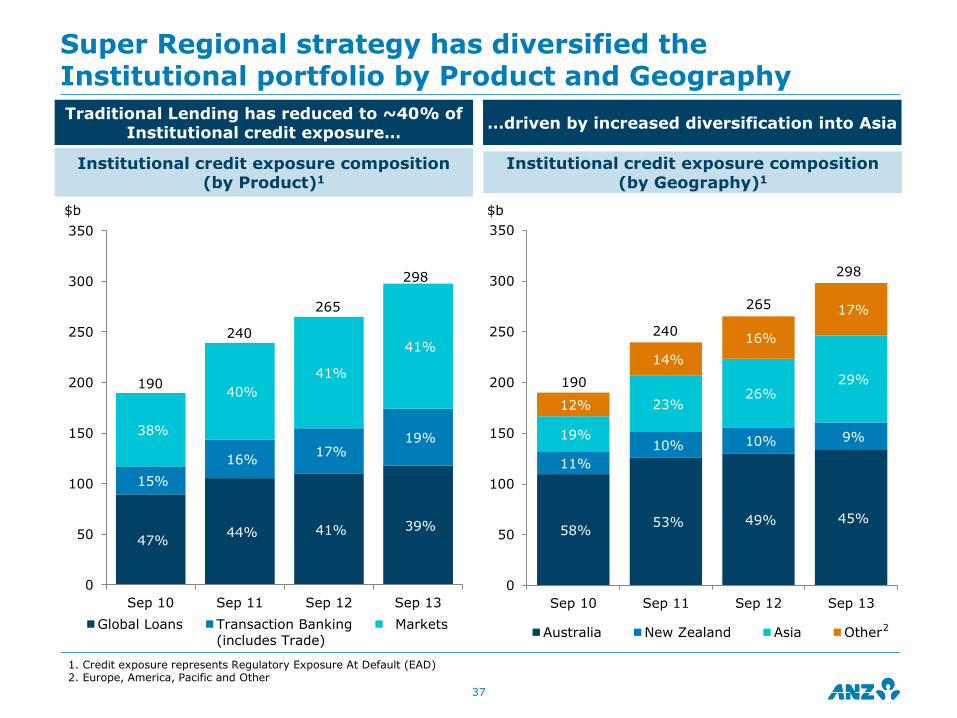
Super Regional strategy has diversified the Institutional portfolio by Product and Geography
37
Traditional Lending has reduced to ~40% of Institutional credit exposure…
Institutional credit exposure composition (by Geography)1
1. Credit exposure represents Regulatory Exposure At Default (EAD) 2. Europe, America, Pacific and Other
Institutional credit exposure composition (by Product)1
…driven by increased diversification into Asia
47%44% 41% 39%
15%
16%17%
19%38%
40%
41%
41%
0
50
100
150
200
250
300
350
Sep 10 Sep 11 Sep 12 Sep 13
Global Loans Transaction Banking
(includes Trade)
Markets
58%53% 49% 45%
11%
10% 10% 9%19%
23%26%
29%
12%
14%
16%
17%
0
50
100
150
200
250
300
350
Sep 10 Sep 11 Sep 12 Sep 13
Australia New Zealand Asia Other
190
240
265
298
190
240
265
298
$b $b
2

Trade Finance and Asia Institutional growth has improved average credit quality for Institutional
38
Asia Global Loans Australia Global Loans
• Trade Finance portfolios provide access to a large and high quality multi-national customer base
• Strong growth in Trade Finance portfolio focussed on shorter duration exposures to investment grade counterparties
• Asia Global Loans focussed on shorter duration to Investment Grade customers
• Asia Global Loans has a higher proportion of investment grade credit exposure than Australia Global Loans
Trade Finance
59% 69% 67% 67%
0
20
40
60
80
Sep 10 Sep 11 Sep 12 Sep 13
Investment Grade Sub-Investment Grade
50% 55% 56% 57%
0
20
40
60
80
Sep 10 Sep 11 Sep 12 Sep 13
Investment Grade Sub-Investment Grade$b
64% 67% 67%
69%
0
20
40
60
Sep 10 Sep 11 Sep 12 Sep 13
Investment Grade Sub-Investment Grade$b

Strong Collective Provisioning Coverage
39
Global Institutional Sub-Investment Grade1 Exposures continue to decline Trend in Global Institutional composition
Collective Provision Charge (CP) by Source
1. Sub-Investment grade defined as exposures with a rating below BBB- 2. CRWA Rate defined as Credit Risk Weighted Assets as a percentage of Exposure at Default (EAD)
• ANZ remains appropriately provided for with a Collective Provision coverage ratio of 100bps
• Reductions in Collective Provision overlay have occurred in line with portfolio improvement
• This improvement can be seen by the reduction in Institutional Sub-Investment Grade Exposure
10%
15%
20%
25%
30%
35%
40%
60
70
80
90
100
110
120
130
140
Sep 09 Sep 10 Sep 11 Sep 12 Sep 13
Institu
tional (%
of
Sub-I
nvestm
ent
Gra
de
cre
dit e
xposure
)
CP /
Cre
dit R
WA (
bps)
Group CP/CRWA Ratio (Basel 3)
Group CP/CRWA Ratio (Basel 2)
Institutional Sub-Investment Grade Exposure (RHS)
66%68% 73% 73% 78%
0%
20%
40%
60%
80%
0
100
200
300
400
Sep 09 Sep 10 Sep 11 Sep 12 Sep 13
Sub-Investment Grade (LHS)
Investment Grade (LHS)
Institutional Basel 2 CRWA Rate CRWA Rate2
30
136
43
29
34
Lending
Growth
Risk Impact Portfolio Economic
Cycle
Total FY13
CP charge
$b
$m

Individual Provision Charge
40
Individual Provision Charge by Segment Individual Provision Charge Composition
Individual Provision Charge by Region
0
500
1,000
1,500
2,000
2,500
3,000
FY09 FY10 FY11 FY12 FY13
$m Institutional Commercial Consumer
1,823
1,213
1,637
-1,000
0
1,000
2,000
3,000
FY09 FY10 FY11 FY12 FY13
$m New Increased Writebacks & Recoveries
1,8231,213
1,637
0
500
1,000
1,500
2,000
2,500
3,000
FY09 FY10 FY11 FY12 FY13
$m Australia New Zealand APEA
1,823
1,213
1,637
1,167
1,167
1,167
2,815
2,815
2,815

Risk Weighted Assets
41
Total Risk Weighted Assets Total Risk Weighted Assets movement Sep 2013 v Sep 2012
Total Risk Weighted Assets movement by Division Sep 2013 v Sep 2012
230 234249 255
274288
2231
31
45
50
51
252
264
280
300
324
339
Sep 09 Sep 10 Sep 11 Sep 12 Sep 13
Basel 2
Sep 13
Basel 3
$bMarket & Operational Risk Weighted Assets
Credit Risk Weighted Assets
300.1
338.7
18.7
14.15.3 0.9
0.4
Sep 12 Basel 2
Credit
RWA
Basel 3
Credit RWA
Impacts
Traded
Market
RWA
IRRBB
RWA
Operational
Risk
RWA
Sep 13
$b
300.1
338.7
11.1
21.55.1 0.9
Sep 12 Australia IIB NewZealand
GWPB Sep 13
$b
Up 8%
Up 8%

Traded Market Risk & IRRBB Risk Weighted Assets
Income ($) / VaR1
Market Risk Weighted Asset Trends
1. Average 1-day 99% VaR
• FY13 increase in IRRBB VaR and RWA partly reflects modest increase in Capital and Replicating portfolio duration and additional liquid assets
• Increased diversification over time in the Traded Market portfolio has reduced Traded Market Risk 1-day 99% VaR whilst Traded Market Risk RWAs were impacted by Jan 2012 Basel 2.5 introduction
Generating improved Markets Risk-adjusted Income outcomes
Strategic decisions driving Risk Weighted Asset and VaR outcomes
• Sales & Trading business has continued to grow its income stream in parallel with reducing the Traded Market Risk 1-day 99% VaR
• The improved 1-day 99% VaR trend reflects the diversification benefit achieved via Asian growth and via growth and diversity in our Foreign Exchange business
42
42
91
170
198
17 12 17 14
0
50
100
150
200
250
FY10 FY11 FY12 FY13
Global Markets Sales & Trading (Traded)
Balance Sheet (Non-Traded)
0
10
20
30
40
50
0
5
10
15
20
Sep 10 Sep 11 Sep 12 Sep 13
IRRBB RWAsTraded Market Risk RWAsTraded Market Risk 1-day VaR (RHS)
$b $m
$

Credit Risk Weighted Assets
43
Credit Risk Weighted Assets Credit Risk Weighted Assets movement Sep 2013 v Sep 2012
Credit Risk Weighted Assets movement by Division Sep 2013 v Sep 2012
254.9
287.714.1
15.4 10.9
0.67.0
Sep 12 Basel IIIImpact
Risk Growth PortfolioData
Review
FX Impact Sep 13
$b
Credit Risk Weighted AssetsCredit Risk Weighted Assets
movement Sep 2013 v Sep 2012
230 234249 255
274
1.32% 1.35%1.28%
1.08% 1.06%
1.00%
Sep 09 Sep 10 Sep 11 Sep 12 Sep 13
Basel 2 Credit Risk Weighted Assets
Collective Provision as a % of CRWA (Basel 2)
Collective Provision as a % of CRWA (Basel 3)
254.9 273.6 287.7
5.2 9.1 5.1 0.2 12.5 0.1 1.3
0.7
Sep 1
2
Austr
alia
IIB
NZ
Oth
er
Sep 1
3Basel 2
Austr
alia
IIB
NZ
Oth
er
Sep 1
3Basel 3
Basel 2 Impacts Basel 3 Impacts
288Basel 3 CRWAs
$b

Control List and Risk Grade Profiles
44
Control List
Investment Grade Risk Profile
Group Sub-Investment Grade1 Exposures
as % Exposure at Default
1. Sub-investment grade defined as exposures with a rating below BBB-
40
60
80
100
120
Sep 09 Sep 10 Sep 11 Sep 12 Sep 13
Control List by limits Control List by No of Groups
72% 72%74%
77% 78%
Sep 09 Sep 10 Sep 11 Sep 12 Sep 13
6% 6% 6%5%
4%
9% 9%8%
7%7%
13% 13%
12%
11%11%
Sep 09 Sep 10 Sep 11 Sep 12 Sep 13
<BB- BB- BB+ to BB
Index Sep 09 = 10028% 28%
26%
23%22%

Gross Impaired Assets
45
Gross Impaired Assets by Type Gross Impaired Assets by Size of Exposure
1. NPCCD - Non-Performing Commitments, Contingents & Derivatives
0
1,000
2,000
3,000
4,000
5,000
6,000
7,000
8,000
Sep 09 Sep 10 Sep 11 Sep 12 Sep 13
$m Impaired Loans NPCCD Restructured
0
1,000
2,000
3,000
4,000
5,000
6,000
7,000
8,000
Sep 09 Sep 10 Sep 11 Sep 12 Sep 13
$m > $100m $10-$99m < $10m
Avg. $0.8b decline YOY since Sep 10
5,595
6,561
5,581
5,196
4,264
5,595
6,561
5,581
5,196
4,264
1

Impaired Assets
46
New Impaired Assets by Division
Impaired Assets Concentration by number of Customers1
Net Impaired Assets by Division
Impaired Assets Concentration by value of Impaired Assets1
1. Only >$10m customers
0
1,000
2,000
3,000
4,000
5,000
6,000
7,000
FY09 FY10 FY11 FY12 FY13
Institutional Australia New Zealand Other
0
1,000
2,000
3,000
4,000
5,000
Sep 09 Sep 10 Sep 11 Sep 12 Sep 13
Institutional Australia New Zealand Other
4,069
6,575
5,446
4,265 4,203
13%29% 37% 42%
56%16%
29%31% 18%
18%
16%
11%5% 16%55%
31% 27% 24% 26%
Sep 09 Sep 10 Sep 11 Sep 12 Sep 13
$10-50m $51-100m $101-200m >$200m
58%72% 77% 82% 88%
19%
20% 19% 11%9%
11%
4%1% 4%12%
4% 3% 3% 3%
Sep 09 Sep 10 Sep 11 Sep 12 Sep 13
$10-50m $51-100m $101-200m >$200m
3,287
$m$m
2,797
3,4233,884
4,685

Total Credit Exposure (EAD) by Geography
47
Exposure by Geography Exposure at Default by Line of Business2
Australia
New Zealand
APEA
1. EAD excludes amounts for „Securitisation‟ and „Other Assets‟ Basel asset classes 2. Institutional includes exposure to Bank and Sovereign counterparties and ANZ‟s Liquidity portfolio
3%
4%
3%
4%
1%
3%
3%
55%17%
28%
48%
30%
22%
5%1%
94%
Retail
Commercial
Institutional
Australia62%APEA
21%
New Zealand17%
UK & Europe
Americas
Pacific
Singapore
Hong Kong
Other NorthEast Asia
Other South East Asia
Total Exposure at Default (Sep 13) - $725b1
Australia New Zealand APEA
$450.6b $123.6b $150.8b
Retail
Commercial
Institutional
Retail
Commercial
Institutional

Total Credit Exposure (EAD) by Industry
48
Category EAD% in Non
Performing
Mar 13 Sep 13 Mar 13 Sep 13
Consumer Lending 40.4% 40.8% 0.2% 0.2%
Finance, Investment & Insurance
16.8% 15.9% 0.2% 0.1%
Property Services 7.1% 7.1% 1.6% 1.1%
Manufacturing 6.1% 6.0% 1.0% 0.7%
Agriculture, Forestry,Fishing
4.2% 4.3% 4.1% 4.1%
Government & Official Institutions
3.9% 4.0% 0.0% 0.0%
Wholesale trade 4.0% 3.9% 0.6% 0.8%
Retail Trade 2.9% 2.9% 0.8% 0.9%
Transport & Storage 2.2% 2.2% 2.0% 1.6%
Business Services 1.9% 2.0% 0.7% 0.5%
Resources (Mining) 1.8% 1.9% 0.2% 1.2%
Electricity, Gas & Water Supply
1.7% 1.7% 0.1% 0.1%
Construction 1.6% 1.7% 1.2% 1.1%
Other 5.4% 5.7% 0.1% 0.9%
Exposure at Default (EAD)as a % of group total
41%
16% 7%
6%
4%
4%
4%
3%
2%2%
2%2%
2%5%
ANZ Group
Total EAD (Sep 13)
$725b

Resources
49
Resources Exposure by Sector (% EAD) Resources Exposure by Geography (EAD)
Resources Exposure by Geography (EAD) Includes
Iron Ore 7%
0
2
4
6
8
10
12
14
16
Sep 10 Sep 11 Sep 12 Sep 13
$bAustralia Non-Australia
52%
22%
6%
20%
Australia
Asia
New Zealand
Europe, America,
Pacific & Other
37%
16%
22%
19%6%
Oil & Gas Coal
Metal Ore Mining Services
Other
Includes Iron Ore 7%
Resources
Total EAD (Sep 13) As a % of Group EAD
$13.7b 1.9%

Agriculture
50
Agriculture Exposure by Sector (% EAD) New Zealand Agri Credit Exposure (EAD) and Average Probability of Default
Agriculture Security Levels
1. 93% of Dairy exposure is in New Zealand Agri
38%
14%
10%
14%
3%
8%
4%5%4%
Dairy BeefSheep & Other Livestock GrainWheat Horticulture/FruitOther Crops Forestry & FishingAgriculture Services
1
Agriculture
Total EAD (Sep 13) As a % of Group EAD
$30.9b 4.3%
68%54%
78%
16%25%
10%7%
10%5%
9% 10% 7%
Group Australia New Zealand
Fully Secured 80-100% Secured
60-80% Secured <60% Secured
21 1918 17
0.00%
0.50%
1.00%
1.50%
2.00%
2.50%
0
5
10
15
20
25
Sep 10 Sep 11 Sep 12 Sep 13
NZD Total Credit Exposure (LHS)
Average PD (Non-Defaulted Customers) (RHS)NZDb

Commercial Property credit exposure
51
Commercial Property Exposure Gross Loans and Advances by Region
Commercial Property Exposure by Sector
Exposure to REIT‟s, Listed Property Companies and/or their subsidiaries
21.319.9 20.8 21.3 22.1
20.7
6.1
5.25.9 5.0
5.35.9
0.8
1.0
1.1 3.03.5 4.1
6.6%
5.5%
6.0%
6.5%
7.0%
7.5%
8.0%
8.5%
0
5
10
15
20
25
30
35
Sep 08 Sep 09 Sep 10 Sep 11 Sep 12 Jun 13
$b
APEA (LHS) New Zealand (LHS)
Australia (LHS) % of Group GLA's (RHS)
28%
29%
24%
14%
2%3%
Offices
Retail
Residential
Industrial
Tourism
Other
32%68%
Exposure toREITs, listed
property companies and/or their subsidiaries
Other Commercial
Property
28.2
26.1
29.330.9 30.7
27.8

Australia Home Loans 90+ day delinquencies by state
Australia Division Credit Quality
52
Australia Division 90+ day delinquencies Australia Home Loan Portfolio by state
Australia Division Credit Exposure (EAD)
Changes to treatment of hardship cases within Home Loan 90+ DPD impacted underlying trends during FY13. Sep 2013 90+ DPD 0.40% excluding change and 0.44% including.
0.0%
0.5%
1.0%
1.5%
2.0%
Sep 09 Sep 10 Sep 11 Sep 12 Sep 13
Home Loans Credit Cards
Corporate &
Commercial Banking
0.44%
29%
26%
18%
17%10%
VIC
NSW & ACT
QLD
WA
Other
1.03%
1.35%
67%
24%
7%
1%
1%
Home Loans
Corporate &
Commercial
Consumer Cards
Personal Loans
Other0.00%
0.20%
0.40%
0.60%
0.80%
1.00%
VIC NSW
& ACT
QLD WA Portfolio
Sep 10 Sep 11 Sep 12 Sep13

1. Excludes funds in Equity Manager Accounts. 2. Average loan size of home loans written in 2H13 excluding offset accounts 3. % of customers paying Principal and Interest that are one month or more ahead of repayments 4. Excludes revolving credit facilities
Australia Division - Home Loan Portfolio
53
1H12 2H12 1H13 2H13
ANZ Group Total 0.36% 0.43% 0.27% 0.24%
Australia Home Loans
0.03% 0.02% 0.02% 0.02%
Dynamic Loan to Value Ratio
Individual Provision as % Gross Loans
Total Number of Home Loan Accounts 887k
Total Home Loan FUM $195b
% of Total Australia Geography Lending
60%
% of Total Group Lending 41%
Owner Occupied Loans - % of Portfolio1 62%
Average Loan Size at Origination (2H13 average)2 $329k
Average LVR at Origination (2H13 average)
70%
Average Dynamic LVR of Portfolio 50%
% of Portfolio Ahead on Repayments3 57%
First Home Owners - % of New Lending
7%
% of Portfolio Paying Interest Only4 32%
0%
10%
20%
30%
40%
50%
60%
0-60% 61-75% 76-80% 81-90% 91-95% 95%+
Mar-11 Sep-11 Mar-12 Sep-12 Mar-13 Sep-13
% of Portfolio

New Zealand Division – Home Loan Portfolio
54
Dynamic Loan to Valuation Ratio
Home Loan Portfolio by Region
Total Number of Home Loan Accounts 478k
Total Home Loan FUM (NZD) $59b
% of Total New Zealand Lending 56%
% of Total Group Lending 11%
Owner Occupied Loans - % of Portfolio 77%
Average Loan Size at Origination (2H13 average) (NZD) $247k
Average LVR at Origination (2H13 average)
67%
Average Dynamic LVR of Portfolio 47%
% of Portfolio Paying Interest Only1 21%
1. Excludes revolving credit facilities
1H12 2H12 1H13 2H13
ANZ Group Total 0.36% 0.43% 0.27% 0.24%
New Zealand Home Loans
0.05% 0.03% 0.02% 0.02%
Individual Provision as % Gross Loans
45%
17%
18%
11%
9%0-60%
61-70%
71-80%
81-90%
90%+
39%
12%6%
28%
12%3%
Auckland
Wellington
Christchurch
Rest of North Island
Rest of South Island
Other

New Zealand – Credit Quality
55
New Zealand Geography Net Impaired Assets
New Zealand Geography Total Provision Charge
New Zealand Division
90+ days delinquencies
1. Spikes in 2012 Commercial 90 day delinquencies are primarily due to internal classifications rather than any deterioration in underlying credit quality.
743
1,463
1,307
990
662
0.76%
1.50%1.38%
1.02%
0.66%
Sep 09 Sep 10 Sep 11 Sep 12 Sep 13
Net Impaired Assets NIA as % GLA
NZDm
-200
0
200
400
600
800
1,000
FY09 FY10 FY11 FY12 FY13
NZDm IP Charge CP Charge
0.0%
0.4%
0.8%
1.2%
1.6%
2.0%
2007 2008 2009 2010 2011 2012 2013
Mortgages Commercial Rural
456
190 202
66
1
883

Australia Division

Simplifying our products & process
We are transforming the business to position ANZ for growth in a changing environment
Building our lead in mobile & digital
• Expanding customer reach and deepening loyalty
• New mobile & digital foundations
• Rapid evolution of our market leading applications
Transforming our distribution channels
Retail
• Transforming branches and contact centres to focus on more complex sales
• Multi-channel connectivity
• Migrating low value transactions to self service
Corporate & Commercial Banking
• Using our super regional advantage to bring whole of ANZ
• Providing market leading banker tools & centralised service
• Offering deep industry insight
Accelerating through customer insights
• Digitising and automating
• Paperless processing
• Simplifying product range
• New information platforms
• Single customer view enabled
• Insight driven offers
57

1. Source: APRA Monthly Banking Statistics, 12 months to August 2013. Excludes impact from sale of Origin Mortgage Management Services; 2. To June quarter 2013. Retail Source: APRA Monthly Banking Statistics, excludes impact from sale of Origin Mortgage Management Services; C&CB Source: RBA Lending and Credit Aggregates – Non Financial Corporations.; 3. Source: Roy Morgan Research, 6 months to August 2013; 4. Excludes Esanda.
Banking on Australia is delivering strong outcomes
58
FY13 Performance: NPAT up 11% to $2.87bn
Retail Corporate & Commercial Banking
#1 Strongest overall growth of major banks across Home Loans, Deposits and Cards in FY131
14 Quarters of Above System Home Loan growth2
17% Profit before Provisions growth
>80% MFI Customer satisfaction3
19% Increase in sales via Digital channels
11% Reduction in customer complaints
7% Lending Growth
6 Quarters of Above System Lending growth2
30,000 Growth in Customer Numbers4
7,000+ ANZ Fastpay Users
158bps Reduction in Cost to Income ratio
45,000+ Frontline training hours invested

Achieving above system growth
59
Retail Strongest overall growth of major banks across Home Loans, Deposits and Cards in FY13
Home Loans1 Deposits1 Consumer Cards1
Corporate & Commercial Banking Delivering above system growth and cross sell income to Institutional, Retail and Wealth
Lending2 Deposits2 Cross Sell Income3 ($m)
1. Source: APRA Monthly Banking Statistics, Sep 2012 to Aug 2013. System adjusted for new ADI incorporations; 2. Source: Lending - RBA Lending and Credit Aggregates and Deposits – APRA Monthly Banking Statistics, Non-Financial Corporations, Sep 2012 to Aug 2013; 3. C&CB cross sell includes income booked in Retail, Wealth and International and Institutional Banking.
4.9%
6.4%
System ANZ
7.6%
8.8%
System ANZ
0.1%1.7%
System ANZ
1.3x 1.2x 16.3x
2.2%
6.6%
System ANZ
1.8%
4.4%
System ANZ
1,108
1,202
1,298
FY11 FY12 FY13
3.1x 2.4x
+8%
+8%

Improving sales efficiency and productivity
60
7% Uplift in branch sales per FTE in 2013
15% Increase in Home loans approved at first application 2H13
178,000 Frontline hours freed up through Operations efficiency
Australia Division Cost to Income Ratio Australia Operations Efficiency
-10.3%
5.0%
Operations Expenses Operations Volume
Growth FY13 v FY12
41.8%
39.9%
37.9%
37.2%
1H12 2H12 1H13 2H13

3bps Improvement in Home Loan 90+ days past due in 20131
13%
Reduction in Credit Card provisions in FY13, 30+ and 90+ day delinquencies at lowest level in 3 years
Maintained prudent risk
settings
Retail Credit Quality
61
Australia Retail 90+ days past due1
Home Loan Loss Rates Home Loans 90+ days past by state
19 36 21 28 43 45
Individual Provision Charge ($m)
1. Excludes changes to treatment of hardship cases that impacted underlying trend. Sep 2013 90+ DPD 0.40% excluding hardship change and 0.44% including.
0.0%
0.5%
1.0%
1.5%
Mar
08
Sep 0
8
Mar
09
Sep 0
9
Mar
10
Sep 1
0
Mar
11
Sep 1
1
Mar
12
Sep 1
2
Mar
13
Sep 1
3
Credit Cards Home Loans
0.01%
0.03%
0.01%
0.02% 0.02% 0.02%
2008 2009 2010 2011 2012 2013
IP Charge as % Portfolio
0.00%
0.20%
0.40%
0.60%
0.80%
1.00%
VIC NSW
& ACT
QLD WA Portfolio
Sep 10 Sep 11 Sep 12 Sep 13

Corporate & Commercial Banking Credit Quality
62
Individual Provision Charge Movement FY13 v FY12
Individual Provision Charge as % Gross Loans & Advances
Customer Credit Rating (CCR) Profiles by Exposure at Default
Net Impaired Assets
8.6% 8.8%
78.9% 78.2%
12.5% 13.0%
Sep 2012 Sep 2013
% of Portfolio0.62%
0.57%0.61%
2H12 1H13 2H13
275
387
14
54 2123
FY12 W/Back &Recoveries
ExistingImpaired
Esanda Other FY13
$m
0-3
4-6
Stronger
Weaker 7-10
Weighted Average CCR
6.19 6.18
937 949895
803
1.61% 1.55%
1.42%
1.23%
0.00%
0.30%
0.60%
0.90%
1.20%
1.50%
1.80%
0
200
400
600
800
1,000
Mar 12 Sep 12 Mar 13 Sep 13
Net
impair
ed a
ssets
as a
%
of net
lendin
g a
ssets
$m
+41%
New Impaired
+16%

Significant progress made on mobile and digital agenda
Banking on Australia
63

ANZ goMoneyTM is our market leading mobile banking app
Available for iPhone and Android
Active goMoney users2 1.0m
goMoney logins per month >25m
First payments app in the Australian market 2010
Transactions processed >$56b
ANZ‟s award-winning app1 provides a secure and convenient way to bank, 24/7
Customers with ANZ goMoneyTM demonstrate greater loyalty
1. Winner of 2011 IDC Financial Insights Innovation Award, 2011 CANSTAR Innovation in Financial Services Award, 2011 Banking & Payments Asia Trailblazer Award, 2011 Australian Banking & Finance Magazine Innovative Retail Banking Product of the Year Award; 2. Active users within past 120 days. 64

Transforming our branches to focus on more complex needs, generate increased cross-sell and productivity
Smart ATMs installed 201
New look sales focused branches 74
Uplift in sales via Video Conference in 2H13 18%
Uplift in branch sales in FY13
7%
Drop in branch traffic due to increased self service 5%
Transforming our distribution network by embracing new technology to meet the changing needs of customers
65

Interactive frontline sales tools that improve banker productivity and deliver ANZ‟s super regional capabilities to our customers
C&CB frontline bankers with iPads 100%
Digital A-Z reviews completed in last 3 months
>5,000
48 hrs Average turnaround time saving with each “Sign-on-Glass” application
Markets connected via Super Regional App
33
Faster application turnaround
Access to bank-wide digital customer information
66
ANZ App catalogue Source of banker apps
ANZ Hub Customer & frontline information
ANZ Podcast Banker Training
A-Z Review Customer needs assessment
Collaboration Video access to specialists
Super Regional ANZ regional capability resource
Voice notes Capture of customer notes
On Boarding & Identification Customer information capture
1
2
3
4
5
6
7
8
8 Frontline Applications Developed
1
2
3
4
5
6
7
8

ANZ FastPayTM is our award winning mobile merchant app, enabling our small business customers to be paid „on the go‟
Available for iPhone and iPad
Winner, FIIA Award for Innovation and the Trailblazer award for innovation in banking1
FastPay users 7,000+
Monthly growth in FastPay customers 30%
Transactions processed >140k
• Mobile merchant app for faster card payments
• Allows businesses to accept card sales on iPhone or iPad with same-day settlement
1. Financial Insights Innovation Awards (FIIA) 2013; 2013 Banking & Payments Asia Trailblazer Awards 67

Retail Transformation is improving Home Loan capability
68
1.1 million
A to Z customer needs reviews completed in 2013
68% Branch sales staff now accredited to sell home loans
16% Increase in branch Home Loan sales in 2013
Delivered Home Loan continuous improvement program
$13 billion
Home Loan growth achieved in 2013
19% Percentage of online chats generating mortgage referrals
Home Loan Sales Mix by Channel
Total Home Loan Accounts
45% 49% 51% 53%
55% 51% 49% 47%
1H12 2H12 1H13 2H13
Broker
Proprietary
847
857
869
887
1H12 2H12 1H13 2H13
Thousands

And increasing cross sell of retail, wealth and small business solutions to our customers
69
1,600 Branch staff trained to sell Small Business transaction accounts
1,300 Branch staff accredited to sell Wealth products
23,000 Smart Choice Super sales sold through branch network since November 2012 launch
16% Growth in Small Business deposit accounts
414,000 Business sales and wealth referrals through branches
Revenue from Retail Products Sold to Commercial Customers
Wealth Products Sold Through Retail Distribution
173
206
FY12 FY13
Thousands
622
740
FY12 FY13
$m+19%
+19%

Corporate & Commercial Banking transformation is enhancing banker productivity
70
8% Growth in cross sell revenue to $1.3 billion
20% Growth in leads to frontline
Establishment of cross border on-boarding team
47 Processes removed from frontline staff
12 to 1 Different product applications consolidated to a single form
12 Products decommissioned
Revenue per FTE Costs per FTE
1,111
1,137
FY12 FY13
+2%
376
367
FY12 FY13
-2%
Money Magazine Business Bank of the Year
CANSTAR Best Value Australia Agribusiness Award
Trailblazer „Channel Excellence in Mobile – Payments‟ Award 2013
FIIA Innovative in Mobile Payments Award 2013

Delivering leading insight and support to help corporate & commercial customers improve their business
71
#1 No.1 Most Trusted Adviser1
$750 million
Lent to new small businesses in the first 6 months under our $1 billion pledge
6,000 Monthly customer visits to the Small Business HUB, an online customer portal
Small business customer approval notification via SMS
Simplified application and assessment for new small businesses
Single point of contact for Business Banking servicing
Leading Insights Capabilities
ANZ Insight Series
A series of client reports covering long-term opportunities and challenges across Asia Pacific
Client Insights
Bespoke strategic industry and customer insight for corporate clients
Business Insights
Real-time peer benchmarking tool for small and medium sized business clients
1. Peter Lee Associates 2013 Large Corporate and Institutional Relationship Banking survey Australia

And leveraging our super regional advantage to bring the whole of ANZ to our customers
72
100% Relationship Frontline staff with Super Regional training
45% Growth in cross-border referrals from Australia
25% Relationship Frontline staff with hands-on experience in key Asian markets
30% Growth in foreign exchange customers
2,500 Customers per week visit anz.com Super-regional site
1. DBM‟s Business Financial Services Monitor. Rolling 3 month average, as at Sept-13. Defined as proportion of Commercial Banking customers with $1m to less than $40m turnover who associate bank with the statement „can service my business needs across Australia, NZ and Asia„
Super Regional iPad App to facilitate cross-border customer conversations
“Can Service My Business Needs Across Australia, NZ and Asia”1
24
28
32
36
40
Jun-12 Sep-12 Dec-12 Mar-13 Jun-13 Sep-13
ANZ Peer 1 Peer 2 Peer 3

International and
Institutional Banking
Division

Note: Growth rates compare FY13 v FY12 unless specifically stated a
1. Volume represents total lending and deposits 2. Represents referred income booked in a jurisdiction different from where a client relationship is managed 3. Income CAGR FY10 – FY13
Disciplined execution of our strategy is driving improved performance
74
Customer
Geography
Product
% Institutional customers dealing with IIB in multiple countries 32%
Cross border income2 as a percentage of Institutional customer income 35%
Cross border income growth = 3x Local income growth3 3x faster
FY13 APEA operating income as a percentage of Total IIB operating income - up 12% since FY10 48%
FX income represents 41% of Global Markets income growing at a 14% CAGR since FY10
Diversification Trade income represents 13% of Global Institutional income growing at a 18% CAGR since FY10
Strong growth in priority segments – Natural Resources +6%, Global Diversified +9%, Financial Institutions +17%, Asia Commercial +30%, Asia Retail Affluent +31%, Agriculture -13%
Volume1 growth
Institutional +11%, Affluent Retail +16%, Commercial +19% Customer
Acquisition in Asia
Trade volumes growing at 59% CAGR since FY10
Sources:
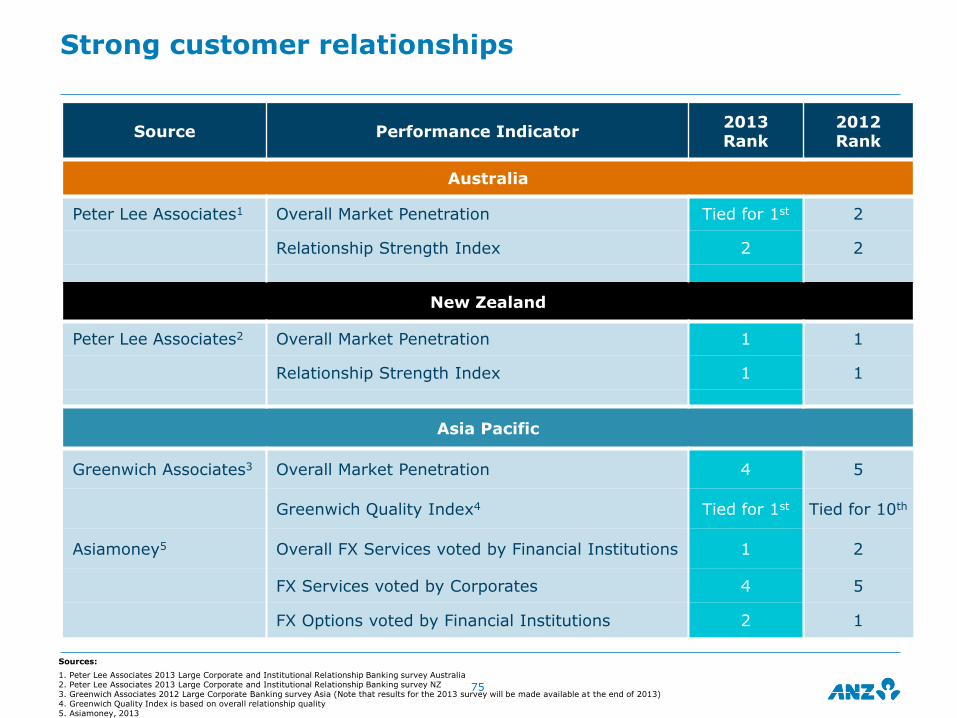
1. Peter Lee Associates 2013 Large Corporate and Institutional Relationship Banking survey Australia 2. Peter Lee Associates 2013 Large Corporate and Institutional Relationship Banking survey NZ 3. Greenwich Associates 2012 Large Corporate Banking survey Asia (Note that results for the 2013 survey will be made available at the end of 2013) 4. Greenwich Quality Index is based on overall relationship quality 5. Asiamoney, 2013
Strong customer relationships
75
Source Performance Indicator 2013 Rank
2012 Rank
Australia
Peter Lee Associates1 Overall Market Penetration Tied for 1st 2
Relationship Strength Index 2 2
New Zealand
Peter Lee Associates2 Overall Market Penetration 1 1
Relationship Strength Index 1 1
Asia Pacific
Greenwich Associates3 Overall Market Penetration 4 5
Greenwich Quality Index4 Tied for 1st Tied for 10th
Asiamoney5 Overall FX Services voted by Financial Institutions 1 2
FX Services voted by Corporates 4 5
FX Options voted by Financial Institutions 2 1

Growing volume with target customers
Diversification by customer
• Financial Institutions - capital, portfolio management, liquidity & transactional banking solutions
• Resources - specialist banking products and services
• Global Diversified Industries – financial and capital management solutions to clients across a range of global industries
• Commercial – solutions, insights and banking support to corporates with cross border needs
• Retail – banking solutions and advisory capabilities for affluent and emerging affluent customers
76
1. Volume reflects total lending and deposits on a constant currency basis
Growing priority customers
Institutional: International connectivity, insights, strong balance sheet and consistency of relationship to deliver flow and value added solutions
Asia Pacific Commercial: Seamless connectivity to customers targeting those with cross border needs
Asia Pacific Retail: Banking and wealth solutions focussed primarily on affluent and emerging affluent customers
Customer Value
Proposition
22%
10%
12%8%6%
12%
15%
3%12%
24%
13%
10%8%
5%
10%
10%
5%
15%
Financial Institutions
FY10
FY13
Property
AgricultureUtilities &
Infrastructure
ResourcesLocal
DiversifiedIndustries
Global Diversified Industries
Income by Customer Segment (FY10-FY13)
-13%
6%9%
17%
30% 31%
Agri-culture
Resources GlobalDiversified
FinancialInst.
AsiaCommercial
RetailAsia
Volume Growth1
(FY12-FY13)
Commercial
Retail

Diversification by geography and product
Geography
Accessing fast growing Asia: 18% CAGR in Asia IIB income over last three years1
Product
Diversifying income to create greater resilience against changing economic cycles
Income
Mix
Lowering balance sheet intensity and delivering improved capital efficiency
Income by Geography
Income by Product Income Mix
77
1. CAGR calculated using AUD
52%
14%
34%
23%
25%
6%
11%
2%
18%
14%
21%
29%6%
8%3%
17%
16%
64%12%
24%
59%
41%
56%
44%
FY10
OtherOperatingIncome
NetInterestIncome
Income by Geography (FY10-FY13)
Income by Product (FY10-FY13)
FY10
FY13
Aust & NZ CAGR -1%
Pacific, Europe & AmericaCAGR +11%
AsiaCAGR+18%
Transaction Banking
FY10
FY13
Retail
Partnerships
Global Loans
MarketsSales
MarketsTrading
Income Composition (FY10-FY13)
FY13
Relationship & Infrastructure

Cross border income is 35% of Institutional customer revenue - 3x faster growth than domestic
Domestic Institutional Cross Border1 Institutional
Cross border income growth with 43% CAGR2 in Intra Asia Referrals
15% CAGR2
Cross border lending growth 18%
Note: Growth rates compare FY13 v FY12 unless specifically stated 1. Cross border business represents income booked in a jurisdiction different to where a client relationship is managed 2. Income CAGR FY10 – FY13 3. Top 100 Institutional customers by FY13 income
Local income growth 5% CAGR2
Domestic lending growth 6%
% Top 100 Institutional customers3 banked in multiple countries
86% % Top 100 Institutional customers3 banked in one country
14%
FY13 cross sell of Institutional products into Commercial Australia & NZ
$0.5 billion FY13 cross border income $1.6 billion
78

JAWs Flat Delivered flat JAWs YOY
Costs
up 1% HOH
Driving efficiency by leveraging Global Hubs
$88m
Incremental spend in FY13
In Technology and front line coverage
Productivity gains enabling focused investment spend
1. 2H12 figures exclude one-off Software impairment of AUD162m 2. Includes contract employees 3. Includes Asian Core Banking Engine, Transactive and compliance projects
Strong productivity outcomes
Managing FTE whilst selectively investing Very modest HoH growth from projects
79
1,446
1,512 1,524 66 12
1H13 FX 1H13Constant FX
Projects Other 2H13
2.5%
4.8%
3.4%
0.7%0.8%
2H11 1H12 2H12 1H13 2H13
HoH Cost Growth (Constant FX)1
HoH Cost Growth
1% underlying
growth
$m
3,856 3,865 3,846
4,170 3,944 3,758
6,601 6,029 5,578
14,627 13,838 13,182
Sep 11 Sep 12 Sep 13
Institutional & Commercial Retail Enablement
-
IIB Full Time Employees2
3

2.7
0.7
1.9
Global
Loans
Transaction
Banking
Global
Markets
68%78%
32%22%
Sep-10 Sep-13
Investment Grade Sub-Investment Grade
85%70%
15%24%
0%6%
Sep-10 Sep-13
Global Loans Transaction Banking Markets
48% of portfolio has a tenor <1 year
FY13 Avg. Tenor (years)
2,062
1,3292.9%
1.3%
0%
1%
1%
2%
2%
3%
3%
4%
Sep-10 Sep-13
Net Impaired Assets Net Impaired Assets % GLA
$m
1
Institutional - A higher quality balance sheet
80
Institutional Risk Grade Profile by Exposure at Default
Tenor by Exposure at Default
Net Impaired Assets
Lending Composition
1. Sub-investment grade defined as exposures with a rating below BBB-
1

Maintaining cost discipline with costs down 5% YOY1
36%
Re-shaping the Australia and New Zealand Institutional businesses
Greater connectivity and cross sell
81
Note: Growth rates compare FY13 v FY12 1. Costs exclude 2H12 software impairment of $66m 2. Sub-investment grade defined as exposures with a rating below BBB-
Super Regional Connectivity : Income thrown to Asia
Shifting business mix with a greater focus on flow and value added products
12% CAGR
Referred cross border income over the last 3 years
Improving risk profile
$0.5b FY13 cross sell revenue into Commercial Australia & NZ
66% 73%
34% 27%
Sep-10 Sep-13
Investment Grade Sub-Investment Grade
Institutional Aus/NZ Risk Grade Profile by Exposure at Default
625 630
634
647 643
624
598
2H10 1H11 2H11 1H12 2H12 1H13 2H13
-7%-6%
6%
13%
GlobalLoans
CommercialProperty
Trade FX
Volume growth(FY13 v FY12)
$m
Australia NZ
2
81% 88%
19% 12%
Sep-10 Sep-13
Australia / NZ Costs HOH

1. The Greenwich Quality Index score is based upon a normalized composite of all qualitative evaluations transformed to a scale of 0 to 1,000 with the difference from the average shown. Note: Cross-pairs are calculated by the average of the banks shown in graph.
82 1. The Greenwich Quality Index score is based upon a normalized composite of all qualitative evaluations transformed to a scale of 0 to 1,000 with the difference from the average shown.
Note: Cross-hairs are calculated by the average of the banks shown in graph.
Growing our customer base and volume in key products
A top 4 Corporate Bank in Asia
A top 4 Corporate Bank in Asia with a growing customer base
82
0%
10%
20%
30%
40%
50%
60%
70%
-75 -50 -25 0 25 50 75
Im
porta
nt
Rela
tion
sh
ips
Bank A
Bank B
Bank C
Bank F
Bank E
Bank D
Bank I
Bank H
Bank G
2012
Greenwich Quality Index1 - Overall Relationship Quality(Difference from the Average)
2011
2010
Greenwich Associates Large Corporate SurveyOverall Relationship Quality
6%7%
12%
16%
19%
Agriculture Financial
Inst.
Resources Global
Diversified
Commercial
Growth In Asia Customer Numbers By Segment(FY13 v FY12)
32%
66%
16%
25%
Trade Lending FX
Turnover
PCM
Deposits
Retail
Deposits
Asia Volume Growth(FY13 v FY12)

Asian business growing in line with strategy
Growing flow and value added products
1. NPAT up 19% if adjusted for software impairment on a USD basis 2. FY10–13 CAGR in USD 3. Includes Asia Private Bank 83
FY13 Performance: NPAT up 45% to USD0.6 billion1
Gaining momentum across the region
Realising liquidity advantages Delivering strong growth
22%
12%
13%26%
2%
24%
21%
17%
13%
29%
1%
18%
217 506
384 856
FY10 FY13
28
4350 52
FY10 FY11 FY12 FY13
322
622
877
1,257
1,840 2,109
2,243
FY07 FY08 FY09 FY10 FY11 FY12 FY13
Asia Operating Income2
Global MarketsCAGR +20%
Trans. Banking
CAGR +36%
FY13 Trade = 12%FY13 Cash Mgmt. = 5%
Global LoansCAGR +21%
Asia Operating Income3USDm Asia DepositsUSDbLDR = 83%
FY13
38% CAGR23% CAGR
Relationship & Infrastructure
CAGR flat
RetailCAGR +25%
254 383
Indonesia
Singapore
Greater China
134 141
Greater Mekong
Flow & value added business
Income growth by largest geographies (USDm)
PartnershipsCAGR +10%
FY10

Asia Institutional balance sheet – Shorter tenor
84
Institutional Asia Risk Grade Profile by Exposure at Default
Tenor by Exposure at Default
Net Impaired Assets
Lending Composition
1. Sub-investment grade defined as exposures with a rating below BBB-
3.1
0.6 0.6
Global
Loans
Transaction
Banking
Global
Markets
74% 75%
26% 25%
Sep-10 Sep-13
Investment Grade Sub-Investment Grade
63% 55%
37% 45%
Sep-10 Sep-13
Global Loans Transaction Banking
74% of portfolio has a tenor <1 year
FY13 Avg. Tenor (years)
139
50
0.9%
0.1%
0%
0%
0%
1%
1%
1%
Sep-10 Sep-13
Net Impaired Assets Net Impaired Assets % GLA
$m
1

Asia Pacific Commercial and Retail
85
Growing with positive JAWS (FY13 v FY12)
Retail: A source of liquidity Commercial Asia: Institutional product cross
sell to Commercial customers
Ongoing customer acquisition in Asia
87% of Commercial income is generated
from markets, cash and trade
Note: Growth rates compare FY13 v FY12
77% Markets
16% Cash Management
43% Trade
Commercial Asia cross sell income growth (FY13 v FY12)
16%
19%
Retail
Affluent
Commercial
Active Customer Growth(FY13 v FY12)
29%
17%
Income Cost
4%
-2%
Income Cost
Retail Commercial
2.53.7
4.9
7.2
Sep-10 Sep-11 Sep-12 Sep-13
46%
Lending Deposits
7.68.4
10.4
12.9
Sep-10 Sep-11 Sep-12 Sep-13
24%
JAWs +6% JAWs +12%
$b $b

Growing faster in higher return products
1. Capital calculated in accordance with APRA Standards, and represents Average Basel 3 RWA plus Capital Deductions
Growing higher return flow and value added products
86
Growing volume
11%
18% 17%
Global
Loans
Transaction
Banking
Global
Markets
Grow
Revenue Growth by Product(FY10-FY13)
1%
9%
7%
GlobalLoans
TransactionBanking
MarketsSales
Maintain
FY13 Return on Equity(Regulatory Capital Basel 31)
27%
35%
15%
24%
Trade Lending FX
Turnover
PCM
Deposits
Retail
Deposits
IIB Volume Growth(FY12–FY13)

Transaction Banking
Net Lending Assets Income
Deposits Income
1. Global Finance Magazine, 2012 Best Trade Finance Banks 2. Greenwich Associates, 2013 Asian Large Corporate Trade Finance Survey 3. Existing deployment includes Singapore, Hong Kong, Vietnam, Cambodia and Japan (Liquidity only)
87
Trade & Supply Chain
Payments & Cash
Asia Expansion
Franchise expansion into Asia has driven volumes and income growth
Customer Segments
75% of Assets with Financial Institutions, Resources and Global Diversified. 60% of assets are Intra-Asia trade
Strong Deposit Growth
Transactive Asia
Deposit growth assisting to offset margin impact from low base rate environment
Coverage to be extend beyond existing 53 markets to Taiwan, India, Philippines and China in 2014
Strong Market Position
#1 in Australia and NZ1
Rapid growth in Asia, now ranked #5 in the region2
Provided ~$50b in surplus deposits after self funding low risk trade assets
Asian Income Growth
9% growth in Asia revenue driven by increased volumes and better quality funding mix
Self funded
17.429.3 30.6 35.6
58.165.7 65.1
74.6
2010 2011 2012 2013
Asia
Global
$b
$b
Global
Asia
401 487
614 664
FY10 FY11 FY12 FY13
$m
758
817
905
858
FY10 FY11 FY12 FY13
$mCAGR 4%
15%
8%
-5%
5.79.9
13.117.3
9.5
15.2
19.0
24.1
2010 2011 2012 2013
27%
90% of portfolio
has a tenor <1
year
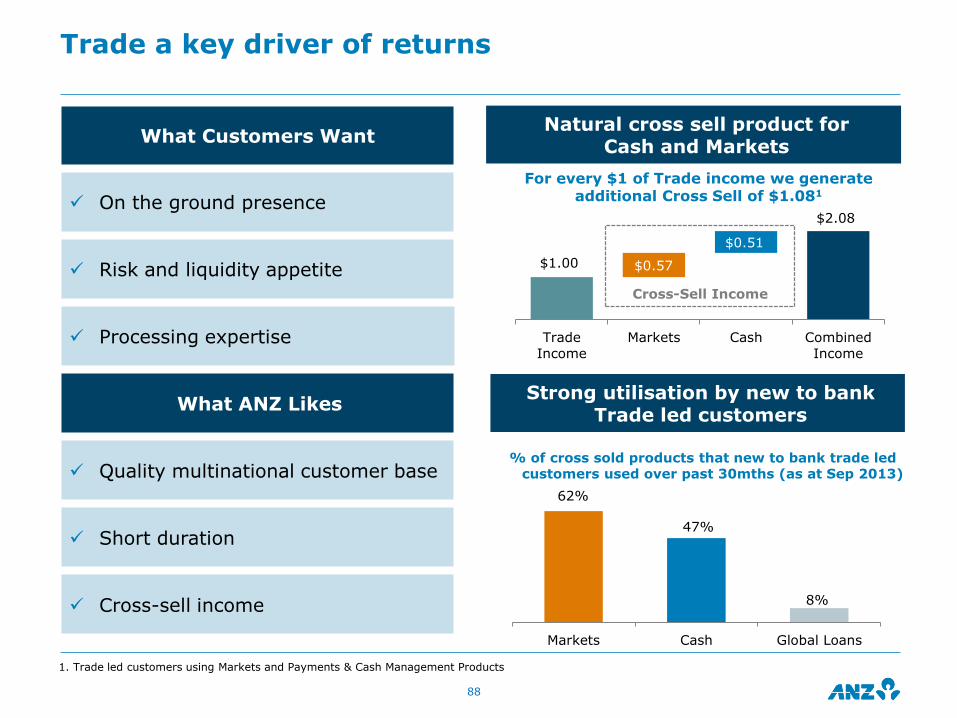
1. Trade led customers using Markets and Payments & Cash Management Products
Trade a key driver of returns
Natural cross sell product for Cash and Markets
88
Strong utilisation by new to bank Trade led customers
What Customers Want
On the ground presence
Risk and liquidity appetite
Processing expertise
What ANZ Likes
Quality multinational customer base
Short duration
Cross-sell income
$1.00
$2.08
$0.57
$0.51
Trade
Income
Markets Cash Combined
Income
% of cross sold products that new to bank trade led customers used over past 30mths (as at Sep 2013)
62%
47%
8%
Markets Cash Global Loans
For every $1 of Trade income we generate additional Cross Sell of $1.081
Cross-Sell Income

Global Markets
Global Markets income growth by product, client and geography
(FY13 v FY12)
An improved risk profile
89
Increased & Diversified Earnings
11% Markets income growth - FX income up 14% YOY
Expanded Asia Footprint
Contribution to Global Markets sales from Asian clients
Overall FX Services voted by Financial Institutions1
Regional Best Sales Service in Interest Rate Derivatives – G101
#1
#1
Enhanced Risk Systems Framework
Improvement in Traded Income/$ VAR to global best practice levels driven by a strong risk framework
16%
1. Asiamoney FX & FI polls 2013
24%
Trading income on the back of client flows and improved execution capabilities 28%
7% 8%
25%
Australia& New Zealand
Europe & America Asia
15% 12%
FinancialInstitutions
GlobalDivisified
14%6%
11%
ForeignExchange
FixedIncome
CapitalMarkets
Products Client Segment
Geography
42
91
170198
1712 17 14
0
50
100
150
200
250
FY10 FY11 FY12 FY13
Global Markets Sales & Trading (Traded)
Balance Sheet (Non-Traded)
Income/$ VAR$m

Global Markets showing consistent growth while building out capabilities in core franchise products
Global Markets Income by Type
Global Markets Income by Geography
Global Markets Income
Global Markets Income by Product
90
977 990 1,003 1,112
879 704 904998
1,8561,694
1,9082,110
1,112 998
FY10 FY11 FY12 FY13 1H13 2H13
0
500
1,000
1,500
2,000
2,500
FY10 FY11 FY12 FY13 1H13 2H13
Sales Trading Balance Sheet
0
500
1,000
1,500
2,000
2,500
FY10 FY11 FY12 FY13 1H13 2H13
Aus/NZ APEA
29%36%
41%
40% 45%71% 64% 59%
60% 55%
0
500
1,000
1,500
2,000
2,500
FY10 FY11 FY12 FY13 1H13 2H13
FX Fixed Income Capital Markets Other
$m
$m
$m
$m
43%
57%
4% CAGR
18% APEA CAGR
2H
1H
Avg. 1H:2H Income split ≈
53%:47%
Highest ever proportion from APEA

Diversification of income and more stable risk adjusted margins
Income
1. Risk Adjusted NIM represents NII/CRWA
91
Net Interest Margin
2.6
2.93.1
2.9
3.33.2
3.3 3.3
1H10 2H10 1H11 2H11 1H12 2H12 1H13 2H13
Net Interest Income Other Operating Income
2.64%
2.47%
3.28%
2.61%
2.00%
2.50%
3.00%
3.50%
4.00%
4.50%
1H10 2H10 1H11 2H11 1H12 2H12 1H13 2H13
Risk Adjusted NIM ex Global Markets
NIM ex Global Markets
IIB ex Markets NIM down 67bps
Risk Adjusted NIM down 17bps
1
AUDb
6% CAGR
NIM is more stable on a risk adjusted basis reflecting an improved portfolio risk profile

New Zealand Division

Our strategy has been to significantly simplify and focus our business to create scale
Scale advantage 2017+
Leverage Scale 2013-2016
Create Scale 2010 - 2013
2010 2012 2013 2017+
Systems 2 1 1 1
Brands 2 1 1 1
Brand Consideration1 27% 32% 39% Market leading
Staff engagement 64% 74% 76% Best practice
CTI – NZ Geography2 49.1% 47.7% 42.5% Market leading
CTI – NZ Division2 48.4% 50.6% 43.1% Market leading
Cash profit NZDm2 545 827 1,068
• Brought together 2 brands as ANZ
• Moved to 1 core banking system
• Created 1 management structure
• Simplified and moved to a single set of policies, processes and products
• Leverage global hubs and shared platforms
• Further improve branch coverage
• Roll out customer data focused sales strategy
Note: 1. Brand consideration - sourced from IPSOS Brand Tracking (first choice, or seriously considered) 2. NPAT and CTI includes NZ Simplification Programme (NZS) costs (pre-tax: FY10 nil, FY12 NZD196m, FY13 NZD22m) 3. Represents NZ Division, unless otherwise noted
• Natural competitive advantage in key markets
93

Growth FY13 v FY12
62% ANZ@work1
22% Trade Finance
33% Kiwisaver FUM
29% Direct Insurance sales2
10% Time spent on sales by frontline staff
Creating scale to build a stronger bank
Cost to Income Loan to Deposit Ratio
Net Profit After Tax Return on RWA
Increased Cross Sell
94
1. ANZ@work is a banking benefits program for employees of ANZ‟s corporate, institutional and selected commercial customers. The program provides consumer product benefits and discounts along with local relationship and financial literacy support, because of the relationship ANZ has with the customers‟ employer
2. Includes sales of white-labelled General Insurance products
FY10 FY13
NZ Simplification Programme 199%
187%
177%175%
Sep 10 Sep 11 Sep 12 Sep13
545
751827
1,068
FY10 FY11 FY12 FY13
1.1%
1.6%1.7%
2.1%
FY10 FY11 FY12 FY13
NZ Division NZ Geography
NZDm
FY10 FY13
48.4%
43.1%
49.1%
42.5%

New operating model is enabling productivity and efficiency improvements
Revenue per FTE Revenue per Branch
Branch Coverage1 Cost % average total
assets
1. Branch coverage measures the areas in which ANZ is represented relative to where New Zealanders do business 2. NZ Simplification pre-tax costs were FY12 NZD196m; FY13 NZD22m; 1H13 NZD18m; 2H13 NZD4m
95
Optimising branch network
7% Branch coverage up 7% over 3 years
Branch costs down 7% YOY (-6% HOH) 7%
Leveraging scale
10% Revenue per FTE up 10% YOY (+8% HOH)
Revenue per branch up 14% HOH 18%
Achieving productivity gains
Revenue per branch up 17% YOY (+16% HOH) 17%
3% Costs down 3% YOY (-1% HOH) ex. NZ Simplification Programme costs2
Simplified processes and removed duplication
Simplified Business
Productivity savings enabling increased investment
Investing in sales capability leading to increased retail sales from proprietary channels & improved
customer experience
328.5
361.9
FY12 FY13
8.8
10.3
FY12 FY13
75.0
82.0
2010 2013
1.51
1.24
FY12 FY13
NZ Simplification Programme%%
NZDk NZDm
+10% +17%

Transforming our lending book by focusing on growing mortgage share and balancing risk in the Agri portfolio…
96
System lending growth driven by mortgages
ANZ out-performing system in key home loans segment
Growing mortgages through Retail and Small Business Bank, de-leveraging in Agri
Agri exposure rebalanced and credit quality improved
1. Source: RBNZ schedule S7; September 11 to August 13 2. Source: RBNZ schedule S7; September 12 v August 13 3. Terralink
1.3
1.0
0.6
-1.5
-1.0
-0.5
0.0
0.5
1.0
1.5
Sep 11 Sep 12 Sep 13
Agri Net impaired assets
85.5
91.5
1.3
4.20.5
FY11 Retail SBB CommAgri FY13
95
100
105
110
115
Sep 11 Mar 12 Sep 12 Mar 13
System ANZ
Growth in home loans – ANZ v System1
Indexed Sep 11 = 100
Agri
Business
Aug 13
|
System lending growth1
CAGR 3%
Total Lending and Impaired Assets
Mortgage share2 up 20bps YTD to 30.8%
20bps
Cards/Personal
#1
#1 mortgage sales3 YTD in Auckland & Christchurch
NZDb
Mortgages
85.5 88.0 91.5
NZDb
80.6% 81.5% 82.5%
19.4% 18.5% 17.5%
70%1%
14%
15%

… and this is driving continued improvement in credit quality
97
Net impaired assets (NIA) Total provision charge
90+ days arrears
1,2951,158
979881
573
1.50%
1.34%
1.11%
0.99%
0.63%
Sep 11 Mar 12 Sep 12 Mar 13 Sep 13
Net Impaired Assets NIA as % GLA
NZDm
349
165 98 119
101 90 36 10
-100
0
100
200
300
400
1H10 2H10 1H11 2H11 1H12 2H12 1H13 2H13
NZDm
IP Charge CP Charge
0.00%
0.40%
0.80%
1.20%
2007 2008 2009 2010 2011 2012 2013
Mortgages Commercial Agri

1. NZ brand consideration change from August 2010 to August 2013 sourced from IPSOS Brand Tracking (online survey, first choice or seriously considered). Six month rolling average
Single brand focus has resulted in increased consideration and higher profile
ANZ‟s advertising stands out in the market and is delivering high advertising awareness. Combining our
marketing spend from two brands into one is having the expected impact
Increased Brand Consideration… … driven by best in market advertising campaigns
Brand Consideration1
98
2013 2013
ANZ awarded „New Zealand Bank of the
Year‟
2012 Nexus Gold Awards ANZ Simplification Program: Customer
Transition Communications
2013
2012 Nexus Gold Awards ANZ Simplification
Program: National Bank Brand Change Direct
Communications
… and evidenced by greater market recognition
98
-7%
-7%
-3%
2%
12%
Peer 1
Peer 2
Peer 3
Peer 4

1. Brand consideration – IPSOS Brand Tracking 2. Branch coverage represents the areas in which ANZ is represented relative to where people do business 3. Excludes Small Business Banking 4. Mobile Mortgage Manager
Retail – Driving sales through investment in sales capability, channels and branch coverage
99
Strong result
Increased sales capability driving higher % of mortgage sales3 through branches
Cash profit up 4% YOY & 15% HOH
CTI down 2% YOY & 3% HOH
Consideration1 scores
Staff engagement up 13% to 76% over 3 years
4%
2%
12%
13%
Increased branch coverage2
Added branches in 8 new communities over 2 years
Improved insurance sales performance of front line staff that completed new life insurance training
Average time frontline spent on sales
Sales of general and life insurance products
Coverage
30%
10%
Increased sales capability during the year
20%
75%
82%
2010 2013
3943
48
30 29 313128
21
2H12 1H13 2H13
Branch Brokers MMM
% of mortgage sales by channel
4

Retail - fewer, simpler products
Increased cross sell
100
The proportion of Retail customers with
four or more needs met has increased 9%
over the past three years
A simplified product suite ANZ has award-winning products, including more 5-star Credit Card Ratings1
than any other bank – which has driven market share gains
Flexiplus Mortgage
Low rate
Fixed Mortgage
+9% 2013 v 2010
Freedom transaction
Airpoints Platinum
Cashback Rewards
1. Source: Canstar Credit Card rating report November 2012
160
75
2010 2013
Making it easier for our customers to access our products
# Retail & Business Banking Products

67% 67%
Total
Portfolio
Auckland
NZDk
35%
16%
25%
15%
9%0-60%
61-70%
71-80%
81-90%
90%+
Average LVR at Origination4
Average Loan Size at Origination4
24%
30%
27% 28%
FY10 FY13
22%
27%
23%22%
FY10 FY13
Share of new mortgage sales in Auckland1
Share of new mortgage sales in Christchurch1
ANZ#2
ANZ#1
ANZ#2
ANZ#1
Leading peer bank
247
328
Total
Portfolio
Auckland
Winning in key growth mortgage markets without increasing risk
101
Winning share in Auckland and Christchurch
Auckland mortgages reflect higher average loan size but similar portfolio quality
1. Source: Terralink 2. New RBNZ restrictions effective 1 October 2013 require banks‟ new >80% LVR mortgage lending to be capped at 10% of total new mortgage lending. Banks must be compliant by March 2014 3. RBNZ publication, Regulatory impact assessment: restrictions on high-LVR residential mortgage lending, August 2013 4. 2H13 Average
#1 Share of new mortgage sales1 in Auckland and Christchurch
67% Average LVR at origination4
24% >80% LVR mortgages
>80% LVR lending accounts for c.24% of ANZ NZ‟s existing mortgage book2 ANZ >80% LVR new mortgage lending is less than the NZ banks average of c.30%3 due to our lower emphasis on >90% LVR lending
Loan to Valuation Ratio - portfolio composition (on balance sheet)

HOH profit growth (+17% YOY) driven by small business lending
YOY increase in revenue cross sell to $93m
Higher risk exposures at default (CCR1 7-10) has reduced by NZD3b since FY10
Return on RWA up 18% YOY
Risk
Commercial - Strong growth in Small Business Banking
102
Profit growth driven by lending volumes and improved economic environment Lending and Deposit Growth
SBB is performing well Considerable improvement in book quality
11%
18%
1. Customer Credit Rating 2. Normalised to exclude EFTPOS 3. EAD=Exposure at Default
11%
4,850
5,470
FY12 FY13
526
549
FY12 FY13
9
1 26
1 2-3 -5
SBB UDC Commercial Agri
13
3 3
-1
6
1 2 1
SBB UDC Commercial Agri
Lending Growth %
Deposit Growth %
YOY
HOH
SBB revenues2 SBB new to bank customers
NZDm
8 311
3
237
2822
6061
39
26
6475
29 36 38
66
FY10 FY13 FY10 FY13 FY10 FY13
7-10
5-6
CCR
AgriCommercialBusiness Bank
EAD3 distribution by CCR
0-4
%13%
Lower CCR 7-10 exposures have reduced EAD by NZD3bn in Commercial & Agri
Strong
Fair
Impaired
4%

Commercial – delivering insight to our customers and connecting them to the region
103
Connecting customers abroad
Customer tours to India, Hong Kong and China
Leading the Agribusiness market
Best Agri Bank
Strategic Partner: National
Fieldays
Sponsor:
Young
Farmers
Providing thought-leadership
„Passing the Baton‟
Succession planning guide
Sector focus papers
UDC - 75 years of providing asset finance to customers

Customers are increasingly using digital channels to do their banking
% of transactions2 using digital channels
1. Source: Apple App Store, Google Play 2. Volume of retail transactions by number
% of customers actively using Internet Banking or goMoneyTM
104
Greater than 50% of ANZ NZ customers are using digital channels to do their banking
>50%
57% of customer transactions now digital (up 5% YOY)
57%
ANZ goMoneyTM is currently the most downloaded banking app in New Zealand
#1 Banking App1
48%
52%53%
57%
1H12 2H12 1H13 2H13
38%
52%47%
FY10 FY13 FY13 Australia

ANZ FastPayTM to be launched
105
• Award winning mobile merchant app currently operational in Australia and soon to be launched in New Zealand
• Enables business customers to process credit and debit card payments securely using their iPhone or Android smartphone
• Provides same day access to takings in your linked ANZ Business Account
• Receipts are emailed directly to the customer

Global Wealth

Global Wealth supports ANZ‟s Super Regional Strategy
107
Improved customer economics
Delivering value to the Group
• Deeper and longer customer relationships with improved customer economics
• Diversified revenue stream (significant source of non-interest income)
• Important and growing source of liquidity
Customer Attrition Revenue per customer
Significant source of other operating income (OOI) for ANZ
Important source of liquidity
FY12 FY13
1. Wealth Sourced includes deposits & lending from Private Bank and E*TRADE which is sourced by Global Wealth but registered in other divisions. 2. Wealth OOI includes Other Operating Income, Net Funds Management and Insurance Income
FY12 FY13
Without
Wealth
With
WealthWithout
Wealth
With
Wealth
-45% +65%$b
Wealth OOI2
23%
Non-WealthANZ OOI
77%
Wealth OOI2
25%
Non-WealthANZ OOI
75%
95
1310
5
22
126
11
14
26
5
Wealth sourced1Wealth
Deposits Loans Deposits Loans
$b

Embed wealth solutions into all customer touch points across the bank
108
Increased Wealth Solutions to ANZ Customers
Direct Insurance sales
ANZ Smart Choice Super Accounts and FUM KiwiSaver Accounts and FUM
FY13 Sales FY13 Sales FUM FUM2
1. Includes sales of white-labelled General Insurance products 2. KiwiSaver FUM in AUD
+11%
39 52
FY12 FY13
250 283
FY12 FY13
Australia New Zealand1
+33%+13%
NZDm$m
(Includes Australia, New Zealand & Asia)
2,520
3,813
FY12 FY13
„000
110
275
1H13 2H13
FY13 Sales
+51%
FY13 Sales FUM
+150%
FUM2
„000
$m $m
Call Centre& Online
BranchChannel
25(50%)
25(50%)
17(19%)
BranchChannel
Other
71(81%)
Total: 50,000 Total: 88,000
FY12 FY13

Deliver higher returns in Life Insurance
109
Retail Life Lapse Rates
Insurance Cash Profit Retail Life Insurance Inforce
Awards
Money Management
Retail Life Insurance awarded „Risk
Company of the Year‟ (4th consecutive year)
CANSTAR
Awarded „Outstanding
Value‟ for Direct Life Insurance in
2013
CANSTAR
Awarded „Outstanding Value‟ for Life
Insurance in 2013 (6th consecutive year)
Direct Life Insurance Life Insurance
Australia
$m
221 203
FY13FY12
9%+10%
13.9% 13.7%
16.6%15.9%
FY12 FY13 FY12 FY13
%
$m
20bps 70bps
839920
128
147967
1,067
FY12 FY13
Australia New Zealand
Australia New Zealand
%

Position for growth in Funds Management
110
Awards Efficiently delivering MySuper
Funds Management Cash Profit Funds Under Management (FUM)
CANSTAR
ANZ SmartChoice Super awarded
„Outstanding Value‟ in all life stage
categories for 2013
Money Magazine
OneAnswer Frontier awarded „Best Featured
Pension Product‟ for 2013
FundSource
New Zealand Fund Manager and
KiwiSaver Manager of the Year for
2012
• MySuper license approved by APRA
• Our MySuper compliant offering (ANZ Smart
Choice Super) is a market leading solution
that secures our ability to capture the growth
of superannuation in Australia
• With ANZ Smart Choice Super, we are seizing
the opportunity of regulatory reform to
materially grow our business and increase
market share
42.9 47.4
8.8 11.2
FY12 FY13
$b
Australia New Zealand
+13%
128
68
FY13FY12
88%
51.758.6
$m
The material in this presentation is general background information about the Bank‟s activities current at the date of the presentation. It is information given in summary form and does not purport to be complete. It is not intended to be relied upon as advice to investors or potential
investors and does not take into account the investment objectives, financial situation or needs of any particular investor. These should be considered, with or without professional advice when
deciding if an investment is appropriate
This presentation may contain forward-looking statements including statements regarding our intent, belief or current expectations with respect to ANZ‟s business and operations, market
conditions, results of operations and financial condition, capital adequacy, specific provisions and risk management practices. When used in this presentation, the words “estimate”, “project”,
“intend”, “anticipate”, “believe”, “expect”, “should” and similar expressions, as they relate to ANZ and its management, are intended to identify forward-looking statements. Readers are cautioned not to place undue reliance on these forward-looking statements, which speak only as of the date hereof. Such statements constitute “forward-looking statements” for the purposes of the United
States Private Securities Litigation Reform Act of 1995. ANZ does not undertake any obligation to publicly release the result of any revisions to these forward-looking statements to reflect events or
circumstances after the date hereof to reflect the occurrence of unanticipated events.
For further information visit
www.anz.com
or contact
Jill Craig Group General Manager Investor Relations
ph: (613) 8654 7749 fax: (613) 8654 9977 e-mail: [email protected]