Heading 1 - NERC Open Research Archive
157
Science Report Methods to Assess, Model and Map the Environmental Consequences of Flooding: Literature review (June 2008) i Methods to Assess, Model and Map the Environmental Consequences of Flooding Literature review (June 2008) Science Report – SC060062 Product code
Transcript of Heading 1 - NERC Open Research Archive
Science Report Methods to Assess, Model and Map the Environmental Consequences of Flooding: Literature review
(June 2008)
i
Methods to Assess, Model and Map the Environmental Consequences of Flooding Literature review (June 2008) Science Report – SC060062
Product code
Science Report Methods to Assess, Model and Map the Environmental Consequences of Flooding: Literature review
(June 2008)
ii
The Environment Agency is the leading public body protecting and improving the environment in England and Wales.
It’s our job to make sure that air, land and water are looked after by everyone in today’s society, so that tomorrow’s generations inherit a cleaner, healthier world.
Our work includes tackling flooding and pollution incidents, reducing industry’s impacts on the environment, cleaning up rivers, coastal waters and contaminated land, and improving wildlife habitats.
This report is the result of research commissioned and funded by the Environment Agency’s Science Programme.
Published by: Environment Agency, Rio House, Waterside Drive, Aztec West, Almondsbury, Bristol, BS32 4UD Tel: 01454 624400 Fax: 01454 624409 www.environment-agency.gov.uk ISBN: XXXXXXXXXX © Environment Agency – July 2008 All rights reserved. This document may be reproduced with prior permission of the Environment Agency. The views and statements expressed in this report are those of the author alone. The views or statements expressed in this publication do not necessarily represent the views of the Environment Agency and the Environment Agency cannot accept any responsibility for such views or statements. This report is printed on Cyclus Print, a 100% recycled stock, which is 100% post consumer waste and is totally chlorine free. Water used is treated and in most cases returned to source in better condition than removed. Further copies of this report are available from: The Environment Agency’s National Customer Contact Centre by emailing: [email protected] or by telephoning 08708 506506.
Author(s): Dr Gareth Old (Editor) Centre for Ecology and Hydrology Dissemination Status: Released to all regions Publicly available / Restricted Keywords: Maximum of 10 Research Contractor: Contractors name and address with tel. no. Environment Agency’s Project Manager: Project Manager’s name, Science Department Collaborator(s): In alphabetical order (refer to guidance document) Science Project Number: SC060062 Product Code: XXXXXXXXXXXX-E-P

Science Report Methods to Assess, Model and Map the Environmental Consequences of Flooding: Literature review
(June 2008)
iii
Science at the Environment Agency Science underpins the work of the Environment Agency. It provides an up-to-date understanding of the world about us and helps us to develop monitoring tools and techniques to manage our environment as efficiently and effectively as possible.
The work of the Environment Agency’s Science Department is a key ingredient in the partnership between research, policy and operations that enables the Environment Agency to protect and restore our environment.
The science programme focuses on five main areas of activity:
• Setting the agenda, by identifying where strategic science can inform our evidence-based policies, advisory and regulatory roles;
• Funding science, by supporting programmes, projects and people in response to long-term strategic needs, medium-term policy priorities and shorter-term operational requirements;
• Managing science, by ensuring that our programmes and projects are fit for purpose and executed according to international scientific standards;
• Carrying out science, by undertaking research – either by contracting it out to research organisations and consultancies or by doing it ourselves;
• Delivering information, advice, tools and techniques, by making appropriate products available to our policy and operations staff.
Steve Killeen
Head of Science

Science Report Methods to Assess, Model and Map the Environmental Consequences of Flooding: Literature review
(June 2008)
iv
Executive summary There is currently no standard approach for evaluating the consequences of flooding on the natural environment within a flood risk assessment. The purpose of the overall project is to develop methods for understanding and assessing the impacts of flooding on the natural environment.
This report reviews the policy and planning drivers for flood risk management, the main environmental consequences of flooding and, modelling and spatial data analysis techniques. The environmental consequences of flooding (positive and negative) are considered in detail for key aspects of the natural environment to provide the basis for developing an objective assessment methodology later in the project. These chapters build on preliminary considerations of the environmental consequences of floods presented in the scoping study. At present ecological consequences of flooding are likely to rely upon expert knowledge unless a site specific problem is being addressed with a specific model. When considering the consequences of flooding for each aspect of the natural environment relevant tools and techniques that are currently being developed or available are summarised. The review builds on information presented in the scoping study (ref). The review begins by emphasising the ecological diversity and productivity of floodplain environments and the current recognition of this. The various processes of flooding ecosystems are considered.
The next section considers which aspects of policy and planning drivers need to be delivered through this project. An overview of the requirements of key directives is presented. The policy and planning drivers include the following:
• International Commitments and Directives
• National legislation, policies, strategies and commitments
• Environment Agency/other Operating Authorities Strategies, Plans and systems
The next section considers ways to better assess, model and map the environmental consequences of flooding from the sea. It begins with a definition of the coastal zone. The key coastal processes relating to flooding from the sea are described together with the general nature of this type of flooding. The biodiversity assets of the coastal zone are summarised and the potential impact of flooding from the sea upon biodiversity is indicated. The general policy framework for conserving biodiversity in England and Wales is set out and the way in which this is presently implemented in relation to the management of flood risk in the coastal zone is described. Current, risk-based approaches to the assessment, modelling and mapping of the consequences of flooding from the sea are then discussed and ways in which these approaches might be developed to better incorporate biodiversity issues, are outlined. The general aim is to maximise the use of existing information and tools, as far as possible, while allowing for the incorporation of new and/or more complex tools later, if necessary.
A consideration of modelling flood hydrology follows in which the three approaches are evaluated:

Science Report Methods to Assess, Model and Map the Environmental Consequences of Flooding: Literature review
(June 2008)
v
• Statistical analysis of flood magnitude and frequency
• Event-based modelling of flood generation mechanisms
• Continuous simulation of long flow records, with peaks abstracted for statistical analysis
Each approach has its benefits and suitabilities, with ways to transfer information from sites with long records to those that are ungauged. The appropriateness of these ways of assessing the environmental consequences of flood management is considered. Assessing the ecological consequences of flood management options is likely to require the assessment of additional parameters and indicators not included in the current MDSF (e.g. seasonality, more frequent floods, habitat extent, water temperature, sediment).
A consideration of the consequences of floods for sediments follows. For this it is necessary to understand how the sediment regime is related to surface runoff from the catchment and the flow regime of the river. The active sources and processes of sediment transport during floods in natural and improved channels are discussed before considering the dependence of channel form on flood magnitude. The significance of sediment deposition and storage in river channels and on floodplains is discussed. The importance of high flows for maintaining river gravel habitat is highlighted.
The next section considers the consequences of flooding for sediment and water quality. The major sources of sediment associated contaminants and nutrients are presented. Mobilisation and deposition of these sediments from floodplains and within river channels is discussed before considering the ecological implications of the nutrients and contaminants.
Discussion of the effect of flooding on birds and their invertebrate prey follows. The bird species that would be most affected by flooding are those that feed and nest in floodplain areas. These include waterfowl, such as ducks, coot, and moorhen, and waders, such as lapwing, curlew and snipe. Floods influence the suitability of habitat for birds through affecting food availability, nesting habitat, and cover from predators.
The next section concerns the effects of flooding on freshwater, anadromous and diadromous fishes within fluvial ecosystems. Fish and their habitats are strongly influenced by flow regime, and requirements and tolerances vary, not only between species but also between developmental stages within species. Flooding can affect fish populations directly, through encouraging migration, washout, stranding, or more indirectly through enabling access to floodplain environments, impacts on habitat quality and food availability. Consideration is given to how varying degrees of flooding can have both detrimental and beneficial consequences throughout all life stages of fish and how relevant research could be applied to improve hydrological management and in-stream habitat management for the benefit fish populations.

Science Report Methods to Assess, Model and Map the Environmental Consequences of Flooding: Literature review
(June 2008)
vi
A consideration of the consequences of flooding for macro-invertebrates follows. Their ecological requirements are complex and there are many gaps in our knowledge due to limited understanding of individual species requirements. River flow, temperature and the composition and stability of the substratum are reported as the three dominant variables controlling their distribution and survival.
The next section addresses the impacts of flooding on vegetation dominated by vascular plants. The general impacts are discussed before considering the inundation of floodplain semi-natural vegetation, including wetlands, grasslands and forests. The impacts of high flood flows on aquatic macrophytes and marginal riparian vegetation are summarised. There is also some consideration of saline inundation.
The next part of the review considers the potential for modelling and spatial data analysis to assess the consequences of flooding. It begins with a consideration of the potential and limitations of hydro-ecological models. The different types of models are discussed and exemplified. The key issues associated with the implementation of such models are discussed and these include the availability of input data, their range of application and use by practitioners.
The following section reviews the hydraulic modelling techniques that could be used as tools to assess the environmental consequences of flooding. The note covers a variety of hydraulic models that are used in flood risk management in the UK. It also details the outputs from the models and the data that are required to set the various models up.
The final section considers the application of Geographical Information Systems to assess and map the environmental consequences of floods. GIS is routinely used to process and display spatial data related to flooding, and to integrate spatial calculations. There is an enormous body of information on such GIS applications. A Google search on the terms “flooding”, "environmental impact", and “gis” produced 290,000 hits. A few of these documents have been viewed, but no attempt has been made to review them formally. Rather, a brief description is given of (i) the GIS-based Modelling and Decision Support Framework (MDSF), commissioned by the Environment Agency to support the development of Catchment Flood Management Plans (CFMPs), and (ii) how “Broad Scale Ecosystem Assessment” is being introduced alongside the current economic and social assessment of flood management strategies.
This review has demonstrated the complexity of the relationship between flooding and the natural environment. Characteristics of floods (in space and time) that are good for one aspect may be detrimental to another. Management strategies will need to acknowledge this and respond by protecting/enhancing priority environmental aspects of a given catchment in a flexible way.
Initial suggestions for data requirements have been identified within each section of this review, although more work will be needed during the next phase of the study. Relevant tools and techniques that are currently under development or in use are discussed, although the fundamental purpose of this project is to develop appropriate prototype tools and techniques.

Science Report Methods to Assess, Model and Map the Environmental Consequences of Flooding: Literature review
(June 2008)
vii
As well as legislative reasons, considering ‘social’ ‘economic’ and ‘environmental’ factors is part of sustainable decision making and supports Environment Agency policy of flood risk management.

Science Report Methods to Assess, Model and Map the Environmental Consequences of Flooding: Literature review
(June 2008)
viii
Contents
Executive Summary iv
Introduction 1
Policy and planning drivers for flood risk management 5
Issue 2 Coastal ecosystems and the consequences of flooding 19
Consequences of flooding for freshwater ecosystems:
Issue 3 Hydrology to assess the environmental consequences of flooding 41
Issue 4 Sediments and the consequences of flooding 47
Issue 5 Sediment and water quality – consequences of flooding 60
Issue 6 Birds and terrestrial invertebrates – consequences of flooding 66
Issue 7 Fish populations: the consequences of flooding 75
Issue 8 Macro-invertebrates (Aquatic invertebrates) and the
consequences of flooding 89
Issue 9 Vegetation and plant ecology – consequences of flooding 96
Consequences of floods: Modelling and spatial data analysis:
Issue 10 Hydro-ecological modelling for assessing the consequences of flooding 108
Issue 11 Hydraulic modelling methods used in flood risk management 113
Issue 12 Geographic Information Systems to assess the environmental consequences of flooding – with addendum on MDSF2 132
Concluding Remarks 144

Review: Freshwater Ecosystems, Flooding and Vegetation
Science Report Methods to Assess, Model and Map the Environmental Consequences of Flooding: Literature review
(June 2008)
1
1 Introduction G. Old1 and J. Thompson2
(1Centre for Ecology and Hydrology, 2Univeristy College London)
Rivers/coasts and their associated floodplains are some of the most ecologically productive and diverse environments on earth. They are also characterised by complex and dynamic geomorphology. Many Special Areas of Conservation (SACs) that are designated under the EC Habitats Directive to meet obligations to conserve wildlife and habitats are located on river and coastal floodplains. Furthermore, floodplains host many areas designated as Special Protection Areas (SPAs) under the Birds Directive.
Water bodies, including rivers, estuaries, near shore seas and lakes are required to reach Good Ecological Status by 2015 (EU Water Framework Directive (WFD)). The quality elements for the classification of ecological status are presented in Annex V of the Directive (EC, 2000). The biological elements include the composition and abundance of aquatic flora, and invertebrate and fish fauna. The hydromorphological elements supporting these biological elements include: hydrological regime, river continuity, and morphological conditions. The chemical and physico-chemical elements supporting the biological elements include thermal, oxygenation and nutrient conditions.
Changes to the flow regime and extent of flooding of a river/coast are likely to have implications for the geomorphology and ecology of the floodplain environment. In this project the consequences of river flooding from impoundments are not considered. In such cases environmental consequences may be particularly severe. For example, high flows may occur at unnatural times of year, and hydrographs may be a different shape. Furthermore, water released from a reservoir may be cooler in summer / warmer in winter (Jensen, 2003), lower in dissolved oxygen and suspended sediment (often with complete absence of coarse sediment), and higher in nutrients (e.g. Collingwood, 1966) than downstream river water. Water discharged from high spillways may also be supersaturated with gases (Bell and DeLacy 1967 in Bizere, 2000).
Socio-economic considerations have always been central to river and coastal flood management. The protection of residential/industrial properties and infrastructure from high river flows has always been a top priority. Conversely the avoidance of extreme low flows, unsuitable for industrial users of river water (e.g. mill owners, abstractors), through the introduction of compensation schemes has also been a key issue.
However, European legislation (WFD), the research community and wildlife conservation groups are increasingly requesting management strategies that are sensitive to the needs of a broad ecology (e.g. invertebrates, mammals, non-migratory fish, birds, and riparian and aquatic vegetation) (e.g. Postel and Richter, 2003).

Science Report Methods to Assess, Model and Map the Environmental Consequences of Flooding: Literature review
(June 2008)
2
Types of Flooding:
Flooding of ecosystems can result from a number of processes:
Direct Precipitation (Surface water flooding): Intense rainfall which exceeds the soil’s infiltration capacity can lead to the ponding of surface water which can be extensive. In some wetland areas subject to high water tables, especially in winter, rainfall can lead to the rapid expansion of surface water as the limited soil reservoirs are filled. For example, Thompson et al. (2004) reported the influence of winter precipitation upon the inundation of the Elmley Marshes, an example of lowland wet grassland in North Kent. Similarly, precipitation falling upon areas already flooded by another mechanism further contributes to inundation.
Overland and subsurface flow from adjacent uplands (Surface and groundwater flooding): Freshwater ecosystems including wetlands can be flooded as a result of water delivered from adjacent uplands (following surface and/or subsurface pathways). Drainage from slopes onto low-lying, wide floodplains can favour the development of saturated conditions over wide areas (Burt and Haycock, 1996). This promotes the generation of saturation-excess overland flow within and immediately adjacent to floodplains. The impact of these flows in terms of the volume of water provided and the rate at which they reaches an area is dependent upon the nature of the hydrological connectivity between the contributory area in which flow is generated and the down slope area. The relative size of these contributory areas compared with the environments they discharge into is also an important control on the significance of these inflows (McCartney, 2000). Flooding by water following a surface pathway may be particularly damaging as response times may be very short, velocities are often high and water may have high sediment concentrations.
High water tables (Groundwater flooding): As previously noted, many wetland areas have water tables that are close to the ground surface, especially in winter but also throughout summer. For example, Burt (1995) suggested that even in dry summers, the water table in many peat soils rarely falls much beyond 1 m below the surface while above the water table soils remain near saturation. Similarly, lowland wet grasslands are characterised by permanently high water tables (e.g. Joyce and Wade, 1998; Thompson et al., 2004). Within riparian and lacustrine wetlands high water tables may also be retained by seepage from the adjacent rivers and lakes respectively. In these environments, where water tables are close to the surface, relatively low rainfall can cause surface saturation and extensive source areas for saturation-excess overland flow. Within the North Kent Marshes for example, soils are saturated, or close to saturation, for several months through autumn and winter and saturation-excess overland flow contributes a significant proportion of the water inundating the marsh surface. Particular areas that favour the generation of flooding are shallow relic channels on the marsh surface. These areas become saturated earlier as the groundwater approaches the surface and subsequently remain saturated for longer as the water table falls in spring (Thompson, 2004; Thompson et al., 2004). Groundwater flooding may have specific ecological implications given its often long duration.
River (fluvial flooding): Under natural conditions wetlands located on floodplain areas (riverine wetlands) are subject to inundation from the river when it is in flood. The characteristics of flood pulses, such as their frequency, duration and magnitude, are controlled by the regime of the river which in turn can be modified by land use change. Low order upland streams experience numerous flood peaks and the flood pattern is irregular
Review: Freshwater Ecosystems, Flooding and Vegetation
Science Report Methods to Assess, Model and Map the Environmental Consequences of Flooding: Literature review
(June 2008)
3
since these catchments respond rapidly to local precipitation. Heavy local rainfall over the catchment of such a stream can therefore result in the relatively rapid inundation of nearby wetlands. In contrast, within larger catchments, flood patterns are more seasonal and the impacts of individual precipitation events are less evident (Baker et al., in press). On a much smaller scale the flooding of freshwater environments such as lowland wet grasslands is also partly due to high winter water levels within the ditches which cross them. Flow patterns of inundation within floodplain wetlands are often complex. In many riverine wetlands it is rare for initial inundation to occur directly over the riverbank or levee. Instead, floodwater often enters wetlands via relic floodplain features such as former channels or ditch networks that become connected to adjacent river channels during periods of high water. It is often only in the later stages of a flood event, when discharges are highest, that water enters the wetland directly over the riverbank. Similarly, within wet grasslands, the first flooding from ditches often occurs as water first intercepts shallow, small-scale drainage features which link the ditches with more remote areas (Thompson et al., 2004). Natural flooding processes have been modified for the vast majority of the UK’s floodplain wetlands through the construction of embankments and other flood control infrastructure. It has been suggested that climate change will lead to increased river flooding through the 21st Century (e.g. Kay et al., 2006; Reynard et al., 2001).
Lake water inundation: Freshwater environments which are adjacent to large bodies of fresh water such as lakes, are often inundated as a result of rising lake water levels. Changes in lake level may take place in response to seasonal climatological patterns which drive the balance between precipitation and evaporation and, in turn, influence lake inflows from streams and rivers (e.g. Keough et al., 1999; Wilcox and Whillans, 1999). Seiche activity (standing wave oscillations across the span of a lake), which is characteristic of large lakes, is responsible for changes in the same wetlands over a much shorter cycle. The characteristics of lake inundation upon adjacent freshwater ecosystems varies with their hydrogeomorphic characteristics. For example, differences in flooding processes are evident between open lakeshore environments, over which lake water can readily migrate, and those which are protected by sand barriers and ridges which have more limited direct connection with lake water (Keough et al., 1999).
Freshwater estuarine inundation: Wetlands adjacent to tidally fluctuating estuaries are typically considered saline and brackish ecosystems. However, a third, freshwater, zone at the upstream end of many estuaries also experiences daily tidally induced water level fluctuations and inundation. For example, the Wash contains good examples of this type of wetland. The dominant source of water to these marshes is freshwater from the rivers with possible inputs also coming from other sources such as groundwater discharge. The marsh hydrodynamics are influenced by both freshwater discharges from upstream and downstream tidal fluctuations. The relative volumes of these controls dictate the water surface elevation at any point in time which, combined with the morphology of the river channel and the marshes, dictates the regime of water level fluctuations.
Coastal flooding by salt and brackish water (tidal): Coastal freshwater environments can periodically be inundated by sea water. This may most frequently occur during storms especially when they coincide with high tides such as the major floods of eastern England in 1953 and more recently in the west of England and Wales in March 2008. Concerns over the increasing frequency of these events are associated with projected sea level rise. Flooding of freshwater by saline sea water may have catastrophic environmental implications.

Science Report Methods to Assess, Model and Map the Environmental Consequences of Flooding: Literature review
(June 2008)
4
Aim of review
The aim of this review is to consider the environmental consequences of flooding for coastal and freshwater ecosystems. Given the limited resources available for this task in the current project the authors stress that it has not been possible to review all areas in their entirety. However, every effort has been made to prioritise and review key issues. The open workshop, held in May 2008, was used to ensure that all key knowledge had been included.

Review: Freshwater Ecosystems, Flooding and Vegetation
Science Report Methods to Assess, Model and Map the Environmental Consequences of Flooding: Literature review
(June 2008)
5
2 Issue 1: Policy and planning drivers for flood risk management
David Ramsbottom
(HR Wallingford)
2.1 Introduction The purpose of this review is to ascertain which aspects of policy and planning drivers need to be delivered through this project. This chapter builds on information presented in the scoping study (Ramsbottom et al., 2005). Relevant research that has been / is being undertaken by EA/DEFRA which should influence flood risk management will be carefully considered during the course of this project (e.g. Project Appraisal Guidance).
The review applies to all types of flooding.
2.2 Policy and planning drivers The policy and planning drivers include the following:
• International Commitments and Directives
• National legislation, policies, strategies and commitments
• Environment Agency/other Operating Authorities Strategies, Plans and systems
International Commitments and Directives
These commitments and Directives are generally implemented through UK Legislation and commitments. Those of particular relevance include:
• The Convention on Biological Diversity, leading to the UK Biodiversity Action Plan.
• The EC Birds, Habitats, Water Framework and Environmental Assessment Directives, implemented through UK legislation.
• The EC Floods Directive, which came into force late in 2007. This refers to the ecological objectives of the Water Framework Directive.

Science Report Methods to Assess, Model and Map the Environmental Consequences of Flooding: Literature review
(June 2008)
6
National legislation, policies, strategies and commitments
These cover the UK legislative framework for managing the environmental including the implementation of international Commitments and Directives. Those of particular relevance include:
• Legislation covering the roles and responsibilities of the Environment Agency and other organisations.
• Legislation covering the management of the environment, including implementation of European Directives.
• The UK Biodiversity Action Plan.
• Flood and Coastal Erosion Risk Management (FCERM) policy.
• Targets and Outcome Measures for FCERM.
• Guidance of the appraisal of FCERM projects.
Environment Agency/other Operating Authorities Strategies, Plans and systems
These cover the planning and implementation of FCERM together with aspects of the Environment Agency’s wider responsibilities for the environment. Those of particular relevance include:
• The Environment Agency’s overall strategy.
• The FCERM planning framework. This covers flood management and the associated management of the environment. Key elements include Catchment Flood Management Plans (CFMP), Shoreline Management Plans (SMP), Water Level Management Plans (WLMP) and Coastal Habitat Management Plans (CHaMPs).
• Tools and systems for managing FCERM including the Multi-Criteria Analysis (MCA) approach to appraisal.
A list of the main policy and planning documents is contained in Table 1.1.
The emerging Flood Mapping and Data Management Strategies will be considered during subsequent phases of the project.
2.3 Assessment of environmental consequences Before considering which aspects of policy and planning drivers need to be delivered through the project, it is first necessary to consider the situations where an assessment would be needed. The requirements of the project would then be determined by the associated legislation and guidance.
Situations where an assessment is likely to be needed are as follows:
Review: Freshwater Ecosystems, Flooding and Vegetation
Science Report Methods to Assess, Model and Map the Environmental Consequences of Flooding: Literature review
(June 2008)
7
• Strategic FCERM planning:
- Baseline (the present day situation)
- Baseline for future epochs
- Options for intervention to management flood and coastal erosion risk, for present day and future epochs.
• Scheme development
- Baseline (the present day situation)
- Baseline for future epochs
- Options for intervention to management flood and coastal erosion risk, for present day and future epochs.
• Flood risk assessment for development planning
Thus the project should consider the environmental consequences of flooding under the following circumstances:
• Existing conditions, present day
• Future epochs (typically over the next 100 years)
• With FCERM interventions
Issues to consider under future epochs include:
• Impacts of climate change including changes in fluvial flows, mean sea level rise and increases in surge tide levels.
• Changes in morphology.
FCERM interventions that have a major impact on the environment include new defences, raising of defences (coastal, estuarine, fluvial), setting back of defence lines, flood storage, channel restoration, etc.
2.4 Environmental requirements and indicators
2.4.1 Policy and planning drivers
The policy and planning drivers referred to in Section 2 require identification of the following:
• Location of designated sites (including SACs, SPAs, Ramsar Sites and SSSIs).
• Condition of designated sites
• Location of priority Biodiversity Action Plan (BAP) habitats

Science Report Methods to Assess, Model and Map the Environmental Consequences of Flooding: Literature review
(June 2008)
8
• Status of priority BAP species
The general obligations under the policy and planning drivers referred to in Section 2 include the following:
• Protection of designated sites or, where this is not possible, identification of suitable alternative sites.
• Restoration of designated sites to favourable condition where they are not in favourable condition already.
• No reduction in priority BAP habitats.
• No reduction in priority BAP species.
Thus, in general terms, the project should aim to identify the consequences of flooding on:
• Extent of designated sites. For example, sea level rise could reduce the area of an SPA if there is no intervention.
• Conservation status of designated sites.
• Other areas that could potentially become replacement or compensation habitat sites.
• BAP priority habitats.
• BAP priority species.
• Ecological status for surface waters, lakes, transitional waters and coastal waters as defined in the Water Framework Directive (as required by the Floods Directive).
UK legislation related to the Floods Directive has not been developed yet, and the extent to which flood risk assessment should take account of ecological status is not clear.
BAP priority habitats include:
• Blanket bog
• Chalk rivers
• Coastal and floodplain grazing marshes
• Coastal saltmarsh
• Coastal sand dunes
• Coastal vegetated shingle
• Eutrophic standing waters
• Fens
• Littoral and sublittoral chalk
• Lowland raised bog

Review: Freshwater Ecosystems, Flooding and Vegetation
Science Report Methods to Assess, Model and Map the Environmental Consequences of Flooding: Literature review
(June 2008)
9
• Maritime cliff and slopes
• Mesotropic lakes
• Mudflats
• Purple moor grass and rush pastures
• Reed beds
• Saline lagoons
• Seagrass beds
• Wet woodlands
There are a large number of priority species of flora and fauna, of which some of the most important include:
• Water vole
• Otter
• Great crested newt
• Natterjack toad
• Bittern
• White-clawed crayfish
• Shining ramshorn snail
• Starlet sea anemone
• Ribbon-leaved water-plantain
• Three-lobed water crowfoot
•
A full list is given on the UKbap website.
2.4.2 Other potential requirements In order to provide the information outlined in Section 4.1, the assessment of environmental consequences of flooding will have to consider some broader issues. Some of these are discussed below.
Flooding characteristics that will affect the environment include:
• Frequency*
• Extent*
• Depth*

Science Report Methods to Assess, Model and Map the Environmental Consequences of Flooding: Literature review
(June 2008)
10
• Velocity*
• Duration
• Season
• Water quality
*Required under the Floods Directive
In some cases these can be related to specific habitats and species, for example water depths for wading birds or swimming speeds for fish.
Flooding will affect ecological functioning of a system, for example the connectivity between functions (roosting and feeding; fish migration and spawning grounds, etc). This will require a broad understanding of how systems function.
Flooding will affect the sediment regime, including erosion and deposition. This in turn affects habitats and species.
An understanding of the resilience of sites to flooding will be helpful. For example, Natural England provides guidance on the frequency with which coastal grazing marshes can be inundated with saline flood water without permanent damage.
2.5 Overview of some key documents The Scoping study includes a brief overview of some of the key documents listed in Table 1.1. This section considers the requirements of these documents, and the potential implications for assessing the environmental consequences of flooding.
Habitats Directive
The Habitats Directive (92/43/EEC) lists habitats and species of European importance and makes provision for designating Special Areas of Conservation (SACs) within which they are represented. It is implemented in the UK with the Birds Directive under the provisions of The Conservation (natural Habitats & c.) Regulations 1994 (the ‘Habitats Regulations’).
The measures set out in the Directive are designed to maintain at, or restore to, a 'favourable conservation status' the listed species and habitats. It also states that land-use planning and development policies should encourage the development of features of the landscape which are of major importance for wild fauna and flora, such as rivers and ponds.
Implications for the project:
• Consequences of flooding on SACs including conservation status.

Review: Freshwater Ecosystems, Flooding and Vegetation
Science Report Methods to Assess, Model and Map the Environmental Consequences of Flooding: Literature review
(June 2008)
11
The Birds Directive
The Birds Directive (79/409/EEC) requires that special measures be taken to conserve the habitats of listed species in order to ensure their survival and reproduction in their area of distribution. The most suitable areas for these species are classified as Special Protection Areas (SPAs). Similar measures are to be taken in respect of regularly occurring migratory species not listed in the Directive.
Implications for the project:
• Consequences of flooding on SPAs and other areas containing habitats of listed species.
Floods Directive
This new Directive requires the development of flood risk management plans that take account of relevant aspects. These ‘relevant aspects’ include the environmental objectives of Article 4 of the Water Framework Directive, and nature conservation. The Water Framework Directive is discussed below.
Water Framework Directive
The fundamental objective of the Water Framework Directive (2000/60/EC) is the achievement of ‘good status ‘in all water bodies. Groundwater, rivers, lakes, transitional waters, coastal waters, and artificial or heavily modified systems can all be defined as water bodies. The achievement of good status in water bodies is aimed at, amongst other things, conservation of associated ecosystems such as wetlands.
Achieving good ecological status in UK water bodies will in some cases require maintenance or re-instatement of a flooding regime.
Ecological status is defined in Annex V of the Directive and includes biological quality elements, hydromorphological elements supporting biological elements, and chemical elements supporting biological elements.
Potential implications for the project:
• Consequences of flooding on biological quality elements. These include aquatic flora and fauna and, for transitional and coastal waters, phytoplankton, macroalgae and angiosperms.
• Consequences of flooding on hydromorphological elements which support biological elements. These include river continuity, morphological conditions, the tidal regime (currents and wave exposure).
• Consequences of flooding on chemical elements which support biological elements.
UK legislation related to the Floods Directive has not been developed yet, and the extent to which flood risk assessment should take account of ecological status is not clear.
Science Report Methods to Assess, Model and Map the Environmental Consequences of Flooding: Literature review
(June 2008)
12
Strategic Environmental Assessment (SEA)
SEA is intended to integrate environmental considerations in strategic planning. The general intention is to prevent, reduce and offset any adverse impacts of plans or programmes on the environment. SEA is applied at flood management planning scale (CFMPs, and SMPs) and Strategy Plan scale.
SEA provides a process for assessing impacts and incorporating results into plans and programmes, but does not contain scientific information on impacts. Thus the results from this project will be required for SEA.
Defra PAG5
Project Appraisal Guidance Note 5 provides guidance on general environmental issues to be considered in developing and appraising FCERM plans and schemes, for example environmental duties covered by Government High Level Targets. It also provides guidance on approaches to appraisal, although these are changing as Government approaches evolve and more information becomes available.
PAG5 summarises the duties of operating authorities and environmental requirements at the time of publication (2000). The guidance includes the following:
• Environmental impacts to be considered through the life of a scheme.
• Works are subject to EIA.
• Refers to High Level Targets (since revised, see below).
• Schemes should take account of and contribute to BAPs.
• Key environmental indicators should be monitored at agreed times of the year.
• Refers to importance of SPAs (Birds Directive), SACs (Habitats Directive) and Ramsar sites.
• Refers to the need for appropriate assessment of European sites, including the PPG9 definition of the integrity of sites.
PPG9 defines the integrity of sites as ‘the coherence of its ecological structure and function, across its whole area, that enables it to sustain the habitat, complex of habitats and/or the levels of populations of the species for which it was classified’.
The implication for the project is a requirement to assess the consequences of flooding on the overall integrity of the site.
Review: Freshwater Ecosystems, Flooding and Vegetation
Science Report Methods to Assess, Model and Map the Environmental Consequences of Flooding: Literature review
(June 2008)
13
Outcome Measures
The new Defra Outcome Measures will be used to set FCERM targets from 2008/09 onwards. The Measures of particular relevance to the environmental consequences of flooding are:
• Measure 4: Record, through liaison with Natural England, the delivery of flood, water level and coastal management remedies which contribute to the Government target to have 95% of SSSI in favourable condition by 2010.
• Measure 5: Overall increase in BAP habitat achieved through flood and coastal erosion risk management activities.
Implications for the project:
• To be able to assess the consequences of flood, water level and coastal management remedies on the condition of SSSIs under flood conditions.
• To predict the impacts of flood and coastal erosion risk management activities on BAP habitat under flood conditions.
High Level Targets
The current Defra High Level Targets were implemented from 1 April 2005. The Target 4 is of particular relevance to the environmental consequences of flooding:
Target 4 Biodiversity:
• Ensure no net loss to habitats covered by BAPs
• In consultation with Natural England (NE), review WLMPs for all priority SSSIs in unfavourable condition, and submit to the Environment Agency a costed action plan of flood management measures to achieve favourable condition.
• In consultation with NE, assess the flood management measures necessary to achieve the PSA targets for SSSIs not covered by WLMPs, and submit to the Environment Agency a costed action plan of flood management measures to achieve favourable condition.
• Report to Environment Agency.
• Create at least 200ha of new Biodiversity habitat per annum as a result of flood management activities, of which at least 100ha should be saltmarsh or mudflat. (This is in the Environment Agency corporate plan).
The implications for the project are essentially the same as for the Outcome Measures.
Creating a better place for wildlife – How our work helps biodiversity
This document describes the Environment Agency’s commitment to the UK Biodiversity Action Plan, and confirms the importance of the priority habitats and species.

Science Report Methods to Assess, Model and Map the Environmental Consequences of Flooding: Literature review
(June 2008)
14
Pitt Report
The Pitt report provides recommendations arising from the July 2007 floods. Whilst the emphasis is on flood risk management organisation and interventions, it includes a recommendation for greater working with natural processes including green corridors and restoring natural river courses.
This is consistent with the obligations of operating authorities to conserve and enhance the natural environment.
The implications for the project are that it should be possible to assess the environmental consequences of green corridors and restored natural river courses under flood conditions.
Catchment Flood Management Plans (CFMPs)
The CFMP guidance requires the application of the environmental assessment methods and targets covered elsewhere in this document. Particular requirements include:
• Flood risk to be quantified in environmental terms (consistent with the MCA approach to appraisal)
• A CFMP should aim to maintain, restore and enhance the total stock of natural and historic assets (including biodiversity).
• Compliance with SEA requirements.
• A CFMP should provide information for SEA including the range of habitats and species, and sensitivity to current and future flood regimes.
• Specific environmental opportunities are recognised, including:
- Restoration of fluvial streams
- More beneficial management of existing wetlands for nature conservation
- Creation of BAP habitats
• Environmental impact of flooding to be considered including the impact on designated and priority sites.
• The Environmental Report required for the SEA includes the baseline, assessment of strategic options, and the requirement to monitor indicators.
• Specific indicators include
- Area and number of sites in favourable condition
- Protection and enhancement of biodiversity species and habitats
Shoreline Management Plans (SMPs)
The SMP Guidance requires risks (including natural environment) to be reduced in a sustainable manner. The Guidance refers to the Policy objective of environmentally sound and sustainable flood and coastal defence measures. Particular requirements include:
• Implications of policies on European sites and biodiversity to be considered.

Review: Freshwater Ecosystems, Flooding and Vegetation
Science Report Methods to Assess, Model and Map the Environmental Consequences of Flooding: Literature review
(June 2008)
15
• Compliance with international and national nature conservation legislation and biodiversity obligations.
• Specific reference to CHaMPs, BAPs, WLMPs, management schemes for European sites.
• The need for habitat replacement where habitat loss from European sites could occur. In cases of managed realignment where coastal grazing marshes are lost, there will also be a need for compensation freshwater habitat.
• The need to conserve and enhance biological diversity of priority habitats and species
• The need to contribute to biodiversity targets including no net loss to habitats in BAPs.
• The need to consider conservation objectives of European sites.
• The need for monitoring, including habitat change
Coastal Habitat Management Plans (CHaMP)
A CHaMP includes the identification and quantification of habitats under threat and how they can be safeguarded.
Modelling and Decision Support Framework (MDSF/MDSF2)
The MDSF uses information on flooding (either internally generated or imported) to calculate the social and economic impacts of flooding. It does not currently include any environmental indicators. It is expected that this project will provide appropriate methods and indicators that could be used within MDSF2 in the future. This current project has the potential to influence future developments of MDSF.
Risk Assessment for Strategic Planning (RASP)
RASP is essentially a concept for risk based flood risk management, and is being implemented in tools such as MDSF2 and PAMS. It therefore has no direct relevance to this project.
Performance and Asset Management (PAMS)
PAMS provides a system for managing flood defence assets. The main focus is on engineering performance of structures, and it does not have an environmental component. It therefore has no direct relevance to this project at present.
Multi Criteria Analysis (MCA)
It is expected that MCA will provide a future approach to project appraisal that takes specific and quantifiable account of the environment in flood risk assessment. The project should help to provide the specific information needed for an MCA appraisal. The current version of MCA includes the following parameters:

Science Report Methods to Assess, Model and Map the Environmental Consequences of Flooding: Literature review
(June 2008)
16
• Area of habitat (including reed bed; saltmarsh; coastal lagoons; coastal grazing marsh; wetland; instream; fish spawning grounds; etc)
• The quality of habitat
Environmental Impact Assessments
These will be considered during the next phase of the project.
Table 1.1 Policy and planning documents
International Commitments and Directives Comments
Convention on Biological Diversity 5 June 1992 Bern Convention on the Conservation of European Wildlife and Natural Habitats (1979)
Ramsar Convention on wetlands of international importance especially as waterfowl habitat (1971)
Communication on a European Community Biodiversity Strategy
Directive 79/409/EEC, on the Conservation of Wild Birds Directive 92/43/EEC, on the Conservation of Natural Habitats and of Wild Fauna and Flora
Water Framework Directive (2000/60/EC) The Shellfish Water Directive 79/923/EEC) Directive (85/337/EEC) on Environmental Impact Assessment (EIA)
Directive (2001/42/EC) on Strategic Environmental Assessment (SEA).
Directive 2007/60/EC on the assessment and management of flood risks (came into force on 26 November 2007)
Groundwater Directive (2006/118/EC) Daughter directive to the WFD
National Policies, Strategies and Commitments UK Legislation
Wildlife & Countryside Act 1981 The Wildlife and Countryside Act 1981 (Amendment) Regulations 1995
The Conservation (Natural Habitats, &c.) Regulations 1994 The Conservation (Natural Habitats, &c.) (Amendment) Regulations 1997
Town & Country Planning Act 1990 Countryside and Rights of Way Act 2000 UK Biodiversity Action Plan, including: Habitats Action Plans Species Action Plans
Not strictly legislation
Water Resources Act 1991 Environment Act 1995 The Water Environment (Water Framework Directive) (England and Wales) Regulations 2003 (SI 3242)

Review: Freshwater Ecosystems, Flooding and Vegetation
Science Report Methods to Assess, Model and Map the Environmental Consequences of Flooding: Literature review
(June 2008)
17
The Town and Country Planning (Environmental Impact Assessment) (England and Wales) Regulations 1999 (SI 293)
The Environmental Impact Assessment (Land drainage improvement works) Regulations 1999 (SI 1783)
The Environmental Assessment of Plans and Programmes Regulations 2004
Land Drainage Act 1991, as amended in 1994 The Coast Protection Act 1949 The Groundwater Regulations 1998 Policy Statement on Groundwater Regulations 1998 The Surface Waters (Shellfish) (Classification) Regulations 1997
UK Strategies, policies, guidance etc
Making Space for Water (2005) – Consultation Document No final version available. It is a strategic guiding document rather than a distinct policy.
Working with the grain of nature: A biodiversity strategy for England (2002)
Making Space for Water: Outcome Measures (Defra 2007) High Level Targets (Defra 2005) Project Appraisal Guidance (Defra), specifically: PAG5, Environmental Appraisal
Water Strategy (Defra, 2008) River basin planning guidance (Defra, 2006) Implementation plan for the Environment Agency Strategic Overview for Sea Flooding and Coastal Erosion Risk Management (Dec 2007)
Coastal Squeeze. Implications for Flood Management. The Requirements of the European Birds and Habitats Directive Defra, 2005
The Pitt review: learning lessons from the 2007 flood. Interim Report. (Dec 2007)
Conserving biodiversity in a changing climate: guidance on building capacity to adapt (Defra 2007)
Guidance rather than a PPP
Biodiversity and the UK Action Plan (1994)
National PPGs/PPSs (Planning Policy Guidance/Statement)
PPS1 – Delivering Sustainable Development PPS25: Development and Flood Risk (December 2006) PPS9: Biodiversity and Geological Conservation (August 2005) Note also “Planning for
Biodiversity and Geological Conservation: A Guide to Good Practice” (March 2006)
PPG20: Coastal Planning
Environment Agency/Operating Authority Strategies, Plans and systems
Creating a Better Place – Corporate Strategy 2006-11 Catchment Flood Management Plans (CFMP)
Science Report Methods to Assess, Model and Map the Environmental Consequences of Flooding: Literature review
(June 2008)
18
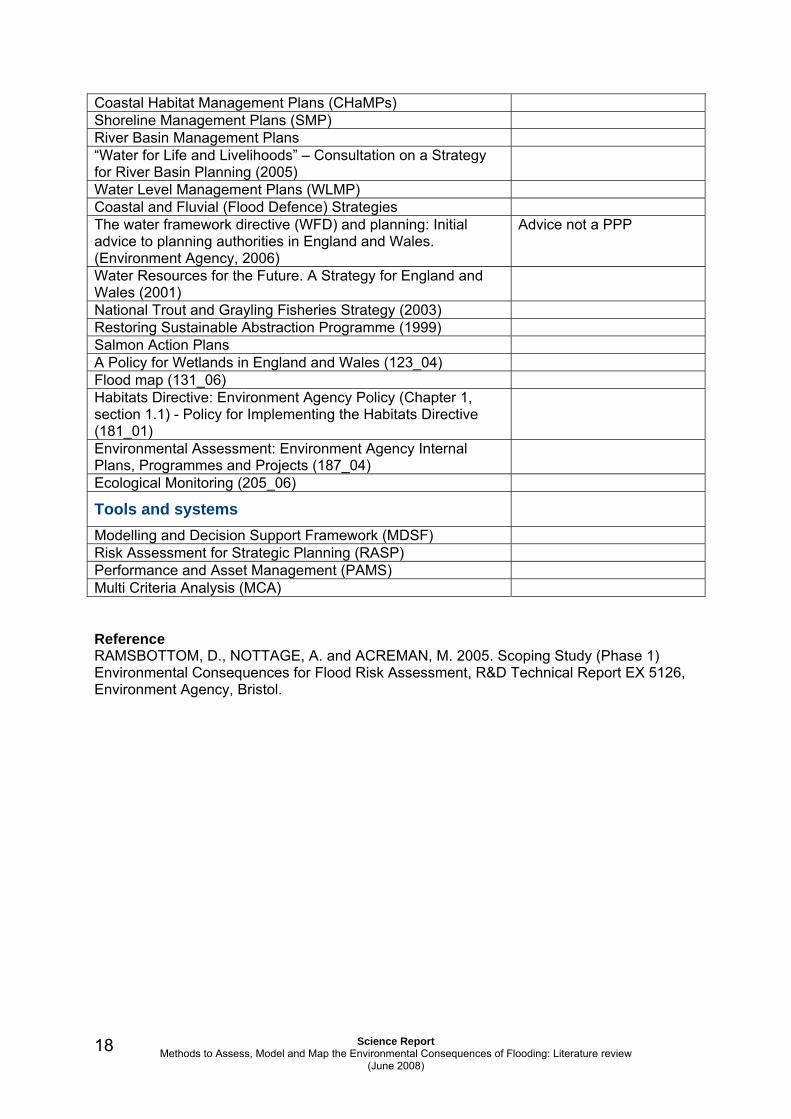
Coastal Habitat Management Plans (CHaMPs) Shoreline Management Plans (SMP) River Basin Management Plans “Water for Life and Livelihoods” – Consultation on a Strategy for River Basin Planning (2005)
Water Level Management Plans (WLMP) Coastal and Fluvial (Flood Defence) Strategies The water framework directive (WFD) and planning: Initial advice to planning authorities in England and Wales. (Environment Agency, 2006)
Advice not a PPP
Water Resources for the Future. A Strategy for England and Wales (2001)
National Trout and Grayling Fisheries Strategy (2003) Restoring Sustainable Abstraction Programme (1999) Salmon Action Plans A Policy for Wetlands in England and Wales (123_04) Flood map (131_06) Habitats Directive: Environment Agency Policy (Chapter 1, section 1.1) - Policy for Implementing the Habitats Directive (181_01)
Environmental Assessment: Environment Agency Internal Plans, Programmes and Projects (187_04)
Ecological Monitoring (205_06)
Tools and systems
Modelling and Decision Support Framework (MDSF) Risk Assessment for Strategic Planning (RASP) Performance and Asset Management (PAMS) Multi Criteria Analysis (MCA) Reference RAMSBOTTOM, D., NOTTAGE, A. and ACREMAN, M. 2005. Scoping Study (Phase 1) Environmental Consequences for Flood Risk Assessment, R&D Technical Report EX 5126, Environment Agency, Bristol.
Review: Freshwater Ecosystems, Flooding and Vegetation
Science Report Methods to Assess, Model and Map the Environmental Consequences of Flooding: Literature review
(June 2008)
19
3 Issue 2: Coastal ecosystems and the consequences of flooding
Dr Albert Nottage
(Independent Consultant)
Overall approach to the study
This section considers ways to better assess, model and map the environmental consequences of flooding from the sea. The chapter builds preliminary considerations in the scoping study (Ramsbottom et al., 2005). The particular aspect of the environment addressed is the natural biota of the coastal zone; the plant and animal communities. Hereafter these assets are referred to as biodiversity.
As a first step, a structured review of relevant available information has been undertaken. The review was conducted in accordance with current guidelines for systematic review of scientific and technical information (CEBC, 2006). It was initiated with a search of the World Wide Web, focused on the United Kingdom (UK) that employed a selection of relevant keywords. The first fifty ‘hits’ in each search were examined and cross-referenced against the other searches to identify the most relevant material. Most attention was given to work published since 1990 (with the principal emphasis being placed on studies undertaken since 2000). Broad-based review and guidance studies commissioned by UK Government agencies, such as the Department of the Environment, Food and Rural Affairs (Defra), English Nature (EN; now Natural England – NE) and the Environment Agency (the Agency) were of particular interest. This initial selection was made in the belief that such studies would provide an adequate overview of earlier work, as many included extensive literature reviews, and present the most authoritative, up-to-date account of the relevant topic areas in the UK context.
The following account begins with a definition of the coastal zone. The key coastal processes relating to flooding from the sea are then described together with the general nature of this type of flooding. The biodiversity assets of the coastal zone are summarised and the potential impact of flooding from the sea upon biodiversity is indicated. The general policy framework for conserving biodiversity in England and Wales is set out and the way in which this is presently implemented in relation to the management of flood risk in the coastal zone is described. Current, risk-based approaches to the assessment, modelling and mapping of the consequences of flooding from the sea are then discussed.

Science Report Methods to Assess, Model and Map the Environmental Consequences of Flooding: Literature review
(June 2008)
20
The coastal zone
Delineating the interface between the land and the sea, the coastline of England and Wales is a, naturally, highly dynamic feature that changes in response to the action of waves and tides over timescales ranging from seconds to centuries. Where the coast is unconstrained and free to adapt to coastal processes, some areas will be eroding sediment and other areas will be accreting sediment. In the former situation the coastline will retreat landward while in the latter situation it will advance seawards. In both situations the likelihood of flooding of low-lying hinterland, by the sea, as a result of coastline migration will change.
However, much of the coast of England and Wales is heavily constrained. It is held in place artificially by the presence of man-made sea defence works. These, often heavily engineered, structures act as local barriers to landward migration of the coastline. They can also disrupt natural coastal processes, such as sediment transport mechanisms, and may, thereby, affect the functioning of the coastline in areas some distance away from where they are located. By these means, sea defence structures can significantly influence the likelihood of flooding from the sea.
In the context of coastal flooding, the coastline needs to be considered as part of a coastal zone within which natural processes interact with the activities and aspirations of man to create flood risk.
DoE (1993) recognised three sub-zones as collectively constituting the coastal zone:
• The dynamic zone is that area in which natural coastal processes can directly affect the coastline; it extends someway offshore.
• The hazard zone is the area that is potentially susceptible to the effects of physical processes impacting the coastline
• The interactive zone is that area within which human activities and aspirations may impact upon, or be impacted by, natural processes, and their consequences, that occur in the dynamic zone and the hazard zone respectively.
Because physical processes affecting the coastline and man’s uses of the coastal zone vary greatly from place to place, the extent of these three sub-zones and, hence, the overall extent of the coastal zone will vary according to location. For any particular site, in relation to flooding from the sea, however, the limits of the coastal zone can be defined in terms of the relevant physical process boundaries (dynamic zone), the overall area(s) at risk from specified flood events (hazard zone) and those areas within the hazard zone that are of value or interest to man. (interactive zone).
Coastal processes in the dynamic zone
Because coastal flooding is heavily influenced by changes to the coastline, some of the key factors driving the process of coastline change are highlighted below. Readers wishing to familiarise themselves with the science of coastal processes will find a comprehensive

Review: Freshwater Ecosystems, Flooding and Vegetation
Science Report Methods to Assess, Model and Map the Environmental Consequences of Flooding: Literature review
(June 2008)
21
introduction in Carter (1988) and a summary account, in the context of coastal flooding and erosion, in MAFF (1993).
The fundamental unit of the dynamic zone, in coastal process terms, is the sediment cell (HR Wallingford, 1994). This is defined as a length of coastline and its associated near-shore area within which the movement of coarse, unconsolidated sediment (sand and shingle, is largely self-contained. Consequently, perturbations to the movement of sand and shingle in one cell should not affect the shoreline in other sediment cells. Sediment sub-cells are parts of sediment cells within which the movement of sand and shingle is relatively self-contained.
At any given coastal location, at any given time, an unconstrained shoreline exists in a state of dynamic equilibrium governed by the nature of the wave climate, the geology of the shore, the tidal regime and the sediment supply. Change will occur when the magnitude of a single event, or series of events, is sufficient to overcome the inherent resistance of the shoreline. Such changes vary greatly in space and time. On the broadest scale, the general configuration of the coastline of England and Wales, including the inter-tidal zone, was established several thousand years ago when the sea is believed to have reached its approximate current level. However, changes at a local and regional level have occurred fairly continuously ever since. The most substantial changes, occurring in recent centuries, are exemplified by the dramatic erosion of the Holderness coast north of the mouth of the Humber estuary and the isolation of the port of Hythe, on the south coast, from the sea as a result of coastline migration seawards.
Wave action is the primary natural driver of shoreline change. Essentially, the shore adjusts to conform to the shape best suited to absorb the incident wave energy given the nature of the shoreline and the wave climate. Where it is unable to do this due to a naturally rising topography or the presence of a fixed line of sea defence works placed to protect assets and prevent loss of hinterland, the ability of the coastline to adjust to change is impaired. In such situations the coastline is unable to attain the equilibrium ordained by prevailing physical conditions and is out of balance. This lack of balance can lead to potentially significant implications for flood risk. These will be described below
Foresight (2004) recognised four key coastal processes that are likely to affect present rates of coastline change, and, thereby, alter the likelihood of flooding from the sea at susceptible sites, in the future:
• Relative sea level rise will increase the still water level of the sea and allow more wave and tidal energy to impact the coastline. This will be especially significant in those areas of the coast, such as south-east England, where the land is also sinking relative to the sea.
• Predicted increases in wave height, increased storminess and changes in wave direction, exacerbated by relative sea level rise, as a result of climate change, will lead to increased wave impacts on the coastline at many locations.
• Predicted increases in surge levels due to climate change, in association with the above, will lead to higher extreme water levels and enable greater wave and tidal energies to impact the coast.
• Changes in coastal morphology consequent on the impact of the above processes, e.g. accelerated erosion, will further exacerbate their effect(s) and

Science Report Methods to Assess, Model and Map the Environmental Consequences of Flooding: Literature review
(June 2008)
22
alter the probability of coastal flooding. Particularly significant in this context are the potential loss of landforms such as beaches and saltmarsh due to coastal squeeze and the increased exposure of sea defence works to wave impact which will cause damage and increase the likelihood of overtopping and/or breaching of these structures.
Flooding from the Sea in the hazard zone
Flooding from the sea is a natural phenomenon that the coast of England and Wales has adapted to over time. Indeed, wherever the land retains a direct connection with the sea, the inter-tidal zone is submerged by the flooding tide to an extent, at a frequency and for a duration that varies in accordance with various cycles. The inter-tidal zone relies upon tidal inundation to maintain its morphology and ecological integrity. .
With regard to flooding from the sea, the hazard zone of a particular stretch of coastline is, essentially, that area of the land that is sufficiently low-lying to be inundated by the sea as a result of a flood event. For England and Wales this area is highlighted on Indicative Coastal Floodplain Maps (ICFM) that display the land area that would be inundated by a 1:200 year return period flood from the sea in the absence of any sea defences. Significant areas of the coast in the south and east of England are threatened by flooding from the sea.
It is necessary to consider two basic types of flooding from the sea here; one-off extreme, usually storm-driven, events and progressive flooding (increased submergence) of low-lying land due to relative sea level rise.
The mean sea level, state of the tide and magnitude of any tidal surge that is occurring will define the still water level of the sea at any given point on the coastline at any particular time. Occasionally, on an extreme high tide, the still water level of the sea may attain a height sufficient, in itself, to inundate parts of the coastal floodplain that are not normally subject to tidal immersion. Usually, however, it requires a storm acting upon the still water level to produce significant flooding of land by the sea especially where the land is protected by defences. Where the coastline is unconstrained by such structures, the flood wave can advance and recede smoothly. Consequently, in such situations, the physical, scouring action of the flood wave is limited and the floodwater recedes as soon as the event is over. Adverse environmental consequences of occasional flooding from the sea in these circumstances, therefore, tend to be limited. Indeed, the absence of any sea defence structures at such locations is, generally, a clear indicator of the fact that man does not perceive any problems will arise as a result of occasional flooding from the sea.
In contrast, the presence of sea defence works at a coastal site generally signifies that the site has a value or interest to man that he deems worthy of protection against flooding from the sea. In some cases, however, the reasons for building sea defences no longer apply and the structures are, effectively, redundant. Wherever a site is being actively protected, the crest level of the defence works is usually set at a height that safeguards against flooding from the still water level of the sea in all but the most extreme of events. By generating waves that act upon the still water level of the sea storm events may, as already noted, overtop or breach sea defences. Flooding that occurs as a result of this phenomenon is

Review: Freshwater Ecosystems, Flooding and Vegetation
Science Report Methods to Assess, Model and Map the Environmental Consequences of Flooding: Literature review
(June 2008)
23
usually rapid in onset and can be highly hazardous and extremely severe in impact due to the fact that the flood wave surges into an area that is constrained and only rarely, if ever, subject to flooding by seawater.
The presence of hard engineered sea defence works on the coast create a problem in terms of flood risk given the highly dynamic nature of the coastal environment and predictions for sea level rise and climate change. Some coastal landforms such as beaches and saltmash act as a buffer against wave and tidal energies impacting the shoreline; thereby fulfilling a natural sea defence function. On many areas of defended coastline these landforms can be found located in front of sea defence works. Their presence, given their ability to moderate wave and tidal energies, means that the sea defences they front can be safely constructed or maintained to a lower level of protection than would need to be the case if they were not there. Unfortunately, however, this situation is changing fast. The presence of fixed sea defence works behind beaches and saltmarsh prevents them from adapting to sea level rise and climate change by migrating landwards; a phenomenon known as coastal squeeze. Consequently, many of these landforms are changing in character as the frequency and duration of tidal inundation alters as a result of sea level rise. This form of progressive flooding differs from that produced by one-off, usually storm-driven, events. Ultimately, it will permanently submerge some existing coastal landforms, expose the new coastline (and/or sea defences) to the impact of greater wave energies and increase the likelihood of flooding of low-lying land by the sea.
The exposure of many sea defence works to the action of waves and tides as a result of this process will increase the likelihood that they will be overtopped and/or breached by the type of storm event currently experienced. If the severity of these events is on the increase, as present predictions imply, this likelihood will be increased still further. The increased likelihood of overtopping and/or breaching will, in turn, increase the likelihood of flooding to the land protected by the sea defence works. Large-scale retreat of the shoreline as a result of coastal squeeze and the increased threat from flooding this will present in many areas currently protected by sea defence works is the most pressing issue facing biodiversity assets in the coastal zone, in the context of flooding from the sea, today.
An overview of the general nature of the biodiversity assets of the coastal zone of England and Wales is presented in the next section prior to consideration of the potential impact(s) that flooding from the sea might have upon these assets.
Biodiversity assets of the coastal zone
The current interaction between man and the coastal zone of England and Wales is already substantial and likely to increase in the future. Much of the coast is currently subject to residential, agricultural and industrial development and this continues to expand. Most of the remainder is valued by man for aesthetic qualities, recreational opportunities and biodiversity. It is the last of these attributes, the biodiversity of the coastal zone, that concerns us here and this is described below.
The coastal features of England and Wales have been described by Steers (1978). These landforms give rise to a variety of habitats which support characteristic communities of plants
Science Report Methods to Assess, Model and Map the Environmental Consequences of Flooding: Literature review
(June 2008)
24
and animals. The broad habitat types found in the coastal zone may be simply classified as follows:
• Sea cliffs
• Shingle and gravel beaches
• Sand dunes
• Sand and mud flats
• Saltmarsh
• Saline lagoons
• Coastal grazing marsh
• Reedbed
Vertical or nearly vertical cliffs may develop from both hard and soft rocks. Because, by definition, they front high backshores their interest in relation to potential flooding of the coastal hinterland by the sea resides mainly in the fact that sediment derived from eroding soft rock cliffs is required to sustain other coastal habitats such as sand dunes and saltmarsh which have a natural flood defence function.
Shingle and gravel beaches are common and widespread frequently fronting relatively exposed areas of coast where they protect the land behind from waves and storms. Developing and evolving in response to wave action, storms and the movement(s) of sediment along the shore by long-shore-drift, shingle and gravel shores are highly dynamic. In many areas, they are actively managed (e.g. re-profiled and protected by man-made structures) to enhance their sea defence value.
Sand dunes develop in areas where wind-blown sand settles. On the coast, this is generally inland of a suitable sandy beach just above the zone normally inundated by the tide. Like shingle and gravel shores, they exhibit a spectrum of stability with those in the middle of the range possessing the greatest variety of dune types and, hence, the greatest diversity of habitat. Sand dunes act to buffer extreme waves and winds. The exchange of sediment between the beach and the dune system which occurs in this context is extremely important in maintaining the morphology of the dunes and their ecological diversity.
Sand and mudflats develop in sheltered areas of the coast where they are subject to regular tidal inundation. They adjust their shape to the influence of waves and tides and act as a source of sediment for the development and maintenance of other habitats such as sand dunes and saltmarsh.
Saltmarsh consists of specialist plant communities able to live between Mean Low Water of Neap Tides and Mean High Water of Spring Tides. It develops in areas sheltered from wave action, such as estuaries and stretches of coast protected by structures like shingle spits, where fine sediment can accumulate.

Review: Freshwater Ecosystems, Flooding and Vegetation
Science Report Methods to Assess, Model and Map the Environmental Consequences of Flooding: Literature review
(June 2008)
25
Saline lagoons typically develop in sheltered, tidal inlets or behind shingle shores. Owing to their restricted interaction with the sea, they are characterised by low, intermediate or, in some cases, high salinities when compared with seawater. They are rare habitats in England and Wales.
Coastal grazing marsh is not a natural habitat. It is permanent pasture, used for grazing and hay-making, that has been created by man through the enclosure of saltmarsh and other tidal wetlands by embankments. Over time, annexation in this manner has created new land at the expense of inter-tidal zone. As this ‘land’ is naturally inter-tidal it lies within the coastal floodplain and needs to be protected by sea defences. Moreover, as a result of compaction and settlement of the soil, much of it has reduced in surface elevation relative to sea level. Consequently, coastal grazing marsh is a habitat that is under severe threat from flooding by the sea.
Reedbed, dominated by Phragmites australis, occurs at the margins of tidal land where brackish to freshwater transitions occur. It is a rare habitat in England and Wales which, if allowed to develop naturally, will proceed from newly colonising plants in much open water through large areas of reedbed with some open water to scrub and woodland. The intermediate state of large areas of reedbed and some open water has the highest biodiversity value.
This wide range of habitat types supports extensive plant and animal communities that make the coastal zone of England and Wales a very diverse biological environment. This biodiversity is valued by man at various levels (local, regional national and international) and is conserved in two principal ways. The first approach to conservation involves the protection of particular habitats; the second involves the protection of particular species. Habitats are protected by the designation of selected sites. Much of the coast of England and Wales is designated for its biodiversity value. Moreover, even where they occur outside of currently designated sites, each one of the coastal habitat types listed above is considered to be of principal importance in England under Section 74 of the Countryside and Rights of Way Act 2000. Statutory site designations for biodiversity in the coastal zone include:
• Special Areas of Conservation (SAC) designated under the Habitats Directive (EC, 1992).
• Special protection areas (SPA) designated under the Birds Directive (EC, 1979).
• Wetlands of international importance (Ramsar sites) designated under the Ramsar Convention (Ramsar Convention, 1971).
• Sites of Special Scientific Interest (SSSI) designated under the Wildlife and Countryside Act 1981.
• National nature reserves (NNR) designated under the Wildlife and Countryside Act 1981.
• Marine Nature Reserves (MNR) designated under the Wildlife and Countryside Act 1981.
• Local Nature Reserves (LNR) designated by local authorities under section 21 of the National Parks and Access to the Countryside Act 1949.

Science Report Methods to Assess, Model and Map the Environmental Consequences of Flooding: Literature review
(June 2008)
26
In addition to the above statutory designations, there are also a number of non-statutory designations such as sites of interest for nature conservation (SINC) and land held for conservation purposes by organisations such as County Wildlife Trusts. Although not receiving the level of legal protection conferred on sites in receipt of statutory designation, sites subject to non-statutory designation must be taken in to account by local planning authorities when developments are being considered.
Historically, both statutory and non-statutory designated sites have been defined by fixed, unchanging boundaries selected according to certain criteria such as those developed by Radcliffe (1977). They may encompass a variety of different habitat types. Given the highly dynamic nature of the coastal zone, this approach has limitations as many of these arbitrarily defined areas of the coastal zone are, in reality, part of a greater functional unit. Both the Habitats Directive and the Birds Directive recognise the need to address this issue by promoting action for conservation outside of, as well as within, designated sites. Recent initiatives to develop such an approach in England are described later in this text.
The most conspicuous feature of coastal habitats in terms of their biodiversity is the spectacular flocks of birds that feed on inter-tidal sandflats and mudflats especially during the winter months. The large tidal range of the coastline of England and Wales provides extensive areas of inter-tidal shore on which the birds can feed. For the most part, their prey consists of the abundant populations of sediment-dwelling invertebrates, such as molluscs, crustaceans and polychaete worms, found living below the surface of these shores although some birds eat algae and vegetation while others take surface-living invertebrates such as mussels. Birds also use coastal areas for roosting and nesting purposes. Areas of saltmarsh and shingle are especially significant in this respect.
Estuarine and marine fish also make extensive use of the inter-tidal zone and saltmarsh has been shown to be of particular importance as a nursery area for juveniles of several species.
Readers wishing to find out more about the flora and fauna of the various habitat types occurring around the coast of England and Wales and the physical processes affecting them should consult sources such as Defra (2007), www.saltmarshmanagementmanual.co.uk, Packham, Randall, Barnes and Neal (2001), Larson, Matthies and Kelly (2000), Packham and Willis (1997), NRA (1995) and Adam (1990). Information on designated sites, including the reasons for their designation and advice on their management, can be obtained from Natural England, the Countryside Council for Wales and, in the case of some local sites, local biological records centres and local wildlife trusts.
Potential impacts of flooding from the sea on the biodiversity of the coastal zone
In general terms, flooding from the sea will impact the biodiversity of the coastal zone by changing the landform morphology and changing the ambient physical and chemical conditions. Such changes may destroy habitats and kill susceptible plants and animals.

Review: Freshwater Ecosystems, Flooding and Vegetation
Science Report Methods to Assess, Model and Map the Environmental Consequences of Flooding: Literature review
(June 2008)
27
Examples of the ways in which possible changes in landform morphology and ambient physical and chemical conditions may be brought about by flooding from the sea that occurs as a result of a one-off event, include:
• The scouring action of the flood wave giving rise to erosion and, possibly, releasing previously buried contaminants.
• The capacity of the flood wave to transport suspended sediment which may be deposited to smother existing surfaces, infill features such as ditches and ponds and change the nature of the soil structure.
• The ingress of saline water, perhaps containing contaminants such as oil, into freshwater or brackish environments producing a directly toxic effect on susceptible plants and animals and contaminating areas by causing changes in attributes such as soil salt content.
The extent of the disruption to biodiversity in the coastal zone caused by flooding from the sea is governed by the frequency, extent and duration of the flooding event. Timing is also important. Thus, a flood that occurs over a shore when ground nesting birds are hatching eggs and/or rearing young or a flood that sweeps through a saltmarsh when juvenile fish are sheltering there, for example, may be much more damaging to the bird and fish populations than a comparable flood that occurs at a time when they are less susceptible to its impact.
Flooding (in the form of long-term or permanent increase in the duration of submergence of any given area) that occurs at sites where the sea water can not readily drain away or as a consequence of relative sea level rise, will produce different effects to the short-term, one-off type of extreme flood event that is followed by the complete recession of the flood water. In essence, the area(s) of land inundated by the sea in such situations will develop some form of marine habitat. Thus, for example, in those situations where the surface level of the land flooded by the sea lies below sea level saline lagoons may develop after an extreme flooding event. Where the coastline is free to migrate landward, in response to relative sea level rise, however, the overall effect might only be a progressive shift of the current pattern of zonation of the existing plant and animal communities landwards. Where shoreline retreat is not possible relative sea level rise will give rise to a progressive increase in submergence time for plant and animal communities that are currently adapted to a defined regime of tidal inundation. In such cases, the zonation pattern of the inter-tidal zone will be constricted leading to a reduction in biodiversity. Constriction of the inter-tidal zone in this manner could potentially exert a major impact on those species of shore bird that feed, in such areas unless alternative feeding grounds develop, or are provided, elsewhere.
The most immediate threat of this phenomenon relates to the coastal squeeze brought about by the presence of fixed sea defences as noted above. At many locations beaches and/or saltmarsh will be (are already) unable to adapt, even in the short-term, by means of landward migration. So, they will be (are being) lost exposing the sea defences behind them to increased wave and tidal energies and, thereby increasing the likelihood that the sea will flood the areas that the sea defences are there to protect. In many cases this protection is being afforded to features that add greatly to the biodiversity of the coastal zone; coastal grazing marsh, saline lagoon and reedbed habitats.
Flooding from the sea in such situations will involve the sudden failure of a defence structure as a result of overtopping and/or breaching. A flood wave will then flow over, or through, the

Science Report Methods to Assess, Model and Map the Environmental Consequences of Flooding: Literature review
(June 2008)
28
structure inundating land that is not ordinarily subject to the influence of seawater. Moreover, as noted above, the surface elevation of the land flooded might be below mean sea level. The result of such flooding for coastal grazing marsh, saline lagoons and reedbeds is likely to be catastrophic totally destroying or dramatically changing the community structure, species diversity and character of these habitats. However, inter-tidal habitats, such as saltmarsh and mudflat, can be expected to develop in such areas if, once flooded, they retain an open connection with the sea and become subject to tidal influence. Where the land newly flooded by the sea lies below sea level, the possibility of saline lagoons developing also exists. Flooding from the sea can, thus, have positive effects for biodiversity as well as negative ones.
The north Norfolk coast has a very high conservation value and is covered by most of the principal nature conservation designations available. It is also relatively low-lying and, unusually for the coastline of England and Wales, much of it is still in direct connection with the sea as it has not been embanked. Consequently, here, flooding from the sea and seepage of seawater through permeable natural features such as shingle ridges is a common occurrence. Nature has responded to the challenge this situation presents by creating an intricate mosaic of habitats that include shingle banks, sand dunes, inter-tidal sand and mud, saltmarsh, brackish water lagoons, freshwater grazing marsh and reedbeds. Moreover, the transitions between fully marine habitats, inter-tidal habitats, freshwater habitats and terrestrial habitats are among the best remaining in any low-lying coastal area of England and Wales. The north Norfolk coast is the only area in Britain where certain transitional saltmarsh vegetation communities still exist (Rodwell, 2000) and the region supports numerous rare and endangered species of plant and animal as well as the internationally important populations of birds for which it is well known amongst ornithologists (Buck, 1997).
The purpose of extolling the virtues of the north Norfolk coast with regard to its biodiversity here is twofold:
Firstly, it clearly illustrates that the consequences of flooding from the sea on stretches of functional coastline can be highly beneficial in terms of promoting both habitat and species variability and, hence, in enhancing biodiversity.
Secondly, it also clearly illustrates that much the best way of achieving current aims and objectives relating to biodiversity conservation in the coastal zone (see next section) is to enable, wherever possible, functional coastlines to develop rather than follow traditional approaches that have tended to equate the conservation of designated sites with their preservation in situ.
The latter observation creates a dilemma for those seeking to conserve biodiversity within the fixed boundaries of designated sites. As already noted above, many coastal grazing marshes, saline lagoons and reedbeds are currently protected by hard, fixed engineered sea defence structures that are creating coastal squeeze for beaches and saltmarsh. Consequently, a conflict exists whereby conserving some of the biodiversity assets of the coastal zone, like existing coastal grazing marsh and/or saline lagoons and/or reedbeds is incompatible with the conservation of others, such as existing beaches and/or saltmarsh.

Review: Freshwater Ecosystems, Flooding and Vegetation
Science Report Methods to Assess, Model and Map the Environmental Consequences of Flooding: Literature review
(June 2008)
29
The policy framework for the conservation of biodiversity – commitments, aspirations and legal requirements
Policy for the conservation of biodiversity in England and Wales has developed from the commitments and aspirations of UK government and the legal obligations it is bound to adhere to.
In 1992, the UK Government signed a convention on biological diversity at the United Nations Conference on Environment and Development (the Rio Earth Summit). This convention committed the UK to the conservation and sustainable use of biodiversity.
In 1994, as a first step to meeting this commitment, the UK Government published ‘Biodiversity: The UK Action Plan’. This included a list of valued habitats and species in the UK with actions and targets necessary for their conservation. A revised list was issued in 2007. It included 69 priority habitats and over 1,000 species. The UK BAP website is www.ukbap.org.uk.
The conservation of biodiversity is now central to all aspects of government policy with regard to coastal issues. The UK Marine Stewardship Report ‘Safeguarding our Seas’ (Defra, 2002a) sets out the Government’s vision for the marine environment as, essentially, ‘one of clean, healthy, safe, productive and biologically diverse oceans and seas’. One of the strategic goals adopted to deliver this vision is ‘to enhance and conserve the overall quality of our seas, their natural processes and their biodiversity’.
The strategic goals to deliver this vision were further developed by the Review of Marine Nature Conservation (Defra, 2004). The report on this study included the following recommendations:
• To halt the deterioration in the state of the UK’s marine biodiversity and to promote recovery where practicable.
• To further the conservation, where practicable, of marine features which have a key role in contributing to biodiversity and providing essential habitats to support the variety of marine life and the benefits derived from it.
These general aspirations are consistent with strategic goals and objectives being formulated under the developing European Marine Strategy (EC, 2005) and the UK Marine Bill (Coastal Futures, 2006). Thus, one of the strategic goals of the proposed UK Marine Bill is to ‘protect, allow recovery and, where practicable, restore function and structure of marine biodiversity and ecosystems in order to achieve and maintain good ecological status of these ecosystems’.
All of the above aspirations and commitments are underpinned by various legal obligations. The most significant of these are:

Science Report Methods to Assess, Model and Map the Environmental Consequences of Flooding: Literature review
(June 2008)
30
• The Water Framework Directive (EC, 2000) which seeks to ‘prevent further deterioration and protect and enhance the status of aquatic ecosystems and associated wetlands’.
• The Habitats Directive which seeks to conserve biodiversity by maintaining or restoring the favourable conservation status of habitats and species of European importance.
• The Birds Directive which seeks to maintain all naturally occurring bird populations in the wild state.
The key to the Water Framework Directive is the obligation to achieve good ecological status. The Directive does not quantitatively define good ecological status, but allows for national assessment and interpretation of datasets relating to biological communities. It is applicable to all inland waters, estuaries, coastal lagoons and near-shore coastal waters.
The Habitat Directive focuses on achieving (by maintaining or restoring) favourable conservation status. It considers the conservation status of a natural habitat to be favourable when:
• Its natural range and areas it covers within that range are stable or increasing, and
• The species structure and functions which are necessary for its long term maintenance exist and are likely to continue to exist for the foreseeable future, and
• The conservation status of its typical species is favourable as defined in Article 1(i).
Favourable conservation status does not apply directly to the Birds Directive. Simply put, this instrument requires that bird populations are maintained. It does recognise, however, that achieving this aim will necessitate the maintenance, or re-establishment of sufficient diversity and areas of habitat to address the needs of bird species both inside and outside of the designated areas.
Overall, therefore, the policy framework outlined above seeks to instil an integrated, ecosystem approach to the conservation of biodiversity that transcends the artificial boundaries set to delineate designated sites. It focuses on the need to maintain, improve and where practicable, expand the extent of habitats in the belief that this will contribute substantially to the protection of individual species. The way in which this approach is currently applied to flood risk management in the coastal zone is considered below
Incorporating biodiversity considerations into the management of flood risk in the coastal zone – shoreline management plans and coastal habitat management plans
The management of flooding from the sea in England and Wales is undertaken within the context of a Shoreline Management Plan (SMP). An SMP is a large-scale assessment of the risks associated with coastal processes that is undertaken by coastal defence authorities. It
Review: Freshwater Ecosystems, Flooding and Vegetation
Science Report Methods to Assess, Model and Map the Environmental Consequences of Flooding: Literature review
(June 2008)
31
aims to reduce the risks of flooding to people, property and the natural environment (Defra, 2006a).
When formulating an SMP the relevant authorities are obliged to contribute to and further nature conservation. In addition to complying with the general requirements of the policy framework outlined above, this means that they are also required to address a number of currently agreed environmental targets including:
• The biodiversity targets set out in UK BAP habitat and species action plans.
• The public service agreement target to bring 95% of all SSSIs into favourable condition by 2010.
• Area Targets for priority habitats.
• Provision of replacement habitat to mitigate losses of existing habitat arising from approaches to flood risk management, e.g. ‘hold the line’ and ‘no active intervention’.
• The Defra High Level Target for biodiversity – to ensure no net loss of BAP habitats and to seek opportunities for habitat enhancement and new habitat creation.
The Living with the Sea LIFE Project (English Nature, 2003) sought to optimise the implementation of legal instruments and commitments relating to nature conservation in order to meet the requirements of coastal habitats and species especially with regard to flood management.
Overall, the aim of the Living with the Sea LIFE project was to develop sustainable approaches to flood and coastal management based upon better knowledge and understanding of likely future change and the identification of the requirements for habitat creation to offset any losses. Outputs included the development of Coastal Habitat Management Plans (CHAMPs), best-practice guidance on the re-creation and/or restoration of coastal habitat and a proposed Action Plan for England.
A CHAMP provides information on the requirements of the Habitats and Birds Directives. One is prepared when there are conflicts between flood management activities and the requirements of SPAs and SACs (the Natura 2000 network) and Ramsar sites. By quantifying habitat change and identifying options, such as habitat restoration and/or habitat recreation, to compensate for any negative impacts identified, a CHAMP can inform the SMP to ensure that it contributes to and furthers nature conservation whenever this is practicable.
Key points in the Action Plan of major relevance here are:
• To manage designated sites as a coherent network.
• To take a strategic approach to the management of this network.
• To move, in the long-term, towards a presumption to restore functional coastlines.

Science Report Methods to Assess, Model and Map the Environmental Consequences of Flooding: Literature review
(June 2008)
32
• To focus on systems not features.
• To address form and function of features both within and beyond designated sites.
The formulation of SMPs is a structured process that is designed to provide solutions for present and future problems over the long-term (the next 100 years). It is based on sediment cell boundaries and considers four policy options for shoreline managers:
• Hold the existing defence line by maintaining or changing the standard of protection.
• Advance the existing defence line by building new defences seaward.
• Managed realignment of the shoreline backwards or forwards.
• No active intervention.
To facilitate the process of SMP formulation, Defra commissioned national research on coastal changes in England and Wales (Halcrow, 2002). This developed scenarios for future coastal evolution and identified the likely position of the coastline in 2025, 2055 and 2105 under the different policy options considered by SMPs.
The first round of SMPs for the coastline of England and Wales has been completed, but individual SMPs will be reviewed and revised as appropriate over time.
Assessing, modelling and mapping the consequences of flooding from the sea on biodiversity in the coastal zone
The basic approach to assessing the likely environmental impact of a natural phenomenon or a man-made development is a relatively straightforward process, but it requires a substantial amount of professional knowledge and judgement. Thus, in order to fully assess the environmental consequences of flooding from the sea it is necessary to draw upon a wide range of specialist technical disciplines that cover processes like hydrodynamics, geomorphology and ecology. Critically, it is also necessary to have access to individuals who understand the, often extremely subtle, linkages between the various interacting processes that give rise to the actual environmental consequences of a flooding event and are able to evaluate these consequences within a risk assessment framework. A valuable tool for risk assessment is modelling; a particularly specialised field. Consequently, any assessment study of the environmental consequences of flooding from the sea requires a team of suitably trained, qualified and experienced staff. This essential requirement should be borne in mind when reading the following outline account of the process and procedure(s) of assessment which should not be regarded as a ‘do-it-yourself’ guide.
The general process and procedures employed for environmental impact assessment (EIA) are well documented (IEMA, 2004). In addition, guidance is available on the particular techniques relevant to ecological impact assessment (IEEM, 2006) and, currently, advice is being prepared for the ecological impact assessment of developments in the coastal zone (IEEM, in press). Specific guidance on the conservation of biodiversity is available in

Review: Freshwater Ecosystems, Flooding and Vegetation
Science Report Methods to Assess, Model and Map the Environmental Consequences of Flooding: Literature review
(June 2008)
33
Planning and Policy Statement 9 (HMSO, 2005) and an associated government circular (ODPM, 2005). A number of guides specific to the assessment of flood and coastal defences in England and Wales (FCDPAG 1 to 6) are also available from the Defra website (www.defra.gov.uk).
The assessment of a potential environmental hazard, like flooding from the sea, is complicated by the fact that the hazard, if realised, may have a number of possible outcomes whose consequences are uncertain. This issue of uncertainty of outcome(s) is usually addressed by adopting a risk-based approach to the assessment process. A widely accepted approach to environmental risk management is described in a document commonly referred to as ‘Green Leaves 2’ (DETR, EA and IEH, 2002). It employs the concept of sources, pathways and receptors. In the present context, sources may be sea level or waves; pathways the overtopping/breaching of sea defence works and the inundation of coastal floodplains and receptors the habitats and species which define biodiversity in the coastal zone. The risk assessment stage of the overall process starts at a simple level and only progresses to more sophisticated levels of analysis if this is shown to be necessary. The risk associated with potential outcomes is defined by the probability of an outcome occurring and the magnitude of the consequences should it occur. Probability of occurrence and magnitude of outcome(s) are both often evaluated qualitatively (high – medium – low – very low) and then combined to generate matrices that categorise the significance of the risk in a similar manner.
One study of particular relevance to the present work is Broad-scale Ecosystem Assessment (BSEA) Toolbox 1 (Defra, 2006b). Following a scoping study (Defra, 2002b), this work was undertaken to provide a user friendly package of guidance, data sources and broad ecosystem impact modelling techniques to inform practitioners working in the fields of fluvial and marine flood risk management. Because of the fundamental significance of this work to the aims and objectives of the present study, its outcome, with regard to the proposed approach for the coastal zone, is described at some length below.
The BSEA study selected coastal habitats as the appropriate level of ecological resolution. This choice was made in recognition of the fact that the current policy framework is heavily focused on habitats and that, given existing levels of knowledge and understanding, adequate evaluation of species-specific impacts in the coastal zone, on a broad-scale, is not feasible at the present time. The assumption made in this selection was essentially the one implicit in the Habitats Directive, viz. by ensuring that the condition of coastal habitats is maintained in, or restored to, favourable condition the characteristic communities of plants and animals associated with those habitats will be conserved. By adopting such an approach when addressing the issues associated with managing the risk of flooding from the sea practitioners will, thus, be providing the best, practical means at their disposal for safeguarding the biodiversity of any given stretch of coast in the context of flood risk management.
The study recommended a two tier approach to broad-scale assessment at the level of the sediment cell: with the tier adopted being dependant upon the likely significance of impact(s) and the quantity and quality of available input data.
Thus, in those situations where the likelihood of significant ecosystem change is low and/or where there is insufficient data available for detailed analysis a High Level approach was

Science Report Methods to Assess, Model and Map the Environmental Consequences of Flooding: Literature review
(June 2008)
34
proposed. A Mid Level approach was advocated for those situations where potentially significant environmental consequences are anticipated and/or where sufficient relevant data is available to permit detailed analysis. Such an overall approach is comparable to the process of EIA with the High Level tier being similar to the Scoping Phase of EIA.
On the basis of this philosophy, BSEA established a framework (toolkit) that identifies potential sources of data and information and provides guidance on how the assessment process should be carried out.
The toolbox developed for coastal high-level ecosystem assessment, in the absence of detailed, specific information, consists of procedures for the integrated analysis of four key areas; baseline habitats, predicted patterns of shoreline migration, tidal inundation and coastal flooding and mobile sediment availability. Essentially, the approach involves incorporating this information, obtained from national databases, into a Geographic Information System (GIS) in order to present and manipulate it as layers which can be overlaid one upon the other to identify areas threatened by flooding from the sea according to a range of different scenarios.
In those situations where significant amounts of suitable data are available, BSEA identifies two basic approaches for conducting more detailed assessments; top-down and bottom-up.
The top down approach can be either wholly empirical or structured around a set of relevant physical principles. Essentially, it involves the application of a general understanding of a discrete system, such as an estuary or stretch of coast defined by a single sediment cell or sediment sub-cell, to predict likely future change(s) in its nature and development. The top-down approach is best suited to the investigation of large-scale, long-term change over years or decades. It typically involves the analysis and interpretation of data or the development and application of a conceptual model based on the assumption that a system that is in a state of dynamic balance before a change occurs will respond to that change by developing a new equilibrium once the change has taken place. Outputs from the top-down approach can, thus, range from statistical predictions of likely future system behaviour to general descriptive accounts of the processes occurring and their likely outcome(s).
Examples of the top-down approach that involve the analysis and interpretation of data include:
• The use of simple regression techniques to relate key features, such as type of sediment, to environmental variables like wave climate.
• The examination of historical trends, in erosion rates to facilitate determination of morphological change and, hence position of a shoreline, at different times in the future
• The bringing together of information on the predicted rise in sea level with knowledge of how the community structure and species diversity of saltmarsh vegetation is governed by the tidal inundation regime at a given site, to provide insight into the likely impacts, on the vegetation of sea level rise.

Review: Freshwater Ecosystems, Flooding and Vegetation
Science Report Methods to Assess, Model and Map the Environmental Consequences of Flooding: Literature review
(June 2008)
35
Top-down approaches that are based on the assumption that a system subject to change will adjust to a new equilibrium condition after that change has taken place generally employ regime relationships or some sort of form analysis. These techniques serve to link properties of form with potential drivers of change to facilitate calculation of the new form subsequent to change taking place. Examples include the equilibrium shape of the depth and width of the cross-section of an estuary in relation to the tidal prism of that estuary and the equilibrium shape of a cross-shore profile in relation to local sea level.
The bottom-up approach makes use of process-based models that may be used singly or in combination. They are generally best suited to considering short-term, localised changes. Such models range from straight-forward mathematical formulations, like the Bruun Rule for calculating shoreline erosion due to sea level rise (Bruun, 1988; see also Dubois, 1992), to sophisticated modular systems that include detailed mathematical representations of all key physical processes. Well established examples of modular modelling systems include DELFT3D developed by Delft Hydraulics, MIKE21 developed by the Danish Hydraulics Institute and TELEMAC 2D/3D developed by Electricite de France in association with HR Wallingford.
The basis of any modular modelling system is a hydrodynamic model which, depending on type, can produce output on parameters such as water levels, current speed and direction and wave climate. Typically, the output of a hydrodynamic model is used to drive a sediment transport model which simulates sediment movement and patterns of accretion and erosion. This information can be fed into a morphological bed updating model to generate changes in bed levels that are predicted to occur as a result of simulated changes in hydrodynamic regime and/or patterns of sediment transport. Some modelling systems also incorporate additional modules that represent aspects of water quality and ecological processes. Thus, it is possible to investigate the response(s) of these process areas, albeit in a generally limited manner, to changes in the physical regime. Most of the ecological assessment work undertaken using such models, however, still involves the use of output data from the modelling system as input to inform an assessment exercise based primarily on the application of professional knowledge and judgement.
The information obtained from a bottom-up modelling study can be used to inform top-down approaches in a variety of hybrid techniques. General guidance on the use of modelling techniques in the context of flood management can be found in Defra (2002b) and the BSEA Toolbox (Defra, 2006b). Specific guidance with regard to using models to predict morphological change in estuarine systems is provided by MAFF (2000) and the interactive, web-based tool ‘The Estuary Guide’ aims to provide an overview of how to identify and predict morphological change in estuaries as a basis for sound management.
A detailed approach of particular interest in the current context is RASP; Risk Assessment for flood and coastal defence Strategic Planning (Environment Agency, 2004 and 2006). The RASP approach is a method for national scale flood risk assessment that was developed in the Foresight Flood and Coastal Defence Project. It is based upon a tiered methodology that provides for three levels of analysis:
• The High Level approach employs data on flood defences, flood plains and land use obtained from national databases to provide a means of refining and updating national estimates of flood risk.

Science Report Methods to Assess, Model and Map the Environmental Consequences of Flooding: Literature review
(June 2008)
36
• The Intermediate Level approach takes measurements or model estimates of flood water levels in conjunction with flood defence levels and terrain topography to produce improved estimates of flood risk.
• The Detailed Level approach takes specific information on the characteristics of flood defence works to generate estimates of their likelihood of failure under a range of different failure mode scenarios. It can also be employed to evaluate the potential socio-economic effect(s) of flooding events using data from national demographic and property databases.
The flood extent and depth information produced by the RASP system is of clear interest in the present context. Moreover, RASP might have the potential to become a powerful, risk-based approach to evaluating the environmental consequences of flooding from the sea if it can be further developed to also handle data on coastal habitat types and appropriate indicators of the response of these habitats to flooding from the sea at the Detailed Level of approach.
The data and information required to conduct any assessment of the environmental consequences of flooding from the sea is potentially available from many sources. However, it is essential to ensure that it is fit for purpose, i.e. reliable and sufficiently accurate. Moreover, it is also desirable that it comes in a format that is readily usable; ideally within a geographical information system (GIS) package. Also, where gaps in the data base exist, it is necessary to ensure that any additional data gathering is undertaken in accordance with appropriate techniques so that the data obtained can be compared directly with the existing datasets.
Many of the key references noted above provide detailed information on potential sources of information in the current context as well as consideration of the issues relating to the use of data and information provided by others, e.g. cost, licensing agreements, quality. Consequently, these sources/issues are not described in detail here. What follows below is a list of the general types of data most relevant to the assessment, modelling and mapping of the consequences of flooding from the sea for biodiversity in the coastal zone. Only primary sources of this data in England and Wales are identified. Hopefully, this should provide some confidence in the provenance of any data obtained. Nevertheless, in every case, practitioners acquiring such data should confirm, by suitable checking procedures, that the data is fit for purpose before making use of it.
Data relating to coastal morphology - These features of an area of the coastal zone are defined by characteristics such as the geology, geomorphology, sedimentology, land surface elevation and near-shore bathymetry. Data sets covering these parameters are compiled and held by organisations such as the British Geological Survey, the Ordnance Survey, the Hydrographic Office, the Environment Agency and some local authorities. The Integrated Coastal Zone Mapping (ICZM) initiative was implemented to provide a single portal for accessing some of this data in the future. The British Geological Survey, the Ordnance Survey and the Hydrographic Office united to bring their respective databases to a common standard in order to provide seamless integration of their data for the coastal zone. Data for three pilot areas of the coast have already been integrated in this manner, but the scheme is still to be completed for the rest of the coast.

Review: Freshwater Ecosystems, Flooding and Vegetation
Science Report Methods to Assess, Model and Map the Environmental Consequences of Flooding: Literature review
(June 2008)
37
Data relating to coastal hydrodynamics – Data on parameters such as tidal regime, wind and wave climate, highest astronomical tides and mean still water sea levels is collected from measuring devices located around the coastline. It is collated and maintained by the British Oceanographic Data Centre which is the UK partner in SEA-SEARCH; a project funded by the European Commission to provide a gateway to marine data in Europe. A commercial service, called SeaZone, is operated by Metoc to supply Admiralty and other marine data for use within a GIS.
Data relating to coastal defence works – The National Flood and Coastal Defence Database (NFCDD) is maintained by the Environment Agency. It holds information on the location, type and condition of sea defence works, but does not have the crest level and crest width for all of these structures as these two crucial aspects of any flood defence structure are not mandatory requirements of the NFCDD. The Environment Agency also has Indicative Coastal Floodplain (ICFP) Maps which indicate the potential extent of flooding from the sea around the coast of England and Wales in the absence of any defences for a 1:200-year return period flood. Indicative Fluvial Floodplain Maps (IFFM) can also be obtained from the Environment Agency. They indicate the extent of flooding, in the absence of any defences, for a 1:100-year return period flood.
Data relating to coastal change – The UK Climate Change Impacts Programme produces predictions for relative sea level change that are reviewed and updated to reflect growing understanding of this process. On the basis of the most authoritative information available at the time, Futurecoast generated predictions of shoreline location in 2025, 2055 and 2105 to inform the production of the latest generation of SMPs.
Data relating to the biodiversity assets of the coastal zone – Datasets relating to biodiversity in the coastal zone are held by a wider range of bodies than the physical datasets described above and, as a consequence, are much more variable in terms of quality. Indeed, when compiling existing information for coastal habitats in order to inform the formulation of targets for coastal habitat re-creation Pye and French (1993) concluded that information on the areal extent of several habitat types was severely deficient and that information about losses affecting all habitat types was fragmentary. They also noted wide discrepancies in even basic parameters, like the length of the coast of England, between different published works. With this note of caution in mind, the principal providers of biodiversity data for the coastal zone are statutory nature conservation organisations, local biological record centres, local authorities and local wildlife trusts. Information on designated sites in England and Wales can be obtained from
• www.magic.gov.uk
• www.natureonthemap.org.uk
• www.naturalengland.co.uk
• www.ccw.gov.uk
Information on species distributions can be obtained from:
• www.nbn.org.uk
• www.searchnbn.uk
Science Report Methods to Assess, Model and Map the Environmental Consequences of Flooding: Literature review
(June 2008)
38
Additional web sites containing much useful information on biodiversity include:
• www.defra.gov.uk
• www.environment-agency.gov.uk
• www.jncc.gov.uk
• www.ukbap.org.uk
The general coastal habitat information available from the above sources tends to be presented in accordance with the UK National Marine Habitat Classification (NMHC) for Britain and Ireland. The NMHC contributes to a pan-European system (EUNIS) to provide a well established, consistent basis for the description of marine habitats at a number of levels of which Level 3 (habitat complexes equating roughly to designated sites) and Level 4 (biotope complexes describing groups of biotopes with similar overall physical and biological characteristics) are likely to be the most suitable for general assessment and mapping purposes.
Specific reference works, with wide geographical coverage, that relate to particular habitat types include the Shingle Survey of Great Britain (Sneddon and Randall, 1993), the Inventory of English Sand Dunes and Their Vegetation (Radley, 1992), the Saltmarsh Survey of Great Britain (Burd, 1989) and the Directory of Saline Lagoons (Smith and Laffoley, 1992). These were summarised by Pye and French (1993).
Concluding remark
The above overview of assessment methods, modelling techniques and existing data indicates that numerous tools and much information required for the assessment of the consequences of flooding from the sea on biodiversity in the coastal zone, at a broad-scale, already exist. Thus, although there may be gaps in terms of data coverage and/or resolution for specific local sites, it seems feasible to integrate available information, using existing tools and procedures, to provide a general assessment of the likely consequences of flooding from the sea on the various types of coastal habitat
References
ADAM, P., 1990 Saltmarsh Ecology, Cambridge University Press, Cambridge.
BRUUN, P.,1988 The Bruun Rule of erosion by sea level rise, a discussion on large-scale two and three dimensional usage. Journal of Coastal Research, 4, 627-648.
BUCK, A.L., 1997 An Inventory of UK estuaries. Volume 5, Eastern England, JNCC, Peterborough.
BURD, F., 1989 The Saltmarsh Survey of Great Britain. Research & Survey in Nature Conservation, Nature Conservancy Council, Peterborough.

Review: Freshwater Ecosystems, Flooding and Vegetation
Science Report Methods to Assess, Model and Map the Environmental Consequences of Flooding: Literature review
(June 2008)
39
CARTER, R.W.S., 1988. Coastal Environments. Academic Press, London.
CEBC, 2006. Guidelines for Systematic review in Conservation and Environmental Management: Version 2.0. Centre for Evidence-Based Conservation, School of Biosciences, University of Birmingham.
Coastal Futures, 2006. The Marine Bill The Consultation & Beyond: Options, Opportunities and Building Networks. June 15, 2006 SOAS, London. Organised by CMS – Coastal Management for Sustainability.
Defra, 2002a. Safeguarding our Seas. A strategy for the conservation and sustainable development of our marine environment. Department for the Environment, Food and Rural Affairs, London.
Defra, 2002b.Broad Scale Ecosystem Impact Modelling Tools: Scoping Study Final Report FD2108. Department for the Environment, Food and Rural Affairs, London.
Defra, 2004. Review of Marine Nature Conservation. Summary of Working Group report to Government, July 2004. Department for the Environment, Food and Rural Affairs, London.
Defra, 2006a. Shoreline Management Plan Guidance. March 2006 Department for the Environment, Food and Rural Affairs, London.
Defra, 2006b Broad Scale Ecosystem Assessment (BSEA) BSEA Toolbox 1 R&D Technical Report FD2112/TR, June 2006. Department for the Environment, Food and Rural Affairs, London.
Defra, 2007. Sand dune processes and management for flood and coastal defence R&D Technical Report FD1302/TR, May 2007. Department for the Environment, Food and Rural Affairs, London.
DETR, EA and IEH, 2002. Guidelines for Environmental Risk Assessment and Management. DETR, Environment Agency and Institute for Environment and Health.
DoE, 1993. Coastal Planning and Management: A Review. Department of the Environment, HMSO, London.
DUBOIS, R.N., 1992. A re-evaluation of Bruun’s Rule and supporting evidence. Journal of Coastal Research. 8, 618-628.
EA, 2004. Risk assessment of flood and coastal defence systems for strategic planning (RASP), R&D Technical Report W5B-030/TR. Environment Agency.
EA, 2006. Scoping the development and implementation of flood and coastal RASP models. Joint Defra/Environment Agency flood and coastal erosion risk management R&D Programme. Science Report SC050065/SR1.
EC, 1979. Directive 79/923/EEC on the conservation of wild birds. Official Journal of the European Commission, L103, 25 April 1979.
EC, 1992. Directive 92/43/EEC on the conservation of natural habitats and of wild flora and fauna. Official Journal of the European Commission, L206, 22 July 1992.
EC, 2000. Directive 2000/60/EEC establishing a framework for Community action in the field of water policy. Official Journal of the European Commission, L327, 22 December 2000.
EC, 2005. Proposal for a DIRECTIVE OF THE EUROPEAN PARLIAMENT AND OF THE COUNCIL establishing a Framework for Community Action in the field of Marine Environmental Policy (Marine Strategy Directive). SEC(2005) 1290. Commission of the European Communities, Brussels.

Science Report Methods to Assess, Model and Map the Environmental Consequences of Flooding: Literature review
(June 2008)
40
English Nature, 2003. Conservation of Dynamic Coasts: A framework for managing Natura 2000. Living with the Sea LIFE Project, English Nature, Peterborough.
Foresight, 2004. Foresight Future Flooding Scientific Summary: Volume 1 Future risks and their drivers. Office of Science and Technology, London.
Halcrow, 2002. Futurecoast. www.defra.gov.uk/environ/fcd/research/futurecoast.htm
HMSO, 2005. Planning Policy Statement 9, Biodiversity and Geological Conservation (PPS9). HMSO, London.
HR Wallingford, 1994. Coastal Management: Mapping of Littoral Cells, report SR 328. HR Wallingford Ltd.
IEEM, 2006. Guidelines for Ecological Impact Assessment in the United Kingdom. Institute of Ecology and Environmental Management, Winchester.
IEMA, 2004. Guidelines for Environmental Impact Assessment. Institute of Environmental Management and Assessment, Lincoln.
LARSON, D.W., MATTHES, U. & KELLY, P.E., 2000. Cliff Ecology: Pattern and Process in Cliff Ecosystems. Cambridge University Press, Cambridge.
MAFF, 1993. Coastal Defence and the Environment; a guide to good practice. Ministry of Agriculture, Fisheries and Food, London.
MAFF, 2000. A Guide to Prediction of Morphological Change within Estuarine Systems. Version 1B. Research by the EMPHASYS Consortium for MAFF Project FD1401. Ministry of Agriculture, Fisheries and Food, London.
NRA 1995. A Guide to the Understanding and Management of Saltmarshes. R&D Note 324, National Rivers Authority, Bristol.
ODPM, 2005. Government Circular: Biodiversity and Geological Conservation – Statutory Obligations and their Impact within the Planning System. Office of the Deputy Prime Minister, 16 August 2005, London.
PACKHAM, J.P., RANDALL, R.E., BARNES, R.S.K. & NEAL, A., 2001. Ecology and Geomorphology of Coastal Shingle. Westbury Academic and Scientific Publishing.
PACKHAM, J.P. & WILLIS, A.J., 1997. Ecology of Dunes, Salt Marsh and Shingle. Chapman & Hall, London.
PYE, K. & FRENCH, P.W., 1993. Targets for coastal habitat re-creation. English Nature Science No. 13, English Nature 1993.
RADCLIFFE, D.A., 1977. A Nature Conservation Review: Volume 1. Cambridge University Press, Cambridge.
RADLEY, G.P., 1992. English Coastal Sand Dunes and their Vegetation, a National Inventory. English Nature, Peterborough.
RAMSBOTTOM, D., NOTTAGE, A. and ACREMAN, M. 2005. Scoping Study (Phase 1) Environmental Consequences for Flood Risk Assessment, R&D Technical Report EX 5126, Environment Agency, Bristol.
RODWELL, J.S. (ed), 2000. British Vegetation Communities. Volume 5. Maritime communities and vegetation of open habitats. Cambridge University Press, Cambridge.
SMITH, E.P. & LAFFOLEY, D., 1992. Saline Lagoons and Lagoon-like Habitats. English Nature, Peterborough.

Review: Freshwater Ecosystems, Flooding and Vegetation
Science Report Methods to Assess, Model and Map the Environmental Consequences of Flooding: Literature review
(June 2008)
41
SNEDDON, P. & RANDALL, R.E., 1993. Coastal Vegetated Shingle Structures of Great Britain. Main Report. Joint Nature Conservation Committee, Peterborough.
STeers, J.A., 1978. Coastal Features of England and Wales. Oleander Press, Cambridge.
Science Report Methods to Assess, Model and Map the Environmental Consequences of Flooding: Literature review
(June 2008)
42
4 Issue 3: Hydrology to assess the environmental consequences of fluvial flooding
John Packman
(Centre for Ecology and Hydrology)
4.1 Scope This chapter builds on initial considerations of flood hydrology in the project’s scoping study (Ramsbottom et al., 2005). Flooding occurs when water flows exceed the capacity of the drainage system. High water flows (essentially a hydrological concern) may be generated by one or a combination of mechanisms including: extreme local rainfall causing surface runoff; widespread heavy rainfall raising river flows; prolonged rainfall periods raising groundwater flows; and anthropogenic impacts such as burst pipes, flow diversions and dam breaks. Flow generation processes are sporadic, seasonal, and spatially varied across a catchment, though flow rates generally evolve more slowly through the drainage system than does the system’s capacity (essentially a hydraulic concern) that can vary rapidly with changes in channel cross-section, slope, roughness, blockages, etc. The resulting occurrence and spatial distribution of flooding can show great variability, particularly in the upper reaches and tributaries of a river basin.
Without intervention, river channels erode and adapt in response to the flows they carry. Typically a mature British river would flood to some extent every 1-2 years, depositing nutrient rich sediment and creating a fertile flood plain. Flora and fauna evolve in sympathy with the river and flood plain regime, and human agriculture and settlement also capitalise on the status quo, adapting to variations in the extent and depth of occasional flooding and harvesting the benefits while seeking to control the risk of severe flood damage. But while the ecology of a river basin is largely dependent on normal flow conditions and seasonal variability, including in-bank and relatively minor flood events, the capital-intense urban, industrial and commercial areas require a very high standard of flood protection – so damages won’t occur more often than typically once in 100 years.
Flood protection may be provided by increasing drainage capacity (e.g. enlarged/straightened channels, raised flood banks, etc) or by reducing flows (e.g. diversions, storage in reservoirs/ enlarged flood plains – and possibly changes in land use/management). Whereas increasing capacity will simply pass on higher flows, the impacts and benefits of flow reduction could persist downstream. Recognising that some risk of flooding remains whatever the standard of flood protection, a strategic approach to flood risk management is now required by EA/Defra, evaluating the costs and annual average

Review: Freshwater Ecosystems, Flooding and Vegetation
Science Report Methods to Assess, Model and Map the Environmental Consequences of Flooding: Literature review
(June 2008)
43
damages for combinations of flood protection options on a basin-wide scale. Catchment Flood Management Plans are developed using procedures described and provided in the Modelling and Decision Support Framework (MDSF, Defra/EA 2003).
Modelling flood risks and damages at a basin wide scale could require very detailed, time-consuming, and costly models. However, the MDSF is not aimed at detailed design, but strategic decisions to protect people and property, and accordingly adopts appropriate and pragmatic model choices. Flood damages are assessed for five standard return periods (5, 10, 25, 100, 200 years), but validation focuses on the 100 year event. The shorter return periods help define the low end (onset) of the annual damages distribution, but are still relatively long in ecological terms. The models used consider only the dominant flow processes, do not consider seasonal or temperature effects, or how flood defence options might affect smaller floods/freshets and their impact on floodplains and wetlands. Spatial resolution is low, with river reaches several kilometres in length. Some upgrading of these model choices will be required if ecological indicators of flood management options are to be considered.
4.2 Modelling flood hydrology The hydrology of flooding may be assessed following one of three main approaches
• Statistical analysis of flood magnitude and frequency
• Event-based modelling of flood generation mechanisms
• Continuous simulation of long flow records, with peaks abstracted for statistical analysis
Each approach has its benefits and suitabilities, with ways to transfer information from sites with long records to those that are ungauged.
4.2.1 Statistical analysis This is the fundamental approach to assessing sporadic phenomena, including flood peaks, durations, extents, damages, and habitat area. For flood peaks, observed flow records are used to relate peak magnitude to frequency of occurrence, and thus estimate Q(T) the peaks for a range of return periods T. The conventional hydrological approach considers just the series of maximum flows each year (avoiding dependence across year boundaries by adopting a ‘water year’ centred on the expected flood season). Alternatively, analysis may consider all peaks above a chosen threshold (with an appropriate rule to avoid dependence between events). Furthermore, seasonal or monthly maximum flows could be analysed (with extended rules on dependence, e.g. disqualifying any monthly maxima at the start of the month on the recession from a flood peak in the previous month – and similarly at the end of the month).

Science Report Methods to Assess, Model and Map the Environmental Consequences of Flooding: Literature review
(June 2008)
44
For ungauged sites, a regional analysis may be used, relating individual Q(T) values to catchment parameters such as area, soil type, rainfall characteristics, etc. Alternatively, the UK Flood Estimation Handbook (FEH, Institute of Hydrology, 1999) derived a relationship just for QMED (i.e.Q(2)) and finds average values for the ratios Q(T)/Q(2) using a ‘pool’ of similar catchments. In either case it is clear that
(1) It is not a causitive model of flow generation, rather an association with catchment parameters (e.g. bigger/more clayey catchments tend to produce bigger annual maxima). Flows are not assessed as surface runoff, river floods, groundwater floods, etc, but considered as enveloping all causes. In most cases, the Q(T) estimates will not take account of changes in catchment, channel, or flood plain properties.
(2) If applied successively down a catchment, there is no link between the analysis for successive gauged sites or regionalised estimates. The Q(T) values do not in general relate to the same flood event, especially where tributaries meet larger main rivers, or as analysis proceeds downstream. Tributary and upstream flood estimates are more likely to be based on shorter more intense rainfall events, rather than the longer events that generally cause flooding downstream. The Q(T) values represent an envelope of all flood events.
Using the FEH procedures, grids of Q(T) values (for T=2,5,10,25,50,100,200,250,1000) have been derived at 50m steps along every UK river with a catchment area of 0.5km2 or more. These grids are recommended in the MDSF (Defra/EA 2003) for assessing and adjusting spatial consistency in the parameters of the FEH event-based model. Also, at 1 km steps along the river network, the Q(100) and Q(1000) values have been used to re-scale a standard hydrograph shape, which was input to a simple river model to derive national base maps of flood plain extent for the Environment Agency. The envelope nature of the Q(T) grids could lead to overestimation of flood extents at confluences (simultaneously combining worst cases), but the procedure is also unable to account directly for the effect of flood management provisions (flood storage, flood defences). The base maps are therefore superseded where more detailed model studies are available.
Although the basic statistical approach seems of limited use in assessing the environmental consequences of flood management, an extension of the FEH analysis to obtain seasonal flow maxima for use as scaling factors in event-based modelling (2) could provide a pragmatic alternative to continuous simulation (3). The issues of water temperature, chemistry and sedimentation remain.
4.2.2 Event-based modelling of flood generation processes Event analysis is the traditional approach to runoff and river flood modelling, developing and calibrating model processes using observed events of appropriate size. For ungauged sites, model parameters may be defined by process rules and/or related to catchment parameters such as area, soil type, land slope, etc. The model is then run from design initial conditions with (usually) the T-year rainfall depth distributed as some design profile over a design duration to provide an assumed T-year flood peak (and full T-year design hydrograph for assessing flood volumes). For some models, including the FEH rainfall-runoff model

Review: Freshwater Ecosystems, Flooding and Vegetation
Science Report Methods to Assess, Model and Map the Environmental Consequences of Flooding: Literature review
(June 2008)
45
(Institute of Hydrology, 1999) and its ‘revitalised’ form (Kjeldsen, 2007), the design inputs have been specifically chosen to optimise the match with statistical T-year flood peaks.
Despite some concerns with the validity of design inputs, event modelling does at least allow flood management options to be compared for reference conditions. Models may be applied for a single site, or to provide multiple sub-catchment inputs to a detailed hydraulic river model (assuming some generalised spatial distribution of rainfall). The MDSF (EA/Defra 2003) takes results from the offline application of an event-based model and assesses flood extents and economic damages; it does not consider flood duration. Though any suitable offline model could be used, the associated guidance is built around the FEH rainfall-runoff model and the iSIS river model. Recognising that design rainfall duration is generally shorter in smaller, ‘flashier’ subcatchments, model runs are repeated for a range of rainfall durations at each return period, and the largest peak flow taken to represent the T-year value.
In comparison with the statistical approach (1), event-based hydrological-hydraulic modelling takes better account of combined responses at confluences, of flood management facilities, and specific hydraulic conditions. Although some generalisation is possible, the approach focuses on a single dominant flood mechanism (seldom groundwater flooding), applied simultaneously across the whole catchment, usually ignoring spatial rainfall variability, localised runoff, seasonal changes in rainfall and initial conditions, and how local changes in catchment response might impact on the critical design conditions. Design hydrographs derived from design storms are unrealistically smooth compared with real observed events, casting doubt on the accuracy of flood duration estimates (which could have critical ecological implications). These concerns could be addressed by using suites of equally likely design storms, but at a cost of additional model runs and detailed scenario management. Such design suites also question how the multiple model outputs relate to the T-year flood. Detailed integration of probabilities across all input variables to build a joint probability distribution of outputs is possible, but properly defining the input probabilities and their inter-dependencies remains a likely source of uncertainty.
As with the statistical method (1), issues remain over the environmental consequences of flood durations and flood related water temperature, chemistry and sedimention.
4.2.3 Continuous simulation
It is now generally recognised that, where the impact of change within a river basin depends on catchment state and event characteristics, continuous simulation over long periods (covering a wide range of situations and events) is likely to provide the best, balanced estimate of overall impact. The continuous simulation approach is well suited to modelling mixed processes where the physical linkage between components is easier to define than any statistical dependence. Such situations include:
• Assessing all modes/mechanism of flood generation (frequency, impact, etc)
• Estimating net effect of phenomena such as climate change, flows below tributaries, and combinations of flood management options.
• Multidisciplinary studies, building in interactions between processes
Science Report Methods to Assess, Model and Map the Environmental Consequences of Flooding: Literature review
(June 2008)
46
• Statistical analysis of derived hydrological, hydraulic, economic and ecological indicators
However, a number of reservations exist, especially in assessing flood flows:
• Model complexity - a majority of processes and parameters tend to concern low flows
• Rainfall data - long records are needed (with spatial variation in larger catchments)
• Synthetic rainfall model - probably required if addressing long return periods - current models involve many parameters ~60, with uncertain representation/reliability.
• Model calibration - which might concentrate on frequent smaller floods
• Model runs – long run times, and iterative design procedures need multiple model runs
• Model response – an aura of credibility, but results depend on the veracity with which the model represents the true processes and interactions involved.
The effort of obtaining and managing long spatial rainfall records (and possibly temperature, evaporation, etc) must be recognised as much greater than for the design storms used in event-based modelling (2). Model runtimes could be reduced by a hybrid approach, using continuous simulation to identify a series of significant events (and initial conditions) to be modelled separately and subsequently analysed in frequency terms (peaks over threshold).
Many continuous simulation models exist that could be used to assess the ecological consequences of flooding. At least four relatively simple candidate models have been developed at CEH: CLASSIC a broad scale, distributed model originally developed for land use studies (Crooks et al, 1996); DAYMOD, a continuous simulation version of the FEH rainfall-runoff model (Packman, 2003); a lumped PDM based model developed for flood frequency estimation (Calver et al, 2005); and G2G, a grid-based distributed model (Bell et al, 2007). Each model could provide subcatchment inflows to a hydraulic river model, and thence link to suitable damage cost and ecological models.
However, the current MDSF damage cost model (EA/Defra 2003) cannot link directly with continuous simulation models. While an interface could be developed to abstract individual return period events from the continuous output, some difficulties emerge with this approach. Different events are likely to be critical under separate criteria (flood peaks, volumes, damages, ecological impact, etc). The benefit of continuous simulation in deriving a full sequence of final model outputs for statistical analysis (rather than using outputs from selected return period inputs) is likely to be lost. Applying the hybrid approach described above, and modelling an extended sequence of events within an expanded MDSF seems a better approach.
Review: Freshwater Ecosystems, Flooding and Vegetation
Science Report Methods to Assess, Model and Map the Environmental Consequences of Flooding: Literature review
(June 2008)
47
4.3 Conclusions
Assessing the ecological consequences of flood management options is likely to require the assessment of additional parameters and indicators not included in the current MDSF (e.g. seasonality, more frequent floods, habitat extent, water temperature, sediment). More information is needed on the form of these indicators and the data on which they should be based.
Some work could be done to address such aspects in the offline hydrological and hydraulic modelling inputs to MDSF (e.g. seasonal factors on event-based flood peak estimates, interface to select return period events from continuous simulation outputs), but an expanded MDSF would be required to evaluate the indicator values and their respective frequencies based on an extended sequence of flood events to include smaller and seasonal events.
References
BELL V.A., KAY A.L., JONES R.G., and MOORE R.J., 2007. Development of a high resolution grid-based river flow model for use with regional climate model output. Hydrol. Earth Syst. Sci., 11(1), 532-549.
CALVER A N, CROOKS S M, JONES D, KAY A, KJELDSEN T R, REYNARD N R, 2005. National river catchment flood frequency method using continuous simulation, Defra/EA Flood and Coastal Management R&D Programme, FD2106, Final Report.
CROOKS S M, NADEN P S, BROADHURST P and GANNON B, 1996. Modelling the flood response of large catchments, Report to MAFF Project FD412, Institute of Hydrology, UK.
Defra/Environment Agency, 2003. Catchment Flood Management Plan, Development of a Modelling and Decision Support Framework (MDSF), Flood and Coastal Defence R&D Programme, MDSF Procedures Version 2.0
INSTITUTE OF HYDROLOGY, 1999. Flood Estimation Handbook. 5 Vols.
KJELDSEN T R 2007. The revitalised FSR/FEH rainfall-runoff method, Flood Estimation Handbook Supplementary Report No. 1, Centre for Ecology and Hydrology
PACKMAN J C, 2003. FEH runoff model parameters for use in the whole Thames CFMP. Customer Report to HRW, 29p.
RAMSBOTTOM, D., NOTTAGE, A. and ACREMAN, M. 2005. Scoping Study (Phase 1) Environmental Consequences for Flood Risk Assessment, R&D Technical Report EX 5126, Environment Agency, Bristol, 62pp.
Science Report Methods to Assess, Model and Map the Environmental Consequences of Flooding: Literature review
(June 2008)
48
5 Issue 4: Sediments and the consequences of flooding
C. Thorne1, G. Old2 and D. Booker2
(1 University of Nottingham, 2Centre for Ecology and Hydrology)
Introduction
This chapter develops the initial consideration of the consequences of flooding for sediments presented in the scoping study (Ramsbottom et al., 2005). To explain the consequences of floods for sediments it is necessary to understand how the sediment regime is related to surface runoff from the catchment and the flow regime of the river. This is the case because the sediment load carried by the stream is composed of two components: material derived from catchment erosion (landslides, slope erosion, soil loss from fields etc.), that is subsequently delivered to the river channel (mainly via surface runoff, tributary streams and ditches but also by wind action), and material derived from erosion of the channel bed and banks within the river channel during high flows (Richards, 1982; Knighton, 1998). Due to the multiplicity of sediment sources and the complex interactions that occur between the flowing water and the sediment it carries, there is no simple relationship between the discharge of water and the rate of sediment transport in rivers (Richards, 1982; Knighton, 1998; Biedenharn et al., 2005). Hence, the precise consequences of floods for sediments are specific to the particular catchment context and, when examining the relationship between floods and sediments, it is necessary to do so with respect to catchment sediment supply, channel sediment erosion, sediment transport and sediment storage as material moves through the particular fluvial system in question, from its source to its temporary or long-term, depositional sink (Sear et al., 2003).
Near-source consequences 1: Muddy Floods
During moderate to heavy rainfall events, surface runoff in the catchment (due to infiltration excess and/or saturation overland flow) generates boundary shear stresses on the land surface. Where the soil is exposed due to lack of vegetation cover, material is entrained and transported by the overland flow. Coarse material travels only short distances down slope before being re-deposited, but finer particles may be carried over much longer distances, to enter the drainage network. Surface runoff that is charged with sediment constitutes a ‘muddy flood’ that may deliver substantial quantities of material to the fluvial system. While overland flow and ‘muddy floods’ are natural during heavy rainfall, their frequency of occurrence, spatial extent and sediment yield may be elevated by anthropogenic effects related to land use (Lane, 2007). For example, arable fields are particularly vulnerable to erosion by surface runoff and generate many ‘muddy floods’, while destruction of hedges and riparian vegetation removes the natural buffering effect of plants in filtering sediments out of surface runoff. Hence, ‘muddy floods’ generated where arable fields abut the channel or are connected to it by drainage ditches may result in highly elevated inputs of catchment-derived sediment entering the fluvial system (e.g. Petts, 1988, Walling and Amos, 1999).

Review: Freshwater Ecosystems, Flooding and Vegetation
Science Report Methods to Assess, Model and Map the Environmental Consequences of Flooding: Literature review
(June 2008)
49
Consequences 1: ‘Muddy floods’ in the catchment are an important source of fine sediment in natural fluvial systems. The delivery of fine material to the fluvial system via this pathway may be markedly increased where land use and/or the destruction of vegetation in the stream corridor connect sources of surface runoff directly to stream channels. The resulting inputs of fine grained sediment can be highly damaging to in-stream and benthic environments and may clog or blanket the alluvial bed of the receiving watercourse, to disrupt water movement in the hyporheic zone and degrade the habitats.
Slope instability
Heavy to extreme rainfall events may generate high groundwater tables and slope wash that trigger landslides and other forms of slope instability (Abramson et al., 2001). These events can deliver large quantities of mixed-size sediments to the fluvial system. This is especially the case where the channel undercuts the base of a slope that is prone to instability. This is termed a ‘coupled slope-channel’ geomorphic system (Reid et al., 2008). Sediment from landslides and slope processes enters the drainage system directly where slopes are coupled to channels, which is a characteristic of upland streams draining headwater catchments (Lane et al., 2007a).
The input of soil and rocks to the fluvial system from a single large slope failure may supply sediment to the river at an elevated rate for decades, with long lasting consequences for local and downstream river environments, habitats and ecosystems (Harvey, 2007).
Consequences 2: In upland, headwater catchments with coupled hill slope-channel systems, extreme rainfall events may trigger slope instability that supplies very substantial inputs of sediment that can act as significant sources of sediment for years or decades following a trigger event.
Floods and erosion of the channel bed and/or banks
During floods, sediment is derived from erosion of the channel bed and banks (Richards, 1982; Lawler, 1995; Lawler et al., 1997; Julien, 1998). This requires boundary shear stresses of sufficient intensity to overcome the erosion resistance of the boundary materials (Thorne, 1982). Hence, erosion is zero or negligible during low flows, and is initiated by intermediate to flood flows. Once the threshold for entrainment has been exceeded, erosion rates initially increase with discharge to about the 1.5 power, so that larger the flood, the faster the erosion. However, once the flow overtops the banks, export of momentum from the channel to the floodplain by large eddies reduces in-channel flow intensity (Wormleaton et al., 2005) and this generally curtails further increases in erosion rates during very large floods. Exceptions to this general rule occur where flow is concentrated within the channel and where it impinges against the channel banks, interacts with a solid obstacle (such as a natural rock/clay outcrop or hydraulic structure) and where overbank flow returns to the channel during the falling limb of the flood hydrograph.
Fluid entrainment is often the major bank erosion process in mid-basin areas owing to a peak in stream power (Lawler, 1995; Knighton, 1999; Liébault et al., 2005). For example, Lawler et al. (1999) report a clear winter peak in erosion rates on the River Swale, Yorkshire. This is interpreted as reflecting the occurrence of frequent high flow events at this time and lower erosion resistance of bank materials due to frost action and antecedent wetting. Erosion is usually greatest during winter events as summer vegetation cover on channel banks can provide effective protection against erosion (Thorne, 1990). If vegetation is disturbed or destroyed by anthropogenic activities (angling, land use that extends to the channel edge, channel enlargement, inappropriate maintenance) then rates of sediment supply from bank erosion may be substantially elevated (Lane and Thorne, 2007).

Science Report Methods to Assess, Model and Map the Environmental Consequences of Flooding: Literature review
(June 2008)
50
Consequences 3: In-bank flood events are particularly effective in eroding sediments from the bed and banks. In natural channels, bankfull discharge corresponds to a flood with a return period of between 1 and 3 years, so that flow intensities and erosion rates are moderate, and natural vegetation can effectively mitigate bank retreat. Channel bank erosion may peak in mid-basin areas reflecting a peak in stream power and winter floods are likely to be most effective in eroding channel banks. But in high-energy channels that have been ‘improved’ for flood control or land drainage purposes, much higher discharges are retained in-channel, flow intensities are much greater during flood peaks and vegetation is removed or heavily maintained. Consequently, rates of bed or bank erosion may be greatly accelerated. As a result, larger floods may be much more important in eroding sediment from the channel boundaries of improved channels than natural ones.
Floods and sediment transport in natural channels
Once it has been delivered to the channel or entrained from its boundaries, the capacity of the flow to transport sediment through the fluvial system is governed by the available stream power per unit bed area – termed the specific stream power (Bagnold 1966, 1980). Specific stream power is positively related to discharge and energy slope, and negatively related to flow width. During in-bank floods in natural, meandering systems the transport capacity increases with discharge because slope (as well as discharge) also tends to increase with stage (as meander bends are short cut) and width remains relatively constant (Winkley 1982). Hence, during the rising limb of the flood hydrograph the channel is able to transport the increased supply of sediment from catchment erosion and bed/bank erosion. Once flow overtops the banks, the width increases rapidly and the level of specific stream power falls markedly. As a result, coarse sediment is deposited close to the channel to form natural levees when discharges exceed the channel conveyance capacity and the floodplain is inundated, while fines tend to be deposited more widely across the floodplain and especially in sloughs and slack water zones in the inundated area (Walling et al. 2006).
Consequences 4: In natural systems, channels are to an extent ’self-cleansing’ because during in-bank floods the sediment transport capacity increases to match or exceed the sediment supply and once the flood spills over on to the floodplain, sediment is exported from the channel to form natural levees and floodplain deposits.
Floods and sediment transport in channels improved for flood defence or land drainage
In channels that have been improved for flood control or land drainage, the relationship between floods and sediment transport is altered. Often, stream power and sediment transport capacity do not increase so markedly with discharge as they do in natural channels as the slope does not increase markedly with stage although the width does. This is especially likely where the channel has been straightened (because in straight or nearly straight channels there are no bends to short cut), has impediments to flow such as bridges or culverts that induce locally lower than expected slopes (through back water effects), or has been over-widened (artificially reducing the specific stream power below natural levels, especially in low energy systems) (Winkley 1982). As a result, the capacity to transport sediment does not keep pace with the increasing supply of sediment during the rising limb and peak of the flood, leading to sedimentation. Also, as there are no spill flows, sediment is not exported onto the floodplain for deposition and so siltation is concentrated in-bank.

Review: Freshwater Ecosystems, Flooding and Vegetation
Science Report Methods to Assess, Model and Map the Environmental Consequences of Flooding: Literature review
(June 2008)
51
Consequences 5: In artificially improved drainage systems, there is a tendency for straight, hydraulically controlled flood control channels with over-wide cross-sections or embankments disconnecting the channel from the floodplain to silt significantly during flood events. The outcome is a greater need for maintenance in improved channels with a flood defence and/or land drainage functions. There are negative implications in both the tendency for siltation during floods and the steps taken to combat it for the river environment in general and in-channel habitats in particular.
Floods and the effective or channel forming discharge
The positive, non-linear relationship between discharge and sediment transport capacity suggests that the larger the flood, the more effective it will be in transporting sediment through the fluvial system. However, over a long period (say 30+ years) the greater capacity of very large floods to transport sediment is more than offset by their rarity and relatively very short durations (Soar and Thorne 2001). Conversely, low flows lack the capacity to transport significant amounts of sediment and so they are ineffective despite their high frequency. In fact, in the long term, it is floods of intermediate magnitude and frequency that transport the most sediment and therefore have the greatest impact on the dimensions, geometries and sediment features displayed by natural channels (Biedenharn et al. 2001).
Consequences 6: In terms of controlling channel form and sediment transfer through the fluvial system, it is floods with return periods between about 1 and 5 years that have the greatest influence. These may be regarded as ‘channel forming flows’ and experience shows that changes to the magnitude, frequency or duration of flood discharges in this range of recurrence intervals (through, for example, changes to climate, land-use, land management or river regulation) are likely to trigger marked morphological responses in the fluvial system both locally and downstream. Yet most flood risk management studies focus on ‘design floods’ with much longer return periods, missing the significance of changes in the regime of short return period floods for sediments, equilibrium channel morphologies, river environments and habitats.
Floods and sediment deposition/storage
During the falling limb of the flood hydrograph, sediment transport capacity decreases and the sediment in motion must be progressively deposited. In natural channels that are in dynamic equilibrium, this sediment is stored either in-channel or on the floodplain. Most of the relatively coarse sediment (similar in size to the bed material) is temporarily stored in the channel between floods (transport events) in point, mid-channel and side bars, although in natural systems some leaves the channel to enter longer term storage through levee building (e.g. Goodson et al., 2003; Steiger et al., 2001).
Relatively fine sediment (including seeds and plant propagules) is either stored temporarily in the channel (e.g. Walling et al., 2006) or stored overbank (for much longer periods) in levee and floodplain deposits (e.g. Steiger et al., 2003; Walling et al., 1998). Walling (1999) presented data which illustrate the great significance of floodplain deposition and storage to sediment dynamics in rivers. For example, in the Rivers Ouse and Wharfe 40% and 49%, respectively of the total amount of suspended sediment delivered to the main channels is deposited on their floodplains. Vegetation roughness has important impacts on floodplain sedimentation rates (Steiger et al., 2001). Investigations across England and Wales reveal wide variations in rates of natural floodplain deposition, with an average of the order of 1 cm per year nationally. It must therefore be concluded that rates of natural floodplain deposition due to the sediment impacts of floods in the UK are not negligible either environmentally or in terms of river and floodplain management.
Science Report Methods to Assess, Model and Map the Environmental Consequences of Flooding: Literature review
(June 2008)
52
Consequences 7: Natural channels evolve to provide sufficient in-channel storage for coarse sediment between flood (transport) events. Storage of coarse sediment occurs in spatially organised bars from which material is readily re-mobilised during the rising limb of the next flood. Fines are mostly stored outside the channel in the riparian corridor and overbank areas, in considerable volumes. Overbank storage of fines is often important in reducing sediment loads, improving in-stream ecological habitat and carrying fresh sediment, seeds and propagules on to the floodplain). However, where flood spates are insufficient, base flows are low, or sediment delivery is high, fine sediment may accumulate on the bed and within gravels to damage important habitats, or as berms to reduce channel conveyance capacity.
Channels improved for flood defence or land drainage store both coarse and fine sediment in-channel, characteristically in unit bars and berms that grow through falling limb deposition. Not only are rates of accretion amplified (because deposition is spatially restricted compared to natural channels that are connected to their floodplains), but also the sediment in these bodies includes seeds and vegetation propagules that promote colonisation and stabilisation of the features between flood (transport) events (Steiger et al. 2003).
Significance 8: Floods interact with sediments quite differently in artificial channels that are over large or are disconnected from their floodplains by embankments. Storage of sediment between floods occurs in a less spatially organised fashion and sediment features are rapidly colonised by vegetation, making it harder for the material stored in them to be re-mobilised during the rising limb of the next event. The effect is to reduce the capacity of artificial channel to be ‘self cleansing’, and introduce a tendency for event-on-event accretion that reduces the dimensions of the channel and increases its roughness - necessitating more frequent maintenance of sediments and vegetation.
Floods and debris
When considering the relationship between floods and sediments it is also necessary to take into account the interaction between water, sediment and debris. In this context, ‘debris’ may be defined as organic material (especially large wood) that is naturally present in the fluvial system, and anthropogenically introduced trash (from industrial waste to domestic waste, litter and shopping carts). Debris can act to impede the movement of sediment when it forms natural jams (Wallerstein and Thorne 2004), but it can also generate local flooding and disturb sediment transfer through the fluvial system when it is deposited in flood control channels or forms blockages at artificial structures such as bridges and culverts (Wallerstein and Thorne 1998). A positive impact of debris is to increase morphological diversity (especially in low energy water courses) and it interacts with sediments to provide important habitats more generally.
Consequences 9: It is important to recognise that floods consist not just of water, but also of sediment and debris. In assessing the environmental importance of floods it is absolutely essential to take into account the interaction of surface runoff, channel and overbank flows with sediments and debris in order to properly understand how the flooding system operates and responds to natural or anthropogenically-induced changes in the flow regime.

Review: Freshwater Ecosystems, Flooding and Vegetation
Science Report Methods to Assess, Model and Map the Environmental Consequences of Flooding: Literature review
(June 2008)
53
Floods and river gravels
River gravels provide important ecological habitats (e.g. Wood and Armitage, 1997) especially in the hyporheic zone, which is one of the most important and productive stream habitats, supporting high densities of organisms (Hynes 1970). All spawning salmonid species excavate depressions within gravel deposits (redds) into which they lay their eggs. The eggs are then fertilized and covered by a porous layer of gravel. Survival of both embryos and alevins depends on a stable gravel matrix with vigorous hyporheic flow to supply them with well-oxygenated water and carry away metabolic wastes (Findlay 1995). When ready to leave the redd, the young fish must be able to travel up through pore-spaces between the gravel particles to reach the stream (Bjornn and Reiser 1991). In addition to spawning habitat, the open gravel structure of riffles and bars is also important for numerous species of invertebrates, many of which are important food sources for animals higher up the food chain. This habitat is, however, vulnerable to damage should the topography of the bed be diminished, the seasonal mobility, size distribution or packing arrangement of the substrate gravels be altered, or the inter-gravel pores become clogged by fines.
Fine sediments may accumulate on the channel bed and in interstitial spaces of gravels during periods of low flows or high sediment input (e.g. Wood and Petts, 1999). This has been observed downstream of tributary inflows on regulated rivers, reflecting the absence of flushing flows (Petts,, 1988). In natural streams during progressively higher flow events, fines are firstly mobilised from the bed surface and then from within the interstitial spaces between the gravels. During these intermediate sized floods, turbulent flow structures such as secondary flow cells act to maintain pool-riffle sequences (Booker et al., 2001). Once fines have entered the gravel-matrix, flushing them out requires that the coarse particles themselves be disturbed – requiring higher flows and shear stresses. However, if the in-channel shear stresses associated with large floods are intensified or prolonged beyond natural levels (for example, due to flood confinement in a flood control channel) the gravels themselves may be entrained and transported from the reach (e.g. Kondolf et al., 1988), coarsening the bed and destroying riffle and bar features, with adverse impacts on gravel habitats.
Consequence 10: High flows are essential to maintain clean river gravels. However, if in-bank flows are too high gravel features may be eroded and the bed coarsened. Conversely, siltation of river gravels has been observed where the fines concentration is unnaturally elevated or flow regulation reduces the effectiveness of flushing flows. It follows that river gravels and the important habitats they support are highly sensitive to the flood regime and changes therein.
Sediment Data Requirements and Availability
Muddy floods
Rather little is known about the sediment dynamics and sediment yields associated with muddy floods in the UK. Anecdotal evidence suggests that sediment concentrations may be very high in concentrated surface runoff from agricultural fields and where runoff pathways are connected to the drainage system it seems likely that floods of this type are seriously damaging to the riparian and in-stream environment.
Fundamental research is required to support or refute current views on muddy floods and this must include field monitoring to make available data for assessment and modelling.

Science Report Methods to Assess, Model and Map the Environmental Consequences of Flooding: Literature review
(June 2008)
54
Maps of soil type, land surface slope and land use could be used as a starting point from which to identify areas at risk from muddy floods.
Flood-related slope instability
Geomorphologists and geotechnical engineers have a good understanding of slope stability and the hydrological conditions that may trigger failure. Some excellent data sets exist on slopes undercut by streams in upland areas of Britain (for example the Howgill fells) and these could be used to calibrate models of sediment delivery due to slope failures triggered by moderate to extreme floods under current and future climate scenarios.
Floods and erosion of the channel bed and/or banks
Few studies have been performed in the UK to establish the impacts on bed and bank erosion of retaining larger floods within channels improved for flood control and land drainage. However, good data sets may be sourced from other parts of the world, notably North America and Australia/New Zealand.
Floods and sediment transport
While the transport of sediment by flowing water has been intensively studied for decades, most of the reliable data sets currently available stem from laboratory flumes or relatively small streams. Also, the details of sediment rating curves for real rivers are based on measurements made over relatively short periods as part of research projects. The data tend to be highly site specific, making it difficult to transfer experience or findings based on any particular measuring station to another river or location. A fundamental problem is that while water flows are routinely gauged at many sites, the same is not true for sediment loads, leading to a dearth of reliable, long term data sets. In fact, few measurements of bed material exist for UK rivers, which limits the potential for even applying sediment transport equations at all. Further progress in understanding sediment transport in natural and improved channels rests on the establishment of network of bed material measurement and sediment transport monitoring stations on key rivers around the UK.
Floods and the effective or channel forming discharge
Calculation of the effective or channel forming discharge requires long term records of discharge and sediment transport. As noted earlier, while routine gauging of discharges is widespread in the UK, there are very few longterm records of observed sediment loads. Further progress in establishing the effective discharge ranges in natural and improved rivers now depends on concerted action to establish and sustain a programme of long term sediment monitoring on British rivers of different types.
Floods and sediment deposition/storage
Observations and dredging records from flood control channels provide the basis for assessing the consequences of floods on in-channel sediment deposition and storage in improved channels. However, the equivalent data for natural (unimproved) channels in Britain are rare (cf. Walling and Amos, 1999). River Habitat Survey data may be used as an indication of the substrate at a given location. Conversely, excellent data exist on floodplain deposition in British rivers. What is lacking is any programme of routine re-surveying of

Review: Freshwater Ecosystems, Flooding and Vegetation
Science Report Methods to Assess, Model and Map the Environmental Consequences of Flooding: Literature review
(June 2008)
55
natural channels at a scale that would allow identification of changes in the volume of coarse sediment stored in bars and other sediment features.
Floods and debris
With the exception of some recent and notable floods such as Boscastle 2004, very few good data sets exist on the interaction of flood waters and sediments with debris in the UK. This limits the factual basis on which to assess the consequences of floods for debris dynamics and storage and makes it difficult to come to any firm conclusions regarding the debris-related environmental impacts of floods in this country. However, evidence from abroad suggests that current wood management and maintenance actions are detrimental to in-stream and riparian habitats and that they probably also exacerbate debris-related flood risks (Prof Angela Gurnell, personal communication, 2007/8).
Tools and techniques
Muddy Floods
The environmental consequences of sediment dynamics associated with muddy floods could be investigated using appropriate rainfall-runoff models, together with topographically-based routing models for overland flow and impact models for in-stream and riparian environments and ecosystems. However, quantitative data would be needed to calibrate these models and so field monitoring is an essential starting point. The PSYCHIC model could be used to estimate suspended sediment mobilisation in land runoff and its subsequent delivery to watercourses (Davison et al., 2008).
Flood-related slope instability
Recently developed slope stability models may be applied to assess the consequences of sediment delivery to fluvial systems by the bank and slope failures triggered by flood events (Abramson et al. 2001, Simon and Pollen 2006). These tools should be tested and applied widely to better how slope failures interact with floods to supply sediment to the fluvial system, and how the relevant processes are likely to respond to climate and land-use changes.
Floods and erosion of the channel bed and/or banks
Comparative studies could be performed to investigate the impacts of floods with similar magnitudes and durations on bed and bank erosion in natural versus improved channels. The tools and techniques required for such studies exist in the forms of hydrodynamic models with sediment transport components and advanced models of bank erosion, instability and retreat.
The importance of the downstream distribution of stream power during floods has long been recognised (Magilligan, 1992) and a conceptual model of downstream change in bank erosion processes has been proposed by Lawler (1995). According to the conceptual model, sub-aerial weakening processes dominate upstream reaches, fluvial entrainment occurs in mid-basin areas and mass failure is the dominant in lower reaches. Research on the Rivers Swale and Ouse indicate that this conceptual model has potential, but wider investigations of

Science Report Methods to Assess, Model and Map the Environmental Consequences of Flooding: Literature review
(June 2008)
56
the spatial and temporal relationships between floods and bank erosion in British rivers is required.
Floods and sediment transport
Good hydrodynamic models exist that are capable of simulating sediment transport in rivers and these could be applied to investigate the similarities and contrasts in the relationship between floods and sediment transport in natural and improved channels. Such simulations would provide the basis for interpretation of the environmental risks associated with floods. However, when applied uncalibrated the sediment transport functions used in sediment modules have an accuracy of no better than +/- 50% for 70% of the time. Hence, lack of data will continue to introduce great uncertainty into sediment models and their utility in assessing the consequences of floods for sediments and sediment-related risks in British rivers until a programme of long term monitoring is established, at least at selected research sites.
One possible way forward would be application of a model produced by CEH to predict the nature of channel bed sediment across England and Wales (Booker et al., 2006). This model uses existing national datasets to estimate the transport capacity of a river, the presence of coarse bed material and fine sediment delivery. This approach could be used to support indicative sediment transport modelling and so identify reaches that are likely to experience sediment-related problems.
Recent research performed by the Flood Risk Management Research Consortium (FRMRC) has been aimed at developing a toolbox of models and methods to account for sediment dynamics in river management and engineering applications (Wallerstein et al., 2006a). This line of research may lead to more practical ways of incorporating sediment transport and transfer through the fluvial system at the broad scale into future river actions and restoration projects (Wallerstein et al., 2006b).
Floods and the effective or channel forming discharge
The computational basis for effective discharge calculations exists and could be applied in establishing the relationship between floods, sediment dynamics and morphological equilibrium (Biedenharn et al., 2001). However, the sediment transport data required to characterise sediment rating curves do not currently exist. While indicative calculations could be performed by applying appropriate sediment transport functions, real progress in this area must await development of longterm databases on sediment transport.
Floods and sediment deposition/storage
The floodplain record of flooding and sedimentation in British Rivers is long and well documented (Macklin and Lewin 2003). It provides a basis for further exploring the relationship between floods, runoff, sedimentation and the catchment environment and so establishes a basis for predicting floodplain responses to future climate and land use changes. Modern multi-dimensional hydrodynamic models are capable of simulating the evolution and adjustment of in-channel and floodplain sediment stores to the occurrence of floods, but their application in the UK remains the preserve of a few specialist modellers in academia and research consultancy companies. These models can be applied at best to the reach scale and they are not suited to continuous simulations over long periods. While short term morphological changes related to floods can be investigated, interpretation of the environmental and habitat consequences of changes in sediment storage can only be based on expert judgement at present.

Review: Freshwater Ecosystems, Flooding and Vegetation
Science Report Methods to Assess, Model and Map the Environmental Consequences of Flooding: Literature review
(June 2008)
57
Long term sediment modelling at the catchment scale is now for the first time possible using cellular models (Coulthard and Macklin, 2001; Coulthard et al., 2002; 2005). The availability of such tools unlocks the possibility for including sediment dynamics in the next generation of Catchment Flood or River Basin Management Plans (Environment Agency, 2004; 2005).
Research on river sediments, capital works and maintenance (HR Wallingford, 2008) has investigated how the type, seasonality and frequency of in-channel works can be adjusted to avoid damaging in-stream sediment features and habitats. The tools and approaches developed in this research have the potential to be operationalised for use in river maintenance applications.
Current research on the design of environmentally-aligned channels (Jacobs, 2007) is leading towards new approaches that balance the needs of different users of multi-functional rivers, with greater account being taken of the natural functioning of the sediment transfer system.
Floods and debris
Few tools or models exist for debris dynamics in alluvial streams. The models that do exist are focused on debris blockage at structures, rather than the impacts of debris on floods and their environmental consequences. New research initiatives are required in these areas.
Floods and river gravels
New evidence is emerging of the impacts of gravel extraction on local and system-scale morphology and the habitats provided by gravel bed rivers (Wishart et al., 2008). In this context it is encouraging that new tools being developed through EA-Defra research are aimed at avoiding the worst impacts of gravel removal for flood defence and land drainage purposes (HR Wallingford, 2008).
Methods that have been proposed to estimate flushing flows required for maintaining clean river gravels were assessed by Kondolf et al. (1988). There are two categories of methods: 1) those that assume the natural flow regime should be mimicked; and 2) those based on theoretical sediment transport equations or field observations. In their paper they demonstrate the difficulty in developing generalised rules. Natural flow regimes may not be adequate to flush fines if sediment supply is very high. Furthermore, the flushing flows of a particular reach of a river will be closely dependent on local hydraulic conditions and geomorphic characteristics (including gravel grain size). Theoretical calculation of flushing flows is dogged by the typically complex variation of flow velocities across many river channels. Experimental observations of the flows need to mobilise gravels in a particular reach may be the most reliable way of determining adequate flushing flows for a given river.
Geomorphic diversity
Major issues in geomorphic diversity centre on the types, spatial distributions and geomorphological responses to climate and land-use changes that are expected to happen during the remainder of this century. While the challenges of predicting morphological response to perturbation in the fluvial system are daunting (Richards, 1997), a good start in linking land use and climate changes to morphological responses has been made through Flood Foresight research (Morris and Wheater 2007; Lane et al. 2007b; Reynard 2007) and the tools required to quantify the relationships between sediment supply, sediment features and habitats are now beginning to emerge (Liébault et al., 2005; Lane et al., 2008

Science Report Methods to Assess, Model and Map the Environmental Consequences of Flooding: Literature review
(June 2008)
58
The assessment of geomorphological diversity and activity itself is far easier than assessing sediment dynamics that generate and maintain sediment-related habitats. In this respect techniques such as the River Habitat Survey (Raven et al., 1998) have been developed to assess habitat diversity. For example, the number of pools or riffles in a particular stretch of river is recorded by RHS. The RHS data set also represents a large body of data that could be used to assess the level of gemorphological activity (or morphological diversity) in different rivers. New tools are being developed that attempt to make use of national databases like the RHS to assess the potential for morphological change directly, without the need to model sediment transport (Wallerstein et al., 2006b).
Similar work and potential for collaboration
Muddy Floods
Research performed at Pontbren under FRMRC 2 is examining the effects of intensification of sheep farming on sediment yields and dynamics in upland catchments. This work is led by Imperial College and Nottingham Univesity in association with CEH Bangor and it has relevance to this topic. There are multiple opportunities for collaboration.
Floods and Flood-related slope instability
Current research at the Universities of Liverpool and Sheffield presents opportunities for collaboration on this topic.
Floods and erosion of the channel bed and/or banks
Centres of excellence in modelling bed scour and bank retreat may be found at the universities of Durham, Loughborough, Nottingham and Southampton, each of which would offer opportunities for collaborative research.
Floods and sediment transport
Relevant research on floods and sediment transport is progressing at several institutions including HR Wallingford, Halcrow, and the universities of Cardiff, Nottingham and Hull.
Floods and the effective or channel forming discharge
Little research is currently underway on the relationship between flood regimes, effective discharges and morphological outcomes in the UK. However, there is an active programme of work at the US Army Corps of Engineers, Engineering Research and Development Center, Vicksburg, Mississippi and collaboration with them could easily be arranged through the European Research Office of US Army Research.
Floods and sediment deposition/storage
Multi-dimensional morphological modelling is performed at a few knowledge centres in the UK including Cardiff, Hull and Durham Universities in the higher education sector and

Review: Freshwater Ecosystems, Flooding and Vegetation
Science Report Methods to Assess, Model and Map the Environmental Consequences of Flooding: Literature review
(June 2008)
59
Jeremy Benn and Associates, HR Wallingford, Halcrow, and Royal Haskoning in the private sector.
Floods and debris
Currently research on floods and debris is underway in the UK under the phase 2 of the Flood Risk Management Research Consortium at Heriot-Watt University. Although this research is focused on the flood risk impacts of debris blockages at bridges and culverts, there are opportunities for collaboration on the wider, environmental impacts of flood-related debris recruitment, movement and jamming.
References
ABRAMSON, L.W., LEE, T. S., SHARMA, S., BOYCE, G.M. 2001. Slope Stability and Stabilization Methods, 2nd Edition, John Wiley and Sons, New York, ISBN: 978-0-471-38493-9, 736 p.
BAGNOLD, R.A. 1966. An approach to the sediment transport problem from general physics, Professional Paper 422-I, US Geological Survey.
BAGNOLD, R. A. 1980. An Empirical Correlation of Bedload Transport Rates in Flumes and Natural Rivers. Proceedings of the Royal Society of London. Series A, Mathematical and Physical Sciences, 372(1751), 453-473.
BIEDENHARN, D.S., THORNE, C. R., WATSON, C. C. 2005. Wash load/bed material load concept in regional sediment management’, Proceedings of the 8th Federal Interagency Sedimentation Conference, Reno, Nevada, April 2-6, 8p.
BIEDENHARN, D.S., THORNE, C.R., SOAR, P.J., HEY, R.D., WATSON, C.C. 2001. Effective discharge calculation guide. International Journal of Sediment Research 16(4): 445-459.
BJORNN, T.C. and D.W. REISER, 1991. Habitat requirements of salmonids in streams. In: Meehan, W.R., ed. Influences of forest and rangeland management on salmonid fishes and their habitats; pp. 83-138. Amer. Fish. Soc. Spec. Pub. 19. 751 pp.
Booker, D.J., Sear, D.A. and Payne, A.J. 2001. Modelling three-dimensional flow structures and patterns of boundary shear stress in a natural pool-riffle sequence. Earth Surface Processes and Landforms, 26, 553-576.
BOOKER, D., GOODWIN, T., GRIFFITHS, J., OLD, G., SMITH, J.W.N. and YOUNG, A. 2006. A classification scheme for hyporheic zone pollutant attenuation capacity. Science Report SC030155/7/SR. Environment Agency, Rio House, Bristol.
COULTHARD, T. J. AND MACKLIN, M.G. 2001. How sensitive are rivers to climate and land-use changes? A model-based evaluation. Journal of Quarternary Science, 16, 347-351.
COULTHARD, T.J., LEWIN, J., MACKLIN, M.G. 2002. A cellular model of Holocene upland river basin and alluvial fan evolution. Earth Surface Processes and Landforms, 27, 269–288.
COULTHARD, T.J., LEWIN, J. MACKLIN, M.G. 2005. Modelling differential and complex catchment response to environmental change. Geomorphology. 69. 224-241.
DAVISON, P.S., WITHERS, P.J.A., LORD, E.I., BETSON, M.J. and STRÖMQVIST, J. 2008. PSYCHIC – A process-based model of phosphorus and sediment mobilisation and delivery within agricultural catchments. Part 1: Model description and parameterisation. Journal of Hydrology, 350, 290-302.

Science Report Methods to Assess, Model and Map the Environmental Consequences of Flooding: Literature review
(June 2008)
60
ENVIRONMENT AGENCY. 2004. Catchment Plood Management Plans: Volume I – Policy Guidance. Bristol: Environment Agency.
ENVIRONMENT AGENCY. 2005. Sustainable flood and coastal management; Final draft technical report. Part 1: Handbook: Bristol: Environment Agency.
FINDLAY, S. 1995. Importance of surface-subsurface exchange in stream ecosystems: The hyporheic zone. Limnology and Oceanography 40:159-164
GOODSON, J.M., GURNELL, A.M., ANGOLD, P.G., MORRISSEY, I.P. 2003. Evidence for hydrochory and the deposition of viable seeds within winter flow-deposited sediments: the River Dove, Derbyshire, UK. River Research and Applications,19, 317–334.
HR Wallingford. 2008 River sediments and habitats and the impact of maintenance operations and capital works. EA/Defra R&D Project FD1920, Final Report on Phase III.
HARVEY, A.M., 2007. Differential recovery from the effects of a 100-year storm: Significance of long-term hillslope-channel coupling; Howgill Fells, northwest England. Geomorphology, 84 192-208.
HYNES, H.B.N., 1970. The ecology of running waters. Univ. Toronto Press, Toronto.
JACOBS. 2007. Digital Design Manual to determine mitigation measures for Flood Risk Management and Land Drainage Activities Environment Agency. National Engineering and Environmental Consultancy Agreement (NEECA) Project Proposal, Jacobs UK Limited, Fairbairn House, Ashton Lane, Sale, Manchester, M33 6WP, 14p.
JULIEN, P.Y. 1998. Erosion and Sedimentation. Cambridge: Cambridge University Press.
KONDOLF, G.M., CADA, G.F., and SALE, M.J. 1988. Assessing flushing-flow requirements for brown trout spawning gravels in steep streams. 23(5), Water Resources Bulletin, 927-935.
KNIGHTON, D.A. 1998. Fluvial Forms & Processes: A New Perspective. London: Arnold.
KNIGHTON, D.A. 1999. Downstream variation in stream power. Geomorphology 29, 293-306.
LANE, S.N. 2007. Other floods and their drivers. In, Future Flooding and Coastal Erosion Risks, C.R. Thorne, E.P. Evans and E.C. Penning-Rowsell (eds), Thomas Telford, London, 173-184.
LANE, S.N., THORNE, C.R. 2007. River Processes. In, Future Flooding and Coastal Erosion Risks, C.R. Thorne, E.P. Evans and E.C. Penning-Rowsell (eds), Thomas Telford, London, 82-99.
LANE, S.N., MORRIS, J., O’CONNELL, P.E., QUINN, P.F. 2007a. Managing the Rural Landscape. In, Future Flooding and Coastal Erosion Risks, C.R. Thorne, E.P. Evans and E.C. Penning-Rowsell (eds), Thomas Telford, London, 64-81.
LANE, S.N., REID, S.C., TAYEFI, V., YU, D., HARDY, R.J., 2008. Reconceptualising coarse sediment delivery problems in rivers as catchment-scale and diffuse. Geomorphology, in press. Available as earlyview on-line.
LANE, S.N., TAYEFI, T., REID, S.C., YU, D., HARDY, R.J. 2007b. Interactions between sediment delivery, channel change, climate change and flood risk and a temperate upland environment. Earth Surface Processes and Landforms, 32, 429-446.
LAWLER, D.M. 1995. The impact of scale on the processes of channel-side sediment supply: a conceptual model. In, Effects of scale on the interpretation and management of sediment and water quality, Osterkamp, W.R. (ed.), IAHS Publication 226, 175-184.

Review: Freshwater Ecosystems, Flooding and Vegetation
Science Report Methods to Assess, Model and Map the Environmental Consequences of Flooding: Literature review
(June 2008)
61
LAWLER, D.M., THORNE, C.R., HOOKE, J.M. 1997 Bank erosion and instability, in, Applied Fluvial Geomorphology for River Engineering and Management, Thorne, C R, Hey, R D and Newson, M D (eds.), John Wiley and Sons, Chichester, UK, ISBN 471969680, 137-172.
LAWLER, D.M., GROVE, J.R., COUPERTHWAITE, J.S. and LEEKS, G.J.L. 1999. Downstream change in river bank erosion rates in the Swale-Ouse system, northern England. Hydrol. Process. 13, 977-992.
LIÉBAULT, F., GOMEZ, B., PAGE, M., MARDEN, M., PEACOCK, D., RICHARD, D., TROTTER, C.M. (2005). Land-use change, sediment production and channel response in upland regions. River Research and Applications, 21, 739-756.
MACKLIN, M.G. and LEWIN, J. 2003. River sediments, great floods and centennial-scale Holocene climate change. Journal of Quaternary Science, 18, 101–105.
MAGILLIGAN, F.J. 1992. Thresholds and spatial variability of flood power during extreme floods. Geomorphology 5: 373-390.
MORRIS, J. and WHEATER, H. 2007. Catchment Land-use. In, Future Flooding and Coastal Erosion Risks, C.R. Thorne, E.P. Evans and E.C. Penning-Rowsell (eds), Thomas Telford, London, 64-81. PETTS, G.E. 1988. Regulated rivers in the United Kingdom. Regulated Rivers: Research & Management, 2:33, 201-220.
RAMSBOTTOM, D., NOTTAGE, A. and ACREMAN, M. 2005. Scoping Study (Phase 1) Environmental Consequences for Flood Risk Assessment, R&D Technical Report EX 5126, Environment Agency, Bristol, 62pp.
Raven, P.J., Holmes, N.T.H., Dawson, F.H., Kox, P.J.A., Everard,M., Fozzard, I.R. and Rouen, K.J. 1998. River Habitat Quality: the physical character of rivers and streams in the UK and Isle of Man. (Report No. 2 to the Environment Agency).
REID, S.C, LANE, S.N., BERNEY, J.M., HOLDEN, J., 2008. The timing and magnitude of coarse sediment transport events within an upland, temperate gravel-bed river. Geomorphology, 83, 152-82.
REYNARD, N.S. 2006. Climate Change, In, Future Flooding and Coastal Erosion Risks, C.R. Thorne, E.P. Evans and E.C. Penning-Rowsell (eds), Thomas Telford, London, 49-63.
RICHARDS, K.S. 1982. Rivers: Form and Process in alluvial channels. London: Methuen & Co. Ltd.
RICHARDS, K.S. 1997. Prediction of morphological changes in unstable channels. In C.R. Thorne, R.D. Hey & M.D. Newson (eds), Applied fluvial geomorphology for river engineering and management: 268 – 292. Chichester: John Wiley and Sons.
SEAR, D.A., NEWSON, M.D., THORNE, C.R. 2003. Guidebook of Applied Fluvial Geomorphology, Defra R&D Technical Report FD1914, Environment Agency R&D Dissemination Centre, WRc, Swindon, UK, ISBN 0-85521-053-2, 231p.
SIMON, A., POLLEN, N.L. 2006. A model of streambank stability incorporating hydraulic erosion and the effects of riparian vegetation. In: Proceedings of the 8th Federal Interagency Sedimentation Conference, April 2-6, 2006, Reno, Nevada.
SOAR, P. J.,THORNE, C. R. 2001. Channel Restoration Design for Meandering Rivers, Final Report ERDC/CHL CR-01-1, Vicksburg, US Army Research and Development Center, 416p plus appendices.

Science Report Methods to Assess, Model and Map the Environmental Consequences of Flooding: Literature review
(June 2008)
62
STEIGER, J., GURNELL, A, M. and PETTS, G.E. 2001. Sediment deposition along the channel margins of a reach of the middle River Severn, UK. Regulated Rivers: Research and Management 17: 443-460.
STEIGER, J., GURNELL, A.M. and GOODSON, J.M. 2003. Quantifying and characterising contemporary riparian sedimentation. River Res and Applic. 19: 335-352.
THORNE, C.R. 1982. Processes and mechanisms of River Bank Erosion. In Gravel-Bed Rivers: Fluvial Processes, Engineering and Management, R D Hey, J C Bathurst and C R Thorne (eds), J Wiley and Sons, Chichester, England, 227-271.
THORNE, C.R. 1990. ‘Effects of vegetation on riverbank erosion and stability’ in Thornes J.B. (Ed.), Vegetation and Erosion. John Wiley & Sons, Chichester, pp. 125-144.
WALLERSTEIN, N.P. and THORNE, C.R. 1998. Computer model for prediction of scour at bridges affected by large woody debris. In, Water Resources Engineering ’98, Abt, S R, Young-Pezeshk, J and Watson, C C (eds.), American Society of Civil Engineers, Vol. 1, 157-162.
WALLERSTEIN N. P. AND THORNE C. R. 2004. Influence of large woody debris on morphological evolution of incised, sand-bed channels. Geomorphology, 57, 53-73.
WALLERSTEIN, N.P. et al. 2006a. Accounting for sediment in rivers: A toolbox of sediment transport and transfer analysis methods and models to support hydromorphologically-sustainable flood risk management in the UK. FRMRC Research Report UR9 available from: http://www.floodrisk.org.uk/images/stories/docs/UR9_accounting_for_sediment_in_rivers_WP8_1_v1_0.pdf
WALLERSTEIN, N.P., SOAR, P.J., THORNE, C.R. 2006b. River Energy Auditing Scheme (REAS) for catchment flood management planning. In, River Flow 2006, Ferreira, Alves, Leal and Cardoso (eds), Taylor and Francis, London, ISBN 0-415-40815-6, pp 1923-1932.
WALLING, D.E. 1999. Linking land use, erosion and sediment yields in river basins. Hydrobiologia 410, 223-240.
WALLING, D.E. and AMOS, C.M. 1999. Source, storage and mobilisation of fine sediment in a chalk stream system, Hydrol. Process. 13, 323-340.
WALLING, D.E., COLLINS, A.L., JONES, P.A., LEEKS, G.J.L. and OLD, G. 2006. The fine-grained sediment budgets of the Pang and Lambourn LOCAR catchments, UK, Journal of Hydrology, 330 (1-2), pp. 126-141.
WALLING, D.E., OWENS, P.N. and LEEKS, G.J.L. 1998. The role of channel floodplain storage in the suspended sediment budget of the River Ouse, Yorkshire, UK., Geomorphology, 22, pp. 225-242.
WINKLEY, B.R. 1982. Response of the Lower Mississippi to River Training and Realignment. In Gravel-Bed Rivers: Fluvial Processes, Engineering and Management, R D Hey, J C Bathurst and C R Thorne (eds), J Wiley and Sons, Chichester, England.
WISHART, D., WARBURTON, J., BRACKEN, L., 2008. Gravel extraction and planform change in a wandering gravel-bed river: The River Wear, Northern England. Geomorphology, 94 131-52.
WOOD, P.J. and ARMITAGE, P.D. 1997. Biological Effects of Fine Sediment in the lotic Environment. Environmental Management, 21(2), 203-217.
WOOD, P.J. and PETTS, G.E. 1999. The influence of drought on chalk stream macroinvertebrates. Hydrol. Process. 13, 387-399.

Review: Freshwater Ecosystems, Flooding and Vegetation
Science Report Methods to Assess, Model and Map the Environmental Consequences of Flooding: Literature review
(June 2008)
63
WORMLEATON,P. R., R. D. HEY, R. H. J. SELLIN, T. BRYANT, J. LOVELESS, CATMUR, S. E. 2005. Behavior of Meandering Overbank Channels with Graded Sand Beds J. Hydr. Engrg., Vol. 131(8), 665-681.

Science Report Methods to Assess, Model and Map the Environmental Consequences of Flooding: Literature review
(June 2008)
64
6 Issue 5: Sediment and water quality – consequences of flooding
Old, G. and Fisher, J.
(Centre for Ecology and Hydrology)
Floods and contaminated sediments Most nutrients and contaminants are associated with fine sediments. Initial discussions of floods and contaminated sediments presented in the scoping study (Ramsbottom et al, 2005) are developed throughout this chapter.
Sources of contaminants
Mining: Many catchments in the UK (e.g. South Wales valleys and Yorkshire Dales) experienced mineral mining in the 19th and early 20th centuries. Tailings tips containing sediments contaminated with heavy metals such as lead, cadmium and zinc are a legacy of this primary industrial activity (Macklin et al., 1997). Destabilisation of these slopes by runoff from extreme rainfall events and/or re-mobilisation of sediment from bodies deposited during or shortly after the mining era can release the contaminated sediments they contain and deliver them to the drainage network downstream (e.g. Blake et al., 2003). Fluvial erosion of floodplain sediments may also mobilise contaminated sediments (e.g. Dennis et al., 2003).
Urban/industrial landuse: Contaminated sediments may originate from urban/industrial landuses. Discharges from surface water drains and combined sewer overflows are often sediment rich (e.g. Ashley et al., 1992; Hewitt and Rashed, 1992). These fine sediments are often highly contaminated with pollutants (e.g. polycyclic aromatic hydrocarbons and trace metals) that are toxic to human life and the aquatic environment (see Old et al., 2003; 2004). Instream sediments may become further enriched with contaminants as chemicals are progressively adsorbed from the water column.
Agricultural practices and sewage: Organic rich sediments with high concentrations of phosphorus and nitrates often originate from runoff from agricultural land and/or discharges from sewage systems (e.g. House et al., 1997; Old et al., 2007; Walling, 1999). Enriched sediments lead to problems of water quality and eutrophic conditions in receiving water bodies.
Review: Freshwater Ecosystems, Flooding and Vegetation
Science Report Methods to Assess, Model and Map the Environmental Consequences of Flooding: Literature review
(June 2008)
65
Contaminanted sediment may be effectively transported downstream by the receiving water course, to be deposited on the floodplain (during overbank flows), along the channel margins and in the benthic sediments. Preferential mobilisation and deposition of fine organic particles concentrates contaminants from the above sources (e.g. Steiger et al., 2001). Sediment associated contaminants and nutrients deposited on floodplains and channel beds are likely to mobilised through future erosive events.
Floodplain deposition
Floodplain deposits have been shown to contain significant stores of nutrients and heavy metals (Dennis et al., 2003; Walling, 1999; Walling et al., 2003). By depositing nitrogen, phosphorus and organic matter over floodplains floods increase the fertility of the soil. In addition to sediment deposition, floodplains trap nutrients by sorption onto sediments (see Khalid et al., 1977) and by taking up nutrients in plant biomass (Lee et al., 1975).
The relative availability of nitrogen and phosphorus to the soils fertility is dependent upon biochemical processes within the floodplain. N may be removed from the wetland via denitrification (Lowrance et al., 1984). Denitrification occurs under anaerobic conditions, which are more likely to be found in water logged sediments (Jordan et al., 1993) and is also influenced by carbon availability and vegetation (Broadbent and Clark, 1965; Armstrong, 1964). Floodplains where the water table and organic content of the soil is high are likely to retain P but are likely to have a deficit in N irrespective of the N loading. The bio-chemical processes in the floodplain soils result in a change of total nutrients into soluble species such as ammonium-N and solube P. These are more mobile and once transformed, are liable to be lost from the floodplain into adjacent water bodies.
D. Gowing pers. comm.. (2008) mentions how floods also deliver basic cations (K, Ca and Mg) to floodplains and therefore have an important role in neutralising floodplain soils.
Instream sediment
In-channel sediment storage and transport
Significant amounts of contaminated/nutrient rich sediment may be transported and/or deposited on the river channel bed (e.g. Walling and Amos, 1999, Walling et al., 1998, Old et al., 2003). Channel bed sediment deposits may be mobilised during a subsequent high flow event (Old et al., 2003; 2004). Carton et al. (2000) describes how the first events of the winter season may have high levels of urban/industrial contaminants owing to accumulation throughout the low flow summer period.
Ecological consequences: nutrients
The deposition of both N and P may cause the eutrophication of riparian wetlands or water bodies, such as oxbow lakes. Many floodplain water bodies are shallow and eutrophic and as such are a type identified as likely to be N-limited (Fisher, 2003; James et al., in press). Every influx of sediment to these shallow lakes is likely to disrupt the complex interactions between macrophytes, zooplankton and algae and the nitrogen influx may cause a temporary increase in algal populations. As a result nitrogen has been identified as an important factor in the reduction of macrophyte species richness in such systems (Van de Molen et al., 1998; James et al., in press). The influx of N into more terrestrial riparian environments is likely to cause less ecological impact as rapid denitrification rates renders the N unavailable to plants before eutrophication can take place. There is more N driven eutrophication in aquatic environments where algae can take up N quickly. P therefore is the
Science Report Methods to Assess, Model and Map the Environmental Consequences of Flooding: Literature review
(June 2008)
66
primary fertilising nutrient in these drier floodplain ecosystems. Work on the modelling the ecological consequences of flooding within along the River Tisza (Fisher and Stratford, 2008) showed that the flood embankments were likely to enhance the deposition of P and increase the loss of N via denitrification therefore ensuing P enrichment but N deficiency.
Instream soluble forms of N and P (produced by floodplain processes), in addition to sediments associated forms may lead to eutrophication of rivers (e.g. algal blooms and excessive macrophyte growth). When organic rich sediments with a high Biological Oxygen Demand (BOD) enter a river they often lead to episodes of oxygen depletion that can result in fish kills (e.g. Jarvie and Neal, 1998). However, under some circumstances, deposition of nutrient rich sediments on floodplains can be beneficial.
Ecological consequences of contaminants
High instream and floodplain concentrations of urban/industrial/agricultural sediment-associated pollutants may occur and present a potential risk to ecosystems (natural and agricultural) and human health (e.g. Dennis et al., 2003). However, it is currently unknown what proportion of these contaminants are taken up by plants and enter the food chain. Sediment associated metals may be of particular concern when they are exposed to low pH river water in which they may be readily mobilised (e.g. Dennis et al., 2003). Through biomagnification (Persaud et al., 1993) sediment associated contaminants on floodplains and in channels may be concentrated in organisms and transferred higher up the food chain.
Data requirements and availability
Data on the areal extent and geographic locations of mining, urban, industrial and agricultural landuses are available.
Water chemistry data should also exist for all main rivers for a range of flow conditions.
Floods and contaminated sediments
Good data sets now exist for contaminated sediments derived from the legacies of mineral mining in Wales and England. These may be used to gauge the environmental consequences of floods that erode contaminated sediments and transport them downstream before depositing them in flood-related sediments at the channel margins and in the floodplain.
Tools and techniques
Floods and contaminated sediments
Recently developed cellular-automata models such as CAESAR and TRACER offer the tools and techniques needed to investigate and establish the environmental risks associated with floods that carry contaminated sediments.
Review: Freshwater Ecosystems, Flooding and Vegetation
Science Report Methods to Assess, Model and Map the Environmental Consequences of Flooding: Literature review
(June 2008)
67
Cellular-automata modelling places more emphasis of interactions between neighbouring cells than the physics of the processes being simulated (e.g. Murray & Paola, 1997). The approach therefore allows simulation of hillslope as well as channel processes and allows simulation of longer time-scales (e.g. Hancock et al., 2002). These types of model have typically been used to simulate long-term landscape evolution (e.g. Coulthard et al., 2002). There are several limitations that should be considered when assessing cellular modelling. The calculations will be scale dependent. The models require sediment transport algorithms that are simplified representations of reality. These algorithms often require parameterisation of variables that do not have physically meaningful units (Coulthard, 1999).
See Tom Coulthard’s web site for information on cellular modeling of landscape evolution:
http://users.aber.ac.uk/jcc/
Similar work and potential for collaboration
Research on floods and contaminated sediments is centred at the University of Wales, Aberystwyth and the University of Hull. Both institutions offer opportunities for collaborative work.
References
ARMSTRONG, W. 1964. Oxygen diffusion from the roots of British bog plants. Nature, 204, 801-802.
ASHLEY, R.M., WOTHERSPOON, D.J.J., COGHLAN, B.P., MCGREGOR, I. 1992. The erosion and movement of sediments and associated pollutants in combined sewers. Water Sci. Technol., 25(8):101-114.
BLAKE, W.H., WALSH, R.P.D., BARNSLEY, M.J., PALMER, G, DYRYNDA, P., JAMES, J.G. 2003. Heavy metal concentrations during storm events in a rehabilitated industrialized catchment. Hydrological Processes, 17 (10), 1923-1939.
BROADBENT, F.E. and CLARK, F.E., 1965. Soil Nitrogen. Agron. 10, 344 Ed: Bartholomew, W.V. and Clark, F.E.
CARTON, J., WALLING, D.E., OWENS, P.N. 2000. Spatial and temporal variability of the chromium content of suspended and flood-plain sediment in the River Aire, Yorkshire, UK. 263, 219-226.
COULTHARD T. 1999. Modelling Upland Catchment Response to Holocene Environmental Change. Unpublished Phd Thesis, University of Leeds, Leeds, UK, 181pp.
COULTHARD T, MACKLIN MG, KIRKBY MJ. 2002. A cellular model of holocene upland river basin and alluvial fan evolution. Earth Surface Processes and Landforms. 27: 269-288.
DENNIS, I. A., MACKLIN, M.G., COULTHARD, T.J. and BREWER, P.A. 2003. The impact of the October-November 2000 floods on contaminant metal dispersal in the River Swale catchment, North Yorkshire, UK. Hydrol. Process. 17, 1641-1657.

Science Report Methods to Assess, Model and Map the Environmental Consequences of Flooding: Literature review
(June 2008)
68
Fisher, J. 2003. Nitrogen limited lakes: their occurrence, basis and characteristics. PhD thesis, University of Liverpool.
FISHER, J. and STRATFORD, C. 2008. Does reconnection mean restoration for an Oxbow lake, Hungary? Intl. J. River Basin Management, 6(2), pp. 1-11.
HANCOCK GR, WILLGOOSE GR, EVANS KG, 2002. Testing of the SIBERIA landscape evolution model using the Tin Camp Creek, Northern Territory, Australia, field catchment. Earth Surface Possesses and Landforms, 27 (2): 125-143.
HEWITT, C.N., and RASHED, M.B., 1992. Removal rates of selected pollutants in the runoff waters from a rural highway. Water Res, 26(3):311-319.
HOUSE, W.A., LEACH, D., WARWICK, M.S., WHITTON, B.A., PATTINSON, S.N., RYLAND, G., PINDER, A., INGRAM, J., LISHMAN, J.P., SMITH, S.M., RIGG, E. and DENISON, F.H. 1997. Nutrient transport in the Humber rivers. The Science of the Total Environment, 194/195, pp. 303-320.
James, C., Fisher, J., Russell, V., Collings, S. and Moss, B. (In press) Nitrate availability and plant biodiversity in freshwaters: implications for management of river basins under the Water Framework Directive. Freshwater Biology.
JARVIE, H. and NEAL, C. 1998. Autotrophs versus heterotrophs: variations in inorganic carbon chemistry of east coast UK rivers. In:Wheater, H., Kirkby, C., editors. Hydrology in a changing environment, Proceedings of the British Hydrological Society International Conference, Exeter, July 1998. Chichester, UK: John Wiley & Sons, 1998. p. 573-584.
JORDAN, T.E., CORRELL, D.L. and WELLER, D.E., 1993. Nutrient interception by a riparian forest receiving inputs from adjacent cropland. J. Environ. Qual., 22, 467-473.
KHALID, R.A., PATRICK, W.H., DELAUNE, R.D. (1997) Phosphorus sorption characteristics of flooded soils. Soil Sci, Soc. Am. J., 41, 305-310.
LEE, G., BENTLEY, E. and AMUNDSON, L.E. 1975. Effects of marshes on water quality. Coupling of Land and Water Systems. Ed: Hasler, A. Pub: New York, Springer Verlag.
LOWRANCE, R.R., TODD, R.L. and ASMUSSEN, L.E. 1984. Nutrient cycling in an agricultural watershed: II Streamflow and artificial drainage. J. Environ. Qual., 13, 27-32.
MACKLIN, M.G., HUDSON-EDWARDS, K.A. and DAWSON, E.J. 1997. The significance of pollution from historic metal mining in the Pennine orefields on river sediment contaminant fluxes to the North Sea. The Science of the Total Environment, 194/195, 391-397.
MURRAY A.B. and PAOLA, C. 1997. Properties of a cellular braided-stream model. Earth Surface Possesses and Landforms. 22 (11): 1001-1025.
OLD GH, LEEKS GJL, PACKMAN JCP, SMITH BPG, LEWIS S, HEWITT EJ, HOLMES M, YOUNG A., 2003. The impact of a convectional summer rainfall event on river flow and fine sediment transport in a highly urbanised catchment: Bradford, West Yorkshire. Sci. Total Environ., 314-316: 495-512.
OLD G.H., LEEKS G JL, PACKMAN JC, STOKES N, WILLIAMS ND, SMITH BPG, HEWITT EJ. LEWIS S. 2004. Dynamics of sediment-associated metals in a highly urbanised catchment: Bradford, west Yorkshire. J. CIWEM, 18: 11-16.
OLD, G.H., NADEN, P.S., GRANGER S.J., BOL, R., BUTLER, P., MARSH, J., OWENS, P.N., SMITH, B.P.G., MACLEOD, C., BILOTTA, G., BRAZIER, R., AND HAYGARTH, P.M. 2007. Understanding the pathways and dynamics of agricultural diffuse pollution from intensively farmed grassland: the application of natural and artificial tracing techniques. Proceedings of the International Phosphorus Workshop 2007, Denmark.

Review: Freshwater Ecosystems, Flooding and Vegetation
Science Report Methods to Assess, Model and Map the Environmental Consequences of Flooding: Literature review
(June 2008)
69
PERSAUD, D., JAAGUMAGI, R. AND HAYTON, A. 1993. Guidelines for the Protection and management of Aquatic Sediment Quality in Ontario. Ministry of Environment and Energy, Queen’s Printer for Ontario, Ontario, Canada.
RAMSBOTTOM, D., NOTTAGE, A. and ACREMAN, M. 2005. Scoping Study (Phase 1) Environmental Consequences for Flood Risk Assessment, R&D Technical Report EX 5126, Environment Agency, Bristol, 62pp.
STEIGER, J., GURNELL, A, M. AND PETTS, G.E. 2001. Sediment deposition along the channel margins of a reach of the middle River Severn, UK. Regulated Rivers: Research and Management 17: 443-460.
VAN DER MOLEN D.T., PORTIELJE R., DE NOBEL W.T. & BOERS P.C.M. 1998. Nitrogen in Dutch freshwater lakes: trends and targets. Environmental Pollution, 102, 553-557.
WALLING, D.E. 1999. Linking land use, erosion and sediment yields in river basins. Hydrobiologia 410, 223-240.
WALLING, D.E., OWENS, P.N. AND LEEKS, G.J.L. 1998. The role of channel floodplain storage in the suspended sediment budget of the River Ouse, Yorkshire, UK., Geomorphology, 22, pp. 225-242.
WALLING, D.E. AND AMOS, C.M. 1999. Source, storage and mobilisation of fine sediment in a chalk stream system, Hydrol. Process. 13, 323-340.
WALLING, D.E., OWENS, P.N., CARTER, J., LEEKS, G.J.L., LEWIS, S., MEHARG, A.A., AND WRIGHT, J., 2003. Storage of sediment-associated nutrients and contaminants in river channel and floodplain systems. Applied Geochemistry, 18, 195-220.

Science Report Methods to Assess, Model and Map the Environmental Consequences of Flooding: Literature review
(June 2008)
70
7 Issue 6: Birds and invertebrates – consequences of flooding
Sarah Durell1, M. Acreman1, J. Thompson2 1 Centre for Ecology and Hydrology 2University College London
7.1 Scope This issue paper is concerned with the effect of flooding on birds and their invertebrate prey. It represents a more detailed consideration of preliminary ideas presented in the scoping study (Ramsbottom et al., 2005). The bird species that would be most affected by flooding are those that feed and nest in floodplain areas. These include waterfowl, such as ducks, coot, and moorhen, and waders, such as lapwing, curlew and snipe.
Types of flooding considered: All flooding mechanisms are important that create wet soil conditions including direct rainfall, local runoff and up-welling groundwater in addition to river bank overtopping.
7.2 Definitions and concepts
Floods influence the suitability of habitat for birds through a number of mechanisms.
(1) Some wetland birds, such as snipe and curlew, probe the soil for invertebrates with their beaks, thus soil penetrability is a key factor. Many soils, such as clay, are easily penetrated in wet conditions but are impenetrable in dry conditions.
(2) Wet soils provide habitat for invertebrate bird prey. For example, earthworms do not have lungs, but breathe through their skin, which must be kept moist. Earthworm burrowing through the soils is aided by the secretion of slimy lubricating mucus which is eaier to maintain in damp soil conditions. Chironomids, such as blood worms, midges and gnats lay their eggs in water and some prefer muddy substrates.
(3) Waterlogged soil has insufficient oxygen for the many invertebrates so they come to the surface get oxygen to breathe, thus making them available to birds. Although, some invertebrates can survive underwater for several hours, they cannot withstand prolonged flooding.
(4) Tall wetland vegetation provides cover for some wetland birds, such as redshank.

Review: Freshwater Ecosystems, Flooding and Vegetation
Science Report Methods to Assess, Model and Map the Environmental Consequences of Flooding: Literature review
(June 2008)
71
(5) Ducks and other water fowl often assemble in large numbers on shallow water, where they feed on a variety of food sources such as grasses, aquatic plants, fish, insects, small amphibians, worms, and small molluscs.
For nesting, wetland birds need dry areas, but which are near to feeding areas for both adults and young. Consequently, a habitat mosaic with lower lying wet adjacent to higher dry areas.
7.3 Consequences of floods (positive and negative)
Research has been undertaken to establish links between surface wetness / flooding and wading birds such as lapwing (Vanellus vanellus) and redshank (Tringa totanus). This is due to the large declines in populations of these species which has been attributed to the loss of suitable habitat such as lowland wet grassland (e.g. Ausden et al., 2001; Green and Robins, 1993). A behavioural link between the distribution of waders and surface wetness has been demonstrated (e.g. Eglington et al., 2008). For example, work undertaken with within the Elmley Marshes, part of the North Kent Marshes, has demonstrated that the probability of a particular part of the marshes being occupied during the breeding season (April–June), as well as the density of lapwing and redshank, increases with flood extent and the number of wet rills and hollows (Milsom et al., 2000, 2002). Feeding rates of both species are also higher in rills which are wet in May compared to those which are dry (Milsom et al., 2002). This may be due to effects of prolonged inundation on vegetation cover, the availability of aquatic invertebrates within pools of water, the concentration of soil macroinvertebrates relatively near the soil surface or the more penetrable nature of wet soil. Other species are influenced by hydrological conditions with mallard (Anas platyrhynchus) and Canada goose (Branta canadensis) exhibiting a positive association with surface wetness (Milsom et al., 2000). Some flooding in April and May is therefore important for attracting waders and other birds. Optimum flood conditions would be those which create a mosaic of unflooded grassland, winter-flooded grassland and shallow pools.
In winter, many waterfowl species are attracted to standing water and can feed in water depths up to 50cm (Thomas, 1982). In general, the larger the area flooded the better, especially for roosting waterfowl. However, feeding conditions are usually better for many species at the margins of flooded areas, so several smaller areas of floodwater are usually more beneficial to waterfowl than one large one. Moreover, prolonged deep flooding can make an area as unattractive to waterfowl as areas without any surface water at all (Thomas, 1976).
Many wader species are also attracted to standing water on grassland in winter. The use of wet grassland by waders is determined to some extent by the level of the water table, as soil invertebrates are forced closer to the surface as the water table rises. The height of the water table also influences the penetrability of the soil for bird species, such as curlew and snipe, which probe for their prey (Green, 1986). Forestry Commission keeper Andy Page predicts that 2008 will be a bonanza year for Hampshire’s populations of waders owing to the sustained high water table and wet soil; a result of the wet weather in 2007

Science Report Methods to Assess, Model and Map the Environmental Consequences of Flooding: Literature review
(June 2008)
72
(www.wildlifeextra.com/new-forest_waders823.html). Whilst high water tables are attractive to wading birds, standing water causes the death of many soil-dwelling invertebrates. This can result in short-term benefit to the birds as invertebrates are forced to the surface. Ausden et al. (2001) quantified the response of soil macroinvetebrates to flooding as well as their ability to survive in flooded grassland and changes in abundances and physical availability for feeding waders. They demonstrated lower biomass of soil macroinvertebrates in sites with a long history of winter flooding compared to unflooded grasslands. Macroinvertebrates in the flooded sites mainly comprised a limited range of semi-aquatic earthworm species. When flooding was introduced to previously unflooded grasslands, a large reduction in soil macroinvertebrate biomass resulted. The main cause of this reduction was the vacation of the soil by earthworms soon after flooding although when artificially confined in flooded soils most earthworm species were capable of surviving periods of at least 120 days of submergence. Winter flooding also resulted in the expulsion of many over-wintering arthropods. Recolonisation by soil macroinvertebrates of grassland flooded in winter was slow during the following spring so that prey biomass for wading birds was low.
Research on three floodplains in the UK (Acreman et al., 2008) under different soil wetness conditions, found that the largest invertebrate biomass samples (including earthworms, beetles, slugs, springtails and spiders) were collected at stations with soil moisture between 0.5 and 0.6 m3m-3, which equates to a moist soil, but not water-logged. This is consistent with optimum conditions for earthworms used in toxicology experiments (e.g. Spurgeon and Hopkin, 1995).
In spring and summer, almost all waterfowl species nest on dry land, preferably along land/water edges (Thomas, 1980). Breeding numbers would therefore tend to be low wherever flooding is widespread and in areas with a low edge/water surface area ratio. Too much open water is not beneficial. Where flooding does extend over large areas in summer, shallow floods are more beneficial than deep floods, particularly for dabbling ducks which require water depths of less than 30cm to feed (Thomas, 1981). Intermittent out-of-bank flooding is likely to be the most detrimental to breeding waterfowl, resulting in the destruction of nests and lost clutches.
Waders are ground nesting birds and, in general, the greatest densities of breeding waders will occur in wet grasslands where the water table is high (Beintema, 1987). However, the optimum conditions usually equate with a water table 20-30cm below the surface in early March (Beintema, 1983) and where wet conditions are restricted to shallow drainage channels, or rills (Milsom et al., 2002). Extensive flooding during the breeding season will actually remove breeding habitat for waders and major intermittent floods will destroy nests, clutches and young birds. For example, heavy rains during the summer of 2007 destroyed the only nest of Bittern chicks at Blacktoft Sands nature reserve, Yorkshire. The nest was either flooded or the chicks died due to starvation or hypothermia (www.wildlifeextra.com/blacktoft-sands.html).
In summary, shallow flooding in winter is beneficial to many species of waterfowl and waders and lack of flooding would reduce their presence in any catchment area. Some invertebrates can survive short periods of flooding (Ausden et al., 2001) and others can survive shallow floods if there are sufficient variations in local topography to afford nearby refugia of higher ground. However, prolonged and deep flooding is not attractive to either waterfowl or waders and will greatly reduce the density of invertebrates present in any area.
Review: Freshwater Ecosystems, Flooding and Vegetation
Science Report Methods to Assess, Model and Map the Environmental Consequences of Flooding: Literature review
(June 2008)
73
During spring and early summer, raised water tables are of benefit to breeding waterfowl and waders. However, out-of-bank flooding would remove breeding habitat and intermittent flooding will actually destroy nests, clutches and young birds.
7.4 Data requirements and availability
Bird usage of the floodplain area in both the wintering and breeding seasons.
Invertebrate biomass related to different soil moisture and inundation conditions.
7.5 Tools and techniques
Data are available for national survey of wetland birds (WeBS). These data would need to be related to flood extent or soil moisture to be useful to models of flooding risk. Invertebrate data are not widely available and would need to extracted from published studies. Data for three floodplain sites are available at CEH. In assessing the risk of flooding for birds and invertebrate prey, it would be necessary to know the frequency, the extent, the depth and the duration of flooding
Research has led to the development of predictive models designed to target conservation management prescriptions. For example, Milsom et al. (2000) developed relationships for the North Kent Marshes between the presence or absence of ground nesting birds and a range of habitat characteristics which included surface wetness (Figure 6.1). Of course, these relationships are likely to be site specific and fauna (birds in this case) will respond to other factors such as vegetation (e.g. sward height, frequency and size of tussocks), habitat area and disturbance factors.

Science Report Methods to Assess, Model and Map the Environmental Consequences of Flooding: Literature review
(June 2008)
74
Figure 7.1. Relationships between proportion of parts of the North Kent Marshes occupied (observed and predicted) and wetness of rills and hollows in early June (WET) for redshank, lapwing, Canada goose and mallard. Key to wetness: DH - dry/hard, DP - dry/penetrable, DM - dry/moist, M - moist, W - wet, WA - some water and water categories pooled In the lapwing and redshank models, the three driest categories were pooled because of small sample sizes to produce a HSM category. Solid bars - observed values; cross-hatched bars - predicted values. Estimated standard errors ar shown (Milsom et al., 2000).
Research into impacts of wetness / flooding upon soil macroinvertebrates and wading birds may provide opportunities for inferring the impacts of flooding upon these communities. For example, the predictive relationships between bird distribution and habitat characteristics developed by Milsom et al. (2000) could aid the assessment of the impacts of flooding upon some bird species although, as highlighted above, these relationships will relatively site specific.
7.6 Similar work and potential for collaboration
No similar work has been undertaken apart from the extensive literature on habitat use by wetland birds. Collaboration may be possible with the organisations which run the wetland bird counts: the British Trust for Ornithology (BTO), The Wildfowl and Wetlands Trust (WWT), the Royal Society for the Protection of Birds (RSPB) and the Joint Nature Conservation Committee (JNCC).

Review: Freshwater Ecosystems, Flooding and Vegetation
Science Report Methods to Assess, Model and Map the Environmental Consequences of Flooding: Literature review
(June 2008)
75
The work of Ausden et al (RSPB, Sandy, Bedfordshire) on relationships between flooding and soil macroinvertebrates could provide some useful basis for collaboration. Similarly, the research of Milsom et al. (Central Science Laboratory, DEFRA, York) on relationships between habitat characteristics including wetness and birds could be of value to the project.
References
ACREMAN, M.C., GOWING, D.J., STRATFORD, C.J., DURELL, S.E.A., MOUNTFORD, J.O., DUENAS, M.A., MOULD, D.J., RISPEN, E., BOFFEY, C.W.H., YOUNGS, E., MOY, I.L. 2008 Installation of surface grips for the restoration and management of wet grasslands on mineral soils. Final report to Department for Environment, Food and Rural Affairs. Centre for Ecology and Hydrology, Wallingford
AUSDEN, M., SUTHERLAND, W.J., & JAMES, R. 2001 The effects of flooding lowland wet grassland on soil macroinvertebrate prey of breeding wading birds. Journal of Applied Ecology, 38, 320-338.
BAKER, C., SIMPSON, M. AND THOMPSON, J.R. in press. Hydrological dynamics I: Surface waters, flood and sediment dynamics. In Maltby, E.B. (Ed.) The Wetlands Handbook. Blackwells, London, UK.
BEINTEMA, A.J. 1983. Meadow birds in the Netherlands. In Managing Wetlands and their Birds. A manual of Wetland and Waterfowl Management (ed D.A. Scott), pp. 83-91. International Waterfowl Research Bureau, Slimbridge.
BEINTEMA, A.J. 1987 Nesting success of birds breeding in Dutch agricultural grasslands. Journal of Applied Ecology, 24, 743-758.
BRINSON, M. M. 1993. A Hydrogeomorphic Classification for Wetlands. Technical Report WRP-DE-4. U.S. Army Corps of Engineers., Washington D.C., USA.
BRINSON, M. M., RHEINHARDT, R. D., HAUER, F. R., LEE, L.C., NUTTER, W.L., SMITH, R. D. AND D. WHIGHAM, 1995. A Guidebook for Application of Hydrogeomorphic Assessments to Riverine Wetlands. Technical Report WRP-DE-11. U.S. Army Corps of Engineers. Washington D.C., USA.
BROCK, M.A., SMITH, R.G. AND JARMAN, P.J. 1999. Drain it, dam it: Alteration of water regime in shallow wetlands on the New England Tableland of New south Wales, Australia. Wetlands Ecology and Management. 7, 37-46.
BURT, T.P. 1995. The role of wetland in runoff generation from headwater catchments. In: Hughes, J. and Heathwaite, L. (Eds). Hydrology and Hydrochemistry of British Wetlands. Wiley, Chichester, UK, 21-38.
BURT, T. P. AND HAYCOCK, N.E. 1996. Linking hillslopes to floodplains. In: Anderson, M.G.. Walling D.E. and Bates, P.D. (Eds) Floodplain Processes. Wiley, Chichester, UK, 461-493.
CHORLEY, R.J. 1978. The hillslope hydrological cycle. In: Kirkby, M.J. (Ed.) Hillslope Hydrology. Wiley, Chichester, UK, 1-42.
COWARDIN L.M., CARTER C., GOLET F.C., LAROE E.T., 1979. Classification of Wetlands and Deepwater Habitats of the United States. FWS/OBS-79/31, United States Fish and Wildlife Service, Washington DC, USA.

Science Report Methods to Assess, Model and Map the Environmental Consequences of Flooding: Literature review
(June 2008)
76
DAVIS, T.J. 1994. The Ramsar Convention Manual: A Guide to the Convention on Wetlands of International Importance Especially as Waterfowl Habitat. Ramsar Convention Bureau, Gland, Switzerland.
DEUVER, M.J. 1988. Hydrologic processes for models of freshwater wetlands. In Mitsch, W.J., Straškraba, M. and Jørgensen, S.E. (Eds) Wetland modelling. Elsevier, Amsterdam, 9-39.
DUGAN, P.J. (Ed.) 1990. Wetland Conservation: A Review of Current Issues and Required action. IUCN, Gland, Swtizerland.
DUGAN, P.J. (Ed.) 1993. Wetlands in Danger. Mitchell Beazley, London, UK.
EGLINGTON, S.M., GILL, J.A., BOLTON, M., SMART, M.A., SUTHERLAND, W.J. AND WATKINSON, A.R. 2008. Restoration of wet features for breeding waders on lowland grassland. Journal of Applied Ecology 45, 305-314.
ELLENBERG H., 1988. Vegetation Ecology of Central Europe (4th Edition). Cambridge University Press, Cambridge, UK.
FREDRICKSON, L.H. AND REID, F.A 1990. Impacts of hydrologic alteration on management of freshwater wetlands. In Sweeney, J.M. (Ed.) Management of Dynamic Ecosystems. North Central Section. The Wildlife Society, West Lafayette, 71-90.
GOSSELINK, J.G. AND TURNER, R.E. 1978. The role of hydrology in freshwater wetland ecosystems, In: Good, R.E., Whigham, D.F. and Simpson, R.L. (Eds). Freshwater Wetlands, Ecological Processes and Management Potential. Academic Press, New York, USA, 63-78.
GREEN, R.E. 1986. The management of lowland wet grassland for breeding waders. RSPB.
GREEN, R.E. AND ROBINS, M. 1993. The decline of the ornithological importance of the Somerset Levels and Moors, England and changes in the management of water levels. Biological Conservation 66, 95-106.
HEATHWAITE, A.L., GÖTTLICH, K.H., BURMEISTER, E.G., KAULE, G. AND GROSPIETSCH, TH 1993. Mires: Definitions and form. In Heathwaite, A.L. and Göttlich, K.h. (Eds) Mires: Process, exploitation and conservation. Wiley, Chichester, UK, 1-75.
HUGHES, J.M.R. AND HEATHWAITE, A.L. 1995. Introduction. In Hughes, J.M.R. and Heathwaite, A.L. (Eds) Hydrology and Hydrochemistry of British Wetlands. Wiley, Chichester, UK, 1-8.
JOYCE, C.B. AND WADE, P.M. 1998. Wet grasslands: A European perspective. In: Joyce, C.B. and Wade, P.M. (Eds), European Wet Grasslands: Biodiversity, Management and Restoration. Wiley, Chichester, UK, 1–12.
JUNK, W.J., BAYLEY, P.B. AND SPARKS, R.E. 1989. The flood pulse concept in river-floodplain systems. In: Dodge, D.P. (ed.). Proceedings of the International Large River Symposium. Canadian Special Publication of Fisheries and Aquatic Science 106, 110-127.
KAY, A.L., JONES, R.G. AND REYNARD, N.S. 2006. RCM rainfall for UK flood frequency estimation. II Climate change results. Journal of Hydrology 318, 165-172.
KEOUGH, J.R., THOMPSON, T.A., GUNTENSPERGEN, G.R. AND WILCOX, D.A. 1999. Hydrogeomorphic factors and ecosystem responses in coastal wetlands of the Great Lakes. Wetlands 19(4), 821-834.
KINGSFORD, R.T. 1999. Managing the water of the Border Rivers in Australia: irrigation, Government and the wetland environment. Wetlands Ecology and Management. 7, 25-35.

Review: Freshwater Ecosystems, Flooding and Vegetation
Science Report Methods to Assess, Model and Map the Environmental Consequences of Flooding: Literature review
(June 2008)
77
KIRKBY, M.J., 1985. Hillslope Hydrology, In: Anderson, M.G. and Burt, T.P. (Eds) Hydrological Forecasting. Wiley, Chichester, UK, 37-75.
MCCARTNEY, M.P. 2000. The water budget of a headwater catchment containing a dambo. Physics and Chemistry of the Earth (B) 25(7-8), 611-616.
MILSOM, T.P., HART, J.D., PARKIN, W.K. AND PEEL, S. 2002. Management of coastal grazing marshes for breeding waders: the importance of surface topography and wetness. Biological Conservation 103, 199–207.
MILSOM, T.P., LANGTON, S.D., PARKIN, W.K., PEEL, S., BISHOP, J.D., HART, J.D. AND MOORE, N.P. 2000. Habitat models of bird species’ distribution: an aid to the management of coastal grazing marshes. Journal of Applied Ecology 37,706–727.
MITSCH, W.J. 1988. Productivity-hydrology-nutrient models of forested wetlands. In Mitsch, W.J., Straškraba, M. and Jørgensen, S.E. (Eds) Wetland Modelling. Elsevier, Amsterdam, 115-132.
MITSCH, W. J. AND GOSSELINK, J.G. 2000. Wetlands. Wiley, New York, USA.
NEWBOLD, C. AND MOUNTFORD, J.O. 1997. Water Level Requirements of Wetland Plants and Animals. English Nature Freshwater Series No. 5. English Nature, Peterborough, UK.
RAMSBOTTOM, D., NOTTAGE, A. and ACREMAN, M. 2005. Scoping Study (Phase 1) Environmental Consequences for Flood Risk Assessment, R&D Technical Report EX 5126, Environment Agency, Bristol, 62pp.
REYNARD, N.S., PROUDHOMME, C. AND CROOKS, S.M. 2001. The flood characteristics of large UK rivers: potential effects of changing climate and land use. Climatic Change 48, 343-359.
RODWELL, J.S. (Ed.) 1991. British plant communities, Vol. 2. Mires and heaths. Cambridge University Press, Cambridge, UK.
ROSS, S.M. 1995. Overview of the hydrochemistry and solute processes in British wetlands. In Hughes, J.M.R. and Heathwaite, A.L. (Eds) Hydrology and Hydrochemistry of British Wetlands. Wiley, Chichester, 133-181.
SEMENIUK C.A. 1987. Wetlands of the Darling system – A geomorphic approach to habitat classification. Journal of the Royal Society of Western Australia 69, 95-112.
SEMENIUK C.A. and Semeniuk V. 1995. Geomorphic approach to classifying wetlands in tropical north Australia. In Finlayson. C.M. (Ed.) Wetlands Research in the Wet-Dry Tropics of Australia. Supervising Scientist Report 101, Supervising Scientist Group, Environment Australia, Canberra, 123-128.
SEMENIUK V. AND SEMENIUK C.A. 1997. A geomorphic approach to global classification for natural wetlands and rationalization of the system used by the Ramsar Convention – A discussion. Wetlands Ecology and Management 5, 145-158.
SPURGEON, D.J., HOPKIN, S.P. 1995 Extrapolation of the laboratory based OECD earthworm toxicity test to metal-contaminated field sites. Ecotoxicology, 4, 190-205.
THOMAS, G.J. 1976 Habitat usage of wintering ducks at the Ouse Washes, England. Wildfowl, 27, 148-152.
THOMAS, G.J. 1980 The ecology of breeding wildfowl at the Ouse Washes, England. Wildfowl, 31, 73-38.
Science Report Methods to Assess, Model and Map the Environmental Consequences of Flooding: Literature review
(June 2008)
78
THOMAS, G.J. 1981 Field feeding by dabbling ducks around the Ouse Washes, England. Waterfowl, 32, 69-78.
THOMAS, G.J. 1982 Autumn and winter feeding ecology of waterfowl at the Ouse Washes, England. Journal of Zoology, 197, 131-172.
THOMPSON, J.R. 2004. Simulation of wetland water level manipulation using coupled hydrological / hydraulic modelling. Physical Geography 25, 39-67.
THOMPSON, J.R. AND FINLAYSON, C.M. 2001. Freshwater Wetlands. In Warren, A. and French, J.R. (Eds) Habitat Conservation: Managing the Physical Environment. Wiley, Chichester, UK, 147-178.
THOMPSON, J.R., REFSTRUP SØRENSON, H., GAVIN, H. AND REFSGAARD A. 2004. Application of the coupled MIKE SHE / MIKE 11 modelling system to a lowland wet grassland in Southeast England. Journal of Hydrology 293, 151-179.
WHEELER, B.D., GOWING, D.J.G., SHAW, S.C., MOUNTFORD, J.O. AND MONEY, R.P. 2004. Ecohydrological Guidelines for Lowland Plant Communities. Brooks A.W., Jose, P.V. and Whiteman M.I. (Eds). Environment Agency (Anglian Region), Peterborough, UK.
WHEELER, B.D. AND SHAW, S.C. 1995. Plants as hydrologists? An assessment of the value of plants as indicators of water conditions in fens. In: Hughes, JMR and Heathwaite, AL (Eds), Hydrology and Hydrochemistry of British Wetlands. Wiley, Chichester, pp 63–82.
WILCOX, D.A. AND WHILLANS, T.H. 1999. Techniques for restoration of disturbed coastal wetlands of the Great Lakes. Wetlands 19(4), 835-857.

Review: Freshwater Ecosystems, Flooding and Vegetation
Science Report Methods to Assess, Model and Map the Environmental Consequences of Flooding: Literature review
(June 2008)
79
8 Issue 7: Fish populations: the consequences of flooding
J.D. Bolland1, I.G. Cowx1, A Pinder2, G.Old2 and M. Acreman2
(1University of Hull (HIFI), 2Centre for Ecology and Hydrology)
Scope
This issue paper covers the effects of flooding on freshwater, anadromous and diadromous fishes within fluvial ecosystems. It is an extension to the information presented in the scoping study (Ramsbottom et al., 2005). Fish and their habitats are strongly influenced by flow regime, and requirements and tolerances vary, not only between species but also between developmental stages within species. Flooding can affect fish populations directly, through encouraging migration, washout, stranding, or more indirectly through enabling access to floodplain environments, impacts on habitat quality and food availability. We define how varying degrees of flooding can have both beneficial and occasional detrimental consequences throughout all life stages of fish and how relevant research could be applied to improve hydrological management and in-stream habitat management for the benefit fish populations.
Flood definitions and concepts
Flooding occurs when the level of a river exceeds bankfull. The term spate is used to refer to episodes of high flow that are confined within the main channel. Flooding and spates are an integral part of the hydrological regime and a beneficial natural disturbance essential for maintaining a biologically diverse and productive ecosystem (Bayley, 1995; Naiman & Décamps, 1997). However, many researchers argue that floods should not be classed as disturbances as they are part of a continuum of natural hydrologic variability. This may be contrasted to disturbances in other disciplines where disturbances may be catastrophic events that do not normally occur (e.g. fire).
The extended serial discontinuity concept (ESDC) describes the relative strength of longitudinal, vertical and lateral interactions within a catchment, with the longitudinal (river/river or river/tributaries) pathway being most important in the constrained headwaters, vertical (river bed/aquifer) interactions reaching their maximum importance in the braided middle course and lateral connectivity playing the major role in alluvial floodplain (river bed/floodplains) rivers (Ward & Stanford (1995). The Flood Pulse Concept (FPC; Junk et al., 1989) states that the lateral connection between the river channel and the connected floodplain during periodic inundation is the major driving variable for ecological processes in large tropical and temperate river floodplain systems (Junk et al., 1989; Bayley, 1991; Tockner et al., 2000b). The intermediate-disturbance hypothesis predicts that species richness will be highest in communities that experience intermediate levels of disturbance (Connell, 1978). Thus rivers with an intermediate (and predictable) level of flooding are expected to provide high diversity, by resetting environmental conditions, interrupting community succession and causing increased habitat heterogeneity for many species with
Science Report Methods to Assess, Model and Map the Environmental Consequences of Flooding: Literature review
(June 2008)
80
different environmental requirements. Ecologically important characteristics of floods are their magnitude, frequency, seasonal timing, predictability, duration and rate of change of flow conditions (Poff et al., 1997; Welcomme & Halls, 2001; Bunn & Arthington, 2002). Winemiller (2004) classified rivers globally based on their annual hydrology as: temperate with aseasonal (seemingly random) flood pulses, temperate with seasonal flood pulses and tropical with seasonal flood pulses. However, this gross classification misses many of the subtleties of local river systems, attributed to local geology, geomorphology, and climate variability (Cowx et al., 2004). However, every river has a unique flow regime that is determined by its physical setting.
Floods in upland reaches
In dynamic upland river environments individual fish species have different resistances to flooding based on variations in life history, behaviour during floods and morphology. Indeed, many authors report negligible effects of floods on fish of age 1+ or older (Elwood & Waters, 1969; Hill & Grossman, 1987; Matthews et al., 1994; Harvey et al., 1999; Jensen & Johnsen, 1999; Lojkásek et al., 2005; Pires et al., 2008), mainly because of behavioural adaptations. In environments subject to frequent disturbances species evolve life history, behavioural and morphological adaptations (Matthews, 1986).
Life history adaptations
Life history adaptations increase recruitment success by increasing the survival of vulnerable life stages (i.e. eggs, larvae and juveniles) (Seegrist & Gard, 1972). For example, salmonids are ecologically well adapted to survive in rapidly flowing rivers. They excavate egg nests deep enough to minimise flood scour to a tolerable level (DeVries, 1997). Their early life stages (alevins) remain in situ until they are relatively well developed and capable of withstanding faster flows. The early life stages of some diadromous fish inhabit the marine or estuarine environment to avoid exposure to floods (McDowall, 1976). The importance of timing of spawning so fry emergence coincides with seasonal periods of low flood probability appears to be an optimal strategy (e.g. Fausch et al., 2001).
For many species, behaviour has evolved in response to natural rhythms of flooding. For example, physiological preparation to spawn is largely governed by a combination of photoperiod and temperature. However, it is often a rise in water velocity that triggers the behavioural response to migrate and congregate on the spawning grounds. It is widely accepted that salmon preferentially migrate into rivers during periods of higher flow (Harriman, 1961; Ladle, 2002) and the majority of spawning fish enter the rivers in summer and autumn (Milner, 1989; Saunders, 1967). During low flow years the number of salmon entering a river may be low (Sambrook & Cowx 2000; Ladle, 2002; Solomon & Sambrook 2004 ). High flows may be particularly important for migrations in rivers with low base flows. In five English rivers salmon were observed to migrate at velocities ranging from 27 cm s-1 to 128 cm s-1 (Stewart, 1973). Hellawell et al. (1974) mentioned how fish move by night in clear water and by day in turbid flood water on the River Frome, Dorset. Elevated flows increase longitudinal connectivity and allow access for many species to upstream areas suitable for reproduction and juvenile production (Franssen et al., 2006). Entry into small headwater tributary spawning areas is strongly dependent on flow. Webb et al. (2001) suggested how a range of flows is important to ensure spawning areas are distributed as widely as possible. As well as salmonids, many rheophilic cyprinids require good flows in spring to migrate to gravel beds for spawning (Lucas & Bately, 1996). Another example of the importance of seasonal flooding is the strong relationship between the numbers of seaward migrating salmonid smolts and elevated velocities, thought to be a tactic to reduce the risk of predation. The

Review: Freshwater Ecosystems, Flooding and Vegetation
Science Report Methods to Assess, Model and Map the Environmental Consequences of Flooding: Literature review
(June 2008)
81
environmental flow requirements for migration and access to spawning gravels of various fish species are summarised in Table 7.1.
Optimum discharges for salmon spawning may be as high as two or three times median flow (Moir et al., 2001). Moir et al. (2006) indicated that flow stability was also important for salmon spawning, with periods of rapidly varying discharges avoided. During low flow periods, hyporheic water is often dominated by long residence time groundwater with low dissolved oxygen, which is unsuitable for egg survival (Malcolm et al., 2004). During high flows, hyporheic water quality may be improved. The environmental flow requirements for spawning of various fish species are summarised in Table 7.1.
In systems where discharge is usually low, high flow events can also clean silt from underlying gravels, temporarily making available suitable spawning substrata for rheophils (Wood & Armitage, 1997). During high flows water may flow through gravels supplying oxygen to embryos and removing waste products.
Behavioural adaptations
During a flood the creation or existence of refugia and disturbance patches influences organism survival and recolonisation potential (Townsend, 1989). Perasons et al. (1992) reported that fish populations were more stable in physically complex habitats by providing increased availability of flow refugia. Juvenile and adult fish use low-flow refugia near stream banks and in rocky shorelines (e.g. Deegan et al., 1999), large deep pools with low-velocity areas (Brown et al., 2001) and instream interstitial spaces, behind rocks, boulders and woody debris (e.g. White & Harvey, 2001). Under high flow conditions fish are often attracted to areas of low flow because they are energetically less demanding than maintaining a position in faster water, thus avoiding displacement, physical damage and/or mortality. The life behavioural adaptations discussed above are for principally for fish in upland reaches because flow variability, intensity of scour and water velocity are inversely related to stream size, i.e. high flow events are more dramatic in upland reaches. However, behavioural adaptations are also relevant to fish in lowland rivers and some fish migrate onto inundated floodplains areas/water bodies (e.g. Bell et al., 2001) and riparian vegetation with negligible velocity (e.g. Gillette et al., 2006).
Morphological advantages
The morphological features of many fish affect their hydrodynamic performance. For example, the hydraulic basis of position-holding using paired pectoral fins close to the river bed has been established for many species, including salmonids (Arnold et al., 1991), cyprinids (Facey & Grossman, 1990), acipenserids (Adams et al., 1999) and cottids (Webb, 1989).

Science Report Methods to Assess, Model and Map the Environmental Consequences of Flooding: Literature review
(June 2008)
82
Table 8.1 Summary information on ecosystem flow needs (Old and Acreman, 2006) Timing and related
conditions Flow preferences
Salmonids: river entry
Flood/High tide Night time Water temperature between 5° and 17°C (measured at 09h00). Sufficiently well oxygenated river flow
Elevated river flows
Salmonids: upstream migration
Spring run Feb - May Summer run Jun - Aug Autumn run Sept – Nov Exact timings may vary between rivers and sub-catchments due to genetic differences.
Required flows for salmon migration vary annually and seasonally. Adequate base flows may occur during spring. In high baseflow rivers a high background migration may occur during summer that is unrelated to river flow. In rivers with a flashy flow regime or in a dry year summer flow increases are likely to initiate migrations. Increased migration is likely to occur in most rivers during periods of elevated flow.
Salmonids: spawning
In upland and northern rivers spawning typically occurs between October and December. In lowland or southern rivers spawning may take place anytime between November and March.
During this period extreme flow events capable of mobilising gravel must not occur or eggs will be damaged or washed away. Flows need to be sufficiently high to ensure a wide distribution of spawning and connectivity between various habitats during spawning to allow dispersal
Salmonids: downstream adult migration
Migration November to May
Elevated flows may help
Salmonids: post emergence
March – May Low, stable flow is desirable, with no rapid increases/decreases
Salmonids: dispersal of smolts
April – July Periods of elevated flow
Coarse fish: migration and spawning
February-March Rheophilic cyprinids need good flows to migrate and spawn
Coarse fish: pike, stickleback and dace
February – April No extreme high or low flows. Extreme high flows may wash out/displace or damage eggs and larval fish. Extreme low flows may result in stranding of fish in backwaters/marginal areas or drying

Review: Freshwater Ecosystems, Flooding and Vegetation
Science Report Methods to Assess, Model and Map the Environmental Consequences of Flooding: Literature review
(June 2008)
83
out of eggs. Pike and sticklebacks spawn in flooded backwaters during late winter/early spring floods. Sustained and elevated flows are needed to ensure connectivity of backwaters/marginal areas and to avoid fish stranding during flow recessions.
Late spawning coarse fish (e.g. chub, barbel and sea lamprey)
May – July No extreme high or low flows. Extreme high flows may wash out/displace or damage eggs and larval fish. Extreme low flows may result in stranding of fish in backwaters/marginal areas or drying out of eggs.
Floods in lowland rivers
Many undisturbed lowland rivers have more gentle sloping banks that are overtopped relatively quickly, facilitating more frequent connectivity with the floodplain and thus allowing river discharge to dissipate and velocities to reduce across large areas of habitat, suitable for spawning, feeding or refuge purposes. This can result in increased diversity within the system – e.g. by providing habitats, such as oxbows and drainage ditches, for spawning or as nursery areas, that are scarce or lacking within the main river.
Availability of suitable spawning habitat and nursery habitats for young fish, as well as an adequate food supply (e.g. inundated floodplain environments) during the early stages are critical for good recruitment (Nunn et al. 2007a, b). The habitat heterogeneity of floodplain river ecosystems is not only maintained but is often increased by erosional and depositional processes during floods (e.g. Mertes, 1997). For example, fluvial action may create fish habitats through the formation of channels, backwaters, standing water bodies and marshes. Periodic flood events maintain connectivity between river and floodplain and compensate for terrestrialisation during low flow periods (Amoros, 1991). The balance between rejuvenation and terrestrialisation processes produces a mosaic of habitats with distinct fish assemblages (Copp, 1989). For example, phytophilic species require lentic, vegetated areas, which are often only temporarily connected with the main channel. Jurajda et al. (2004) found long term flooding increased the abundance of phytophilous and phytolithophilous species (flooded vegetation provides food and shelter thus increasing growth and reducing predation). Furthermore, pike spawn in February or March in well-vegetated flooded back waters and side channels coinciding with late winter/early spring floods (Fabricius & Gustafson, 1958). Sticklebacks also spawn in the same habitat, a little later in March and April (Wheeler, 1998). Permanent stocks of bream have been found in oxbow lakes on the River Rhine (Molls, 1999).
Waidbacher (1989) found a positive relationship between hydrological connectivity and fish species richness in European aquatic floodplain habitats. Tockner et al. (1998) identified that fish diversity peaked in highly connected habitats on a Danube floodplain. During floods river-floodplain connectivity allows fish to disperse and take advantage of different floodplain habitats for refuge, spawning, nursery and feeding. Ward et al. (1999) emphasised that fish movements to floodplain spawning and nursery areas, are crucial for the recruitment and
Science Report Methods to Assess, Model and Map the Environmental Consequences of Flooding: Literature review
(June 2008)
84
sustainability of fish populations. Furthermore, nutrient release during floodplain inundation stimulates phytoplankton and zooplankton production providing an abundant food source for newly hatched larvae (Junk et al., 1989).
Welcomme and Halls (2004) reviewed the influence of the hydrological regime on fisheries, and detailed that floods of greater amplitude increased the area for spawning sites, food and shelter for the fish, whilst duration influences the time available for fish to grow and shelter from predators. These principles apply to rivers globally; large floods of long-term duration increase fish species richness and abundance in temperate floodplain systems (e.g. Modde et al., 1996).
Detrimental effects of flooding
Upland reaches
Stewart (1969) indicated that there is an upper threshold above which salmonid migration is inhibited. This is suggested to be a response to the combined effect of high velocity and high suspended solids. Extreme high flows may scour salmonid fish eggs from river gravels (e.g. Carline and McCullough, 2003). Increased sediment load during the salmonid spawning season has been reported to fill interstitial spaces and prevent alevin emergence (Phillips et al., 1975) and suffocate eggs by starving them of oxygen (Meyer, 2003). Rapidly fluctuating discharges were thought to impact negatively on trout populations in the Afon Clywedog, UK (Cowx & Gould, 1989). The effect of floods on adults are less severe or more predictable than on smaller fish (Fausch et al., 2001), but extreme floods can cause mortality of adult fish (e.g. Weng et al., 2001). Fish in upland environments are susceptible to mortality through damage by drifting debris or shifting bed material (Erman et al., 1988), especially fish that live in interstitial spaces (e.g. Lusk et al., 1998). Most severe impacts occur when landslides combine with flood water to produce debris flows (e.g. Sato, 2006). Fish may also be affected by a food shortage due to invertebrate mortality or washout (e.g. Jensen & Johnsen, 1999), and/or reduced feeding efficiency in turbid flood water (e.g. Arndt et al., 2002).
Lowland reaches
Analysis of the population structure of riverine fish species often demonstrates a wide variation in recruitment success between years. Extreme high flows may scour fish eggs from vegetation (e.g. Cowx & Gould, 1989). Floods of short duration or low amplitude are most detrimental if spawning involves nest building and adhesive eggs because of the risk of desiccation (Humphries et al., 1999). Spawning in backwaters during flooding is a high risk strategy which can lead to stranding of adults and young fish as the water recedes (Fabricius & Gustafson, 1958). During floodplain inundation water quality may become poor because of high levels of tannins and decaying plant matter (low dissolved oxygen), and this may impact larval fish abundance and diversity (e.g. Swales et al., 1999). There is much evidence to suggest that the bottlenecks to recruitment in many fish populations relate principally to spawning success and the growth and survival rates of newly hatched larvae (Mills & Mann, 1985), but these are intrinsically linked to flow conditions during critical periods in the fishes’ development (Nunn et al. 2003, 2007c). While older fish, with well developed swimming abilities are able to seek out areas that offer protection from high velocities, larval fish (particularly the Cyprinidae) are not morphologically equipped to cope with these events, although this capacity increases rapidly in the first few weeks of life (e.g. Jensen & Johnsen 1999). During the first few weeks of development larvae are able to tolerate velocities of only

Review: Freshwater Ecosystems, Flooding and Vegetation
Science Report Methods to Assess, Model and Map the Environmental Consequences of Flooding: Literature review
(June 2008)
85
a few centimetres per second (Mann & Bass 1997) and are therefore very susceptible to being displaced downstream, stranded or totally washed out of the system (Nunn et al., 2007; Salvteit et al., 2001). Spates or larger flood events are therefore more likely to have a major impact on juvenile fish if they occur immediately after fish hatching, i.e. mortality is directly related to flow event timing but duration of spate or flooding can also have implications for year class strengths and overall fish densities (Nunn et al. 2003, 2007c).
Extreme flood events can strip away marginal vegetation that provides cover and a food source for many fish. During early development larvae are restricted in the type of food organism they are able to catch and ingest. Initially many species are heavily reliant on rotifers, while older larvae are able to catch larger and faster moving crustaceans such as Daphniidae and Bosminiidae. In turn these are dependent for food on amount of phytoplankton available. Washout of the planktonic food support system by floods during the transition from endogenous to exogenous nutrition (a critical period in fish ontogeny) can again result in high mortality and year class failure.
Anthropogenic influences
Regulation, channelization and levee construction: reduce floodplain connectivity. Alterations to the flow regime are considered to be the most detrimental human alterations to freshwater ecosystems (Stanford et al., 1996; Poff et al., 1997). Stabilised river flows often favour alien species which prey and compete with native fish (e.g. Reid and Brooks, 2000). In heavily regulated rivers rheophilic species have become rare due to habitat degradation (Aarts et al., 2004). Channelisation and levee construction constrain rivers to a single channel with short shorelines that are isolated from floodplain water bodies. These floodplains experience accelerated terrestrialisation. Up to 90% of European and North American floodplains are ‘cultivated’ and therefore functionally extinct (Tockner and Stanford, 2002). Species adapted to floodplain inundation for spawning, nursey, flow refuge are adversely affected by reduced floodplain connectivity. When floodwaters overtop levees fish are often washed or swim onto the floodplain and then during recession flows they may become trapped. Ultimately human modifications to the river floodplain ecosystem culminate in increased numbers of endangered fish taxa and reflect a loss of species diversity (e.g. Galat et al., 1998). Tockner and Stanford (2002) emphasised the urgent need to preserve intact flood plains and restore impacted systems to prevent extinctions of species and ecosystem services.
A further, and increasing, threat is that posed by non-native species sold for garden ponds by the aquarist trade. Flooding of gardens and commercial fisheries within and in close proximity of the floodplain greatly increases the probability of further dispersal of alien species and the potential threats associated with this additional component.
River restoration
Tockner and Stanford (2002) stated that natural uses of floodplains far outweigh the value of human activities that constrain floodplain structure and function. Brown (2002) stated that if river restoration is to have an ecological design it is necessary to understand what the natural state was and whether this can be recreated. Restoration strategies should not focus on a single taxonomic group or species (e.g. Sparks, 1995) because different faunal groups have different requirements. However, flagship species can highlight key issues. Conservation plans that target one species but incorporate habitat improvement are likely to

Science Report Methods to Assess, Model and Map the Environmental Consequences of Flooding: Literature review
(June 2008)
86
be successful. Cowx and Welcomme (1998) suggested rehabilitation of rivers for fish should involve reinstating lateral and longitudinal connectivity, recreating habitat diversity and channel morphology, improving flow regimes for fisheries purposes and improving water quality problems.
Stanford et al. (1996) stated that rivers should perform the geomorphic restoration rather than using artificial engineering solutions. Many studies have demonstrated the benefits of dam releases for enhancing populations of native over non native fish species (e.g. Schultz et al., 2003). Re-connecting floodplain environments may involve changing a rivers flow regime, removing levees and creating artificial floodplain ponds. Grift et al. (2003) observed fish habitat use in man-made secondary channels and reconnected oxbow lakes was comparable to (semi) natural floodplains. Brenner et al. (2003) reported that ecologically sensitive flood control structures enhanced fish recruitment and diversity along the rivers Rhine and Meuse.
Tockner et al. (1998) suggested restoration of the integrity of the hydrograph is the most vital step in restoring rivers. Several studies have attempted to model environmental flows regimes necessary to protect or restore river ecosystems, for example the RVA (Range of Variability Approach; Richter et al., 1997), the DRIFT methodology (Downstream Response to Imposed Flow Transformations; King et al., 2003) and others (Arthington & Pusey, 2003, Arthington et al., 2003; Richter et al., 2003; reviewed in Tharme, 2003; Cowx et al., 2004).
Data
To evaluate the consequences of flooding on fish populations and apply this knowledge to management, results of the following research will be required
• radio telemetry and Passive Integrated Transponder (PIT) tag technologies, used to investigate behavioural responses to flooding of a representative number of species from each ecological guild over a seasonal time-scale. In particular, the use of floodplain habitat.
• experimentally controlled investigation of the critical swimming speeds of a range of fish species at various stages during their early ontogeny.
• Modelling impact of timing and frequency of high flow events on recruitment success.
• field surveys of egg and larval drift under various flow conditions.
• relationship between flow regime and food base of fish.
• field surveys of habitat utilisation by 0+ fishes to establish phenotypic plasticity in response to fluctuating habitat availability.
It should be noted here that the role of floodplains in the life cycle of N. European fishes remains very ill defined although the studies that have occurred do show that many species rely on the floodplain habitats when these are allowed to flood.
Other work

Review: Freshwater Ecosystems, Flooding and Vegetation
Science Report Methods to Assess, Model and Map the Environmental Consequences of Flooding: Literature review
(June 2008)
87
Although not within the scope of the present study to provide a thorough literature review some past and present studies relevant to this topic are as follows.
• Lowland Catchment Research (LOCAR): the fish research within this thematic project is currently investigating the temporal and spatial movements of non salmonid species in the River Frome, Dorset. In particular this project is concentrating on the utilisation and relative importance of off-river habitats both during low flows and flood events.
• Larval habitat use: although a number of studies have addressed this topic there is a paucity of literature regarding the specific effects of flooding on larval habitat availability in the UK (but see Bolland et al. 2008).
• Various data are available regarding critical swimming speeds of some species. Some work has also been carried out on the swimming capacities of 0+ fishes (Mann & Bass 1997), although this research has stalled.
References
AARTS, B.G.W., VAN DEN BRINK, F.W.B. & NIENHUIS, P.H. 2004. Habitat loss as the main cause of the slow recovery of fish faunas of regulated large rivers in Europe: The transversal floodplain gradient. River Research and Applications 20, 3-23.
ADAMS, S.R., HOOVER, J.J. & KILLGORE, K.J. 1999. Swimming Endurance of Juvenile Pallid Sturgeon, Scaphirhynchus albus. Copeia 1999, 802-807.
AMOROS, C. 1991. Changes in side-arm connectivity and implications for river system management. Rivers 2, 105-112.
ARNDT, S.K.A., CUNJAK, R.A. & BENFEY, T.J. 2002. Effect of summer floods and spatial–temporal scale on growth and feeding of juvenile Atlantic salmon in two New Brunswick streams. Transactions of the American Fisheries Society 131, 607–622.
ARNOLD, G.P., WEBB, P.W. & HOLFORD, B.H. 1991. The role of the pectoral fins in station-holding of Atlantic salmon parr (Salmo salar L.). Journal of Experimental Biology 156, 625-629.
ARTHINGTON, A.H. & PUSEY, B.J. 2003. Flow restoration and protection in Australian rivers. River Research and Applications 19, 1-19.
ARTHINGTON, A.H., RALL, J.L., KENNARD, M.J. & PUSEY, B.J. 2003. Environmental flow requirements of fish in Lesotho rivers using the DRIFT methodology. River Research and Applications 19, 641-666.
BAYLEY, P.B. 1991. The flood pulse advantage and the restoration of the river-floodplain systems. Regulated Rivers 6, 75-86.
BAYLEY, P.B. 1995. Understanding large river-floodplain ecosystems. Bioscience 45, 153-158.
BELL, E., DUFFY, W.G. & ROELOFS, T.D. 2001. Fidelity and survival of juvenile coho salmon in response to a flood. Transactions of the American Fisheries Society 130, 450–458.
BOLLAND J.D., COWX I.G. & LUCAS M.L. 2008 Dispersal of coarse fish. Environment Agency Science Report – SC030215/SR
BRENNER, T., BUIJSE, A.D., LAUFF, M., LUQUET, J.F. & STAUB, E. 2003. The present status of the River Rhine with special emphasis on fisheries development. Pages 121-148 in

Science Report Methods to Assess, Model and Map the Environmental Consequences of Flooding: Literature review
(June 2008)
88
WELCOMME R.L & PETR T., editors. Proceedings of the Second International Symposium on the Management of Large Rivers for Fisheries, Volume I.
BROWN, A.G. 2002. Learning from the past: palaeohydrology and palaeoecology. Freshwater Biology 47, 817–829.
BROWN, R.S., POWER, G. & BELTAOS, S. 2001. Winter movements and habitat use of riverine brown trout, white sucker and common carp in relation to flooding and ice break-up. Journal of Fish Biology 59, 1126-1141.
BUNN, S.E. & ARTHINGTON, A.H.. 2002. Basic principles and ecological consequences of altered flow regimes for aquatic biodiversity. Environmental Management 30, 492-507.
CARLINE, R.F. & MCCULLOUGH, B.J. 2003. Effects of floods on brook trout populations in the Monongahela National Forest, West Virginia. Transactions of the American Fisheries Society 132, 1014–1020.
CONNELL, J.H. 1978. Diversity in tropical rain forests and coral reefs. Science 199, 1302-1310.
COPP, G.H. 1989. The habitat diversity and fish reproduction function of floodplain ecosystems. Environmental Biology of Fishes 26, 1–27.
COWX, I.G. & VAN ZYLL DE JONG, M. 2004. Rehabilitation of freshwater fisheries: tales of the unexpected? Fisheries Management and Ecology 11, 243–249.
COWX, I.G. & WELCOMME, R.L. (eds) 1998. Rehabilitation of Rivers for Fish. Oxford: Fishing News Books, Blackwell Science, 260 pp.
DEEGAN, L.A., GOLDEN, H., HARVEY, C.J. & PETERSON, B.J. 1999. Influence of environmental variability on the growth of age-0 and adult arctic grayling. Transactions of the American Fisheries Society 128, 1163-1175.
DEVRIES, P. 1997. Riverine salmonid egg burial depths: review of published data and implications for scour studies. Canadian Journal of Fisheries and Aquatic Sciences 54, 1685–1698
ELWOOD, J.W. & WATERS, T.F. 1969. Effects of floods on food consumption and production rates of a stream brook trout population. Transactions of the American Fisheries Society 98, 253–262.
ERMAN, D.C., ANDREWS, E.D. & YODER-WILLIAMS, M. 1988. Effects of winter floods on fishes in the Sierra Nevada. Canadian Journal of Fisheries and Aquatic Sciences 45, 2195–2200.
FACEY, D.E. & GROSSMAN, G.D. 1990. The metabolic cost of maintaining position for four North American stream fishes: effects of season and velocity. Physiological Zoology 63, 757-776.
FAUSCH, K.D., TANIGUCHI, Y., NAKANO, S., GROSSMAN, G.D. & TOWNSEND, C.R. 2001. Flood disturbance regimes influence rainbow trout invasion success among five holarctic regions. Ecological Applications 11, 1438-1455.
FRANSSEN, N.R., GIDO, K.B., GUY, C.S., TRIPE, J.A., SHRANK, S.J., STRAKOSH, T.R., BERTRAND, K.N., FRANSSEN, C.M., PITTS, K.L. & PAUKERT, C.P. 2006. Effects of floods on fish assemblages in an intermittent prairie stream. Freshwater Biology 51, 2072–2086.
GALAT, D.L., FREDRICKSON, L.H., HUMBURG, D.D., BATAILLE, K.J., BODIE, J.R., DOHRENWEND, J., GELWICKS, G.T., HAVEL, J.E., HELMERS, D.L., HOOKER, J.B., JONES, J.R., KNOWLTON, M.F., KUBISIAK, J., MAZOUREK, J., MCCOLPIN, A.C.,
Review: Freshwater Ecosystems, Flooding and Vegetation
Science Report Methods to Assess, Model and Map the Environmental Consequences of Flooding: Literature review
(June 2008)
89
RENKEN, R.B. & SEMLITSCH, R.D. 1998. Flooding to restore connectivity of regulated, large-river wetlands. Bioscience 48, 721–733.
GILLETTE, D.P., TIEMANN, J.S., EDDS, D.R. & WILDHABER, M.L. 2006. Habitat use by a Midwestern U.S.A. riverine fish assemblage: effects of season, water temperature and river discharge. Journal of Fish Biology 68, 1494-1512.
GRIFT, R.E., BUIJSE, A.D., VAN DENSEN, W.L.T., MACHIELS, M.A.M., KRANENBARG, J., BRETELER, J.P.K. & BANKX, J.J.G.M. 2003. Suitable habitats for 0-group fish in rehabilitated floodplains along the lower River Rhine. River Research and Applications 19, 353-374.
HARVEY, B.C., NAKAMOTO, R.J. & WHITE, J.L. 1999. Influence of large woody debris and a bankfull flood on movement of adult resident coastal cutthroat trout (Oncorhynchus clarki) during fall and winter. Canadian Journal of Fisheries and Aquatic Sciences 56, 2161–2166.
HILL, J. & GROSSMAN, G.D. 1987. Home range estimates for three North American stream fishes. Copeia 1987, 376–380.
HUMPHRIES, P., KING, A.J. & KOEHN, J.D. 1999. Fish, flows and floodplains: Links between freshwater fishes and their environment in the Murray-Darling River system, Australia. Environmental Biology of Fishes 56, 129–151.
JENSEN, A.J. & JOHNSEN, B.O. 1999. The functional relationship between peak spring floods and survival and growth of juvenile Atlantic salmon (Salmo salar) and brown trout (Salmo trutta). Functional Ecology 13, 778–785.
JUNK, W.J., BAYLEY, P.B. & SPARKS, R.E. 1989. The flood pulse concept in river–floodplain systems. Canadian Special Publication of Fisheries and Aquatic Sciences 106, 110–127.
JURAJDA, P., ONDRAČKOVÁ, M. & REICHARD, M. 2004. Managed flooding as a tool for supporting natural fish reproduction in man-made lentic watebodies. Fisheries Management & Ecology 11, 237-242.
LADLE, M. 2002. Review of Flow Needs for Fish and Fisheries. R&D Technical report W159, Environment Agency, 99pp.
LOJKÁSEK, B., LUSK, S., HALACKA, K., LUSKOVÁ, K. & DROZD, P. 2005. The impact of the extreme floods in July 1997 on the ichthyocenosis of the Oder Catchment area (Czech Republic). Hydrobiologia 548, 11-22.
LUSK, S., HALAČKA, K. & LUSKOVÁ, V. 1998. The effect of extreme floods on the fish communities in the upper reaches of the Tichá Orlice River (the River Labe drainage area). Czech Journal of Animal Science 43, 531–536.
MANN, R. H. K. 1996. Environmental requirements of European non-salmonid fish in rivers. Hydrobiologia 323, 223-235.
MANN, R.H.K. & BASS, J.A B. 1997. The critical water velocities of larval roach (Rutilus rutilus) and dace (Leuciscus leuciscus) and implications for river management. Regulated Rivers: Research and Management 13, 295-301.
MATTHEWS, W.J. 1986. Fish community structure in a temperate stream: stability, persistence, and a catastrophic flood. Copeia 1986, 388–397.
MATTHEWS, W.J., HARVEY, B.C. & POWER, M.E. 1994. Spatial and temporal patterns in the fish assemblages of individual pools in a midwestern stream (USA). Environmental Biology of Fishes 39, 381– 397.

Science Report Methods to Assess, Model and Map the Environmental Consequences of Flooding: Literature review
(June 2008)
90
MCDOWALL, R.M. 1976. The role of estuaries in the life cycles of fishes in New Zealand. Proceedings of the New Zealand Ecological Society 23, 27-32.
MERTES, L.A.K. 1997. Documentation and significance of the perirheic zone on inundated floodplains. Water Resources Research 33, 1749-1762.
MEYER,C. B. 2003. The importance of measuring biotic and abiotic factors in the lower egg pocket to predict coho salmon egg survival. J. Fish. Biol 62 (3), 534-548.
MILLS, C. A. & MANN, R. H. K 1985. Environmentally-induced fluctuations in year-class strength and their implications for management. J. Fish. Biol 27 (suppl A), 209-409.
MODDE, T., BURNHAM, K.P. & WICK, E.F. 1996. Population status of the endangered razorback sucker in the middle Green River. Conservation Biology 10, 110–119.
MOLLS, F. 1999. New insights into the migration and habitat use by bream and white bream in the floodplain of the River Rhine. Journal of Fish Biology 55, 1187–1200.
NAIMAN, R.J. & DÉCAMPS, H. 1997. The ecology of interfaces: Riparian zones. Annual Review Ecology & Systematics 28, 621-658.
NOBLE R.A.A., GOFFAUX D., KESTEMONT P. & COWX I.G. 2007 Harmonisation of the classification of the ecological characteristics of fish species for use in a standardised assessment method for the ecological integrity of European rivers. Fisheries Management and Ecology 14, 381-392.
NUNN A.D., HARVEY J.P. & COWX I.G. 2007a. The food and feeding relationships of larval and 0+ juvenile fishes in lowland rivers and floodplain waterbodies: I. Ontogenetic shifts and interspecific diet similarity. Journal of Fish Biology70, 726–742.
NUNN A.D., HARVEY J.P. & COWX I.G. 2007b. The food and feeding relationships of larval and 0+ juvenile fishes in lowland rivers and floodplain waterbodies: II. Prey selection and the influence of gape size. Journal of Fish Biology 70, 743–757.
NUNN, A.D., HARVEY, J.P., BRITTON, J.R., FREAR, P.A. & COWX, I.G. 2007c. Fish, climate and the Gulf Stream: the influence of abiotic factors on the recruitment success of cyprinid fishes in three English lowland rivers. Freshwater Biology 52, 1576-1586.
NUNN A.D., COWX I.G. & HARVEY J.P. 2003. Is water temperature an adequate predictor of recruitment success in coarse fish populations in lowland rivers? Freshwater Biology 48, 579-588.
OLD, G. AND ACREMAN, M.C. 2006 Guidance on compensation flows and freshets. Task 3: a review of literature on environmental flow requirements of UK river ecosystems. Project WFD 82, Scotland and Northern Ireland Forum for Environmental Research, 26 pp.
PEARSONS T.N., LI H.W. & LAMBERTI G.A. 1992. Influence of habitat complexity on resistance to flooding and resilience of stream fish assemblages. Transactions of the American Fisheries Society 121, 427–436.
PHILLIPS, R.W., LANTZ, R.L., CLAIRE, E.W. & MORING, J.R. 1975. Some effects of gravel mixtures on emergence of coho salmon and steelhead trout fry. Transactions of the American Fisheries Society 104, 461–466.
PIRES, A.M., MAGALHÃES, M.F., MOREIRA DA COSTA, L., ALVES, M.J. & COELHO M.M. 2008. Effects of an extreme flash flood on the native fish assemblages across a Mediterranean catchment. Fisheries Management and Ecology 15, 49–58.
POFF, N.L., ALLAN, J.D., BAIN, M.B., KARR, J.R., PRESTEGAARD, K.L., RICHTER, B.D., SPARKS, R.E. & STROMBERG, J.C. 1997. The natural flow regime. Bioscience 47, 769–784.

Review: Freshwater Ecosystems, Flooding and Vegetation
Science Report Methods to Assess, Model and Map the Environmental Consequences of Flooding: Literature review
(June 2008)
91
RAMSBOTTOM, D., NOTTAGE, A. and ACREMAN, M. 2005. Scoping Study (Phase 1) Environmental Consequences for Flood Risk Assessment, R&D Technical Report EX 5126, Environment Agency, Bristol, 62pp.
REID, M.A. & BROOKS, J.J. 2000. Detecting effects of environmental water allocations in wetlands of the Murray–Darling Basin, Australia. Regulated Rivers: Research and Management 16, 479–496.
RICHTER, B.D., BAUMGARTNER, J.V., WIGINGTON, R. & BRAUN, D.P. 1997. How much water does a river need? Freshwater Biology 37, 231–249.
SAMBROOK H.T. & COWX I.G. 2000). Wimbleball pumped storage scheme: integration of water resource management, engineering design and operational control to compliment the needs of the salmonid fisheries of the River Exe, UK. In: I.G. COWX (ed.) Management and Ecology of River Fisheries Oxford: Fishing News Books, Blackwell Science, pp. 177-200.
SATO, T. 2006. Dramatic decline in population abundance of Salvelinus leucomaenis after a severe flood and debris flow in a high gradient stream. Journal of Fish Biology 69, 1849–1854.
SCHULTZ, A.A., MAUGHAN, O.E. & BONAR, S.A. 2003. Effects of flooding on abundance of native and nonnative fishes downstream from a small impoundment. North American Journal of Fisheries Management 23, 503-511.
SEEGRIST, D.W. & GARD, R. 1972. Effects of floods on trout in Sagehen Creek, California. Transactions of the American Fisheries Society 101, 478–482.
SOLOMON D.J. & SAMBROOK H.T. 2004. Effects of hot dry summers on the loss of Atlantic salmon, Salmo salar, from estuaries in South West England Fisheries Management and Ecology 11, 353-363.
SPARKS, R.E. 1995. Need for ecosystem management of large rivers and floodplains. BioScience 45,168–182.
STANFORD, J.A., WARD, J.V., LISS, W.J., FRISSELL, C.A., WILLIAMS, R.N., LICHATOWICH, J.A. & COUTANT, C.C. 1996. A general protocol for restoration of regulated rivers. Regulated Rivers: Research and Management 12, 391–413.
SWALES, S., STOREY, A.W., RODERICK, I.D. & FIGA, B.S. 1999. Fishes of floodplain habitats of the Fly River system, Papua New Guinea, and changes associated with El Nino droughts and algal blooms. Environmental Biology of Fishes 54, 389–404.
THARME, R.E. 2003. A global perspective on environmental flow assessment: emerging trends in the development and application of environmental flow methodologies for rivers. Rivers Research and Applications 19, 397-441.
TOCKNER, K., & STANFORD, J.A. 2002. Riverine flood plains: present state and future trends. Environmental Conservation 29, 308-330.
TOCKNER, K., MALARD, F. & WARD, J.V. 2000b. An extension of the flood pulse concept. Hydrological Processes 14, 2861–2883.
TOCKNER, K., SCHIEMER, F. & WARD, J.V. 1998. Conservation by restoration: the management concept for a river floodplain system on the Danube River in Austria. Aquatic Conservation: Marine & Freshwater Ecosystems 8, 71–86.
TOWNSEND, C.R. 1989. The patch dynamics concept of stream community ecology. Journal of the North American Benthological Society 8, 36-50.

Science Report Methods to Assess, Model and Map the Environmental Consequences of Flooding: Literature review
(June 2008)
92
WAIDBACHER, H., HEPP, H., KOVACEK, H, LEUTGEB, H. & ZAUNER, G. 1989. The influence of bank structuring on fish populations. pp. 123-161 In: N. Hary & H.P. Nachtnebel (eds) Landscaping for the Altenworth backwater area — Eco-system study Altenworth. Österreichische Akademie der Wissenschaften, Veröffentlichungen des Österreichischen MaB-Programms, Band 14, Universitätsverlag Wagner, Innsbruck. (in German, English summary)
WARD, J.V., TOCKNER, K. & SCHIEMER, F. 1999. Biodiversity of floodplain river ecosystems: ecotones and connectivity. Regulated Rivers: Research and Management 15, 125–139.
WEBB, P.W. 1989. Station-holding by three species of benthic fishes. Journal of experimental biology 145, 303-320.
WELCOMME, R.L. & HALLS, A. 2004. Dependence of tropical river fisheries on flow. In Proceedings of the Second International Symposium on the Management of Large Rivers for Fisheries Volume II. (eds Welcomme R. & Petr, T.), pp. 267-283. RAP Publication 2004/17. FAO Regional Office for Asia and the Pacific, Bangkok, Thailand,
WENG, Z., MOOKERJI, N. & MAZUMDER, A. 2001. Nutrient-dependent recovery of Atlantic salmon streams from a catastrophic flood. Canadian Journal of Fisheries and Aquatic Sciences 58, 1672–1682.
WHITE, J.L. & HARVEY. B.C. 2001. Effects of an introduced piscivorous fish on native benthic fishes in a coastal river. Freshwater Biology 46, 987–995.
WOOD, P.J. & ARMITAGE, P.D. 1997. Biological effects of fine sediment in the lotic environment. Environmental Management 21, 203-217.

Review: Freshwater Ecosystems, Flooding and Vegetation
Science Report Methods to Assess, Model and Map the Environmental Consequences of Flooding: Literature review
(June 2008)
93
9 Issue 8: Macro-invertebrates (Aquatic Invertebrates) and the consequences of flooding
G. Old and M. Acreman
(Centre for Ecology and Hydrology)
9.1 Scope This section reviews the impacts of flooding on macroinvertebrates (aquatic invertebrates). Invertebrates were not considered in the scoping study (Ramsbottom et al., 2005). High river flows originating from overland/subsurface drainage of precipitation from upland areas is considered.
9.2 Consequences of flooding The ecological requirements of macro-invertebrate communities are complex and there are many gaps in our knowledge due to limited understanding of individual species requirements. Armitage and Ladle (1991) state that many invertebrates species have a relatively wide distribution and can tolerate a large range of environmental conditions (e.g. mayflies) while the distribution of others is more restricted and particular invertebrate species may only be found in abundance where certain conditions prevail. These invertebrates are adapted to their environment and any alterations as a result of flooding, for example, flow, substratum, vegetation, food supply, water quality, may alter the composition and abundance of stream benthos. With so many interacting factors, it is hard to establish causal relationships. River flow, temperature and the composition and stability of the substratum are the three dominant variables controlling macro-invertebrate distribution and survival (Boon, 1988; Cortes et al., 2002; Fleituch, 2003; Ward and Stanford, 1979; Lytle and Poff, 2004). Flow controls the availability and suitability of habitat for invertebrates. Wood et al. (2000) found that hydrological conditions played a dominant role in explaining variations in macro-invertebrate communities on the Little Stour with the presence or absence of high winter-spring discharge is one of the most important variables for describing late summer communities in groundwater-dominated rivers. Many invertebrate species require specific substrate types and assemblages may change in response to the deposition of fine sediment on the channel bed (Armitage and Ladle, 1991) or erosion by high flows. Furthermore, water quality may also be important as it determines the nutrient budget of the water.
Several literature reviews (Armitage, 1979; Brooker, 1981; and Ward, 1976;) have summarised the effects of flow on invertebrates, but there have been few attempts to establish causal relationships. Ward (1976) concluded that a constant compensation flow regime, in excess of natural low flows, results in enhanced numbers or biomass of macro-invertebrates, even when short-term fluctuations are imposed. However, some periodic flushing (natural spates) is desirable to prevent settling of fines clogging interstitial spaces in

Science Report Methods to Assess, Model and Map the Environmental Consequences of Flooding: Literature review
(June 2008)
94
the substratum. (Doegg and Koehn, 1994; Milhouse, 1998; Wood and Armitage, 1997). Nevertheless, if higher flood discharges are introduced species with lower flow preferences may give way to those capable of withstanding high flows, thereby substantially altering the composition of benthos (e.g. Cortes et al., 2002 and Fleituch, 2003).
Diptera, Olichoptera and Ephemeroptera may be enhanced or reduced and Plecoptera may be increased (Ward, 1976). Observations by Armitage (1978) comparing the fauna below Cow Green reservoir with the unregulated adjacent tributary of Maize Back, broadly confirms this. He noted more Oligochaeta, Chironomidae and Diptera and large numbers of microcrustaceans (from reservoir water) below the dam which may provide an enriched food supply for fish.
Comparison of RIVPACS predicted communities with samples from below Meldon dam in Devon showed that where flows are reduced and constant, there is a tendency for an increase in deposit feeding invertebrates and a reduction in grazers (NERC, 1989). Armitage (2006) studied the River Tees, downstream of Cow Green dam and compared it with Maize Brook, an unregulated tributary of the Tees. The regulated flow regime had less than half the number of flow events exceeding 3 times the median flow and half the overall flow CV compared to the unregulated flow regime. He found that after 30 years, 19 of the 31 common macroinvertebrate taxa had declined in abundance at the regulated site by a factor of 5 or more, including Hydra sp., Ancylus fluvitilis, Naididae, Heptagageniidae, Leuctridae and Brachycentrus subnubilus. There were fewer changes in the unregulated tributary. Armitage concluded that a narrower range of environmental conditions and increased flow stability had led to a dynamically fragile community, which is susceptible to perturbations because it has developed in their absence.
Six years of trials by the Environment Agency in Yorkshire have studied the response of macro-invertebrates and fish (Brown Trout) to altering steady state compensation releases from reservoirs (Christmas, pers comm.). The project showed the need to consider not only minimum flows, but that in some cases too much water can be a problem by reducing disturbance and causing competitive exclusion i.e. in under compensated situations invertebrate populations are more diverse, but at more risk, whereas in over compensated situations the populations are less diverse, but more stable. It is likely that in under compensated situations it is the unnatural element of the population that is at greatest risk from a large artificial release or a natural spate. The project is now considering freshets and a model will be available (Based on Excel) to guide what compensation regimes are beneficial for particular target species (e.g. brown trout, lamprey, crayfish and EPT taxa (Ephemeroptera (mayflies), Plecoptera (Stoneflies) and Tichoptera (caddisflies)).
Robinson et al. (2004a) suggest that a variable flow regime is required to sustain a natural macroinvertebrate community. Rempel et al. (1999 cited in Robinson et al., 2004b) found that in high flows in an unconfined large river, shoreline habitats can provide refugia for macroinvertebrates. Furthermore, Robinson et al. (2004b) report that macroinvertebrates are resilient to high flows and recover over time periods shorter than the generation times of most species. This is consistent with the organisms using flow refugia as well as morphological, behavioural and physiological traits to survive floods. Boon (1988) refers to invertebrates being particularly sensitive to flow changes at the beginning and end of a regulatory period. Flow also has an important impact through its control on the physical state of the substratum.
Review: Freshwater Ecosystems, Flooding and Vegetation
Science Report Methods to Assess, Model and Map the Environmental Consequences of Flooding: Literature review
(June 2008)
95
Armitage (1984) found that the most detrimental flow regime is one with substantial intermittent flow variations, such as ramping for hydropower generation, periodically exposing large areas of channel and leaving species stranded. Variations in velocity may destroy pool-riffle relationships and create bank instability. Also, very high flows can result in scouring of the bottom with a consequent decrease in aquatic vegetation and loss of fine organic food material
Clausen and Biggs (1997, 1998) considered the relation between descriptors of hydrological regime of 83 New Zealand rivers and streams and their periphyton and invertebrate ecology. A measure of the frequency of flows greater than 3 times the median flow was shown to be most closely linked to the ecology. With increasing frequency of floods greater than 3 times median flow periphyton biomass, species richness and diversity decreased and invertebrate density increased. However, most hydrological indices examined, including measures of average flow, flow variability, floods and low flows were found to be significantly correlated to periphyton biodiversity and/or total invertebrate density.
Wright et al. (2004) found that exceptionally high flows on the river’s Kennet and Lambourn during 2001 had no immediate detrimental consequences for the macro-invertebrate assemblages.
9.3 Data requirements and availability Information would be needed on the morphology of the river channel. Unconstrained channels will provide refuge for invertebrates during periods of high flow. Information on current invertebrate communities would be necessary.
9.4 Tools and techniques Wright et al. (1988) analysed macro-invertebrate data from 438 unpolluted rivers on 80 river systems in the UK. They found that the probability of occurrence and relative abundance of benthic macro-invertebrates was related to water quality (both natural, such as alkalinity and anthropogenic, such as BOD), substrate and flow. The results were used to develop the River Invertebrate Prediction and Classification System (RIVPACS) which predicts expected invertebrate communities.
Extence et al. (1999) found that changes in flow had significant impacts on macro-invertebrate communities in UK rivers. They developed the Lotic Invertebrate Index for Flow Evaluation (LIFE) score, which is an aggregate index of the taxa collected in a sample of macroinvertebrates from a river. It is a weighted average, where the weights reflect the perceived sensitivity of each taxon to higher water velocities and clean gravel/cobble substrates v. lower velocities and silty substrates. Initial research demonstrated that on several catchments with good data records, LIFE score responds to moving average summaries of the antecedent flows. Further research has shown that using large-scale datasets, it responds in the expected manner to the relative magnitude of antecedent low

Science Report Methods to Assess, Model and Map the Environmental Consequences of Flooding: Literature review
(June 2008)
96
flows, and that there is similarity in the responses of different catchment types. Some of the LIFE score component flow groups have been shown to respond to magnitude of high flow events. LIFE is affected by both habitat quality and flow history, and there is evidence from lowland wadeable streams that more modified channels have lower LIFE scores and a steeper response of LIFE to flow. Monks et al. (2006) found that specific median flow (Q50/drainage area) explained 38% of the variance in LIFE scores between sites in England and classification of the flow regime allowed between 18 and 72% of the ecological variance to be explained.
Attempts to establish flow requirements specifically for invertebrates are rare. Gore and Judy (1981) in Canada adapted physical habitat modelling to invertebrates. At the mirco scale, it is the flow velocity, shear forces and turbulence that determine its suitability for invertebrates to hold station and obtain resources (Crowder and Diplas, 2000; Lancaster and Mole, 1999). Armitage and Ladle (1991) present velocity and depth preferences for 5 invertebrate species (stoneflies Leuctra fusca and Isoperla grammatical; caddis-fly Polycentropus flavomaculatus and Rhyacophila dorsalis; and Pea mussel: Sphaerium corneum).
References
ARMITAGE, P.D. 1978 Downstram changes in the compostion numbers and biomass of bottom fauna in the Tees below Cow Green reservoir and in an unregulated tributary, Maize Beck in the first years after impoundment. Hydrobiologia 58, 145-156
ARMITAGE, P.D. 1979 Stream regulation in Great Britain. In: Ward, J.V. Standford J.A. (eds) The ecology of regulated streams. Plenum Publishing Corporation.
ARMITAGE, P.D. 1984 Environmental changes induced by stream regulation and their effect on lotic macroinvertebrate communities. In: Lillehammer, A. and Saltveit, S.J. (eds) Regulated Rivers.
ARMITAGE, P.D. 2006 Long term faunal changes in a regulated and an unregulated stream – Cow Green thirty years on. Rivers Research and Applications 22, 947-966
ARMITAGE, P.D. AND LADLE, M. 1991. Habitat preferences of target species for application in PHABSIM testing, in A. Bullock, A. Gustard and E.S. Granger. Instream Flow Requirements of Aquatic Ecology in Two British Rivers, Institute of Hydrology, Report No. 115, p. 87-122.
BARKER, J. (2006) http://www.glaucus.org.uk/lamprey2.htm
BAATTRUP-PEDERSEN, A. AND RIIS, T., 1999. Macrophyte diversity and composition in relation to substratum characteristics in regulated and unregulated Danish streams. Freshwater Biology 42 (2): 375-385.
BIZERE, J.R. 2000 International mechanisms for avoiding, mitigating and compensating the impacts of large dams on aquatic and related ecosystems and species. Thematic review II.1 World Commission on Dams, Cape Town.http://www.dams.org/kbase/thematic/tr21.htm
BOON, P.J. 1988. The impact of river regulation on invertebrate communities in the U.K., Regulated Rivers: Research and Management, Vol. 2, 389-409.
BROOKER, M.P. 1981 The impact of impoundments on the downstream fisheries and general ecology of rivers. Advances in Applied Biology, 6, 91-152

Review: Freshwater Ecosystems, Flooding and Vegetation
Science Report Methods to Assess, Model and Map the Environmental Consequences of Flooding: Literature review
(June 2008)
97
BURT, T.P. 1995. The role of wetland in runoff generation from headwater catchments. In: Hughes, J. and Heathwaite, L. (Eds). Hydrology and Hydrochemistry of British Wetlands. Wiley, Chichester, UK, 21-38.
BURT, T. P. AND HAYCOCK, N.E. 1996. Linking hillslopes to floodplains. In: Anderson, M.G.. Walling D.E. and Bates, P.D. (Eds) Floodplain Processes. Wiley, Chichester, UK, 461-493.
CHORLEY, R.J. 1978. The hillslope hydrological cycle. In: Kirkby, M.J. (Ed.) Hillslope Hydrology. Wiley, Chichester, UK, 1-42.
CLAUSEN, B. AND BIGGS, B.J.F. 1997. Relationships between benthic biota and hydrological indicies in New Zealand streams. Freshwater Biology 38: 327-342.
CLAUSEN, B. AND BIGGS, B.J.F. Streamflow variability indices for riverine environmental studies. In: Wheater, H. and Kirby C. (eds) Hydrology in a Changing Environment, John Wiley: Chichester, 357-364.
COLLINGWOOD, R.W. 1966. Water storage and reservoir management: Their effect on water quality. Association of River Authorities Year Book, 24-34.
CORTES, R.M.V., FERREIRA, M.T., OLIVEIRA, S.V. AND OLIVEIRA, D. 2002. Macroinvertebrate community structure in a regulated river segment with different flow conditions. River Res. Applic. 18: 367-382.
DOEG, T.J. AND KOEHN, J.D. 1994 Effects of draining and de-silting a small weir on downstream fish and invertebrates. Regulated Rivers; Research and Management, 9, 263-277.
EC (European Community). 2000. Water Framework Directive (2000/60/EC). Official Journal of the European Communities L327, 1-72.
EXTENCE, C., BALBI, D.M. AND CHADD, R.P., 1999. River flow indexing using British benthic macro-invertebrates: a framework for setting hydro-ecological objectives. Regulated River Research and Management., 15, 543-574
FLEITUCH, T. 2003. Structure and Functional Organisation of Benthic Invertebrates in a Regulated Stream. Internat. Rev. Hydrobiol., 88, 332-344.
GORE, J.A. AND JUDY, R.D. 1981 Predictive models of the benthic macro-invertebrate density for use in instream flow studies and regulated flow management. Canadian Journal of Fisheries and Aquatic Science, 38, 1363-1370.
JENSEN, A.J. 2003. Atlantic Sakmon (Salmo Salar) in the regulated river Alta: Effects of altered water temperature on Parr growth. River Res. Applic. 19: 733-747.
JOYCE, C.B. AND WADE, P.M. 1998. Wet grasslands: A European perspective. In: Joyce, C.B. and Wade, P.M. (Eds), European Wet Grasslands: Biodiversity, Management and Restoration. Wiley, Chichester, UK, 1–12.
KAY, A.L., JONES, R.G. AND REYNARD, N.S. 2006. RCM rainfall for UK flood frequency estimation. II Climate change results. Journal of Hydrology 318, 165-172.
KEOUGH, J.R., THOMPSON, T.A., GUNTENSPERGEN, G.R. AND WILCOX, D.A. 1999. Hydrogeomorphic factors and ecosystem responses in coastal wetlands of the Great Lakes. Wetlands 19(4), 821-834.
KIRKBY, M.J., 1985. Hillslope Hydrology, In: Anderson, M.G. and Burt, T.P. (Eds) Hydrological Forecasting. Wiley, Chichester, UK, 37-75.

Science Report Methods to Assess, Model and Map the Environmental Consequences of Flooding: Literature review
(June 2008)
98
LANCASTER, J. AND MOLE, A. 1999 Interactive effects of near-bed flow and substratum texture on the micro-distribution of lotic invertebrates. Archiv. Fur Hydrobiologie 146, 83-100.
LYTLE, D.A. AND POFF, N.L. 2004 Adaptation to natural flow regimes. Trends in Ecology and Evolution. 19, 94-100.
MCCARTNEY, M.P. 2000. The water budget of a headwater catchment containing a dambo. Physics and Chemistry of the Earth (B) 25(7-8), 611-616.
MILHOUSE, R.T. 1998 Modelling of instream flow needs: the link between sediment and aquatic habitat. Regulated Rivers: Research and Management, 13, 79-94.
MONKS, W.A., WOOD, P.J., HANNAH, D.M., WILSON, D.A., EXTENCE, C.A., CHADD, R.P. 2006 Flow variability and macro-invertebrate community response within riverine systems. Rivers Research and Applications, 22, 595-615.
NATURAL ENVIRONMENT RESEARCH COUNCIL 1989 Report of the Institute of Terrestrial Ecology 1988-1989, NERC, Swindon.
POSTEL, S. AND RICHTER, B. 2003. Rivers for life. Managing water for people and nature. Island Press, London. 253 pp.
RAMSBOTTOM, D., NOTTAGE, A. and ACREMAN, M. 2005. Scoping Study (Phase 1) Environmental Consequences for Flood Risk Assessment, R&D Technical Report EX 5126, Environment Agency, Bristol, 62pp.
REYNARD, N.S., PROUDHOMME, C. AND CROOKS, S.M. 2001. The flood characteristics of large UK rivers: potential effects of changing climate and land use. Climatic Change 48, 343-359.
ROBINSON, C.T., UEHLINGER, U. AND MONAGHAN, M.T. 2004a. Stream ecosystem response to multiple experimental floods from a reservoir. River Res. Applic. 20:359-377.
ROBINSON, C.T., AEBISCHER, S. AND UEHLINGER, U. 2004b. Immediate and habitat-specific responses of macroinvertebrates to sequential experimental floods. J.N.Am. Benthol. Soc. 23(4): 853-867.
THOMPSON, J.R. 2004. Simulation of wetland water level manipulation using coupled hydrological / hydraulic modelling. Physical Geography 25, 39-67.
THOMPSON, J.R., REFSTRUP SØRENSON, H., GAVIN, H. AND REFSGAARD A. 2004. Application of the coupled MIKE SHE / MIKE 11 modelling system to a lowland wet grassland in Southeast England. Journal of Hydrology 293, 151-179.
WARD, J.V. 1976 Effects of flow patterns below large dams on stream benthos; a review. Instream flow needs symposium viol 2 235-253. American Fish Society
WARD, J.V. STANDFORD J.A. 1979 The ecology of regulated streams. Plenum Publishing Corporation.
WILCOX, D.A. AND WHILLANS, T.H. 1999. Techniques for restoration of disturbed coastal wetlands of the Great Lakes. Wetlands 19(4), 835-857.
WOOD, P.J., ARMITAGE, P.D. 1997 Biological effects of fine sediment in the lotic environment. Environmental Management, 21, 203-217.
WOOD, P.D., AGNEW, M.D., PETTS, G.E. 2000 Flow variations and macroinvertebrate community response in a small groundwater-dominated stream in south-east England. Hydrological Processes, 14, 3133-3147.

Review: Freshwater Ecosystems, Flooding and Vegetation
Science Report Methods to Assess, Model and Map the Environmental Consequences of Flooding: Literature review
(June 2008)
99
WRIGHT, J.F., ARMITAGE, P.D., FURSE, M.T., AND MOSS, D. 1988 Predicting invertebrates communities using stream measurements. Regulated Rivers Research and Management 4, 147-155.
WRIGHT, J.F., CLARKE, R.T. GUNN, R.J.M., KNEEBONE, N.T. AND DAVY-BOWKER, J. 2004 Impact of major changes in flow regime on the macro-invertebrates assemblages of four chalk stream sites 1997-2001. Rivers Research and Applications, 20, 775-794.
Science Report Methods to Assess, Model and Map the Environmental Consequences of Flooding: Literature review
(June 2008)
100
10 Issue 9: Vegetation and plant ecology – environmental consequences of flooding
Owen Mountford
(Centre for Ecology and Hydrology)
General and specific impacts of flooding
Throughout this chapter preliminary ideas, presented in the scoping study, are developed (Ramsbottom et al., 2005).
Context: Disturbance – natural and artificial
Many natural landscapes and the habitats and vegetation that they contain are shaped by the regimes of flooding. These flooding regimes contribute to the ecological filters that sort species into communities through influencing the assembly rules by which plant communities come together. The role of disturbance in shaping habitats and the plant communities within them is manifest in the modern British landscape, but the role of natural perturbation also (such as flooding) is and has been vitally important. Indeed disturbance rather than competition may be the most important mechanism creating and sustaining variation in plant communities, especially when assessed in terms of ecological traits (Grime 2006). Evolution of plant species within systems subject to such long-term episodic disturbance is reflected in their dependence on the agent of disturbance for dispersal, the creation of the regeneration niche and/or the suppression of potential competitors. Thus flooding and the plants that occur within rivers and floodplains are intimately related, and attempts to regulate rivers and to divorce the river from its floodplain necessarily result in changes in the assemblage of plant species. When reviewing the impacts of floods on vegetation, inundation should be considered as a decisive environmental factor imposing selection pressure on species and thus on assemblages.
Reviews of the impact of inundation on floodplain, wetland and in-stream habitats are provided by Acreman (2000), Keddy (2000) Mitsch and Gosselink (1993) and Westlake et al. (1998), with an analysis of the physiological effects of inundation and the special characteristics of aquatic and amphibious habitats given in a series of contributions within a BES volume (Crawford 1987). Several works analyse the floodplain in terms management, floodplain-channel interactions, wetland functioning and impacts on particular biota (e.g. Bailey et al. 1998; Gowing et al. 2002; Hughes 2003; Prach et al. 1996). The role of flooding within the landscape, it control and its relationship with biodiversity protection are discussed by Bailey et al. (1998) and Purseglove (1989). The information relating to freshwater habitats, vegetation and the contribution of floods that has been marshalled by the Centre for Evidence-based Conservation (CEBC) is very sparse, comprising with some reviews and

Review: Freshwater Ecosystems, Flooding and Vegetation
Science Report Methods to Assess, Model and Map the Environmental Consequences of Flooding: Literature review
(June 2008)
101
protocols on the a) functioning of riparian corridors for population viability of species in fragmented habitats; and b) the impacts of salmon stocking in lakes on (inter alia) flora and vegetation.
Constraints on plants caused by flooding
J. Thompson pers. comm.. (2008) mentions that the responses of individual species to a wetland’s water level regime and therefore flooding are variable. He states that different plants have ‘preferred’ optimum positions on a gradient reflecting the duration and depth of inundation or soil saturation (e.g. Newbold and Mountford, 1997). Wetland plant communities and species have specific and critical ecohydrological requirements which include water quantity and quality factors (Wheeler et al., 2004).
The chief constraint upon vegetation resulting from flooding is mediated by waterlogging of the soil and the consequent production of anoxia in the plant root-zone, though the nature and degree of the impact will depend upon the timing and duration of the flood. In terms of plant physiology and the soil environment, flooding a) restricts gas-exchange, depleting oxygen and leading to the accumulation of CO2, methane and nitrogen; b) alters the absorption and reflectance of radiation; and c) alters soil structure through increased plasticity, the breakdown of the soil crumb-structure and swelling of soil colloids.
Where the duration of the flood is prolonged, further marked impacts occur, with changes in the soil microbial assemblages (obligate anaerobes such as bacteria replacing fungi) and consequent effects on the soil both specifically as a growing medium for plants and on the overall biogeochemical processes that determine availability of nutrients etc. Thus under prolonged flooding the decomposition rate of soil organic matter is reduced, nutrient and electrolyte concentrations within the soil solution are diluted, the redox potential of the soil is reduced, and pH tends to rise. At the same time, the plant stomata close with reduced rates of transpiration and photosynthesis, and in time (in non-tolerant species), flooding can lead to root death and wilting of the vegetation. Thus the primary disturbance caused by flooding leads to secondary effects that place further constraints on the species that can survive and the vegetation assemblages that develop (Table10.1).

Science Report Methods to Assess, Model and Map the Environmental Consequences of Flooding: Literature review
(June 2008)
102
Table 10.1 Primary constraints create a series of secondary constraints that determine the ecological attributes of wetland plant communities (after Keddy 2000).
Nature of flooding Primary Constraint Mean level Duration
Resultant wetland type
Secondary constraints
Secondary characteristics in plants
Flooding Low High (continuous)
Peatland Infertility Evergreenness Mycorrhizae Carnivory
Flooding High High (continuous)
Aquatic Low CO2 Low light Waves
Stress tolerance
Flooding Low (with seasonal highs)
Low (0.3 growing season)
Swamp Shade Disturbance
Gaps colonisation Shade tolerance
Flooding Medium Medium (0.5 growing season)
Marsh Disturbance Herbivory Fire
Buried rhizomes Annual shoots Seed banks
One may distinguish three basic strategies by which plant species deal with the fluctuating water-regime of a flood, where periods of perturbation alternate with periods of recovery (Prach et al. 1996):
I. Surviving in an inactive state e.g. as seeds
II Develop adaptations that enable the plant to tolerate the perturbation e.g. aerenchyma and/or ethylene-induced etiolation bringing the aerial parts of the plant above the flood level.
III. Escaping from the area affected, as plant fragments or other propagules.
However in floodplains most plant species are perennial and it is thus difficult for them to avoid flood episodes of unpredictable timing and duration. For this reason the adaptive strategy is the most commonly encountered resulting in distinctive flood-tolerant species and assemblages.
Distinctive floodplain habitats, communities and species in England and Wales
These constraints have led to a remarkable degree of adaptive variation in terms of species and communities, with distinctive variation across the range of flooding regimes. Flood (i.e. aeration) stress on vegetation can lead to the evolution of either stress-tolerance, with distinctive species of flooded sites or of stress-avoidance where the plants grow where or when the site is not inundated e.g. on baulks, batches and ridges within the floodplain or by germinating, flowering and/or fruiting during any dry season. Species of regularly or continuously inundated situations have particular adaptations (Crawford 1987) e.g. special tissue (aerenchyma tissue) that conducts atmospheric oxygen to the root zone and the products of respiration from the root zone to the atmosphere; and dependence upon flood-waters for dispersal of propagules (hydrochory).

Review: Freshwater Ecosystems, Flooding and Vegetation
Science Report Methods to Assess, Model and Map the Environmental Consequences of Flooding: Literature review
(June 2008)
103
Floodplains support characteristic types of wetland dependent upon when the flooding occurs and for how long. Thus distinctive habitats of seasonally flooded land include (European Topic Centre 2007):
• Rivers with muddy banks with goosefoot and bur-marigold vegetation
• Hydrophilous tall-herb fringe communities
• Alluvial meadows and lowland hay meadows
• Transition mires
• Calcareous fen
• Alluvial forests with alder, ash and willows; and
• Drawdown communities of rivers and lakes, some related to the distinctive turloughs of the Irish limestones.
The occurrence of these habitats is further influenced by human exploitation of the floodplain through farming etc (Mountford 2003). Since many floodplain plants are effectively dormant during the flood, the exposed phase of the floodplain will correspond to the growing season for vegetation and the active farming period. For example in England and Wales, lowland wet grasslands were often created by the partial reclamation of natural floodplain wetlands. Deliberate flood-control was combined with removal of the (natural) swamp, marsh or fen vegetation and their replacement by (semi-natural) wet meadows maintained by agricultural cutting for hay and/or grazing. Floodplain meadows were valuable agricultural land partly because the nutrient-rich silt they received from river flooding enabled them to sustain very high hay yields (Gowing et al. 2002). Flooding further affects the vegetation indirectly through its impact on other biota and on human activity e.g. through altering the access to the floodplain of wild or domestic grazing animals, or as agriculture became mechanised, by limiting the times when harvesting could take place. The determination of the plant assemblage by artificial regulation of flooding is especially clear in water-meadows, an engineered system of shallow surface-water channels that distributes water through the grassland and which allows or creates floods at pre-determined seasons. The channels can be used to direct water for irrigation, protection from frost and inputs of nutrient-rich sediment. The vegetation of flood meadows and water-meadows has special conservation designation both within the European Union (Natura 2000 habitat type 6510 Lowland hay meadows) and within England and Wales (MG4 Alopecurus pratensis-Sanguisorba officinalis grassland and MG8 Cynosurus cristatus-Caltha palustris grassland: Rodwell 1991-2000).
Alluvial and riparian forests were originally the natural cover of floodplains, but the fertility of the soils resulted in their virtual elimination through large parts of Europe, including the UK (Hughes 2003). Like flood meadows (Gowing @@@), the current area of floodplain forest is a tiny fraction of its original extent. The restoration of these extremely rich habitats and the conservation of those floodplain forests that remain is therefore a real priority. The FLOBAR2 (Hughes 2003) summarises the relationship between floodplain forests and hydrology, specifically in terms of flood regime, neatly encapsulating many of the factors that influence and alter all floodplain habitats. Floodplain forests require:
• Regular low to medium flows which replenish and maintain floodplain water-tables and allow established trees to grow.
• Periodic high flows (floods) which cause channel movement and sediment deposition, providing regeneration sites.

Science Report Methods to Assess, Model and Map the Environmental Consequences of Flooding: Literature review
(June 2008)
104
• Appropriately-timed high and low flows through the growing season to allow delivery of propagules to the floodplain and establishment of seedlings
• Gently-tapered flows after the flood peak so that water-tables recede gradually for successful establishment of seedlings.
• No high flows during the second half of the growing season, since such floods can destroy young seedlings.
• Regeneration sites that include some that a) are open to allow pioneer species to colonise; b) are moist throughout the first growing season; c) are near water’s edge that remain moist and catch organic debris; and/or d) have a range of sediment types to provide varied regeneration niches.
• Limited waterlogging.
Other habitats and vegetation types are typical of more natural situations such as the riparian zone of a river and the littoral zone of a lake, where these hydro-morphological elements often support transitional wetlands such as reedbeds (Maltby et al. 2005). Nonetheless, within England and Wales, such reedbeds have been brought into active management either for production or for nature conservation. The management combines elements of cutting with timing, duration and depth of flooding to produce particular desired outcomes in the reedbed (see Table 10.2).
Table 10.2 Suggested water-level guidelines for different objectives in reedbed management (after Hawke & José 1996; and Wheeler et al. 2004)
Main Regime Regime
Variant Summer level
Winter level Why? Comments
Winter Cut A +5 to 30cm Max +100cm Optimum for reed wildlife
Summer levels varied for habitat mosaic. If winter levels kept at ca +30cm, Bittern etc may use the reedbed
Winter Cut B Max +100cm 0 to ca –20cm Optimum for Reed harvest. Draw-down for machinery use and maximum butt length
High summer levels enhance Reed growth & reduce competition. Water >1m may inhibit growth
Winter Cut C Max +30cm Split-regime: +30cm ca -20cm
Integration of two Reed uses
Summer levels kept mod. high for growth Winter levels varied to provide some harvest and some wildlife use
Summer Cut +2cm to sub-surface
Max. +30cm For wildlife and harvests (Reed plus Great Fen Sedge & marsh-hay)
For late Great Fen Sedge harvest - winter levels <+30cm Summer draw-down allows cutting and minimises rutting

Review: Freshwater Ecosystems, Flooding and Vegetation
Science Report Methods to Assess, Model and Map the Environmental Consequences of Flooding: Literature review
(June 2008)
105
Variation in the impact of floods – timing and duration
Floods can therefore have very different effects on vegetation depending on when they occur in relation to the growing season, how long the flooding lasts and the depth to which the flood rises. Thus research by Gowing and colleagues on the flood meadows of the Thames catchment (Wheeler et al. 2004) revealed how short summer floods could have a very different impact to protracted winter floods, not only I the broad vegetation pattern, but also in the distribution of particular species of nature conservation interest e.g. Fritillaria meleagris. Indeed flooding in the middle of the British winter may cause little damage to the vegetation.
The interaction between flooding and oxygen availability is again clearly related to the timing and duration of the flood, with seasonal flooding in some wet forests resulting in better annual oxygen supply and thus increasing community productivity, whereas areas with stagnant water (even if shallower) producing protracted anoxia and reduced productivity. Patterns in floodplain vegetation can be related to the depth to which the land is inundated, with zones defined on whether the land is deeply or shallowly flooded. The typical dominants of these zones vary in their morphology with those in deeply-flooded sites have root and rhizome systems that are relatively superficial in the soil, whilst shallowly-flooded sites are dominated by species with deep underground systems (Westlake et al. 1998).
Classic research on the zonation of herbaceous swamp vegetation and wet grassland similarly showed evident relationships between depth of the seasonal flood and the composition of the community (Kopecký 1967). Flood duration determines the density of shoots and the survival of rhizomes, and floods in the first months of the growing season have the greatest impact. Research on wet grasslands in Somerset, Norfolk and Oxfordshire further confirmed the importance of the timing of the flood (Gowing et al. 1997, 2002; Mountford 2003). Where flooding and associated waterlogging continued into April and May, the vegetation was species-poor inundation grassland, whilst of the flood receded before the end of March, a much wider range of forbs and grasses were able to coexist (Wheeler et al. 2004). Thus flooding in the spring can have a marked selection impact, slowing (or extinguishing) the growth of intolerant species (of which there are many in the British flora) and enabling (the relatively few) tolerant species to replace them by getting an early start to growth.
Floods can cause tree-fall, opening up the canopy and leading to secondary succession, or deflecting succession at the strandline through large-scale input of new propagules and suppression of extant cover. Flooding is thus an integral part of floodplain dynamics determining both community type and structure. Extensive tree fall occurred in associated with the summer 2007 floods (e.g. poplar trees along the River Lambourn). Floods bear both organic detritus (plant litter etc) and nutrient-rich sediment, and the location and timing of the deposition of this material is central to understanding floodplain dynamics. Where, when and what height such detritus is deposited will have consequences for nutrient supply and export, for mineral cycling and for creating bare ground. Flood waters are also important in mechanically breaking down detritus particles, resulting in the export and import of sediment and associated nutrients between habitats.

Science Report Methods to Assess, Model and Map the Environmental Consequences of Flooding: Literature review
(June 2008)
106
Short duration floods during the growing season may be tolerated by many non-wetland plant species, but a prolonged flood will increasingly select for obligate wetland species. Flood water, especially with suspended sediment, intercepts light and reduces the amount available for photosynthesis to rooted plants. The primary impacts of flooding discussed above (anoxia and reduced photosynthesis) are however relatively more important than the reduced incidence of light. Deep floods may overtop lenticels or cut/broken stems that are conducting oxygen to the roots, and hence effectively suffocating the plants. Epiphytic species (e.g. algae, bryophytes and vascular plants) may also be affected.
Flooding and the in-stream habitat for plants
Flood impacts can be much more evident in macrophyte vegetation than in the periodically inundated flora of the floodplain, and depend on the force, depth and duration of the flood. These impacts are demonstrated through the dynamics and reproduction of the macrophytes and the marginal vegetation, and are closely dependent on the associated sediment load. High flows can remove macrophyte beds, reduce the vigour of existing beds and facilitate the colonisation of new areas from detached plant fragments, or from seed. Mechanical damage to aquatic and riparian vegetation, stripping plant material from the riverbed and itst margins, can lead to the creation of vegetation dams, and thus to new aquatic and marginal habitats. The deposition of sediment on submerged or marginal species can lead to localised extinction or changes in community structure. However, flood waters may also clear silt and aerate gravels. Prolonged periods of flooding, through increased depth and silt load can considerably reduce light penetration and impact photosynthesis.
There is variation in the responses of different swamp species such as Typha angustifolia and Phragmites australis to summer floods, with T. angustifolia floating upward with the flood and P. australis being damaged and with patches breaking off from the main reedbed (Westlake et al. 1998). However, Colin Studholme pers. comm.. (2008) has observed a contrasting response to prolonged (> 1 month) summer flooding in two Gloucestershire SSSI (Ashleworth Ham and Coom Hill). He reported that Typha had been killed but Phragmites survived. Observations are continuing at these sites to better understand the impacts of the summer 2007 floods on both SSSI. Work on the chalk-streams of England has shown that water-cress (Rorippa nasturtium-aquaticum s.l.) begins growth when water-levels fall, resulting in beds of Ranunculus penicillatus and silt reach the water surface trapping small detached ramets of watercress etc floating downstream. Watercress then grows rapidly until washed away by the next series of floods (normally in autumn). Some chalk-streams (e.g. winterbournes) dry out completely altering the competitive balance between true watercress and “fool’s watercress” (Apium nodiflorum), resulting in the latter coming to dominate the riverbed. The balance in these macrophyte elements of the river is determined by the river flood regime (Thommen and Westlake 1981).
The relationship between floods and hydrochory (i.e. the waterborne dispersal of propagules) is an area of active research. Flood flows play a major role in the transport and deposition of seeds along river corridors and in the structuring of riparian communities (Gurnell et al. 2008). Hydrochory may be fundamental to the functioning of some floodplain habitats e.g. floodplain forest vegetation is regenerated by propagules transported during floods (Hughes 2003). However the evidence that hydrochory can have potential use in effective habitat restoration in UK floodplains is only tentative (Manchester @@@). Floods can disperse seeds from other communities that are more adapted to the open sediment deposited with the seed, leading to deflected succession and new communities. Flooding after seed-set

Review: Freshwater Ecosystems, Flooding and Vegetation
Science Report Methods to Assess, Model and Map the Environmental Consequences of Flooding: Literature review
(June 2008)
107
may be vital to ensure dispersal of hydrochorous plants. Propagules vary in their buoyancy and investigation of riverbeds has demonstrated that numerous viable propagules are stored there (Gurnell et al. 2007). By comparing flooded and unflooded plots, Jansson et al. (2005) showed that water and fluvial disturbance are important for increasing species richness in riparian plant communities. This was attributed to the transport of buoyant seeds by floodwater. Combroux et al. (2001) also found floods to be fundamental in introducing new species to depositional areas, whilst research into invasive species (e.g. Fallopia japonica, Heracleum mantegazzianum, Impatiens glandulifera etc) indicates that many are transported by rivers when in flood and may come to dominate riparian vegetation (Prach et al. 1996; Tickner et al. 2001).
Data requirements and availability
Eco-hydrological guidelines for the management and restoration of habitats (aquatic, floodplain and mires including groundwater-fed and ombrogenous) have been developed for England and Wales in recent years (e.g. Barsoum et al. 2005; Mountford 2003; Mountford et al. 2005; Wheeler et al. 2004). These guidelines contain an outline of the types of data required to assess the impact of flooding on the species and communities concerned. Risk assessment for the flooding of vegetation ideally requires:
• For the floodplain, a terrestrial vegetation map of the site or sites that are threatened with flooding, with information on the vegetation communities present, or (if information on assemblages is absent) then an inventory of the species present, stressing dominants and noting any of nature conservation interest.
• For in-channel impacts, a map giving the spatial distribution of macrophyte patches with the identity of the dominant species in each patch, together with complementary spatial data on sediment type and flows. Data resources such as the JNCC rivers macrophyte database and the Environment Agency’s BIOs system are likely to be useful (N. Holmes Pers. comm.. 2008). These systems hold ‘JNCC’ type 500m survey data and ‘MTR/WFD’ 100m macrophyte data. Both have methods to see how recorded taxa are at variance from the ‘norm’ for their types but care is needed in interpretation.
• J. Thompson pers. comm. (2008) states that at the very least the distribution of vegetation communities within a site of interest according to the National Vegetation Communities System (NVC, Rodwell, 1992) would be required if approaches such as those advocated within the Ecohydrological Guidelines for Lowland Plant Communities (Wheeler et al., 2004) are to be employed to assess the impacts of flooding upon plants. He also says that for some sites, such as those which are currently subject to nature conservation initiatives, this information might be available from organisations such as Natural England or Wildlife Trusts.
• N. Holmes (pers. comm.. 2008) mentions that the variable level of detail from the Landsat ITE land cover systems may be useful for broad assessments of vegetation types.
• Detailed knowledge of the requirements of the plant communities, as documented in the National Vegetation Classification (Rodwell 1991-2000) or further developed in a quantitative form through the eco-hydrological guidelines (see above and Figure 10.1).
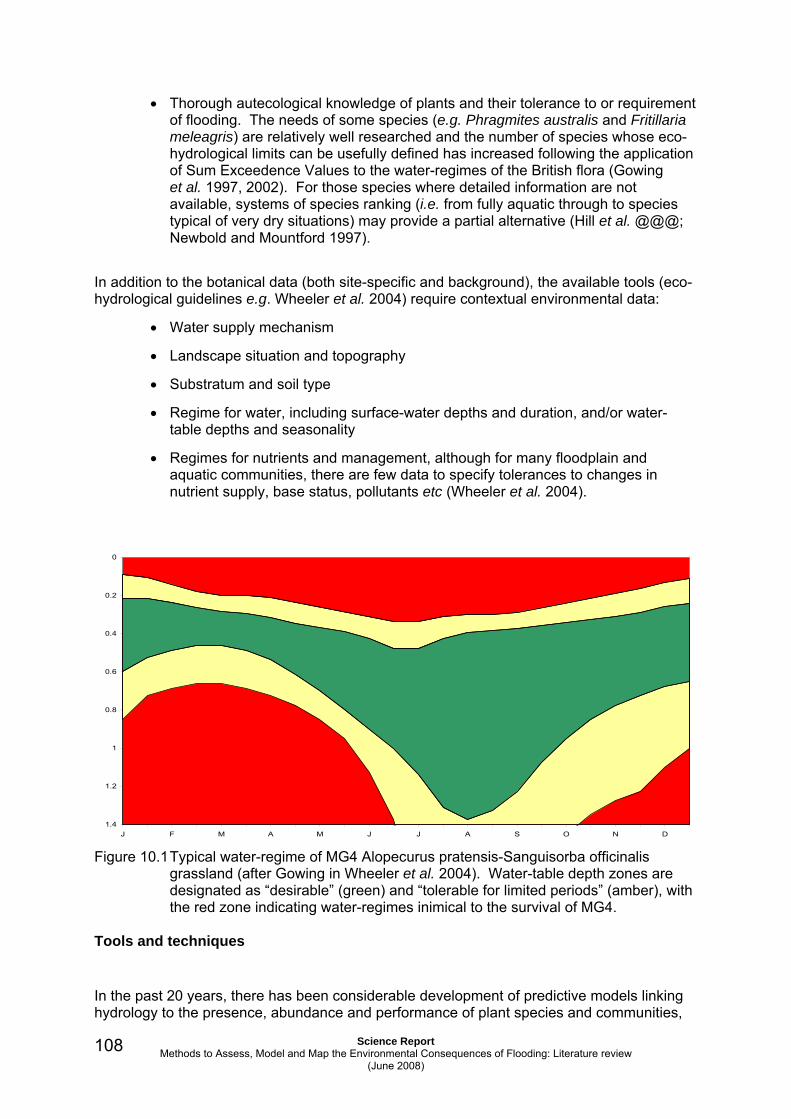
Science Report Methods to Assess, Model and Map the Environmental Consequences of Flooding: Literature review
(June 2008)
108
• Thorough autecological knowledge of plants and their tolerance to or requirement of flooding. The needs of some species (e.g. Phragmites australis and Fritillaria meleagris) are relatively well researched and the number of species whose eco-hydrological limits can be usefully defined has increased following the application of Sum Exceedence Values to the water-regimes of the British flora (Gowing et al. 1997, 2002). For those species where detailed information are not available, systems of species ranking (i.e. from fully aquatic through to species typical of very dry situations) may provide a partial alternative (Hill et al. @@@; Newbold and Mountford 1997).
In addition to the botanical data (both site-specific and background), the available tools (eco-hydrological guidelines e.g. Wheeler et al. 2004) require contextual environmental data:
• Water supply mechanism
• Landscape situation and topography
• Substratum and soil type
• Regime for water, including surface-water depths and duration, and/or water-table depths and seasonality
• Regimes for nutrients and management, although for many floodplain and aquatic communities, there are few data to specify tolerances to changes in nutrient supply, base status, pollutants etc (Wheeler et al. 2004).
0
0.2
0.4
0.6
0.8
1
1.2
1.4J F M A M J J A S O N D
Figure 10.1 Typical water-regime of MG4 Alopecurus pratensis-Sanguisorba officinalis
grassland (after Gowing in Wheeler et al. 2004). Water-table depth zones are designated as “desirable” (green) and “tolerable for limited periods” (amber), with the red zone indicating water-regimes inimical to the survival of MG4.
Tools and techniques
In the past 20 years, there has been considerable development of predictive models linking hydrology to the presence, abundance and performance of plant species and communities,

Review: Freshwater Ecosystems, Flooding and Vegetation
Science Report Methods to Assess, Model and Map the Environmental Consequences of Flooding: Literature review
(June 2008)
109
especially within the Netherlands and the UK (Witte 1998). The Dutch examples include WAFLO (Fahner and Wiertz 1987), WSN (Gremmen 1990), ICHORS (Barendregt and Nieuwenhuis 1993) etc. Within the UK, the development of such tools has been stimulated by agri-environment schemes and nature protection designations, notably in floodplain grasslands and grazing marsh (Gowing et al. 1997; Youngs et al. 1991). Amongst the most useful techniques for assessing flood tolerance is that of Sum Exceedence Values, which integrates the timing and duration of waterlogging due to flooding. The greatest detail available is for lowland wet grasslands, though comparable information has been assembled for other floodplain habitats. Other tools available for the British situation relate the occurrence of particular vegetation types to water-regime by categorising water-quality (in terms of pH and nutrient content) and water-supply mechanism and amount (Wheeler et al. 2004; Wheeler and Shaw 2001).
The general data requirements for these tools are outlined above. The outputs from these guidelines include water-regime parameters that indicate the water-depths (maximum, minimum, duration of exposure etc) that are favourable for the habitat, the depth-ranges that the habitat can tolerate for short periods, and those that are damaging for the habitat. Annex Figure 1 shows a ‘traffic light-based’ water level regime zones diagram that depicts the mean water table requirements for each month of the year. The green area shows preferred conditions. The amber area denotes conditions that are not ideal, but which the plants can withstand for short periods. The red area marks conditions which the vegetation cannot tolerate. These eco-hydrological modelling techniques have been to underpin attempts at habitat restoration on floodplains e.g. Arnaud et al. (2003). This approach for the Thames floodplain assessed the suitability of floodplains for species-rich meadow restoration, and found that both the maximum duration of flood events in autumn and winter and the depth of the groundwater table during the summer exceeded the requirements of the target species.
Bibliography and References:
ACREMAN, M.C. 2000. Wetlands and Hydrology. MedWet Conservation of Mediterranean Wetlands no. 10. Tour du Valat
Arnaud 2003
BAILEY, R.G., JOSÉ, P.V. AND SHERWOOD, B.R. (ed) 1998. United Kingdom Floodplains. Otley: Westbury
BARENDREGT, A. AND NIEUWENHUIS, J.W. 1993. ICHORS, hydro-ecological relations by multi-dimensional modelling of observations. In Hooghart, J.C. and Posthumus, C.W.S. (eds) The Use of Hydro-ecological Models in the Netherlands, pp 11-30, Delft. Proceedings and Information/TNO Committeeob Hydrological Research no. 47
@@@ BARSOUM et al. 2005. Eco-hydrological guidelines for wet woodland. English Nature
COMBROUX, I., BORNETTE, G., WILLBY, N. AND AMOROS, C. 2001. Regenerative strategies of aquatic plants in disturbed habitats: the role of the propagule bank. Archiv für Hydrobiologie, 152: 215-235.
CRAWFORD, R.M.M. (ed.) 1987. Plant Life in Aquatic and Amphibious Habitats. Oxford: Blackwell
European Topic Centre (Biodiversity) 2007. Interpretation Manual of European Union Habitats (EUR27). Paris: European Commission DG Environment.

Science Report Methods to Assess, Model and Map the Environmental Consequences of Flooding: Literature review
(June 2008)
110
FAHNER, F. AND WIERTZ, J. 1987. Handleiding bij het WAFLO-model. Technical report, RIN, Leersum
GOWING, D.J.G. @@@
GOWING, D.J.G, GILBERT, J.C., YOUNGS, E.G. AND SPOOR, G. 1997. Water regime requirements of the native flora - with particular reference to ESAs. Final report to Ministry of Agriculture, Fisheries and Food. Cranfield University.
GOWING, D.J.G., LAWSON, C.S., YOUNGS, E.G., BARBER, K.R., RODWELL, J.S., PROSSER, M.V., WALLACE, H.L. MOUNTFORD, J.O. AND SPOOR, G. 2002. The water regime requirements and the response to hydrological change of grassland plant communities. Final report for Defra-commissioned project BD1310. Silsoe: Cranfield University.
GOWING, D.J.G., TALLOWIN, J.R.B., DISE, N.B., GOODYEAR, J., DODD, M.E. AND LODGE, R.J. 2002. A review f the ecology, hydrology and nutrient dynamics of floodplain meadows in England. Peterborough: English Nature Research Report 446.
GREMMEN, N.J.M. 1990. Natuurtechnisch model voor de beschrijving en voorspelling van effecten van veranderingen in waterregime op de waarde van een gebied vanuit natuurbehoudsoogpunt. IV Herziening en verificatie van het model. Technical report Ir, SWNBL, Utrecht
GRIME, J.P. (2006). Trait convergence and trait divergence in herbaceous plant communities: Mechanisms and consequences. Journal of Vegetation Science, 17(2): 255-260
GURNELL, A.M., GOODSON, J., THOMPSON, K., CLIFFORD, N. AND ARMITAGE, P. 2007. The river-bed: a dynamic store for plant propagules? Earth Surface Processes and Landforms, 32, 1257-1272.
GURNELL, A., THOMPSON, K., GOODSON, J. AND MOGGRIDGE, H. 2008. Propagule deposition along river margins: linking hydrology and ecology. Journal of Ecology, 96: 553-565
HAWKE, C. AND JOSÉ, P.V.1996. The Reedbed Handbook. Royal Society for the Protection of Birds, Sandy, UK
HILL, M.O., ROY, D.B. AND PRESTON, C.D. 2004. PLANTATT @@@
HUGHES, F.M.R. (ed) 2003. The Flooded Forest: Guidance for Policy makers and river managers in Europe on the restoration of floodplain forests. FLOBAR2, Department of Geography, University of Cambridge, UK
@@@ JANSSON et al. 2005
KEDDY, P.A. 2000. Wetland Ecology: Principles and Conservation. Cambridge: Cambridge University Press.
KOPECKÝ, K. 1967. Einfluss langdauernder Ügerflutungen auf die Stoffproduktion von Glanzgraswiesen. Folia Geobotanica Phytotaxonomica, Praha, 2: 347-382
MALTBY, E., SGOURIDIS, F., NÉGREL, P. AND PETELET-GIRAUD, E. (ed) 2005. EUROWET: Integration of European wetland research in sustainable management of the water cycle. Final Report: (Volume 2. Synthesis of current wetland research in Europe, and Volume 3. Technical Guidance) EU Contract GOCE-CT-2003-505586
MANCHESTER, S.J. @@@ PhD thesis

Review: Freshwater Ecosystems, Flooding and Vegetation
Science Report Methods to Assess, Model and Map the Environmental Consequences of Flooding: Literature review
(June 2008)
111
MITSCH, W. J. AND GOSSELINK, J. G. 1993. Wetlands. Van Nostrand Reinhold, New York. Second Edition.
MOUNTFORD, J.O. (ed) (2003). Guidelines for the management and restoration of lowland wet grassland. London: Department for Environment, Food and Rural Affairs.
MOUNTFORD, J.O., ROSE, R.J. AND BROMLEY, J. 2005. Eco-hydrological Guidelines for Wet Heaths Phase 1. Final Report to English Nature.
NEWBOLD, C. AND MOUNTFORD, J.O. 1997. Water level requirements of wetland plants and animals. English Nature Freshwater Series No. 5. Peterborough: English Nature.
PRACH, K. JENÍK, J. AND LARGE, A.R.G. 1996. Floodplain Ecology and Management. Amsterdam: SPB Academic Publishing bv
PURSEGLOVE, J. 1989. Taming the Flood. Oxford: Oxford University Press
RAMSBOTTOM, D., NOTTAGE, A. and ACREMAN, M. 2005. Scoping Study (Phase 1) Environmental Consequences for Flood Risk Assessment, R&D Technical Report EX 5126, Environment Agency, Bristol, 62pp.
RODWELL, J.S. (ed) 1991-2000. British Plant Communities (5 vols). Cambridge: Cambridge University Press
THOMMEN, G.H. AND WESTLAKE, D.F. 1981. Factors affecting the distribution of populations of Apium nodiflorum and Nasturtium officinale in small chalk streams. Aquatic Botany, 11: 21-36
TICKNER, D.P., ANGOLD, P.G., GURNELL, A.M., MOUNTFORD, J.O. 2001 Riparian plant invasions: hydro-geomorphological control and ecological impacts. Progress in Physical Geography 25: 22-52.
WESTLAKE, D.F., KVĚT, J. AND SZCZEPAŃSKI, A. 1998. The Production Ecology of Wetlands: The IBP Synthesis. Cambridge: Cambridge University Press.
WHEELER, B.D., GOWING, D.J.G., SHAW, S.C., MOUNTFORD, J.O. AND MONEY, R.P. 2004. Ecohydrological Guidelines for Lowland Wetland Plant Communities. Eds Brooks, A.W., José, P.V. and Whiteman, M.I. Peterborough: Environment Agency (Anglian Region).
WHEELER, B.D. AND SHAW, S.C. 2001. A Wetland Framework for Impact Assessment at Statutory Sites in Eastern England. Environment Agency R&D Note. W6-068/TR1 and TR2.
WITTE, J-P.M. 1998. National water management and the value of nature. Wageningen: Agricultural University.
YOUNGS, E.G., CHAPMAN, J.M., LEEDS-HARRISON, P.B. AND SPOOR, G. 1991. The application of a soil physics model to the management of soil water conditions in wildlife habitats. In: Hydrological Basis of Ecologically Sound Management of Soil and Groundwater. Proc. of Vienna Symposium Aug 1991. IAHS Publ no 202, 91-

Science Report Methods to Assess, Model and Map the Environmental Consequences of Flooding: Literature review
(June 2008)
112
11 Issue 10: Hydro-ecological modelling for assessing consequences of flooding
Cedric Laize1 with contributions from Julian Thompson2
(1Centre for Ecology and Hydrology, 2University College London)
Scope
In the context of this project, the scope of hydro-ecological modelling is the calculation of the environmental consequences of flooding using the methods defining the relationship between flood characteristics and species/communities/habitats. This includes the consequences of flooding to the in-stream as well as floodplain environments and should consider:
• characteristics of floods (all types)
• numerical methods to compare flood characteristics with species, communities or habitats requirements
• methods to quantify these relationships
• methods to quantify uncertainty in the calculation of environmental consequences
Definitions and concepts
Typically, hydrological modelling estimates a specific aspect of the flow regime suitable for a given purpose; for example, dam design requires estimates of flood magnitude at given return periods, regardless of timing or duration. On the contrary, a key concept of hydro-ecological modelling is that all aspects of the flow regime can be of importance; for example, some fish species require enough flooding at a specific time of their life-cycle (the window being +/- 2 weeks) to promote spawning. In hydro-ecological modelling, magnitude, duration, timing, etc. play a role.
Hydro-ecology is a young scientific area compared to its parent fields hydrology and ecology. One of the first review of computer-based hydro-ecological models is hardly 15 year old (Johnson and Law, 1995). As a consequence, hydro-ecological models have not reached yet the level of maturity of, for example, industry-standard flow prediction packages like the Flood Estimation Handbook or Low Flow 2000. There are numerous hydro-ecological models; focusing on environmental flows, there are more than 200 methodologies (Tharme, 2003), while a more general review identified more than 4000 ecological models available today (Old et al., 2002).

Review: Freshwater Ecosystems, Flooding and Vegetation
Science Report Methods to Assess, Model and Map the Environmental Consequences of Flooding: Literature review
(June 2008)
113
However, these models are most often research models that can be implemented by few specialists; availability and usability of the models (i.e. licensing, documentation, etc.) to the EA is likely to be an issue. In addition, most models are site-specific and require extensive surveys to collect the necessary input data.
Detailing all these models is far beyond the scope of this initial literature review. There are three main types of models: statistical , process, and expert (Old et al., 2002); a couple of examples for each types are presented below. Where applicable, a mention is made for models with a focus on a specific target species (e.g. fish, invertebrates, plants) or zone (e.g. river bed, floodplain).
Review hydro-ecological modelling
Statistical models
RIVPACS (invertebrates) or HABSCORE (salmonids) are two examples of statistical models. Extensive site collected data from which statistical inferences between abiotic (e.g. river width and depth, substrate, air temperature) and biotic (e.g. invertebrate community) variables were derived allowing for an empirical prediction of the biotic factors at unknown sites. One shortcoming of this approach is that as one departs from the original datasets used to build the model, the validity of any extrapolation tends to fall; for example, HABSCORE was based on data on salmonid habitats and any extrapolation to river with no salmonids is not advisable.
PHABSIM combines a hydraulic model of a the reach being assessed and relationships defining how suitable are given hydraulic conditions for target species (‘suitbaility curves’; these are specific to each species and to each of their life stages). PHABSIM requires very detailed surveys of the reaches being modelled, so a simplified version has been developed (using fewer variables) when it is possible to do a full survey.
Process models
The model INFORM from Germany is a grid-based model specific to the floodplain and targeting plant species (Fuchs, 2001). This is an example of process-based model, i.e. usiing using determinsitic relationships. The model includes a series of pre-determined causal connections between environmental factors (e.g. duration of flooding, land use, soil texture) and vegetations units. Unfortunately, most of Fuchs’ subsequent publications are in German (http://www.bafg.de/cln_007/nn_162186/U2/DE/07__Mitarbeiter/Allgemeine__Modelle/fuchs__elmar.html). There seems to be a body of work in the same vein from the Netherlands (e.g. Ertsen, 1999) but this has not been reviewed to date.
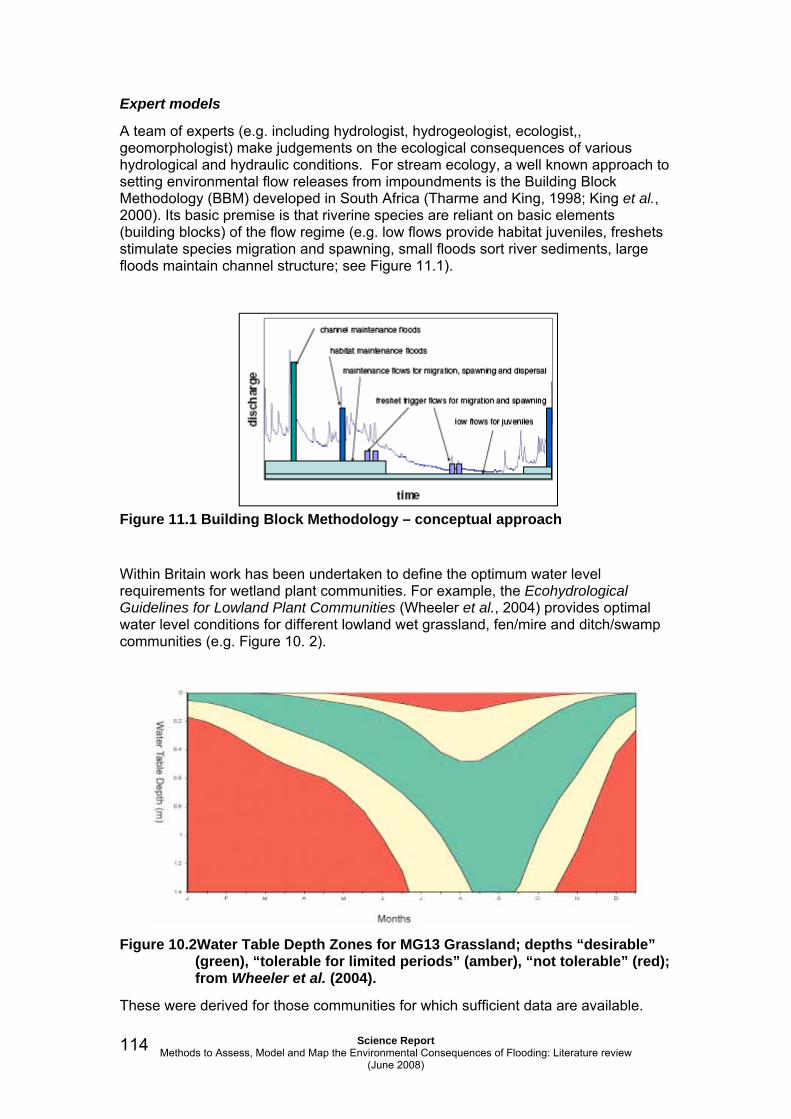
Science Report Methods to Assess, Model and Map the Environmental Consequences of Flooding: Literature review
(June 2008)
114
Expert models
A team of experts (e.g. including hydrologist, hydrogeologist, ecologist,, geomorphologist) make judgements on the ecological consequences of various hydrological and hydraulic conditions. For stream ecology, a well known approach to setting environmental flow releases from impoundments is the Building Block Methodology (BBM) developed in South Africa (Tharme and King, 1998; King et al., 2000). Its basic premise is that riverine species are reliant on basic elements (building blocks) of the flow regime (e.g. low flows provide habitat juveniles, freshets stimulate species migration and spawning, small floods sort river sediments, large floods maintain channel structure; see Figure 11.1).
Figure 11.1 Building Block Methodology – conceptual approach
Within Britain work has been undertaken to define the optimum water level requirements for wetland plant communities. For example, the Ecohydrological Guidelines for Lowland Plant Communities (Wheeler et al., 2004) provides optimal water level conditions for different lowland wet grassland, fen/mire and ditch/swamp communities (e.g. Figure 10. 2).
Figure 10.2Water Table Depth Zones for MG13 Grassland; depths “desirable”
(green), “tolerable for limited periods” (amber), “not tolerable” (red); from Wheeler et al. (2004).
These were derived for those communities for which sufficient data are available.

Review: Freshwater Ecosystems, Flooding and Vegetation
Science Report Methods to Assess, Model and Map the Environmental Consequences of Flooding: Literature review
(June 2008)
115
An interesting feature is that they capture the temporal element. For floodplain application, the concept could be adapted with flood levels instead of water table depths.
Data requirements and availability
Several methods require intensive site-specific surveys to collect the necessary input data while other approaches are based on more widely available datasets or can be simplified or regionalised (e.g. PHABSIM as described in Lamouroux and Capra, 2002; Lamouroux and Jowett, 2005; Booker and Acreman, 2007 (UK focus)). Regardless of their respective stengths and weaknessess, the latter group might be more suitable suitable for a UK-wide GIS-based system.
Gaps in the data limit the establishment of ecohydrological guidelines for other vegetation communities found within the three ecosystem groups (see above) and for others including wet heath and wet woodland where research is particularly lacking. As Wheeler et al., (2004) note, good quality time series of both hydrological (e.g. dipwell monitoring of groundwater depth) and water quality data is lacking for most wetlands in England and Wales which presents an obstacle for defining the ecohydrological regime requirements.
Regarding Quality Assurance, because of the younger nature of hydro-ecological modelling, one important criterion for selecting models is the availability of appropriate model documentation (beyond the scientific references).
References
BOOKER, D. J. & ACREMAN, M. C. (2007) Generalisation of physical habitat-discharge relationships. Hydrology and Earth System Sciences, 11, 141-157.
ERTSEN, A. C. D. (1999) Ecohydrological impact–assessment modeling: an example for terrestrial ecosystems in Noord-Holland, the Netherlands. Environmental Modeling and Assessment, 4, 13-22.
FUCHS, E. (2001) The flood-plain model INFORM for predicting ecological impacts caused by alterations in mean river stage. Hydro-ecology: Linking Hydrology and Aquatic Ecology.
JOHNSON, I. W. & LAW, F. M. (1995) Computer Models for Quantifying the Hydro-Ecology of British Rivers. Water and Environment Journal, 9, 290-297.
KING, J. M., THARME, R. E. & DE VILLIERS, M. S. (2000) Environmental flow assessments for rivers: manual for the building block methodology. Water Research Commission Report TT, 131.
LAMOUROUX, N. & CAPRA, H. (2002) Simple predictions of instream habitat model outputs for target fish populations. Freshwater Biology, 47, 1543-1556.
LAMOUROUX, N. & JOWETT, I. G. (2005) Generalized instream habitat models. Canadian Journal of Fisheries and Aquatic Sciences, 62, 7-14.

Science Report Methods to Assess, Model and Map the Environmental Consequences of Flooding: Literature review
(June 2008)
116
OLD, G. H., PACKMAN, J. C. & CALVER, A. N. (2002) State-of-art for biota (ecological) modelling. IN REFSGAARD, J. C. (Ed.) State-of-the-art report on quality assurance in modelling related to river basin management. HarmoniQuA Report. Copenhagen, Denmark, D-WP1-1.
THARME, R. E. (2003) A global perspective on environmental flow assessment: emerging trends in the development and application of environmental flow methodologies for rivers. River Research and Applications, 19, 397-441.
THARME, R. E. & KING, J. M. (1998) Development of the building block methodology for instream flow assessments and supporting research on the effects of different magnitude flows on riverine ecosystems. Water Research Commission Report, 98.
WHEELER, B. D., GOWING, D. J. G., SHAW, S. C., MOUNTFORD, J. O. & MONEY, R. P. (2004) Ecohydrological Guidelines for Lowland Wetland Plant Communities. Environment Agency (Anglian Region), Peterborough, UK.

Review: Freshwater Ecosystems, Flooding and Vegetation
Science Report Methods to Assess, Model and Map the Environmental Consequences of Flooding: Literature review
(June 2008)
117
12 Issue 11: Hydraulic modelling methods used in flood risk management
Darren Lumbroso
(Hydraulics Research Wallingford)
Scope of work
The purpose of this Technical Note is to review the hydraulic modelling techniques that could be used as tools to assess the environmental consequences of flooding. The note covers a variety of hydraulic models that are used in flood risk management in the UK. It details the outputs from the models and the data that are required to set the various models up. The review builds on the initial tabulation of hydraulic models presented in the scoping study (Ramsbottom et al., 2005).
Background to the outputs from hydraulic models
The outputs from hydraulic models used in flood risk management that could be used to assess the environmental consequences of flooding can be categorised as follows:
• Flood frequency;
• Flood extent;
• Flood depth;
• Flow velocity both in the channel and the floodplain;
• Duration of the flooding;
• Seasonality of the flooding;
• Impacts of change (e.g. climate change, land use) and interventions (e.g. flood risk management);
• Fluctuations in groundwater level as a result of flooding;
• Sediment transport.
This report details a range of hydraulic models currently used in the UK at a variety of spatial scales and details which of the above outputs are available from the different types of models. There are various types of flooding that models can be applied to including:
• Rivers;
• Estuaries;
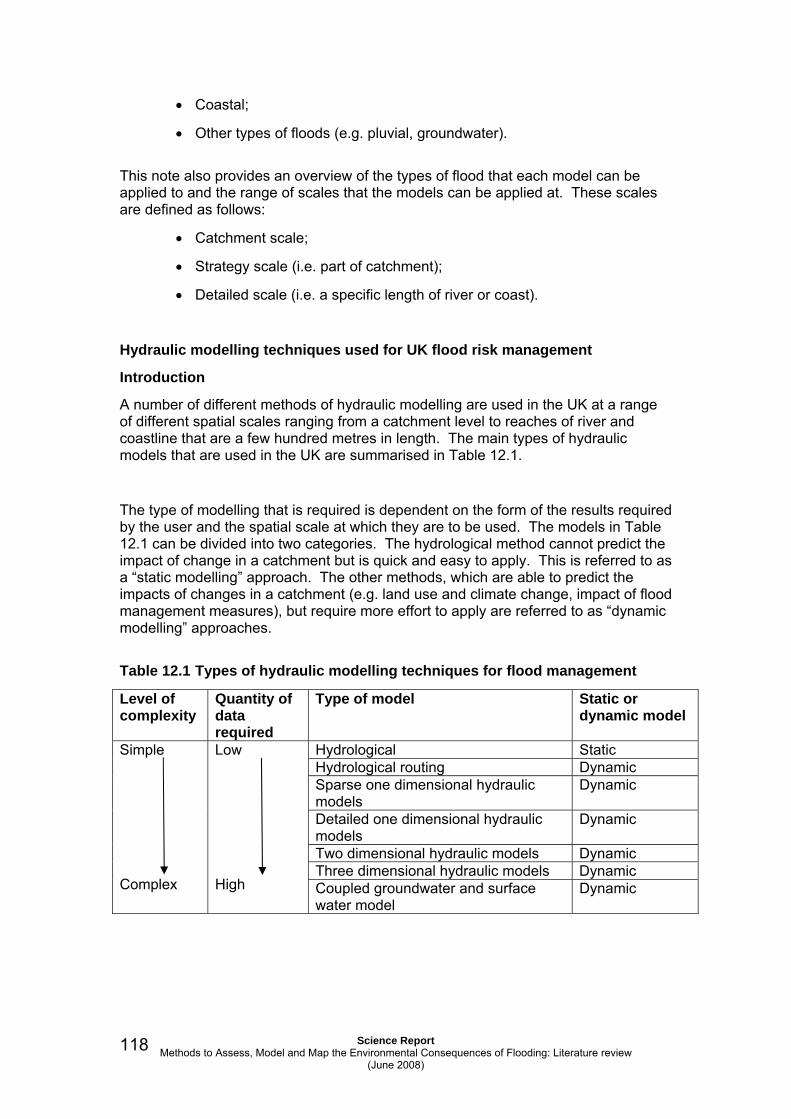
Science Report Methods to Assess, Model and Map the Environmental Consequences of Flooding: Literature review
(June 2008)
118
• Coastal;
• Other types of floods (e.g. pluvial, groundwater).
This note also provides an overview of the types of flood that each model can be applied to and the range of scales that the models can be applied at. These scales are defined as follows:
• Catchment scale;
• Strategy scale (i.e. part of catchment);
• Detailed scale (i.e. a specific length of river or coast).
Hydraulic modelling techniques used for UK flood risk management
Introduction
A number of different methods of hydraulic modelling are used in the UK at a range of different spatial scales ranging from a catchment level to reaches of river and coastline that are a few hundred metres in length. The main types of hydraulic models that are used in the UK are summarised in Table 12.1.
The type of modelling that is required is dependent on the form of the results required by the user and the spatial scale at which they are to be used. The models in Table 12.1 can be divided into two categories. The hydrological method cannot predict the impact of change in a catchment but is quick and easy to apply. This is referred to as a “static modelling” approach. The other methods, which are able to predict the impacts of changes in a catchment (e.g. land use and climate change, impact of flood management measures), but require more effort to apply are referred to as “dynamic modelling” approaches.
Table 12.1 Types of hydraulic modelling techniques for flood management
Level of complexity
Quantity of data required
Type of model Static or dynamic model
Hydrological Static Hydrological routing Dynamic Sparse one dimensional hydraulic models
Dynamic
Detailed one dimensional hydraulic models
Dynamic
Two dimensional hydraulic models Dynamic Three dimensional hydraulic models Dynamic
Simple Complex
Low High Coupled groundwater and surface
water model Dynamic

Review: Freshwater Ecosystems, Flooding and Vegetation
Science Report Methods to Assess, Model and Map the Environmental Consequences of Flooding: Literature review
(June 2008)
119
Hydrological modelling – static method
Background to method
Flood flows for return periods ranging from 1 in 2 years in 1 in 1,000 years can be obtained from the Centre for Ecology and Hydrology (CEH) National Flow Q(T) Grid. This was produced by CEH by automating the Flood Estimate Handbook (FEH) pooling - group method. The flow data are available on a 0.5 km x 0.5 km grid basis for the whole of the UK.
Water level versus discharge rating curves can be produced for the flow prediction points using one of the following methods:
• Use rating curves derived from detailed calibrated hydraulic models of rivers where they are available;
• Estimate floodplain cross sections from the nationally available digital terrain model (DTM) of the UK. Where no river cross-section data are available, site visits should be made to estimate the channel dimensions. Rating curves can be derived from cross-sections assuming normal depth.
The next step is to calculate water levels for a reference flood (e.g. the 1 in 100 year event) and plot this on a longitudinal section. Where detailed model and gauging station rating curves are used, adjustments should be made to take account of DTM datum differences. Once the rating curves are calibrated, water levels can be calculated for the full range of return periods. This modelling approach is only applicable to fluvial applications. It should be noted that the accuracy of the national DTM of the UK is low (e.g. ± 1 m vertical resolution). The Environment Agency’s Light Detection and Ranging (LiDAR) topographic coverage that has an accuracy of at least ±0.25 m, is increasing, although there is still far from national coverage.
Outputs
This method provides estimates of peak water levels for a range of return periods. Simple estimates of velocity could be made using this method. However, their accuracy is likely to be low and they will be averaged across the cross-section. The outputs are summarised in Table 12.2.
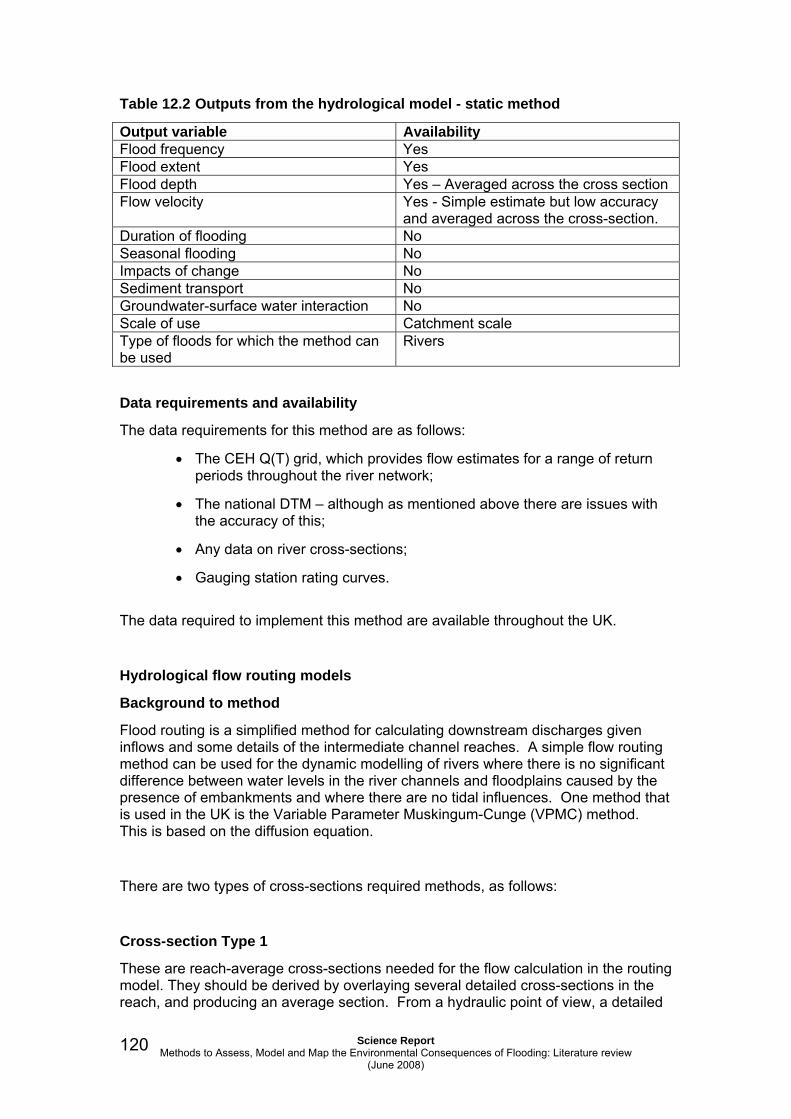
Science Report Methods to Assess, Model and Map the Environmental Consequences of Flooding: Literature review
(June 2008)
120
Table 12.2 Outputs from the hydrological model - static method
Output variable Availability Flood frequency Yes Flood extent Yes Flood depth Yes – Averaged across the cross section Flow velocity Yes - Simple estimate but low accuracy
and averaged across the cross-section. Duration of flooding No Seasonal flooding No Impacts of change No Sediment transport No Groundwater-surface water interaction No Scale of use Catchment scale Type of floods for which the method can be used
Rivers
Data requirements and availability
The data requirements for this method are as follows:
• The CEH Q(T) grid, which provides flow estimates for a range of return periods throughout the river network;
• The national DTM – although as mentioned above there are issues with the accuracy of this;
• Any data on river cross-sections;
• Gauging station rating curves.
The data required to implement this method are available throughout the UK.
Hydrological flow routing models
Background to method
Flood routing is a simplified method for calculating downstream discharges given inflows and some details of the intermediate channel reaches. A simple flow routing method can be used for the dynamic modelling of rivers where there is no significant difference between water levels in the river channels and floodplains caused by the presence of embankments and where there are no tidal influences. One method that is used in the UK is the Variable Parameter Muskingum-Cunge (VPMC) method. This is based on the diffusion equation.
There are two types of cross-sections required methods, as follows:
Cross-section Type 1
These are reach-average cross-sections needed for the flow calculation in the routing model. They should be derived by overlaying several detailed cross-sections in the reach, and producing an average section. From a hydraulic point of view, a detailed

Review: Freshwater Ecosystems, Flooding and Vegetation
Science Report Methods to Assess, Model and Map the Environmental Consequences of Flooding: Literature review
(June 2008)
121
cross-section is not essential, because the Type 1 section is only used for routing the flow down the river valley and not for water level prediction.
Cross-section Type 2
These are detailed cross-sections for producing rating curves at points on the river network. They can be derived directly from detailed data at the point, providing the section is reasonably representative of the reach.
The next step is to produce water level versus discharge rating curves for the flow prediction points using:
• Use rating curves derived from detailed calibrated hydraulic models of rivers where they are available:
• Estimate floodplain cross sections from the national available digital terrain model (DTM) of the UK. Where no river cross-section data are available, site visits should be made to estimate the channel dimensions. Rating curves can be derived from cross-sections assuming normal depth.
Outputs
This method provides the following:
• Estimates of peak water levels for a range of return periods;
• Estimates of the average velocity across the channel and the floodplain.
The outputs from hydrological flow routing models is summarised in Table 12.3.
Table 12.3 Outputs from the hydrological flow routing model
Output variable Availability Flood frequency Yes Flood extent Yes Flood depth Yes – Accuracy dependent upon the way
the model is schematised Flow velocity Yes - Simple estimate but low accuracy
and averaged across the cross-section. Duration of flooding Yes Seasonal flooding This is dependent on the hydrological
input Impacts of change No Sediment transport No Groundwater-surface water interaction No Scale of use Catchment and strategy scale Type of floods for which the method can be used
Rivers
Science Report Methods to Assess, Model and Map the Environmental Consequences of Flooding: Literature review
(June 2008)
122
Data requirements and availability
The key data requirements for this method are:
• The national DTM
• Any data on river cross-sections
• Calibration data for the reference flood
• Gauging station rating curves.
This data should be available throughout the UK. As detailed above there are issues with the accuracy of the national DTM.
One dimensional hydraulic models
Introduction
There are two forms of one dimensional hydraulic modelling technique. These are classified as follows:
• Detailed one dimensional hydraulic models;
• Sparse one dimensional hydraulic models.
Detailed one dimensional models of rivers and estuaries using software such as ISIS, HEC-RAS, MIKE-11 and SOBEK are widely used in the UK by the Environment Agency and consultants to model, rivers and floodplains. The sparse one dimensional modelling techniques was developed for Catchment Flood Management Plans (CFMPs) and does not appear to be widely used.
Background to detailed one dimensional hydraulic models
Detailed one dimensional hydraulic models are capable of performing one-dimensional water surface profile calculations for steady gradually varied flow in river channels and floodplains. Subcritical, supercritical and mixed flow regime water surface profiles can be estimated. Figure 12.1 shows the two dimensional characteristics of the interaction between the river channel and floodplain flows. As the water rises in the channel, the water moves away laterally way from the channel inundating the floodplain and filling the available storage areas. As the depth of water increases the floodplain begins to convey water downstream generally along a shorter path (DFloodplain) than that of the main channel (DChannel). This two dimensional flow field is often approximated by extending river cross-sections into the floodplain or by using off-channel ponding areas (i.e. flood cells or reservoirs). It should be noted that in many one-dimensional hydraulic models where flood cells are used only the water level is calculated as the velocity in the floodplain in these areas is assumed to be zero.

Review: Freshwater Ecosystems, Flooding and Vegetation
Science Report Methods to Assess, Model and Map the Environmental Consequences of Flooding: Literature review
(June 2008)
123
Figure 12.1 Plan view of channel and floodplain flows
In one dimensional hydraulic models the channel/floodplain problem is addressed in several different ways. One common approach is to ignore the overbank conveyance assuming that the floodplain is used only for storage. This assumption is suitable for large rivers that are confined by flood defences (e.g. Thames Estuary) and the remaining part of the floodplain is an off channel storage area. In some cases one dimensional models are set up in a pseudo-two dimensional form. This is done by dividing the channel, and the left and right bank floodplains into three separate channels. The left and right bank floodplain “channels” are then connected to the main channel by a series of weirs. This approach allows the left and right bank floodplain depths and velocities to be estimated separately.
The representation of floodplains is an important, as it affects wetlands and other floodplain features. For examples, mudflats and salt marshes are important feature of estuaries. However, in the case of estuaries one-dimensional models are not suitable for managed realignments, where the main flows are lateral and not parallel to the channel.
It should be noted that most one-dimensional hydraulic models (e.g. ISIS, HEC-RAS, SOBEK, MIKE-11) incorporate a module that allows sediment transport and in some cases changes to the river bed form (in terms of aggradation and degradation) to be estimated.
Outputs from detailed one dimensional hydraulic models
This method provides the following:
• Estimates of peak water levels for a range of return periods;
• Estimates of the average velocity across the river channel and the floodplain.
Edge offloodplain
DChannel
DFloodplain
Edge offloodplain
Main channelflow
Floodplainflow
Edge offloodplain
DChannel
DFloodplain
Edge offloodplain
Main channelflow
Floodplainflow
Science Report Methods to Assess, Model and Map the Environmental Consequences of Flooding: Literature review
(June 2008)
124
It should be noted that in the case of pseudo-two dimensional models water levels and mean velocities for the channel, and the left and right bank floodplain can be computed separately. The outputs from hydrological flow routing models is summarised in Table 12.4.
Table 12.4 Outputs from a detailed one dimensional hydraulic model
Output variable Availability Flood frequency Yes Flood extent Yes Flood depth Yes – Accuracy dependent upon the way
the model is schematised Flow velocity Yes – In a pseudo two dimensional
model separate velocities for the two floodplains and the main channel can be obtained. For a simpler model there are methods in some one dimensional models of estimating the velocity across the channel.
Duration of flooding Yes Seasonal flooding This is dependent on the hydrological
input Impacts of change Yes Sediment transport Yes Groundwater-surface water interaction No Scale of use Catchment, strategy and detailed scale Type of floods for which the method can be used
Rivers, estuaries and in some cases coastal floods
Data requirements and availability for detailed and detailed one-dimensional models
Thus the key data requirements for this method are:
• Floodplain topographic data;
• Channel cross-sections.
This quality and availability of data will vary throughout the UK. However, many of these data are readily available
Background to sparse one-dimensional hydraulic modelling
For Catchment Flood Management Plans in England and Wales a sparse one-dimensional hydrodynamic approach has been developed. These are hydrodynamic models where the cross-section spacing and the size of floodplain reservoirs are maximised so that the hydrodynamic model can cover the whole catchment rather than a reach of a few kilometres. For sparse hydrodynamic models used to model embanked rivers and estuaries that include flood cells, the two most important schematisation decisions are the size of the flood cells and the spacing of river cross sections.

Review: Freshwater Ecosystems, Flooding and Vegetation
Science Report Methods to Assess, Model and Map the Environmental Consequences of Flooding: Literature review
(June 2008)
125
With regard to floodplain cell size:
• Where the longitudinal flood plain slope is relatively flat, for example tidal reaches, then large flood plain cells of 10 km2 or more may be adopted;
• Where the longitudinal flood plain slope is steeper, then much smaller flood cells are required to minimise the short cutting of flood routes. For example, the suggested flood plain cells size for a river, where the slope is about 1:2500, is approximately 2 km2 to 5 km2.
The spacing of river cross sections has a less significant influence on the accuracy of results than size of flood cell. Recommended spacings are as follows:
• Where the longitudinal river slope is relatively flat, then spacings of up to 5 km may be adopted;
• Where the longitudinal slope is steeper, a closer spacing is required. For example, the suggested spacing for a river, where the slope is about 1:2,500, is approximately 1 km.
The numerical solution of the hydrodynamic equations may necessitate a closer spacing than these recommendations and in this case it is suggested that interpolated sections are used. Structures that significantly affect high flow water levels, such as weirs and sluices, will need to be represented in the model. Figure 12.2 shows a flow diagram providing recommendations of how the spacing of cross-sections and size of flood cell should be chosen for sparse hydraulic models.
It should be noted that the Environment Agency and their consultants do not appear to have used sparse modelling very much. The reasons for this could be that it requires a considerable amount of judgement to set up a sparse one-dimensional hydrodynamic so that it captures the main features of the system and that is unfamiliar to many hydraulic modelling teams.
(Source: Defra/Environment Agency) Figure 12.2 Recommended sparse hydrodynamic modelling approach for embanked
rivers
Areas where the floodplain and main channelare to be considered separately
Floodplainlongitudinal
slope?
Longitudinalriver slope?
Floodplain cell size Spacing of river sections
Large cell size e.g. 10 km2 Moderate sizecells size e.g. 2 to 5 km2
Sparse e.g. 1 km spacing Very sparse e.g. 2 to 5km
Flat Slope <1:2,500
InclinedSlope >1:2,500
Flat Slope <1:2,500
InclinedSlope >1:2,500

Science Report Methods to Assess, Model and Map the Environmental Consequences of Flooding: Literature review
(June 2008)
126
Outputs
This method provides the following:
• Estimates of peak water levels for a range of return periods;
• Estimates of the average velocity across the river channel and the floodplain.
The outputs from a sparse one dimensional hydraulic model are summarised in Table 12.5. It should be noted that the outputs from a sparse on dimensional hydraulic model will be less accurate than from a detailed one dimensional hydraulic model.
Table 12.5 Outputs from a sparse one dimensional hydraulic model
Output variable Availability Flood frequency Yes Flood extent Yes Flood depth Yes – Accuracy dependent upon the way
the model is schematised Flow velocity Yes Duration of flooding Yes Seasonal flooding This is dependent on the hydrological
input Impacts of change Yes Sediment transport Yes Groundwater-surface water interaction No Scale of use Catchment and in some cases strategy
scale Type of floods for which the method can be used
Rivers and estuaries
Data requirements and availability for detailed and sparse one-dimensional models
Thus the key data requirements for this method are:
• Floodplain topographic data;
• Channel cross-sections.
•
This quality and availability of data will vary throughout the UK. However, many of these data are readily available

Review: Freshwater Ecosystems, Flooding and Vegetation
Science Report Methods to Assess, Model and Map the Environmental Consequences of Flooding: Literature review
(June 2008)
127
Two dimensional hydraulic models
Background to two dimensional hydraulic models
Two dimensional hydraulic models simulate the hydrodynamics of water using a solution of the full free surface flow equations. A two dimensional model usually is structured as a grid of square cells or triangles that covers the area of interest. The size of the grid is dependent upon the resolution of the results that are required by the user. A two-dimensional hydraulic model uses the channel cross-section in combination with topographic data for the floodplain to calculate the depth and velocity that would occur at a set of points in the stream channel for a given discharge. The velocity calculated for each location is depth averaged; that is, one velocity is calculated for each x,y spatial location. A two dimensional modelling approach allows average depth and velocity values to be predicted more accurately than a one dimensional model. Two dimensional models are now widely used in the UK for fluvial, estuary and coastal flood risk applications.
For the modelling of rivers a coupled one dimensional – two dimensional hydraulic model is likely to provide the best modelling approach, with currently available technology, for complex floodplain configurations. There are several pieces of software (e.g. InfoWorks RS 2D and TuFlow) that allow the main river channel and structures to be modelled using a one dimensional model and the floodplains to be modelled using a two dimensional grid.
Outputs
This method provides the following:
• Estimates of peak water levels for each cell;
• Estimates of the average velocity across the floodplain for a specific cell.
A typical output from a two-dimensional model showing the results in terms of water depth are shown in Figure 12.3. The outputs from a two dimensional hydraulic model is summarised in Table 12.6.
Table 12.6 Outputs from a two dimensional hydraulic model
Output variable Availability Flood frequency Yes Flood extent Yes Flood depth Yes – Available on a two dimensional
grid basis Flow velocity Yes – Available on a two dimensional
grid basis Duration of flooding Yes Seasonal flooding This is dependent on the hydrological
input Impacts of change Yes Sediment transport Yes – Available on a two dimensional
grid basis Groundwater-surface water interaction No
Science Report Methods to Assess, Model and Map the Environmental Consequences of Flooding: Literature review
(June 2008)
128
Scale of use Detailed scale and in some cases strategy scale. Dependent on the size of the catchment and the resolution required they could also be used at this scale.
Type of floods for which the method can be used
Rivers, estuaries and coastal floods. In some cases they may be used to estimate pluvial flood extents and depths.
Data requirements and availability
Thus the key data requirements for this method are:
• A detailed DTM of the floodplain/estuary;
• Channel cross-sections.
The availability of these data in the UK is variable, although many main rivers in England and Wales have been modelled.
Three dimensional hydraulic models
Background to method
One and two-dimensional models cannot represent accurately the full details of flow around structures and the interaction between the main channel and floodplain flows. These flows are fully three dimensional and there is a need to use three-dimensional modelling to fully understand the flow behaviour in these situations. There are numerous three dimensional hydraulic models available. Software such as Flow 3D, CFX and Phoenics can all model complex free water surfaces. It should be noted that there are numerous ways to model the free surface flow and turbulence in three dimensional models. The performance and accuracy of the three dimensional model will be dependent upon the method that is used to model the free surface and turbulence terms. Many three dimensional models can also model sediment transport. Three dimensional models are often used to model sediment transport in estuaries.
A typical view of the computational grid for a three dimensional model for a few kilometres of the River Rhine is shown in Figure 12.3. The amount of data required for a three dimensional model means that they are limited to fairly short reaches of river. For most cases, for flood risk management applications one and two dimensional models will continue to be the most appropriate tools.

Review: Freshwater Ecosystems, Flooding and Vegetation
Science Report Methods to Assess, Model and Map the Environmental Consequences of Flooding: Literature review
(June 2008)
129
This map is reproduced from the OS map by HR Wallingford with the permission of the Controller of Her Majesty's Stationery Office, Crown Copyright. Unauthorised reproduction infringes Crown Copyright and may lead to prosecution or civil proceedings: Licence Number 100019904 Figure 12.3 Typical water depths produced by a 50 m x 50 m grid two-
dimensional hydraulic model for the 1 in 100 year flood for the River Thames floodplain at Shepperton
(Source: Stoesser et al) Figure 12.4 Velocities generated by a three dimensional model of the River
Rhine
Water depth (m)0.0 to 0.2
> 0.2 to 0.5> 0.5 to 1.0
> 1.0 to 2.0> 2.0
Water depth (m)0.0 to 0.2
> 0.2 to 0.5> 0.5 to 1.0
> 1.0 to 2.0> 2.0

Science Report Methods to Assess, Model and Map the Environmental Consequences of Flooding: Literature review
(June 2008)
130
Outputs
The outputs from a three dimensional model include:
• A three dimensional representation of flow velocities (i.e. variation in a stream-wise and cross-stream wise direction);
• Water level and depth for each cell in the model.
The outputs from a three dimensional hydraulic model are summarised in Table 12.7.
Table 12.7 Outputs from a three dimensional hydraulic model Output variable Availability Flood frequency Yes Flood extent Yes Flood depth Yes – Available on a three dimensional
grid basis Flow velocity Yes – Available on a three dimensional
grid basis Duration of flooding Yes Seasonal flooding This is dependent on the hydrological
input Impacts of change Yes Sediment transport Yes – Available on a three dimensional
grid basis Groundwater-surface water interaction No Scale of use Detailed scale Type of floods for which the method can be used
Rivers, estuaries and coastal floods
Data requirements
To utilise three dimensional hydraulic models high resolution channel and floodplain topographic data are required. Information on the vegetation in the floodplain is also needed to accurately represent the roughness of the channel and the floodplain. Information to construct three dimensional models of rivers is limited, although three dimensional modelling of estuaries tends to be more prevalent.
Coupled surface water and groundwater models
Background to method
Coupled surface water and groundwater models are these useful where there is a significant degree of interaction between the surface water and the groundwater. This is often characterised by areas that have aquifers with a high hydraulic conductivity. In the USA coupled surface water and groundwater models have been applied to wetlands in Florida that cover areas of some 1,100 km2. The main advantage of the methods is that they can provide a more accurate representation of
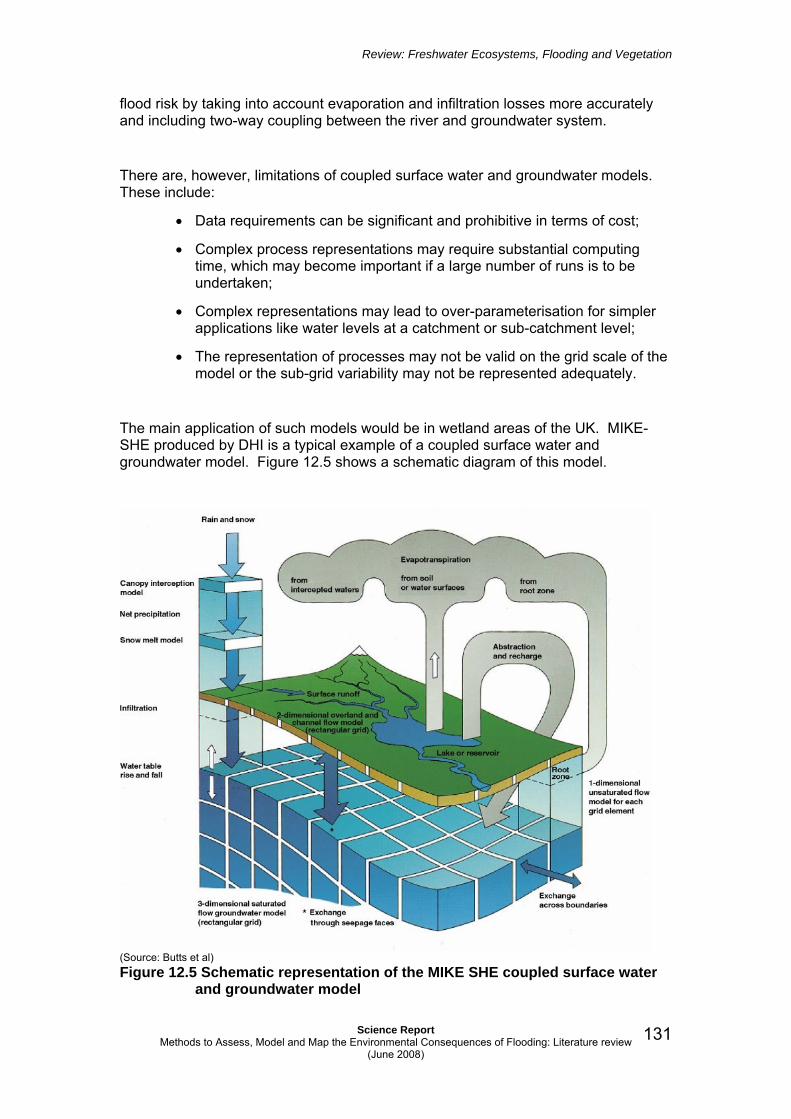
Review: Freshwater Ecosystems, Flooding and Vegetation
Science Report Methods to Assess, Model and Map the Environmental Consequences of Flooding: Literature review
(June 2008)
131
flood risk by taking into account evaporation and infiltration losses more accurately and including two-way coupling between the river and groundwater system.
There are, however, limitations of coupled surface water and groundwater models. These include:
• Data requirements can be significant and prohibitive in terms of cost;
• Complex process representations may require substantial computing time, which may become important if a large number of runs is to be undertaken;
• Complex representations may lead to over-parameterisation for simpler applications like water levels at a catchment or sub-catchment level;
• The representation of processes may not be valid on the grid scale of the model or the sub-grid variability may not be represented adequately.
The main application of such models would be in wetland areas of the UK. MIKE-SHE produced by DHI is a typical example of a coupled surface water and groundwater model. Figure 12.5 shows a schematic diagram of this model.
(Source: Butts et al) Figure 12.5 Schematic representation of the MIKE SHE coupled surface water
and groundwater model

Science Report Methods to Assess, Model and Map the Environmental Consequences of Flooding: Literature review
(June 2008)
132
Outputs
A coupled surface water and groundwater model will provide the following outputs:
• A two dimensional representation of flow velocities (i.e. in a horizontal direction) if a two dimensional model is being used;
• Two dimensional flows;
• Water level and depth;
• Fluctuations in groundwater levels.
The outputs from a three dimensional hydraulic model is summarised in Table 12.8.
Table 12.8 Outputs from a coupled surface water – groundwater model
Output variable Availability Flood frequency Yes Flood extent Yes Flood depth Yes – Normally available on a two
dimensional grid basis, however, this is dependent upon the type of surface water hydraulic model used
Flow velocity Yes – Normally available on a two dimensional grid basis, however, this is dependent upon the type of surface water hydraulic model used
Duration of flooding Yes Seasonal flooding This is dependent on the hydrological
input Impacts of change Yes Sediment transport Yes – Normally available on a two
dimensional grid basis, however, this is dependent upon the type of surface water hydraulic model used
Groundwater-surface water interaction Yes – Groundwater fluctuation is normally available on a three dimensional grid basis, however, this is depend upon the type of groundwater model used.
Scale of use Catchment, strategy and detailed scale Type of floods for which the method can be used
Rivers, estuaries, coastal and groundwater floods

Review: Freshwater Ecosystems, Flooding and Vegetation
Science Report Methods to Assess, Model and Map the Environmental Consequences of Flooding: Literature review
(June 2008)
133
Data requirements and availability
The data requirements for a coupled surface water and groundwater model include:
• Rainfall;
• Potential evapotranspiration;
• River channels surveys;
• Details of the river bed lining and permeability;
• Details of the saturated and unsaturated zone;
• DTM for the area being modelled;
• Hydraulic characteristics of the underlying aquifer;
• Location of groundwater abstractions;
• Details of the vegetation cover.
The availability of this information in the UK is variable. The availability of data for a coupled surface water and groundwater model will also be dependent on the scale at which the model is to be employed. For example for a high resolution model at a catchment scale it may not be cost effective to obtain the above data at a sufficient resolution for the required application.
Conclusions
A summary of the outputs from various models is given in Table 12.9. Over the last 20 years, the options available to model rivers and coastal flooding have increased significantly. A more detailed hydraulic model usually provides better results than a simpler one. However, an increase in detail, both in terms of finer resolution and in physical processes often requires more computer time, more data, and sometimes more unknown coefficients that need to be calibrated. It should be noted that uncertainty in actual physical conditions (e.g. channel and floodplain roughness coefficients), inflow and parameters often remains. These may dominate the uncertainty of the results.

Science Report Methods to Assess, Model and Map the Environmental Consequences of Flooding: Literature review
(June 2008)
134
Table 12.9 A summary of the outputs, scale of use and type of flood that hydraulic models relevant to assessing environmental consequences can be used for
Type of hydraulic model Output variable
Hydrological
Hydrological
routing
Detailed one
dimensional
hydrodynamic
models
Two dim
ensional hydrodynam
ic m
odels
Three dim
ensional hydrodynam
ic m
odels
Coupled
groundwater and
surface water
model
Flood frequency
No Yes Yes Yes Yes Yes
Flood extent Yes Yes Yes Yes Yes Yes Flood depth Yes Yes Yes Yes Yes Yes Flow velocity Yes Yes Yes Yes Yes Yes Duration of flooding
No Yes Yes Yes Yes Yes
Seasonal flooding
No Depends on the hydrological input
Impacts of change
No Yes Yes Yes Yes Yes
Sediment transport
No No Yes Yes Yes Yes
Groundwater-surface water interaction
No No No No No Yes
Scale of use Catchment Yes Yes Yes Possibly No Yes Strategy No No Yes Yes No Yes Detailed No No Yes Yes Yes Yes Type of flood River Yes Yes Yes Yes Yes Yes Estuaries No No Yes Yes Yes Yes Coastal No No In some
cases Yes Yes Yes
Other types of floods (e.g. pluvial, groundwater)
No No No Can be used for pluvial flooding
No Can be used for groundwater flooding
Note: The accuracy of the results will be dependent on the type of model used and the input data used
References
M.B. BUTTS, J. OVERGAARD, P. VIAENE, A. DUBICKI, K. STROŃSKA, W. SZALINSKA, A. LEWANDOWSKI, T. OLSZEWSKI, AND T. KOLERSKi (2005) Modelling Framework For Flood Forecasting – MIKE SHE ACTIF conference Norway October 2005
CROWDER, D AND DIPLAS, P (2000) Using two-dimensional hydrodynamic models at scales of ecological importance Journal of Hydrology Volume 230, Issues 3-4, 8 May 2000, PP 172-191
Review: Freshwater Ecosystems, Flooding and Vegetation
Science Report Methods to Assess, Model and Map the Environmental Consequences of Flooding: Literature review
(June 2008)
135
ENVIRONMENT AGENCY/DEFRA (2003) Catchment Flood Management Plans - Guidance of the selection of appropriate hydraulic models – Final report – July 2003
LAVEDRINE, I (1997) Application of 3D models to river flood problems HR Wallingford Report TR 26 March 1997
NEX, A AND SAMUELS, P (1999) The use of 3D CFD models in river flood defence HR Wallingford report SR542 January 1999
RAMSBOTTOM, D., NOTTAGE, A. and ACREMAN, M. 2005. Scoping Study (Phase 1) Environmental Consequences for Flood Risk Assessment, R&D Technical Report EX 5126, Environment Agency, Bristol, 62pp.
SCOTTISH ENVIRONMENT PROTECTION AGENCY (2006) Indicative river and coastal flood map (Scotland) – Summary of technical methodology – Version 2.0 – September 2006
STOESSER, T WILSON, M BATES, P. AND DITTRICH, A (2003) Application of a 3D numerical model to a river with vegetated floodplains Journal of Hydroinformatics pp99-12
SPALIVEIRO, F AND SEED, D (1998) 3D modelling of hydraulic structures HR Wallingford report SR545 May 1998

Science Report Methods to Assess, Model and Map the Environmental Consequences of Flooding: Literature review
(June 2008)
136
13 Issue 12: GIS to assess the environmental consequences of flooding – with addendum on MDSF2
John Packman
(Centre for Ecology and Hydrology
13.1 Scope Geographical Information Systems are routinely used to process and display spatial data related to flooding, and to integrate spatial calculations involving:
• Digitally mapped data on catchment properties (e.g. topography, soils, land use, environmental protection zones),
• Remote sensed information (e.g. land cover, growth indices, soil moisture)
• Inputs and outputs to flood models (e.g. rainfall, groundwater levels, river levels, flood depths/durations/extents), and
• Information on economic and environmental impacts tabulated against or related to flood characteristics (e.g. flood damages to property, habitat areas dependent on depth/duration/velocity of flooding)
The consequences of various flood management options can thus be easily compared.
There is an enormous body of information on such GIS applications. A Google search on the terms “flooding”, "environmental impact", and “gis” produced 290,000 hits, covering case studies and research, but also advertising the capability of many river engineering consultants. A few of these documents have been viewed, but no attempt has been made to review them formally. Rather, a brief description is given of (i) the GIS-based Modelling and Decision Support Framework (MDSF), commissioned by the Environment Agency to support the development of Catchment Flood Management Plans (CFMPs), and (ii) how “Broad Scale Ecosystem Assessment” is being introduced alongside the current economic and social assessment of flood management strategies.

Review: Freshwater Ecosystems, Flooding and Vegetation
Science Report Methods to Assess, Model and Map the Environmental Consequences of Flooding: Literature review
(June 2008)
137
13.2 CFMPs and the MDSF Catchment Flood Management Plans seek to
• assess flood generation processes occurring at a broad scale throughout a catchment,
• identify areas currently likely to flood,
• incorporate future pressures (e.g. changes in land use/management and climate),
• consider a range and combination of flood management options (flood plains, reservoirs, banks, diversions, etc),
• assess the consequent average annual costs and damages, and
• via stakeholder consultation, determine a preferred catchment-wide management strategy.
The MDSF (Defra/EA, 2003) supports the process, by firstly
• assessing flood sources - using GIS layers of topography, soils, land use, T-year floods (see hydrology issues described elsewhere in this report), etc to identify important subcatchments/areas (and corresponding model parameters) for flood generation,
• defining flood pathways and flood management options (cases) – using GIS layers of rivers, river structures, flood plains etc to define channels and flood plain areas that need to be modelled to assess flood depths
• outlining receptor areas and sinks – using GIS layers of current condition and future scenarios (e.g. land use, population densities, housing categories, commercial, industrial, agricultural, pasture, forest, moor, ecological reserves, estuaries, etc)
With the catchment, rivers, and defence cases suitably characterised, modelling of flood processes are performed off-line using suitable software applied at a suitable spatial and temporal resolution (see reviews elsewhere in this report). For each case, and for a range of flood probabilities (where probability = 1/T, the return period), the peak flood heights in channel (or in channel and over flood plain) are modelled and fed back into the GIS. GIS macros are then used to:
• spread (if necessary) channel flood heights over the flood plain
• derive a flood depth grid - using a GIS grid of ground elevation (DEM),
• derive a damage grid - using costs tabulated against flood depth and land use, and any necessary price indexing
• integrate damages over the catchment, and
• derive the average annual damage as a probability weighted average of the T-year values

Science Report Methods to Assess, Model and Map the Environmental Consequences of Flooding: Literature review
(June 2008)
138
The MDSF is based on the ArcView platform and has not been converted to run on the updated ArcGIS platform. All the required GIS-layers are provided by the EA, along with additional layers relevant to environmental impact assessment (part of CFMPs but not currently in the MDSF). The GIS macros and associated case management for each flood defence/development scenario are provided within the MDSF project file. Off-line modelling of flood processes is applied at only a limited number of flood probabilities (usually return periods 5, 10, 25, 100, & 200 years).
CFMPs and the MDSF are concerned with river flooding. The comparable Shoreline Management Plans (SMPs) are developed to assess the strategic management of coastal flooding, with a modelling framework provided by RASP (Risk Assessment for Strategic Planning) – see description under Coastal issues elsewhere in this report. Two major differences from the MDSF are that RASP addresses the risk and associated damages from failure/overtopping of defences, and also considers the risk of combined high sea and river levels in estuaries. This requires modelling of a larger number of cases (failure modes) and combinations of sea and river level probabilities.
Recognising the benefit of these RASP features, a revised MDSF2 is planned (EA, undated) – see addenda 1 and 2 below. To avoid dependence on a specific commercial GIS, the main spatial calculations will be performed by a platform independent ‘engine’, but it will be possible to assess input data and results using a commercial GIS. It should be noted that MDSF2 is not currently planned to support:
• Multi-criteria assessment (e.g. to include environmental impacts)
• Continuous simulation (see hydrology issue elsewhere in this report)
• Flooding from other than river or coast (e.g. groundwater, surface runoff, sewers)
•
The engine would need to be professionally updated to provide such support. The current project provides an opportunity to influence future developments of MDSF.
13.3 Broad Scale Ecosystem Assessment (BSEA) An EA scoping study on Broad Scale Ecosystem Impact Modelling Tools (Conlan, 2002) identified a need for models covering the “hydrodynamic, geomorphological, and ecological systems and the interactions and feedback loops between each....incorporated into a raster based GIS compatible framework”. These would “use a consistent GIS database format and potentially remote sensing techniques to gather broad-scale ecosystem data”. There was a need to “understand not only the driving mechanisms for ecosystem function but also the composition and dynamic structure of the ecosystems themselves”. However, “the lack of spatial resolution in base data may mean that lower resolution less complex models may be the most suitable option in the short term”.

Review: Freshwater Ecosystems, Flooding and Vegetation
Science Report Methods to Assess, Model and Map the Environmental Consequences of Flooding: Literature review
(June 2008)
139
Follow up work developed the BSEA Toolbox (Conlan et al, 2006) providing a GIS-based framework for Broad Scale Ecosystem Assessment using tools based on readily available broad scale data. The toolbox for river ecosystems covered channel condition, floodplain connectivity, and channel continuity, while for coastal ecosystems covered shoreline migration, tidal inundation and coastal flooding, and mobile sediment availability.
The tools for river ecosystems are briefly described below (full details of their development and the data sources are given in Conlan et al, 2006, Appendix 1):
Tool Description Channel Condition
A1. Catchment hydrology
Flow duration curves, representative frequent & infrequent floods, flood duration
A2. Surface runoff potential
Runoff to rivers – used with A4 to assess sediment runoff
A3. Channel gradient Indicates stream power, morphology, habitat types, artificial controls/weirs/etc.
A4. Catchment sediment sources
Sediments (fine/course) and land use – affect morphology, habitats, diversity, etc
A5. Substrate erodibility In-channel sediment sources – affect morphology, habitats, diversity, etc
A6. Morphological continuity
Physical, transverse/lateral barriers to sediment movement - affect deposition.
A7. Channel modification
Limit natural features/processes/sediment supply/storage
A8. In-channel habitats and ecology
Broad trends in ecology, use of GQA data, overview of habitat health & areas of concern
A9. Chemical water quality
General chemical/nutrient quality – ecosystem pressures, pollution, eutrophication
Floodplain connectivity
B1. Floodplain areas & existing defences
Floodplain extent, historic defences disconnected areas, ecologically active areas.
B2. Riparian zone & gathering grounds
Water dependent habitats, ecologically active areas, restoration areas, upland management
B3. Landcover in pot-ential floodplain
Potential for management actions – creation, restoration, enhancement – ecologically active
Channel continuity
C1. Barriers to river continuity
Barriers to ecological migration – flora and fauna
The steps involved in a Broad Scale Ecosystem Assessment include
• Using the tools and GIS data sources to understand catchment/coastal-cell ecology (broad habitats – their location, extent and status - and the associated ecosystem drivers)
• Defining Broad scale Ecosystem Criteria (BEC) – including existing targets from previous plans, and new areas defined for protection or enhancement
• Mapping and tabulating the BEC – prediction of change based on available data/evidence

Science Report Methods to Assess, Model and Map the Environmental Consequences of Flooding: Literature review
(June 2008)
140
• Expert consultation on catchment/coast-cell characteristics and the suitability of the BEC
• Use of BEC in policy development and appraisal (multi-criteria analysis, etc) The BEC allow a relative assessment of positive, neutral, or negative ecosystem impact.
For a high-level assessment it is assumed that if an ecosystem is functioning appropriately then the habitats are in good condition (and vice versa). Thus the BEC focus on habitats not individual species. Habitat availability and dynamic change over time is described by collating a number of overlaid GIS-based datasets as applied in the tools. The process relies on the intuitive understanding of experts on the status and functioning of the catchment/coast-cell. Different combinations of GIS layers provide information for different BECs, for example in river ecosystems, identifying high sediment yield would combine surface runoff potential (A2) with catchment sediment sources (A4) and substrate erodibility (A5), while targeting wetland creation would combine floodplain areas (B1) with riparian/gathering areas (B2).
These tools/indicators could be included within the MDSF, using expert review to intuitively adapt the weights given to each for any particular BEC. The tools could not be included within the engine of MDSF2 but would have to be run as a post-process.
The original aim of the current project, however, is to develop improved tools and ecosystem models, incorporating new or updated numeric GIS-based indicators of hydrological, geomorphological and ecological functioning.
13.4 Conclusions There is a user need for a GIS based framework for assessing the environmental consequences of flood management strategies across a whole catchment, and allowing impacts on the spatial location and extent of functional habitats to be modelled. The Broadscale Ecosystem Assessment BSEA toolkit is based on GIS data sets that already exist or can be easily created and that have an apparent relationship with ecological characteristics. Developing and testing such relationships is required, relating indices to observed ecosystem characteristics. Implementation of the BSEA toolkit within MDSF2 may be difficult due to the fixed nature of its proprietary engine. The original MDSF framework would appear to be more flexible, allowing users to apply their own weights and combinations of GIS-layers or adapt to new toolkits as appropriate.

Review: Freshwater Ecosystems, Flooding and Vegetation
Science Report Methods to Assess, Model and Map the Environmental Consequences of Flooding: Literature review
(June 2008)
141
Addendum 1. MDSF2 and links with Environmental Consequences Project
from note by P Sayers and C McGahey, HRWallingford, edited J Packman, CEH
The updated version of MDSF being developed (Environment Agency, 2007) will:
• incorporate risk based approach of RASP (Risk Assessment for Strategic Planning)
• minimise dependence on propriety software; maximise platform independence
• address lessons learned from the implementation and use of MDSF1.
The MDSF2 aims to provide a structured framework to assist decision makers in identifying preferred flood risk management strategies at a range of scales. The tool will allow for the integration of multiple and complex relationships between natural hazards, social and economic vulnerability, the impact of measures and instruments for risk mitigation (infrastructure provision, vulnerability reduction) in support of planning flood risk management in the medium and long term.
Figure 13.1 “Flooding system” and Source-Pathway-Receptor Model (Sayers et al, 2002)
The MDSF2 assesses the system risk for discrete defence systems – termed Flood Areas (Fig 13.2). The embedded rapid inundation model calculates water levels within these at the resolution of Impact Zones. The impact/risk calculations are then evaluated at Impact Cells, and can be aggregated to any user defined polygon level.
Pathway(e.g. beach, defence and floodplain)
Source (River or sea)
Receptor(e.g. people in the floodplain)
(HR Wallingford, 2001)
Pathway(e.g. beach, defence and floodplain)
Source (River or sea)
Receptor(e.g. people in the floodplain)
Pathway(e.g. beach, defence and floodplain)
Source (River or sea)
Receptor(e.g. people in the floodplain)
Source (River or sea)
Receptor(e.g. people in the floodplain)
(HR Wallingford, 2001)

Science Report Methods to Assess, Model and Map the Environmental Consequences of Flooding: Literature review
(June 2008)
142
Fig 13.2 Example MDSF2 Impact Zones and Impact Cells (EA, 2007)
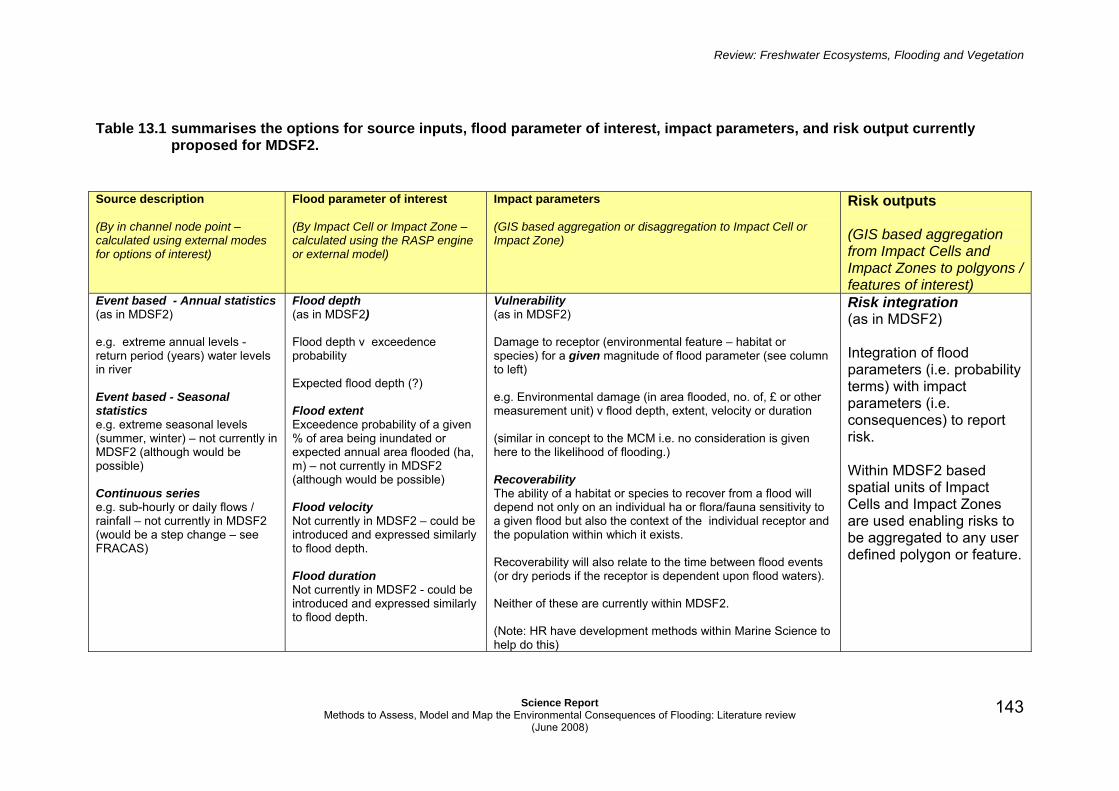
Review: Freshwater Ecosystems, Flooding and Vegetation
Science Report Methods to Assess, Model and Map the Environmental Consequences of Flooding: Literature review
(June 2008)
143
Table 13.1 summarises the options for source inputs, flood parameter of interest, impact parameters, and risk output currently proposed for MDSF2.
Source description (By in channel node point – calculated using external modes for options of interest)
Flood parameter of interest (By Impact Cell or Impact Zone – calculated using the RASP engine or external model)
Impact parameters (GIS based aggregation or disaggregation to Impact Cell or Impact Zone)
Risk outputs (GIS based aggregation from Impact Cells and Impact Zones to polgyons / features of interest)
Event based - Annual statistics (as in MDSF2) e.g. extreme annual levels - return period (years) water levels in river Event based - Seasonal statistics e.g. extreme seasonal levels (summer, winter) – not currently in MDSF2 (although would be possible) Continuous series e.g. sub-hourly or daily flows / rainfall – not currently in MDSF2 (would be a step change – see FRACAS)
Flood depth (as in MDSF2) Flood depth v exceedence probability Expected flood depth (?) Flood extent Exceedence probability of a given % of area being inundated or expected annual area flooded (ha, m) – not currently in MDSF2 (although would be possible) Flood velocity Not currently in MDSF2 – could be introduced and expressed similarly to flood depth. Flood duration Not currently in MDSF2 - could be introduced and expressed similarly to flood depth.
Vulnerability (as in MDSF2) Damage to receptor (environmental feature – habitat or species) for a given magnitude of flood parameter (see column to left) e.g. Environmental damage (in area flooded, no. of, £ or other measurement unit) v flood depth, extent, velocity or duration (similar in concept to the MCM i.e. no consideration is given here to the likelihood of flooding.) Recoverability The ability of a habitat or species to recover from a flood will depend not only on an individual ha or flora/fauna sensitivity to a given flood but also the context of the individual receptor and the population within which it exists. Recoverability will also relate to the time between flood events (or dry periods if the receptor is dependent upon flood waters). Neither of these are currently within MDSF2. (Note: HR have development methods within Marine Science to help do this)
Risk integration (as in MDSF2) Integration of flood parameters (i.e. probability terms) with impact parameters (i.e. consequences) to report risk. Within MDSF2 based spatial units of Impact Cells and Impact Zones are used enabling risks to be aggregated to any user defined polygon or feature.

Science Report Methods to Assess, Model and Map the Environmental Consequences of Flooding: Literature review
(June 2008)
144
Addendum 2 Comments on MDSF2 following stakeholder meeting, 19/05/2008
John Packman
(Centre for Ecology and Hydrology)
The Modelling and Decision Support Framework (MDSF2) has four stages/components:
(1) Input data assessment, using a commercial GIS and various input layers to assess flood issues, and define flood prone areas and sub-catchments to model
(2) Source modelling (external software to provide T-year loadings, i.e. maximum water levels along river, estuary/sea levels, wave height)
(3) Platform independent Engine to: interpolate source inputs for additional T-year probabilities; evaluate the many combinations (typically 40,000) of source input and defence failure modes; derive joint probabilities and flood extents; and determine the economic/social consequences (normally using the depth-damage data from the FHRC(2006) Multi-Coloured Manual.
(4) Output visualisation (using a commercial GIS)
MDSF2 considers flood prone areas along a river or coastline as defended (DAs) or undefended (UAs). The Engine assess flood spread in DAs (for each of the failure/overtopping cases considered) using a rapid approximation method with flows into the area (per defence) based on some assumed hydrograph shape and duration. The Engine can also predict flood spreads in UAs (by setting virtual defences at river bank height), but for the most upstream UAs, flood spreading is better predicted by the more accurate source models (stage 2), many of which include detailed flood spreading procedures. Downstream of DAs, the Engine specification includes reduction in river levels (as predicted by the source models) by an assumed amount to allow for upstream flooding, with consequent impact on any downstream flooding.
For each flood spread, the Engine evaluates the flood depth within grid cells, finds the cell damage costs (from tables for different land-uses, housing types, etc) and then aggregates over the impact area of interest (e.g. urban boundary, flood plain extent, user defined polygon). Considering all flood spreads (for different source/failure combinations) it builds a flood damage-probability distribution from which mean annual damages can be derived. Note that the probabilities of each source/failure mode and consequent inflows to each DA give revised loading probabilities for the adjusted downstream hydrographs (as mentioned at the end of the paragraph above).
The procedure can be repeated for different scenarios (climate/land-use/flood defences, etc), and results displayed in a GIS.
Science Report Methods to Assess, Model and Map the Environmental Consequences of Flooding: Literature review
(June 2008)
145
Discussion
Functionality has been introduced into MDSF to deal with the role of flood defences and their risk of failure/overtopping. Although essential, this improvement has drawn attention away from the role of Catchment Flood Management Plans in assessing flood generation processes at a broad scale throughout a catchment in order to identify the areas likely to flood. This includes assessing runoff characteristics, and the roles of topography, rainfall characteristics, soils, and impacts of (for example) lakes, confluences and floodplains. This broad scale assessment involves expert review, exploring and combining GIS layers of catchment and hydrological indicators. Within this work, the Broad-Scale Ecosystem Assessment (BSEA) toolbox could usefully be introduced. These broad-scale assessments indicate the areas where more detailed modelling may be necessary (stage 2 above), and where impact zone polygons should be defined. A number of simple GIS macros could be developed to streamline or standardise these assessments, and such macros are likely to be platform dependent (tied to the GIS used). However, many GIS users are skilled at implementing and adapting standard macros.
The MDSF2 Engine is more than a simple macro, and it is computationally intensive: interpolating source loads for intermediate return periods (up to about 40); managing the range of defence failure modes (usually each 350 metres of defence is treated separately); evaluating joint probabilities of inputs and failures; implementing flood spreading; performing the relatively complex calculation of land-use dependent damage costs; and integrating such costs within a user-defined polygon. Stand-alone coding (and platform independence) is desirable, if only to minimise computing time.
It should be noted that the Engine works with flood levels and ignores any information given by source models on hydrograph shape and duration (and on uncertainties due to hydrological and hydraulic conditions). The accuracy of the rapid flood spreading method and consequential impacts on downstream levels have not been independently tested against the generally better quality source modelling and are areas of concern; especially if the rapid method is used to model large UAs. Differences are likely to be compounded through successive DAs along the river. The MDSF2 system design does allow for detailed modelling to check specific scenarios, but it is unclear how any differences from the Engine’s rapid simulations will be incorporated into the damage-frequency calculations. Note also that the rapid flood spreading gives no information on duration or velocity of flooding.
Table 12.1 in the Sayers and McGahey note (Addendum 1) indicates that many environmentally relevant features could relatively easily be introduced into the Engine (e.g. seasonal assessments require “only another column in the results matrix”). Yet, while integration within the Engine may be easy, considerable work is still required on the associated source modelling (stage 2). Use of MDSF with continuous simulation modelling is under review, but is not yet possible.
The Engine is primarily concerned with evaluating mean annual damage costs, and additional programming would be required to implement other detailed metrics (e.g. on sediment issues or habitat suitability). However, intermediate levels of information are stored that would allow simple metrics of likely relevance to environmental assessment (e.g. flooded area, maximum/mean flood depth, user defined “depth-damage/benefit”

Science Report Methods to Assess, Model and Map the Environmental Consequences of Flooding: Literature review
(June 2008)
146
tables, etc.) to be evaluated over a user defined polygon (presumably the usual damage costs need not be performed for such environmental areas). Thus, a frequency distribution of say x% of a user defined area/polygon being flooded can be obtained. However, the polygon must be pre-defined, and the Engine does not yield ‘contour’ maps of flood outlines for different return periods (which is a likely requirement for assessing environmental impacts). Indeed, within DAs, different but equally likely failure modes will generally give different zonal patterns of flooding. These differences in upstream flood extents may also affect downstream flood extents. Large differences in flood patterns are less likely in UAs, where flooding comes more from bank overtopping than local failure.
Note also that riverine DAs are almost exclusively urban areas, and evaluating flood metrics within such areas - which is the prime concern of MDSF2 - is of lesser interest to the Environmental Consequences project - which is more concerned with the impact that the defences of DAs have on the much larger UAs downstream. In general, large floods are damaging to both the environment and to people, while frequent inundation of floodplains is beneficial to the environment but potentially damaging to people. Thus it is the effect that flood defences have on relatively frequent flood extents elsewhere that is of most environmental concern – and in these conditions the risk (and impact) of defence failure is minimal. Thus, apart from concerns over the accuracy of the rapid flood spreading method, the complexity of the Engine seems unwarranted for environmental assessments, especially as assessing multiple failure modes in sequences of DAs along a river would involve considerable computing effort, but have questionable impact on any environmental indicators.
Determination
The EA aims to include the assessment of environmental consequences in MDSF2, but the potential gains in consistency of approach and data management effort must be weighed against computational effort and model suitability. Of greatest environmental concern are the effect of defences on short return period flooding downstream (rather than defence failure), and also the effect of varying conditions in the source models, such as seasons, sequences of events, duration, extent and velocity of flooding, groundwater levels, etc., moving eventually to a continuous simulation approach. These aspects can be assessed using the same MDSF2 ancillaries (input/output GIS procedures to develop broad scale understanding, and source models - or environmentally relevant developments thereof), but feeding a parallel ‘Environmental Engine’, which considers frequent return period events, and just two defence conditions (present or not present). This is the intended strategy to be followed in this project. Beyond this project, the two Engines could eventually be merged, but probably maintaining different internal tracks for the environmental and people-centred impact analyses.
References
CONLAN K (2002) Broad Scale Ecosystem Impact Modelling Tools: Scoping Study, R&D Technical Report FD2108, Defra/Environment Agency
CONLAN K, WADE T, DANGERFIELD S, NOTTAGE A, DANGERFIELD H, RAMSBOTTOM D, HOLMES N, RICHARDS K AND ALLEN J (2006) Broad Scale

Science Report Methods to Assess, Model and Map the Environmental Consequences of Flooding: Literature review
(June 2008)
147
Ecosystem Assessment: BSEA Toolbox 1, R&D Technical Report FD2112, Defra/Environment Agency
Defra/Environment Agency (2003). Catchment Flood Management Plan, Development of a Modelling and Decision Support Framework (MDSF), Flood and Coastal Defence R&D Programme, MDSF Procedures Version 2.0
Environment Agency (undated). Task 1g Report – MDSF2 System Design, Science Report SC05001/SR
Environment Agency (2007) MDSF2 System Design Report, SC050051/SR1 by HR Wallingford.
Flood Hazard Research Centre (2006) The Benefits of Flood and Coastal Risk Management (Multi-Coloured Manual and Handbook),iddlesex University Press.
SAYERS P B, HALL J W AND MEADOWCROFT I C (2002). Towards risk-based flood hazard management in the UK. Proc. ICE, Civ.Engg 150, May 2002 pp 36-42.

Science Report Methods to Assess, Model and Map the Environmental Consequences of Flooding: Literature review
(June 2008)
148
14 Concluding Remark
The relevant policies and strategies have been considered and developments in this area during the course of the project will be considered. The review has illustrated the complexity of the environmental consequences of floods which are clearly specifically dependent on the species of interest. The available knowledge on the sensitivity of various species to floods has been reviewed and it is clear that there are many gaps in our knowledge. Throughout the review the sensitivities of key indicator species to flooding has been considered. The ultimate goal in this area of research, but beyond the scope of the current study, would be to consider the sensitivity of whole ecosystems to floods by considering habitat function. Throughout this study expert knowledge will be an important part of defining the impacts on ecology. In general an increase in the frequency of flooding would be good for maintaining, aiding recovery of, or recreating water dependent habitats that are more natural ecosystems than the typical arable or improved grassland of many floodplains that have not been urbanised (Nigel Holmes, pers. comm.. 2008). The various tools and models that may be used to assess the consequences of floods have been considered. Many tools are applicable at the broad scale but it is acknowledged that very small changes in hydrology can trigger major changes in community composition (especially soil invertebrates and plants). Ideally, site based models, using broad scale output to provide boundary conditions, are needed to predict the fine-scale changes that can be related to species tolerances.
During the next phase of the project the knowledge presented in this review will be used to define indicators (flood characteristics) and the associated ecological consequences. A key indicator for considering the consequences of flooding for many species is seasonality. A challenge for this project is how to incorporate seasonality into current tools.

We are The Environment Agency. It's our job to look after your environment and make it a better place – for you, and for future generations.
Your environment is the air you breathe, the water you drink and the ground you walk on. Working with business, Government and society as a whole, we are making your environment cleaner and healthier.
The Environment Agency. Out there, making your environment a better place.
Published by: Environment Agency Rio House Waterside Drive, Aztec West Almondsbury, Bristol BS32 4UD Tel: 0870 8506506 Email: [email protected] www.environment-agency.gov.uk © Environment Agency All rights reserved. This document may be reproduced with prior permission of the Environment Agency.