Family Nutrition Education Programs Nutrition for Missouri Families FNEP.

Head Start Children, Families, and Programs: Present and Past Data from FACES
OPRE Report 2011-33a
DECEMBER 2011

DISCLAIMER: The views expressed in this publication do not necessarily reflect the views or policies of the Office of Planning, Research and Evaluation, the Administration for Children and Families, or the U.S. Department of Health and Human Services.
This report and other reports sponsored by the Office of Planning, Research and Evaluation are available at http://www.acf.hhs.gov/programs/opre/index.html.
ACKNOWLEDGMENTS:
The authors would like to express their appreciation to our Project Officer Maria Woolverton and other federal staff at OPRE and the Office of Head Start. We thank the Mathematica team, including Annalee Kelly, Cassandra Meagher, Barbara Carlson, Anne Bloomenthal, Jennifer McNulty, Lizabeth Malone, Susan Sprachman, Brian Takei, Erin Slyne, Timothy Bruursema, Katherine Burnett, Kristina Rall, Ama Takyi, Miriam Lowenberg, Amanda Bernhardt, Laura Bernstein, August Pitt, as well as Francene Barbour, Joan Gutierrez, and Thidian Diallo at the Survey Operations Center and all of the Mathematica field and telephone staff who collected the data. The report also benefited from careful editing by Patricia Ciaccio. We are also grateful for the contributions of our partners at Juarez and Associates and the Educational Testing Service. Most of all, we offer our gratitude to the staff, families and children of the 60 FACES 2009 programs across the country, who once again opened their doors and shared their time with us.

Head Start Children, Families, and Programs: Present and Past Data from FACES
OPRE Report 2011-33a
December 2011
Submitted to: Maria Woolverton, Project Officer Office of Planning, Research, and Evaluation Administration for Children and Families U.S. Department of Health and Human Services
Submitted by: Lara Kristin Hulsey Nikki Aikens Ashley Kopack Jerry West Emily Moiduddin Louisa Tarullo Mathematica Policy Research, Inc.
Project Director: Jerry West, Mathematica Policy Research
Contract Number: HHSP23320092900YC Mathematica Reference Number: 06573.122
This report is in the public domain. Permission to reproduce is not necessary.
Suggested citation: Hulsey, L. K., Aikens, N., Kopack, A., West, J., Moiduddin, E., and Tarullo, L. (2011). Head Start Children, Families, and Programs: Present and Past Data from FACES. OPRE Report 2011-33a. Washington, DC: Office of Planning, Research and Evaluation, Administration for Children and Families, U.S. Department of Health and Human Services.

1
INTRODUCTION
This report provides a portrait of children entering Head Start for the first time in fall 2009, as well as of their family backgrounds and the classrooms and programs that serve them. The report also offers comparisons across the past decade of the Head Start program to delineate trends and changes in the population served and the services provided. Data are drawn from the Head Start Family and Child Experiences Survey (FACES), which was first launched in 1997 as a periodic, longitudinal study of program performance. Successive nationally representative samples of Head Start children, their families, classrooms, and programs provide descriptive information on the population served; staff qualifications, credentials, and opinions; Head Start classroom practices and quality measures; and child and family outcomes. FACES includes a battery of child assessments across many developmental domains; interviews with children’s parents, teachers, and program managers; and observations of classroom quality.1 In 2008, the Administration for Children and Families (ACF) funded Mathematica Policy Research and its partners—Educational Testing Service and Juárez and Associates—to design and conduct FACES 2009.
FACES 2009 is the fifth in a series of national cohort studies—previous cohorts were initiated in 1997, 2000, 2003, and 2006. The FACES 2009 child sample was selected to represent 3- and 4-year-old children as they entered their first year of the program, drawing on participants from 60 selected programs from across the country.2 Successive samples of Head Start children, their families, and programs provide a rich source of ongoing information on the children and families served by Head Start and on the programs and staff providing these services. Interviews, observations, and assessments carried out on a recurring basis provide the means for assessing how the program is performing, currently and over time, in response to changing demographics and policy mandates.
Based on a comprehensive “whole-child” view of school readiness, FACES uses multiple methods to collect data on child characteristics and skills from several sources. FACES 2009 provides updated information to document a number of key areas. In addition to offering a current picture of the program and its participants, this report chronicles change over time in selected areas where comparable data are available across cohorts. These include child and family demographics and home experiences,
children's skills and abilities as they enter the program, and characteristics of the teachers and classrooms that serve them.
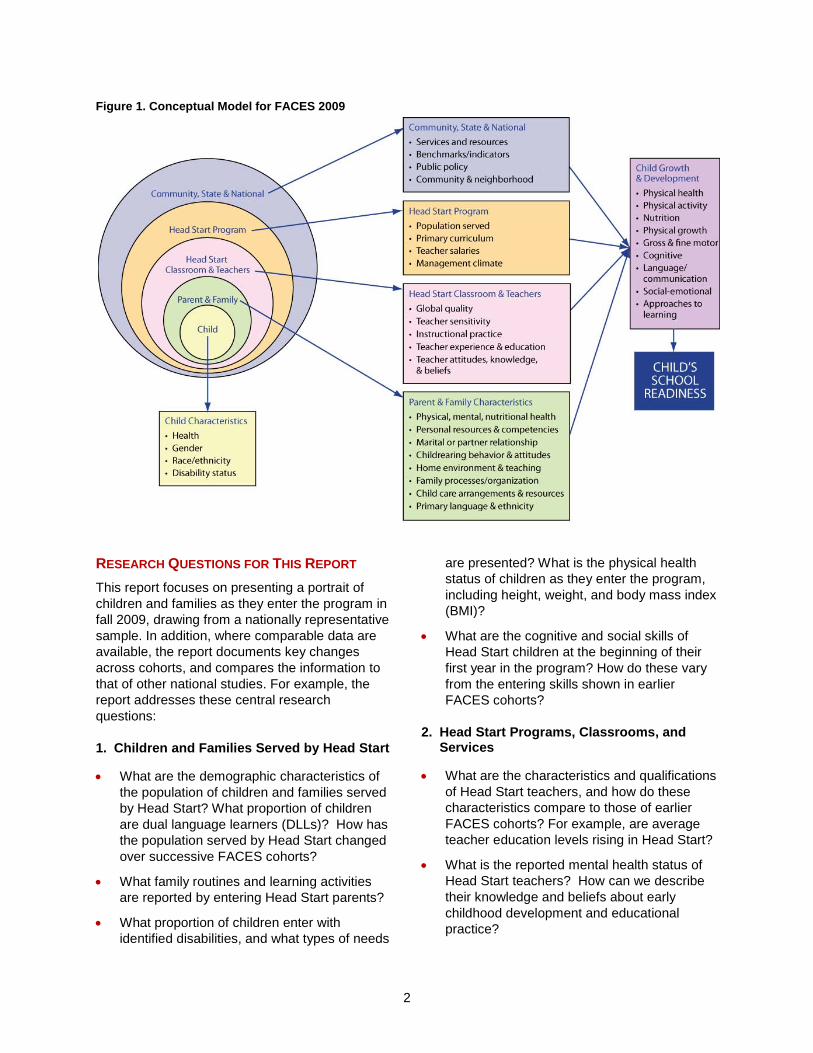
CONCEPTUAL MODEL AND FRAMEWORK The conceptual framework for FACES 2009 illustrates the complex interrelationships that help shape the developmental trajectories of children in Head Start (Figure 1). The child’s place is primary and constitutes the central core of the relationships depicted in the figure; fostering his or her progress toward school readiness, broadly construed, is Head Start’s ultimate goal. The family context—health, economic, and educational resources, as well as cultural factors—forms the first ring of influences surrounding the child. Membership in the Head Start community is reflected in the child’s classroom and teachers and the wider Head Start program, all of which influence the quality of the early childhood learning experience. Factors affecting the child’s development and well-being also include teacher credentials, classroom quality, and program management. Finally, community, state, and national policy decisions, depicted in the outer ring, also affect the life of a Head Start child. These multidimensional contexts guide all aspects of the FACES study, from the selection of measures to the multilevel analyses needed to fully address program and policy issues in today’s Head Start program.
The Head Start experience is designed to promote immediate short- and long-term goals for children and families. For children, the experience includes preschool education, health screenings and examinations, nutritionally adequate meals, and opportunities to develop social-emotional skills that support school readiness. For parents, the experience involves opportunities to participate in policy and program decisions. The program provides parents with chances to participate in the classroom and strives to encourage their active involvement in the education and development of their children. Head Start seeks to promote adult literacy and further parent education, where needed and appropriate, and to provide opportunities for careers and training in early childhood education. The program also seeks to promote family self-sufficiency through provision of case management, assessment, referral, and crisis intervention services. Head Start acts as an advocate for necessary family-focused social services through interagency coordination and agreements.
Measurement of these child and family outcomes, both during the program years and through followup at the end of kindergarten, allows fuller understanding of Head Start’s efforts to prepare children and their parents for participation in school.
2
Figure 1. Conceptual Model for FACES 2009
RESEARCH QUESTIONS FOR THIS REPORT This report focuses on presenting a portrait of children and families as they enter the program in fall 2009, drawing from a nationally representative sample. In addition, where comparable data are available, the report documents key changes across cohorts, and compares the information to that of other national studies. For example, the report addresses these central research questions:
1. Children and Families Served by Head Start
• What are the demographic characteristics of the population of children and families served by Head Start? What proportion of children are dual language learners (DLLs)? How has the population served by Head Start changed over successive FACES cohorts?
• What family routines and learning activities are reported by entering Head Start parents?
• What proportion of children enter with identified disabilities, and what types of needs
are presented? What is the physical health status of children as they enter the program, including height, weight, and body mass index (BMI)?
• What are the cognitive and social skills of Head Start children at the beginning of their first year in the program? How do these vary from the entering skills shown in earlier FACES cohorts?
2. Head Start Programs, Classrooms, and Services
• What are the characteristics and qualifications of Head Start teachers, and how do these characteristics compare to those of earlier FACES cohorts? For example, are average teacher education levels rising in Head Start?
• What is the reported mental health status of Head Start teachers? How can we describe their knowledge and beliefs about early childhood development and educational practice?

3
• What specific curricular and instructional approaches are being used in Head Start classrooms, and how have these changed over the past decade?
METHODS
The findings in this report are based on analyses of data from four FACES cohorts: FACES 2009, 2006, 2003, and 2000. In this section, we first describe the FACES 2009 sample and the fall 2009 response rates, data collection methods, and instruments. Next, we provide a general description of the designs of earlier FACES cohorts, noting similarities and differences in the samples, methods, and instruments used compared to FACES 2009. More information on the designs of FACES 2006, 2003, and 2000 is available in the data file user’s manuals for each of these studies (West, Aikens, et al. 2010; Zill et al. 2005; Zill et al. 2008). For more information on
the design of FACES 2009, see West, Tarullo, et al. (2010).
FACES 2009 SAMPLE AND RESPONSE RATES FACES 2009 used a multistage sample design to select a nationally representative probability sample of Head Start children and their families. This design provides information at the national level about Head Start programs, centers, and classrooms, as well as the children and families they serve. A sample of Head Start programs was selected from the 2007–2008 Head Start Program Information Report (PIR),3 and approximately two centers per program and three classrooms per center were selected for participation. Within each classroom, an average of eight newly enrolled 3- and 4-year-old children were selected for the study. Table 1 shows the number of cases initially selected and the number of cases that participated at each sampling stage.
Table 1. Number of Cases Selected and Participating at Each Stage of Sampling
Sampling Stage
FACES 2009 FACES 2006 FACES 2003 FACES 2000
Selected Participated Selected Participated Selected Participated Selected Participated
Programs 65 60 64 60 68 63 45 43
Centers 130 129 140 135 182 175 NA NA
Classrooms 486 486 415 410 409 337 307 286
Children 3,718 3,349 3,817 3,315 2,816 2,457 2,790 2,535
Note: The number of selected cases includes programs, centers, classrooms, and children later determined to be ineligible based on the study criteria.
NA = not applicable
Sixty programs, 129 centers, 486 classrooms, 439 teachers, and 3,349 children participated in the study in fall 2009. Overall, 93 percent of the sampled programs and all the sampled centers and classrooms participated in the fall.4 The parents of 92 percent of the sampled children consented to their children’s participation. Child assessments, parent interviews, teacher interviews, and teacher ratings were obtained for 93 to 97 percent of these children.5
DATA COLLECTION METHODS FACES 2009 data were collected over a four-month period in fall 2009 (September–December 2007). Mathematica data collection teams assessed the children at their Head Start centers,
interviewed the children’s lead teachers, and interviewed most children’s parents during weeklong site visits.6 Teachers were asked to complete ratings for each sampled child in their classroom using either a web-based or paper instrument.7 All FACES cohorts use data from a battery of direct child assessments to report on children’s cognitive outcomes when they first entered Head Start, and assessor ratings are used to describe children’s social-emotional outcomes. Parent and teacher ratings provide additional information about children’s social skills, approaches to learning, problem behaviors, and academic and non-academic accomplishments at the beginning of the Head Start year. Parent interview data are also used to describe children’s backgrounds and home

4
environments; teacher interview data are used to describe children’s first Head Start classroom experiences.
Direct Child Assessments. The FACES 2009 fall battery of direct child assessments included standardized preschool assessments designed to measure children’s cognitive outcomes (language, literacy, and mathematics) and physical outcomes (height and weight) through an untimed, one-on-one assessment of each child.8 The actual measures used are described later in this report, where we discuss children’s cognitive and social-emotional development at the beginning of the Head Start year.
The FACES 2009 direct assessment began with a screening to determine whether children from households where a language other than English was the primary spoken language should be assessed in English, assessed in Spanish, or administered an abbreviated battery that included the Peabody Picture Vocabulary Test, Fourth Edition (PPVT-4) and the measurement of height and weight.9 The assessments themselves used the standard material for each instrument (for example, stimulus and response pages from the PPVT-4 and Woodcock-Johnson measures). Computer-assisted personal interviewing (CAPI) was used when administering the assessments to facilitate the movement from one measure to the next without the assessor having to calculate stopping or starting points. Assessors read the questions and instructions from a computer screen. The child responded by pointing to the correct answers on the assessment easel or by giving a verbal response. Assessors entered the child’s responses into a laptop computer using software that ensured that all basal and ceiling rules were followed.10
Parent Interviews. FACES 2009 used a computer-assisted interview to collect information from Head Start parents in a variety of areas, including the characteristics of households (for example, household income, number of adult household members, languages spoken in the home) and household members (for example, age, race/ethnicity, relationship to study child). Information was also collected on parent-child relationships, aspects of the child’s home life, children’s child care arrangements, and parents’ ratings of their children’s social skills and problem
behaviors. New to FACES 2009 are additional questions about parents’ involvement in their children’s Head Start program and classrooms. FACES 2009 expanded the information collected from parents of dual language learners (DLLs) by asking more questions about language use in the home and parents’ attitudes and preferences toward learning English.
Teacher Interviews and Teacher Child Reports. FACES 2009 and FACES 2006 also used CAPI with lead teachers to ask them about their educational backgrounds, professional experience, and credentials.
In fall 2009, teachers were asked to report on the learning activities that are scheduled in their classrooms. They were asked to estimate the amount of time they spend both on teacher-directed activities and on child-selected activities in a typical day, as well as how often the children in the class participate in various language and literacy development and mathematics activities. Teachers were asked questions on whether they have a principal curriculum guiding the classroom activities and, if so, whether they received training in how to use it. To understand more about the classroom context within which DLLs develop and learn, additional questions were added to the FACES 2009 teacher interview asking about the number of DLL children in classrooms and the languages used when reading and speaking with the children.
Using a Teacher Child Report (TCR) form, teachers in fall 2009 were asked to rate each child on items that assess the child’s accomplishments, cooperative classroom behavior, behavior problems, and approaches to learning. Teachers also provided reports of children’s developmental conditions using either an online or paper instrument.11
Interviewer Ratings. At the end of the one-on-one testing sessions with children, the assessor completed rating scales evaluating the child’s behavior in the assessment situation. Four subscales from the Leiter-R Examiner Rating Scales were used in FACES 2009: (1) attention, (2) organization/impulse control, (3) activity level, and (4) sociability. The 27 items and four subscales make up the cognitive/social scale.

5
SAMPLES AND METHODS OF EARLIER FACES COHORTS FACES 2006 and FACES 2003, like FACES 2009, used a four-stage sample design. FACES 2000 did not sample centers (stage two), but instead sampled classrooms within each of the sampled Head Start programs. Table 1 contains the sample sizes for each stage of sampling. Response rates for earlier FACES cohorts are high as well. For example, child assessment response rates in FACES 2000 and FACES 2006 were 90 and 96 percent, respectively.12
All earlier FACES cohorts included a battery of child assessments that, like FACES 2009, assessed a broad set of school readiness skills. Differences in the assessment instruments used over time are identified in the later section of this report, when we describe cross-cohort patterns in critical child outcomes. Early FACES cohorts also interviewed children’s teachers and parents and asked teachers to complete a set of child ratings. By design, many of the questions asked in FACES 2009 questionnaires were asked earlier in FACES 2006, 2003, and 2000.13 FACES 2006 did this through a computer-assisted interview, while cohorts before 2006 used paper instruments when conducting the parent interview.
Population Estimates. The statistics found in this report are estimates of key characteristics of the population of newly entering Head Start children and their parents and families, as well as the population of Head Start teachers serving them.14 The data used to report on child and family characteristics and child outcomes are weighted to represent all newly entering Head Start children in fall of the program year.15 Teacher and classroom data are weighted to represent all teachers serving children entering Head Start for the first time in the fall and their classrooms.
The report includes analyses that compare the population of Head Start children and families from 2000 through 2009, as well as their teachers and classrooms. Analyses are limited to child outcomes that were measured in the same way in two or more FACES cohorts. When comparing the characteristics of children (for example, age at program entry), their families (for example, family risks), and classrooms (for example, classrooms with a teacher who has a B.A.), we created the variables used in the analysis following the
approach used in FACES 2009. This helped ensure that the characteristics were comparable across FACES cohorts.
All group differences cited in the text of the report are statistically significant at the p < .05 level. Similarly, all reported changes in the characteristics of children, families, and classrooms over time and any trends in these characteristics across FACES cohorts are statistically significant at the p < .05 level.
HEAD START CHILDREN AND FAMILIES
CHILD AND FAMILY DEMOGRAPHICS, PARENTING, AND THE HOME ENVIRONMENT Head Start serves a diverse population of low-income children and their families. In recognition of the important role that family plays in a child’s development, Head Start has made the family a cornerstone in its framework, and the FACES 2009 Parent Interview collected a wealth of information on the family and household environment of entering Head Start children. This section describes the population of children entering Head Start for the first time in fall 2009 and presents key findings on household demographic characteristics, the home learning environment and parenting practices, and health care and nutrition for this group of children.
In addition to describing the population of children and families in fall 2009, we examine changes and trends in the population of children and families served by Head Start using baseline data from FACES 2000 through FACES 2009. In selected cases, we make comparisons to the demographic characteristics of preschool children and their families across the nation.
Characteristics of Children Entering Head Start
Status in Fall 2009. Sixty-one percent of first-time Head Start children are 3 years old (as of September 1, 2009), and the others are 4 years old or older. The entering Head Start population is nearly evenly divided between boys and girls.
More than a third of Head Start children (36 percent) are Hispanic/Latino, and another third (33 percent) are African American (Figure 2).16 Newly entering 3-year-olds are more likely than newly entering 4-year-olds to be African

6
American, while 4-year-olds are more likely than 3-year-olds to be Hispanic/Latino.
Thirteen percent of children entering Head Start in fall 2009 have participated in Early Head Start.
Children entering Head Start as 3-year-olds are more likely than those entering Head Start at age 4 to have participated in Early Head Start, but the difference is small (14 and 12 percent, respectively).
Figure 2. Child’s Race/Ethnicity: Fall 2009
23
33 36
22
35 34
24
30
39
0
5
10
15
20
25
30
35
40
45
White, Non-Hispanic
African American, Non-Hispanic*
Hispanic/ Latino*
Perc
enta
ge o
f Chi
ldre
n
Total sample 3-year-olds 4-year-olds
Source: Fall 2009 FACES Parent Interview.
Note: Statistics are weighted to represent all children who entered Head Start for the first time in fall 2009.
*Asterisk indicates that the difference between the age groups is statistically significant at the p < .05 level.
Changes in Child Characteristics Across Cohorts. The age and gender distributions of children entering Head Start have remained fairly constant since 2000. However, the racial/ethnic composition of the entering child population has shifted. In particular, the percentage of entering Head Start children who are minorities has increased, from 66 percent in fall 2000 to 77 percent in fall 2009, while the percentage of children who are White has decreased. Although data from the Head Start Program Information Report (PIR) indicate that the percentage of Hispanic/Latino children in Head Start has increased over time, from 19 percent in 1980 to 35 percent in 2007 (West and Hulsey 2009), there has been no statistically significant change in the percentage of children in any specific minority group for the shorter time period covered by FACES 2000 through 2009.17 The shift in the percentage minority is driven by a change in the racial/ethnic composition of entering 4-year-olds
across cohorts. The percentage of entering 4-year-old children who are members of a minority group rose from 56 percent in fall 2000 to 76 percent in 2009, while the percentage of 3-year-olds who are minorities remained relatively stable.18
Household Composition
Status in Fall 2009. Most children entering Head Start in 2009 (95 percent) live with at least one of their biological or adoptive parents,19 and few live apart from their mother. Half of newly entering Head Start children (50 percent) live with their mother only, while a few (3 percent) live with their father only (Figure 3). Forty-two percent live with both of their biological or adoptive parents. Just over one-quarter (27 percent) of children live in households with their married parents, and 14 percent live in households where their parents are cohabiting. Head Start children live in households with two adults and 2.6 children, on average.

7
Figure 3. Family Members with Whom Child Resides: Fall 2009
42%
50%
3% 5%
Both mother and father
Mother only
Father only
Neither mother nor father
Source: Fall 2009 FACES Parent Interview.
Note: Statistics are weighted to represent all children who entered Head Start for the first time in fall 2009.
Mother and father include both biological and adoptive parents.
Household composition varies by age and race/ethnicity. Three-year-olds are more likely (44 percent) to live with both biological/adoptive parents than are 4-year-olds (39 percent). Hispanic/Latino and White children are more than twice as likely to live with both of their parents (58 and 47 percent, respectively) than are African American children (22 percent).
Changes in Household Composition Across Cohorts. The percentage of entering Head Start children who live with both of their biological or adoptive parents decreased across FACES cohorts from 48 percent in 2000 to 42 percent in 2009. However, household size has remained stable across FACES cohorts from 2000 to 2009.
Parent Education, Employment, and Income
Status in Fall 2009. More than two-thirds (68 percent) of children entering Head Start in fall 2009 have a parent with at least a high school diploma or GED living with them. Sixty-four percent of newly entering Head Start children’s mothers and 54 percent of their fathers have at least a high school diploma or GED.20 Four-year-olds are somewhat less likely than 3-year-olds to have a parent with at least a high school diploma or GED.
More than three-quarters (77 percent) of children live with at least one parent who is working full
time. One third (33 percent) of children are not living with an employed parent, including 19 percent who live with at least one parent who is looking for work.
Almost half the children’s mothers (47 percent) work, with about a quarter (26 percent) working full time (35 or more hours per week) and another fifth (20 percent) working part time. A higher percentage of Head Start children’s fathers (72 percent) work, and the majority (58 percent) work full time.
The median annual household income for Head Start children in fall 2009 is $22,714. More than 9 in 10 children live in households where the income is less than or equal to 185 percent of the federal poverty threshold, and 63 percent live in households where income is less than or equal to 100 percent of the federal poverty threshold.21
On average, household incomes for newly entering White children are higher than for other groups. Hispanic/Latino children’s households are more likely than those of other racial/ethnic groups to have incomes below the federal poverty threshold.
Many Head Start children live in households that receive federal assistance. The most common type of assistance (received by 64 percent of children’s households) is from the U.S.

8
Department of Agriculture’s Supplemental Nutrition Assistance Program (SNAP, formerly known as food stamps), followed by the Women, Infants, and Children (WIC) program (59 percent). Just over one-quarter of children (27 percent) live in households that receive Temporary Assistance for Needy Families (TANF). Three-year-olds are somewhat more likely than 4-year-olds to live in households that receive WIC.
Twelve percent of children entering Head Start in fall 2009 live in public or subsidized housing, and less than one-quarter (23 percent) of children’s families own the home in which they live. More than a third (36 percent) of Head Start children have moved at least once in the past year, including 11 percent who have moved two or more times in that year. Four-year-olds are more likely than 3-year-olds to have moved in the past year.
Changes in Parent Education, Employment, and Income Across Cohorts. In fall 2009, employment among both mothers and fathers living with Head Start children declined relative to the prior cohort. The percentage of children living with an employed mother had increased between 2000 and 2006, but fell by five percentage points by 2009. Among children living with their fathers, the percentage with an employed father decreased 13 points from 2006 to 2009.
The proportion of children in households with incomes below the federal poverty level also changed between 2006 and 2009, increasing from 58 to 63 percent. However, the percentage with incomes below poverty was even higher in 2003; thus there was no consistent trend in income across FACES cohorts.
The percentage of entering Head Start children in households that receive SNAP or food stamps has increased, including an 11 percentage point jump between the 2006 and 2009 cohorts. This pattern reflects a broader national trend in SNAP caseloads, which have increased from 17 million participants in 2000 to 28 million in 2008 (Mabli and Ferrerosa 2010). The changes between 2006 and 2009 in SNAP receipt, household income, and parent employment are likely related to the recent economic downturn.
Home Language
Status in Fall 2009. Slightly more than a quarter—26 percent—of newly entering Head
Start children in 2009 live in households where a language other than English is primarily spoken to them. Spanish is by far the most prevalent non-English primary language and is spoken to 24 percent of children in their homes.
Among children in households where a language other than English is primarily spoken to them, 59 percent are most often read to in a language other than English. In addition, 18 percent have no children’s books written in English in their homes, and 14 percent watch television programs primarily in a language other than English.
Entering 4-year-olds are somewhat more likely to be spoken to primarily in Spanish (26 percent) than are 3-year-olds (22 percent). Among those in households where a language other than English is primarily spoken to the child, 4-year-olds are more likely to be usually read to in a language other than English, more often have no children's books written in English, and are more likely to watch only non-English television programs, compared to 3-year-olds.
Changes in Home Language Across Cohorts. The percentage of entering Head Start children who are spoken to primarily in a language other than English at home was significantly higher in fall 2009 (26 percent) than in fall 2000 (18 percent), but the percentage did not change significantly between consecutive cohorts.22
Cumulative Socioeconomic Risk
Status in Fall 2009. Coming from a low-income family or single-parent household and having parents who did not complete high school are identified as risk factors for poor developmental and educational outcomes.23 Children with one of these risk factors are more likely to have others, and research has shown that having more than one risk factor can have negative consequences for children’s development and school readiness skills.24 In FACES 2009, a socioeconomic risk index was created as a measure of cumulative family risk. The number of risks is based on three characteristics of children’s living circumstances: (1) whether the child resides in a single-parent household, (2) whether the household income is below the federal poverty threshold, and (3) whether the child’s mother has less than a high school diploma.
More than half (52 percent) of children entering Head Start in 2009 have more than one of these

9
risk factors. Fourteen percent of entering Head Start children have none, and 13 percent have all three. Most have either one (34 percent) or two (39 percent) of the risks.
The number of family risks varies significantly by age and race/ethnicity. Three-year-olds are more likely to have no family risks (15 percent) than 4-year-olds (12 percent). African American and Hispanic/Latino children are more likely to have multiple family risks, and less likely to have no risks, than are White children. Children whose parents primarily speak a language other than English to them at home are more likely to have multiple family risks (59 percent) than other children (49 percent), and they are less likely to have no family risks (10 and 16 percent, respectively).
Changes in Socioeconomic Risk Across Cohorts. In almost every FACES cohort since 2000, more than half (between 52 and 54 percent) of entering Head Start children have had more than one family risk. The sole exception is the 2006 cohort, in which 48 percent were in families with two or more risks.
Home Learning Activities and Parenting Practices
Status in Fall 2009. Head Start children participate in a variety of learning activities with their families, both in and outside of the home.
One common activity is being read to by a parent or other family member. More than three-quarters (76 percent) of newly entering Head Start children in 2009 are read to by a family member at least three times a week, including 39 percent who are read to every day. For comparison, the 2007 National Household Education Survey (NHES) found that 55 percent of all children ages 3 to 5 are read to daily by a family member (Federal Interagency Forum on Child and Family Statistics 2010).
The frequency of reading varies significantly by race/ethnicity, number of family risk factors, and primary home language (Figure 4). White children are read to by family members more frequently than are African American children, who in turn are read to more frequently than Hispanic/Latino children (88 percent of White children are read to at least three times during the week, compared to 78 percent of African American children and 66 percent of Hispanic/Latino children). Children with multiple family risk factors are less likely to be read to at least three times a week than are children with just one risk factor or with no risk factors. Children who are primarily spoken to in a language other than English at home are read to by family members less often than are other children, and those spoken to primarily in Spanish at home are less likely to be read to three or more times a week than those with other non-English home languages (not shown).
Figure 4. Family Member Read to Child at Least Three Times in Past Week: Fall 2009
88 78
66
82 79 72
81
61
0 10 20 30 40 50 60 70 80 90
100
White, Non-Hispanic*
African American,
Non-Hispanic*
Hispanic/ Latino*
0 risks 1 risk 2 or more risks*
English Other Language*
Perc
enta
ge o
f Chi
ldre
n
Source: Fall 2009 FACES Parent Interview.
Note: Statistics are weighted to represent all children who entered Head Start for the first time in fall 2009.
* Within each category (race/ethnicity, risk, language), asterisks indicate subgroups that are statistically significantly different from other subgroups in the category at the p < .05 level.

10
Besides reading, the most common home learning activities—in which at least 90 percent of children’s families engaged in the past week—are playing with toys or games indoors; teaching letters, words, or numbers; taking children along on errands; and talking about Head Start (Figure 5). The most common activities in which family
members engaged in the past month involve taking the child with them to a playground or park, to a shopping mall, and to church activities (Figure 6). For each of these destinations, more than half of families (53 percent or more) had taken their Head Start child in the past month.
Figure 5. Family Members’ Activities with Child in Past Week: Fall 2009
81
97
83
66
97
85 95
89 90 94
0
20
40
60
80
100
120
Stories Letters, words, or numbers
Songs or music
Arts and crafts
Toys or games indoors
Games, sports, or exercise
Errands Household chores
Counted different things
Talked about Head
Start
Perc
enta
ge o
f Chi
ldre
n
Source: Fall 2009 FACES Parent Interview.
Note: Statistics are weighted to represent all children who entered Head Start for the first time in fall 2009.
Figure 6. Family Members’ Activities with Child in Past Month: Fall 2009
37 35
15
75
16
90
27
44 42 35
53
0
10
20
30
40
50
60
70
80
90
100
Library Movie Play/ concert
Mall Gallery/ museum
Playground/ park
Zoo/ aquarium
Discussed heritage
Community event
Sporting event
Church activity
Perc
enta
ge o
f Chi
ldre
n
Source: Fall 2009 FACES Parent Interview.
Note: Statistics are weighted to represent all children who entered Head Start for the first time in fall 2009.
11
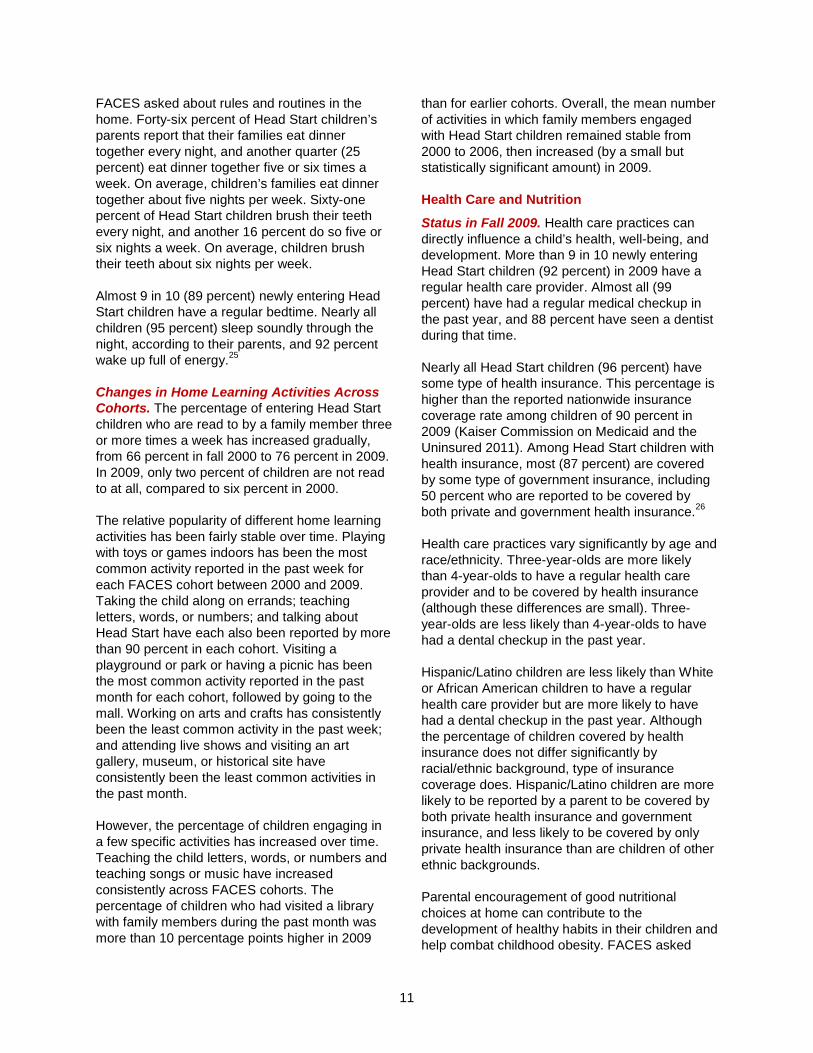
FACES asked about rules and routines in the home. Forty-six percent of Head Start children’s parents report that their families eat dinner together every night, and another quarter (25 percent) eat dinner together five or six times a week. On average, children’s families eat dinner together about five nights per week. Sixty-one percent of Head Start children brush their teeth every night, and another 16 percent do so five or six nights a week. On average, children brush their teeth about six nights per week.
Almost 9 in 10 (89 percent) newly entering Head Start children have a regular bedtime. Nearly all children (95 percent) sleep soundly through the night, according to their parents, and 92 percent wake up full of energy.25
Changes in Home Learning Activities Across Cohorts. The percentage of entering Head Start children who are read to by a family member three or more times a week has increased gradually, from 66 percent in fall 2000 to 76 percent in 2009. In 2009, only two percent of children are not read to at all, compared to six percent in 2000.
The relative popularity of different home learning activities has been fairly stable over time. Playing with toys or games indoors has been the most common activity reported in the past week for each FACES cohort between 2000 and 2009. Taking the child along on errands; teaching letters, words, or numbers; and talking about Head Start have each also been reported by more than 90 percent in each cohort. Visiting a playground or park or having a picnic has been the most common activity reported in the past month for each cohort, followed by going to the mall. Working on arts and crafts has consistently been the least common activity in the past week; and attending live shows and visiting an art gallery, museum, or historical site have consistently been the least common activities in the past month.
However, the percentage of children engaging in a few specific activities has increased over time. Teaching the child letters, words, or numbers and teaching songs or music have increased consistently across FACES cohorts. The percentage of children who had visited a library with family members during the past month was more than 10 percentage points higher in 2009
than for earlier cohorts. Overall, the mean number of activities in which family members engaged with Head Start children remained stable from 2000 to 2006, then increased (by a small but statistically significant amount) in 2009.
Health Care and Nutrition
Status in Fall 2009. Health care practices can directly influence a child’s health, well-being, and development. More than 9 in 10 newly entering Head Start children (92 percent) in 2009 have a regular health care provider. Almost all (99 percent) have had a regular medical checkup in the past year, and 88 percent have seen a dentist during that time.
Nearly all Head Start children (96 percent) have some type of health insurance. This percentage is higher than the reported nationwide insurance coverage rate among children of 90 percent in 2009 (Kaiser Commission on Medicaid and the Uninsured 2011). Among Head Start children with health insurance, most (87 percent) are covered by some type of government insurance, including 50 percent who are reported to be covered by both private and government health insurance.26
Health care practices vary significantly by age and race/ethnicity. Three-year-olds are more likely than 4-year-olds to have a regular health care provider and to be covered by health insurance (although these differences are small). Three-year-olds are less likely than 4-year-olds to have had a dental checkup in the past year.
Hispanic/Latino children are less likely than White or African American children to have a regular health care provider but are more likely to have had a dental checkup in the past year. Although the percentage of children covered by health insurance does not differ significantly by racial/ethnic background, type of insurance coverage does. Hispanic/Latino children are more likely to be reported by a parent to be covered by both private health insurance and government insurance, and less likely to be covered by only private health insurance than are children of other ethnic backgrounds.
Parental encouragement of good nutritional choices at home can contribute to the development of healthy habits in their children and help combat childhood obesity. FACES asked

12
parents to report on the foods their child consumed over the past week, concentrating on types of foods that are particularly salient for young children, such as milk, fruits and vegetables, soda, fast food, salty snacks, and sweets. Figure 7 shows their reported consumption relative to thresholds that indicate healthier nutritional choices in these areas. Based on parent reports regarding the past week, two-
thirds of Head Start children (67 percent) drink milk at least twice a day, 38 percent eat fruit at least twice a day, and one-third (34 percent) eat vegetables that often. Almost three-quarters (74 percent) eat salty snacks less than once a day, and two-thirds (67 percent) eat sweets less than once a day. One-third (33 percent) consume no fast food, and 24 percent do not drink soda or other sweetened beverages.
Figure 7. Child Nutrition in Past Week: Fall 2009
67
38 34
24
33
67 74
0
10
20
30
40
50
60
70
80
Milk at least twice/day
Fruit at least twice/day
Vegetables at least twice/day
No soda or sweetened beverages
No fast food
Sweets less than once/day
Salty snacks less than once/day
Perc
enta
ge o
f Chi
ldre
n
Source: Fall 2009 FACES Parent Interview.
Note: Statistics are weighted to represent all children who entered Head Start for the first time in fall 2009.
Nutritional intake varies by child’s age, with younger Head Start children more likely to meet some of the thresholds that indicate healthier nutritional choices. In particular, 3-year-olds are more likely than 4-year-olds to eat fruits at least twice a day, vegetables at least twice a day, and salty snacks less than once a day.
Changes in Health Care Across Cohorts. The proportion of Head Start children reported to be covered by both private insurance and some type of government insurance increased from 33 percent in 2006 to 50 percent in 2009.27 This was driven by both an increase in those reporting private insurance (from 52 to 63 percent) and an increase in those reporting government insurance (from 82 to 87 percent).
Child Care
The NHES 2005 Early Childhood Program Participation survey found that almost three-quarters (73 percent) of children ages 3 to 5 who have not yet entered school are in some type of nonparental care arrangement, and that these children spend an average of 28 hours per week in such care (Iruka and Carver 2006). Because many children (43 percent) attend half-day Head Start programs, and even full-day programs may not match the schedules of some working parents, FACES asked about child care arrangements before and after Head Start. Newly entering children spend an average of 25 hours per week in their Head Start program. More than a third of them (37 percent) are also cared for by someone other than their parents before or after Head Start

13
(Figure 8), spending an additional 15 hours per week, on average, away from their parents. Children attending full-day Head Start programs are no less likely to be in child care than are those in half-day Head Start programs. However, among
children in child care, those attending full-day Head Start programs spend less time in child care (14 hours per week, on average) than those attending half-day programs (about 16 hours).
Figure 8. Child Care Arrangements Before and After Head Start: Fall 2009
63% 8%
25%
3% 1%
No child care before or after Head Start
Center-based care
Relative
Non-relative
Equal time in multiple types of care
a
Source: Fall 2009 FACES Parent Interview.
Note: Statistics are weighted to represent all children who entered Head Start for the first time in fall 2009. a
Center-based care includes wraparound care provided at the child's Head Start site that is not part of the Head Start program.
Care by a relative is the most common type of child care, received by one-quarter (25 percent) of newly entering Head Start children. Only eight percent of children are cared for in a center-based program (including wraparound care provided at the Head Start site) in addition to Head Start, and three percent are cared for by a non-relative in a home-based setting.
Child care usage varies significantly by age and race/ethnicity. Use of before- and after-care is more common for 4-year-olds (41 percent) than for 3-year-olds (35 percent). African American children are more likely to be in child care before or after Head Start than are children of other racial/ethnic backgrounds. Hispanic/Latino children are least likely to be in center-based care and are more likely to be in home-based non-relative care, compared to White and African American children. The patterns of child care usage may relate to parent employment patterns, because children whose mothers are employed are more likely to be in child care than those whose mothers do not work outside the home.
CHILD COGNITIVE DEVELOPMENT In this section, we describe children’s cognitive, social-emotional, and health and physical development as they enter Head Start for the first time in fall 2009, highlighting differences in children’s performance by important groups, including children’s age at program entry, gender, race/ethnicity, and number of family risks.28 Specifically, in the area of children’s cognitive development, we provide descriptive information on the skills of children who were assessed in English at Head Start entry and separately provide similar information for children who were assessed in Spanish. In addition, where comparable measures exist, we report on changes and trends in the skills that children bring with them to Head Start, using data from FACES 2000 through 2009. In some cases, we describe changes in skills that have only been measured twice in FACES (such as the set of broader early math skills measured using items from the Early Childhood Longitudinal Study, Birth Cohort (ECLS–B). We report on children’s skills on norm-

14
and criterion-referenced measures, using raw scores, W scores, item response theory (IRT)-based scores, and standard scores. Standard scores provide information on children’s performance relative to same-age peers. These scores have a mean of 100 and a standard deviation of 15. An increase in a child’s standard score signifies that the child is making progress relative to peers. In contrast, raw, W, and IRT scores allow for measurement of change or growth in performance on the same scale over time. They are an indicator of absolute, rather than relative, performance.
Instruments used. To assess children’s skills and knowledge, norm- and criterion-referenced measures of language, literacy, and math development were directly administered to the children. Receptive and expressive vocabulary were measured using the Peabody Picture Vocabulary Test, Fourth Edition (PPVT-4) (Dunn and Dunn 2006) and the Expressive One-Word Picture Vocabulary Test (EOWPVT; EOWPVT-SBE; Brownell 2000). The EOWPVT and EOWPVT-SBE measure the expressive vocabulary of children from English- and Spanish-speaking households. The EOWPVT provides a measure of children's expressive vocabulary relative to English-speaking peers nationally, while the EOWPVT-SBE reflects children's vocabulary skills relative to Spanish-bilingual and Spanish-dominant peers.29 In addition, the Test de Vocabulario Imagenes Peabody (TVIP) (Dunn et al. 1986) was used to measure children’s receptive vocabulary in Spanish.30 The assessment battery also measured children’s letter-word knowledge and skills in applied problems and early writing, using the Letter-Word Identification, Applied Problems, and Spelling subtests from the Woodcock-Johnson Tests of Achievement, Third Edition (Woodcock et al. 2001) and the Batería III Woodcock-Muñoz Tests of Achievement (Woodcock et al. 2004).31 A supplemental set of math items from the ECLS–B math assessment was used to assess a broader set of skills than is captured by Applied Problems.32
Language screening. At Head Start entry in fall 2009, the direct child assessment began with a screening to determine whether children who primarily spoke a language other than English at home should be assessed in English, in Spanish, or with a short assessment of vocabulary and height and weight measurements. Two subtests
from the Preschool Language Assessment Survey 2000 (Pre-LAS 2000; Duncan and DeAvila 1998), Simon Says and Art Show, were used as screening tools. All children were also administered the PPVT-4 and the EOWPVT or EOWPVT-SBE to measure their English receptive vocabulary and expressive vocabulary, respectively. Following administration of both measures, children whose home language33 was Spanish and who made five consecutive errors on Simon Says and Art Show were then routed to the Spanish-language cognitive assessment.34 Similarly, a child who made five consecutive errors on both the Simon Says and Art Show and primarily spoke a language other than English or Spanish was routed out of the cognitive assessment following administration of the vocabulary measures and was weighed and measured for height. Children who passed the screener and whose primary home language was a language other English received the cognitive assessment battery in English. Those from homes in which English was primarily spoken were administered the cognitive assessment battery in English, regardless of their scores on the language screener. Table 2 presents the routing procedures for the assessment based on a child’s home language and performance on the screener.
Status in Fall 2009: Children Assessed in English. On average, children entering Head Start for the first time in fall 2009 score below national norms on measures of language, literacy, and math development. They score approximately one standard deviation below national norms on English receptive vocabulary (87.2), two-thirds of a standard deviation below national norms on applied problems (89.5), and one-third of a standard deviation below national norms on letter-word identification (95.9) and early writing (94.5). Children also score more than one standard deviation below norms on average in expressive vocabulary (81.6).
On the ECLS–B math items, the FACES sample is performing about one standard deviation below the ECLS–B sample. For example, while nearly two-thirds of children (63 percent) in the ECLS–B national sample were able to demonstrate number/shape skills, only 28 percent of Head Start children are able to demonstrate these skills at the start of the program year.35 Children in Head Start score in the middle range on the counting task (7.9 out of a possible 20) and, on average, can count up to 8 at the start of the program year.

15
Table 2. FACES 2009 Language Routing Assessment Paths
Home Language
English
Spanish Other
English Path Spanish Path English Path Non–English Path
Language Screener (Simon Says and Art Show)
Language Screener (Simon Says and Art Show)
Language Screener (Simon Says and Art Show)
Language Screener (Simon Says and Art Show)
Language Screener (Simon Says and Art Show)
PPVT-4 PPVT-4 PPVT-4 PPVT-4 PPVT-4
EOWPVT EOWPVT-SBE (conceptually scored)
EOWPVT-SBE (conceptually scored)
EOWPVT EOWPVT
-- TVIP TVIP -- --
WJ III (Spelling, Letter-Word Identification, Applied Problems)
WJ III (Spelling, Letter-Word Identification, Applied Problems)
Batería III (Spelling, Letter-Word Identification, Applied Problems)
WJ III (Spelling, Letter-Word Identification, Applied Problems)
--
ECLS–B Math
ECLS–B Math ECLS–B Math (Spanish translation available)
ECLS–B Math
--
Executive Functioning Pencil Tapping Taska
Executive Functioning Pencil Tapping Taska
Executive Functioning Pencil Tapping Taska (Spanish translation available)
Executive Functioning Pencil Tapping Taska
--
Height and Weight Height and Weight Height and Weight Height and Weight Height and Weight
EOWPVT = Expressive One-Word Picture Vocabulary Test
EOWPVT-SBE = Expressive One-Word Picture Vocabulary Test, Spanish-Bilingual Edition
PPVT–4 = Peabody Picture Vocabulary Test-Fourth Edition
TVIP = Test de Vocabulario de Imagines Peabody
WJ III = Woodcock-Johnson III Tests of Achievement
Batería III = Batería III Woodcock-Muñoz Tests of Achievement. a This task is administered only to children age 4 and older.
Diversity exists in the entering Head Start population (Figure 9). For example, mean standard scores for the highest quartile of children entering Head Start are at or near national averages in two areas: 100.5 in letter-word knowledge and 99.3 in early writing skills. However, in receptive vocabulary, children in the highest quartile score, on average, 92.5, about two-thirds of a standard deviation below national
norms. The highest quartile scores in expressive vocabulary, on average, are 87.8, nearly one standard deviation below national norms. Mean standard scores for the lowest quartile of Head Start children are more than one standard deviation below national averages (for example, 69.8 in receptive vocabulary and 77.5 in early writing skills).

16
Figure 9. Mean Standard Scores for All Children, the Bottom Quartile, and the Top Quartile Among Those Taking the Assessment in English: Fall 2009
87.2 81.6
95.9 89.5
94.5
69.8 63.1
75.1 70.2
77.5
92.5 87.8
100.5 95.0 99.3
0
20
40
60
80
100
120
PPVT-4 EOWPVT WJ III Letter-Word
WJ III Applied Problems
WJ III Spelling
Mea
n St
anda
rd S
core
s
Overall Bottom Quartile Top Quartile
Source: Fall 2009 FACES Direct Child Assessment.
Note: Statistics are weighted to represent all children who entered Head Start for the first time in fall 2009. Reported scores are for children who passed the threshold on the language screener and took the
assessment in English, including children from Spanish and Other language households.
Newly entering 3-year-olds who took the assessment in English are performing closer to their same-age peers nationally than are entering 4-year-olds across several measures. For example, in English receptive vocabulary, letter-word knowledge, and applied problems, differences in relative performance favor younger Head Start children. The two age groups score similarly relative to same-age peers in expressive vocabulary and early writing, however. Using scores reflecting absolute performance, such as W ability and IRT scores, 4-year-olds are outperforming 3-year-olds, indicating that absolute (rather than age-normed) performance of 4-year-olds exceeds that of 3-year-olds. Similarly, on the ECLS–B math items, 4-year-olds outperform 3-year-olds. For example, 4-year-olds are more than twice as likely to have mastered the number/shape skill set (44 versus 17 percent).
Relative to same-age peers, newly entering girls who are assessed in English perform better than boys on letter-word knowledge, early writing, and applied problems. Girls also are more likely than boys to demonstrate number and shape skills. There are no gender differences in receptive or expressive vocabulary. White children score
higher on applied problems than do African American and Hispanic/Latino children. While they also score closer to norms than do African American children in English receptive vocabulary, expressive vocabulary, letter-word knowledge, ECLS–B math, and ECLS–B number/shape proficiency, both of these groups of children score closer to norms than Hispanic/Latino children across these areas. Finally, children with no or one family risk score closer to norms in English receptive vocabulary and expressive vocabulary than do children with two or more risks. Those with no family risks score better than those with one or more risks in letter-word knowledge and the ECLS–B math items.
Status in Fall 2009: Children Assessed in Spanish. Like other Head Start children, children taking the assessment in Spanish score below norms on many measures of language, literacy, and math development.36 Head Start entrants assessed in Spanish score approximately one standard deviation below norms on Spanish receptive vocabulary (84.8), two-thirds of a standard deviation below norms in early writing (90.5), and more than one standard deviation
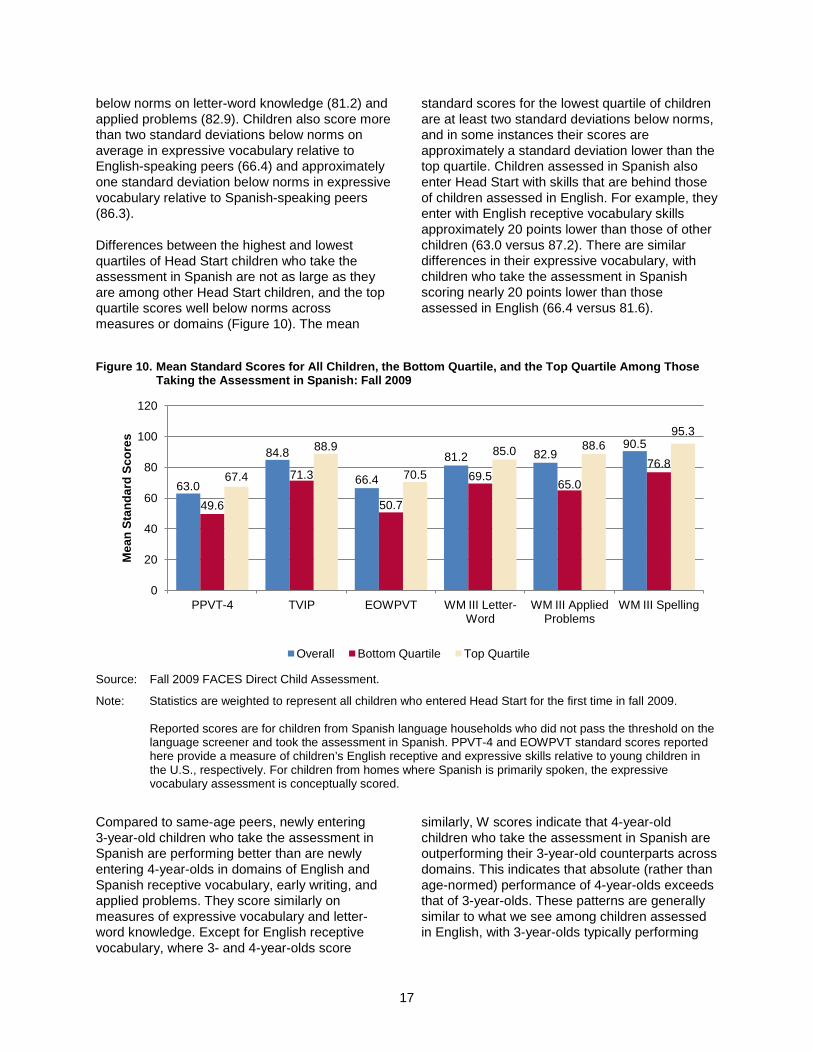
17
below norms on letter-word knowledge (81.2) and applied problems (82.9). Children also score more than two standard deviations below norms on average in expressive vocabulary relative to English-speaking peers (66.4) and approximately one standard deviation below norms in expressive vocabulary relative to Spanish-speaking peers (86.3).
Differences between the highest and lowest quartiles of Head Start children who take the assessment in Spanish are not as large as they are among other Head Start children, and the top quartile scores well below norms across measures or domains (Figure 10). The mean
standard scores for the lowest quartile of children are at least two standard deviations below norms, and in some instances their scores are approximately a standard deviation lower than the top quartile. Children assessed in Spanish also enter Head Start with skills that are behind those of children assessed in English. For example, they enter with English receptive vocabulary skills approximately 20 points lower than those of other children (63.0 versus 87.2). There are similar differences in their expressive vocabulary, with children who take the assessment in Spanish scoring nearly 20 points lower than those assessed in English (66.4 versus 81.6).
Figure 10. Mean Standard Scores for All Children, the Bottom Quartile, and the Top Quartile Among Those Taking the Assessment in Spanish: Fall 2009
63.0
84.8
66.4
81.2 82.9 90.5
49.6
71.3
50.7
69.5 65.0
76.8 67.4
88.9
70.5
85.0 88.6 95.3
0
20
40
60
80
100
120
PPVT-4 TVIP EOWPVT WM III Letter-Word
WM III Applied Problems
WM III Spelling
Mea
n St
anda
rd S
core
s
Overall Bottom Quartile Top Quartile
Source: Fall 2009 FACES Direct Child Assessment.
Note: Statistics are weighted to represent all children who entered Head Start for the first time in fall 2009. Reported scores are for children from Spanish language households who did not pass the threshold on the
language screener and took the assessment in Spanish. PPVT-4 and EOWPVT standard scores reported here provide a measure of children’s English receptive and expressive skills relative to young children in the U.S., respectively. For children from homes where Spanish is primarily spoken, the expressive vocabulary assessment is conceptually scored.
Compared to same-age peers, newly entering 3-year-old children who take the assessment in Spanish are performing better than are newly entering 4-year-olds in domains of English and Spanish receptive vocabulary, early writing, and applied problems. They score similarly on measures of expressive vocabulary and letter-word knowledge. Except for English receptive vocabulary, where 3- and 4-year-olds score
similarly, W scores indicate that 4-year-old children who take the assessment in Spanish are outperforming their 3-year-old counterparts across domains. This indicates that absolute (rather than age-normed) performance of 4-year-olds exceeds that of 3-year-olds. These patterns are generally similar to what we see among children assessed in English, with 3-year-olds typically performing

18
closer to same-age peers, but 4-year-olds having higher skills in absolute terms.
There are two differences by gender on the Spanish assessments. Relative to same-age peers, newly entering girls taking the assessment in Spanish perform better than boys in early writing and applied problems. Except for early writing and applied problems, differences by number of family risks are not present among children taking the assessment in Spanish. In both areas, differences favor children with fewer risks.
Status in Fall 2009 by Language of Assessment. As described previously, FACES 2009 assesses the expressive vocabulary and English receptive vocabulary of all children regardless of home language, providing an opportunity to understand the language development of all children. For children from
Spanish-speaking households, FACES assesses their receptive vocabulary in English and in Spanish, as well as their conceptual expressive vocabulary.37 The former provides an opportunity to understand the language development of this group of children both in English and in their home language, while the latter depicts their development across languages. Children from households where a language other than English is spoken (dual language learners or DLLs) enter Head Start with English receptive vocabulary skills (71.5) considerably behind those of children who come from households where English is the primary language spoken in the home (88.8; Figure 11). As expected, children who are DLLs who are unable to pass the language screener have the lowest scores. We see similar patterns in expressive vocabulary relative to English speaking peers, with those unable to pass the language screener performing most poorly.
Figure 11. Mean PPVT-4 and EOWPVT Standard Scores by Language of Assessment: Fall 2009
88.8 82.7
71.5 69.7 77.1
74.4
63.3 66.0
0
10
20
30
40
50
60
70
80
90
100
PPVT-4 EOWPVT
Mea
n St
anda
rd S
core
s
Non-DLLs All DLLs All DLLs Passing Screener All DLLs Failing Screener
Source: Fall 2009 FACES Direct Child Assessment.
Note: Statistics are weighted to represent all children who entered Head Start for the first time in fall 2009.
Among children from Spanish-speaking households, when looking at expressive vocabulary relative to Spanish-dominant and Spanish-bilingual peers, those who are able to pass the language screener have stronger skills than those who do not pass the language screener. In fact, those passing the screener score near norms (98.3) relative to Spanish-speaking peers.38 Regardless of performance on
the screener, both groups score closer to the Spanish-bilingual norms than to the English norms on expressive vocabulary. When examining their Spanish receptive vocabulary skills, there are only small differences based on children’s ability to pass the language screener. That is, both those who do and do not demonstrate enough English proficiency to be assessed in English have similar Spanish receptive vocabulary skills.

19
Changes in Children’s Entering Skills Across Cohorts. In this section, we describe the language, literacy, and math skills of children as they entered Head Start in fall 2000, 2003, 2006, and 2009, focusing on children who were assessed in English. We highlight trends or patterns in these skills over time. When specific data are not available for all children in a given cohort, we exclude the cohort in our discussion of outcomes in that area. For example, in FACES 2000, the Woodcock-Johnson subtests were only administered to children age 4 and older. We thus exclude this cohort when describing children’s skills on these subtests in this section.
Various factors influence our ability to provide comparable estimates of children’s cognitive skills across cohorts. For example, the language screening and routing process differs across cohorts, influencing the group of children who were administered the English (versus Spanish) version of the assessment battery. In addition, newer versions of the direct assessment measures were used in the more recent cohorts, which influences interpretation of standard scores and children’s performance relative to norms.39
Across cohorts, most children are assessed in English at Head Start entry. Between 12 and 16 percent are assessed in Spanish. Very small numbers speak a language other than English or
Spanish and cannot be fully assessed across domains.
Children entering Head Start for the first time in fall 2003, 2006, and 200940 score below national norms on measures of language, literacy, and math development (Table 3).41 It is important to keep in mind that these are the skills that children have when they arrive at the program, and these skills are influenced by home life and other early childhood settings before Head Start. At program entry in 2003, 2006, and 2009, they score approximately one standard deviation below national norms on receptive vocabulary (85.1, 85.4, and 87.2, respectively), two-thirds of a standard deviation below national norms on applied problems (88.8, 89.8, and 89.5, respectively), and one-third of a standard deviation below national norms on letter-word identification (92.8, 93.9, and 95.9, respectively) and early writing (93.4, 95.0, and 94.5, respectively). Thus, children score lowest in receptive vocabulary and applied problems at program entry. They score closer to norms in letter-word knowledge and early writing. In their entering receptive vocabulary and letter-word knowledge skills, children move closer to norms between fall 2003 and 2009. However, the norming sample and versions used for measures differ, depending on the FACES cohort of interest.
Table 3. Standardized Scores for 3- and 4-Year-Old Children Taking the Assessment in English: Fall 2000–2009
Mean Scales Fall 2000 Fall 2003 Fall 2006 Fall 2009 PPVT Standard Score 85.1 85.1 85.4 87.2 WJ: Letter-Word Identification Standard Score NA 92.8 93.9 95.9 WJ: Dictation/Spelling Standard Score NA 93.4 95.0 94.5 WJ: Applied Problems Standard Score NA 88.8 89.8 89.5 ECLS–B Math IRT Score NA NA 7.4 6.9 ECLS–B Number/Shape Proficiency Probability Score NA NA 0.25 0.28 Combined ECLS–B/WJ III Applied Problems IRT Score NA NA 14.0 13.6 WJ: Letter-Word Identification W Ability Score NA 305.5 304.7 308.1 WJ: Dictation/Spelling W Ability Score NA 346.8 345.0 345.8 WJ: Applied Problems W Ability Score NA 376.2 374.8 376.1
Source: Fall 2000, 2003, 2006, 2009 FACES Direct Child Assessment.
Note: Statistics are weighted to represent all children entering Head Start for the first time in the cohort year.
NA = not available or administered. Unlike in other cohorts, in FACES 2000, the Woodcock-Johnson Tests of Achievement were only administered to children age 4 and older. Scores for this cohort are only for children who are 4 and older. ECLS-B math items were not administered in FACES 2000 or 2003.

20
In absolute skills, as measured by W scores, children have similar early writing and applied problems skills in fall 2003, 2006, and 2009. Children’s entering letter-word scores are statistically significantly higher in fall 2009 than in 2003, although these differences are small.
CHILD SOCIAL-EMOTIONAL DEVELOPMENT FACES 2009 uses measures from a variety of sources—teacher, parent, and assessor—to add a dimension to children’s developmental status at entry into Head Start. Using items taken from the Behavior Problems Index (Peterson and Zill 1986), the Personal Maturity Scale (Entwisle et al. 1997), and the Social Skills Rating Scale (Gresham and Elliott 1990), we present teacher reports of children’s cooperative classroom behavior, such as making friends easily and waiting their turn in games or other activities, as well as their problem behaviors in the classroom, such as being very restless and unable to sit still or disrupting ongoing activities. We also present teachers’ ratings of children’s approaches to learning, using the ECLS–K Approaches to Learning scale (U.S. Department of Education 2002).42 Parents also reported on children’s social skills and problem behaviors in the home environment. Using the Leiter-Revised Examiner Rating Scale (Leiter-R; Roid and Miller 1997), assessors rated children’s behaviors during the assessment situation in such areas as attention, organization and impulse control, activity level, and sociability. Finally, for FACES 2009, a pencil tapping task (Blair 2002; Diamond and Taylor 1996; Smith-Donald et al. 2007) was added to capture 4-year-old children’s executive functioning, also reported in this section.
As with the cognitive measures, we describe the skills and behaviors of all children in fall 2009, and then for important groups of children (defined by children’s age at program entry, gender, race/ethnicity, and number of family risks). Where comparable data are available, we provide comparisons across cohorts of Head Start children’s skills and abilities as measured at
entrance to the program. Where possible, we present national data on children’s social-emotional development using information from other national studies.
Status in Fall 2009. On average, both teachers and parents rate many items asking about children’s behavior problems as being “not true” and items asking about children’s social skills as being “very true.” For example, at Head Start entry, teachers rate children as having mean social skills scores that are about 15 out of a possible 24 and mean problem behavior scores that are 5.3 out of a possible 36). They rate children’s aggressive, hyperactive, and withdrawn behavior problems at similar levels. Parents rate children as having strong social skills (12 out of a possible 16) and few behavior problems (5.4 out of a possible 24).
On the Approaches to Learning scale, on average, teachers rate children as “sometimes” to “often” (mean of 1.6 out of 3) demonstrating skills related to attention, persistence, adaptability, and independence. For example, they rate about three-quarters of children as “sometimes” or “often” paying attention well (77 percent), persisting in completing tasks (75 percent), and showing eagerness to learn new things (74 percent; Figure 12). Finally, based on children’s behavior during the direct assessment, assessors rate children as demonstrating social/cognitive skills that are about one standard deviation below norms and same-age peers (87.1).
As noted previously, in FACES 2009, the pencil tapping task was added to capture 4-year-old children’s executive functioning43. In the task, children are asked to inhibit the natural response to imitate the adult assessor exactly (or to tap repeatedly) and instead to keep in mind that the rule is to do the opposite of what the assessor does. At Head Start entry, children are able to inhibit their initial impulse and respond correctly on the pencil tapping task 42 percent of the time.44

21
Figure 12. Percentage of Children Demonstrating Approaches to Learning Behaviors: Fall 2009
7 8 6
77 75 74
16 17 20
0
10
20
30
40
50
60
70
80
90
Pays attention well Persists in completing tasks Eager to learn new things
Perc
enta
ge o
f Chi
ldre
n
Never Sometimes/Often Very Often
Source: Fall 2009 FACES Direct Child Assessment.
Note: Statistics are weighted to represent all children who entered Head Start for the first time in fall 2009.
Entering children show expected developmental differences in levels of social-emotional readiness. Teachers report that 4-year-olds have more social skills and fewer total problem behaviors than 3-year-olds (Figure 13). Teachers report that 4-year-olds have more advanced approaches to learning than 3-year-olds. Parents rate 4-year-olds as
having more social skills than 3-year-olds. Based on the child’s behavior during the direct assessment, assessors rate 4-year-olds as demonstrating better social/cognitive skills than 3-year-olds. Both groups score about one standard deviation below norms in this area, however (88.3 and 86.3, respectively).
Figure 13. Children’s Teacher-Reported Social-Emotional Development: Fall 2009
14.2
5.6
1.5
16.1
4.7
1.7
0
2
4
6
8
10
12
14
16
18
Social Skills (range = 0 to 24)*
Problem Behaviors (range = 0 to 36)*
Approaches to Learning (range = 0 to 3)*
Mea
n Sc
ore
3-Year-Olds 4-Year-Olds
Source: Fall 2009 FACES Direct Child Assessment.
Note: Statistics are weighted to represent all children who entered Head Start for the first time in fall 2009.
*Asterisk indicates that the difference between the age groups is statistically significant at the p < .05 level.

22
In addition to developmental differences, gender differences emerge in reports of children’s social skills and problem behaviors. Both teachers and parents report that boys have fewer social skills and more problem behaviors than girls. Among teacher-reported problem behaviors, boys show more hyperactive, aggressive, and withdrawn behavior problems than girls. Girls also earn higher scores from teachers on their approaches to learning. There are no differences by gender in children's ability to inhibit their initial impulse and respond correctly on the pencil tapping task. Based on the child’s behavior during the direct assessment, assessors rate girls as having better social/cognitive skills than boys.
In terms of child race/ethnicity, teachers report more total behavior problems for White children in their classrooms than for African American and Hispanic/Latino children. They also report them as having more withdrawn behavior problems than other children. They report Hispanic/Latino children as having fewer aggressive and hyperactive behaviors and higher approaches to learning scores than African American and White children. Teachers also report more social skills for Hispanic/Latino children than for White children. Parents of African American and White children report fewer behavior problems than do parents of Hispanic/Latino children. Parents of African American children report more social skills than do parents of Hispanic/Latino and White children. White children are better able to inhibit their initial impulse and respond correctly on the pencil tapping task than are African American and Hispanic/Latino children. Assessors rate African American children as having fewer social/cognitive skills than White and Hispanic/Latino children, including attention, organization/impulse control, and activity level. Thus, teachers report White children as having more behavior problems than other children, and Hispanic/Latino children as having fewer aggressive and hyperactive problems and more social skills and positive approaches to learning. In contrast, parents of Hispanic/Latino report them as having more problem behaviors than other children.
Parents of children with two or more family risks report more behavior problems than do parents of children with one or no family risks. There are no differences in executive function (pencil tapping) by number of family risks. Assessors rate children with two or more family risks as having fewer social/cognitive skills than children with no risks, including attention and organization/impulse control.
Changes in Children’s Entering Skills Across Cohorts. Parents and teachers report small but statistically significant differences in children’s entering social-emotional skills between fall 2000 and 2009 (Table 4). For example, teacher-reported social skills increase slightly over time. Parent-reported problem behaviors decrease slightly over time. Based on the behavior during the direct assessment, assessors rate children who entered the program in fall 2006 as demonstrating social/cognitive skills that are closer to norms than those who entered in fall 2009.45 Thus, assessor ratings decrease over time.
CHILD HEALTH AND PHYSICAL DEVELOPMENT A child’s health status is an integral part of well-being and development. Parents and teachers reported on several aspects of children’s health and physical development, including disability status and health and developmental conditions or concerns. As in FACES 2006, each child’s height and weight were also measured to support analyses of obesity or underweight status. In this section, we provide information from teacher reports on children’s status in fall 2009, including child disability and Individualized Education Plan (IEP) or Individualized Family Service Plan (IFSP) status. From parent reports, we present child health status. We also report on Head Start children’s height and weight and Body Mass Index (BMI); these data are compared to FACES 2006 data and national data from the National Center for Health Statistics and the National Center for Education Statistics. Trends over time are discussed as available across cohorts.

23
Table 4. Parent Interview, Teacher Child Report, and Assessor Rating Measures: Fall 2000–2009
Mean
Scales Fall 2000 Fall 2003 Fall 2006 Fall 2009
Teacher Child Report Social Skills* 14.6 15.5 15.5 15.0
Parent Interview Social Skills/Positive Approaches to Learning* 12.1 15.7 11.9 12.0 Total Behavior Problems* 6.2 4.4 5.8 5.4
Assessor Rating Leiter Cognitive/ Social Raw Score* NA NA 54.6 51.4 Leiter Cognitive/ Social Standard Score a* NA NA 90.0 87.1 Attention NA NA 19.3 18.3 Organization/Impulse Control* NA NA 15.4 14.5 Activity Level* NA NA 8.1 7.4 Sociability* NA NA 11.9 11.2
Source: Fall 2000, 2003, 2006, 2009 FACES Direct Child Assessment, Teacher Child Report, and Parent Interview.
Note: Statistics are weighted to represent all children entering Head Start for the first time in the cohort year.
Scores for teacher-reported behavior problems are not comparable across all cohorts and are therefore excluded from the table.
a This standard score has a mean of 100 and a standard deviation of 15.
* Asterisk indicates that the trend is statistically significant at the p < .05 level.
NA = not available.
Status in Fall 2009. About 11 percent of children in Head Start are reported by their teachers to have a diagnosed disability.46 Head Start requires that at least 10 percent of its enrollment slots be made available to children with an identified disability. Most children with disabilities are reported to have either speech/language impairments (86 percent) or cognitive impairments (27 percent). Ten percent or fewer have behavioral/emotional (7 percent), sensory (10 percent), or physical impairments (6 percent; Figure 14).47 About half (51 percent) of children with teacher-reported disabilities also have an IEP or IFSP. Nearly one-third (30 percent) have multiple impairments. In comparison, in fall 2008, the most common identified disabilities among children ages 3 to 5 nationally were speech/language impairments (47 percent) and cognitive impairments (44 percent; Individuals with Disabilities Education Act Data Accountability Center 2011). Only one percent had multiple impairments.
Newly entering Head Start children have an average BMI (mean = 16.5) that is higher than the 50th percentile for age and gender groups.48 Using criteria set by the Centers for Disease Control and Prevention (CDC),49 about 17 percent of children entering Head Start for the first time are obese, and about one-third (34 percent) are overweight or obese (Figure 15). While a similar percentage (18 percent) of preschoolers in the ECLS–B were obese in 2005–2006 (Anderson and Whitaker 2009), a slightly smaller percentage (15 percent) of low-income preschoolers nationally were obese in 2008 (Centers for Disease Control and Prevention 2009). More than three-quarters (82 percent) of newly entering children in Head Start are rated as having “excellent” or “very good” health by their parents. Only five percent are rated as having “fair” or “poor” health by parents. Similarly, most parents of first-time kindergartners nationally report their child’s health to be “excellent” or “very good” (83 percent; U.S. Department of Education 2000).

24
Figure 14. Teacher-Reported Disability Categories for Children with Disabilities: Fall 2009
86
27
7 10 6
0
10
20
30
40
50
60
70
80
90
Speech or Language
Cognitive Behavioral/ Emotional
Sensory Physical
Perc
enta
ge o
f Chi
ldre
n
Source: Fall 2009 FACES Direct Child Assessment.
Note: Statistics are weighted to represent all children who entered Head Start for the first time in fall 2009.
Percentages do not add to 100 because children can be reported to have more than one impairment across the impairment categories.
Figure 15. Child BMI Categories: Fall 2009
4%
62%
17%
17%
Underweight
Normal weight
Overweight
Obese
Source: Fall 2009 FACES Direct Child Assessment.
Note: Statistics are weighted to represent all children who entered Head Start for the first time in fall 2009.
Similar percentages of 3- and 4-year-old children in Head Start are reported by their teacher to have a disability at program entry. Meanwhile, teachers report that a larger percentage of boys than girls have an identified disability, and that those with no or one risk are more likely to have an identified disability than those who have two or more family risks.50 Teachers also report that a larger
percentage of White children have an identified disability than children of all other racial/ethnic groups in Head Start.
Compared to 3-year-olds, a larger percentage of 4-year-olds are obese, with a smaller percentage of normal weight. More boys than girls are obese. Hispanic/Latino children are more likely than

25
White and African American children to be obese and less likely to be of normal weight, while African American children are more likely than White and Hispanic/Latino children to be underweight. There are no statistically significant differences in height, weight, or BMI by the number of family risks.
Finally, fewer entering 4-year-olds than 3-year-olds are rated as having “excellent” or “very good” health by their parents. In contrast, more are rated as having “good” health. Parents of Hispanic/Latino children are less likely to rate them as having “excellent” or “very good” health than are parents of children from other racial/ethnic groups, and instead are more likely to rate them as having “good” and “fair/poor” health. Parents of children with two or more family risks are also less likely than parents of children from families with one or no risks to rate their children as having “excellent” or “very good” health. Parents with no family risks are less likely than
parents with more risks to rate the child as having “fair” or “poor” health. There are no differences by gender in parents’ ratings of children’s health status.
Changes in Children’s Entering Health Across Cohorts. Larger percentages of children are reported by their teachers as having a disability in fall 2003 than in fall 2006 or 2009 (Figure 16). In fall 2003, 2006, and 2009,51 most children with disabilities are reported to have either speech/language impairments or cognitive impairments. However, higher percentages of children with disabilities are reported as having speech/language impairments in fall 2009 than in 2006. Across cohorts, about half of children who enter Head Start with teacher-reported disabilities also have an IEP or IFSP, on average (50, 41, and 50 percent in 2003, 2006, and 2009, respectively). About one-quarter of these children in fall 2003, 2006, and 2009 (28, 21, and 28 percent, respectively) have multiple impairments.
Figure 16. Percentage of Children with a Teacher-Reported Disability and in Excellent/Very Good Health: Fall 2009
81
15
83
11
34
77
11
34
82
0
10
20
30
40
50
60
70
80
90
Child has Disability*
Child Is Overweight or Obese
Child in Excellent/ Very Good Health
Perc
enta
ge o
f Chi
ldre
n
2000
2003
2006
2009
Source: Fall 2009 FACES Teacher Child Report and Parent Interview.
Note: Statistics are weighted to represent all children who entered Head Start for the first time in fall 2009.
Teacher-reported disability status is not available in FACES 2000, and data on BMI are not available in FACES 2000 and 2003.
*Asterisk denotes statistically significant change across cohorts at the p < .05 level.

26
Similar percentages of children entering Head Start for the first time in fall 2006 and 2009 are overweight or obese.52 Both groups of children also have similar BMIs. Across cohorts, more than three-quarters of newly entering children in Head Start (between 77 and 83 percent) are rated as having “excellent” or “very good” health by their parents. Across cohorts, newly entering Hispanic/Latino children are less likely than White and African American children to be rated as having “excellent” or “very good” health. Similarly, except for fall 2000, children with two or more family risks are less likely than their peers with one or no risks to be rated as having “excellent” or “very good” health. In 2000, those with two or more risks were less likely than those with no risks to be rated as having “excellent” or “very good” health.
HEAD START TEACHERS AND CLASSROOMS
The FACES conceptual framework envisions a relationship between the provision of quality early care and educational services and children’s developmental outcomes. To examine teacher and classroom characteristics that may relate to the quality of services for parents and children, in fall 2009, FACES conducted interviews with lead teachers in each classroom where sample children were enrolled. Teacher reports of classroom activities and curricula were also collected.53
In this section, we present information on Head Start teachers and classrooms that serve children entering in fall 2009. Specifically, we present information regarding teacher background (years teaching and education), teacher beliefs and knowledge of child development, teacher mental health, learning activities and curriculum, and the classroom language environment. Where possible, we provide information on trends in teacher characteristics, credentials, and classroom activities across FACES cohorts.54 We also include comparable information for the broader population of preschool teachers and classrooms when available.55
TEACHER CHARACTERISTICS Status in Fall 2009. Most Head Start teachers are female (99 percent), a finding consistent with the Multi-State Study of Pre-Kindergarten and
Study of State-Wide Early Education Programs (SWEEP) conducted between 2001 and 2004 (Early et al. 2005). More than half (55 percent) are between ages 30 and 49. Forty-five percent of Head Start teachers are White, 32 percent are African American, and nearly 20 percent are Hispanic/Latino. For comparison, the Multi-State and SWEEP studies of prekindergarten found that 64 percent of teachers are White, 13 percent are African American, and 15 percent are Hispanic/Latino.
The average Head Start teacher has been in the classroom for nearly nine years, and more than half (64 percent) have five or more years of experience teaching in Head Start. The average annual salary is $28,127. More than three-quarters of Head Start teachers (81 percent) have at least an associate’s (A.A.) degree, and almost half (46 percent) have at least a bachelor’s (B.A.) degree. For comparison, the Multi-State and SWEEP studies found that 85 percent of prekindergarten teachers have at least an A.A. degree, and nearly three-quarters (73 percent) have a B.A. degree or more (Early et al. 2005).
In addition to their degrees, many Head Start teachers have specific training in child development and teaching. Half (53 percent) of all teachers pursued a field of study that included early childhood education, and 88 percent of teachers enrolled in at least six courses in early childhood education. Almost half of Head Start teachers (47 percent) report having a Child Development Associate (CDA) certificate, compared to 23 percent of teachers in the Multi-State Study of Pre-Kindergarten (Early et al. 2005). Between 30 and 40 percent of Head Start teachers have a state-awarded certificate, teaching certificate, or license, or are currently enrolled in teacher-related training. Slightly more than one-quarter of Head Start teachers (27 percent) completed a college or other training course on children who are dual language learners (DLLs).
FACES measured teacher beliefs and attitudes using a 24-item Teacher Beliefs Scale (Burts et al. 1990) that consists of statements worded to reflect positive attitudes and knowledge of generally accepted practices in preschool settings, or to reflect a lack of these attitudes and knowledge. Scores regarding attitudes toward developmentally appropriate practice average 7.9

27
out of 10 overall. Teachers score higher on child-initiated practice (4.5 out of 5) than on didactic, strictly teacher-initiated practice (2.6 out of 5). Teachers scoring higher on developmentally appropriate practice are likely to endorse such items as “Head Start classroom activities should be responsive to individual differences in development” and to disagree with such items as “Children should work silently and alone on seatwork.”
As teachers’ mental health status could affect their classroom behaviors and interactions with children, teachers were asked about their depressive symptoms using the short (12-item) form of the Center for Epidemiologic Studies Short Depression Scale (CES–D) (Radloff 1997). As Figure 17 shows, most Head Start teachers (64 percent) do not report symptoms of depression. However, four percent of teachers report symptoms of severe depression, and another six percent report symptoms of moderate depression.
Figure 17. Depressive Symptoms Among Head Start Teachers: Fall 2009
64%
26%
6% 4%
Not depressed
Mildly depressed
Moderately depressed
Severely depressed
Source: Fall 2009 FACES Teacher Interview.
Note: Statistics are weighted to represent all teachers serving children entering Head Start for the first time in fall 2009.
Changes in Teacher Characteristics Across Cohorts. Across cohorts, nearly all Head Start classrooms have female teachers. Over time, the percentage of Head Start classrooms with female teachers remained above 95 percent and increased from fall 2000 to fall 2009 as the percentage of Head Start classrooms with male teachers decreased from five percent in fall 2000 to less than one percent in fall 2009. Across cohorts, most Head Start classrooms have teachers who are between ages 30 and 49 and are White or African American. The percentage of classrooms with teachers who identify themselves as Hispanic/Latino ranged from 15 to 22 from 2000 to 2009, but there was no consistent statistically significant trend across cohorts.
The percentage of Head Start classrooms with teachers having more than five years of Head Start teaching experience increased from 2000 through 2006 and remained stable from 2006 to
2009. Despite the increase in the percentage of teachers with more than five years’ experience, teachers’ mean years of teaching in Head Start remained stable over time (between eight and nine years). The mean annual salary of teachers is significantly greater in fall 2009 than in fall 2000 ($28,352 versus $20,750, respectively).56
Consistent with Head Start’s mandate to increase the educational levels of its teachers to an A.A. degree or higher, the percentage of Head Start classrooms with teachers having at least an A.A. significantly increased across cohorts, from 57 percent in 2000 to 82 percent in 2009. The percentage of Head Start classrooms with teachers having at least a B.A. degree remained stable (around 40 percent) from 2000 through 2006 and was nearly 50 percent in fall 2009 (Figure 18). The percentage of Head Start classrooms with teachers who have completed at least six courses in early childhood education

28
remained stable from 2003 through 2009. Across cohorts, the percentage of Head Start classrooms with teachers who reported having a CDA certificate, are currently enrolled in a teacher-related training, or have a state-awarded certificate has remained steady.
In fall 2006 and fall 2009, the percentage of Head Start classrooms with teachers who report no symptoms of depression was similar, with an average teacher depressive symptoms score of 4 (scores ranging from 0 to 4 are coded as not depressed).57 Except for higher 2003 scores compared to the other cohorts, teachers’ mean scores regarding attitudes toward developmentally appropriate practice were stable from 2000 to 2009. Also except for lower 2003 scores compared to the other cohorts, teachers’ didactic scale scores were stable from 2000 to 2009. Child-initiated scale scores did not differ across cohorts.
CURRICULUM Status in Fall 2009. We asked teachers to report on the curricula they use in the classroom. Slightly less than half (46 percent) of all Head Start teachers report using Creative Curriculum as their primary curriculum, whether they use only one curriculum or a combination of curricula. The High/Scope Curriculum is used by 19 percent of teachers, while 13 percent of teachers report using another widely available curriculum,58 and only 3 percent of teachers use a locally designed curriculum. Other types of curricula are used by 20 percent of teachers.59 The Multi-State Study also found that Creative Curriculum and High/Scope are the most commonly used curricula in prekindergarten programs, with 38 percent of prekindergarten classrooms using High/Scope and 19 percent using Creative Curriculum (Clifford et al. 2005).
Figure 18. Percentage of Head Start Classrooms with Teachers Having At Least an Associate’s or Bachelor’s Degree: Fall 2000 – Fall 2009
57
39
72
38
82
40
82
49
0
10
20
30
40
50
60
70
80
90
AA or higher* BA or higher
Perc
enta
ge o
f Hea
d St
art
Cla
ssro
oms
2000
2003
2006
2009
Source: Fall 2000, 2003, 2006, 2009 FACES Teacher Interview.
Note: Statistics are weighted to represent all classrooms serving children entering Head Start for the first time in the cohort year.
*Asterisk denotes statistically significant change across cohorts at the p < .05 level.

29
Changes in Curriculum Across Cohorts. Across cohorts, the relative prevalence of different types of curricula used was fairly stable. Creative Curriculum was the curriculum most often used in Head Start classrooms from 2000 to 2009.
CLASSROOM CHARACTERISTICS
Status in Fall 2009. On average, classrooms serve almost 17 children, slightly more than half of whom (9 children) are 4-year-olds. Three-quarters (75 percent) of all Head Start classrooms are mixed-age classrooms. Fifteen percent of classrooms only serve 4-year-old children, and the remaining 10 percent of classrooms only serve 3-year-old children. Head Start classes meet, on average, five days each week for an average of 6 hours per day (or 26 hours each week). For comparison, the Multi-State/SWEEP studies found prekindergarten classes meet an average of 25 hours each week (Early et al. 2005).
More than 70 percent of Head Start classrooms have children who are DLLs enrolled, with an average of five such children per classroom. Eighty-eight percent of classrooms serving children who are DLLs include children who speak Spanish. In nearly 20 percent of classrooms with any children who are DLLs enrolled, children speak an Asian language,60 and children speak another non-English language in 12 percent of DLL classrooms. Nearly all DLL classrooms use English for instruction (92 percent), and a little more than half of DLL classrooms (53 percent) use Spanish for instruction. English is also the language used most often for reading and speaking in DLL classrooms (94 and 92 percent, respectively). Less than half of DLL classrooms (40 percent) have lead teachers who speak non-English languages for instruction, and about a third of DLL classrooms (36 percent) have assistant teachers who speak non-English languages for instruction.
CLASSROOM LEARNING ACTIVITIES Status in Fall 2009. FACES 2009 asked teachers about the types and frequency of learning activities in early literacy and mathematics that were commonly used in their classrooms. For
most reading and language activities, more than half of teachers report engaging in the activities daily or almost daily. The most common of these, reported by at least 75 percent of teachers as occurring daily or almost daily are working on letter naming, discussing new words, listening to the teacher read stories where children can see the print, and learning about conventions of print. Activities occurring less frequently, although still occurring daily or almost daily in at least half of classrooms (57 percent or more), include practicing writing letters, dictating stories to an adult, working on phonics, retelling stories, writing names, and learning about common prepositions. Of the activities asked about in FACES, only listening to the teacher read stories where children do not see print and learning about rhyming words and word families occur in less than 50 percent of classrooms daily or almost daily.
More than half of teachers report engaging in various math activities daily or almost daily. The most common of these, reported by at least 75 percent of teachers as occurring daily or almost daily, are counting out loud, working with geometric manipulatives, working with counting manipulatives, engaging in calendar-related activities, and engaging in activities that involve shapes and patterns. All other math activities addressed occur less often but still occur daily or almost daily in at least half of classrooms (52 percent or more): playing math-related games, using music to understand math concepts, using creative movement or creative drama to understand math concepts, working with rulers or other measuring instruments, and engaging in activities related to telling time.
Changes in Classroom Learning Activities Across Cohorts. Between 2000 and 2009, the frequencies of reading and language activities that occur daily or almost daily in Head Start classrooms stayed about the same for most reading and language activities. However, the percentage of Head Start classrooms with teachers who reported working on letter names, practicing writing letters, working on phonics, and writing own name daily or almost daily increased over this period.

30
SUMMARY
Data from FACES provide a wealth of information on the children entering Head Start for the first time, their families, and their Head Start teachers and classrooms. The report documents these characteristics for those entering Head Start in 2009 and offers comparisons across the past decade of FACES cohorts.
Head Start continues to serve a diverse population of low-income children and their families. Sixty-one percent of first-time Head Start children are 3 years old (as of September 1, 2009), and the entering Head Start population is nearly evenly divided between boys and girls. More than a third (36 percent) of first-time Head Start children are Hispanic/Latino, and another third (33 percent) are African American. The racial/ethnic composition of the entering child population has changed across FACES cohorts, with an increase from 66 percent in 2000 to 77 percent in 2009 in the percentage that are minorities, and a commensurate decrease in the percentage who are White.
FAMILY ENVIRONMENT
Most children entering Head Start in 2009 (95 percent) live with at least one of their biological or adoptive parents, including half (50 percent) who live with their mothers only. The percentage of entering Head Start children who live with both of their biological or adoptive parents decreased across FACES cohorts (from 48 percent in 2000 to 42 percent in 2009).
More than two-thirds (68 percent) of children entering Head Start in fall 2009 have a parent with at least a high school diploma or GED living with them, and almost half (47 percent) of children live with at least one parent who is working full time. Many Head Start children live in households that receive federal assistance; the most common type received in 2009 is SNAP, which increased from 44 percent of children’s households in 2000 to 64 percent in 2009.
Slightly more than a quarter (26 percent) of newly entering Head Start children in 2009 live in households in which a language other than English is primarily spoken to them. Spanish is by far the most prevalent non-English primary language. The percentage of children who are
spoken to primarily in a language other than English is higher in 2009 than in 2000.61
The percentage of newly entering Head Start children who are read to by a family member at least three times a week has increased gradually, from 66 percent in fall 2000 to76 percent in 2009. The relative popularity of other home learning activities in which Head Start children participate with their families has been fairly stable over time. For each FACES cohort between 2000 and 2009, playing with toys or games indoors has been the most common activity reported in the past week, and visiting a playground or park or having a picnic has been the most common activity reported in the past month.
More than 9 in 10 newly entering Head Start children in 2009 have a regular health care provider, all but a few (99 percent) have had a regular medical checkup in the past year, and 88 percent have seen a dentist during that time. Nearly all Head Start children (96 percent) have some type of health insurance, and most of those (83 percent) are covered by some type of government insurance (including 48 percent also reportedly covered by private insurance).
In addition to the 25 hours per week, on average, spent in Head Start, 37 percent of newly entering children are also cared for by someone other than their parents before or after Head Start, spending an additional 15 hours per week, on average, away from their parents. Care by a relative is the most common type of child care, received by one-quarter (25 percent) of newly entering Head Start children.
CHILD COGNITIVE, SOCIAL-EMOTIONAL, AND PHYSICAL DEVELOPMENT
Newly-entering Head Start children score below norms across developmental areas, including language, literacy, and mathematics development at program entry. In fall 2009, we see this pattern among those assessed in English, as well as those assessed in Spanish. We also see diversity in children’s skills when they first enter the program, although this diversity is less pronounced among those who are assessed in Spanish. For example, although the top quartile of those assessed in English in fall 2009 scores above norms in many areas, among those assessed in Spanish, the top quartile scores below norms across areas.

31
Across cohorts, parents report children as having strong social skills and few problem behaviors. Teachers also report children as having few problem behaviors. In contrast, assessors rate children entering in fall 2009 as having social/cognitive skills that are about one standard deviation below norms. In addition, on an executive functioning task, children entering in fall 2009 respond correctly less than half of the time. This suggests that children have not yet fully developed their working memories or their ability to inhibit their initial impulses. Many patterns across groups of children are in expected directions, with, for example, younger children reported as having fewer social skills and problem behaviors than older children, and girls having stronger social skills, better approaches to learning, and fewer problem behaviors than boys.
At Head Start entry, 11 percent of children have an identified disability, with the majority of these reported to be speech or language impairments. This pattern holds across cohorts. In fall 2006 and 2009, more than one-third of children (34 percent) are overweight or obese. Finally, on average, parents across cohorts generally report children to be in excellent or very good physical health.
HEAD START TEACHERS AND CLASSROOMS
Consistent with prior cohorts, Head Start teachers in 2009 have, on average, multiple years of experience in the Head Start classroom. Most have earned a postsecondary degree (A.A. or B.A.), and the percentage that have earned an A.A. has increased over time. Most teachers also have specific training in early childhood. As in prior FACES cohorts, teachers are most likely to report using the Creative Curriculum as their primary curriculum.
Head Start classrooms provide intensive services to children, meeting on average five days each week for six hours a day. Children are served in a linguistically diverse environment; a majority of Head Start classrooms include DLL children. Multiple language, literacy, and mathematics activities take place in a majority of classrooms daily or almost daily. Over time, the percentage of classrooms engaging daily or almost daily in work on letter names, phonics, and writing letters or names has increased.

32
REFERENCES
Aikens, N., L.K. Hulsey, E. Moiduddan, A. Kopak, A. Takyi-Laryea, L. Tarullo, and J. West. “Data Tables for FACES 2009 Head Start Children, Families, and Programs: Present and Past Data from FACES Report. OPRE Report 2011-33b.” Washington, DC: Office of Planning, Research and Evaluation, Administration for Children and Families, U.S. Department of Health and Human Services, December 2011.
Anderson, S.E., and R.C. Whitaker. “Prevalence of Obesity Among U.S. Preschool Children in Different Racial and Ethnic Groups.” Archives of Pediatric and Adolescent Medicine, vol. 163, no. 4, 2009, pp. 344–348.
Blair, C. “School Readiness: Integrating Cognition and Emotion in a Neurobiological Conceptualization of Children’s Functioning at School Entry.” American Psychologist, vol. 57, 2002, pp. 111–127.
Blair, C., and R. Razza. “Relating Effortful Control, Executive Function, and False Belief Understanding to Emerging Math and Literacy Ability in Kindergarten.” Child Development, vol. 78, no. 2, 2008, pp. 647–663.
Brownell, R. “Expressive One-Word Picture Vocabulary Test.” San Antonio, TX: Harcourt Assessment, Inc., 2000.
Burts, D.C., C.H. Hart, R. Charlesworth, and L. Kirk. “A Comparison of Frequencies of Stress Behaviors Observed in Kindergarten Children in Classrooms with Developmentally Appropriate Versus Developmentally Inappropriate Instructional Practices.” Early Childhood Research Quarterly, vol. 5, 1990, pp. 407–423.
Centers for Disease Control and Prevention. “Obesity Prevalence Among Low-Income, Preschool-Aged Children—United States, 1998–2008.” Morbidity and Mortality Weekly Report, vol. 58, no. 28, 2009, pp. 769–796.
Chernoff, J., K. D. Flanagan, C. McPhee, and J. Park. “Preschool: First Findings from the Preschool Follow-up of the Early Childhood Longitudinal Study, Birth Cohort (ECLS-B).” NCES 2008–025. Washington, DC: U.S. Department of Education, Institute of Education Sciences, NCES, 2007.
Child Trends. "Early Childhood Program Enrollment." Child Trends Databank, 2010. Retrieved from [http://www.childtrendsdatabank.org/ ?q=node/280].
Clifford, R.M., O. Barbarin, F. Chang, D.M. Early, D. Bryant, C. Howes, M. Burchinal, and R. Pianta. “What Is Pre-Kindergarten? Characteristics of Public Pre-Kindergarten Programs.” Applied Developmental Science, vol. 9, 2005, pp. 126–143.
Croninger, R.G., and V.E. Lee. “Social Capital and Dropping Out of High School: Benefits to At-Risk Students of Teachers’ Support and Guidance.” Teachers College Record, vol. 103, no. 4, 2001, pp. 548–541.
Diamond, A., and C. Taylor. “Development of an Aspect of Executive Control: Development of the Abilities to Remember What I Said and to “Do as I Say, Not as I Do.” Developmental Psychobiology, vol. 29, 1996, pp. 315–334.
Downey, D.B., P.T. von Hippel, and B. Broh. “Are Schools the Great Equalizer? Cognitive Inequality During the Summer Months and the School Year.” American Sociological Review, vol. 69, no. 5, 2004, pp. 613–635.
Duncan, S. E., and E. A. DeAvila. Preschool Language Assessment Survey 2000 Examiner’s Manual: English Forms C and D. Monterey, CA: CTB/McGraw-Hill, 1998.
Dunn, L.M., D.E. Lugo, E.R. Padilla, and L.M. Dunn. Test de Vocabulario en Imagenes Peabody. Circle Pines, MN: American Guidance Service, 1986.

33
Dunn, L., and D. Dunn. Peabody Picture Vocabulary Test. Fourth Edition. Circle Pines, MS: American Guidance Service, 2006.
Early, D., O. Barbarin, D. Bryant, M. Burchinal, F. Chang, R. Clifford, G. Crawford, W. Weaver, C. Howes, S. Ritchie, M. Kraft-Sayre, R. Pianta, and W. S. Barnett. “Pre-Kindergarten in Eleven States: NCEDL’s Multi-State Study of Pre-Kindergarten and Study of State-Wide Early Education Programs (SWEEP).” Preliminary descriptive report. NCEDL working paper. Chapel Hill, NC: University of North Carolina, Chapel Hill, May 24, 2005.
Entwisle, D.R., K.L. Alexander, and L.S. Olson. Children, Schools, and Inequality. Boulder, CO: Westview Press, 1997.
Federal Interagency Forum on Child and Family Statistics. America’s Children in Brief: Key National Indicators of Well-Being, 2010. Washington, DC: U.S. Government Printing Office, 2010.
Gresham, F.M., and S.N. Elliot. Social Skills Rating System. Circle Pines, MN: American Guidance Service, 1990.
Individuals with Disabilities Education Act (IDEA) Data. “Part B Child Count (2008).” Retrieved from https://www.ideadata.org/arc_toc10. asp#partbCC on February 21, 2011.
Iruka, I.U., and P.R. Carver. “Initial Results from the 2005 NHES Early Childhood Program Participation Survey.” NCES 2006-075. Washington, DC: National Center for Education Statistics, 2006.
Kaiser Commission on Medicaid and the Uninsured. “Health Coverage of Children: The Role of Medicaid and CHIP.” Washington, DC: Henry J. Kaiser Family Foundation, 2011. http://www.kff.org/medicaid/upload/7698-05.pdf
Mabli, J., and C. Ferrerosa. Supplemental Nutrition Assistance Program Caseload Trends and Changes in Measures of Unemployment, Labor Underutilization, and Program Policy from 2000 to 2008. Alexandria, VA: U.S. Department of Agriculture, Food and Nutrition Service, 2010.
McDermott, P.A., L.F. Green, J.M. Francis, and D.H. Stott. Preschool Learning Behaviors Scale. Philadelphia: Edumetric and Clinical Science, 2000.
National Center for Education Statistics. "Common Core of Data: Build a Table." Washington, DC: NCES, 2011. Retrieved from [http://nces.ed.gov/ccd/bat/].
Pallas, A.M., G. Natriello, and E.L. McDill. “The Changing Nature of the Disadvantaged Population: Current Dimensions and Future Trends. Educational Researcher, vol. 18. no. 5, 1989, pp. 16–22.
Peterson, J., and N. Zill. “Marital Disruption, Parent-Child Relationships, and Behavior Problems in Children.” Journal of Marriage and the Family, vol. 48, 1986, pp. 295–307.
Radloff, L.S. “The CES-D Scale: A Self-Report Depression Scale for Research in the General Population.” Journal of Applied Psychological Measurement, vol. 1, no. 3, 1977, pp. 385–401.
Rathbun, A., and J. West. From Kindergarten Through Third Grade: Children’s Beginning School Experiences. NCES 2004-007. Washington, DC: National Center for Education Statistics, 2004.
Roid, G.H., and L.J. Miller. Examiners Manual: Leiter International Performance Scale-Revised. Chicago: Stoelting Co., 1997.
Smith-Donald, R., C. C. Raver, T. Hayes, and B. Richardson. “Preliminary Construct and Concurrent Validity of the Preschool Self-Regulation Assessment (PSRA) for Field-Based Research.” Early Childhood Research Quarterly, vol. 22, 2007, pp. 173–187.

34
Tarullo, L., J. West, N. Aikens, and L.K. Hulsey. Beginning Head Start: Children, Families, and Programs in Fall 2006. Washington, DC: U.S. Department of Health and Human Services, 2008.
U.S. Department of Education, National Center for Education Statistics. “Early Childhood Longitudinal Study—Kindergarten Class of 1998–99 (ECLS–K), Psychometric Report for Kindergarten Through First Grade.” NCES 2002–05. Washington, DC: U.S. Department of Education, Institute of Education Sciences, NCES, 2002.
U.S. Department of Education, National Center for Education Statistics. “America’s Kindergartners: Findings from the Early Childhood Longitudinal Study-Kindergarten Class of 1998-99, Fall 1998.” NCES 2000–07. Washington, DC: U.S. Department of Education, NCES, 2000.
West, J., K. Denton, and L. Reaney. The Kindergarten Year. NCES 2001-023. Washington, DC: National Center for Education Statistics, 2001.
West, J., and L.K. Hulsey, “Who Is Served by Head Start? A 10-Year Perspective.” Paper presented at the Association for Public Policy Analysis and Management Fall Conference, Washington, DC, 2009.
West, J., L. Tarullo, N. Aikens, L. Malone and B.L. Carlson. “FACES 2009 Study Design.” Washington, DC: Office of Planning, Research and Evaluation, Administration for Children and Families, U.S. Department of Health and Human Services, November 2010.
West, J., N. Aikens, B. Carlson, C. Meagher, L. Malone, A. Bloomenthal, A. Kelly, K. Rall, and R. Zota. “Head Start Family and Child Experiences Survey: 2006. User’s Manual.” Washington, DC: U.S. Department of Health and Human Services, 2010.
Woodcock, R.W., K. McGrew, and N. Mather. Woodcock-Johnson III Tests of Achievement. Itasca, IL: Riverside Publishing, 2001.
Woodcock, R.W., A.F. Muñoz-Sandoval, K. McGrew, N. Mather, and F. Schrank. Batería III Woodcock-Muñoz. Itasca, IL: Riverside Publishing, 2004.
Zill, N., K. Kim, A. Sorongon, R. Herbison, C. Clark. “Head Start Family and Child Experiences Survey 2000: Data User’s Guide.” Washington, DC: U.S. Department of Health and Human Services, Administration for Children and Families. Office of Planning, Research and Evaluation, 2005.
Zill, N., K. Kim, A. Sorongon, G. Shapiro, R. Herbison. “Head Start Family and Child Experiences Survey 2003: Data User’s Guide.” Washington, DC: U.S. Department of Health and Human Services, Administration for Children and Families. Office of Planning, Research and Evaluation, 2008.
Zill, N., and J. West. Findings from the Condition of Education 2000: Entering Kindergarten Children. NCES 2001-035. Washington, DC: National Center for Education Statistics, 2001.

35
NOTES
1 Observations of classroom quality are administered in the spring data collection waves, and are not included in this report.
2 For detailed information on the FACES 2009 study design and measures, see West, Tarullo et al. 2010.
3 Migrant and Seasonal Worker programs (MSHS), American Indian and Alaska Native (AI/AN) programs, programs in Puerto Rico and other U.S. territories, and programs not directly providing services to 3-, 4-, and 5-year-olds (such as Early Head Start) were excluded from the frame. The Office of Head Start provided information about any defunded (or soon-to-be defunded) programs before sampling, and these programs were then deleted from the sampling frame. FACES 2006 also excluded from the sampling frame 13 programs affected by Hurricanes Katrina and Rita in August 2005 that were unable to provide information for the 2004–2005 PIR data.
4 Three of the 65 programs originally sampled were determined to be ineligible because we learned that they were under provisional management or otherwise in financial jeopardy. In addition, two eligible programs declined to participate.
5 These are all weighted response rates. The cumulative weighted response rates, which take into account the response rate for all levels of the sample, are lower. The cumulative weighted response rates for centers and classrooms are both 93 percent. The cumulative teacher response rate is 91 percent, and the cumulative child response rate (consent rate) is 85 percent. The cumulative weighted response rates for the child assessments, parent interviews, and teacher ratings are 80, 79, and 83 percent, respectively. At the teacher level, among participating classes, marginal weighted response rate for the teacher interview was 99 percent. At the child level, among children with consent, the child assessment rate was 94 percent, parent interview was 93 percent, and Teacher Child Report (TCR) was 97 percent.
6 Eighty-four percent of parents were
interviewed by telephone and the rest in person during the weeklong visit by FACES data collection teams. The fall 2009 round also included program director, center director, and education coordinator interviews, but data from these sources are not used in this report.
7 Before FACES 2006, which also used a web survey, TCRs were collected using a paper survey.
8 Children’s height and weight were measured for the first time in FACES 2006.
9 The screening process and cognitive assessment measures used in FACES 2009 and earlier FACES cohorts are described in the section of this report that describes children’s cognitive outcomes.
10 FACES 2006 screened children in the same way and also administered the assessment with the assistance of a laptop computer. Early FACES cohorts used a standard easel format to administer the assessment, but did not use laptop computers and recorded children’s responses on paper.
11 In fall 2009, 79 percent of TCRs were completed using the web instrument.
12 These are the unweighted conditional response rates and pertain to the percent of children with a child assessment among the group of children with parent consent. They do not take into account the parent consent rate or participate rates for prior stages of sampling (for example, programs, centers, classrooms), which would lower the overall response rate. For example, in FACES 2006, overall unweighted response rate for the child assessment is 84 percent.
13 To facilitate cross-cohort comparisons and to track changes in the population of children and families served by Head Start, there is a large overlap in the content of the measures used in the FACES instruments. However, each cohort study includes some new measures in order to adapt to changes in Head Start policies, practices, and the larger community context surrounding the program, and drops a few measures that have not proven useful in analysis. New cohorts also add or

36
substitute measures to take advantage of measures development in the field. More information on the comparability of measures across cohorts is provided in later sections of this report.
14 All statistics found in this report and information on reliability of the measures can be found in Aikens et al. 2011.
15 Weights are used to compensate for the differential probabilities of selection at the sampling stage (for example, 3-year-olds were sampled at a higher rate than 4-year-olds) and to adjust for the effects of nonresponse.
16 All references to African American refer to African American, Non-Hispanic.
17 All references to White refer to White, Non-Hispanic.
18 Nationally, the percentage of children enrolled in public school prekindergarten programs who are White decreased from 47 percent in school year 2000-01 to 46 percent in 2009-10, while the percentage of children who are African American decreased from 25 percent to 21 percent. The percentage of children in these programs who are Hispanic increased from 24 percent to 27 percent during the same period (National Center for Education Statistics 2011). The percentage of Hispanic children ages 3 to 5 enrolled in any center-based programs (such as day care centers, Head Start programs, and state prekindergarten) increased between 2001 and 2006, while the percentage of White children in such programs had almost no change over the same time span (Child Trends 2010).
19 All references to mothers, fathers, or
parents include both biological and adoptive parents.
20 The percentages presented in this section apply only to children whose mothers and/or fathers live with them.
21 The federal poverty threshold for a family of four in 2009 was $20,050. The eligibility criterion for Head Start is based on parent, rather than household, income.
22 There was no consistent statistically
significant trend across cohorts in the percentage of entering Head Start children spoken to primarily in English or other languages at home.
23 Croninger and Lee 2001; Pallas et al. 1989;
Rathbun and West 2004; Zill and West 2001.
24 Downey et al. 2004; Rathbun and West 2004; West et al. 2001.
25Sixty-five percent of children’s parents “strongly agree” that their children sleep soundly through the night, and another 30 percent “agree.” Fifty-eight percent “strongly agree” that their children wake up full of energy, and another 34 percent “agree.”
26 Government insurance includes Medicaid, State Children’s Health Insurance Program (SCHIP), military health care, Indian Health Service, and other government insurance programs.
27 Comparable information on health care was
not collected for FACES cohorts before 2006.
28 The number of risks is based on three characteristics of children’s living circumstances: (1) whether the child resides in a single-parent household, (2) whether the household income is below the federal poverty threshold, and (3) whether the child’s mother has less than a high school degree.
29 The EOWPVT-SBE allows for conceptual scoring (that is, it provides prompts for both English and Spanish and accepts responses in each language and various Spanish dialects). All children take the same items but are scored as correct when they accurately identify an object, whether they label it in English or Spanish, thereby providing a picture of children’s bilingual expressive vocabulary. In FACES, the EOWPVT-SBE was used with children whose primary home language was Spanish, while the EOWPVT was used with all other children.
30 All children, regardless of home language or performance on the Pre-LAS, received the English receptive vocabulary measure, the PPVT-4, and the expressive vocabulary measure, the EOWPVT or EOWPVT-SBE. The TVIP is the

37
Spanish-language version of the PPVT-4 and was used with children whose primary home language was Spanish, regardless of performance on the Pre-LAS. Thus, children whose parents spoke Spanish to them at home received the receptive vocabulary component of the battery in English (PPVT-4) as well as in Spanish (TVIP). They also received the Spanish-bilingual version of the EOWPVT. All other children received the PPVT-4 and the EOWPVT.
31 The English assessment used the Woodcock-Johnson III Tests of Achievement, and the Spanish assessment used the Batería III Woodcock-Muñoz Tests of Achievement.
32 FACES uses 23 mathematics items from the ECLS–B in fall and spring of the Head Start year(s) and an additional 7 items from the ECLS–K in kindergarten.
33 For the direct assessment, home language was based on information provided on parent consent forms.
34 As noted previously, regardless of performance on the language screener, children from homes where Spanish was primarily spoken were also administered the TVIP as a measure of their receptive Spanish vocabulary. Thus, these children received the receptive vocabulary component of the battery in English (PPVT-4) and in Spanish (TVIP). They also received the Spanish-bilingual version of the EOWPVT.
35 The ECLS–B preschool wave was intended to assess children in the fall, when most children would be about 48 through 57 months of age. However, the age at time of testing in the ECLS–B preschool wave ranged from approximately 3 years, 8 months to 5 years, 5 months (Chernoff et al. 2007). On average, the FACES children in the fall 2009 round were assessed earlier in the program year than the ECLS–B sample, and their ages ranged from approximately 2 years, 3 months to 6 years, 3 months. The ECLS–B is a national study of 14,000 children born in 2001.
36 The calibration sample for the Woodcock-Muñoz was drawn from both inside and outside (Mexico, Costa Rica, Panama, Argentina, Colombia, Puerto Rico, and Spain) the United
States. Calibration data were then equated to the Woodcock-Johnson norms. The TVIP was normed on a sample of individuals in Mexico and Puerto Rico in the early 1980s (Dunn et al. 1986). The norms for the EOWPVT-SBE are based on a national sample of children of Hispanic/Latino origin from 4–12 years old, while the standardization sample for the EOWPVT is nationally representative of all children in the United States from 2-18.
37 For children from homes where Spanish is
primarily spoken, the expressive vocabulary assessment is conceptually scored. For these children, standard scores using both the EOWPVT-SBE and the EOWPVT norms are created. EOWPVT standard scores provide a measure of children's English expressive vocabulary relative to young children in the U.S., while the EOWPVT-SBE standard scores reflect children's bilingual (English and Spanish) vocabulary skills relative to young Hispanic children nationally.
38 As noted previously, the EOWPVT and EOWPVT-SBE measure the expressive vocabulary of children from English- and Spanish-speaking households. The EOWPVT provides a measure of children's expressive vocabulary relative to English-speaking peers nationally, while the EOWPVT-SBE reflects children's vocabulary skills relative to Spanish-bilingual and Spanish-dominant peers.
39 In FACES 2006 and 2009, the fourth edition
of the PPVT was administered to children. The third edition of the PPVT was administered in earlier cohorts. The norming sample for the third edition of the PPVT matches the U.S. population in 1994, while that for the PPVT-4 matches the population in 2004. Thus, standard scores on the former assessment compare children to same-age peers in 1994, while those on the latter compare them to children in 2004. Similarly, the third edition of the Woodcock-Johnson Tests of Achievement was administered to children in FACES 2006 and 2009, while the revised edition was administered to children in FACES 2000. A hybrid of the third and revised editions was administered in FACES 2003. A third edition score, derived from this hybrid, is reported here. The norming sample for the revised edition of the Woodcock-Johnson matches the U.S. population
38
in 1980. That for the third edition matches the population in 2000.
40 Unlike in other cohorts, in FACES 2000, the Woodcock-Johnson Tests of Achievement were only administered to children age 4 and older. Thus, reported scores for this cohort are only available for children who are 4 and older. In this section, we exclude this cohort and describe the entering skills for all children in fall 2003, 2006, and 2009, regardless of age at entry. Appendix Table B.24 provides the mean entering scores for 4-year-old children in fall 2000, 2003, 2006, and 2009.
41 Although all children, regardless of home language, in FACES 2006 and 2009 were administered the PPVT, only scores for children assessed in English are included here. The PPVT was only administered to children assessed in English in FACES 2000 and 2003.
42 For the first time in FACES, teachers in FACES 2009 rated each child on the six items that comprise the Approaches to Learning scale from the ECLS–K (U.S. Department of Education 2002). Earlier FACES cohorts used the Preschool Learning Behavior Scale (PLBS) (McDermott et al. 2000) to assess children’s approaches to learning.
43 Because the pencil tapping task requires working memory and more attention to auditory and visual stimuli, FACES administers the measure only to children age 4 and older.
44 A similar percentage of Head Start children (56 percent; mean age = 5 years, 1 month) responded correctly across trials on the peg tapping task (Blair 2008). Pencil tapping is an adaptation of the peg tapping task. Both tasks require a child do the opposite of what the assessor says (for example, tap once when the assessor says to tap two times). These authors argue that developmental changes around age 4 in inhibitory control likely influence children’s executive function and self-regulation, but they also point out that other factors may influence children’s skills on executive function tasks as well. In comparison, in another study of a small sample of older Head Start children (mean age = 60.5 months), a larger percentage of children
responded correctly across trials (59 percent [Smith-Donald et al. 2007]).The pencil tapping task does not have normative data. We report data from this study to provide a comparison to the performance of FACES children on this task.
45 The Leiter was used for the first time in FACES in 2006. Thus, comparable scores are not available for earlier cohorts.
46 Teachers were asked whether a professional had indicated that children had a developmental problem, delay, or other special need, and to indicate the specific need or disability.
47 Teachers were asked whether a professional had indicated that the child had a developmental problem, delay, or other special need, and to indicate the specific need or disability. Five disability categorizations are reported here: speech or language, cognitive, behavioral/emotional, sensory, and physical impairment. Cognitive impairment includes developmental delay, mental retardation, and autism or pervasive developmental delay. Behavioral/emotional impairment includes behavior problems, hyperactivity, and attention deficit. Sensory impairment includes deafness, hearing impairment/hard of hearing, blindness, and vision impairment. Physical impairment includes motor impairment.
48 According to the CDC, the 50th percentile in BMI for children ages 3 to 5 ranges from 15.4 to 16.0.
49 According to the CDC, a child is considered to be overweight when his or her BMI score is at or above the 85th percentile for their age and gender, and obese if his or her BMI is at or above the 95th percentile for their age and gender.
50 Head Start allows enrollment by children who are above the federal poverty level if they have a diagnosed disability. Forty-three percent of those with a disability have household incomes at or above the federal poverty line, while 36 percent of those without a disability have similar incomes.
51 Teacher-reported disability status is not available in FACES 2000. Accordingly, in this

39
section, we only report this information for children in FACES 2003, 2006, and 2009.
52 The Centers for Disease Control and Prevention (CDC) sets the criterion of overweight as being when a child’s BMI score is from the 85th to 94th percentile for his or her age and gender, and of obese as being when the child’s BMI is at or above the 95th percentile. In some earlier FACES reports, the two categories have been labeled as at risk of overweight and overweight, respectively. Here, we use the more recent terminology used by the CDC.
53 In spring 2010, FACES also conducted classroom observations of the quality of facilities and teacher-child interactions. These data will be explored in a subsequent report.
54 To compare teacher and classroom data across cohorts, statistics were weighted to represent all classrooms serving children entering Head Start for the first time in the cohort year. Statistics for fall 2009 baseline data regarding teacher characteristics and curriculum were weighted to represent all teachers serving children entering Head Start for the first time in fall 2009. Statistics for fall 2009 baseline data regarding classroom characteristics and classroom learning activities were weighted to represent all classrooms serving children entering Head Start for the first time in fall 2009. Because teachers can have more than one classroom, the number of classrooms is greater than the number of teachers, and the same characteristic estimated at the teacher and classroom level can differ. All reported differences are significant at the p < .05 level or better.
55 Comparisons are made to findings from the Multi-State Study of Pre-Kindergarten and SWEEP (Clifford et al. 2005; Early et al. 2005). The Multi-State Study includes a random sample of state-funded prekindergarten programs in four states (Georgia, Illinois, Kentucky, and Ohio) and two large regions of two other states (Los Angeles and the Central Valley in California and New York state-funded prekindergarten programs in four City and Albany in New York) and began in 2001. The SWEEP study includes a random sample of states (Massachusetts, New Jersey, Washington, and Wisconsin) and a large region in Texas and began in 2003. These studies focused on classrooms for 4-year-olds.
56 Salaries are not adjusted for inflation, but
there are no statistically significant differences in teacher salary across cohorts when such an adjustment is made.
57 Mental health data are available only for
FACES 2006 and 2009.
58 Widely available curricula include High Reach, Let’s Begin with the Letter People, Montessori, Bank Street, Creating Child Centered Classrooms–Step by Step, Scholastic Curriculum, and Curiosity Corner-Johns Hopkins.
59 Examples of other types of curricula include Galileo, Houghton Mifflin, I am Moving/I am Learning, Links to Literacy, New World, and Opening the World of Learning.
60 Asian and Pacific Island languages include languages from three categories as specified in the Program Information Report: (1) Middle Eastern and South Asian Languages, (2) East Asian Languages, and (3) Pacific Island Languages.
61 However, there was no statistically significant change between consecutive cohorts in the percentage of children spoken to primarily in a language other than English at home.

FACES 2009 COPYRIGHT PERMISSIONS
Peabody Picture Vocabulary Test, Fourth Edition (PPVT-4). Copyright © 2007, Wascana Limited Partnership. Reproduced with permission of the publisher NCS Pearson, Inc. All rights reserved. Test de Vocabulario en Imagenes Peabody (TVIP). Copyright © 1987, Dunn Educational Services, Inc. Reproduced with permission of the publisher NCS Pearson, Inc. All rights reserved. Social Skills Rating System (SSRS). Copyright © 1990, NCS Pearson, Inc. This adaptation Copyright © 2006. Reproduced with permission of the publisher. All rights reserved. Woodcock-Johnson® III (WJ III®), WJ III® Tests of Achievement. Copyright © 2001, 2007, The Riverside Publishing Company. Reproduced with permission of the publisher. All rights reserved.
No part of this work may be reproduced or transmitted in any form or by any means, electronic or mechanical, including photocopying and recording or by any information storage or retrieval system without the proper written permission of The Riverside Publishing Company unless such copying is expressly permitted by federal copyright law. Address inquiries to Contracts and Permissions Department, The Riverside Publishing Company, 3800 Golf Road, Rolling Meadows, Illinois 60008-4015.
Batería III Woodcock-Muñoz ®. Copyright © 2004, 2007, The Riverside Publishing Company. Reproduced with permission of the publisher. All rights reserved.
No part of this work may be reproduced or transmitted in any form or by any means, electronic or mechanical, including photocopying and recording or by any information storage or retrieval system without the proper written permission of The Riverside Publishing Company unless such copying is expressly permitted by federal copyright law. Address inquiries to Contracts and Permissions Department, The Riverside Publishing Company, 425 Spring Lake Drive, Itasca, Illinois 60143-2079.
PreLAS 2000, by Sharon E. Duncan, Ph.D., and Edward A. DeAvila, Ph.D. Copyright © 1998 CTB/McGraw-Hill LLC, a subsidiary of The McGraw-Hill Companies, Inc. Reproduced by permission of CTB/McGraw-Hill LLC. Leiter International Performance Scale-Revised Examiner Ratings. Copyright © 1997, 2002 Stoelting Co., 620 Wheat Lane, Wood Dale, IL 60191. All rights reserved. Classroom Assessment Scoring System™ (CLASS™) by Robert C. Pianta, Karen M La Paro, and Bridget K. Hamre. Copyright © 2008 by Paul H. Brooks Publishing Co. Used with permission of publisher. Early Childhood Environment Rating Scale, Revised Edition by Thelma Harms, Richard M. Clifford, and Debby Cryer. Copyright © 2005. New York: Teacher College Press. Reproduced with permission from the authors and the publisher. This copyrighted material may not be sold, copied, or distributed for any reason. All rights reserved. Expressive One-Word Picture Vocabulary Test (EOWPVT). Copyright © 2000, Academic Therapy Publications, 20 Commercial Boulevard, Novato, CA, 94949-6191. All rights reserved. Reproduced by permission of Academic Therapy Publications. Expressive One-Word Picture Vocabulary Test—Spanish-Bilingual Edition. Copyright © 2001, Academic Therapy Publications, 20 Commercial Boulevard, Novato, CA, 94949-6191. All rights reserved. Reproduced by permission of Academic Therapy Publications. Adaptation of the Diamond and Taylor (1996) Peg-Tapping Executive Functioning Task. Copyright © 1996; Blair 2002; Smith-Donald, Raver, Hayes, and Richardson, 2007. Selected items from the Early Childhood Longitudinal Study, Kindergarten Class of 1998-99 (ECLS-K), National Center for Education Statistics. To include items reproduced from the Test of Early Mathematics Ability, 3rd Ed. (TEMA-3), by H.P. Ginsburg, and A.J. Baroody. Copyright © 2003, Pro Ed, Inc. Used with permission. Selected items from the Early Childhood Longitudinal Study, Birth Cohort (ECLS-B), National Center for Education Statistics. Used with permission.