Head and Neck Cancer Surgery in Ontario, 2003-2010
154
Head and Neck Cancer Surgery in Ontario, 2003‒2010 An ICES Atlas November 2015
Transcript of Head and Neck Cancer Surgery in Ontario, 2003-2010

Head and Neck Cancer Surgery in Ontario, 2003‒2010An ICES Atlas
November 2015


Institute for Clinical Evaluative SciencesInstitute for Clinical Evaluative Sciences
Head and Neck Cancer Surgery in Ontario, 2003‒2010An ICES Atlas
Authors
Antoine EskanderJonathan C. IrishDavid R. UrbachDavid P. Goldstein
November 2015

Institute for Clinical Evaluative Sciencesii
HEAD AND NECK CANCER SURGERY IN ONTARIO, 2003–2010
Publication Information
© 2015 Institute for Clinical Evaluative Sciences. All rights reserved.
This publication may be reproduced in whole or in part for noncommercial purposes only and on the condition that the original content of the publication or portion of the publication not be altered in any way without the express written permission of ICES. To seek this information, please contact [email protected].
The opinions, results and conclusions included in this publication are those of the authors and are independent of the funding sources. No endorsement by the Institute for Clinical Evaluative Sciences, Cancer Care Ontario or the Ontario Ministry of Health and Long-Term Care is intended or should be inferred.
Parts of this publication are based on data and information compiled and provided by the Canadian Institute for Health Information (CIHI). However, the analyses, conclusions, opinions and statements expressed herein are those of the authors, and not necessarily those of CIHI.
INSTITUTE FOR CLINICAL EVALUATIVE SCIENCESG1 06, 2075 Bayview AvenueToronto, Ontario M4N 3M5Telephone: 416-480-4055Email: [email protected]
How to cite this publication
Eskander A, Irish JC, Urbach DR, Goldstein DP. Head and Neck Cancer Surgery in Ontario, 2003‒2010: An ICES Atlas. Toronto, ON: Institute for Clinical Evaluative Sciences; 2015.
This document is available at www.ices.on.ca.
ISBN 978-1-926850-64-1 (Online)ISBN 978-1-926850-63-4 (Print)

Institute for Clinical Evaluative Sciences iii
HEAD AND NECK CANCER SURGERY IN ONTARIO, 2003–2010
Authors’ Affiliations
Antoine Eskander, MD, ScMResident, Department of Otolaryngology ‒ Head & Neck Surgery, University of Toronto
Jonathan Irish, MD, MSc, FRCSC, FACSProfessor, Department of Otolaryngology ‒ Head & Neck Surgery, Department of Surgery and Department of Speech-Language Pathology, University of Toronto / Chair, Kevin and Sandra Sullivan Chair in Surgical Oncology, University of Toronto / Chief, Department of Surgical Oncology, University Health Network, Mount Sinai Hospital / Provincial Head, Surgical Oncology, Cancer Care Ontario
David Urbach, MD, MSc, FRCSC, FACSProfessor, Department of Surgery and Institute of Health Policy, Management and Evaluation, University of Toronto / Scientist, Cancer Care Ontario / Senior Scientist, Division of Clinical Decision-Making and Health Care, Toronto General Hospital Research Institute / Adjunct Scientist and Cancer Program Lead, Institute for Clinical Evaluative Sciences
David Goldstein, MD, MSc, FRCSC, FACSAssistant Professor, Department of Otolaryngology ‒ Head & Neck Surgery, University of Toronto
Acknowledgements
The authors wish to thank the following individuals and organizations for their contributions to the success of this project and to apologize in advance for any inadvertent omissions:
Internal Coordination and Editorial Support
Laura Maclagan, MScSenior Epidemiologist Institute for Clinical Evaluative Sciences
Nancy MacCallum, MLISSenior Communications Officer Institute for Clinical Evaluative Sciences
Administrative, Logistical and Content Support
Amber HunterProgram Manager, Surgical Oncology Program Cancer Care Ontario
Programming and Biostatistics
Refik Saskin, MScStaff ScientistInstitute for Clinical Evaluative Sciences
Lingsong Yun, MScSenior Research Analyst Institute for Clinical Evaluative Sciences
Clinical Content Support/Stakeholder
Patrick Gullane, Ralph Gilbert, Jeremy Freeman, Patti Groome, Stephen Hall
Financial Support
Dr. Antoine Eskander was supported by funding from the Chapnik, Freeman and Friedberg Surgeon Scientist Award, the Temmy Latner/Dynacare Chair in Head and Neck Oncology Fund at Mount Sinai Hospital, the Estey Fund from the Princess Margaret Hospital Foundation, and the Kevin and Sandra Sullivan Chair in Surgical Oncology Fund and the Department of Otolaryngology – Head & Neck Surgery at the University Health Network in Toronto, Ontario.
This atlas was funded by the Kevin and Sandra Sullivan Chair in Surgical Oncology Fund and the Department of Otolaryngology ‒ Head & Neck Surgery at the University Health Network and by the Bryce Fund at the University of Toronto.

Institute for Clinical Evaluative Sciencesiv
HEAD AND NECK CANCER SURGERY IN ONTARIO, 2003–2010
Contents
ii Publication Information iii Authors’ Affiliations iii Acknowledgements v About the Organizations Involved in This Atlas vi Foreword
1 EXECUTIVE SUMMARY 3 GLOSSARY OF TERMS
4 1 INTRODUCTION
16 2 SURGERY FOR ORAL CAVITY CANCER
49 3 SURGERY FOR LARYNX/HYPOPHARYNX CANCER
84 4 SURGERY FOR SALIVARY GLAND CANCER
121 5 REFLECTIONS AND RECOMMENDATIONS
128 TECHNICAL APPENDIX

Institute for Clinical Evaluative Sciences v
HEAD AND NECK CANCER SURGERY IN ONTARIO, 2003–2010
About the Organizations Involved in This Atlas
Cancer Care Ontario
Cancer Care Ontario (CCO) is the provincial agency responsible for continually improving cancer services.
As the government’s cancer advisor, CCO:
• Implements provincial cancer prevention and screening programs.
• Works with cancer care professionals and organizations to develop and implement quality improvements and standards.
• Uses electronic information and technology to support health professionals and patient self-care, and to continually improve the safety, quality, efficiency, accessibility and accountability of Ontario’s cancer services.
• Plans cancer services to meet current and future patient needs, and works with health care providers in every Local Health Integration Network (LHIN) to continually improve cancer care for the people they serve.
• Conducts research and rapidly transfers knowledge of new research into improvements and innovations in clinical practice and cancer service delivery.
Institute for Clinical Evaluative Sciences
The Institute for Clinical Evaluative Sciences (ICES) is an independent, nonprofit organization that uses population-based health information to produce knowledge on a broad range of health care issues. ICES’ unbiased evidence provides measures of health system performance, a clearer understanding of the shifting health care needs of Ontarians, and a stimulus for discussion of practical solutions to optimize scarce resources.
Key to ICES’ work is its ability to link population-based health information, at the patient level, in a way that ensures the privacy and confidentiality of personal health information. Linked databases reflecting 13 million of 34 million Canadians allow researchers to follow patient populations through diagnosis and treatment, and to evaluate outcomes.
ICES receives core funding from the Ontario Ministry of Health and Long-Term Care. In addition, ICES scientists and staff compete for peer-reviewed grants from federal funding agencies, such as the Canadian Institutes of Health Research, and project-specific funds from provincial and national organizations. ICES knowledge is highly regarded in Canada and abroad, and is widely used by government, hospitals, planners, and practitioners to make decisions about health care delivery and to develop policy.

Institute for Clinical Evaluative Sciencesvi
HEAD AND NECK CANCER SURGERY IN ONTARIO, 2003–2010
Foreword
Leveraging health data to drive quality improvements in cancer surgery
One of Cancer Care Ontario’s goals is to continuously enhance the quality and accessibility of cancer surgery. Together with our partners, we use data and research analysis to support population-based planning for cancer services across the province.
Previous cancer research atlases published by the Institute for Clinical Evaluative Sciences (ICES) have laid a strong foundation for advancements in cancer surgery. The 2008 atlas Cancer Surgery in Ontario showcased variations in the range and use of health services by cancer surgery patients within Ontario’s 14 Regional Cancer Programs and provided data that has helped us further our efforts in improving performance and quality.
The 2015 ICES atlas presents vital information about cancer surgery and related health services provided to Ontarians who were newly diagnosed with cancer of the oral cavity, larynx/hypopharynx or salivary gland between 2003 and 2010. It examines the types of procedures patients received, where they received their procedure, and any other health services they utilized. Data is presented by age group, sex, neighbourhood income level, community size and region. By assessing variations that exist in access, treatment and outcomes, the findings will allow Cancer Care Ontario’s Surgical Oncology
Program and our valued partners to identify opportunities for quality improvement across the province.
The data in this new atlas are particularly relevant as Cancer Care Ontario recently established Head and Neck Centres in eight Regional Cancer Programs across the province. This regionalization has balanced access to care with the benefits of high-quality specialized cancer treatment. The decision to have head and neck surgeries provided at large-volume centres was based on strong evidence and was also supported by regional data presented in the 2008 atlas. The updated data in the current atlas will help us as we work toward our goal of having all head and neck cancer surgeries performed in designated centres.
I want to thank all of the authors for their contributions to this terrific piece of work. In conjunction with key evidence, the data it contains can be used by healthcare providers, planners and policymakers to inform planning and decision-making. It is an effective resource that helps ensure a consistent, high-quality approach to head and neck cancer surgery across all care settings in Ontario. I am looking forward to leveraging this data in the years ahead.
Michael Sherar, PhDPresident and Chief Executive OfficerCancer Care Ontario

Institute for Clinical Evaluative Sciences 1
HEAD AND NECK CANCER SURGERY IN ONTARIO, 2003–2010
Executive Summary
Issue
Head and neck cancers include oral cavity, larynx/hypopharynx and salivary gland cancers. The treatment of these cancers is complex and requires multidisciplinary health care teams. Patients treated for head and neck cancers are often left with significant impairments, such as difficulties with swallowing, taste, speech, breathing and body image.
Study
This atlas presents information on surgery and related health services provided to persons in
Ontario who were newly diagnosed with cancer of the oral cavity, larynx/hypopharynx or salivary gland between 2003 and 2010. The atlas also describes the impact of patient factors (i.e., age, sex, socioeconomic status, place of residence) and provider factors (i.e., surgical specialty and the type and location of hospitals delivering services) on the health care services provided to these patients. Patients were identified using data from the Ontario Cancer Registry, and information on patient and provider characteristics and health care service utilization was obtained by linking several Ontario health administrative databases.
Key findings
• The vast majority of Ontarians with newly diagnosed head and neck cancers underwent a surgical procedure in the 12 months before and after their diagnosis, including 85% of patients with oral cavity cancer, 69% of patients with larynx/hypopharynx cancer and 93% of patients with salivary gland cancer. Patients aged 75 years or older were less likely to have a cancer-related surgery.

Institute for Clinical Evaluative Sciences2
HEAD AND NECK CANCER SURGERY IN ONTARIO, 2003–2010 EXECUTIVE SUMMARY
• Among the nine major head and neck cancer treatment centres in Ontario, there were large variations in the proportion of patients who had a consultation with a radiation or medical oncologist and in the approach to treatment.
• The majority of resection procedures were performed at head and neck cancer treatment centres and involved 90% of patients with oral cavity cancer, 98% of those with larynx/hypopharynx cancer and 57% of those with salivary gland cancer.
• There were significant variations across Ontario’s 14 Local Health Integration Networks (LHINs) in the use of surgery and radiation therapy for patients newly diagnosed with head and neck cancers.
• There was significant variation across the LHINs in the use of palliative care services by patients with head and neck cancers, which may reflect differences in the availability of these services.
Implications
• Variations in the diagnostic workup, treatment approach, use of adjunctive procedures and number of consultations for patients exist even among high-volume regional head and neck cancer treatment centres.
• Although treatment for head and neck cancers is highly regionalized, some cases are still being treated in low-volume centres.
• Further research is necessary to understand differences in access to specialist care and head and neck cancer treatment patterns across the LHINs.
• As the Ontario population ages, there may be an increasing demand for health care services to treat head and neck cancers.

Institute for Clinical Evaluative Sciences 3
HEAD AND NECK CANCER SURGERY IN ONTARIO, 2003–2010GLOSSARY OF TERMS
Glossary of Terms
Benign Not life-threatening or severe and likely to respond to treatment. A tumour that is not malignant.
Definitive surgical procedure The most extensive surgical procedure performed for a patient who has had more than one procedure.
Fine-needle aspiration A type of biopsy procedure in which a thin needle is inserted into an area of abnormal-appearing tissue or body fluid.
Free flap Tissue taken from one part of the body and transplanted to another to close a surgical site after removal of a cancer.
Histology The scientific study of the microscopic structure of tissues.
Hypopharynx Part of the throat that lies beside and behind the larynx.
Incidence The extent or rate of occurrence, specifically in the number of new cases of a disease in a population over a period of time.
Laryngectomy The surgical removal of the larynx.
Larynx An organ located in the neck above the opening of the trachea (windpipe). Often called the voice box.
Local Health Integration Network One of 14 health regions in Ontario with a mandate for planning, integrating and funding health care services at a local level.
Malignant Relating to cancer cells that are invasive and tend to metastasize.
Mandible The bone that forms the lower jaw and holds the lower teeth in place.
Maxilla The upper jaw.
Neck dissection Removal of the regional lymph nodes in the neck.
Oncology The branch of medicine that deals with tumours, including the study of their development, diagnosis, treatment and prevention.
Oral cavity/Oropharynx Includes the lips, cheeks, palate (roof of the mouth), floor of the mouth, and part of the tongue in the mouth.
Palliative Relieving or soothing the symptoms of a disease such as cancer without effecting a cure.
Pharyngolaryngectomy The surgical removal of the larynx (voice box) and pharynx (area at the back of the throat).
Radiation therapy Treatment of cancer by controlled exposure to a radioactive substance.
Resection Surgical removal of all or part of an organ, tissue or other body structure.
Salivary glands Glands found in and around the mouth and throat that secrete saliva into the mouth. The major salivary glands are the parotid, submandibular and sublingual glands.

Institute for Clinical Evaluative Sciences4
HEAD AND NECK CANCER SURGERY IN ONTARIO, 2003–2010
1 Introduction
Inside
• Why Do We Need an Atlas for Head and Neck Cancer Surgery in Ontario?
• The Role of Surgery and Surgeons in Head and Neck Cancer Diagnosis and Treatment
• Head and Neck Cancer in Ontario• How We Did the Research• Content and Format of the Chapter Exhibits• References

Institute for Clinical Evaluative Sciences 5
HEAD AND NECK CANCER SURGERY IN ONTARIO, 2003–2010INTRODUCTION
Why Do We Need an Atlas for Head and Neck Cancer Surgery in Ontario?
In 2008, the Institute for Clinical Evaluative Sciences (ICES) summarized epidemiologic data from April 1, 2003, to March 31, 2004, for five of the most common oncologic diagnoses affecting Ontarians: breast, prostate, colorectal, lung and female genitourinary cancers.1 In 1997, similar data were used to summarize the epidemiology of a number of malignancies, including cancers of the head and neck, from 1992 to 1997.2 These data are now out of date, and there have been significant changes in the incidence and management of these cancers. For example:
• Ontario’s 14 Local Health Integration Networks (LHINs) were created in 2007, and there is limited information on how head and neck cancer surgery services are distributed among these geographical and health resource units.
• There has been a major shift in the regionalization of head and neck cancer surgery to large-volume centres. Fewer hospitals and surgeons are performing head and neck cancer surgery as compared to 1992‒1995, but the extent of these trends was largely unknown prior to the production of this atlas.
The information derived from such atlases can be used to support population-based regional planning of Ontario’s cancer health services and provides the foundation for a research program in health services research in Ontario. Ultimately, this atlas will outline an agenda for cancer surgery‒related health services research with the aims of improving the outcomes and quality of delivered care for patients with head and neck cancer.
The Role of Surgery and Surgeons in Head and Neck Cancer Diagnosis and Treatment
Radiation therapy and chemotherapy are important in the management of cancers, but most cancers are initially diagnosed by surgeons and are often initially treated with surgery.3 Head and neck cancers are not different. These cancers are almost always initially assessed by surgeons for acquisition of diagnostic tissue. Furthermore, surgery has an important role in the primary management of head and neck cancers.4-6 Even for those cancers treated primarily with radiotherapy and/or chemotherapy, salvage surgery is used if these tumours are incompletely treated or are recurrent.4-6
The role of cancer surgeons
Surgeons are often the first specialists to see patients with cancers of the head and neck. As such, they are the gatekeepers to the cancer care system.3
Surgeons are usually responsible for establishing the diagnosis by performing a biopsy; determining the stage of the disease, usually through diagnostic imaging and other tests; and following patients regularly after treatment to detect any recurrences early. Surgeons are also responsible for performing the surgical removal of the tumour when that is warranted.
Surgeons are also involved in the coordination of patients’ care, including referral to radiation and medical oncology when indicated. Complicated cases are presented at cancer tumour boards, and surgeons are often responsible for presenting such cases.
What we already know about patterns of care
Based on the current body of knowledge, cancer care is not delivered equally to all patients in the province of Ontario, and significant variations in exist in access, treatment and outcomes.1 Depending on the region of residence at the time of diagnosis (LHIN), different types of surgical procedures may be offered to patients.1 Possible reasons for this include surgeon training and preference, access to resources in the LHIN, patient preference and availability of alternate treatments.

Institute for Clinical Evaluative Sciences6
HEAD AND NECK CANCER SURGERY IN ONTARIO, 2003–2010 INTRODUCTION
Many studies show that cancer patients treated by higher-volume surgeons or at higher-volume hospitals have better outcomes (length of stay, readmission, survival).7-11 This is also true for head and neck cancer surgery.12 An ICES study of head and neck cancer patients showed that hospital volume is a more important factor than surgeon volume, but both have a significant association with outcomes.13
Despite these important findings, there remain a number of unanswered questions. How many patients are developing these cancers in Ontario? Are there variations in surgical resection rates by social, demographic or regional factors? Who is performing these procedures? Where are they being performed? How far are patients travelling to receive care? How often are patients seeing radiation and medical oncologists? What other health services are they using? What resources will be needed to provide care to patients who develop these cancers in the future?
Health administrators and policy makers are constantly responding to concerns about equity, access, cost and quality of care in the delivery of cancer surgery in Ontario. One of our goals in producing this atlas, Head and Neck Cancer Surgery in Ontario, 2003–2010, is to assist policy makers with information that will aid them in their decision-making. This is particularly timely as quality-based procedures are being developed for cancer surgery in Ontario, where funding may potentially be linked to the quality of delivered care.14
Head and Neck Cancer in Ontario
Head and neck cancers are a heterogeneous group of cancers derived from the mucosa of the upper aerodigestive tract, which includes the oral cavity, nasopharynx, oropharynx, larynx, hypopharynx and paranasal sinuses (Exhibit 1.1). Tissues that produce saliva, including the submandibular and parotid glands, are also a major type of head and neck cancer: salivary gland cancer. Head and neck cancers together account for approximately 5% of cancers in the United States,15 but they represent a huge worldwide burden of disease and are some of the most common cancers in the developing world.
Changing incidence
As Exhibit 1.2 demonstrates, the incidence of head and neck cancer in Ontario is changing.
The dramatic rise in oropharynx cancers in Ontario matches trends observed in the United States and Europe; this rise is linked to human papillomavirus (HPV), which is sexually transmitted.16,17 Tumours associated with HPV appear in a younger population than non-HPV-related tumours16,17 and are associated with significantly better survival outcomes compared to their non-HPV counterparts.
Salivary gland cancers appear to be on the rise, an unexpected finding. This is not explained by a rise in skin cancers in the head and neck region that may metastasize to the salivary glands, and it may be a result of mislabelling in the Ontario Cancer Registry. Skin cancer pathology and lymphoma were excluded in this assessment of incidence.
Incidence rates of larynx/hypopharynx, oral cavity and nasopharynx cancers have been stable over the last two decades in Ontario.
Atlas subsite focus
The larynx and hypopharynx subsites can be challenging to differentiate clinically and therefore have been studied in combination using ICES data. We chose to combine these two subsites in a single chapter for this reason. Oral cavity and salivary gland cancers are primarily surgically treated and are each assigned their own chapters.
Due to the low incidence of cancers of the nasopharynx and paranasal sinuses, neither of these subsites were amenable for summary in this atlas. Oropharynx cancer was not amenable for inclusion herein. There are several reasons for this. We found that many oropharynx cases were oral cavity cases that were inappropriately labelled in the Ontario Cancer Registry. This is in keeping with the subsite accuracy for the OCR which is 91%.18 Also, we found that we could not reliably code primary surgical treatment for (a) patients who were primarily treated with radiation or chemoradiation and then received surgery as a salvage procedure when they failed

Institute for Clinical Evaluative Sciences 7
HEAD AND NECK CANCER SURGERY IN ONTARIO, 2003–2010INTRODUCTION
EXHIBIT 1.1 Sagittal view of upper aerodigestive tract (left) and frontal view of oral cavity (right)

Institute for Clinical Evaluative Sciences8
HEAD AND NECK CANCER SURGERY IN ONTARIO, 2003–2010 INTRODUCTION
EXHIBIT 1.2 Age- and sex-standardized incidence of head and neck cancers per 100,000 population, in Ontario, 1993 to 2010

Institute for Clinical Evaluative Sciences 9
HEAD AND NECK CANCER SURGERY IN ONTARIO, 2003–2010INTRODUCTION
those other treatments, or (b) patients who received palliative treatments. This inability to define primary surgical resection patients from those receiving other treatments made it very difficult to define a surgical cohort and thus made the interpretation of surgical resources impossible. This subsite would benefit from a province-wide chart review to assess variations in practice.
How We Did the Research
Key questions about head and neck cancer surgery in Ontario
In developing this atlas, much like the previous cancer surgery atlases at ICES, we set out to address a variety of relevant and important questions about head and neck cancer surgery in Ontario:
• How many Ontarians are diagnosed with head and neck cancer and receive a surgical procedure as a result of their diagnosis?
• Among patients who undergo surgery for head and neck cancer, what procedures do they receive?
• Where do patients receive their surgery? How regionalized is the care delivered to these patients? How far do they have to travel to receive this care?
• What other health services are patients with head and neck cancer who receive surgery utilizing and does this differ from those that do not receive surgery?
Data is presented by age group, sex, neighbourhood income level, community size, and region (LHIN) of patient residence at the time of cancer diagnosis. Because we suspected that head and neck surgical oncologic care would largely be regionalized to a few centres, we also assessed differences by LHINs of treatment for key variations.
Data sources and methods
This atlas focuses on three subsites in the head and neck region: the larynx/hypopharynx, the oral cavity and the salivary gland. Reasons for exclusion of the nasopharynx, paranasal sinuses and oropharynx subsites have been previously described.
We present data on 6,470 patients in Ontario who were newly diagnosed with one of the three cancers between January 1, 2003, and December 31, 2010. This eight-year time frame was chosen to minimize the number of small cells that would have to be suppressed for privacy reasons, given the lower incidence of head and neck cancers compared to the cancers summarized in the 2008 ICES cancer surgery atlas.1 We chose not to include data from prior to 2003, as information on radiation oncology was limited and this would have greatly affected the interpretability and relevance of our results.
We first identified incident cases of head and neck cancer in the Ontario Cancer Registry (OCR). The OCR has a 98% cancer capture rate in Ontario (except for nonmelanoma skin cancer) and goes back to 1964.19 The OCR identifies new cancer cases through hospital discharge and day-surgery summaries, pathology reports, patient records from regional cancer centres, and death certificates. Cancer stage is currently not captured.
Having identified our cohort of cancer patients, we then linked cases to records in the Ontario Health Insurance Plan, the Discharge Abstract Database, the National Ambulatory Care Reporting System, and the Registered Persons Database. This allowed us to determined which procedures, investigations and health resources used by patients identified in our cohort in a specific two-year time period ‒ from 12 months before the date their cancers were diagnosed to 12 months after ‒ similar to the previous cancer surgery atlas.1 The Registered Persons Database allowed us to ascertain important demographic data, and this was linked to Statistics Canada postal code data to assess average family income as a surrogate for socioeconomic status.
Patients in the cancer system receive care for noncancer-related diseases and illnesses, and this was not captured in our atlas as our objective was to focus on health services related to the treatment of the cancer. Primary care services were not addressed.

Institute for Clinical Evaluative Sciences10
HEAD AND NECK CANCER SURGERY IN ONTARIO, 2003–2010 INTRODUCTION
Our approach to identifying cancer-related procedures and surgeries was similar to that used by the 2008 ICES cancer surgery atlas.1 Rather than specifying a list of procedures at the outset of our analysis, we started by looking at all health services provided to patients with each specific type of cancer (i.e., each chapter). We then created a list of services that were used by more than 1% of all patients with that particular cancer. Using clinical experts on our research team, we were then able to go through this detailed list to determine which procedures were specifically related to cancer. This allowed us to capture diagnostic, curative and palliative procedures that might have otherwise been excluded. This methodology allowed us to include a variety of procedures that we would have otherwise potentially missed and was an excellent approach to assessing what health services these patients were utilizing.
Study populations
For each of the three head and neck cancer subsites chosen for our study, we identified study cohorts. These included all individuals 18 years of age or older who were identified as having that particular cancer in the Ontario Cancer Registry and whose diagnosis date fell between January 1, 2003, and December 31, 2010. These are referred to as the Overall Cancer Cohorts.
The Overall Cancer Cohorts were then divided into two pairs of smaller groups:
• The Cancer Surgery Cohort included anyone who had surgery related to their cancer during the period from 12 months before to 12 months after their diagnosis. The Cancer/No Surgery Cohort includes the remaining patients from the Overall Cohort which did not receive surgery related to their cancer.
• The Cancer Resection Cohort included anyone who had a resection of their cancer subsite during the period from 12 months before to 12 months after their diagnosis. The Cancer/No Resection Cohort included everyone in the Overall Cohort who did not have a surgical resection of their cancer subsite during the designated time period.
Content and Format of the Chapter Exhibits
Chapters 2, 3 and 4 of this atlas include exhibits that present our key findings in tabular form. These exhibits carry forward in the same format from chapter to chapter.
Some exhibits may have two or three parts with an alphanumeric designation. The first number identifies the chapter within the atlas that contains the exhibit; the second number identifies the number of the exhibit within the chapter. Thus, Exhibit 3.2 is the second exhibit in the third chapter.
In Chapters 2 through 4, exhibits with the same second number present similar information in a similar format; thus, Exhibits 2.1, 3.1 and 4.1 are similar in content and format.
The following overview outlines the content and format of each exhibit in Chapters 2 through 4, with the letter ‘X’ used as a stand-in for the chapter numbers.
Exhibit X.1 presents data on the incidence of each head and neck cancer in Ontario from 2003 to 2010. It also then divides this cohort into patients who received any form of surgical procedure related to their cancer diagnosis versus those who did not. A surgical procedure related to the cancer diagnosis is not limited to a resection procedure in which the cancer is removed by the surgeon but includes adjunctive procedures, such as tracheotomy tubes to assist patients with breathing and gastrostomy tubes to assist patients with feeding. The percentage of patients who received a surgical procedure are examined by age group, sex, neighbourhood income, community size and the Local Health Integration Network (LHIN) where patients were living at the time of their diagnosis (referred to as the LHIN of residence).

Institute for Clinical Evaluative Sciences 11
HEAD AND NECK CANCER SURGERY IN ONTARIO, 2003–2010INTRODUCTION
Socioeconomic status was measured using census data derived from patient postal code. Patients’ neighbourhoods of residence were ranked according to how the average income in their neighbourhood compared to all other neighbourhoods in their city or metropolitan area. This was measured as an income quintile with a ranking of 1 indicating the least affluent neighbourhoods and a ranking of 5 indicating the wealthiest neighbourhoods.
Exhibit X.1A shows information for adults of both sexes, whereas Exhibits X.1B and X.1C present information for men and women, respectively.
Exhibits X.2 to X.8 focus on patients who received a definitive surgical resection (the Cancer Resection Cohorts) as opposed to patients who did not receive surgery or those who may have received a procedure related to their cancer but not a definitive surgical procedure to remove the cancer.
Exhibit X.2A presents the percentage of patients who underwent a surgical resection (as opposed to any cancer-related procedure). It focuses on certain aspects of health care use, including the average number of visits with a treating surgeon, the percentage of patients requiring more than one hospital admission, the frequency of admissions, and whether procedures were done on an inpatient basis (stayed at least one night in hospital) or outpatient basis (went home the same day as the procedure). Patients are classified by age group, sex, neighbourhood income level, community size and the Local Health Integration Network (LHIN) of residence and of treatment (where patients received surgical care).
Exhibit X.2B presents information on use of health care services but focuses on emergency department visits, Community Care Access Centre visits, length of stay in the intensive care unit, and hospital readmissions, all by LHIN of residence and of treatment.
Exhibit X.3 presents data on all the hospital admissions (both inpatient and outpatient) for resection surgery performed on those in the Cancer Resection Cohort. Here, the goal is to assess how many patients received cancer surgery in the LHIN where they were living when diagnosed. This exhibit also demonstrates the LHINs to which patients travelled to receive their resection. On the vertical axis is the LHIN of residence and on the horizontal axis is the LHIN of treatment. This exhibit depicts referral patterns and identifies high-volume LHINs of treatment.
Exhibit X.4 describes patterns of care as they relate to patients in the Cancer Resection Cohort where patients are grouped by definitive surgical procedure. Information is presented by sex, age group, neighbourhood income level, community size and LHIN of residence and of treatment.
Exhibit X.5 demonstrates geographic variations in the percentage of patients in the overall Cancer Resection Cohort who received a definitive surgical procedure by LHIN of residence. This could not be replicated for LHIN of treatment because we did not have an accurate way of determining where each of the patients in the overall Cancer Cohort were managed, as they were oftentimes managed at more than one centre despite not having received a surgical resection.
Exhibit X.6A presents information about the surgeons who operated on patients in the Cancer Resection Cohort. This is further categorized by the type of definitive procedure provided, according to surgical specialty. Data about surgical specialties were obtained from the Ontario Health Insurance Plan.
Exhibit X.6B presents information on the type of hospital where patients in each Cancer Resection Cohort underwent surgery for their cancers and the type of definitive procedure delivered by each hospital type. We considered classifying hospitals as academic (teaching) or community hospitals, but this would not have captured important information in Ontario. Head and neck cancer is rarer than the other cancers addressed in the 2008 ICES cancer surgery atlas.1 In Ontario, there are nine hospitals at which fellowship-trained head and neck surgical oncologists and radiation oncologists manage these rare tumours; these hospitals are identified as head and neck cancer treatment centres in Exhibit 1.3. We thus categorized our hospitals using this more important distinction as it demonstrates what percentage of procedures are being provided at nondesignated centres and is a measure of the degree of regionalization of head and neck cancer care in Ontario.
Exhibits X.7A, X.7B and X.7C present data on health services provided to patients in the Cancer Resection Cohort. These include cancer-related diagnostic and adjunctive procedures (panendoscopy, other endoscopy, biopsies, neck dissections, reconstructive procedures, tracheotomy and gastrostomy tubes), diagnostic imaging (head and neck, chest, and abdomen), and consultations and

Institute for Clinical Evaluative Sciences12
HEAD AND NECK CANCER SURGERY IN ONTARIO, 2003–2010 INTRODUCTION
services (radiation oncology, medical oncology and palliative care referrals). Each chapter differs slightly in the extent of the information included, as some anatomical cancer sites do not require many or any of these services. The exhibits only list health services that were provided to patients in the Cancer Resection Cohorts during a 24-month period (from 12 months before to 12 months after their definitive surgery). These exhibits are further organized by LHIN of residence and LHIN of treatment.
Exhibits X.8A, X.8B and X.8C present information on the health services described in X.7 but for the Cancer/No Resection Cohort during a 24-month period (from 12 months before to 12 months after their date of diagnosis). All information is presented by LHIN of patient residence only, as LHIN of treatment could not be accurately identified for the No Resection Cohort.

Institute for Clinical Evaluative Sciences 13
HEAD AND NECK CANCER SURGERY IN ONTARIO, 2003–2010INTRODUCTION
EXHIBIT 1.3 Map of head and neck cancer treatment centres, by Local Health Integration Network, in Ontario, 2010

Institute for Clinical Evaluative Sciences14
HEAD AND NECK CANCER SURGERY IN ONTARIO, 2003–2010 INTRODUCTION
References
1. Urbach DR, Simunovic M, Schultz SE. Cancer Surgery in Ontario: ICES Atlas. 2nd ed. Toronto, ON: Institute for Clinical Evaluative Sciences; 2008.
2. Iscoe NA, To T, Gort EH, Tran M. Cancer Surgery in Ontario. Toronto, ON: Institute for Clinical Evaluative Sciences; 1997.
3. Bahn CH. The surgeon as gatekeeper. Am J Surg. 1993; 165(5):550‒3.
4. Gilbert R, Devries-Aboud M, Winquist E, Waldron J, McQuestion M; Head and Neck Disease Site Group. The Management of Head and Neck Cancer in Ontario. Evidence-Based Series 5-3. Toronto, ON; Cancer Care Ontario; 2009. Accessed July 16, 2015 at https://www.cancercare.on.ca/common/pages/UserFile.aspx?fileId=58592.
5. National Institute for Clinical Excellence. Guidance on Cancer Services: Improving Outcomes in Head and Neck Cancers. The Manual. London, UK: NICE; 2005. Accessed June 23, 2015 at https://www.nice.org.uk/guidance/csghn/evidence/improving-outcomes-in-head-and-neck-cancers-the-manual2.
6. Scottish Intercollegiate Guidelines Network. Diagnosis and Management of Head and Neck Cancer: A National Clinical Guideline. Guideline No. 90. Edinburgh, UK: SIGN; 2006. Accessed May 12, 2015 at http://www.sign.ac.uk/pdf/sign90.pdf.
7. Birkmeyer JD, Siewers AE, Finlayson EV, Stukel TA, Lucas FL, Batista I, et al. Hospital volume and surgical mortality in the United States. N Engl J Med. 2002; 346(15):1128‒37.
8. Birkmeyer JD, Stukel TA, Siewers AE, Goodney PP, Wennberg DE, Lucas FL. Surgeon volume and operative mortality in the United States. N Engl J Med. 2003; 349(22):2117‒22.
9. Goodney PP, Stukel TA, Lucas FL, Finlayson EV, Birkmeyer JD. Hospital volume, length of stay, and readmission rates in high-risk surgery. Ann Surg. 2003; 238(2):161‒7.
10. Simunovic M, Rempel E, Theriault ME, Coates A, Whelan T, Holowaty E, et al. Influence of hospital characteristics on operative death and survival of patients after major cancer surgery in Ontario. Can J Surg. 2006; 49(4):251‒8.
11. Urbach DR, Bell CM, Austin PC. Differences in operative mortality between high- and low-volume hospitals in Ontario for 5 major surgical procedures: estimating the number of lives potentially saved through regionalization. CMAJ. 2003; 168(11):1409‒14.
12. Eskander A, Merdad M, Irish JC, Hall SF, Groome PA, Freeman JL, et al. Volume-outcome associations in head and neck cancer treatment: a systematic review and meta-analysis. Head Neck. 2014; 36(12):1820‒34.
13. Eskander A, Irish J, Groome PA, Freeman J, Gullane P, Gilbert R, et al. Volume-outcome relationships for head and neck cancer surgery in a universal health care system. Laryngoscope. 2014; 124(9):2081‒8.
14. Quality-Based Procedures Clinical Handbook for Cancer Surgery. Toronto, ON: Ministry of Health and Long-Term Care; January 2015. Accessed July 16, 2015 at http://www.health.gov.on.ca/en/pro/programs/ecfa/docs/qbp_cancer_surgery.pdf.
15. Montgomery PQ, ed. Principles and Practice of Head and Neck Surgery and Oncology. 2nd ed. London, UK: Informa Healthcare; 2009.
16. Auluck A, Hislop G, Bajdik C, Poh C, Zhang L, Rosin M. Trends in oropharyngeal and oral cavity cancer incidence of human papillomavirus (HPV)-related and HPV-unrelated sites in a multicultural population: the British Columbia experience. Cancer. 2010; 116(11):2635‒44.
17. Chaturvedi AK, Engels EA, Pfeiffer RM, Hernandez BY, Xiao W, Kim E, et al. Human papillomavirus and rising oropharyngeal cancer incidence in the United States. J Clin Oncol. 2011; 29(32):4294-301.

Institute for Clinical Evaluative Sciences 15
HEAD AND NECK CANCER SURGERY IN ONTARIO, 2003–2010INTRODUCTION
18. Hall S, Schulze K, Groome P, Mackillop W, Holowaty E. Using cancer registry data for survival studies: the example of the Ontario Cancer Registry. J Clin Epidemiol. 2006; 59(1):67‒76.
19. McLaughlin JR, Kreiger N, Marrett LD, Holowaty EJ. Cancer incidence registration and trends in Ontario. Eur J Cancer. 1991; 27(11):1520‒4.

Institute for Clinical Evaluative Sciences16
HEAD AND NECK CANCER SURGERY IN ONTARIO, 2003–2010
2 Surgery for Oral Cavity Cancer
Inside
• Summary • Introduction • List of Exhibits • Exhibits and Key Findings • Discussion and Conclusions • References

Institute for Clinical Evaluative Sciences 17Institute for Clinical Evaluative Sciences 17
HEAD AND NECK CANCER SURGERY IN ONTARIO, 2003–2010SURGERY FOR ORAL CAVITY CANCER
Summary
Issue
Oral cavity cancer is the 13th most common type of newly diagnosed cancer and the 15th most common cause of death due to cancer in Canada. Treatment of this cancer site can often affect a patient’s swallowing, taste, speech, breathing and body image. A large multidisciplinary health team is often required for delivery of high-quality care to this patient group. For these reasons and due to the inherent complexity of treating this cancer, care should be confined to designated high-volume regional health care facilities.
Study
This chapter provides a snapshot of treatment patterns for adults newly diagnosed with oral cavity cancer in Ontario between January 1, 2003, and December 31, 2010. We focus on the delivery of surgical care and related health services and, where possible, include data regarding patient factors (sex, age, socioeconomic status and place of residence) and provider factors (surgical specialty and the location and type of hospital delivering services). We also assess the influence of patient and provider factors on the services provided.
Key findings
Nearly 85% of Ontario adults newly diagnosed with oral cavity cancer underwent a cancer-related surgical procedure for their disease within a year of diagnosis, and 75% had a definitive surgical procedure (an oral cavity resection).
Adults aged 75 or older who were newly diagnosed with oral cavity cancer were less likely to have a cancer-related surgery (or oral cavity resection) than younger people with this disease.
Significant variations existed among the nine head and neck cancer treatment centres in the province as to the rate of consultation with radiation oncologists and medical oncologists.
Of the 75% of patients in the study cohort who underwent an oral cavity resection procedure for oral cavity cancer, nearly half (49%) underwent a tongue resection. The more complex maxilla, mandible and mandibular alveolus resection procedures were more likely to be performed at one of the nine head and neck cancer treatment centres. These resections are a significant portion of the procedures required for this cohort (25%).
• A significant portion (90%) of the oral cavity cancer resection procedures done in Ontario between 2003 and 2010 were performed at head and neck cancer treatment centres.
• Among the province’s 14 Local Health Integration Networks (LHINs), there were variations in the use of surgery and radiation therapy to treat newly diagnosed oral cavity cancer. There was
also variation in the use of palliative care consultation, which may reflect the availability of this service in the LHINs or differences in the stage (extent) of the disease at presentation.
Implications
• We noted variations in the use of surgical procedures and referral to specialists among oral cavity cancer patients residing in one LHIN and being treated in another. More research is necessary to understand this observation.
• The incidence of oral cavity cancer increases with age. As the Ontario population ages, there may be increasing demand for health services related to the diagnosis and treatment of this cancer.
• While care is largely confined to designated head and neck cancer treatment centres, 10% of cases are treated at centres with very low volumes (fewer than 10 cases per year).
• Variations in diagnostic workup, treatment approaches, adjunctive procedures and patient consultations exist even among regional head and neck cancer treatment centres with large caseloads.

Institute for Clinical Evaluative Sciences18 Institute for Clinical Evaluative Sciences18
HEAD AND NECK CANCER SURGERY IN ONTARIO, 2003–2010 SURGERY FOR ORAL CAVITY CANCER
Introduction
Tumours of the oral cavity constitute 2.8% of all new malignant cancers diagnosed annually in Canada; they account for approximately 2% of all deaths from cancer.1 The oral cavity subsite, excluding the oropharynx, has historically been the second-most incident cancer of the upper aerodigestive tract, although the increasing incidence of oropharynx cancer has recently changed this order. There has been a moderate increase in incidence of oral cavity cancer in Canada, which mimics the trend in the United Kingdom.2 In Canada, oral cavity cancer (including the oropharynx subsite) is the 13th most common newly diagnosed cancer and the 15th most common cause of death due to cancer for adults.1 Recently published data estimate that 4,000 Canadians (2,700 men and 1,300 women) would be diagnosed with oral cavity cancer in 2012, and another 1,150 Canadians (800 men and 350 women) would die of the disease.1
Oral cavity cancer is divided into two major groups according to the histology (tissue type) of the tumour. The majority of oral cavity cancers (90%) are of the squamous cell carcinoma type, which is this chapter’s focus; the remainder involve a range of rare histologies.
Anatomically, the oral cavity starts at the lips and ends posteriorly at the circumvallate papillae (the border of the anterior two-thirds of the tongue and the posterior third) (see Exhibit 1.1). Superiorly, the oral cavity ends at the junction between the hard
palate and the soft palate. The area behind the oral cavity is referred to as the oropharynx and includes the remainder of the oropharyngeal tongue (the tongue base), the soft palate, the posterior pharyngeal wall and the tonsils. The oral cavity is very important for swallowing, taste and speech. Due to significant differences in the epidemiology and management of oral cavity and oropharynx cancer, these two subsites could not be included in the same chapter. We acknowledge the risk for their misclassification by physicians and in the Ontario Cancer Registry but believe that this chapter provides an adequate scoping review of the management of oral cavity cancer in Ontario.
While some cancers of the oral cavity (excluding the oropharynx) are diagnosed at an early stage, most patients with these cancers have advanced-stage disease at the time of diagnosis.3
Patients are sometimes treated with antibiotics or oral rinses for what is believed to be an oral ulcer or other more common noncancerous oral lesions before a referral to a specialist for biopsy and other diagnostic tests ultimately leads to a cancer diagnosis.
Role of surgery in diagnosis and staging
A definitive diagnosis of oral cavity cancer usually involves a biopsy of a suspicious-appearing lesion. Typically, this can be performed in an office setting. After a biopsy confirms cancer, a consultation with a surgeon with expertise in the evaluation and treatment of this cancer is arranged. A comprehensive head and neck examination is
performed that involves flexible fibre optic inspection of the upper aerodigestive tract, including the nasopharynx, oropharynx, larynx and hypopharynx. This allows for visualization to assess the extent of the primary lesion and, if necessary, for the biopsy (sampling or removal) of other suspicious lesions. Infrequently, an examination of the upper aerodigestive tract (referred to as a panendoscopy) is performed under general anesthetic when there is concern about a second malignancy and rarely to facilitate biopsy of a posterior oral cavity cancer.
Treatment of squamous cell carcinoma of the oral cavity
Following diagnosis, patients should undergo appropriate staging investigations to assess the extent—local, regional (neck) or distant—of their disease. The main curative treatment modality for oral cavity cancer is surgical resection of the primary tumour with a margin of surrounding normal tissue. In patients at risk of nodal metastases, surgical removal of the cervical lymph nodes, referred to as neck dissection is performed. Radiation with or without chemotherapy is less frequently used in the primary management of oral cavity cancer. Radiation or chemoradiation may be considered for very advanced tongue cancer in which surgery would result in total or near total glossectomy, tumours of the oral cavity with extensive oropharyngeal involvement, or patients who refuse or are not fit for surgery. Radiation or chemoradiation is often used postoperatively to treat the primary site or the neck

Institute for Clinical Evaluative Sciences 19Institute for Clinical Evaluative Sciences 19
HEAD AND NECK CANCER SURGERY IN ONTARIO, 2003–2010SURGERY FOR ORAL CAVITY CANCER
in patients with adverse pathologic features. Resection is largely dependent on the location and extent of disease, whether it is resectable and whether the patient will tolerate a major operation; there are also functional considerations such as the effect of resection on the patient’s ability to speak, swallow, taste and breathe.4
Since the major risk factors for oral cavity cancer are tobacco and alcohol exposure, comorbid conditions such as smoking-related heart disease, chronic lung disease and alcohol-related liver disease are frequently present in this patient population. The presence of these health problems can sometimes limit the use of potentially curative surgical therapy for oral cavity cancer.
Type of surgical resection
Very small tumours are usually removed through the mouth, either in an operating room or at a procedure clinic. It is challenging in these circumstances to reliably distinguish a definitive resection from an excisional biopsy procedure using administrative data. For this reason, we defined definitive surgical procedures in this chapter based on resection codes for procedures performed in hospitals. These can be divided into resection by subsite (maxilla, mandible, mandibular alveolus, buccal, floor of mouth, tongue, and lip). The type of definitive procedure depends on tumour factors (location, extent), patient factors (comorbidities, preferences), and surgeon factors (ability to perform procedure).
How the study cohorts were defined
This chapter provides detailed information about surgical services and related health services delivered to adults newly diagnosed with oral cavity cancer (excluding oropharynx cancer) in Ontario from 2003 to 2010.
The study population for this chapter included all adults 18 years of age or older identified with oral cavity cancer in the Ontario Cancer Registry whose diagnosis date fell between January 1, 2003, and December 31, 2010. These are referred to as the Overall Oral Cavity Cancer Cohort.
The Overall Oral Cavity Cancer Cohort was then divided into two pairs of smaller groups.
For Exhibits 2.1A to 2.1C, the Overall Oral Cavity Cancer Cohort was divided as follows:
• The Oral Cavity Surgery Cohort included those who had surgery related to their oral cavity cancer within 12 months before or after their diagnosis date.
• The Oral Cavity/No Surgery Cohort included those who did not have surgery related to their oral cavity cancer within 12 months before or after their diagnosis date.
For Exhibits 2.2A to 2.8C, the Overall Oral Cavity Cancer Cohort was divided as follows:
• The Oral Cavity Resection Cohort included those who had resection of their primary tumour site within 12 months before or after their diagnosis date.
• The Oral Cavity/No Resection Cohort included those who did not have resection of their primary tumour site within 12 months before or after their diagnosis date. This group included all individuals who did not have surgery and those whose definitive surgery was limited to a surgical biopsy or adjunctive procedures (e.g., a tracheostomy or gastrostomy tube).

Institute for Clinical Evaluative Sciences20
HEAD AND NECK CANCER SURGERY IN ONTARIO, 2003–2010 SURGERY FOR ORAL CAVITY CANCER
List of Exhibits
EXHIBIT 2.1A Incidence of oral cavity cancer and use of surgery among adults in the Overall Oral Cavity Cancer Cohort, by sex, age group, neighbourhood income quintile, community size and Local Health Integration Network of residence, in Ontario, 2003 to 2010
EXHIBIT 2.1B Incidence of oral cavity cancer and use of surgery among men in the Overall Oral Cavity Cancer Cohort, by age group, neighbourhood income quintile, community size and Local Health Integration Network of residence, in Ontario, 2003 to 2010
EXHIBIT 2.1C Incidence of oral cavity cancer and use of surgery among women in the Overall Oral Cavity Cancer Cohort, by age group, neighbourhood income quintile, community size and Local Health Integration Network of residence, in Ontario, 2003 to 2010
EXHIBIT 2.2A Health care use among adults in the Oral Cavity Cancer Resection Cohort, by sex, age group, neighbourhood income quintile, community size and Local Health Integration Network of residence and of treatment, in Ontario, 2003 to 2010
EXHIBIT 2.2B Health care use among adults in the Oral Cavity Cancer Resection Cohort, by Local Health Integration Network of residence and of treatment, in Ontario, 2003 to 2010
EXHIBIT 2.3 Hospital admissions for oral cavity surgery among men and women in the Oral Cavity Cancer Resection Cohort in the 12 months before and 12 months after their diagnosis, by Local Health Integration Network of residence and of treatment, in Ontario, 2003 to 2010
EXHIBIT 2.4 Type of definitive resection procedure among adults in the Oral Cavity Cancer Resection Cohort, by sex, age group, neighbourhood income quintile, community size and Local Health Integration Network of residence and of treatment, in Ontario, 2003 to 2010
EXHIBIT 2.5 Proportion of adults in the Overall Oral Cavity Cancer Cohort who received an oral cavity resection as a definitive procedure, by Local Health Integration Network of residence, in Ontario, 2003 to 2010
EXHIBIT 2.6A Overall pattern of surgical care provided to adults in the Oral Cavity Cancer Resection Cohort, by physician specialty, in Ontario, 2003 to 2010
EXHIBIT 2.6B Overall pattern of surgical care provided to adults in the Oral Cavity Cancer Resection Cohort, by hospital type, in Ontario, 2003 to 2010
EXHIBIT 2.7A Diagnostic and adjunctive procedures received by adults in the Oral Cavity Cancer Resection Cohort in the 12 months before and 12 months after their definitive surgery, by Local Health Integration Network of residence and of treatment in Ontario, 2003 to 2010
EXHIBIT 2.7B Radiologic services received by adults in the Oral Cavity Cancer Resection Cohort in the 12 months before and 12 months after their definitive surgery, by Local Health Integration Network of residence and of treatment, in Ontario, 2003 to 2010
EXHIBIT 2.7C Consultations and services received by adults in the Oral Cavity Cancer Resection Cohort in the 12 months before and 12 months after their definitive surgery, by Local Health Integration Network of residence and of treatment, in Ontario, 2003 to 2010

Institute for Clinical Evaluative Sciences 21
HEAD AND NECK CANCER SURGERY IN ONTARIO, 2003–2010SURGERY FOR ORAL CAVITY CANCER
EXHIBIT 2.8A Diagnostic and adjunctive procedures received by adults in the Oral Cavity Cancer/No Resection Cohort in the 12 months before and 12 months after diagnosis, by Local Health Integration Network of residence, in Ontario, 2003 to 2010
EXHIBIT 2.8B Radiologic services received by adults in the Oral Cavity Cancer/ No Resection Cohort in the 12 months before and 12 months after their definitive surgery, by Local Health Integration Network of residence, in Ontario, 2003 to 2010
EXHIBIT 2.8C Consultations and services received by adults in the Oral Cavity Cancer/No Resection Cohort in the 12 months before and 12 months after their definitive surgery, by Local Health Integration Network of residence, in Ontario, 2003 to 2010

Institute for Clinical Evaluative Sciences22 Institute for Clinical Evaluative Sciences22
HEAD AND NECK CANCER SURGERY IN ONTARIO, 2003–2010 SURGERY FOR ORAL CAVITY CANCER
EXHIBIT 2.1A Incidence of oral cavity cancer and use of surgery among adults in the Overall Oral Cavity Cancer Cohort, by sex, age group, neighbourhood income quintile, community size and Local Health Integration Network of residence, in Ontario, 2003 to 2010
Key Findings
• Men constituted 62% of all patients with oral cavity cancer in Ontario from 2003 to 2010. In the Overall Oral Cavity Cancer Cohort, the rate of oral cavity cancer cases per 100,000 population was higher among men (28.6) than women (14.6).
• The incidence of oral cavity cancer increased with age. Nearly half (47.3%) of newly diagnosed oral cavity cancers occurred in persons aged 65 or older, and a quarter (25.1%) occurred in those younger than age 55.
• The incidence of oral cavity cancer declined with increasing neighbourhood income.
• The incidence of oral cavity cancer increased with smaller community size. The proportion of Ontarians with oral cavity cancer who underwent cancer-related surgery decreased with smaller community size.
• There were variations in the incidence of oral cavity cancer across Local Health Integration Network (LHINs) of patient residence. The Central and Mississauga Halton LHINs had the lowest incidence rate (19 cases per 100,000) and the Erie St. Clair LHIN had the highest (23 cases per 100,000).
• The probability of undergoing surgery was lower for patients aged 75 or older (67%) compared to those in the younger age groups (all above 80%).
• Rates of surgery for oral cavity cancer varied across LHINs of patient residence. The proportion of patients in the cohort who had surgery for their disease ranged from a low of 77% among those living in the South East LHIN at the time of diagnosis to a high of 91% among those who resided in the South West LHIN.

Institute for Clinical Evaluative Sciences 23Institute for Clinical Evaluative Sciences 23
HEAD AND NECK CANCER SURGERY IN ONTARIO, 2003–2010SURGERY FOR ORAL CAVITY CANCER
EXHIBIT 2.1A continued
Characteristic
Age-standardized1 Incidence
per 100,000
Overall Oral Cavity Cancer Cohort
Total Had surgery Did not have surgery
N % nAge-standardized2
% of total nAge-standardized2
% of total
Ontario 21.3 2,196 100.0 1,786 85.3 410 14.7Sex3
Female 14.6 841 38.3 658 85.9 183 14.1Male 28.6 1,355 61.7 1,128 85.2 227 14.8Age group,3 years18–54 9.1 551 25.1 478 87.0 73 13.055–64 44.8 605 27.6 531 87.7 74 12.365–69 57.8 266 12.1 229 86.6 37 13.470–74 61.0 242 11.0 194 80.4 48 19.6≥75 69.3 532 24.2 354 66.9 178 33.1Neighbourhood income quintileQ1 (lowest) 24.0 466 21.2 379 86.6 87 13.4Q2 23.7 495 22.5 398 82.9 97 17.1Q3 19.8 403 18.4 337 87.7 66 12.3Q4 20.1 413 18.8 328 84.8 85 15.2Q5 (highest) 20.0 419 19.1 344 86.6 75 13.4Community size (population)≥1,500,000 20.1 813 37.0 665 85.7 148 14.3100,000–1,499,999 22.4 867 39.5 697 85.8 170 14.2<100,000 22.4 516 23.5 424 83.7 92 16.3
LHIN of residence1. Erie St. Clair 23.0 130 5.9 101 85.1 29 14.92. South West 21.6 182 8.3 158 90.8 24 9.23. Waterloo Wellington 21.8 124 5.6 103 88.2 21 11.84. Hamilton Niagara Haldimand Brant 21.1 258 11.7 217 86.8 41 13.25. Central West 20.1 108 4.9 90 90.1 18 9.96. Mississauga Halton 19.1 149 6.8 118 81.3 31 18.77. Toronto Central 20.5 201 9.2 164 90.0 37 10.08. Central 19.1 246 11.2 202 84.6 44 15.49. Central East 20.2 256 11.7 212 82.3 44 17.710. South East 20.4 96 4.4 68 77.0 28 23.011. Champlain 20.3 207 9.4 154 83.7 53 16.312. North Simcoe Muskoka 19.7 79 3.6 66 81.1 13 18.913. North East 21.2 116 5.3 101 90.0 15 10.014. North West 20.6 44 2.0 32 84.5 12 15.5
1 Standardized to the 1991 Canadian census. 2 Standardized to the Overall Oral Cavity Cancer Cohort. 3 Sex-specific rates have been adjusted for age; age-specific rates have been adjusted for sex.

Institute for Clinical Evaluative Sciences24 Institute for Clinical Evaluative Sciences24
HEAD AND NECK CANCER SURGERY IN ONTARIO, 2003–2010 SURGERY FOR ORAL CAVITY CANCER
EXHIBIT 2.1B Incidence of oral cavity cancer and use of surgery among men in the Overall Oral Cavity Cancer Cohort, by age group, neighbourhood income quintile, community size and Local Health Integration Network of residence, in Ontario, 2003 to 2010
Key Findings
• The findings shown in this exhibit are similar to those in Exhibit 2.1A; that is, both the incidence of oral cavity cancer and the proportion of men who had surgery were related to age.
• Among men, the incidence of oral cavity cancer and the proportion of patients who had surgery were both related to income. For example, men in the lowest income group had the highest incidence of this cancer (34 cases per 100,000). Among men in the highest income group, 91% had received cancer-related surgery, the largest proportion overall.
• The incidence of oral cavity cancer was highest for men living in smaller communities at the time of their diagnosis (29 cases per 100,000).
• Men living in the North East Local Health Integration Network (LHIN) had the highest incidence of oral cavity cancer (31 cases per 100,000) and those living in the Central LHIN had the lowest (22 cases per 100,000).
• Men living in the North East LHIN were the most likely to have oral cavity cancer-related surgery (97%), while those living in the South East LHIN were the least likely (74%).
Characteristic
Age-standardized1
Incidenceper 100,000
Overall Oral Cavity Cancer Cohort
Total Had surgery Did not have surgery
N % n
Age-standardized2
% of total n
Age-standardized2
% of total
Ontario 28.6 1,355 100.0 1,128 85.5 227 14.5
Age group,3 years18–54 5.0 391 28.9 338 86.4 53 13.6
55–64 35.9 430 31.7 378 87.9 52 12.1
65–69 35.1 175 12.9 149 85.1 26 14.9
70–74 37.8 138 10.2 109 79.0 29 21.0
≥75 45.5 221 16.3 154 69.7 67 30.3
Neighbourhood income quintileQ1 (lowest) 33.5 305 22.5 258 85.5 47 14.5
Q2 31.1 308 22.7 257 83.3 51 16.7
Q3 25.1 247 18.2 208 88.7 39 11.3
Q4 24.1 245 18.1 196 79.4 49 20.6
Q5 (highest) 23.9 250 18.5 209 91.0 41 9.0
Community size (population)≥1,500,000 25.6 502 37.0 420 86.2 82 13.8
100,000–1,499,999 28.5 531 39.2 440 83.8 91 16.2
<100,000 28.7 322 23.8 268 87.1 54 12.9
LHIN of residence1. Erie St. Clair 29.0 80 5.9 61 76.5 19 23.5
2. South West 27.9 113 8.3 99 85.5 14 14.5
3. Waterloo Wellington 27.9 79 5.8 65 85.0 14 15.0
4. Hamilton Niagara Haldimand Brant 27.0 158 11.7 135 85.8 23 14.2
5. Central West 26.5 73 5.4 65 89.2 8 10.8
6. Mississauga Halton 23.3 92 6.8 74 78.5 18 21.5
7. Toronto Central 28.0 131 9.7 108 91.5 23 8.5
8. Central 21.6 138 10.2 117 86.3 21 13.7
9. Central East 24.1 149 11.0 127 85.7 22 14.3
10. South East 25.7 60 4.4 43 73.7 17 26.3
11. Champlain 23.9 119 8.8 95 85.2 24 14.8
12. North Simcoe Muskoka 26.9 53 3.9 45 81.3 8 18.7
13. North East 30.8 83 6.1 74 96.5 9 3.5
14. North West 24.7 27 2.0 20 92.3 7 7.7
1 Standardized to the 1991 Canadian census.2 Standardized to the Overall Oral Cavity Cancer Cohort.3 Age-specific rates have not been standardized.

Institute for Clinical Evaluative Sciences 25Institute for Clinical Evaluative Sciences 25
HEAD AND NECK CANCER SURGERY IN ONTARIO, 2003–2010SURGERY FOR ORAL CAVITY CANCER
EXHIBIT 2.1C Incidence of oral cavity cancer and use of surgery among women in the Overall Oral Cavity Cancer Cohort, by age group, neighbourhood income quintile, community size and Local Health Integration Network of residence, in Ontario, 2003 to 2010
Key Findings
• The incidence of oral cavity cancer among Ontario women increased markedly with age from 2003 to 2010. The rate was highest among women aged 75 or older (39 cases per 100,000).
• Across the Local Health Integration Networks (LHINs) of patient residence, the highest incidence of oral cavity cancer was among women living in the Erie St. Clair LHIN at the time of diagnosis (17 cases per 100,000). The lowest incidence was among those who resided in the North East LHIN (12 cases per 100,000).
• Women in the Overall Oral Cavity Cancer Cohort who were aged 75 or older at the time of diagnosis were less likely to undergo surgery related to their cancer than similarly aged men in the same cohort.
• The age-standardized proportion of women in the study cohort who underwent surgery related to their oral cavity cancer in the 12 months before or after diagnosis was highest among those living in the South West LHIN (96%).
Characteristic
Age-standardized1
Incidenceper 100,000
Overall Oral Cavity Cancer Cohort
Total Had surgery Did not have surgery
N % n
Age-standardized2
% of total n
Age-standardized2
% of total
Ontario 15.7 841 100.0 658 85.5 183 14.5
Age group,3 years18–54 2.1 160 19.0 140 87.5 20 12.5
55–64 14.2 175 20.8 153 87.4 22 12.6
65–69 15.5 91 10.8 80 87.9 11 12.1
70–74 22.1 104 12.4 85 81.7 19 18.3
≥75 38.5 311 37.0 200 64.3 111 35.7
Neighbourhood income quintileQ1 (lowest) 14.9 161 19.1 121 87.7 40 12.3
Q2 16.6 187 22.2 141 82.5 46 17.5
Q3 14.8 156 18.5 129 86.8 27 13.2
Q4 16.3 168 20.0 132 89.9 36 10.1
Q5 (highest) 16.2 169 20.1 135 82.4 34 17.6
Community size (population)≥1,500,000 14.8 311 37.0 245 85.3 66 14.7
100,000–1,499,999 16.5 336 40.0 257 87.7 79 12.3
<100,000 16.3 194 23.1 156 80.5 38 19.5
LHIN of residence1. Erie St. Clair 17.3 50 5.9 40 93.4 10 6.6
2. South West 15.6 69 8.2 59 95.9 10 4.1
3. Waterloo Wellington 16.0 45 5.4 38 91.2 7 8.8
4. Hamilton Niagara Haldimand Brant 15.4 100 11.9 82 87.8 18 12.2
5. Central West 14.1 35 4.2 25 91.1 10 8.9
6. Mississauga Halton 15.0 57 6.8 44 84.0 13 16.0
7. Toronto Central 13.4 70 8.3 56 88.6 14 11.4
8. Central 16.7 108 12.8 85 83.0 23 17.0
9. Central East 16.4 107 12.7 85 79.0 22 21.0
10. South East 15.3 36 4.3 25 80.2 11 19.8
11. Champlain 16.8 88 10.5 59 82.3 29 17.7
12. North Simcoe Muskoka 12.7 26 3.1 * * * *
13. North East 11.9 33 3.9 27 83.7 6 16.3
14. North West 16.7 17 2.0 * * * *
1 Standardized to the 1991 Canadian census. 2 Standardized to the Overall Oral Cavity Cancer Cohort. 3 Age-specific rates have not been standardized. * In accordance with ICES policy, the exact number is suppressed when the cell size is <6, or when the cell size allows for a number of <6 to be calculated.

Institute for Clinical Evaluative Sciences26 Institute for Clinical Evaluative Sciences26
HEAD AND NECK CANCER SURGERY IN ONTARIO, 2003–2010 SURGERY FOR ORAL CAVITY CANCER
EXHIBIT 2.2A Type and number of health care services used by adults in the Oral Cavity Cancer Resection Cohort, by sex, age group, neighbourhood income quintile, community size and Local Health Integration Network of residence and treatment, in Ontario, 2003 to 2010
Key Findings
• Approximately 64% of hospital admissions for patients in the Oral Cavity Cancer Resection Cohort were for inpatient care; the remaining 36% were for ambulatory (same-day) care.
• Fifty-eight percent of patients in this cohort had more than one hospital admission in the 12 months before and after their cancer diagnosis.
• Patients residing in the South East Local Health Integration Network (LHIN) at the time of their diagnosis had the highest rate of same-day admissions (49%) in the 12 months before and after their oral cavity resection.
• Patients in this cohort averaged 4.1 visits with their treating surgeon in the 12 months before and after their oral cavity resection.
• Patients in this cohort had an average hospital length of stay of 9.4 days for their oral cavity resection procedure.
• Patients treated in seven of the LHINs (Erie St. Clair, Waterloo Wellington, Central West, Mississauga Halton, Central, Central East and North Simcoe Muskoka) had very short hospital stays (less than three days) for their oral cavity resection procedures. These patients may have had smaller resections that do not require a long hospital stay.

Institute for Clinical Evaluative Sciences 27Institute for Clinical Evaluative Sciences 27
HEAD AND NECK CANCER SURGERY IN ONTARIO, 2003–2010SURGERY FOR ORAL CAVITY CANCER
EXHIBIT 2.2A continued
Characteristic Cohort, N
Patients who had surgical resection, %
Visits with treating
surgeon, avg per patient1
Patients with more than one
hospital admission, %
Total hospital admissions,2 n
Admissions, avg per patient2
Same-day surgery as % of total
admissions
Inpatient admissions as
% of total admissions
Avg. length of stay, days
Median length of stay (IQR),
days
Patients with preoperative
XRT or chemotherapy,
%Ontario 1,640 74.7 4.1 58.2 3,566 2.2 36.4 63.6 9.4 8 (2–13) 3.2Sex3
Female 620 73.7 4.2 57.3 1,315 2.1 36.3 63.7 9.3 7 (1–13) 3.5Male 1,020 75.3 4.0 58.7 2,251 2.2 36.5 63.5 9.4 8 (2–13) 3.0Age group,3 years18–54 442 80.2 4.4 58.4 944 2.1 31.9 68.1 7.9 7 (2–12) 2.555–64 488 80.7 4.2 57.4 1,050 2.2 34.2 65.8 9.5 8 (2–13) 3.565–69 206 77.4 4.1 58.3 462 2.2 34.6 65.4 10.7 9 (2–15) 4.970–74 185 76.4 4.0 54.1 399 2.2 43.6 56.4 10.1 7 (1–13) 3.2≥75 319 60.0 3.7 61.4 711 2.2 42.8 57.2 10.0 6 (1–14) 2.8Neighbourhood income quintileQ1 (lowest) 331 71.0 3.9 58.6 716 2.2 34.6 65.4 9.7 8 (2–14) 2.4Q2 370 74.7 4.1 58.6 803 2.2 34.0 66.0 10.5 9 (2–14) 3.5Q3 311 77.2 4.1 55.3 692 2.2 40.6 59.4 9.0 7 (2–13) 2.3Q4 305 73.8 4.3 58.7 649 2.1 36.1 63.9 8.9 7 (1–12) 3.6Q5 (highest) 323 77.1 4.2 59.4 706 2.2 37.1 62.9 8.6 7 (1–13) 4.3Community size (population)≥1,500,000 600 73.8 4.2 55.5 1,284 2.1 30.8 69.2 10.0 8 (2–14) 3.5100,000–1,499,999 649 74.9 4.3 59.6 1,385 2.1 38.9 61.1 8.8 7 (1–13) 3.5<100,000 391 75.8 3.6 59.8 897 2.3 40.5 59.5 9.4 8 (1–14) 2.3
1 The time frame for surgeon visits was 6 months before to 6 months after the first surgery. 2 The time frame for hospital admissions was 12 months before to 12 months after the first surgery. 3 Standardized to the Overall Oral Cavity Cancer Cohort; sex-specific rates have been adjusted for age; age-specific rates have been adjusted for sex. IQR = interquartile range; XRT = cetuximab and radiation.

Institute for Clinical Evaluative Sciences28 Institute for Clinical Evaluative Sciences28
HEAD AND NECK CANCER SURGERY IN ONTARIO, 2003–2010 SURGERY FOR ORAL CAVITY CANCER
EXHIBIT 2.2A continued
Characteristic Cohort, N
Patients who had surgical resection, %
Visits with treating
surgeon, avg per patient1
Patients with more than one
hospital admission, %
Total hospital admissions,2 n
Admissions, avg per patient2
Same-day surgery as % of total
admissions
Inpatient admissions as
% of total admissions
Avg. length of stay, days
Median length of stay (IQR),
days
Patients with preoperative
XRT or chemotherapy,
%LHIN of residence1. Erie St. Clair 95 73.1 3.4 62.1 211 2.2 40.8 59.2 8.5 8 (1–13) *2. South West 155 85.2 3.7 51.6 304 2.0 28.0 72.0 10.6 9 (2–13) *3. Waterloo Wellington 97 78.2 3.8 56.7 204 2.1 39.7 60.3 8.5 6 (2–11) *4. Hamilton Niagara Haldimand Brant 203 78.7 4.3 62.6 442 2.2 44.8 55.2 6.9 6 (0–10) *5. Central West 80 74.1 4.1 60.0 188 2.4 33.5 66.5 10.2 9.5 (4–14) *6. Mississauga Halton 110 73.8 4.0 57.3 239 2.2 23.8 76.2 10.4 8 (2–15) *7. Toronto Central 144 71.6 4.2 50.7 288 2.0 26.0 74.0 10.7 7 (2–14) *8. Central 185 75.2 4.4 56.8 388 2.1 38.7 61.3 9.0 7 (2–12) *
9. Central East 189 73.8 4.1 57.7 436 2.3 33.5 66.5 10.2 9 (3–14) *10. South East 65 67.7 4.3 58.5 165 2.5 49.1 50.9 7.3 5 (1–11) *11. Champlain 142 68.6 5.0 59.9 302 2.1 35.4 64.6 10.7 9 (1–15) *12. North Simcoe Muskoka 58 73.4 3.4 56.9 128 2.2 35.2 64.8 8.6 5 (2–14) *13. North East 89 76.7 3.8 64.0 199 2.2 46.7 53.3 9.1 10 (0–15) *14. North West 28 63.6 3.8 78.6 72 2.6 43.1 56.9 11.5 11 (3–16) *LHIN of treatment1. Erie St. Clair 16 ** 4.2 68.8 41 2.6 68.3 31.7 0.8 0 (0–1) *2. South West 275 ** 3.7 54.9 562 2.0 30.8 69.2 10.0 9 (3–13) *3. Waterloo Wellington 10 ** 2.9 70.0 22 2.2 72.7 27.3 0.8 0 (0) *4. Hamilton Niagara Haldimand Brant 218 ** 4.2 61.9 467 2.1 44.5 55.5 7.4 6 (0–10) *5. Central West 6 ** 2.3 * 12 2.0 * 58.3 1.5 1.5 (1–2) *6. Mississauga Halton 7 ** 6.3 * 15 2.1 46.7 53.3 1.9 2 (1–3) *7. Toronto Central 778 ** 4.1 56.2 1,678 2.2 29.3 70.7 10.6 9 (3–14) * A. University Health Network 459 ** 3.7 56.6 1,012 2.2 27.7 72.3 11.6 10 (3–16) * B. Sunnybrook Health Sciences Centre 151 ** 4.7 59.6 315 2.1 37.8 62.2 10.1 9 (6–13) * C. Mount Sinai Hospital 142 ** 4.5 50.0 288 2.0 26.0 74.0 8.3 4 (2–11) * D. Other 26 ** 5.1 61.5 63 2.4 28.6 71.4 7.2 3.5 (0–11) *8. Central 11 ** 2.0 81.8 30 2.7 80.0 20.0 0.3 0 (0) *9. Central East 21 ** 3.8 61.9 55 2.6 69.1 30.9 2.9 0 (0–1) *10. South East 49 ** 4.0 61.2 132 2.7 49.2 50.8 6.9 5 (1–11) *11. Champlain 155 ** 5.0 60.0 338 2.2 37.6 62.4 10.3 9 (1–14) *12. North Simcoe Muskoka 8 ** 2.6 * 16 2.0 62.5 37.5 0.8 0 (0–1.5) *13. North East 73 ** 3.8 64.4 160 2.2 51.3 48.8 8.5 9 (0–14) *14. North West 13 ** 6.7 76.9 38 2.9 60.5 39.5 8.2 5 (0–12) *
1 The time frame for surgeon visits was 6 months before to 6 months after the first surgery. 2 The time frame for hospital admissions was 12 months before to 12 months after the first surgery. 3 Standardized to the Overall Oral Cavity Cancer Cohort; sex-specific rates have been adjusted for age; age-specific rates have been adjusted for sex. * In accordance with ICES policy, the exact number is suppressed when the cell size is <6, or when the cell size allows for a number of <6 to be calculated. * * A percentage could not be derived as it is difficult to determine the denominator of patients that presented to each treatment LHIN using administrative data. IQR = interquartile range; XRT = cetuximab and radiation.

Institute for Clinical Evaluative Sciences 29Institute for Clinical Evaluative Sciences 29
HEAD AND NECK CANCER SURGERY IN ONTARIO, 2003–2010SURGERY FOR ORAL CAVITY CANCER
EXHIBIT 2.2B Type and number of health care services used by adults in the Oral Cavity Cancer Resection Cohort, by Local Health Integration Network of treatment, in Ontario, 2003 to 2010
Key Findings
• Patients treated by oral cavity resection had, on average, less than 1 day (0.8 days) in the intensive care unit during their oral cavity resection admission. This varied by the LHIN of the treating institution, potentially reflecting differing tumour sizes and variation in the complexity of procedures performed by different institutions.
• Ten percent of patients undergoing an oral cavity resection procedure in Ontario between 2003 and 2010 were readmitted to hospital within 30 days of discharge. Even among LHINs with the highest treatment volumes, there was variation in the rate of readmission. The readmission rate was highest in the Hamilton Niagara Haldimand Brant LHIN (15%).
Characteristic Cohort, N
ED Visits CCAC Visits ICU Days Hospital Readmissions
nAvg1 per
patient, n nAvg1 per
patient, n nAvg1 per
patient, n n
Patients readmitted
n %
Ontario 1,640 2,372 1.4 43,457 26.5 1,254 0.8 198 171 10.4
LHIN of residence1. Erie St. Clair 95 190 2.0 3,298 34.7 49 0.5 11 11 11.6
2. South West 155 360 2.3 4,251 27.4 149 1.0 13 11 7.1
3. Waterloo Wellington 97 102 1.1 2,953 30.4 29 0.3 13 12 12.4
4. Hamilton Niagara Haldimand Brant 203 312 1.5 6,437 31.7 67 0.3 30 26 12.8
5. Central West 80 87 1.1 1,995 24.9 72 0.9 * * *
6. Mississauga Halton 110 163 1.5 2,672 24.3 58 0.5 13 13 11.8
7. Toronto Central 144 175 1.2 3,700 25.7 147 1.0 22 20 13.9
8. Central 185 168 0.9 4,357 23.6 138 0.7 19 16 8.6
9. Central East 189 195 1.0 4,799 25.4 159 0.8 29 23 12.2
10. South East 65 105 1.6 1,195 18.4 31 0.5 * * *
11. Champlain 142 247 1.7 3,806 26.8 103 0.7 21 16 11.3
12. North Simcoe Muskoka 58 69 1.2 1,107 19.1 17 0.3 * * *
13. North East 89 152 1.7 1,939 21.8 213 2.4 13 11 12.4
14. North West 28 47 1.7 948 33.9 22 0.8 6 * *
LHIN of treatment1. Erie St. Clair 16 18 1.1 * * * * * * *
2. South West 275 569 2.1 8,991 32.7 214 0.8 26 24 8.7
3. Waterloo Wellington 10 8 0.8 145 14.5 * * * * *
4. Hamilton Niagara Haldimand Brant 218 334 1.5 7,468 34.3 58 0.3 37 32 14.7
5. Central West 6 * * 60 10.0 * * 0 0 0.0
6. Mississauga Halton 7 * * * * 0 0.0 0 0 0.0
7. Toronto Central 778 914 1.2 19,563 25.1 634 0.8 89 79 10.2
A. University Health Network 459 590 1.3 12,470 27.2 123 0.3 47 42 9.2
B. Sunnybrook Health Sciences Centre 151 145 1.0 4,503 29.8 350 2.3 23 20 13.2
C. Mount Sinai Hospital 142 152 1.1 2,071 14.6 104 0.7 14 13 9.2
D. Other 26 27 1.0 519 20.0 57 2.2 * * *
8. Central 11 18 1.6 196 17.8 * * * * *
9. Central East 21 27 1.3 254 12.1 * * * * *
10. South East 49 64 1.3 734 15.0 10 0.2 * * *
11. Champlain 155 278 1.8 4,060 26.2 110 0.7 22 17 11.0
12. North Simcoe Muskoka 8 14 1.8 45 5.6 0 0.0 * * *
13. North East 73 96 1.3 1,568 21.5 201 2.8 7 7 9.6
14. North West 13 22 1.7 325 25.0 9 0.7 * * *
1 The denominator includes all patients in the Larynx/Hypopharynx Cancer Resection Cohort.* In accordance with ICES policy, the exact number is suppressed when the cell size is <6,
or when the cell size allows for a number of <6 to be calculated.** The LHIN did not treat any patients from the Cancer Resection Cohort (i.e., no
laryngectomies were performed in the LHIN).ED = emergency department; CCAC = Community Care Access Centre; ICU = intensive care unit.

Institute for Clinical Evaluative Sciences30 Institute for Clinical Evaluative Sciences30
HEAD AND NECK CANCER SURGERY IN ONTARIO, 2003–2010 SURGERY FOR ORAL CAVITY CANCER
EXHIBIT 2.2C Type and number of health care services used by adults in the Oral Cavity Cancer Resection Cohort, by Local Health Integration Network of residence, in Ontario, 2003 to 2010
Key Findings
• Patients treated by oral cavity resection averaged 1.4 emergency department visits in the 12 months before and 12 months after their definitive resection procedure.
• Patients treated by oral cavity resection received 26.5 Community Care Access Centre (CCAC) visits, on average, in the 12 months before and after their definitive resection procedure. Patients residing in the Erie St. Clair LHIN at the time of diagnosis received the most CCAC visits (34.7); those living in the South East LHIN received the fewest (18.4).
Characteristic Cohort, N
ED Visits CCAC Visits ICU Days Hospital Readmissions
nAvg1 per
patient, n nAvg1 per
patient, n nAvg1 per
patient, n n
Patients readmitted
n %
Ontario 1,640 2,372 1.4 43,457 26.5 1,254 0.8 198 171 10.4
LHIN of residence1. Erie St. Clair 95 190 2.0 3,298 34.7 49 0.5 11 11 11.6
2. South West 155 360 2.3 4,251 27.4 149 1.0 13 11 7.1
3. Waterloo Wellington 97 102 1.1 2,953 30.4 29 0.3 13 12 12.4
4. Hamilton Niagara Haldimand Brant 203 312 1.5 6,437 31.7 67 0.3 30 26 12.8
5. Central West 80 87 1.1 1,995 24.9 72 0.9 * * *
6. Mississauga Halton 110 163 1.5 2,672 24.3 58 0.5 13 13 11.8
7. Toronto Central 144 175 1.2 3,700 25.7 147 1.0 22 20 13.9
8. Central 185 168 0.9 4,357 23.6 138 0.7 19 16 8.6
9. Central East 189 195 1.0 4,799 25.4 159 0.8 29 23 12.2
10. South East 65 105 1.6 1,195 18.4 31 0.5 * * *
11. Champlain 142 247 1.7 3,806 26.8 103 0.7 21 16 11.3
12. North Simcoe Muskoka 58 69 1.2 1,107 19.1 17 0.3 * * *
13. North East 89 152 1.7 1,939 21.8 213 2.4 13 11 12.4
14. North West 28 47 1.7 948 33.9 22 0.8 6 * *
1 The denominator includes all patients in the Oral Cavity Cancer Resection Cohort. * In accordance with ICES policy, the exact number is suppressed when the cell size is <6, or when the cell size allows for a number of <6 to be calculated. ED = emergency department; CCAC = Community Care Access Centre; ICU = intensive care unit.

Institute for Clinical Evaluative Sciences 31Institute for Clinical Evaluative Sciences 31
HEAD AND NECK CANCER SURGERY IN ONTARIO, 2003–2010SURGERY FOR ORAL CAVITY CANCER
EXHIBIT 2.3 Hospital admission for oral cavity surgery among adults in the Oral Cavity Cancer Resection Cohort in the 12 months before and 12 months after diagnosis, by Local Health Integration Network of residence and of treatment, in Ontario, 2003 to 2010
Key Findings
• Half (49%) of all oral cavity resections were done outside the Local Health Integration Networks (LHINs) where the patients resided at the time of diagnosis. (Note: Some data are suppressed due to small cell size.)
• Approximately 18% of oral cavity resection procedures undertaken in hospitals in the Toronto Central LHIN were performed on patients who lived in this LHIN when their cancers were diagnosed. The majority of oral cavity resection procedures undertaken in the Toronto Central LHIN were performed on patients who lived in other LHINs, including the Central (23%) and Central East (22%) LHINs.
• Across the province, 78% of oral cavity resection procedures undergone by patients in the cohort were performed in hospitals in the South West, Hamilton Niagara Haldimand Brant, and Toronto Central LHINs.

Institute for Clinical Evaluative Sciences32 Institute for Clinical Evaluative Sciences32
HEAD AND NECK CANCER SURGERY IN ONTARIO, 2003–2010 SURGERY FOR ORAL CAVITY CANCER
EXHIBIT 2.3 continued
LHIN of Residence
LHIN of Treatment
Ontario1. Erie St.
Clair2. South
West3. Waterloo Wellington
4. Hamilton Niagara
Haldimand Brant
5. Central West
6. Mississauga Halton
7. Toronto Central 8. Central
9. Central East
10. South East 11. Champlain
12. North Simcoe
Muskoka13. North
East14. North
West
Admissions, n (Column %, Row %)1
1. Erie St. Clair * 79(83.2, 28.7) * 95
(5.8, 100.0)
2. South West 143(92.3, 52.0) * * 6
(3.9, 0.8)155
(5.9, 100.0)
3. Waterloo Wellington * 43
(44.3, 15.6) * 27(27.8, 12.4)
20(20.6, 2.6)
97(5.9, 100.0)
4. Hamilton Niagara Haldimand Brant * 184
(90.6, 84.4)12
(5.9, 1.5) * 203(12.4, 100.0)
5. Central West * 73(91.3, 9.4) * 80
(4.9, 100.0)
6. Mississauga Halton * * 7
(6.4, 100.0)98
(89.1, 12.6)110
(6.7, 100.0)
7. Toronto Central * 140(97.2, 18.0) * * 144
(8.8, 100.0)
8. Central 175(94.6, 22.5) * * 185
(11.3, 100.0)
9. Central East * 168(88.9, 21.6)
16(8.5, 76.2) * 189
(11.5, 100.0)
10. South East 8(12.3, 1.0)
45(69.2, *)
12(18.5, 7.7)
65(4.0, 100.0)
11. Champlain * * 142(8.7, 100.0)
12. North Simcoe Muskoka
45(77.6, 5.8) * *
(1.7, 0.7)8
(13.8, 100.0) * 58(3.5, 100.0)
13. North East * * 71(79.8, *)
89(5.4, 100.0)
14. North West 15(53.6, 1.9)
13(46.4, 100.0)
28(1.7, 100.0)
Ontario 16(100.0, 1.0)
275(100.0, 16.8)
10(100.0, 0.6)
218(100.0, 13.3) * 7
(100.0, 0.4)778
(100.0, 47.4)11
(100.0, 0.7)21
(100.0, 1.3) * 155(100.0, 9.5)
8(100.0, 0.5) * 13
(100.0, 0.8)1,640
(100.0, 100.0)
1 Column % = the proportion of patients having oral cavity cancer surgery in a given LHIN who were residents of that LHIN when diagnosed, and the proportion who were residents of other LHINs. Row % = the proportion of patients having oral cavity cancer surgery in a given LHIN who had surgery in their LHIN of residence, and the proportion who had the surgery in other LHINs.
* In accordance with ICES policy, the exact number is suppressed when the cell size is <6, or when the cell size allows for a number of <6 to be calculated. Totals may not sum due to small-cell suppression.

Institute for Clinical Evaluative Sciences 33Institute for Clinical Evaluative Sciences 33
HEAD AND NECK CANCER SURGERY IN ONTARIO, 2003–2010SURGERY FOR ORAL CAVITY CANCER
EXHIBIT 2.4 Type of definitive resection procedure among adults in the Oral Cavity Cancer Resection Cohort, by sex, age group, neighbourhood income quintile, community size and Local Health Integration Network of residence and of treatment, in Ontario, 2003 to 2010
Key Findings
• Only 2% of maxilla, mandible and mandibular alveolus resections were performed outside of the Local Health Integration Networks with designated head and neck cancer treatment centres, indicating that these resections are highly regionalized.
• With increasing age, patients were more likely to have a maxilla or mandibular alveolus resection and less likely to receive a tongue resection. For example, 3% of patients aged 55 to 64 received a maxilla resection compared to 10% of those aged 75 or older.
• In the Oral Cavity Resection Cohort, the rate of maxilla resection was lowest among those living in the lowest-income neighbourhoods (4%) and highest among those living in the highest-income neighbourhoods (8%). A similar trend was observed for mandibular alveolus resection. The opposite trend was observed for floor of mouth resection.
Characteristic Cohort, N
Definitive Resection Procedure
Maxilla Mandible Mandibular alveolus Buccal Floor of mouth Tongue Lip
n % n % n % n % n % n % n %
Ontario 1,640 91 5.5 307 18.7 55 3.4 111 6.8 251 15.3 795 48.5 30 1.8
Sex
Female 620 43 6.9 116 18.7 31 5.0 46 7.4 76 12.3 301 48.5 7 1.1
Male 1,020 48 4.7 191 18.7 24 2.4 65 6.4 175 17.2 494 48.4 23 2.3
Age group,3 years18–54 442 18 4.1 63 14.3 * * 24 5.4 61 13.8 271 61.3 * *
55–64 488 13 2.7 95 19.5 20 4.1 29 5.9 85 17.4 243 49.8 * *
65–69 206 11 5.3 52 25.2 7 3.4 5 2.4 43 20.9 85 41.3 * *
70–74 185 16 8.6 42 22.7 * * 16 8.6 27 14.6 70 37.8 8 4.3
≥75 319 33 10.3 55 17.2 19 6.0 37 11.6 35 11.0 126 39.5 14 4.4
Neighbourhood income quintileQ1 (lowest) 331 13 3.9 66 19.9 7 2.1 16 4.8 68 20.5 155 46.8 6 1.8
Q2 370 17 4.6 78 21.1 14 3.8 34 9.2 51 13.8 173 46.8 * *
Q3 311 18 5.8 49 15.8 11 3.5 24 7.7 44 14.1 157 50.5 8 2.6
Q4 305 16 5.2 56 18.4 11 3.6 19 6.2 44 14.4 153 50.2 * *
Q5 (highest) 323 27 8.4 58 18.0 12 3.7 18 5.6 44 13.6 157 48.6 7 2.2
Community size (population)≥1,500,000 600 35 5.8 113 18.8 20 3.3 51 8.5 72 12.0 296 49.3 13 2.2
100,000–1,499,999 649 42 6.5 111 17.1 19 2.9 38 5.9 107 16.5 321 49.5 11 1.7
<100,000 391 14 3.6 83 21.2 16 4.1 22 5.6 72 18.4 178 45.5 6 1.5
* In accordance with ICES policy, the exact number is suppressed when the cell size is <6, or when the cell size allows for a number of <6 to be calculated.

Institute for Clinical Evaluative Sciences34 Institute for Clinical Evaluative Sciences34
HEAD AND NECK CANCER SURGERY IN ONTARIO, 2003–2010 SURGERY FOR ORAL CAVITY CANCER
EXHIBIT 2.4 continued
Characteristic Cohort, N
Definitive Resection Procedure
Maxilla Mandible Mandibular alveolus Buccal Floor of mouth Tongue Lip
n % n % n % n % n % n % n %
LHIN of residence
1. Erie St. Clair 95 6 6.3 17 17.9 * * 8 8.4 16 16.8 44 46.3 * *
2. South West 155 6 3.9 35 22.6 11 7.1 6 3.9 31 20.0 65 41.9 * *
3. Waterloo Wellington 97 8 8.2 16 16.5 * * 7 7.2 * * 50 51.5 * *
4. Hamilton Niagara Haldimand Brant 203 8 3.9 34 16.7 * * 13 6.4 42 20.7 99 48.8 * *
5. Central West 80 6 7.5 16 20.0 * * 11 13.8 12 15.0 32 40.0 * *
6. Mississauga Halton 110 * * 26 23.6 * * 12 10.9 10 9.1 56 50.9 0 0.0
7. Toronto Central 144 8 5.6 21 14.6 * * 7 4.9 15 10.4 84 58.3 * *
8. Central 185 9 4.9 36 19.5 8 4.3 14 7.6 25 13.5 89 48.1 * *
9. Central East 189 13 6.9 38 20.1 12 6.3 11 5.8 21 11.1 89 47.1 * *
10. South East 65 * * * * * * * * 19 29.2 30 46.2 * *
11. Champlain 142 10 7.0 35 24.6 * * 9 6.3 17 12.0 70 49.3 0 0.0
12. North Simcoe Muskoka 58 * * 6 10.3 * * * * 11 19.0 31 53.4 * *
13. North East 89 * * 17 19.1 * * 6 6.7 17 19.1 41 46.1 * *
14. North West 28 0 0.0 * * 0 0.0 * * * * 15 53.6 * *
LHIN of treatment1. Erie St. Clair 16 0 0.0 0 0.0 0 0.0 * * * * 9 56.3 * *
2. South West 275 * * 59 21.5 15 5.5 15 5.5 48 17.5 122 44.4 * *
3. Waterloo Wellington 10 0 0.0 * * * * * * * * * * * *
4. Hamilton Niagara Haldimand Brant 218 12 5.5 34 15.6 * * 13 6.0 40 18.3 112 51.4 * *
5. Central West * * * 0 0.0 0 0.0 * * * * * * * *
6. Mississauga Halton 7 0 0.0 0 0.0 * * 0 0.0 0 0.0 * * 0 0.0
7. Toronto Central 778 51 6.6 160 20.6 28 3.6 58 7.5 91 11.7 383 49.2 7 0.9
A. University Health Network 459 32 7.0 97 21.1 11 2.4 35 7.6 45 9.8 237 51.6 * *
B. Sunnybrook Health Sciences Centre 151 10 6.6 31 20.5 13 8.6 7 4.6 28 18.5 62 41.1 0 0.0
C. Mount Sinai Hospital 142 9 6.3 30 21.1 * * 13 9.2 16 11.3 69 48.6 * *
D. Other 26 0 0.0 * * * * * * * * 15 57.7 * *
8. Central 11 * * 0 0.0 0 0.0 0 0.0 * * * * * *
9. Central East 21 0 0.0 * * 0 0.0 * * 6 28.6 6 28.6 * *
10. South East * 0 0.0 * * 0 0.0 * * * * * * * *
11. Champlain 155 11 7.1 35 22.6 * * 8 5.2 23 14.8 75 48.4 * *
12. North Simcoe Muskoka 8 0 0.0 0 0.0 0 0.0 * * * * * * * *
13. North East * * * 12 16.4 * * * * * * * * * *
14. North West 13 0 0.0 0 0.0 0 0.0 0 0.0 * * 8 61.5 * *
* In accordance with ICES policy, the exact number is suppressed when the cell size is <6, or when the cell size allows for a number of <6 to be calculated.

Institute for Clinical Evaluative Sciences 35Institute for Clinical Evaluative Sciences 35
HEAD AND NECK CANCER SURGERY IN ONTARIO, 2003–2010SURGERY FOR ORAL CAVITY CANCER
EXHIBIT 2.5 Proportion of adults in the Overall Oral Cavity Cancer Cohort who received an oral cavity resection as a definitive procedure, by Local Health Integration Network of residence, in Ontario, 2003 to 2010
Key Finding
• Among patients in the Overall Oral Cavity Cancer Cohort, the proportion who received an oral cavity resection within 12 months of diagnosis ranged from a high of 85% of patients residing in the South West LHIN to a low of 64% of those residing in the North West LHIN.
CharacteristicCohort,
N
Patients with Definitive Procedure
LHIN Rate vs. Ontario Rate1n %
Ontario 2,196 1,640 74.7 0.0
LHIN of residence1. Erie St. Clair 130 95 73.1 -2.1
2. South West 182 155 85.2 14.1
3. Waterloo Wellington 124 97 78.2 4.7
4. Hamilton Niagara Haldimand Brant 258 203 78.7 5.4
5. Central West 108 80 74.1 -0.8
6. Mississauga Halton 149 110 73.8 -1.2
7. Toronto Central 201 144 71.6 -4.1
8. Central 246 185 75.2 0.7
9. Central East 256 189 73.8 -1.2
10. South East 96 65 67.7 -9.4
11. Champlain 207 142 68.6 -8.2
12. North Simcoe Muskoka 79 58 73.4 -1.7
13. North East 116 89 76.7 2.7
14. North West 44 28 63.6 -14.9
1 Ontario rate = 74.7%

Institute for Clinical Evaluative Sciences36 Institute for Clinical Evaluative Sciences36
HEAD AND NECK CANCER SURGERY IN ONTARIO, 2003–2010 SURGERY FOR ORAL CAVITY CANCER
EXHIBIT 2.6A Overall pattern of surgical care provided to adults in the Oral Cavity Cancer Resection Cohort, by physician specialty, in Ontario, 2003 to 2010
Key Findings
• Of physicians who performed oral cavity cancer resection in Ontario between 2003 and 2010, 89% were otolaryngology–head and neck surgeons, and the remainder were general surgeons and plastic surgeons.
• General surgeons were more likely to perform tongue resections, and otolaryngology–head and neck surgeons were more likely to perform mandible and mandibular alveolus resections.
• The majority of patients (91%) were treated by otolaryngology–head and neck surgeons.
Physician Specialty
Physicians Performing Oral
Cavity Cancer Surgery
Surgeries Performed Patients Treated
Definitive Procedure (Resection)
Maxilla MandibleMandibular
alveolus Buccal Floor of mouth Tongue Lip
n % n % n % n % n % n % n % n % n % n %
Ontario 80 100.0 1,960 100.0 1,529 100.0 87 5.7 295 19.3 52 3.4 103 6.7 229 15.0 744 48.7 19 1.2
Otolaryngology 71 88.8 1,789 91.3 1,386 90.6 80 5.8 277 20.0 51 3.7 95 6.9 209 15.1 663 47.8 11 0.8
General surgery * * 163 8.3 135 8.8 * * 18 13.3 * * 8 5.9 20 14.8 81 60.0 0 0.0
Plastic surgery * * 8 0.4 8 0.5 * * * * * * 0 0.0 0 0.0 0 0.0 8 100
* In accordance with ICES policy, the exact number is suppressed when the cell size is <6, or when the cell size allows for a number of <6 to be calculated.

Institute for Clinical Evaluative Sciences 37Institute for Clinical Evaluative Sciences 37
HEAD AND NECK CANCER SURGERY IN ONTARIO, 2003–2010SURGERY FOR ORAL CAVITY CANCER
EXHIBIT 2.6B Overall pattern of surgical care provided to adults in the Oral Cavity Cancer Resection Cohort, by hospital type, in Ontario, 2003 to 2010
Key Findings
• Although head and neck cancer treatment centres constituted only 17% of the hospitals providing oral cavity resection in Ontario between 2003 and 2010, they performed 90% of the oral cavity resections done on the study cohort.
• Patients undergoing resection for oral cavity cancer at a designated head and neck cancer centre were more likely to have maxilla, mandible or mandibular alveolus resections compared with those who received care at other hospitals (some data were suppressed due to small cell sizes).
Physician Specialty
Hospitals Performing Oral
Cavity Cancer Surgery
Surgeries Performed Patients Treated
Definitive Procedure (Resection)
Maxilla MandibleMandibular
alveolus Buccal Floor of mouth Tongue Lip
n % n % n % n % n % n % n % n % n % n %
Ontario 52 100.0 2,001 100.0 1,640 100.0 91 5.5 307 18.7 55 3.4 111 6.8 251 15.3 795 48.5 30 1.8
Head and neck cancer centre 9 17.3 1,800 90.0 1,485 90.5 * * * * * * 96 6.5 221 14.9 715 48.1 12 0.8
Other hospital 43 82.7 201 10.0 155 9.5 * * * * * * 15 9.7 30 19.4 80 51.6 18 11.6
* In accordance with ICES policy, the exact number is suppressed when the cell size is <6, or when the cell size allows for a number of <6 to be calculated.
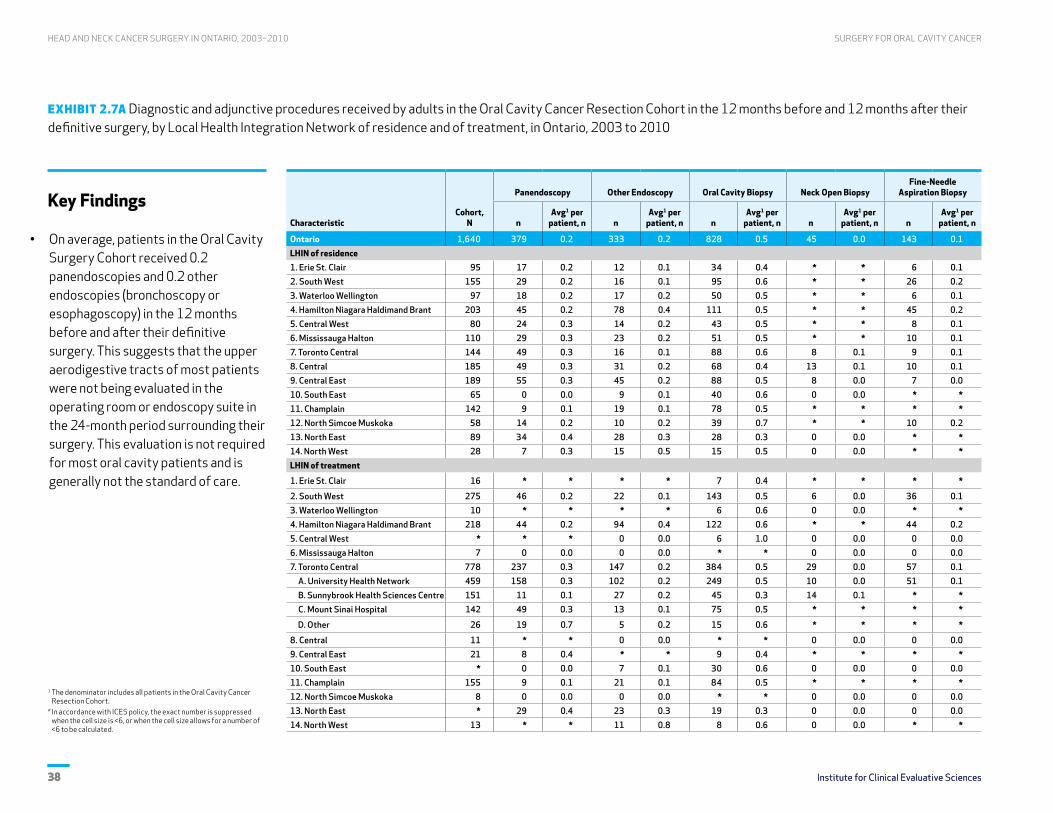
Institute for Clinical Evaluative Sciences38 Institute for Clinical Evaluative Sciences38
HEAD AND NECK CANCER SURGERY IN ONTARIO, 2003–2010 SURGERY FOR ORAL CAVITY CANCER
EXHIBIT 2.7A Diagnostic and adjunctive procedures received by adults in the Oral Cavity Cancer Resection Cohort in the 12 months before and 12 months after their definitive surgery, by Local Health Integration Network of residence and of treatment, in Ontario, 2003 to 2010
Key Findings
• On average, patients in the Oral Cavity Surgery Cohort received 0.2 panendoscopies and 0.2 other endoscopies (bronchoscopy or esophagoscopy) in the 12 months before and after their definitive surgery. This suggests that the upper aerodigestive tracts of most patients were not being evaluated in the operating room or endoscopy suite in the 24-month period surrounding their surgery. This evaluation is not required for most oral cavity patients and is generally not the standard of care.
CharacteristicCohort,
N
Panendoscopy Other Endoscopy Oral Cavity Biopsy Neck Open BiopsyFine-Needle
Aspiration Biopsy
nAvg1 per
patient, n nAvg1 per
patient, n nAvg1 per
patient, n nAvg1 per
patient, n nAvg1 per
patient, n
Ontario 1,640 379 0.2 333 0.2 828 0.5 45 0.0 143 0.1
LHIN of residence1. Erie St. Clair 95 17 0.2 12 0.1 34 0.4 * * 6 0.1
2. South West 155 29 0.2 16 0.1 95 0.6 * * 26 0.2
3. Waterloo Wellington 97 18 0.2 17 0.2 50 0.5 * * 6 0.1
4. Hamilton Niagara Haldimand Brant 203 45 0.2 78 0.4 111 0.5 * * 45 0.2
5. Central West 80 24 0.3 14 0.2 43 0.5 * * 8 0.1
6. Mississauga Halton 110 29 0.3 23 0.2 51 0.5 * * 10 0.1
7. Toronto Central 144 49 0.3 16 0.1 88 0.6 8 0.1 9 0.1
8. Central 185 49 0.3 31 0.2 68 0.4 13 0.1 10 0.1
9. Central East 189 55 0.3 45 0.2 88 0.5 8 0.0 7 0.0
10. South East 65 0 0.0 9 0.1 40 0.6 0 0.0 * *
11. Champlain 142 9 0.1 19 0.1 78 0.5 * * * *
12. North Simcoe Muskoka 58 14 0.2 10 0.2 39 0.7 * * 10 0.2
13. North East 89 34 0.4 28 0.3 28 0.3 0 0.0 * *
14. North West 28 7 0.3 15 0.5 15 0.5 0 0.0 * *
LHIN of treatment
1. Erie St. Clair 16 * * * * 7 0.4 * * * *
2. South West 275 46 0.2 22 0.1 143 0.5 6 0.0 36 0.1
3. Waterloo Wellington 10 * * * * 6 0.6 0 0.0 * *
4. Hamilton Niagara Haldimand Brant 218 44 0.2 94 0.4 122 0.6 * * 44 0.2
5. Central West * * * 0 0.0 6 1.0 0 0.0 0 0.0
6. Mississauga Halton 7 0 0.0 0 0.0 * * 0 0.0 0 0.0
7. Toronto Central 778 237 0.3 147 0.2 384 0.5 29 0.0 57 0.1
A. University Health Network 459 158 0.3 102 0.2 249 0.5 10 0.0 51 0.1
B. Sunnybrook Health Sciences Centre 151 11 0.1 27 0.2 45 0.3 14 0.1 * *
C. Mount Sinai Hospital 142 49 0.3 13 0.1 75 0.5 * * * *
D. Other 26 19 0.7 5 0.2 15 0.6 * * * *
8. Central 11 * * 0 0.0 * * 0 0.0 0 0.0
9. Central East 21 8 0.4 * * 9 0.4 * * * *
10. South East * 0 0.0 7 0.1 30 0.6 0 0.0 0 0.0
11. Champlain 155 9 0.1 21 0.1 84 0.5 * * * *
12. North Simcoe Muskoka 8 0 0.0 0 0.0 * * 0 0.0 0 0.0
13. North East * 29 0.4 23 0.3 19 0.3 0 0.0 0 0.0
14. North West 13 * * 11 0.8 8 0.6 0 0.0 * *
1 The denominator includes all patients in the Oral Cavity Cancer Resection Cohort.
* In accordance with ICES policy, the exact number is suppressed when the cell size is <6, or when the cell size allows for a number of <6 to be calculated.

Institute for Clinical Evaluative Sciences 39Institute for Clinical Evaluative Sciences 39
HEAD AND NECK CANCER SURGERY IN ONTARIO, 2003–2010SURGERY FOR ORAL CAVITY CANCER
EXHIBIT 2.7A continued
Key Findings
• Neck dissections (removal of the lymph nodes in the neck) were conducted on 67% of patients, with considerable variability by Local Health Integration Network (LHIN) of patient residence and treatment. The dissection rate was lowest for patients living in the South East LHIN at the time of diagnosis (35%). Among patients treated in LHINs with head and neck cancer treatment centres, those treated in the South East LHIN had the lowest rate of neck dissection (number suppressed due to small sample size).
• Nearly 47% of patients undergoing an oral cavity resection received a free flap in the two-year period surrounding the definitive procedure; this rate varied by LHIN of residence and LHIN of treatment. Of the high-volume LHINs of treatment, patients in the South East and Hamilton Niagara Haldimand Brant LHINs were least likely to receive a free flap (14% and 35%, respectively).
Characteristic
Neck Dissection Free FlapReconstructive
Procedure TracheostomyGastrostomy
Tube
n
Avg1 per patient,
n
Patients receiving,
% n
Avg1 per patient,
n
Patients receiving,
% n
Avg1 per patient,
n n
Avg1 per patient,
n n
Avg1 per patient,
n
Ontario 1,279 0.8 67.3 826 0.5 46.6 1,142 0.7 826 0.5 396 0.2
LHIN of residence1. Erie St. Clair 72 0.8 66.3 50 0.5 50.5 68 0.7 57 0.6 21 0.2
2. South West 132 0.9 74.8 86 0.6 51.0 121 0.8 88 0.6 34 0.2
3. Waterloo Wellington 69 0.7 70.1 40 0.4 38.1 57 0.6 46 0.5 20 0.2
4. Hamilton Niagara Haldimand Brant 147 0.7 59.6 76 0.4 34.5 114 0.6 102 0.5 75 0.4
5. Central West 70 0.9 77.5 51 0.6 60.0 70 0.9 43 0.5 18 0.2
6. Mississauga Halton 93 0.8 69.1 55 0.5 49.1 74 0.7 57 0.5 34 0.3
7. Toronto Central 113 0.8 68.8 66 0.5 43.1 89 0.6 65 0.5 27 0.2
8. Central 143 0.8 67.0 99 0.5 50.3 140 0.8 92 0.5 37 0.2
9. Central East 167 0.9 74.6 104 0.6 52.4 150 0.8 99 0.5 44 0.2
10. South East 26 0.4 35.4 17 0.3 24.6 33 0.5 19 0.3 6 0.1
11. Champlain 108 0.8 69.0 95 0.7 57.0 108 0.8 78 0.5 34 0.2
12. North Simcoe Muskoka 51 0.9 65.5 26 0.4 37.9 40 0.7 23 0.4 13 0.2
13. North East 72 0.8 68.5 49 0.6 49.4 57 0.6 46 0.5 25 0.3
14. North West 16 0.6 46.4 12 0.4 39.3 21 0.8 11 0.4 8 0.3
LHIN of treatment
1. Erie St. Clair 6 0.4 31.3 0 0.0 0.0 0 0.0 0 0.0 0 0.0
2. South West 232 0.8 75.3 153 0.6 52.4 210 0.8 167 0.6 63 0.2
3. Waterloo Wellington * * * * * * * * * * * *
4. Hamilton Niagara Haldimand Brant 157 0.7 60.1 82 0.4 35.3 122 0.6 115 0.5 84 0.4
5. Central West * * * * * * * * 0 0.0 0 0.0
6. Mississauga Halton * * * 0 0.0 0.0 0 0.0 0 0.0 0 0.0
7. Toronto Central 682 0.9 74.6 436 0.6 52.4 604 0.8 411 0.5 183 0.2
A. University Health Network 428 0.9 76.7 271 0.6 54.9 338 0.7 247 0.5 124 0.3
B. Sunnybrook Health Sciences Centre 139 0.9 81.5 116 0.8 72.2 192 1.3 118 0.8 26 0.2
C. Mount Sinai Hospital 101 0.7 66.2 42 0.3 28.2 62 0.4 39 0.3 28 0.2
D. Other 14 0.5 42.3 7 0.3 26.9 12 0.5 7 0.3 * *
8. Central 0 0.0 0.0 0 0.0 0.0 * * 0 0.0 * *
9. Central East 6 0.3 19.0 * * * * * * * * *
10. South East * * * 8 0.2 14.3 22 0.4 10 0.2 * *
11. Champlain 120 0.8 69.7 101 0.7 56.1 115 0.7 83 0.5 35 0.2
12. North Simcoe Muskoka * * * 0 0.0 0.0 * * 0 0.0 * *
13. North East 52 0.7 64.4 40 0.5 * 44 0.6 36 0.5 21 0.3
14. North West 0 0.0 0.0 * * 49.3 7 0.5 * * * *
1 The denominator includes all patients in the Oral Cavity Cancer Resection Cohort. * In accordance with ICES policy, the exact number is suppressed when the cell size is <6, or when the cell size allows for a number of <6 to be calculated.

Institute for Clinical Evaluative Sciences40 Institute for Clinical Evaluative Sciences40
HEAD AND NECK CANCER SURGERY IN ONTARIO, 2003–2010 SURGERY FOR ORAL CAVITY CANCER
EXHIBIT 2.7B Radiologic services received by adults in the Oral Cavity Cancer Resection Cohort in the 12 months before and 12 months after their definitive surgery, by Local Health Integration Network of residence and of treatment, in Ontario, 2003 to 2010
Key Findings
• The computed tomography (CT) scan was the major modality used to image the head and neck in the Oral Cavity Cancer Resection Cohort. Patients averaged 1.4 CT scans in the 12 months before and 12 months after their definitive oral cavity resection procedure.
• A significant number of chest X-rays (3.2 per patient, on average) and CT scans of the chest (0.8 per patient, on average) were done on patients in this cohort.
• Other less common imaging tests undergone by patients in this cohort included abdominal CT scans (0.3 per patient, on average) and abdominal ultrasound (0.4 per patient, on average).
• Magnetic resonance imaging (MRI) was infrequently used to diagnose or stage oral cavity cancer in this cohort (0.4 per patient, on average).
• Only 8 positron emission tomography (PET) scans were undertaken to diagnose or stage oral cavity cancer in the cohort (data not shown due to small sample sizes).

Institute for Clinical Evaluative Sciences 41Institute for Clinical Evaluative Sciences 41
HEAD AND NECK CANCER SURGERY IN ONTARIO, 2003–2010SURGERY FOR ORAL CAVITY CANCER
EXHIBIT 2.7B continued
Characteristic Cohort, N
Head and Neck Chest Abdomen
Ultrasound CT Scan MRI Scan X-Ray CT Scan Ultrasound CT Scan
nAvg1 per
patient, n nAvg1 per
patient, n nAvg1 per
patient, n nAvg1 per
patient, n nAvg1 per
patient, n nAvg1 per
patient, n nAvg1 per
patient, n
Ontario 1,640 294 0.2 2,350 1.4 602 0.4 5,261 3.2 1,390 0.8 581 0.4 465 0.3
LHIN of residence
1. Erie St. Clair 95 25 0.3 148 1.6 11 0.1 322 3.4 80 0.8 40 0.4 26 0.3
2. South West 155 15 0.1 251 1.6 9 0.1 549 3.5 162 1.0 55 0.4 65 0.4
3. Waterloo Wellington 97 14 0.1 116 1.2 12 0.1 256 2.6 71 0.7 40 0.4 23 0.2
4. Hamilton Niagara Haldimand Brant 203 22 0.1 221 1.1 50 0.2 644 3.2 107 0.5 50 0.2 28 0.1
5. Central West 80 26 0.3 134 1.7 43 0.5 270 3.4 88 1.1 48 0.6 25 0.3
6. Mississauga Halton 110 14 0.1 187 1.7 64 0.6 363 3.3 113 1.0 43 0.4 38 0.3
7. Toronto Central 144 47 0.3 238 1.7 87 0.6 457 3.2 168 1.2 57 0.4 47 0.3
8. Central 185 39 0.2 268 1.4 102 0.6 493 2.7 131 0.7 83 0.4 44 0.2
9. Central East 189 30 0.2 274 1.4 91 0.5 652 3.4 148 0.8 61 0.3 61 0.3
10. South East 65 21 0.3 65 1.0 40 0.6 204 3.1 40 0.6 26 0.4 16 0.2
11. Champlain 142 20 0.1 198 1.4 24 0.2 502 3.5 123 0.9 34 0.2 27 0.2
12. North Simcoe Muskoka 58 * * 70 1.2 25 0.4 158 2.7 39 0.7 9 0.2 * *
13. North East 89 12 0.1 138 1.6 31 0.3 276 3.1 108 1.2 29 0.3 50 0.6
14. North West 28 * * 42 1.5 13 0.5 115 4.1 12 0.4 6 0.2 * *
LHIN of treatment1. Erie St. Clair 16 * * 11 0.7 * * 30 1.9 * * * * * *
2. South West 275 38 0.1 433 1.6 13 0.0 950 3.5 266 1.0 113 0.4 100 0.4
3. Waterloo Wellington 10 * * 10 1.0 0 0.0 11 1.1 8 0.8 * * * *
4. Hamilton Niagara Haldimand Brant 218 22 0.1 235 1.1 50 0.2 698 3.2 119 0.5 56 0.3 36 0.2
5. Central West * * * 7 1.2 * * 22 3.7 * * * * * *
6. Mississauga Halton 7 0 0.0 * * * * 16 2.3 * * * * 0 0.0
7. Toronto Central 778 165 0.2 1,236 1.6 431 0.6 2,564 3.3 744 1.0 294 0.4 233 0.3
A. University Health Network 459 97 0.2 725 1.6 285 0.6 1,443 3.1 447 1.0 168 0.4 118 0.3
B. Sunnybrook Health Sciences Centre 151 26 0.2 214 1.4 42 0.3 684 4.5 99 0.7 62 0.4 63 0.4
C. Mount Sinai Hospital 142 22 0.2 260 1.8 89 0.6 354 2.5 170 1.2 55 0.4 31 0.2
D. Other 26 20 0.8 37 1.4 15 0.6 83 3.2 28 1.1 9 0.3 21 0.8
8. Central 11 * * 10 0.9 0 0.0 21 1.9 * * 7 0.6 * *
9. Central East 21 9 0.4 12 0.6 8 0.4 32 1.5 * * 8 0.4 * *
10. South East * 19 0.4 47 1.0 35 0.7 150 3.1 22 0.4 18 0.4 14 0.3
11. Champlain 155 21 0.1 210 1.4 25 0.2 535 3.5 133 0.9 42 0.3 30 0.2
12. North Simcoe Muskoka 8 0 0.0 * * * * 7 0.9 * * 0 0.0 0 0.0
13. North East * 8 0.1 112 1.5 26 0.4 189 2.6 80 1.1 25 0.3 33 0.5
14. North West 13 * * 17 1.3 6 0.5 36 2.8 * * * * * *
1 The denominator includes all patients in the Oral Cavity Cancer Resection Cohort. * In accordance with ICES policy, the exact number is suppressed when the cell size is <6, or when the cell size allows for a number of <6 to be calculated.

Institute for Clinical Evaluative Sciences42 Institute for Clinical Evaluative Sciences42
HEAD AND NECK CANCER SURGERY IN ONTARIO, 2003–2010 SURGERY FOR ORAL CAVITY CANCER
EXHIBIT 2.7C Consultations and services received by adults in the Oral Cavity Cancer Resection Cohort in the 12 months before and 12 months after their definitive surgery, by Local Health Integration Network of residence and of treatment, in Ontario, 2003 to 2010
Key Findings
• Approximately 76% of all patients in the Oral Cavity Cancer Resection Cohort saw a radiation oncologist during the 12 months before and after their definitive oral cavity resection procedure. About 43% of the cohort received radiation therapy as a part of treatment.
• The rate of referral to a radiation oncologist was lowest among patients living in the North Simcoe Muskoka Local Health Integration Network (LHIN) at the time of their diagnosis (48%) and highest among patients living in the North West LHIN (93%).
• Exactly half of patients in this cohort were seen by a medical oncologist in the 24 months surrounding their definitive oral cavity resection procedure. This rate ranged from a low of 31% among people residing in the South East LHIN at the time of diagnosis to a high of 65% among those living in the South West LHIN.
• More than one in eight patients in this cohort (13%) received chemotherapy as part of their treatment for oral cavity cancer. The highest rate (25%) was observed among those living in the North West LHIN at the time of diagnosis; the lowest rate was found among those residing in the South East LHIN (number suppressed due to small sample size).
• On average, patients in the cohort visited surgeons 8.3 times in the 12 months before and 12 months after their definitive oral cavity resection procedure.
• Eleven percent of patients in the cohort received a palliative care consultation in the 12 months before and 12 months after their definitive oral cavity resection. The highest consultation rate (16%) was observed among those living in the Champlain LHIN at the time of diagnosis.
• Low rates of referral to palliative care in the low-volume LHINs of treatment may be an indication that these LHINs are referring more challenging tumours to designated head and neck cancer treatment centres. Staging data would be required to confirm this assertion.
Institute for Clinical Evaluative Sciences 43Institute for Clinical Evaluative Sciences 43
HEAD AND NECK CANCER SURGERY IN ONTARIO, 2003–2010SURGERY FOR ORAL CAVITY CANCER
EXHIBIT 2.7C continued
CharacteristicCohort,
N
Radiation OncologyConsultations
Radiation TherapyTreatments
Medical OncologyConsultations
ChemotherapyTreatments
SurgeryConsultations
Palliative CareConsultations
Patients receiving, %
Avg1 per patient, n
Patients receiving, %
Avg1 per patient, n
Patients receiving, %
Avg1 per patient, n
Patients receiving, %
Avg1 per patient, n
Patients receiving, %
Avg1 per patient, n
Patients receiving, %
Ontario 1,640 75.7 0.9 42.7 0.5 50.2 1.0 13.2 0.5 99.2 8.3 11.2
LHIN of residence
1. Erie St. Clair 95 76.8 0.9 46.3 0.5 63.2 1.2 24.2 1.1 97.9 7.1 12.6
2. South West 155 74.2 0.8 51.0 0.5 64.5 1.3 21.3 0.7 99.4 7.7 14.8
3. Waterloo Wellington 97 73.2 0.8 37.1 0.5 48.5 0.8 10.3 0.3 99.0 7.5 6.2
4. Hamilton Niagara Haldimand Brant 203 83.7 0.9 39.9 0.5 48.8 1.0 20.2 1.1 99.0 7.8 11.3
5. Central West 80 82.5 0.9 51.3 0.6 55.0 1.3 10.0 0.3 100.0 9.4 *
6. Mississauga Halton 110 60.9 0.7 37.3 0.5 46.4 1.0 9.1 0.2 99.1 8.8 13.6
7. Toronto Central 144 75.0 0.9 37.5 0.6 63.2 1.4 9.7 0.3 99.3 8.6 11.8
8. Central 185 78.4 0.9 40.0 0.6 49.7 0.8 8.1 0.4 98.9 8.8 10.3
9. Central East 189 72.0 0.8 43.4 0.6 46.6 0.9 9.5 0.2 99.5 8.4 10.1
10. South East 65 67.7 1.1 44.6 0.6 30.8 0.6 * * 96.9 8.2 10.8
11. Champlain 142 81.0 1.0 54.9 0.7 47.9 1.1 11.3 0.6 100.0 9.1 15.5
12. North Simcoe Muskoka 58 48.3 0.6 25.9 0.3 41.4 0.6 * * 100.0 8.7 *
13. North East 89 87.6 1.0 42.7 0.4 32.6 0.6 14.6 0.6 100.0 7.9 9.0
14. North West 28 92.9 1.1 32.1 0.4 39.3 0.9 25.0 0.5 100.0 9.8 *
LHIN of treatment1. Erie St. Clair 16 37.5 0.4 * * 37.5 0.9 0.0 0.0 87.5 8.1 0.0
2. South West 275 78.5 0.9 48.7 0.5 66.2 1.3 21.5 0.8 99.6 7.5 13.8
3. Waterloo Wellington 10 * * * * * * * * 90.0 6.8 0.0
4. Hamilton Niagara Haldimand Brant 218 85.3 0.9 41.7 0.5 47.7 0.9 20.6 1.1 99.1 7.7 12.4
5. Central West * * * * * * * * * 100.0 7.8 0.0
6. Mississauga Halton 7 * * 0.0 0.0 * * 0.0 0.0 100.0 8.7 0.0
7. Toronto Central 778 73.7 0.8 42.0 0.6 51.0 1.0 9.9 0.3 99.7 8.7 10.5
A. University Health Network 459 63.8 0.8 41.6 0.5 48.6 1.0 10.7 0.3 100.0 8.5 10.2
B. Sunnybrook Health Sciences Centre 151 96.0 1.1 51.0 0.6 56.3 1.1 13.9 0.5 100.0 9.4 15.9
C. Mount Sinai Hospital 142 89.4 0.9 38.0 0.6 51.4 1.0 4.2 0.1 99.3 8.6 7.0
D. Other 26 30.8 0.3 * * 61.5 1.8 * * 96.2 9.7 *
8. Central 11 * * * * * * 0.0 0.0 81.8 6.8 0.0
9. Central East 21 42.9 0.5 * * 42.9 0.8 * * 95.2 8.1 0.0
10. South East * 67.3 1.2 44.9 0.6 30.6 0.6 8.2 0.8 95.9 7.2 12.2
11. Champlain 155 81.3 1.0 53.5 0.7 45.8 1.0 10.3 0.6 100.0 9.1 14.8
12. North Simcoe Muskoka 8 * * * * * * * * 100.0 8.4 0.0
13. North East * 93.2 1.0 42.5 0.5 28.8 0.3 13.7 0.6 100.0 7.4 *
14. North West 13 84.6 1.0 0.0 0.0 * * 0.0 0.0 100.0 13.3 *
1 The denominator includes all patients in the Oral Cavity Cancer Resection Cohort. * In accordance with ICES policy, the exact number is suppressed when the cell size is <6, or when the cell size allows for a number of <6 to be calculated.

Institute for Clinical Evaluative Sciences44 Institute for Clinical Evaluative Sciences44
HEAD AND NECK CANCER SURGERY IN ONTARIO, 2003–2010 SURGERY FOR ORAL CAVITY CANCER
EXHIBIT 2.8A Diagnostic and adjunctive procedures received by adults in the Oral Cavity Cancer/No Resection Cohort in the 12 months before and 12 months after diagnosis, by Local Health Integration Network of residence, in Ontario, 2003 to 2010
Key Findings
• Patients in the Oral Cavity Cancer/No Resection Cohort received very few diagnostic procedures in the 24 months surrounding their diagnosis. These included panendoscopy (0.1 per patient, on average) and other endoscopies such as esophagoscopy and bronchoscopy (0.1 per patient). Patients in the No Resection Cohort were
less likely than patients in the Resection Cohort to receive these procedures (see Exhibit 2.7A).
• Compared to patients in the Resection Cohort, patients in the No Resection Cohort were less likely to receive a neck dissection, any reconstructive procedure or a gastrostomy tube (a feeding tube through the abdominal wall) (see Exhibit 2.7A).
• Rates of procedures for neck open biopsy, free flaps and tracheostomy were very low in the No Resection Cohort (data not shown due to small sample sizes).
Characteristic Cohort, N
Panendoscopy Other Endoscopy Oral Cavity BiopsyFine-Needle Aspiration
Biopsy Radical Neck DissectionReconstructive
Procedure Gastrostomy Tube
nAvg1 per
patient, n nAvg1 per
patient, n nAvg1 per
patient, n nAvg1 per
patient, n nAvg1 per
patient, n nAvg1 per
patient, n nAvg1 per
patient, n
Ontario 556 46 0.1 63 0.1 255 0.5 26 0.0 30 0.1 24 0.0 124 0.2
LHIN of residence1. Erie St. Clair 35 * * 0 0.0 11 0.3 * * 0 0.0 0 0.0 9 0.3
2. South West 27 * * 0 0.0 10 0.4 * * * * 0 0.0 * *
3. Waterloo Wellington 27 * * * * 9 0.3 * * * * 0 0.0 * *
4. Hamilton Niagara Haldimand Brant 55 6 0.1 12 0.2 32 0.6 * * * * * * 11 0.2
5. Central West 28 * * * * 14 0.5 * * * * 0 0.0 12 0.4
6. Mississauga Halton 39 * * * * 17 0.4 * * * * * * 7 0.2
7. Toronto Central 57 9 0.2 13 0.2 23 0.4 * * * * * * 22 0.4
8. Central 61 * * 10 0.2 33 0.5 * * * * * * 12 0.2
9. Central East 67 * * 8 0.1 28 0.4 * * 7 0.1 7 0.1 20 0.3
10. South East 31 0 0.0 * * 12 0.4 0 0.0 0 0.0 0 0.0 * *
11. Champlain 65 7 0.1 6 0.1 37 0.6 * * 6 0.1 * * * *
12. North Simcoe Muskoka 21 * * * * 12 0.6 * * * * * * 8 0.4
13. North East 27 * * * * 7 0.3 * * * * * * 7 0.3
14. North West 16 * * * * 10 0.6 * * 0 0.0 0 0.0 * *
1 The denominator includes all patients in the Oral Cavity Cancer/No Resection Cohort. * In accordance with ICES policy, the exact number is suppressed when the cell size is <6, or when the cell size allows for a number of <6 to be calculated.

Institute for Clinical Evaluative Sciences 45Institute for Clinical Evaluative Sciences 45
HEAD AND NECK CANCER SURGERY IN ONTARIO, 2003–2010SURGERY FOR ORAL CAVITY CANCER
EXHIBIT 2.8B Radiologic services received by adults in the Oral Cavity Cancer/No Resection Cohort in the 12 months before and 12 months after their definitive surgery, by Local Health Integration Network of residence, in Ontario, 2003 to 2010
Key Findings
• Patients in the Oral Cavity Cancer/No Resection Cohort received a number of radiologic services in the 12 months before and after their diagnosis. These included computed tomography (CT) scans of the head and neck (1.4 per patient, on average), chest X-rays (2.3 per patient), chest CT scans (0.7 per patient), abdominal ultrasound imaging
(0.3 per patient) and abdominal CT scans (0.3 per patient).
• Patients who did not undergo resection received slightly fewer radiologic imaging services overall compared to those who had a resection surgery (see Exhibit 2.7B). This was most prominent in the chest imaging category.
• There was little variation in the use of radiologic services provided to patients in this cohort across different Local Health Integration Networks of patient residence.
• Patients in this cohort received very few bone scans (n=35), swallow studies (n=39), MRIs (n<6) or PET scans (n<6) (exact numbers are not shown due to small cell sizes).
Characteristic Cohort, N
Head and Neck Chest Abdomen
Ultrasound CT Scan MRI Scan X-Ray CT Scan Ultrasound CT Scan
nAvg1 per
patient, n nAvg1 per
patient, n nAvg1 per
patient, n nAvg1 per
patient, n nAvg1 per
patient, n nAvg1 per
patient, n nAvg1 per
patient, n
Ontario 556 92 0.2 757 1.4 212 0.4 1,263 2.3 400 0.7 175 0.3 148 0.3
LHIN of residence1. Erie St. Clair 35 7 0.2 52 1.5 6 0.2 58 1.7 10 0.3 11 0.3 * *
2. South West 27 * * 23 0.9 * * 33 1.2 14 0.5 * * * *
3. Waterloo Wellington 27 6 0.2 31 1.1 * * 41 1.5 19 0.7 6 0.2 12 0.4
4. Hamilton Niagara Haldimand Brant 55 7 0.1 50 0.9 14 0.3 186 3.4 18 0.3 22 0.4 12 0.2
5. Central West 28 * * 43 1.5 15 0.5 48 1.7 25 0.9 11 0.4 * *
6. Mississauga Halton 39 * * 56 1.4 25 0.6 52 1.3 35 0.9 9 0.2 8 0.2
7. Toronto Central 57 21 0.4 96 1.7 31 0.5 207 3.6 74 1.3 22 0.4 25 0.4
8. Central 61 * * 89 1.5 27 0.4 121 2.0 41 0.7 14 0.2 18 0.3
9. Central East 67 9 0.1 102 1.5 31 0.5 145 2.2 50 0.7 22 0.3 17 0.3
10. South East 31 7 0.2 27 0.9 22 0.7 55 1.8 15 0.5 6 0.2 8 0.3
11. Champlain 65 * * 95 1.5 6 0.1 149 2.3 37 0.6 14 0.2 11 0.2
12. North Simcoe Muskoka 21 7 0.3 29 1.4 16 0.8 56 2.7 24 1.1 * * 11 0.5
13. North East 27 * * 43 1.6 6 0.2 68 2.5 31 1.1 15 0.6 11 0.4
14. North West 16 * * 21 1.3 * * 44 2.8 7 0.4 13 0.8 * *
1 The denominator includes all patients in the Oral Cavity Cancer/No Resection Cohort. * In accordance with ICES policy, the exact number is suppressed when the cell size is <6, or when the cell size allows for a number of <6 to be calculated.

Institute for Clinical Evaluative Sciences46 Institute for Clinical Evaluative Sciences46
HEAD AND NECK CANCER SURGERY IN ONTARIO, 2003–2010 SURGERY FOR ORAL CAVITY CANCER
EXHIBIT 2.8C Consultations and services received by adults in the Oral Cavity Cancer/No Resection Cohort in the 12 months before and 12 months after their definitive surgery, by Local Health Integration Network of residence, in Ontario, 2003 to 2010
Key Findings
• Approximately 80% of all patients in the Oral Cavity/No Resection Cohort saw a radiation oncologist during the 12 months before and after their diagnosis. About 58% of this cohort received radiation therapy as a part of treatment.
• The rate of referral to a radiation oncologist was lowest (59%) among patients who lived in the
South West Local Health Integration Network (LHIN) at the time of their diagnosis.
• A similar proportion (50%) of patients in this cohort were seen by a medical oncologist in the 24 months surrounding their diagnosis as compared to the cohort that received a resection (see Exhibit 2.7C).
• Despite not having received an oral cavity resection, patients in this cohort averaged 4.5 visits with surgeons in the 12 months before and
12 months after their diagnosis; this is approximately half as many visits as those who received a definitive oral cavity resection procedure (see Exhibit 2.7C). Despite not receiving the procedure, nearly all patients (92%) in the No Resection Cohort saw a surgeon in the same period.
• Thirty percent of patients in the cohort received a palliative care consultation in the 12 months before and 12 months after their diagnosis, which is much higher than in the resection cohort (11%) (see Exhibit 2.7C).
Characteristic Cohort, N
Radiation OncologyConsultation
Radiation TherapyTreatments
Medical OncologyConsultation
ChemotherapyTreatments Surgery Consultation
Palliative CareConsultation
Patients receiving, %
Avg1 per patient, n
Patients receiving, %
Avg1 per patient, n
Patients receiving, %
Avg1 per patient, n
Patients receiving, %
Avg1 per patient, n
Patients receiving, %
Avg1 per patient, n
Patients receiving, %
Ontario 556 79.7 0.9 57.7 0.8 50.2 1.0 16.0 0.8 91.7 4.5 30.2
LHIN of residence1. Erie St. Clair 35 77.1 0.9 65.7 0.7 65.7 0.9 45.7 1.7 88.6 2.5 37.1
2. South West 27 59.3 0.6 22.2 0.2 44.4 0.7 * * 85.2 2.9 *
3. Waterloo Wellington 27 77.8 1.0 51.9 0.6 33.3 0.7 * * 100.0 4.2 40.7
4. Hamilton Niagara Haldimand Brant 55 74.5 0.8 45.5 0.5 50.9 1.1 12.7 0.3 87.3 4.3 25.5
5. Central West 28 75.0 0.8 57.1 0.8 57.1 1.2 * * 96.4 4.5 28.6
6. Mississauga Halton 39 76.9 0.8 61.5 0.9 59.0 1.2 15.4 0.4 92.3 5.0 30.8
7. Toronto Central 57 80.7 0.9 64.9 1.1 59.6 1.7 14.0 0.3 94.7 5.5 38.6
8. Central 61 85.2 0.9 52.5 0.7 41.0 1.0 13.1 0.9 93.4 4.8 26.2
9. Central East 67 79.1 0.9 56.7 0.8 53.7 1.0 16.4 0.3 92.5 4.9 32.8
10. South East 31 77.4 1.0 58.1 0.8 32.3 0.5 * * 74.2 3.6 *
11. Champlain 65 92.3 1.0 75.4 1.0 46.2 1.0 * * 96.9 4.6 32.3
12. North Simcoe Muskoka 21 71.4 0.9 57.1 1.1 61.9 0.9 * * 95.2 5.8 33.3
13. North East 27 92.6 1.0 70.4 0.7 48.1 0.6 22.2 3.3 92.6 5.0 37.0
14. North West 16 75.0 0.8 50.0 0.7 43.8 0.6 * * 87.5 3.8 *
1 The denominator includes all patients in the Larynx/Hypopharynx Cancer Resection Cohort.* In accordance with ICES policy, the exact number is suppressed when the cell size is <6, or when the cell size allows for a number of <6 to be calculated.

Institute for Clinical Evaluative Sciences 47Institute for Clinical Evaluative Sciences 47
HEAD AND NECK CANCER SURGERY IN ONTARIO, 2003–2010SURGERY FOR ORAL CAVITY CANCER
Discussion and Conclusions
Summary of findings and clinical implications
Oral cavity cancer is the 13th most common newly diagnosed cancer and the 15th most common cause of death from cancer in Canada. Oral cavity cancer is the most common head and neck cancer diagnosed in Ontario. Our analysis of Ontarians diagnosed with oral cavity cancer between 2003 and 2010 found that incidence rates were higher among men than women and higher among older adults than younger adults (regardless of sex). Incidence rates of oral cavity cancer were relatively similar across the province’s 14 Local Health Integration Networks (LHINs).
Although nearly 85% of Ontario adults newly diagnosed with oral cavity cancer underwent a cancer-related surgical procedure for their disease within a year of diagnosis, only 75% had a definitive surgical procedure (an oral cavity resection). Older people (those aged 75 or older) newly diagnosed with oral cavity cancer were less likely to have any cancer-related surgery (or oral cavity resection) than younger people with this disease. There was considerable variation in the proportion of patients with oral cavity cancer who underwent a cancer-related surgical procedure across the LHINs.
Among the 75% of patients in the study cohort who underwent a resection procedure for oral cavity cancer, nearly half (49%) had a tongue resection. The more complex maxilla, mandible and mandibular alveolus resection procedures were more likely to be performed at one of the nine head and neck cancer treatment centres in the province. These resections are a significant portion (25%) of the procedures required by this cohort.
A large majority (90%) of oral cavity cancer resection procedures performed in Ontario between 2003 and 2010 were done at head and neck cancer treatment centres. These procedures were largely performed by otolaryngologists or high-volume general surgeons. Half (51%) of all hospital admissions for oral cavity cancer surgery occurred outside the LHINs where patients were living at the time of their diagnosis; a large majority (78%) of admissions occurred in three LHINs: Toronto Central, South West and Hamilton Niagara Haldimand Brant. Oral cavity surgical care is largely regionalized in Ontario.
Care for patients with oral cavity cancer is resource intensive, requiring a significant number of diagnostic tests and procedures and multidisciplinary care involving a number of different oncologists. Within a year of resection, patients in this cohort had used a large number of services provided by Community Care Access Centres (an average of 27 days of service per person).
Patients with oral cavity cancer were largely imaged with computed tomography; there was little use of magnetic resonance imaging to diagnose or stage this subsite of cancer. Surgery, chemotherapy
and radiotherapy for oral cavity cancer varied according to the LHIN of patient residence. Large variations existed among the nine major head and neck cancer treatment centres in rates of consultation with radiation oncologists and medical oncologists. Similar variations were observed in the use of radiotherapy and chemotherapy in this group. There was also significant variation in the use of palliative care consultation across the LHINs. This may represent a group of patients presenting with very late-stage disease or it may be the result of reduced access to palliative services in certain LHINs. Patients not undergoing a resection would still have used considerable surgical and other health care resources, including palliative care consultation. Palliative care consultation rates varied significantly by LHIN of treatment and LHIN of residence.
Supplementary data from this study were used to describe variations in incidence and resection rates of patients with oral cavity cancer in Ontario; these have been published separately.5
Implications for policy and planning
Our analyses have shown that the incidence of oral cavity cancer increases with age. As the Ontario population ages, there may be increasing demand for health services related to the diagnosis and treatment of oral cavity cancer. Appropriate policy and planning initiatives will be necessary to provide adequate care for this population.

Institute for Clinical Evaluative Sciences48 Institute for Clinical Evaluative Sciences48
HEAD AND NECK CANCER SURGERY IN ONTARIO, 2003–2010 SURGERY FOR ORAL CAVITY CANCER
We noted variations in the use of surgical procedures and referral to specialists among oral cavity patients residing in one LHIN and being treated in another. More research is necessary to understand the causes of this variation and whether access to appropriate medical care requires improvement in some regions in Ontario.
Although largely regionalized to designated head and neck cancer treatment centres, a significant number of oral cavity cancer cases are performed at very low-volume centres (those treating less than 10% of the patients in the Oral Cavity Cancer Resection Cohort). Quality improvement initiatives could further regionalize the care of oral cavity cancer. This would potentially increase the volumes of some of the moderate- to high-volume head and neck cancer treatment centres across the province.
Although care is largely regionalized to the designated head and neck cancer treatment centres, there are significant variations in the diagnostic workup, treatment approach, use of adjunctive procedures, and consultations for patients residing in one LHIN and being treated in another; this is evident even among the three LHINs with the highest treatment volumes. We believe that province-wide quality improvement programs should be designed with input from the nine major head and neck cancer treatment centres to standardize care, monitor and improve compliance with guidelines, and study outcomes in the oral cavity cancer group.
Future research
For our analyses, we did not have access to appropriate cancer stage data or comorbidity information in order to examine variations in the stage at diagnosis, general health status of patients, and other metrics. Additional research to assess case-mix differences across the nine major head and neck cancer treatment centres is needed to more thoroughly analyze variations among centres. Further studies delineating processes of care (preoperative imaging and metastatic workup, multidisciplinary consultation and cancer care conferences, and appropriate follow-up care), adherence to guidelines, and their association with outcomes are needed in order to better assess the quality of care provided to patients with oral cavity cancer.
Although cancer care is regionalized, volumes vary significantly among head and neck cancer treatment centres. Further regionalization of oral cavity cancer care may be associated with improved care. This is particularly important for this cancer because resection often negatively affects speech, taste and swallowing. Rehabilitation requires a large interprofessional team (including dietitians, speech-language pathologists and physiotherapists) with expertise in treating this patient group at high-volume centres. Implementing agreed upon evidence-based algorithms of care across the province may improve outcomes for this patient group. Further work is needed to measure improvements in patient outcomes associated with the regionalization of care and to monitor outcomes and quality of patient care following the implementation of new provincial care algorithms.
References
1. Advisory Committee on Cancer Statistics. Canadian Cancer Statistics 2014. Toronto, ON: Canadian Cancer Society; 2014. Accessed January 7, 2015 at http://www.cancer.ca/~/media/cancer.ca/CW/cancer%20information/cancer%20101/Canadian%20cancer%20statistics/Canadian-Cancer-Statistics-2014-EN.pdf.
2. Oral cancer, November 2014 [fact sheet]. London, UK: Cancer Research UK; 2014. Accessed January 7, 2015 at http://publications.cancerresearchuk.org/downloads/Product/CS_KF_ORAL.pdf.
3. Groome PA, Rohland SL, Hall SF, Irish J, Mackillop WJ, O’Sullivan B. A population-based study of factors associated with early versus late stage oral cavity cancer diagnoses. Oral Oncol. 2011; 47(7):642–7.
4. Gilbert R, Devries-Aboud M, Winquist E, Waldron J, McQuestion M; Head and Neck Disease Site Group. The Management of Head and Neck Cancer in Ontario. Evidence-Based Series 5-3. Toronto, ON: Cancer Care Ontario; 2009. Accessed January 7, 2015 at https://www.cancercare.on.ca/common/pages/UserFile.aspx?fileId=58592.
5. Eskander A, Irish J, Gullane P, Gilbert R, de Almeida JR, Freeman J, et al. Overview of surgery for oral cavity cancer in Ontario. Head Neck. 2015 Jun 3 [Epub ahead of print].

Institute for Clinical Evaluative Sciences 49
HEAD AND NECK CANCER SURGERY IN ONTARIO, 2003–2010
3 Surgery for Larynx/ Hypopharynx Cancer
Inside
• Summary • Introduction • List of Exhibits • Exhibits and Key Findings • Discussion and Conclusions • References

Institute for Clinical Evaluative Sciences50 Institute for Clinical Evaluative Sciences50
HEAD AND NECK CANCER SURGERY IN ONTARIO, 2003–2010 SURGERY FOR LARYNX/HYPOPHARYNX CANCER
Summary
Issue
Cancer of the larynx and hypopharynx cancer is the 21st most common newly diagnosed cancer and the 20th most common cause of death due to cancer in Canada. Due to a modest decrease in incidence rates and the complexity of treating this cancer, care should be highly regionalized.
Study
This chapter provides a snapshot of treatment patterns for adults newly diagnosed with larynx or hypopharynx cancer in Ontario between January 1, 2003, and December 31, 2010. We focus on the delivery of surgical care and related health services and, where possible, include data regarding patient factors (i.e., sex, age, socioeconomic status and place of residence) and provider factors (i.e., surgical specialty and the type and location of hospital delivering services). We also assess the influence of patient and provider factors on the services provided.
Key findings
• Nearly 69% of adults newly diagnosed with larynx/hypopharynx cancer in Ontario underwent a cancer-related surgical procedure for their
disease within a year of diagnosis, and 15% of adults had a definitive surgical procedure (laryngectomy).
• People aged 75 or older and newly diagnosed with larynx/hypopharynx cancer were less likely to have any cancer-related surgery (or laryngectomy) than younger people with this disease.
• Among Ontario’s nine major head and neck cancer treatment centres, approaches to initial treatment varied greatly. Some centres were more likely to treat with a surgical procedure, while others were more likely to initiate radiotherapy with or without chemotherapy.
• Of the 15% of patients in the cohort who underwent a laryngectomy procedure for larynx/hypopharynx cancer, nearly half (46%) had a total laryngectomy. The more complex partial laryngectomy procedure was performed on only 4% of patients in the cohort and at only six of the nine head and neck cancer treatment centres. The remainder of the cohort that underwent a resection (50%) also had a pharyngolaryngectomy (removal of the larynx and pharynx).
• Nearly all (98%) of larynx/hypopharynx cancer resection procedures done in Ontario between 2003 and 2010 were performed at head and neck cancer treatment centres.
• There were variations across Local Health Integration Networks (LHINs) of patient residence in the use of surgery and radiation therapy to treat patients newly diagnosed with larynx/hypopharynx cancer. There was also significant variation in rates of palliative care consultation, which may reflect the availability of this service in the LHINs.
Implications
• We noted variations in the use of surgical procedures and referral to specialists among larynx/hypopharynx cancer patients who reside in one LHIN and are treated in another. More research is necessary to understand this observation.
• The incidence of larynx/hypopharynx cancer increases with age. As the Ontario population ages, there may be increasing demand for health services related to the diagnosis and treatment of this cancer.
• Although care is highly regionalized to designated head and neck cancer treatment centres, there are significant variations in the diagnostic workup, treatment, use of adjunctive procedures, and consultations for patients who reside in one LHIN and are treated in another.

Institute for Clinical Evaluative Sciences 51Institute for Clinical Evaluative Sciences 51
HEAD AND NECK CANCER SURGERY IN ONTARIO, 2003–2010SURGERY FOR LARYNX/HYPOPHARYNX CANCER
Introduction
Tumours of the voice box (larynx) alone constitute approximately 3.5% of all new malignant cancers diagnosed annually worldwide and account for approximately 1.0% of all deaths from cancers.1 Squamous cell carcinoma of the larynx used to be the most common cancer of the upper aerodigestive tract although this is no longer the case due to decreasing incidence of larynx cancer and increasing incidence of oropharynx cancer. In Canada, larynx cancer is the 21st most common newly diagnosed cancer and the 20th most common cause of death due to cancer for men and women. Recently published data estimated that 1,050 Canadians (880 men and 170 women) would be diagnosed with larynx cancer in 2015, and another 380 Canadians (310 men and 75 women) would die of this disease.2
Larynx/hypopharynx cancer is divided into two major groups according to histology (tissue type) of the tumour. The majority (90%) of larynx cancers are of the squamous cell carcinoma type. The remainder involve a range of rare histologies. This chapter focuses on squamous cell carcinoma of the larynx and hypopharynx.
Anatomically, the larynx is the entryway into the airway (tracheobronchial tree), and the hypopharynx is the entryway into the swallowing passage (esophagus). Because of difficulty identifying and potential misclassification of these two subsites, because the involvement of one often involves the other, and because of their similar risk factors and
treatment approaches, we report results for tumours of these two contiguous subsites together in this chapter. Although a distinct difference exists between the two subsites anatomically, they are often misclassified by physicians and they have similar treatment approaches.
While some larynx/hypopharynx cancers are diagnosed at an early stage after a patient seeks evaluation for changes in voice or swallowing, most patients with larynx/hypopharynx cancer have advanced-stage disease at time of diagnosis. Patients are often treated for a sore throat (laryngitis) and other more common noncancerous diseases before investigations ultimately lead to a cancer diagnosis.
The role of surgery in diagnosis and staging
A definitive diagnosis of larynx/hypopharynx cancer usually involves upper aerodigestive tract endoscopy—inspection of the larynx, pharynx, esophagus and trachea using a fibre optic examination telescope (either flexible or rigid) passed through the mouth or nose. Most often, an endoscopic examination under anesthesia, referred to as a panendoscopy or quadroscopy, is required to fully determine the extent of disease and facilitate biopsy. More recently, with the development of digital imaging and flexible fibre optic transnasal esophagoscopes, this procedure can be performed in a clinic under local anesthetic. This allows for visualization to assess the extent and, if necessary, for biopsy (sampling or removal) of a suspicious lesion.
Treatment of squamous cell carcinoma of the larynx/hypopharynx
After patients are diagnosed, they should undergo appropriate tests to assess the local, regional and distant extent of their disease (a process called staging). There are two main curative treatment modalities for larynx/hypopharynx cancer: radiation with or without chemotherapy, and surgery. The goal of treatment is to cure the cancer while preserving a functioning larynx, referred to as an organ preservation strategy. Organ preservation strategies include radiation with or without chemotherapy, and partial laryngeal surgery either through open approaches or transoral laser partial resections. Total laryngectomy with partial or total pharyngectomy as the primary treatment is usually reserved for locally advanced disease at presentation. Postoperative radiation, with or without chemotherapy, is indicated in patients with advanced disease undergoing primary surgery. Total laryngectomy is also performed as ‘salvage treatment’ when there is either persistent or recurrent cancer after partial surgery or radiation (or chemoradiation) or when partial surgery is not possible due to the extent of the tumour, which is the majority of cases. Patients who have received radiation therapy and/or chemotherapy before an operation often have higher rates of postoperative complications.3
Since most patients who develop larynx/hypopharynx cancer have a significant history of tobacco and/or alcohol use, they typically have other comorbid conditions, such as heart disease, chronic

Institute for Clinical Evaluative Sciences52 Institute for Clinical Evaluative Sciences52
HEAD AND NECK CANCER SURGERY IN ONTARIO, 2003–2010 SURGERY FOR LARYNX/HYPOPHARYNX CANCER
lung disease and alcohol-related liver disease. The presence of these health problems can sometimes limit the use of potentially curative therapy for larynx/hypopharynx cancer.
Type of surgical resection
For early-stage and localized cancers, minimally invasive surgical resections can be performed through the mouth (transorally) with a microscope and laser. In the health administrative data, it is challenging to reliably distinguish these resections from biopsy procedures. For this reason, we identified definitive surgical procedures in this chapter based on open (nonendoscopic) resections of the larynx/hypopharynx (laryngectomy); these can be divided into partial resections, total resections or resections involving the pharynx. The type of definitive procedure depends on tumour factors (location, extent), patient factors (comorbidities, preferences) and surgeon factors (ability to perform procedure). A partial laryngectomy involves removing either the left or right side of the larynx (a vertical partial laryngectomy) or a portion of the larynx above the vocal cords (a horizontal partial laryngectomy). Of note, many transoral laser procedures may be billed as a partial laryngectomy, as they achieve an oncologic resection to a similar extent as an open procedure. A total laryngectomy involves removal of the entire larynx (voice box). If a total laryngectomy involves removal of a portion of the pharynx (the entry to the swallowing passage), it is called a pharyngolaryngectomy.
How the study cohorts were defined
This chapter provides detailed information on surgical services and related health services delivered to adults newly diagnosed with larynx/hypopharynx cancer in Ontario from 2003 to 2010.
The study population for this chapter included all adults 18 years of age or older identified with larynx/hypopharynx cancer in the Ontario Cancer Registry and whose diagnosis date fell between January 1, 2003, and December 31, 2010. These individuals are referred to as the Overall Larynx/Hypopharynx Cancer Cohort.
The Overall Larynx/Hypopharynx Cancer Cohort was then divided into two pairs of smaller groups.
For Exhibits 3.1A to 3.1C, the Overall Larynx/Hypopharynx Cancer Cohort was divided as follows:
• The Larynx/Hypopharynx Surgery Cohort included those who had surgery related to their larynx/hypopharynx cancer in the 12 months before or 12 months after their diagnosis date.
• The Larynx/Hypopharynx/No Surgery Cohort included those who did not have surgery related to their larynx/hypopharynx cancer in the 12 months before or 12 months after their diagnosis date.
For Exhibits 3.2A to 3.8C, the Overall Larynx/Hypopharynx Cancer Cohort was divided as follows:
• The Larynx/Hypopharynx Resection Cohort included those who had a definitive resection (laryngectomy) in the 12 months before or 12 months after their diagnosis date.
• The Larynx/Hypopharynx/No Resection Cohort included those who did not have resection (laryngectomy) in the 12 months before or 12 months after their diagnosis date. This group includes all individuals who did not have surgery and those whose definitive surgery was limited to a surgical biopsy or adjunctive procedures (tracheostomy, gastrostomy tube).

Institute for Clinical Evaluative Sciences 53
HEAD AND NECK CANCER SURGERY IN ONTARIO, 2003–2010SURGERY FOR LARYNX/HYPOPHARYNX CANCER
List of Exhibits
EXHIBIT 3.1A Incidence of larynx/hypopharynx cancer and use of surgery among adults in the Overall Larynx/Hypopharynx Cancer Cohort, by sex, age group, neighbourhood income quintile, community size and Local Health Integration Network of residence, in Ontario, 2003 to 2010
EXHIBIT 3.1B Incidence of larynx/hypopharynx cancer and use of surgery among men in the Overall Larynx/Hypopharynx Cancer Cohort, by age group, neighbourhood income quintile, community size and Local Health Integration Network of residence, in Ontario, 2003 to 2010
EXHIBIT 3.1C Incidence of larynx/hypopharynx cancer and use of surgery among women in the Overall Larynx/Hypopharynx Cancer Cohort, by age group, neighbourhood income quintile, community size and Local Health Integration Network of residence, in Ontario, 2003 to 2010
EXHIBIT 3.2A Health care use among adults in the Larynx/Hypopharynx Cancer Resection Cohort, by sex, age group, neighbourhood income quintile, community size, and Local Health Integration Network of residence and of treatment, in Ontario, 2003 to 2010
EXHIBIT 3.2B Health care use among adults in the Larynx/Hypopharynx Cancer Resection Cohort, by Local Health Integration Network of residence and of treatment, in Ontario, 2003 to 2010
EXHIBIT 3.3 Hospital admissions for larynx/hypopharynx surgery among adults in the Larynx/Hypopharynx Cancer Resection Cohort in the 12 months before and 12 months after their diagnosis, by Local Health Integration Network of residence and of treatment, in Ontario, 2003 to 2010
EXHIBIT 3.4 Type of definitive resection procedure among adults in the Larynx/Hypopharynx Cancer Resection Cohort, by sex, age group, neighbourhood income quintile, community size, and Local Health Integration Network of residence and of treatment, in Ontario, 2003 to 2010
EXHIBIT 3.5 Proportion of adults in the Overall Larynx/Hypopharynx Cancer Cohort who received a laryngectomy as a definitive procedure, by Local Health Integration Network of residence, in Ontario, 2003 to 2010
EXHIBIT 3.6A Overall pattern of surgical care provided to adults in the Larynx/Hypopharynx Cancer Resection Cohort, by physician specialty, in Ontario, 2003 to 2010
EXHIBIT 3.6B Overall pattern of surgical care provided to adults in the Larynx/Hypopharynx Cancer Resection Cohort, by hospital type, in Ontario, 2003 to 2010
EXHIBIT 3.7A Diagnostic and adjunctive procedures received by adults in the Larynx/Hypopharynx Cancer Resection Cohort in the 12 months before and 12 months after their definitive surgery, by Local Health Integration Network of residence and of treatment, in Ontario, 2003 to 2010
EXHIBIT 3.7B Radiologic services received by adults in the Larynx/Hypopharynx Cancer Resection Cohort in the 12 months before and 12 months after their definitive surgery, by Local Health Integration Network of residence and of treatment, in Ontario, 2003 to 2010
EXHIBIT 3.7C Consultations and services received by adults in the Larynx/Hypopharynx Cancer Resection Cohort in the 12 months before and 12 months after their definitive surgery, by Local Health Integration Network of residence and of treatment, in Ontario, 2003 to 2010

Institute for Clinical Evaluative Sciences54
HEAD AND NECK CANCER SURGERY IN ONTARIO, 2003–2010 SURGERY FOR LARYNX/HYPOPHARYNX CANCER
EXHIBIT 3.8A Diagnostic and adjunctive procedures received by adults in the Larynx/Hypopharynx Cancer/No Resection Cohort in the 12 months before and 12 months after their diagnosis, by Local Health Integration Network of residence, in Ontario, 2003 to 2010
EXHIBIT 3.8B Radiologic services received by adults in the Larynx/Hypopharynx Cancer/No Resection Cohort in the 12 months before and 12 months after their diagnosis, by Local Health Integration Network of residence, in Ontario, 2003 to 2010
EXHIBIT 3.8C Consultations and services received by adults in the Larynx/Hypopharynx Cancer/No Resection Cohort in the 12 months before and 12 months after their diagnosis, by Local Health Integration Network of residence, in Ontario, 2003 to 2010

Institute for Clinical Evaluative Sciences 55Institute for Clinical Evaluative Sciences 55
HEAD AND NECK CANCER SURGERY IN ONTARIO, 2003–2010SURGERY FOR LARYNX/HYPOPHARYNX CANCER
EXHIBIT 3.1A Incidence of larynx/hypopharynx cancer and use of surgery among adults in the Overall Larynx/Hypopharynx Cancer Cohort, by sex, age group, neighbourhood income quintile, community size and Local Health Integration Network of residence, in Ontario, 2003 to 2010
Key Findings
• Men constituted 84% of all larynx/hypopharynx cancer patients in Ontario from 2003 to 2010. Rates of larynx/hypopharynx cancer in the Overall Larynx/Hypopharynx Cancer Cohort were higher among men (52.7 cases per 100,000) than women (8.6 cases per 100,000).
• The incidence of larynx/hypopharynx cancer increases with age. More than half of newly diagnosed larynx/hypopharynx cancers occurred in people aged 65 or older, while less than 16% occurred in those younger than 55.
• Larynx/hypopharynx incidence of surgery declined with increasing neighbourhood income. The proportion of Ontarians with larynx/hypopharynx cancer who underwent cancer-related surgery decreased with increasing income.
• Larynx/hypopharynx incidence increased with smaller community size. The proportion of Ontarians with larynx/hypopharynx cancer who underwent cancer-related surgery decreased with smaller community size.
• There were variations in the incidence of larynx/hypopharynx cancer across Local Health Integration Network (LHINs) of patient residence. The Central LHIN had the lowest incidence rate (21 cases per 100,000) and the North East LHIN had the highest (37 cases per 100,000).
• The probability of undergoing surgery was lowest among those aged 75 or older (approximately 61%) compared to the younger age groups (all greater than 66%).
• There were variations in rates of surgery use for larynx/hypopharynx cancer across LHINs of patient residence. The proportion of patients in the study cohort who had surgery for their disease ranged from a low of 42% among those living in the Champlain LHIN at the time of diagnosis to a high of 81% among those residing in the South East LHIN.

Institute for Clinical Evaluative Sciences56 Institute for Clinical Evaluative Sciences56
HEAD AND NECK CANCER SURGERY IN ONTARIO, 2003–2010 SURGERY FOR LARYNX/HYPOPHARYNX CANCER
EXHIBIT 3.1A continued
Characteristic
Age-standardized1
Incidenceper 100,000
Overall Larynx/Hypopharynx Cancer Cohort
Total Had surgery Did not have surgery
N % n
Age-standardized2
% of total n
Age-standardized2
% of total
Ontario 29.0 3,034 100.0 2,007 68.5 1,027 31.5
Sex3
Female 8.6 482 15.9 328 67.2 154 32.8
Male 52.7 2,552 84.1 1,679 68.8 873 31.2
Age group,3 years18–54 7.8 474 15.6 330 68.4 144 31.6
55–64 68.4 921 30.4 604 66.8 317 33.2
65–69 110.4 504 16.6 345 71.0 159 29.0
70–74 115.6 448 14.8 307 69.8 141 30.2
≥75 104.4 687 22.6 421 61.4 266 38.6
Neighbourhood income quintileQ1 (lowest) 36.0 703 23.2 471 67.9 232 32.1
Q2 32.4 693 22.8 470 72.9 223 27.1
Q3 28.7 599 19.7 399 68.3 200 31.7
Q4 25.9 558 18.4 361 67.6 197 32.4
Q5 (highest) 21.5 481 15.9 306 62.0 175 38.0
Community size (population)≥1,500,000 23.8 969 31.9 693 69.8 276 30.2
100,000–1,499,999 30.4 1214 40.0 773 67.3 441 32.7
<100,000 34.3 851 28.0 541 66.6 310 33.4
LHIN of residence1. Erie St. Clair 33.3 195 6.4 118 72.1 77 27.9
2. South West 32.1 275 9.1 178 65.0 97 35.0
3. Waterloo Wellington 28.9 165 5.4 108 67.2 57 32.8
4. Hamilton Niagara Haldimand Brant 28.8 373 12.3 227 79.3 146 20.7
5. Central West 25.3 134 4.4 105 76.9 29 20.3
6. Mississauga Halton 22.5 176 5.8 119 44.1 57 55.9
7. Toronto Central 27.5 263 8.7 192 73.7 71 26.3
8. Central 21.3 272 9.0 183 53.2 89 46.8
9. Central East 23.3 303 10.0 217 73.6 86 26.4
10. South East 30.2 155 5.1 110 80.7 45 19.3
11. Champlain 30.3 312 10.3 182 42.2 130 57.8
12. North Simcoe Muskoka 32.5 133 4.4 94 62.9 39 37.1
13. North East 37.2 212 7.0 136 72.4 76 27.6
14. North West 30.2 66 2.2 38 44.9 28 18.8
1 Standardized to the 1991 Canadian census.2 Standardized to the Overall Larynx/Hypopharynx Cancer Cohort.3 Sex-specific rates have been adjusted for age; age-specific rates have been adjusted for sex.

Institute for Clinical Evaluative Sciences 57Institute for Clinical Evaluative Sciences 57
HEAD AND NECK CANCER SURGERY IN ONTARIO, 2003–2010SURGERY FOR LARYNX/HYPOPHARYNX CANCER
EXHIBIT 3.1B Incidence of larynx/hypopharynx cancer and use of surgery among men in the Overall Larynx/Hypopharynx Cancer Cohort, by age group, neighbourhood income quintile, community size and Local Health Integration Network of residence, in Ontario, 2003 to 2010
Key Findings
• The findings shown in this exhibit are similar to those in Exhibit 3.1A; that is, both the incidence of larynx/hypopharynx cancer and the proportion of men who had surgery were related to age, average neighbourhood income and community size.
• Men living in the North Simcoe Local Health Integration Network (LHIN) when they were diagnosed had the highest incidence of larynx/hypopharynx cancer (64 cases per 100,000 males); the lowest incidence among men was in the Central LHIN (37 cases per 100,000).
• Among men with larynx/hypopharynx cancer, those living in large urban centres at the time of their diagnosis were more likely to have surgery than men living in smaller communities.
• Men living in the North Simcoe Muskoka LHIN at the time of diagnosis were the most likely to have larynx/hypopharynx cancer-related surgery (83%); those living in the Champlain LHIN were the least likely (59%).
Characteristic
Age-standardized1
Incidenceper 100,000
Overall Larynx/Hypopharynx Cancer Cohort - Men
Total Had surgery Did not have surgery
N % n
Age-standardized2
% of total n
Age-standardized2
% of total
Ontario 52.7 2,552 100.0 1,679 68.8 873 31.2
Age group,3 years18–54 5.1 399 15.6 280 70.2 119 29.8
55–64 65.9 788 30.9 513 65.1 275 34.9
65–69 84.4 421 16.5 283 67.2 138 32.8
70–74 102.5 374 14.7 254 67.9 120 32.1
≥75 117.3 570 22.3 349 61.2 221 38.8
Neighbourhood income quintileQ1 (lowest) 59.4 561 22.0 377 70.4 184 29.6
Q2 55.2 575 22.5 391 69.0 184 31.0
Q3 49.6 511 20.0 339 68.1 172 31.9
Q4 45.2 483 18.9 306 68.9 177 31.1
Q5 (highest) 37.8 422 16.5 266 68.4 156 31.6
Community size (population)≥1,500,000 40.9 816 32.0 585 71.4 231 28.6
100,000–1,499,999 52.1 1021 40.0 646 69.8 375 30.2
<100,000 57.7 715 28.0 448 64.5 267 35.5
LHIN of residence1. Erie St. Clair 54.5 160 6.3 94 70.5 66 29.5
2. South West 55.4 234 9.2 149 65.2 85 34.8
3. Waterloo Wellington 51.3 145 5.7 96 64.2 49 35.8
4. Hamilton Niagara Haldimand Brant 51.0 325 12.7 193 67.9 132 32.1
5. Central West 41.9 109 4.3 85 77.5 24 22.5
6. Mississauga Halton 39.2 152 6.0 100 66.4 52 33.6
7. Toronto Central 47.0 219 8.6 162 72.7 57 27.3
8. Central 36.9 232 9.1 157 70.5 75 29.5
9. Central East 40.3 258 10.1 187 71.9 71 28.1
10. South East 52.1 133 5.2 92 66.1 41 33.9
11. Champlain 47.4 241 9.4 144 59.0 97 41.0
12. North Simcoe Muskoka 55.1 112 4.4 79 82.7 33 17.3
13. North East 63.8 180 7.1 114 69.5 66 30.5
14. North West 48.0 52 2.0 27 67.0 25 33.0
1 Standardized to the 1991 Canadian census.2 Standardized to the Overall Larynx/Hypopharynx Cancer Cohort.3 Age-specific rates have not been standardized.

Institute for Clinical Evaluative Sciences58 Institute for Clinical Evaluative Sciences58
HEAD AND NECK CANCER SURGERY IN ONTARIO, 2003–2010 SURGERY FOR LARYNX/HYPOPHARYNX CANCER
EXHIBIT 3.1C Incidence of larynx/hypopharynx cancer and use of surgery among women in the Overall Larynx/Hypopharynx Cancer Cohort, by age group, neighbourhood income quintile, community size and Local Health Integration Network of residence, in Ontario, 2003 to 2010
Key Findings
• Among Ontario women, the incidence of larynx/hypopharynx cancer from 2003 to 2010 increased markedly with decreasing neighbourhood income and community size. The rate was highest among women living in the lowest-income neighbourhoods (14 cases per 100,000) and in communities with fewer than 100,000 people (12 cases per 100,000).
• Across the Local Health Integration Networks (LHINs) of patient residence, the highest incidence of larynx/hypopharynx cancer was among women living in the Champlain LHIN at the time of diagnosis (14 cases per 100,000). The lowest incidence was among women who resided in the Central or Mississauga Halton LHINs (6 cases per 100,000 each).
• Women in the Overall Larynx/Hypopharynx Cancer Cohort who were younger than age 75 at the time of their diagnosis were more likely to undergo surgery related to their cancer than similarly aged men in the same cohort.
• The age-standardized proportion of women in this study cohort who underwent surgery related to their larynx/hypopharynx cancers in the 12 months before and after diagnosis was highest among those living in the South East LHIN and lowest among those living in the Mississauga Halton LHIN (data not shown due to small sample sizes).

Institute for Clinical Evaluative Sciences 59Institute for Clinical Evaluative Sciences 59
HEAD AND NECK CANCER SURGERY IN ONTARIO, 2003–2010SURGERY FOR LARYNX/HYPOPHARYNX CANCER
EXHIBIT 3.1C continued
Characteristic
Age-standardized1
Incidenceper 100,000
Overall Larynx/Hypopharynx Cancer Cohort - Women
Total Had surgery Did not have surgery
N % n
Age-standardized2
% of total n
Age-standardized2
% of total
Ontario 8.6 482 100.0 328 67.2 154 32.8
Age group,3 years18–54 1.0 75 15.6 50 66.7 25 33.3
55–64 10.8 133 27.6 91 68.4 42 31.6
65–69 14.1 83 17.2 62 74.7 21 25.3
70–74 15.7 74 15.4 53 71.6 21 28.4
≥75 14.5 117 24.3 72 61.5 45 38.5
Neighbourhood income quintileQ1 (lowest) 13.5 142 29.5 94 65.4 48 34.6
Q2 10.5 118 24.5 79 76.7 39 23.3
Q3 8.6 88 18.3 60 68.6 28 31.4
Q4 7.4 75 15.6 55 66.4 20 33.6
Q5 (highest) 5.8 59 12.2 40 55.7 19 44.3
Community size (population)≥1,500,000 7.4 153 31.7 108 68.2 45 31.8
100,000–1,499,999 9.6 193 40.0 127 64.9 66 35.1
<100,000 11.7 136 28.2 93 68.5 43 31.5
LHIN of residence1. Erie St. Clair 13.1 35 7.3 24 73.6 11 26.4
2. South West 9.7 41 8.5 29 64.8 12 35.2
3. Waterloo Wellington 7.4 20 4.1 12 70.2 8 29.8
4. Hamilton Niagara Haldimand Brant 7.4 48 10.0 34 90.3 14 9.7
5. Central West 9.3 25 5.2 * * * *
6. Mississauga Halton 6.4 24 5.0 * * * *
7. Toronto Central 8.8 44 9.1 30 74.6 14 25.4
8. Central 6.4 40 8.3 26 36.6 14 63.4
9. Central East 6.9 45 9.3 30 75.2 15 24.8
10. South East 9.1 22 4.6 * * * *
11. Champlain 13.9 71 14.7 38 26.0 33 74.0
12. North Simcoe Muskoka 10.8 21 4.4 15 43.8 6 56.2
13. North East 11.7 32 6.6 22 75.2 10 24.8
14. North West 13.2 14 2.9 * * * *
1 Standardized to the 1991 Canadian census.2 Standardized to the Overall Larynx/Hypopharynx Cancer Cohort.3 Age-specific rates have not been standardized.* In accordance with ICES policy, the exact number is suppressed when the cell size is <6, or when the cell size allows for a number of <6 to be calculated.

Institute for Clinical Evaluative Sciences60 Institute for Clinical Evaluative Sciences60
HEAD AND NECK CANCER SURGERY IN ONTARIO, 2003–2010 SURGERY FOR LARYNX/HYPOPHARYNX CANCER
EXHIBIT 3.2A Health care services used by adults in the Larynx/Hypopharynx Cancer Resection Cohort, by sex, age group, neighbourhood income quintile, community size, and Local Health Integration Network of residence and of treatment, in Ontario, 2003 to 2010
Key Findings
• Men and older adults were more likely to be treated with radiation therapy with or without chemotherapy. There were significant variations by Local Health Integration Network (LHIN) of patient residence in the proportion of patients who received resection (laryngectomy) and either radiotherapy or chemotherapy prior to surgery. Similar variations were noted for resection rates by LHIN of patient treatment.
• In this cohort, 59% of hospital admissions for patients were for inpatient care; the remaining 41% were ambulatory (same-day) admissions.
• Ninety-four percent of patients in this cohort had more than one hospital admission in the 12 months before and after their cancer diagnosis
• Patients treated in seven of the LHINs (Erie St. Clair, Waterloo Wellington, Central West, Mississauga Halton, Central, Central East and North Simcoe Muskoka) had very short hospital stays (less than three days) for their oral cavity resection procedures. These patients may have had smaller resections that do not require a long hospital stay.
• Patients residing in the Hamilton Niagara Haldimand Brant LHIN at the time of diagnosis had the highest rate of same-day admission (57%) in the 12 months before and after their laryngectomy.
• Patients in this cohort had 5.5 visits, on average, with their treating surgeon in the 12 months before and after their laryngectomy.
• Patients in this cohort had a 23.5-day length of stay, on average, for their inpatient laryngectomy procedure.
• Patients treated in the Hamilton Niagara Haldimand Brant, South West, and North East LHINs had the shortest lengths of stay (15 to 18 days) for their inpatient laryngectomy procedure.

Institute for Clinical Evaluative Sciences 61Institute for Clinical Evaluative Sciences 61
HEAD AND NECK CANCER SURGERY IN ONTARIO, 2003–2010SURGERY FOR LARYNX/HYPOPHARYNX CANCER
EXHIBIT 3.2A continued
Characteristic Cohort, N
Patients who had surgical resection, %
Patients with preoperative
XRT or chemotherapy,
%
Visits with treating
surgeon, avg per patient,1 n
Patients with more than one
hospital admission, %
Total hospital admissions,2 n
Admissions, avg per
patient,2
n
Same-day surgery as % of total
admissions
Inpatient admissions as
% of total admissions
Avg length of stay, days
Median length of stay (IQR),
daysOntario 448 14.8 35.5 5.5 94.2 1,782 4.0 40.9 59.1 23.5 15 (12–25.5)Sex3
Female 52 * 30.8 5.2 92.3 206 4.0 36.9 63.1 24.5 15.5 (11–29.5)Male 396 15.5 36.1 5.5 94.4 1,576 4.0 41.4 58.6 23.4 15 (12–25)Age group,3 years18–54 80 16.9 28.8 5.4 93.8 298 3.7 40.3 59.7 19.9 14 (11–21)55–64 153 16.6 37.3 5.8 94.8 641 4.2 38.2 61.8 21.0 15 (12–25)65–69 88 17.5 35.2 5.5 93.2 347 3.9 43.8 56.2 23.9 15 (11–24) 70–74 54 12.1 31.5 5.2 98.1 213 3.9 39.4 60.6 22.1 15 (13–23) ≥75 73 10.6 42.5 5.2 91.8 283 3.9 44.9 55.1 33.4 22 (14–36)Neighbourhood income quintileQ1 (lowest) 119 16.9 39.5 5.3 94.1 458 3.8 36.7 63.3 24.4 16 (12–26)Q2 110 15.9 36.4 5.8 92.7 438 4.0 43.8 56.2 25.0 16.5 (12–28)Q3 78 13.0 26.9 5.1 93.6 311 4.0 41.8 58.2 21.1 15 (13–25)Q4 73 13.1 31.5 5.6 94.5 287 3.9 41.1 58.9 22.1 14 (11–18)Q5 (highest) 68 14.1 41.2 5.6 97.1 288 4.2 41.7 58.3 23.9 17 (11.5–26.5)Community size (population)≥1,500,000 108 11.1 43.5 5.6 96.3 418 3.9 33.0 67.0 30.2 17 (14–34)100,000–1,499,999 208 17.1 27.9 5.6 91.3 780 3.8 44.1 55.9 21.1 15 (11–24.5)<100,000 132 15.5 40.9 5.2 97.0 584 4.4 42.1 57.9 22.0 15 (11.5–23.5)
1 The time frame for surgeon visits was 6 months before to 6 months after the first surgery.2 The time frame for hospital admissions was 12 months before to 12 months after the first surgery.3 Standardized to the Overall Larynx/Hypopharynx Cancer Cohort; sex-specific rates have been adjusted for age; age-specific rates have been adjusted for sex.* In accordance with ICES policy, the exact number is suppressed when the cell size is <6, or when the cell size allows for a number of <6 to be calculated.XRT = external beam radiotherapy; IQR = interquartile range.

Institute for Clinical Evaluative Sciences62 Institute for Clinical Evaluative Sciences62
HEAD AND NECK CANCER SURGERY IN ONTARIO, 2003–2010 SURGERY FOR LARYNX/HYPOPHARYNX CANCER
EXHIBIT 3.2A continued
Characteristic Cohort, N
Patients who had surgical resection, %
Patients with preoperative
XRT or chemotherapy,
%
Visits with treating
surgeon, avg per patient,1 n
Patients with more than one
hospital admission, %
Total hospital admissions,2 n
Admissions, avg per
patient,2
n
Same-day surgery as % of total
admissions
Inpatient admissions as
% of total admissions
Avg length of stay, days
Median length of stay (IQR),
daysLHIN of residence1. Erie St. Clair 38 19.5 34.2 4.5 94.7 134 3.5 37.3 62.7 15.0 13.5 (10–18)2. South West 66 24.0 25.8 5.2 80.3 215 3.3 32.6 67.4 20.6 14 (10–24)3. Waterloo Wellington 27 * 25.9 5.2 100.0 105 3.9 38.1 61.9 14.4 12 (10–16)4. Hamilton Niagara Haldimand Brant 61 16.4 26.2 6.6 96.7 292 4.8 57.2 42.8 18.1 12 (7–20)5. Central West 15 * 40.0 4.5 86.7 47 3.1 36.2 63.8 32.1 19 (14–31)6. Mississauga Halton 17 * 35.3 5.1 100.0 70 4.1 41.4 58.6 17.5 14 (8–17)7. Toronto Central 32 * 43.8 6.0 100.0 127 4.0 27.6 72.4 38.1 18.5 (14–52.5)8. Central 27 * 48.1 5.6 96.3 111 4.1 37.8 62.2 29.8 16 (14–35)
9. Central East 46 15.2 47.8 5.3 97.8 192 4.2 41.7 58.3 27.2 21 (14–30)10. South East 30 19.4 10.0 5.3 96.7 112 3.7 41.1 58.9 23.0 15 (14–22)11. Champlain 44 14.1 38.6 6.7 95.5 175 4.0 32.6 67.4 35.8 25 (16–33)12. North Simcoe Muskoka * * * * * * * * * * *13. North East 30 * 53.3 5.5 96.7 132 4.4 51.5 48.5 16.2 15 (13–18)14. North West * * * * * * * * * * *LHIN of treatment1. Erie St. Clair ** ** ** ** ** ** ** ** ** ** **2. South West 117 — 27.4 4.8 87.2 403 3.4 33.0 67.0 17.8 13 (11–21)3. Waterloo Wellington ** ** ** ** ** ** ** ** ** ** **4. Hamilton Niagara Haldimand Brant 82 — 26.8 6.3 97.6 382 4.7 56.0 44.0 16.9 12 (7–20)5. Central West ** ** ** ** ** ** ** ** ** ** **6. Mississauga Halton ** ** ** ** ** ** ** ** ** ** **7. Toronto Central 154 — 46.8 5.0 96.8 621 4.0 35.3 64.7 29.5 18 (14–35) A. University Health Network 104 — 48.1 4.4 97.1 409 3.9 31.3 68.7 31.6 21 (14–36.5) B. Sunnybrook Health Sciences Centre 35 — 45.7 6.6 94.3 144 4.1 47.9 52.1 24.4 16 (14–28) C. Mount Sinai Hospital 15 — 40.0 6.0 100.0 68 4.5 32.4 67.6 26.2 15 (13–24)8. Central ** ** ** ** ** ** ** ** ** ** **9. Central East ** ** ** ** ** ** ** ** ** ** **10. South East 19 — 5.3 5.8 100.0 71 3.7 53.5 46.5 23.2 14 (14–17)11. Champlain 49 — 38.8 6.5 93.9 198 4.0 33.3 66.7 34.1 25 (16–32)12. North Simcoe Muskoka ** ** ** ** ** ** ** ** ** ** **13. North East 25 — 52.0 6.0 96.0 101 4.0 55.4 44.6 14.8 14 (12–16)14. North West ** ** ** ** ** ** ** ** ** ** **
1 The time frame for surgeon visits was 6 months before to 6 months after the first surgery.2 The time frame for hospital admissions was 12 months before to 12 months after the first surgery.3 Standardized to the Overall Larynx/Hypopharynx Cancer Cohort; sex-specific rates have been adjusted for age; age-specific rates have been adjusted for sex.* In accordance with ICES policy, the exact number is suppressed when the cell size is <6, or when the cell size allows for a number of <6 to be calculated.* * The LHIN did not treat any patients from the Cancer Resection Cohort (i.e., no laryngectomies were performed in the LHIN).— A percentage could not be derived as it is difficult to determine the denominator of patients that presented to each treatment LHIN using administrative data.XRT = external beam radiotherapy; IQR = interquartile range.

Institute for Clinical Evaluative Sciences 63Institute for Clinical Evaluative Sciences 63
HEAD AND NECK CANCER SURGERY IN ONTARIO, 2003–2010SURGERY FOR LARYNX/HYPOPHARYNX CANCER
EXHIBIT 3.2B Health care use by adults in the Larynx/Hypopharynx Cancer Resection Cohort, by Local Health Integration Network of residence and of treatment, in Ontario, 2003 to 2010
Key Findings
• Patients treated by laryngectomy averaged 3.1 emergency department visits in the 12 months before and 12 months after their definitive laryngectomy procedure. This rate varied by Local Health Integration Network (LHIN) of residence at the time of diagnosis. Patients who were residents of the North East LHIN when diagnosed had the highest rate of emergency department visits (on average, 5.2 visits per patient).
• Patients treated by laryngectomy received, on average, 54.2 visits from Community Care Access Centres (CCACs) in the 12 months before and 12 months after their definitive laryngectomy procedure. The highest number of CCAC visits (73) was for patients residing in the Toronto Central LHIN at the time of diagnosis; patients residing in the South East LHIN received the lowest number of visits (36).
• Patients treated by laryngectomy averaged 1.5 days in the intensive care unit (ICU) during their laryngectomy admission. This varied by LHIN of the treating institution and may be related to whether an institution had established a head and neck surgery step-down unit, which is not considered an ICU in administrative data.
• Thirty percent of patients undergoing a laryngectomy procedure in Ontario from 2003 to 2010 were readmitted within 30 days of hospital discharge. The readmission rate varied from 46% for patients treated in the Hamilton Niagara Haldimand Brant LHIN to 0% for patients treated in the South East and Erie St. Clair LHINs.

Institute for Clinical Evaluative Sciences64 Institute for Clinical Evaluative Sciences64
HEAD AND NECK CANCER SURGERY IN ONTARIO, 2003–2010 SURGERY FOR LARYNX/HYPOPHARYNX CANCER
EXHIBIT 3.2B continued
Characteristic Cohort, N
ED Visits CCAC Visits ICU Days Hospital Readmissions
nAvg1 per
patient, n nAvg1 per
patient, n nAvg1 per
patient, n n
Patients readmitted
n %
Ontario 448 1,379 3.1 24,263 54.2 689 1.5 154 132 29.5
LHIN of residence1. Erie St. Clair 38 117 3.1 1,952 51.4 40 1.1 10 8 21.1
2. South West 66 168 2.5 3,575 54.2 22 0.3 24 19 28.8
3. Waterloo Wellington 27 70 2.6 1,802 66.7 51 1.9 11 9 33.3
4. Hamilton Niagara Haldimand Brant 61 167 2.7 3,872 63.5 14 0.2 35 30 49.2
5. Central West 15 37 2.5 848 56.5 23 1.5 * * *
6. Mississauga Halton 17 43 2.5 622 36.6 28 1.6 * * *
7. Toronto Central 32 90 2.8 2,329 72.8 121 3.8 7 7 21.9
8. Central 27 93 3.4 1,319 48.9 56 2.1 7 6 22.2
9. Central East 46 126 2.7 2,245 48.8 101 2.2 10 10 21.7
10. South East 30 94 3.1 1,066 35.5 20 0.7 * * *
11. Champlain 44 162 3.7 2,394 54.4 78 1.8 21 19 43.2
12. North Simcoe Muskoka * 56 4.3 556 42.8 15 1.2 10 6 *
13. North East 30 155 5.2 1,594 53.1 117 3.9 11 11 36.7
14. North West * * * * * * * 0 0 0.0
LHIN of treatment1. Erie St. Clair * * * * * 0 0.0 0 0 0.0
2. South West 117 324 2.8 6,497 55.5 114 1.0 41 32 27.4
3. Waterloo Wellington ** ** ** ** ** ** ** ** ** **
4. Hamilton Niagara Haldimand Brant 82 220 2.7 5,339 65.1 43 0.5 44 38 46.3
5. Central West ** ** ** ** ** ** ** ** ** **
6. Mississauga Halton ** ** ** ** ** ** ** ** ** **
7. Toronto Central 154 474 3.1 7,918 51.4 324 2.1 37 33 21.4
A. University Health Network 104 329 3.2 4,864 46.8 116 1.1 23 19 18.3
B. Sunnybrook Health Sciences Centre 35 100 2.9 2,090 59.7 155 4.4 8 8 22.9
C. Mount Sinai Hospital 15 45 3.0 964 64.3 53 3.5 * * *
8. Central * * * * * * * * * *
9. Central East ** ** ** ** ** ** ** ** ** **
10. South East 19 45 2.4 507 26.7 10 0.5 0 0 0.0
11. Champlain 49 188 3.8 2,699 55.1 87 1.8 23 21 42.9
12. North Simcoe Muskoka ** ** ** ** ** ** ** ** ** **
13. North East 25 118 4.7 1,255 50.2 104 4.2 7 7 28.0
14. North West ** ** ** ** ** ** ** ** ** **
1 The denominator includes all patients in the Larynx/Hypopharynx Cancer Resection Cohort.* In accordance with ICES policy, the exact number is suppressed when the cell size is <6, or when the cell size allows for a number of <6 to be calculated.* * The LHIN did not treat any patients from the Cancer Resection Cohort (i.e., no laryngectomies were performed in the LHIN).ED = emergency department; CCAC = Community Care Access Centre; ICU = intensive care unit.

Institute for Clinical Evaluative Sciences 65Institute for Clinical Evaluative Sciences 65
HEAD AND NECK CANCER SURGERY IN ONTARIO, 2003–2010SURGERY FOR LARYNX/HYPOPHARYNX CANCER
EXHIBIT 3.3 Hospital admissions for larynx/hypopharynx surgery among adults in the Larynx/Hypopharynx Cancer Resection Cohort in the 12 months before and 12 months after their diagnosis, by Local Health Integration Network of residence and of treatment, in Ontario, 2003 to 2010
Key Findings
• Approximately half (46%) of laryngectomies were performed outside the Local Health Integration Network (LHIN) of patient residence at the time of diagnosis.
• Approximately 21% of laryngectomy procedures done in hospitals in the Toronto Central LHIN were performed on patients who resided in the LHIN at the time of diagnosis. The majority of laryngectomy procedures in Toronto Central LHIN hospitals were performed on patients who lived in other LHINs, such as the Central East LHIN (30%).
• Across the province, 79% of laryngectomy procedures undergone by patients in this cohort were performed at hospitals in the South West LHIN (London Health Sciences Centre), the Hamilton Niagara Haldimand Brant LHIN (St. Joseph’s Hospital), and the Toronto Central LHIN (University Health Network, Sunnybrook Health Sciences Centre and Mount Sinai Hospital).

Institute for Clinical Evaluative Sciences66 Institute for Clinical Evaluative Sciences66
HEAD AND NECK CANCER SURGERY IN ONTARIO, 2003–2010 SURGERY FOR LARYNX/HYPOPHARYNX CANCER
EXHIBIT 3.3 continued
LHIN of Residence
LHIN of Treatment
Ontario1. Erie St.
Clair2. South
West3. Waterloo Wellington
4. Hamilton Niagara
Haldimand Brant
5. Central West
6. Mississauga Halton
7. Toronto Central 8. Central
9. Central East
10. South East 11. Champlain
12. North Simcoe
Muskoka13. North
East14. North
West
Admissions, n (Column %, Row %)1
1. Erie St. Clair * * * 38(8.5, 100.0)
2. South West * * 66(14.7, 100.0)
3. Waterloo Wellington
19(70.4, 16.2) * * 27
(6.0, 100.0)
4. Hamilton Niagara Haldimand Brant * * 61
(13.6, 100.0)
5. Central West * * 15(3.4, 100.0)
6. Mississauga Halton
9 (52.9, 11.0)
8(47.1, 5.2)
17(3.8, 100.0)
7. Toronto Central 32(100.0, 20.8)
32(7.1, 100.0)
8. Central * * 27(6.0, 100.0)
9. Central East 46(100.0, 29.9)
46(10.3, 100.0)
10. South East * 19(63.3, 100.0) * 30
(6.7, 100.0)
11. Champlain * 44(9.8, 100.0)
12. North Simcoe Muskoka * *
13. North East * * * 25(83.3, 100.0)
30(6.7, 100.0)
14. North West * *
Ontario * 117(100.0, 26.1)
82(100.0, 18.3)
154(100.0, 34.4) * 19
(100.0, 4.2)49
(100.0, 10.9)25
(100.0, 5.6)448
(100.0, 100.0)
1 Column % = the proportion of patients having larynx/hypopharynx cancer surgery in a given LHIN who were residents of that LHIN when diagnosed, and the proportion who were residents of other LHINs. Row % = the proportion of patients having larynx/hypopharynx cancer surgery in a given LHIN who had surgery in their LHIN of residence, and the proportion who had surgery in other LHINs.
* In accordance with ICES policy, the exact number is suppressed when the cell size is <6, or when the cell size allows for a number of <6 to be calculated. Totals may not sum due to small-cell suppression.

Institute for Clinical Evaluative Sciences 67Institute for Clinical Evaluative Sciences 67
HEAD AND NECK CANCER SURGERY IN ONTARIO, 2003–2010SURGERY FOR LARYNX/HYPOPHARYNX CANCER
EXHIBIT 3.4 Type of definitive resection procedure among adults in the Larynx/Hypopharynx Cancer Resection Cohort, by sex, age group, neighbourhood income quintile, community size, and Local Health Integration Network of residence and of treatment, in Ontario, 2003 to 2010
Key Findings
• Partial and total laryngectomy procedures were more common among men than women.
• In the Larynx/Hypopharynx Resection Cohort, the rate of total laryngectomy declined with increasing neighbourhood income. The rate was highest among those living in the lowest-income neighbourhoods (52%) and lowest among those living in the highest-income neighbourhoods (40%).
• Partial laryngectomy procedures were rarely performed (4%; not displayed due to suppression of small cell sizes). They were most common in patients treated in the Toronto Central Local Health Integration Network (LHIN), followed by the South West and North East LHINs (data suppressed due to small sample sizes).
Characteristic Cohort, N
Definitive Resection Procedure
Laryngectomy Pharyngolaryngectomy
n % n %
Ontario 448 207 46.2 222 49.6
SexFemale 52 18 34.6 32 61.5
Male 396 189 47.7 190 48.0
Age group, years18–54 80 36 45.0 41 51.3
55–64 153 58 37.9 88 57.5
65–69 88 38 43.2 46 52.3
70–74 54 30 55.6 22 40.7
≥75 73 45 61.6 25 34.2
Neighbourhood income quintileQ1 (lowest) 119 62 52.1 54 45.4
Q2 110 53 48.2 50 45.5
Q3 78 33 42.3 41 52.6
Q4 73 32 43.8 39 53.4
Q5 (highest) 68 27 39.7 38 55.9
Community size (population)≥1,500,000 108 45 41.7 56 51.9
100,000–1,499,999 208 99 47.6 105 50.5
<100,000 132 63 47.7 61 46.2

Institute for Clinical Evaluative Sciences68 Institute for Clinical Evaluative Sciences68
HEAD AND NECK CANCER SURGERY IN ONTARIO, 2003–2010 SURGERY FOR LARYNX/HYPOPHARYNX CANCER
EXHIBIT 3.4 continued
Characteristic Cohort, N
Definitive Resection Procedure
Laryngectomy Pharyngolaryngectomy
n % n %
LHIN of residence 1. Erie St. Clair 38 * * 22 57.9
2. South West 66 * * 35 53.0
3. Waterloo Wellington 27 15 55.6 12 44.4
4. Hamilton Niagara Haldimand Brant 61 39 63.9 * *
5. Central West 15 12 80.0 * *
6. Mississauga Halton 17 * * 11 64.7
7. Toronto Central 32 11 34.4 20 62.5
8. Central 27 13 48.1 13 48.1
9. Central East 46 17 37.0 24 52.2
10. South East 30 20 66.7 10 33.3
11. Champlain 44 11 25.0 33 75.0
12. North Simcoe Muskoka * * * 7 53.8
13. North East 30 18 60.0 * *
14. North West * * * 0 0.0
LHIN of treatment1. Erie St. Clair * * * 0 0.0
2. South West 117 45 38.5 67 57.3
3. Waterloo Wellington ** ** ** ** **
4. Hamilton Niagara Haldimand Brant 82 50 61.0 * *
5. Central West ** ** ** ** **
6. Mississauga Halton ** ** ** ** **
7. Toronto Central 154 65 42.2 79 51.3
A. University Health Network 104 50 48.1 47 45.2
B. Sunnybrook Health Sciences Centre 35 * * 23 65.7
C. Mount Sinai Hospital 15 * * 9 60.0
8. Central * * * 0 0.0
9. Central East ** ** ** ** **
10. South East 19 17 89.5 * *
11. Champlain 49 12 24.5 37 75.5
12. North Simcoe Muskoka ** ** ** ** **
13. North East 25 16 64.0 * *
14. North West ** ** ** ** **
* In accordance with ICES policy, the exact number is suppressed when the cell size is <6, or when the cell size allows for a number of <6 to be calculated.* * The LHIN did not treat any patients from the Cancer Resection Cohort (i.e., no laryngectomies were performed in the LHIN).

Institute for Clinical Evaluative Sciences 69Institute for Clinical Evaluative Sciences 69
HEAD AND NECK CANCER SURGERY IN ONTARIO, 2003–2010SURGERY FOR LARYNX/HYPOPHARYNX CANCER
EXHIBIT 3.5 Proportion of adults in the Overall Larynx/Hypopharynx Cancer Cohort who received a laryngectomy as a definitive procedure, by Local Health Integration Network of residence, in Ontario, 2003 to 2010
Key Findings
• The proportion of patients in the Overall Larynx/Hypopharynx Cancer Cohort who received a major resection (laryngectomy) within 12 months of their diagnosis varied according to the Local Health Integration Network (LHIN) of residence at the time of diagnosis. The resection rate was highest among patients living in the South West LHIN (24%) and lowest among patients in the North West LHIN (data suppressed due to small sample sizes).
• Some patients residing in the North West LHIN may have been treated in neighbouring Manitoba; nonetheless, there was significant variation in laryngectomy rates at one year among the remainder of the LHINs.
CharacteristicCohort,
N
Laryngectomy
LHIN Rate vs. Ontario Rate1
Patients receiving, n
Patients receiving, %
Ontario 3,034 448 14.8 0.0
LHIN of residence1. Erie St. Clair 195 38 19.5 31.8
2. South West 275 66 24.0 62.2
3. Waterloo Wellington 165 27 16.4 10.8
4. Hamilton Niagara Haldimand Brant 373 61 16.4 10.8
5. Central West 134 15 11.2 -24.3
6. Mississauga Halton 176 17 9.7 -34.5
7. Toronto Central 263 32 12.2 -17.6
8. Central 272 27 9.9 -33.1
9. Central East 303 46 15.2 2.7
10. South East 155 30 19.4 31.1
11. Champlain 312 44 14.1 -4.7
12. North Simcoe Muskoka 133 * * *
13. North East 212 30 14.2 -4.1
14. North West 66 * * *
1 Ontario rate = 14.8%* In accordance with ICES policy, the exact number is suppressed when the cell size is <6, or when the cell size allows for a number of <6 to be calculated.

Institute for Clinical Evaluative Sciences70 Institute for Clinical Evaluative Sciences70
HEAD AND NECK CANCER SURGERY IN ONTARIO, 2003–2010 SURGERY FOR LARYNX/HYPOPHARYNX CANCER
EXHIBIT 3.6A Overall pattern of surgical care provided to adults in the Larynx/Hypopharynx Cancer Resection Cohort, by physician specialty, in Ontario, 2003 to 2010
Key Findings
• Otolarynygology–head and neck surgeons performed 90% of the laryngectomies done in Ontario during the study period; the remainder were performed by general surgeons.
• General surgeons were more likely to perform a total laryngectomy. Otolaryngology–head and neck surgeons were more likely to perform partial laryngectomy and pharyngolaryngectomy (data not shown due to small cell sizes).
• Ninety percent of patients were treated by otolaryngology–head and neck surgeons.
Physician Specialty
Physicians Performing Laryngectomy Surgeries Performed Patients Treated
Definitive Resection Procedure
Partial Laryngectomy Total Laryngectomy Pharyngolaryngectomy
n % n % n % n % n % n %
Ontario 28 100.0 454 100.0 448 100.0 19 4.2 207 46.2 222 49.6
Otolaryngology * * 408 89.9 405 90.4 * * 176 43.5 * *
General surgery * * 46 10.1 43 9.6 * * 31 73.8 * *
* In accordance with ICES policy, the exact number is suppressed when the cell size is <6, or when the cell size allows for a number of <6 to be calculated.

Institute for Clinical Evaluative Sciences 71Institute for Clinical Evaluative Sciences 71
HEAD AND NECK CANCER SURGERY IN ONTARIO, 2003–2010SURGERY FOR LARYNX/HYPOPHARYNX CANCER
EXHIBIT 3.6B Overall pattern of surgical care provided to adults in the Larynx/Hypopharynx Cancer Resection Cohort, by hospital type, in Ontario, 2003 to 2010
Key Findings
• Head and neck cancer treatment centres accounted for 69% of the hospitals providing larynx/hypopharynx resection in Ontario during the study period, yet they performed 97% of all such resections in this cohort.
• Patients undergoing resection for larynx/hypopharynx cancer at designated head and neck cancer treatment centres were more likely to have a partial laryngectomy compared with those who received care at other hospitals.
Hospital Type
Hospitals Performing Larynx/Hypopharynx
Cancer Surgery Surgeries Performed Patients Treated
Definitive Resection Procedure
Partial Laryngectomy Total Laryngectomy Pharyngolaryngectomy
n % n % n % n % n % n %
Ontario 13 100.0 454 100.0 448 100.0 19 4.2 207 46.2 222 49.6
Head and neck cancer centre 9 69.2 442 97.4 437 97.5 19 4.3 * * 216 49.4
Other hospital 4 30.8 12 2.6 11 2.5 0 0.0 * * 6 54.5
* In accordance with ICES policy, the exact number is suppressed when the cell size is <6, or when the cell size allows for a number of <6 to be calculated.

Institute for Clinical Evaluative Sciences72 Institute for Clinical Evaluative Sciences72
HEAD AND NECK CANCER SURGERY IN ONTARIO, 2003–2010 SURGERY FOR LARYNX/HYPOPHARYNX CANCER
EXHIBIT 3.7A Diagnostic and adjunctive procedures received by adults in the Larynx/Hypopharynx Cancer Resection Cohort in the 12 months before and 12 months after their definitive surgery, by Local Health Integration Network of residence and of treatment, in Ontario, 2003 to 2010
Key Findings
• On average, patients in the Larynx/Hypopharynx Resection Cohort received 1.1 panendoscopies and 2.0 other endoscopies (bronchoscopy or esophagoscopy) in the 12 months before and after their definitive surgery. This suggests that many patients had more than three upper aerodigestive tract endoscopy procedures in that period.
• In the year before and after their definitive surgery, 62% of patients in the cohort received a tracheoesophageal fistula (the creation of a passage between the breathing and swallowing passages) to assist with voice rehabilitation after laryngectomy The rate varied considerably across Local Health Integration Networks (LHINs) of residence and, more importantly, of treatment.
• Neck dissections were conducted in 95% of patients. There was considerable variability across LHINs of patient residence and LHINs of patient treatment. The neck dissection rate was lowest for patients living in the South East LHIN (77%).
• On average, patients undergoing a laryngectomy received 0.3 free flaps in the 24 months surrounding the definitive procedure. Among the high-volume LHINs of treatment, the Hamilton Niagara Haldimand Brant LHIN had the lowest proportion of patients receiving a free flap (8%). Similar trends were observed when any reconstructive procedure was assessed.
• Very few head and neck fine-needle biopsies (44) and neck open biopsies (22) were performed in this cohort. (Detailed data are not shown due to the suppression of small cells.)

Institute for Clinical Evaluative Sciences 73Institute for Clinical Evaluative Sciences 73
HEAD AND NECK CANCER SURGERY IN ONTARIO, 2003–2010SURGERY FOR LARYNX/HYPOPHARYNX CANCER
EXHIBIT 3.7A continued
CharacteristicCohort,
N
Tracheoesophageal Fistula Panendoscopy Other Endoscopy Oral Cavity Biopsy
nPatients
receiving, % n Avg1 per patient, n n Avg1 per patient, n n Avg1 per patient, n
Ontario 448 276 61.6 499 1.1 914 2.0 205 0.5
LHIN of residence1. Erie St. Clair 38 25 65.8 47 1.2 44 1.2 14 0.4
2. South West 66 39 59.1 81 1.2 93 1.4 24 0.4
3. Waterloo Wellington 27 20 74.1 26 1.0 58 2.1 11 0.4
4. Hamilton Niagara Haldimand Brant 61 33 54.1 42 0.7 169 2.8 26 0.4
5. Central West 15 13 86.7 21 1.4 29 1.9 9 0.6
6. Mississauga Halton 17 8 47.1 16 0.9 36 2.1 10 0.6
7. Toronto Central 32 22 68.8 54 1.7 75 2.3 15 0.5
8. Central 27 20 74.1 37 1.4 70 2.6 17 0.6
9. Central East 46 25 54.3 77 1.7 113 2.5 26 0.6
10. South East 30 20 66.7 * * 45 1.5 15 0.5
11. Champlain 44 40 90.9 16 0.4 99 2.3 26 0.6
12. North Simcoe Muskoka * * * 17 1.3 24 1.8 * *
13. North East 30 6 20.0 50 1.7 51 1.7 8 0.3
14. North West * * * * * 8 4.0 * *
LHIN of treatment1. Erie St. Clair * * * * * * * 0 0.0
2. South West 117 75 64.1 147 1.3 165 1.4 42 0.4
3. Waterloo Wellington ** ** ** ** ** ** ** ** **
4. Hamilton Niagara Haldimand Brant 82 45 54.9 54 0.7 222 2.7 35 0.4
5. Central West ** ** ** ** ** ** ** ** **
6. Mississauga Halton ** ** ** ** ** ** ** ** **
7. Toronto Central 154 91 59.1 240 1.6 353 2.3 83 0.5
A. University Health Network 104 52 50.0 160 1.5 219 2.1 61 0.6
B. Sunnybrook Health Sciences Centre 35 28 80.0 60 1.7 86 2.5 16 0.5
C. Mount Sinai Hospital 15 11 73.3 20 1.3 48 3.2 * *
8. Central * * * 0 0.0 * * * *
9. Central East ** ** ** ** ** ** ** ** **
10. South East 19 15 78.9 * * 32 1.7 8 0.4
11. Champlain 49 44 89.8 18 0.4 106 2.2 28 0.6
12. North Simcoe Muskoka ** ** ** ** ** ** ** ** **
13. North East * * * 37 1.5 34 1.4 7 0.3
14. North West ** ** ** ** ** ** ** ** **
1 The denominator includes all patients in the Larynx/Hypopharynx Cancer Resection Cohort.* In accordance with ICES policy, the exact number is suppressed when the cell size is <6, or when the cell size allows for a number of <6 to be calculated.* * The LHIN did not treat any patients from the Cancer Resection Cohort (i.e., no laryngectomies were performed in the LHIN).

Institute for Clinical Evaluative Sciences74 Institute for Clinical Evaluative Sciences74
HEAD AND NECK CANCER SURGERY IN ONTARIO, 2003–2010 SURGERY FOR LARYNX/HYPOPHARYNX CANCER
EXHIBIT 3.7A continued
Characteristic
Neck Dissection Free Flap Reconstructive Procedure Tracheostomy Gastrostomy Tube
nAvg1 per
patient, nPatients
receiving, nPatients
receiving, % nAvg1 per
patient, n nAvg1 per
patient, n nAvg1 per
patient, n nAvg1 per
patient, n
Ontario 462 1.0 424 94.6 142 0.3 332 0.7 290 0.6 193 0.4
LHIN of residence1. Erie St. Clair 42 1.1 37 97.4 16 0.4 35 0.9 24 0.6 16 0.4
2. South West 73 1.1 63 95.5 26 0.4 55 0.8 37 0.6 17 0.3
3. Waterloo Wellington 30 1.1 27 100.0 * * 19 0.7 17 0.6 14 0.5
4. Hamilton Niagara Haldimand Brant 56 0.9 54 88.5 * * 16 0.3 36 0.6 27 0.4
5. Central West 15 1.0 15 100.0 0 0.0 * * 13 0.9 * *
6. Mississauga Halton 15 0.9 15 88.2 * * * * 11 0.6 7 0.4
7. Toronto Central 34 1.1 31 96.9 9 0.3 29 0.9 31 1.0 22 0.7
8. Central 33 1.2 26 96.3 14 0.5 32 1.2 16 0.6 13 0.5
9. Central East 48 1.0 44 95.7 25 0.5 47 1.0 34 0.7 24 0.5
10. South East 23 0.8 23 76.7 7 0.2 16 0.5 13 0.4 10 0.3
11. Champlain 46 1.0 44 100.0 17 0.4 42 1.0 27 0.6 7 0.2
12. North Simcoe Muskoka * * * * * * 12 0.9 * * 8 0.6
13. North East 32 1.1 30 100.0 11 0.4 16 0.5 20 0.7 21 0.7
14. North West * * * * 0 0.0 0 0.0 * * * *
LHIN of treatment1. Erie St. Clair 0 0.0 0 0.0 0 0.0 0 0.0 * * * *
2. South West 131 1.1 114 97.4 46 0.4 103 0.9 71 0.6 39 0.3
3. Waterloo Wellington ** ** ** ** ** ** ** ** ** ** ** **
4. Hamilton Niagara Haldimand Brant 77 0.9 75 91.5 6 0.1 23 0.3 49 0.6 38 0.5
5. Central West ** ** ** ** ** ** ** ** ** ** ** **
6. Mississauga Halton ** ** ** ** ** ** ** ** ** ** ** **
7. Toronto Central 163 1.1 148 96.1 58 0.4 142 0.9 120 0.8 86 0.6
A. University Health Network 107 1.0 99 95.2 34 0.3 92 0.9 84 0.8 61 0.6
B. Sunnybrook Health Sciences Centre 39 1.1 35 100.0 22 0.6 44 1.3 21 0.6 15 0.4
C. Mount Sinai Hospital 17 1.1 14 93.3 * * * * 15 1.0 10 0.7
8. Central * * * * 0 0.0 * * * * 0 0.0
9. Central East ** ** ** ** ** ** ** ** ** ** ** **
10. South East * * * * * * 6 0.3 * * * *
11. Champlain 51 1.0 49 100.0 20 0.4 47 1.0 28 0.6 10 0.2
12. North Simcoe Muskoka ** ** ** ** ** ** ** ** ** ** ** **
13. North East 26 1.0 25 100.0 9 0.4 10 0.4 15 0.6 15 0.6
14. North West ** ** ** ** ** ** ** ** ** ** ** **
1 The denominator includes all patients in the Larynx/Hypopharynx Cancer Resection Cohort.* In accordance with ICES policy, the exact number is suppressed when the cell size is <6, or when the cell size allows for a number of <6 to be calculated.* * The LHIN did not treat any patients from the Cancer Resection Cohort (i.e., no laryngectomies were performed in the LHIN).

Institute for Clinical Evaluative Sciences 75Institute for Clinical Evaluative Sciences 75
HEAD AND NECK CANCER SURGERY IN ONTARIO, 2003–2010SURGERY FOR LARYNX/HYPOPHARYNX CANCER
EXHIBIT 3.7B Radiologic services received by adults in the Larynx/Hypopharynx Cancer Resection Cohort in the 12 months before and 12 months after their definitive surgery, by Local Health Integration Network of residence and of treatment, in Ontario, 2003 to 2010
Key Findings
• The computed tomography (CT) scan is the major modality used to image the head and neck. A large number of CT scans (2.2 per patient) were performed on patients in the Larynx/Hypopharynx Resection Cohort in the two-year period surrounding the definitive laryngectomy procedure.
• A large number of chest X-rays (6.5 per patient) and CT scans of the chest (1.5 per patient) were performed on patients in this cohort.
• Other less common imaging tests administered to patients in this cohort included abdominal CT scans (0.4 per patient) and abdominal ultrasound (0.3 per patient).
• Magnetic resonance imaging was seldom used to diagnose or stage larynx/hypopharynx cancer in this group of patients.
• No PET scans were performed in this cohort to diagnose or stage larynx/hypopharynx cancer.

Institute for Clinical Evaluative Sciences76 Institute for Clinical Evaluative Sciences76
HEAD AND NECK CANCER SURGERY IN ONTARIO, 2003–2010 SURGERY FOR LARYNX/HYPOPHARYNX CANCER
EXHIBIT 3.7B continued
CharacteristicCohort,
N
Head and Neck Chest Abdomen
Ultrasound CT Scan MRI Scan X-Ray CT Scan Ultrasound CT Scan
nAvg1 per
patient, n nAvg1 per
patient, n nAvg1 per
patient, n nAvg1 per
patient, n nAvg1 per
patient, n nAvg1 per
patient, n nAvg1 per
patient, n
Ontario 448 114 0.3 999 2.2 68 0.2 2,923 6.5 668 1.5 155 0.3 185 0.4
LHIN of residence1. Erie St. Clair 38 19 0.5 80 2.1 * * 203 5.3 52 1.4 10 0.3 19 0.5
2. South West 66 8 0.1 104 1.6 * * 340 5.2 67 1.0 18 0.3 19 0.3
3. Waterloo Wellington 27 * * 64 2.4 * * 190 7.0 38 1.4 13 0.5 * *
4. Hamilton Niagara Haldimand Brant 61 8 0.1 86 1.4 * * 407 6.7 43 0.7 18 0.3 14 0.2
5. Central West 15 6 0.4 44 2.9 * * 118 7.9 29 1.9 7 0.5 7 0.5
6. Mississauga Halton 17 * * 35 2.1 * * 102 6.0 * * 13 0.8 7 0.4
7. Toronto Central 32 8 0.3 104 3.3 11 0.3 261 8.2 75 2.3 * * 18 0.6
8. Central 27 13 0.5 83 3.1 * * 174 6.4 47 1.7 19 0.7 16 0.6
9. Central East 46 17 0.4 136 3.0 7 0.2 351 7.6 91 2.0 17 0.4 17 0.4
10. South East 30 12 0.4 63 2.1 22 0.7 152 5.1 39 1.3 8 0.3 16 0.5
11. Champlain 44 8 0.2 83 1.9 * * 346 7.9 62 1.4 7 0.2 14 0.3
12. North Simcoe Muskoka * * * 39 3.0 * * 65 5.0 35 2.7 * * 10 0.8
13. North East 30 * 0.1 72 2.4 7 0.2 206 6.9 65 2.2 16 0.5 20 0.7
14. North West * * * 6 3.0 0 0.0 8 4.0 * * 0 0.0 * *
LHIN of treatment1. Erie St. Clair * * 8.0 * * 0 0.0 * * 0 0.0 0 0.0 0 0.0
2. South West 117 27 0.2 227 1.9 8 0.1 677 5.8 148 1.3 35 0.3 44 0.4
3. Waterloo Wellington * * * * * * * * * * * * * * *
4. Hamilton Niagara Haldimand Brant 82 9 0.1 123 1.5 6 0.1 530 6.5 63 0.8 31 0.4 19 0.2
5. Central West * * * * * * * * * * * * * * *
6. Mississauga Halton * * * * * * * * * * * * * * *
7. Toronto Central 154 55 0.4 472 3.1 26 0.2 1,117 7.3 320 2.1 63 0.4 77 0.5
A. University Health Network 104 34 0.3 318 3.1 18 0.2 713 6.9 224 2.2 38 0.4 50 0.5
B. Sunnybrook Health Sciences Centre 35 15 0.4 104 3.0 * * 274 7.8 59 1.7 21 0.6 17 0.5
C. Mount Sinai Hospital 15 6 0.4 50 3.3 * * 130 8.7 37 2.5 * * 10 0.7
8. Central * 0 0.0 * * 0 0.0 * * * * 0 0.0 0 0.0
9. Central East * * * * * * * * * * * * * * *
10. South East 19 7 0.4 27 1.4 18 0.9 76 4.0 * 1.0 * * 14 0.7
11. Champlain 49 11 0.2 94 1.9 * * 374 7.6 66 1.3 10 0.2 14 0.3
12. North Simcoe Muskoka * * * * * * * * * * * * * * *
13. North East 25 * * 52 2.1 * * 141 5.6 51 2.0 11 0.4 17 0.7
14. North West * * * * * * * * * * * * * * *
1 The denominator includes all patients in the Larynx/Hypopharynx Cancer Resection Cohort.* In accordance with ICES policy, the exact number is suppressed when the cell size is <6, or when the cell size allows for a number of <6 to be calculated.CT = computed tomography; MRI = magnetic resonance imaging.

Institute for Clinical Evaluative Sciences 77Institute for Clinical Evaluative Sciences 77
HEAD AND NECK CANCER SURGERY IN ONTARIO, 2003–2010SURGERY FOR LARYNX/HYPOPHARYNX CANCER
EXHIBIT 3.7C Consultations and services received by adults in the Larynx/Hypopharynx Cancer Resection Cohort in the 12 months before and 12 months after their definitive surgery, by Local Health Integration Network of residence and of treatment, in Ontario, 2003 to 2010
Key Findings
• In the Larynx/Hypopharynx Resection Cohort, 95% of patients saw a radiation oncologist in the 12 months before and after their definitive laryngectomy procedure; 84% of patients received radiation therapy as part of their treatment.
• Rates of referral to a radiation oncologist were lowest (84%) among patients who lived in the Champlain Local Health Integration Network (LHIN) at the time of their diagnosis. Patients living in the Toronto Central and North East LHINs had a 100% radiation oncologist consultation rate.
• More than two-thirds (69%) of patients in this cohort were seen by a medical oncologist during the 24 months surrounding their definitive laryngectomy procedure. This rate ranged from a low of 53% among people residing in the North East LHIN at the time of diagnosis to a high of 90% among those living in the Erie St. Clair LHIN.
• More than one in five patients in this cohort (22%) received chemotherapy as part of their treatment for larynx/hypopharynx cancer. The highest chemotherapy rate (35%) was observed among those living in the South West LHIN at the time of diagnosis; those residing in the Central West LHIN had the lowest rate (0%).
• On average, patients in the cohort visited their surgeons 12.1 times in the period from 12 months before to 12 months after their definitive laryngectomy surgeries.
• Seventeen percent of patients in the cohort received a palliative care consultation in the 12 months before and after their definitive laryngectomy surgeries. The highest consultation rate (33%) was observed among those living in the Waterloo Wellington LHIN at the time of diagnosis; the lowest rate (0%) was among those residing in the Central West LHIN. Relatively infrequent use of palliative care services in this cohort resulted in some cells being suppressed due to small sample sizes.

Institute for Clinical Evaluative Sciences78 Institute for Clinical Evaluative Sciences78
HEAD AND NECK CANCER SURGERY IN ONTARIO, 2003–2010 SURGERY FOR LARYNX/HYPOPHARYNX CANCER
EXHIBIT 3.7C continued
CharacteristicCohort,
N
Radiation OncologyConsultation Radiation Therapy
Medical Oncology Consultation Chemotherapy
SurgeryConsultation
Palliative CareConsultation
Patients receiving, %
Avg1 per patient, n
Patients receiving, %
Avg1 per patient, n
Patients receiving
post-operatively, %
Patients receiving, %
Avg1 per patient, n
Patients receiving, %
Avg1 per patient, n
Patients receiving, %
Avg1 per patient, n
Patients receiving, %
Ontario 448 95.1 1.1 84.2 1.1 58.9 69.2 1.8 22.1 0.9 100.0 12.1 17.0
LHIN of residence1. Erie St. Clair 38 92.1 1.2 84.2 0.9 65.8 89.5 2.3 28.9 1.0 100.0 11.1 13.2
2. South West 66 97.0 1.0 89.4 1.1 72.7 81.8 2.0 34.8 1.4 100.0 9.9 13.6
3. Waterloo Wellington 27 92.6 1.0 81.5 1.0 66.7 81.5 1.8 25.9 1.9 100.0 11.9 33.3
4. Hamilton Niagara Haldimand Brant 61 95.1 1.0 80.3 0.9 65.6 60.7 1.3 26.2 0.9 100.0 12.4 14.8
5. Central West 15 93.3 1.1 80.0 1.1 60.0 66.7 2.1 0.0 0.0 100.0 10.0 0.0
6. Mississauga Halton 17 94.1 1.1 76.5 0.9 41.2 58.8 1.9 * * 100.0 11.9 *
7. Toronto Central 32 100.0 1.2 87.5 1.3 50.0 84.4 2.6 * * 100.0 13.2 18.8
8. Central 27 96.3 1.0 85.2 1.3 40.7 70.4 2.1 22.2 0.4 100.0 14.0 *
9. Central East 46 95.7 1.2 84.8 1.3 54.3 63.0 2.0 19.6 0.6 100.0 12.5 15.2
10. South East 30 100.0 1.7 73.3 1.0 70.0 56.7 1.2 26.7 1.9 100.0 10.9 *
11. Champlain 44 84.1 1.0 84.1 1.0 52.3 59.1 2.0 * * 100.0 13.4 20.5
12. North Simcoe Muskoka * * * * * * * * * * * * *
13. North East 30 100.0 1.2 90.0 1.0 50.0 53.3 0.8 * * 100.0 14.0 20.0
14. North West * * * * * * * * * * * * *
LHIN of treatment1. Erie St. Clair * * * * * * * * * * * * *
2. South West 117 94.0 1.1 87.2 1.0 71.8 89.7 2.2 34.2 1.5 100.0 10.6 17.1
3. Waterloo Wellington ** ** ** ** ** ** ** ** ** ** ** ** **
4. Hamilton Niagara Haldimand Brant 82 96.3 1.0 78.0 0.9 61.0 59.8 1.3 24.4 0.8 100.0 12.2 15.9
5. Central West ** ** ** ** ** ** ** ** ** ** ** ** **
6. Mississauga Halton ** ** ** ** ** ** ** ** ** ** ** ** **
7. Toronto Central 154 96.8 1.2 84.4 1.2 47.4 66.9 2.0 16.2 0.4 100.0 12.7 18.2
A. University Health Network 104 96.2 1.2 84.6 1.3 44.2 63.5 1.8 13.5 0.4 100.0 11.7 17.3
B. Sunnybrook Health Sciences Centre 35 100.0 1.2 91.4 1.2 60.0 71.4 2.2 28.6 0.6 100.0 14.7 17.1
C. Mount Sinai Hospital 15 93.3 1.3 66.7 0.9 40.0 80.0 2.7 * * 100.0 14.8 *
8. Central * * * * * * * * * * * * *
9. Central East ** ** ** ** ** ** ** ** ** ** ** ** **
10. South East 19 100.0 1.7 73.7 0.9 78.9 57.9 1.1 36.8 3.0 100.0 11.1 *
11. Champlain 49 85.7 1.0 83.7 1.0 51.0 59.2 1.9 * * 100.0 13.2 22.4
12. North Simcoe Muskoka ** ** ** ** ** ** ** ** ** ** ** ** **
13. North East 25 100.0 1.2 96.0 1.0 60.0 48.0 0.7 * * 100.0 12.8 *
14. North West ** ** ** ** ** ** ** ** ** ** ** ** **
1 The denominator includes all patients in the Larynx/Hypopharynx Cancer Resection Cohort.* In accordance with ICES policy, the exact number is suppressed when the cell size is <6, or when the cell size allows for a number of <6 to be calculated.* * The LHIN did not treat any patients from the Cancer Resection Cohort (i.e., no laryngectomies were performed in the LHIN).

Institute for Clinical Evaluative Sciences 79Institute for Clinical Evaluative Sciences 79
HEAD AND NECK CANCER SURGERY IN ONTARIO, 2003–2010SURGERY FOR LARYNX/HYPOPHARYNX CANCER
EXHIBIT 3.8A Diagnostic and adjunctive procedures received by adults in the Larynx/Hypopharynx Cancer/No Resection Cohort in the 12 months before and 12 months after their diagnosis, by Local Health Integration Network of residence, in Ontario, 2003 to 2010
Key Findings
• Patients in the Larynx/Hypopharynx Cancer/No Resection Cohort underwent a number of diagnostic procedures in the 24 months surrounding their diagnosis. These included panendoscopy (1,172 procedures) and other endoscopies, including esophagoscopy and bronchoscopy, (3,161
procedures). Patients in this cohort were less likely to receive these procedures than patients in the Resection Cohort (see Exhibit 3.7A).
• Patients in the No Resection Cohort were less likely to receive neck dissections, free flaps, any reconstructive procedure, a tracheostomy (a breathing tube placed through the neck), or a gastrostomy tube (a feeding tube inserted through
the abdominal wall) compared to patients in the Resection Cohort (see Exhibit 3.7A).
• Much lower rates of other procedures were performed on patients in this cohort, including 94 neck open biopsies, 157 head and neck fine-needle biopsies, 11 free flaps and 45 reconstructive procedures; all averaged less than 0.1 procedure per patient.
Characteristic Cohort, N
Panendoscopy Other Endoscopy Oral Cavity Biopsy Neck Dissection Tracheostomy Gastrostomy Tube
nAvg1 per
patient, n nAvg1 per
patient, n nAvg1 per
patient, n nAvg1 per
patient, nPatients
readmitted, % nAvg1 per
patient, n nAvg1 per
patient, n
Ontario 2,586 1,172 0.5 3,161 1.2 1,475 0.6 97 0.0 3.3 450 0.2 723 0.3
LHIN of residence1. Erie St. Clair 157 49 0.3 147 0.9 91 0.6 * * * 21 0.1 39 0.2
2. South West 209 117 0.6 267 1.3 105 0.5 11 0.1 4.8 9 0.0 35 0.2
3. Waterloo Wellington 138 72 0.5 186 1.3 63 0.5 * * * 21 0.2 34 0.2
4. Hamilton Niagara Haldimand Brant 312 133 0.4 430 1.4 195 0.6 9 0.0 2.9 35 0.1 72 0.2
5. Central West 119 79 0.7 147 1.2 65 0.5 9 0.1 6.7 38 0.3 61 0.5
6. Mississauga Halton 159 81 0.5 192 1.2 91 0.6 9 0.1 4.4 27 0.2 54 0.3
7. Toronto Central 231 134 0.6 246 1.1 118 0.5 * * * 54 0.2 93 0.4
8. Central 245 105 0.4 312 1.3 162 0.7 * * * 38 0.2 71 0.3
9. Central East 257 108 0.4 297 1.2 162 0.6 7 0.0 2.3 59 0.2 86 0.3
10. South East 125 12 0.1 165 1.3 64 0.5 8 0.1 6.4 23 0.2 35 0.3
11. Champlain 268 59 0.2 302 1.1 181 0.7 17 0.1 4.5 63 0.2 37 0.1
12. North Simcoe Muskoka 120 74 0.6 142 1.2 67 0.6 * * * 23 0.2 46 0.4
13. North East 182 137 0.8 188 1.0 78 0.4 8 0.0 4.4 31 0.2 43 0.2
14. North West 64 12 0.2 140 2.2 33 0.5 0 0.0 0.0 8 0.1 17 0.3
1 The denominator includes all patients in the Larynx/Hypopharynx Cancer Resection Cohort.* In accordance with ICES policy, the exact number is suppressed when the cell size is <6, or when the cell size allows for a number of <6 to be calculated.

Institute for Clinical Evaluative Sciences80 Institute for Clinical Evaluative Sciences80
HEAD AND NECK CANCER SURGERY IN ONTARIO, 2003–2010 SURGERY FOR LARYNX/HYPOPHARYNX CANCER
EXHIBIT 3.8B Radiologic services received by adults in the Larynx/Hypopharynx Cancer/No Resection Cohort in the 12 months before and 12 months after their diagnosis, by Local Health Integration Network of residence, in Ontario, 2003 to 2010
Key Findings
• Patients in the Larynx/Hypopharynx Cancer/No Resection Cohort received a number of radiologic services in the 12 months before and after their diagnosis. These included computed tomography (CT) scans of the head and neck (1.6 per patient, on average), chest X-rays (3.1 per patient), chest CT
scans (0.9 per patient), abdominal ultrasound imaging (0.4 per patient) and abdominal CT scans (0.3 per patient).
• Patients who did not undergo resection received slightly fewer radiologic imaging services overall compared to those who did have a resection surgery (see Exhibit 3.7B). This was most prominent in the chest imaging category.
• In the No Resection Cohort, there was little variation in the use of radiologic services across Local Health Integration Networks of patient residence.
• Other radiologic services utilized infrequently in this cohort included MRI scans (29; average 0.0 per person), PET scans (8; average 0.0 per person) and bone scans (201, average 0.1 per person).
Characteristic
Head and Neck Chest Abdomen
MRI Scan Swallow Study X-Ray CT Scan Ultrasound CT Scan
nAvg1 per
patient, n nAvg1 per
patient, n nAvg1 per
patient, n nAvg1 per
patient, n nAvg1 per
patient, n nAvg1 per
patient, n
Ontario 436 0.2 444 0.2 8,004 3.1 2,425 0.9 1,060 0.4 854 0.3
LHIN of residence1. Erie St. Clair 10 0.1 23 0.1 539 3.4 106 0.7 70 0.4 44 0.3
2. South West 14 0.1 29 0.1 598 2.9 166 0.8 53 0.3 66 0.3
3. Waterloo Wellington 20 0.1 32 0.2 394 2.9 111 0.8 58 0.4 45 0.3
4. Hamilton Niagara Haldimand Brant 41 0.1 27 0.1 870 2.8 170 0.5 143 0.5 70 0.2
5. Central West 22 0.2 37 0.3 361 3.0 153 1.3 62 0.5 37 0.3
6. Mississauga Halton 15 0.1 17 0.1 597 3.8 190 1.2 77 0.5 61 0.4
7. Toronto Central 40 0.2 53 0.2 764 3.3 282 1.2 100 0.4 100 0.4
8. Central 37 0.2 41 0.2 794 3.2 231 0.9 137 0.6 69 0.3
9. Central East 63 0.2 45 0.2 744 2.9 282 1.1 111 0.4 80 0.3
10. South East 107 0.9 23 0.2 359 2.9 93 0.7 41 0.3 51 0.4
11. Champlain 25 0.1 42 0.2 921 3.4 213 0.8 75 0.3 78 0.3
12. North Simcoe Muskoka 16 0.1 31 0.3 397 3.3 123 1.0 41 0.3 43 0.4
13. North East 15 0.1 29 0.2 448 2.5 264 1.5 74 0.4 83 0.5
14. North West 11 0.2 15 0.2 218 3.4 41 0.6 18 0.3 27 0.4
1 The denominator includes all patients in the Larynx/Hypopharynx Cancer Resection Cohort.* In accordance with ICES policy, the exact number is suppressed when the cell size is <6, or when the cell size allows for a number of <6 to be calculated.MRI = magnetic resonance imaging; CT = computed tomography.

Institute for Clinical Evaluative Sciences 81Institute for Clinical Evaluative Sciences 81
HEAD AND NECK CANCER SURGERY IN ONTARIO, 2003–2010SURGERY FOR LARYNX/HYPOPHARYNX CANCER
EXHIBIT 3.8C Consultations and services received by adults in the Larynx/Hypopharynx Cancer/No Resection Cohort in the 12 months before and 12 months after their diagnosis, by Local Health Integration Network of residence, in Ontario, 2003 to 2010
Key Findings
• Approximately 92% of patients in the Larynx/Hypopharynx Cancer/No Resection Cohort saw a radiation oncologist in the 12 months before and after their diagnosis. About 84% of patients received radiation therapy as a part of treatment.
• The rate of referral to a radiation oncologist was lowest among patients who lived in the North West
Local Health Integration Network (LHIN) at the time of their diagnosis (78%).
• A lower proportion of patients in this cohort (50%) were seen by a medical oncologist during the 24 months surrounding their diagnosis as compared to the cohort that received a resection (69%) (see Exhibit 3.7C).
• On average, patients in the study cohort visited their surgeon 7.2 times in the 12 months before
and 12 months after their diagnosis, which is almost half as often as those who received a definitive laryngectomy procedure (see Exhibit 3.7C). Despite not receiving a laryngectomy procedure, 99% of patients in the No Resection Cohort saw a surgeon during the same period.
• Fifteen percent of patients in the cohort received a palliative care consultation in the 12 months before and after their diagnosis, which is comparable to patients in the Resection Cohort (see Exhibit 3.7C).
Characteristic Cohort, N
Radiation OncologyConsultation Radiation Therapy
Medical OncologyConsultation Chemotherapy Surgery Consultation
Palliative CareConsultation
Patients receiving, %
Avg1 per patient
Patients receiving, %
Avg1 per patient
Patients receiving, %
Avg1 per patient
Patients receiving, %
Avg1 per patient
Patients receiving, %
Avg1 per patient
Patients receiving, %
Ontario 2,586 91.5 1.0 84.4 1.0 50.0 1.0 18.1 1.0 99.3 7.2 14.8
LHIN of residence1. Erie St. Clair 157 91.1 1.0 82.8 0.9 61.1 1.2 31.8 1.2 98.7 6.4 9.6
2. South West 209 89.0 0.9 81.8 0.9 57.4 1.0 28.2 1.1 100.0 6.8 10.0
3. Waterloo Wellington 138 88.4 0.9 81.2 0.9 39.9 0.7 18.8 1.3 100.0 6.5 18.1
4. Hamilton Niagara Haldimand Brant 312 90.7 0.9 83.0 0.9 43.3 0.7 17.0 1.4 99.4 6.7 13.1
5. Central West 119 95.8 1.0 84.0 1.3 55.5 1.4 18.5 0.5 100.0 7.6 22.7
6. Mississauga Halton 159 95.0 1.0 88.7 1.2 47.8 1.1 10.7 0.8 100.0 7.8 15.7
7. Toronto Central 231 90.5 1.0 79.7 1.1 61.0 1.5 14.7 0.4 99.1 7.3 19.0
8. Central 245 91.0 1.0 84.5 1.1 47.3 1.1 15.1 0.6 98.4 7.5 13.5
9. Central East 257 91.8 1.0 82.5 1.1 53.7 1.1 17.1 1.1 98.4 7.5 16.0
10. South East 125 92.8 1.2 84.8 1.0 52.0 0.9 21.6 3.2 96.8 6.7 17.6
11. Champlain 268 91.4 1.0 85.8 1.0 43.3 0.9 13.8 0.8 100.0 7.3 18.3
12. North Simcoe Muskoka 120 96.7 1.0 90.0 1.2 49.2 0.8 10.0 0.5 100.0 8.3 10.0
13. North East 182 94.0 1.0 94.5 1.0 44.5 0.6 18.7 1.1 100.0 7.4 12.1
14. North West 64 78.1 0.8 79.7 0.8 45.3 0.8 23.4 1.0 98.4 7.8 9.4
1 The denominator includes all patients in the Larynx/Hypopharynx Cancer Resection Cohort.* In accordance with ICES policy, the exact number is suppressed when the cell size is <6, or when the cell size allows for a number of <6 to be calculated.

Institute for Clinical Evaluative Sciences82 Institute for Clinical Evaluative Sciences82
HEAD AND NECK CANCER SURGERY IN ONTARIO, 2003–2010 SURGERY FOR LARYNX/HYPOPHARYNX CANCER
Discussion and Conclusions
Summary of findings and implications for clinical practice
Cancer of the larynx and hypopharynx is the 21st most common newly diagnosed cancer and the 20th most common cause of death due to cancer in Canada. Larynx/hypopharynx cancer is the second most common head and neck cancer diagnosed in Ontario.
Our analyses of Ontarians diagnosed with larynx/hypopharynx cancer from 2003 to 2010 found that incidence rates were more than six times higher among men than women and were highest among those aged 70 or older. Incidence rates varied widely across the province’s 14 Local Health Integration Networks (LHINs).
Nearly 69% of Ontario adults newly diagnosed with larynx/hypopharynx cancer underwent a cancer-related surgical procedure for their disease within a year of diagnosis, while 15% had a definitive surgical procedure (laryngectomy). People aged 75 or older and newly diagnosed with larynx/hypopharynx cancer and people residing in smaller communities at the time of diagnoses were less likely to have any cancer-related surgery (or laryngectomy) than younger people with this disease and those residing in larger communities. The likelihood of receiving any cancer-related
procedure and laryngectomy varied significantly by the LHIN of patient residence. This lower rate of resection in less populated LHINs and in lower-income neighbourhoods may not be entirely explained by differences in patient preferences, cancer stage or comorbidity profile. These findings warrant further investigation.
Among the province’s nine major head and neck cancer treatment centres, there were large variations in initial treatment approach and adjunctive procedures used (tracheoesophageal puncture, neck dissection, reconstructive procedure). Some centres were more likely to treat with a surgical procedure, while others were more likely to initiate radiotherapy with or without chemotherapy. This represents an important variation in practice, particularly for advanced disease.
Among the 15% of patients in the study cohort who underwent a laryngectomy procedure for larynx/hypopharynx cancer, nearly half (46%) had a total laryngectomy. The more complex partial laryngectomy procedure was performed on only 4% of patients in this cohort and at only six of the nine highly specialized head and neck cancer treatment centres. The remainder of the cohort that underwent a resection (50%) had a pharyngolaryngectomy. Nearly all (98%) laryngectomy procedures done in Ontario between 2003 and 2010 were performed at head and neck cancer treatment centres. These procedures were largely performed by otolaryngologists or high-volume general surgeons.
Most surgical admissions for larynx/hypopharynx cancer (54%) occurred outside the LHINs where patients were living at the time of their
diagnosis, with the vast majority (79%) of admissions occurring in three LHINs: Toronto Central, South West, and Hamilton Niagara Haldimand Brant. Larynx/hypopharynx surgical care is highly regionalized. Care for patients with larynx/hypopharynx cancer was resource intensive and required a significant number of diagnostic tests, procedures and care delivered by a number of different oncologists. There was little use of head and neck MRI in this cohort. The abdomen is not routinely imaged for staging in patients undergoing laryngectomy. Within a year of laryngectomy, patients in this cohort used a large number of services provided by Community Care Access Centres (on average, 54 days of service per person).
There were variations across LHINs of patient residence in the use of surgery and radiation therapy to treat persons newly diagnosed with larynx/hypopharynx cancer. There was also significant variation in the use of palliative care consultation, which may reflect the availability of this service in the various LHINs or differences in the stage (extent) of disease at presentation due to a delay in the diagnosis in some LHINs. Those who did not undergo a laryngectomy still used considerable surgical and other health care resources. We were surprised by the less-than-ideal rates of consultation with radiation oncologists and medical oncologists in this group.

Institute for Clinical Evaluative Sciences 83Institute for Clinical Evaluative Sciences 83
HEAD AND NECK CANCER SURGERY IN ONTARIO, 2003–2010SURGERY FOR LARYNX/HYPOPHARYNX CANCER
Implications for policy and planning
We noted variations in the use of surgical procedures and referral to specialists among larynx/hypopharynx cancer patients who resided in one LHIN and were treated in another. More research is necessary to understand this observation and whether health resource planning initiatives are needed to improve access to care in some regions of the province.
The incidence of larynx/hypopharynx cancer increases with age. As the Ontario population ages, there may be increasing demand for health services related to the diagnosis and treatment of this cancer.
Although care is highly regionalized to the province’s designated head and neck cancer treatment centres, there are significant variations in the diagnostic workup, treatment, use of adjunctive procedures, and consultations for patients who reside in one LHIN and are treated in another. We believe that province-wide quality improvement programs should be designed with input from the nine major head and neck cancer treatment centres to standardize care, monitor and improve compliance with guidelines, and study outcomes in the larynx/hypopharynx group. Communities of practice, led by Cancer Care Ontario clinical champions, have achieved significant improvements in the quality of delivered care in the thoracic, hepatobiliary, colorectal and urological cancer communities. The head and neck oncologic community may benefit from similar programs.
Future research
Cancer-stage data and comorbidity information to assess case mix across the nine major head and neck cancer treatment centres are needed to more thoroughly analyze differences between centres. Further studies should delineate processes of care (preoperative imaging and metastatic workup, multidisciplinary consultations and cancer care conferences, and appropriate follow-up care), adherence to guidelines, and their association with outcomes. Although larynx/hypopharynx cancer care is regionalized, volumes vary significantly among head and neck cancer treatment centres, and further regionalization may be associated with improved care. Alternatively, agreed upon evidence-based algorithms of care may improve outcomes for this patient group.
References
1. Cantrell R. The current status of laryngeal cancer. In: Inouye T, Fukuda H, Sato T, Hinohara T, editors. Recent Advances in Bronchoesophagology: International Congress Proceedings. Amsterdam, The Netherlands: Excerpta Medica; 1990.
2. Advisory Committee on Cancer Statistics. Canadian Cancer Statistics 2015. Toronto, ON: Canadian Cancer Society; 2015. Accessed August 19, 2015 at https://www.cancer.ca/~/media/cancer.ca/CW/cancer%20information/cancer%20101/Canadian%20cancer%20statistics/Canadian-Cancer-Statistics-2015-EN.pdf.
3. Paleri V, Drinnan M, van den Brekel MW, Hinni ML, Bradley PJ, Wolf GT, et al. Vascularized tissue to reduce fistula following salvage total laryngectomy: a systematic review. Laryngoscope. 2014; 124(8):1848–53.

Institute for Clinical Evaluative Sciences84
HEAD AND NECK CANCER SURGERY IN ONTARIO, 2003–2010
4 Surgery for Salivary Gland Cancer
Inside
• Summary • Introduction • List of Exhibits • Exhibits and Key Findings • Discussion and Conclusions • References

Institute for Clinical Evaluative Sciences 85Institute for Clinical Evaluative Sciences 85
HEAD AND NECK CANCER SURGERY IN ONTARIO, 2003–2010SURGERY FOR SALIVARY GLAND CANCER
Summary
Issue
Salivary gland cancers are of diverse histologies (cell types). This is challenging for pathologists and clinicians alike as it is difficult to acquire a significant volume of or experience with any given tumour histology. Because it can be difficult to differentiate between benign and malignant salivary gland tumours, a resection is often performed for diagnostic and therapeutic purposes. For this reason, tumours of this subsite are not necessarily referred to multidisciplinary oncology centres prior to surgical removal.
Malignant tumours can invade nearby structures, particularly nerves, affecting sensation, facial movement, cosmesis and, rarely, speech and swallowing. In such cases, postoperative reconstructive surgery can rehabilitate a patient’s function, physical appearance and quality of life. In addition, postoperative adjuvant radiation is frequently required. For these reasons and due to the inherent complexity of treating these cancers, this chapter explores whether care is regionalized and whether disparities exist among patients with these cancers.
Study
This chapter provides a snapshot of treatment patterns for adults newly diagnosed with cancers of the major salivary gland (including the parotid and submandibular glands) in Ontario between January 1, 2003, and December 31, 2010. We focus on the delivery of surgical care and related health services and, where possible, include data regarding patient factors (sex, age, socioeconomic status and place of residence) and provider factors (surgical specialty and the type and location of hospitals delivering services). We also assess the influence of patient and provider factors on the services provided.
Key findings
• Nearly 93% of Ontario adults newly diagnosed with salivary gland cancer underwent a cancer-related surgical procedure (a resection or an adjunctive procedure) for their disease within a year of diagnosis. Of that group, only 82% had a definitive surgical procedure (parotid or submandibular gland resection).
• Compared to other age groups, adults aged 75 or older and newly diagnosed with salivary gland cancer were less likely to have any cancer-related surgery (or salivary gland resection).
• Among the nine major head and neck cancer treatment centres, there was large variation in rates of consultation with a radiation oncologist or medical oncologist. Similar variations were observed in rates of radiotherapy and chemotherapy for this cohort.
• More than half (57%) of salivary gland cancer resection procedures done in Ontario between 2003 and 2010 were performed at head and neck cancer treatment centres. A large majority of these procedures were performed by otolaryngologists (91%); the remainder were completed by general surgeons (9%) and plastic surgeons (1%).
• A third (35%) of all surgical admissions for salivary gland cancer surgery occurred outside the LHINs where patients were living at the time of their diagnosis; more than half (56%) of these admissions occurred in three LHINs: Toronto Central, South West, and Hamilton Niagara Haldimand Brant. Compared with cancers of the oral cavity and larynx/hypopharyx, surgical care for salivary gland cancer was far less concentrated in regional centres.
• Patients who did not undergo a resection still used considerable surgical and other health care resources.

Institute for Clinical Evaluative Sciences86 Institute for Clinical Evaluative Sciences86
HEAD AND NECK CANCER SURGERY IN ONTARIO, 2003–2010 SURGERY FOR SALIVARY GLAND CANCER
Implications
• For patients with salivary gland cancer who reside in one LHIN and are treated in another, we note variations in the use of surgical procedures and referral to specialists. More research is necessary to understand this observation.
• The incidence of salivary gland cancer increases with age. As the Ontario population ages, there may be increasing demand for health services related to this cancer’s diagnosis and treatment.
• Of the head and neck cancers presented in this atlas, salivary gland cancer treatment is the least regionalized. Benign parotid gland masses are far more common than malignant ones. A surgical resection is often used for both diagnostic and therapeutic purposes if a fine-needle aspiration biopsy does not provide a diagnosis. This is reflected in the number of surgeons and centres performing salivary gland cancer surgery. Although this is understandable, a significant proportion (75%) of patients had a resection without first undergoing a fine-needle biopsy attempt. Regional quality improvement initiatives could help address this rate and potentially improve compliance with provincial best practice guidelines, which have yet to be developed for this cancer subsite.
• Despite some regionalization to designated head and neck cancer treatment centres, there are significant variations in the diagnostic workup,
treatment, use of adjunctive procedures, and consultations for patients residing in one LHIN and being treated in another, even among the three LHINs with the highest treatment volumes.
Introduction
Malignant tumours of the salivary glands have a relatively low incidence compared to other head and neck cancers. Canadian cancer statistics do not specifically report on salivary gland cancers, including them with oral cancers.1Salivary gland tumours account for more than 0.5% of all malignancies and approximately 5% of all head and neck cancers.2 They have a diverse histology, can present at multiple sites (including the face, neck and mouth) and require complex multidisciplinary treatment.
Salivary gland cancers present in one of four sites in decreasing order of incidence:
• the parotid glands (over the cheeks),
• the submandibular glands (below the jaw in the upper neck),
• the sublingual glands (deep to the floor of the mouth), and
• the minor salivary glands (throughout the mouth, sinuses, voice box and trachea).
The vast majority (more than 95%) of malignant tumours in Ontario present in the parotid or submandibular glands, and this chapter focuses on these tumours. We chose to exclude sublingual and minor salivary gland tumours as these require different surgical procedures and are not representative of the majority of salivary gland tumours.
Salivary gland cancers are of diverse histologies (cell types), many of which are very rare. This is challenging for pathologists and clinicians alike as it is difficult to acquire a significant volume of or experience with any given tumour histology or look to the literature for management recommendations. This chapter includes all histological types of salivary gland cancer except for lymphoma, which accounts for only 8% of histological types and is not treated with surgery.
In Ontario, many salivary gland cancers are classified as squamous cell carcinomas; however, the overwhelming majority of these are metastases from skin cancer to the lymph nodes lying within the parotid gland. These cases necessitate surgery to remove the potentially cancerous lymph nodes in the parotid gland. Exhibit 4.0 presents the major nonlymphoma histologies for salivary gland cancers in Ontario from 2003 to 2010.

Institute for Clinical Evaluative Sciences 87Institute for Clinical Evaluative Sciences 87
HEAD AND NECK CANCER SURGERY IN ONTARIO, 2003–2010SURGERY FOR SALIVARY GLAND CANCER
EXHIBIT 4.0 Distribution of salivary gland tumours, by histological type, in Ontario, 2003 to 2010
Source: Eskander et al. J Otolaryngol Head Neck Surg. 2014; 43:50.

Institute for Clinical Evaluative Sciences88 Institute for Clinical Evaluative Sciences88
HEAD AND NECK CANCER SURGERY IN ONTARIO, 2003–2010 SURGERY FOR SALIVARY GLAND CANCER
Presentation
There is no screening program for salivary gland cancers because they are rare. Patients may present to a health care professional with facial weakness or numbness, unexplained pain or swelling in the face or neck, or most commonly, with an asymptomatic mass in and around the cheek, ear, neck or jaw. If the swelling is thought to be due to an infection or a stone in the salivary ducts, nonsurgical treatment is initiated before referral to a specialist for biopsy and other diagnostic tests ultimately lead to a cancer diagnosis. The likelihood of a lesion being malignant depends on the site of presentation. Approximately 25% of parotid tumours and 40% of submandibular tumours are malignant.2,3
Diagnosis and staging
A parotid or submandibular gland cancer is diagnosed using a physical examination by a physician or dentist, which may result in a biopsy before or after appropriate radiological imaging. The cancer typically presents as a mass. A definitive diagnosis usually involves a fine-needle aspiration biopsy with or without imaging guidance. This is typically performed in an office setting unless imaging (ultrasound) is required, in which case it is performed in an imaging suite. Such needle biopsies when positive accurately predict 97% of malignancies; however, when reported as negative, 20%‒30% of cancers are missed.4,5
If a biopsy does not confirm cancer, patients can be re-biopsied, followed closely, or referred to a surgeon for diagnostic excision in cases where the suspicion is high or for cosmesis and symptom control. For the majority of salivary gland neoplasms, including suspected benign neoplasms, surgery is recommended to ensure there is no malignancy (given the high false negative rate) and to prevent progression to a malignancy in cases of pleomorphic adenoma. In addition, surgery is recommended when growth occurs. Larger tumours may be more difficult to remove and also become of cosmetic concern. Despite the fact that surgery is recommended in most cases, a needle biopsy is still valuable as it is often able to determine malignancy, which can aid in the triage of patients to surgery and in counselling them regarding the extent of their surgery. If a biopsy confirms cancer, staging should be performed and a referral made to a surgeon with expertise in the evaluation and treatment of this cancer.
Treatment of parotid and submandibular gland cancers
Once patients are diagnosed, determining the extent of the local disease and of regional or distant metastases – a process called staging – requires a combination of physical examination and imaging with computed tomography and/or magnetic resonance imaging.
The main curative treatment modality for parotid and submandibular cancers is surgery to remove the cancer with a surrounding portion of normal tissue. Radiation with or without chemotherapy is rarely used with the intent to cure the patient as the initial treatment; it is typically reserved for palliative cases. Radiation, however, is often used postoperatively to treat the primary site or the neck in certain high-risk cases. Resection is largely dependent on the location and extent of the tumour, whether it is resectable, whether the patient will tolerate a major operation, and functional considerations (i.e., how the resection will affect the patient’s quality of life).
How the study cohorts were defined
This chapter provides detailed information on surgical services and related health services delivered to adults newly diagnosed with cancers of the major salivary glands — the parotid and submandibular glands — in Ontario from 2003 to 2010.
The study population for this chapter includes all men and women 18 years of age or older identified with salivary gland cancer in the Ontario Cancer Registry and whose diagnosis date fell between January 1, 2003, and December 31, 2010. This population is referred to as the Overall Salivary Gland Cancer Cohort.
The Overall Salivary Gland Cancer Cohort was divided into two pairs of smaller groups.

Institute for Clinical Evaluative Sciences 89Institute for Clinical Evaluative Sciences 89
HEAD AND NECK CANCER SURGERY IN ONTARIO, 2003–2010SURGERY FOR SALIVARY GLAND CANCER
For Exhibits 4.1A to 4.1C, the Overall Salivary Gland Cancer Cohort was divided as follows:
• The Salivary Gland Surgery Cohort includes those persons who had surgery related to their salivary gland cancer within 12 months before or after their diagnosis date.
• The Salivary Gland/No Surgery Cohort includes those persons who did not have surgery related to their salivary gland cancer within 12 months before or after their diagnosis date.
For Exhibits 4.2A to 4.8C, the Overall Salivary Gland Cancer Cohort was divided as follows:
• The Salivary Gland Resection Cohort includes those persons who had resection of their primary tumour site within 12 months before or after their diagnosis date.
• The Salivary Gland/No Resection Cohort includes those persons who did not have resection of their primary tumour site within 12 months before or after their diagnosis date. This group includes all individuals who did not have surgery and those whose only surgery was an adjunctive procedure (reconstruction, tracheostomy, gastrostomy tube).

Institute for Clinical Evaluative Sciences90
HEAD AND NECK CANCER SURGERY IN ONTARIO, 2003–2010 SURGERY FOR SALIVARY GLAND CANCER
List of Exhibits
EXHIBIT 4.1A Incidence of salivary gland cancer and use of surgery among adults in the Overall Salivary Gland Cancer Cohort, by sex, age group, neighbourhood income quintile, community size and Local Health Integration Network of residence, in Ontario, 2003 to 2010
EXHIBIT 4.1B Incidence of salivary gland cancer and use of surgery among men in the Overall Salivary Gland Cancer Cohort, by age group, neighbourhood income quintile, community size and Local Health Integration Network of residence, in Ontario, 2003 to 2010
EXHIBIT 4.1C Incidence of salivary gland cancer and use of surgery among women in the Overall Salivary Gland Cancer Cohort, by age group, neighbourhood income quintile, community size and Local Health Integration Network of residence, in Ontario, 2003 to 2010
EXHIBIT 4.2A Health care use among adults in the Salivary Gland Cancer Resection Cohort, by sex, age group, neighbourhood income quintile, community size, and Local Health Integration Network of residence and of treatment, in Ontario, 2003 to 2010
EXHIBIT 4.2B Health care use among adults in the Salivary Gland Cancer Resection Cohort, by Local Health Integration Network of residence and of treatment, in Ontario, 2003 to 2010
EXHIBIT 4.3 Hospital admissions for salivary gland surgery among adults in the Salivary Gland Cancer Resection Cohort in the 12 months before and 12 months after their diagnosis, by Local Health Integration Network of residence and of treatment, in Ontario, 2003 to 2010
EXHIBIT 4.4 Type of definitive resection procedure among adults in the Salivary Gland Cancer Resection Cohort, by sex, age group, neighbourhood income quintile, community size, and Local Health Integration Network of residence and of treatment, in Ontario, 2003 to 2010
EXHIBIT 4.5 Proportion of adults in the Overall Salivary Gland Cancer Cohort who received a salivary gland resection as a definitive procedure, by Local Health Integration Network of residence, in Ontario, 2003 to 2010
EXHIBIT 4.6A Overall pattern of surgical care provided to adults in the Salivary Gland Cancer Resection Cohort, by physician specialty, in Ontario, 2003 to 2010
EXHIBIT 4.6B Overall pattern of surgical care provided to adults in the Salivary Gland Cancer Resection Cohort, by hospital type, in Ontario, 2003 to 2010
EXHIBIT 4.7A Diagnostic and adjunctive procedures received by adults in the Salivary Gland Cancer Resection Cohort in the 12 months before and 12 months after their definitive surgery, by Local Health Integration Network of residence and of treatment, in Ontario, 2003 to 2010
EXHIBIT 4.7B Radiologic services received by adults in the Salivary Gland Cancer Resection Cohort in the 12 months before and 12 months after their definitive surgery, by Local Health Integration Network of residence and of treatment, in Ontario, 2003 to 2010
EXHIBIT 4.7C Consultations and services received by adults in the Salivary Gland Cancer Resection Cohort in the 12 months before and 12 months after their definitive surgery, by Local Health Integration Network of residence and of treatment, in Ontario, 2003 to 2010

Institute for Clinical Evaluative Sciences 91
HEAD AND NECK CANCER SURGERY IN ONTARIO, 2003–2010SURGERY FOR SALIVARY GLAND CANCER
EXHIBIT 4.8A Diagnostic and adjunctive procedures received by adults in the Salivary Gland Cancer/No Resection Cohort in the 12 months before and 12 months after their diagnosis, by Local Health Integration Network of residence, in Ontario, 2003 to 2010
EXHIBIT 4.8B Radiologic services received by adults in the Salivary Gland Cancer/No Resection Cohort in the 12 months before and 12 months after their definitive surgery, by Local Health Integration Network of residence, in Ontario, 2003 to 2010
EXHIBIT 4.8C Consultations and services received by adults in the Salivary Gland Cancer/No Resection Cohort in the 12 months before and 12 months after their definitive surgery, by Local Health Integration Network of residence, in Ontario, 2003 to 2010

Institute for Clinical Evaluative Sciences92 Institute for Clinical Evaluative Sciences92
HEAD AND NECK CANCER SURGERY IN ONTARIO, 2003–2010 SURGERY FOR SALIVARY GLAND CANCER
EXHIBIT 4.1A Incidence of salivary gland cancer and use of surgery among adults in the Overall Salivary Gland Cancer Cohort, by sex, age group, neighbourhood income quintile, community size and Local Health Integration Network of residence, in Ontario, 2003 to 2010
Key Findings
• Men constituted 59% of all salivary gland cancer patients in Ontario from 2003 to 2010. In the Overall Salivary Gland Cancer Cohort, the rate of salivary gland cancer per 100,000 population was higher among men (15.5 cases) than women (9.7 cases).
• The incidence of salivary gland cancer increases with age. Nearly half (47.1%) of newly-diagnosed salivary gland cancers occurred in people aged 65 or older.
• The incidence of salivary gland cancer is not related to neighbourhood income.
• The proportion of Ontarians with salivary gland cancer who underwent cancer-related surgery decreased with smaller community size.
• The Toronto Central LHIN had the lowest incidence rate of salivary gland cancer (9.1 cases per 100,000) while the South West LHIN had the highest incidence rate (14.5 cases per 100,000).
• The probability of undergoing surgery was lower for those aged 75 and older (76%) compared to the younger age groups (all above 90%).
• There were minor variations in rates of surgery for salivary gland cancer across LHINs of patient residence. The proportion of patients in the study cohort who had surgery related to their disease ranged from a low of 90% in the South East LHIN at the time of diagnosis, to a high of nearly 97% among those who resided in the North East LHIN.

Institute for Clinical Evaluative Sciences 93Institute for Clinical Evaluative Sciences 93
HEAD AND NECK CANCER SURGERY IN ONTARIO, 2003–2010SURGERY FOR SALIVARY GLAND CANCER
EXHIBIT 4.1A continued
Characteristic
Age-standardized1 Incidence
per 100,000
Overall Salivary Gland Cancer Cohort
Total Had surgery Did not have surgery
N % nAge-standardized2
% of total nAge-standardized2
% of total
Ontario 12.2 1,240 100.0 1,089 92.8 151 7.2Sex3
Female 9.7 507 40.9 456 94.6 51 5.4Male 15.5 733 59.1 633 91.1 100 8.9Age group,3 years18–54 6.7 409 33.0 388 94.9 21 5.155–64 18.2 246 19.8 223 91.5 23 8.565–69 19.9 92 7.4 82 90.2 10 9.870–74 30.9 122 9.8 111 91.1 11 8.9≥75 53.4 371 29.9 285 75.6 86 24.4Neighbourhood income quintileQ1 (lowest) 11.8 240 19.4 195 87.8 45 12.2Q2 9.5 202 16.3 185 97.1 17 2.9Q3 12.9 260 21.0 232 94.2 28 5.8Q4 12.6 259 20.9 231 92.3 28 7.7Q5 (highest) 13.7 279 22.5 246 93.0 33 7.0Community size (population)≥1,500,000 10.6 428 34.5 382 93.3 46 6.7100,000–1,499,999 12.1 474 38.2 422 93.4 52 6.6<100,000 14.7 338 27.3 285 91.2 53 8.8LHIN of residence1. Erie St. Clair 13.3 75 6.0 66 90.9 9 9.1
2. South West 14.5 125 10.1 115 94.1 10 5.9
3. Waterloo Wellington 12.0 69 5.6 * * * *
4. Hamilton Niagara Haldimand Brant 11.3 142 11.5 121 92.0 21 8.0
5. Central West 9.4 52 4.2 * * * *
6. Mississauga Halton 11.5 92 7.4 82 91.7 10 8.3
7. Toronto Central 9.1 92 7.4 77 92.2 15 7.8
8. Central 9.8 126 10.2 112 94.0 14 6.0
9. Central East 13.3 169 13.6 150 93.1 19 6.9
10. South East 12.4 60 4.8 47 89.8 13 10.2
11. Champlain 9.2 96 7.7 83 96.0 13 4.0
12. North Simcoe Muskoka 12.5 50 4.0 43 93.0 7 7.0
13. North East 12.2 65 5.2 57 96.6 8 3.4
14. North West 12.9 27 2.2 * * * *
1 Standardized to the 1991 Canadian census.2 Standardized to the Overall Salivary Gland Cancer Cohort.3 Sex-specific rates have been adjusted for age; age-specific rates have been adjusted for sex.

Institute for Clinical Evaluative Sciences94 Institute for Clinical Evaluative Sciences94
HEAD AND NECK CANCER SURGERY IN ONTARIO, 2003–2010 SURGERY FOR SALIVARY GLAND CANCER
EXHIBIT 4.1B Incidence of salivary gland cancer and use of surgery among men in the Overall Salivary Gland Cancer Cohort, by age group, neighbourhood income quintile, community size and Local Health Integration Network of residence, in Ontario, 2003 to 2010
Key Findings
• The findings shown in this exhibit are similar to those in Exhibit 4.1A; that is, both the incidence of salivary gland cancer and the proportion of men who had surgery were related to age.
• Among men in this cohort, those in the lowest income group had the lowest proportion of salivary gland cancer-related surgeries, including both definitive resection and adjunctive cancer procedures (82%).
• The incidence of salivary gland cancer was highest for men living in smaller communities at the time of their diagnosis (17 cases per 100,000 cumulative 8-year incidence).
• Men living in the Champlain LHIN at the time of their diagnosis were the most likely to have salivary gland cancer-related surgery (96%); those living in the South East LHIN were the least likely (85%).
Characteristic
Age-standardized1
Incidenceper 100,000
Overall Salivary Gland Cancer Cohort
Total Had surgery Did not have surgery
N % n
Age-standardized2
% of total n
Age-standardized2
% of total
Ontario 15.5 733 100.0 633 91.1 100 8.9
Age group,3 years18–54 2.6 199 27.1 185 93.0 14 7.055–64 12.5 149 20.3 131 87.9 18 12.165–69 11.4 57 7.8 49 86.0 8 14.070–74 20.8 76 10.4 69 90.8 7 9.2≥75 51.8 252 34.4 199 79.0 53 21.0Neighbourhood income quintileQ1 (lowest) 14.3 143 19.5 111 81.5 32 18.5Q2 10.6 113 15.4 104 98.7 9 1.3
Q3 16.4 164 22.4 143 92.8 21 7.2Q4 15.1 156 21.3 136 90.6 20 9.4Q5 (highest) 14.7 157 21.4 139 93.5 18 6.5Community size (population)≥1,500,000 11.7 233 31.8 203 90.6 30 9.4100,000–1,499,999 14.8 292 39.8 258 92.9 34 7.1<100,000 17.4 208 28.4 172 90.7 36 9.3
LHIN of residence1. Erie St. Clair 17.1 49 6.7 * * * *
2. South West 17.1 75 10.2 * * * *
3. Waterloo Wellington 12.6 37 5.0 * * * *
4. Hamilton Niagara Haldimand Brant 13.1 85 11.6 70 90.3 15 9.7
5. Central West 10.1 28 3.8 * * * *
6. Mississauga Halton 10.6 42 5.7 * * * *
7. Toronto Central 11.9 59 8.0 48 86.7 11 13.3
8. Central 11.0 70 9.5 60 92.7 10 7.3
9. Central East 15.3 98 13.4 86 92.0 12 8.0
10. South East 16.1 40 5.5 30 85.1 10 14.9
11. Champlain 12.1 63 8.6 54 96.4 9 3.6
12. North Simcoe Muskoka 11.7 26 3.5 * * * *
13. North East 17.0 44 6.0 37 94.6 7 5.4
14. North West 16.7 17 2.3 * * * *
1 Standardized to the 1991 Canadian census.2 Standardized to the Overall Salivary Gland Cancer Cohort.3 Age-specific rates have not been standardized.* In accordance with ICES policy, the exact number is suppressed when the cell size is <6, or when the cell size allows for a number of <6 to be calculated.

Institute for Clinical Evaluative Sciences 95Institute for Clinical Evaluative Sciences 95
HEAD AND NECK CANCER SURGERY IN ONTARIO, 2003–2010SURGERY FOR SALIVARY GLAND CANCER
EXHIBIT 4.1C Incidence of salivary gland cancer and use of surgery among women in the Overall Salivary Gland Cancer Cohort, by age group, neighbourhood income quintile, community size and Local Health Integration Network of residence, in Ontario, 2003 to 2010
Key Findings
• Salivary gland cancer incidence among Ontario women increased markedly with age from 2003 to 2010. The rate was highest among women aged 75 or older (15 cases per 100,000).
• The age-standardized incidence of salivary gland cancer ranged from a high of 13.3 per 100,000 in the North Simcoe Muskoka LHIN to a low of 6.4 per 100,000 in the Toronto Central LHIN.
• Salivary gland cancer incidence rates were highest for women living in smaller communities at the time of their diagnosis (an eight-year cumulative incidence rate of 12 cases per 100,000).
Characteristic
Age-standardized1
Incidenceper 100,000
Overall Salivary Gland Cancer Cohort
Total Had surgery Did not have surgery
N % n
Age-standardized2
% of total n
Age-standardized2
% of total
Ontario 9.7 507 100.0 456 94.6 51 5.4
Age group,3 years18–54 2.7 210 41.4 203 96.7 7 3.355–64 7.9 97 19.1 * * * *65–69 6 35 6.9 * * * *70–74 9.8 46 9.1 * * * *≥75 14.7 119 23.5 86 72.3 33 27.7Neighbourhood income quintileQ1 (lowest) 9.4 97 19.1 84 93.8 13 6.2Q2 8.5 89 17.6 81 95.5 8 4.5
Q3 9.6 96 18.9 89 95.6 7 4.4Q4 10.3 103 20.3 95 94.0 8 6.0Q5 (highest) 12.6 122 24.1 107 92.5 15 7.5Community size (population)≥1,500,000 9.5 195 38.5 179 95.8 16 4.2100,000–1,499,999 9.6 182 35.9 164 93.9 18 6.1<100,000 12 130 25.6 113 91.8 17 8.2LHIN of residence1. Erie St. Clair 9.7 26 5.1 * * * *
2. South West 12.0 50 9.9 * * * *
3. Waterloo Wellington 11.5 32 6.3 * * * *
4. Hamilton Niagara Haldimand Brant 9.5 57 11.2 51 93.6 6 6.4
5. Central West 8.6 24 4.7 * * * *
6. Mississauga Halton 12.4 50 9.9 * * * *
7. Toronto Central 6.4 33 6.5 * * * *
8. Central 8.7 56 11.0 * * * *
9. Central East 11.3 71 14.0 64 94.0 7 6.0
10. South East 8.8 20 3.9 * * * *
11. Champlain 6.5 33 6.5 * * * *
12. North Simcoe Muskoka 13.3 24 4.7 * * * *
13. North East 7.6 21 4.1 * * * *
14. North West 9.1 10 2.0 10 95.6 0 4.4
1 Standardized to the 1991 Canadian census.2 Standardized to the Overall Salivary Gland Cancer Cohort.3 Age-specific rates have not been standardized.* In accordance with ICES policy, the exact number is suppressed when the cell size is <6, or when the cell size allows for a number of <6 to be calculated.

Institute for Clinical Evaluative Sciences96 Institute for Clinical Evaluative Sciences96
HEAD AND NECK CANCER SURGERY IN ONTARIO, 2003–2010 SURGERY FOR SALIVARY GLAND CANCER
EXHIBIT 4.2A Health care services used by adults in the Salivary Gland Cancer Resection Cohort, by sex, age group, neighbourhood income quintile, community size, and Local Health Integration Network of residence and of treatment, in Ontario, 2003 to 2010
Key Findings
• Approximately 66% of hospital admissions for patients in the Salivary Gland Resection Cohort were for inpatient care; the remaining 34% were for ambulatory (same-day) care.
• Forty-six percent of patients in this cohort had more than one hospital admission in the year around their cancer diagnosis.
• Patients in this cohort had 3.9 visits, on average, with their treating surgeon in the year surrounding their salivary gland resection.
• Patients in this cohort undergoing a salivary gland resection procedure had an average hospital length of stay of 2.9 days.
• Patients treated in Local Health Integration Networks (LHINs) with lower case volumes were less likely to have had radiation therapy or chemotherapy before their surgical resection. Patients in these LHINs also had shorter lengths of stay for the resection procedure.

Institute for Clinical Evaluative Sciences 97Institute for Clinical Evaluative Sciences 97
HEAD AND NECK CANCER SURGERY IN ONTARIO, 2003–2010SURGERY FOR SALIVARY GLAND CANCER
EXHIBIT 4.2A continued
Characteristic Cohort, N
Patients who had surgical resection,
%
Patients with preoperative XRT or chemotherapy,
%
Visits with treating surgeon, avg per patient,1
n
Patients with more than one
hospital admission, %
Total hospital admissions,2
n
Hospital admissions, avg
per patient,2
n
Same-day surgery as % of total admissions
Inpatient admissions as
% of total admissions
Avg length of stay, days
Ontario 1,010 81.5 5.1 3.9 46.4 1,902 1.9 34.2 65.8 2.9Sex3
Female 424 83.6 2.4 4.0 40.8 717 1.7 31.5 68.5 2.0Male 586 79.9 7.2 3.8 50.5 1,185 2.0 35.9 64.1 3.6Age group,3 years18–54 374 91.4 1.6 3.8 32.1 557 1.5 28.9 71.1 1.555–64 204 82.9 3.4 4.0 41.2 384 1.9 29.9 70.1 2.765–69 77 83.7 * 3.7 46.8 144 1.9 34.7 65.3 2.570–74 99 81.1 9.1 4.0 56.6 211 2.1 43.1 56.9 3.0≥75 256 69.0 10.9 3.8 67.6 606 2.4 38.6 61.4 5.2Neighbourhood income quintileQ1 (lowest) 179 74.6 3.9 3.8 51.4 352 2.0 33.0 67.0 3.8Q2 169 83.7 5.9 4.0 47.9 336 2.0 35.1 64.9 3.1Q3 215 82.7 2.8 3.9 47.4 394 1.8 35.3 64.7 2.6Q4 215 83.0 4.7 4.0 38.1 369 1.7 34.7 65.3 2.5Q5 (highest) 232 83.2 8.2 3.8 48.3 451 1.9 33.3 66.7 2.7Community size (population)≥1,500,000 351 82.0 3.4 4.5 46.2 644 1.8 32.8 67.2 3.1100,000–1,499,999 392 82.7 6.4 3.6 46.9 752 1.9 37.0 63.0 2.8
<100,000 267 79.0 5.6 3.4 46.1 506 1.9 32.0 68.0 2.7
1 The time frame for surgeon visits was 6 months before to 6 months after the first surgery.2 The time frame for hospital admissions was 12 months before to 12 months after the first surgery.3 Standardized to the Overall Salivary Gland Cancer Cohort; sex-specific rates have been adjusted for age; age-specific rates have been adjusted for sex.* In accordance with ICES policy, the exact number is suppressed when the cell size is <6, or when the cell size allows for a number of <6 to be calculated.XRT = external beam radiotherapy; IQR = interquartile range.

Institute for Clinical Evaluative Sciences98 Institute for Clinical Evaluative Sciences98
HEAD AND NECK CANCER SURGERY IN ONTARIO, 2003–2010 SURGERY FOR SALIVARY GLAND CANCER
EXHIBIT 4.2A continued
Characteristic Cohort, N
Patients who had surgical
resection, %
Patients with preoperative XRT or chemotherapy,
%
Visits with treating surgeon, avg per patient,1
n
Patients with more than one
hospital admission, %
Total hospital admissions,2
n
Hospital admissions, avg
per patient,2
n
Same-day surgery as % of total
admissions
Inpatient admissions as
% of total admissions
Avg length of stay, days
LHIN of residence1. Erie St. Clair 60 80.0 * 3.7 51.7 126 2.1 35.7 64.3 3.82. South West 109 87.2 8.3 3.3 38.5 185 1.7 20.0 80.0 3.23. Waterloo Wellington 61 88.4 * 3.4 62.3 145 2.4 39.3 60.7 1.74. Hamilton Niagara Haldimand Brant 113 79.6 12.4 4.0 48.7 210 1.9 43.8 56.2 2.75. Central West * 88.5 0.0 4.7 41.3 77 1.7 31.2 68.8 2.56. Mississauga Halton 79 85.9 * 4.5 38.0 137 1.7 24.8 75.2 3.67. Toronto Central 67 72.8 * 4.1 61.2 144 2.1 31.9 68.1 3.98. Central 101 80.2 6.9 4.6 50.5 199 2.0 41.2 58.8 2.7
9. Central East 136 80.5 * 3.9 39.7 240 1.8 39.6 60.4 2.710. South East 43 71.7 * 2.2 32.6 67 1.6 20.9 79.1 3.111. Champlain 78 81.3 * 4.4 34.6 121 1.6 29.8 70.2 2.212. North Simcoe Muskoka 40 80.0 0.0 3.6 62.5 90 2.3 34.4 65.6 3.713. North East 55 84.6 * 3.0 58.2 114 2.1 35.1 64.9 2.314. North West * 81.5 * 4.1 45.5 47 2.1 38.3 61.7 3.2LHIN of treatment1. Erie St. Clair 22 ** 0.0 5.0 63.6 47 2.1 46.8 53.2 3.92. South West 160 ** 8.1 3.2 43.8 310 1.9 21.9 78.1 3.3
3. Waterloo Wellington 33 ** * 3.8 60.6 70 2.1 47.1 52.9 0.8
4. Hamilton Niagara Haldimand Brant 125 ** 11.2 3.9 48.0 229 1.8 45.0 55.0 2.9
5. Central West 28 ** 0.0 4.8 42.9 44 1.6 27.3 72.7 1.4
6. Mississauga Halton 55 ** * 4.7 30.9 89 1.6 20.2 79.8 2.2
7. Toronto Central 281 ** 4.6 3.9 52.0 581 2.1 35.8 64.2 4.3
A. University Health Network 165 ** * 3.2 53.3 350 2.1 34.0 66.0 5.0
B. Sunnybrook Health Sciences Centre 37 ** * 4.6 56.8 84 2.3 44.0 56.0 4.8
C. Mount Sinai Hospital 40 ** * 4.7 40.0 67 1.7 29.9 70.1 3.8
D. Other 39 ** 0.0 5.2 53.8 80 2.1 40.0 60.0 1.3
8. Central 33 ** 0.0 4.4 36.4 52 1.6 26.9 73.1 1.2
9. Central East 82 ** * 3.9 48.8 156 1.9 47.4 52.6 1.4
10. South East 27 ** * 2.2 29.6 42 1.6 23.8 76.2 2.0
11. Champlain 87 ** * 4.3 34.5 133 1.5 28.6 71.4 2.1
12. North Simcoe Muskoka 18 ** 0.0 3.7 61.1 35 1.9 34.3 65.7 1.7
13. North East 45 ** * 3.2 55.6 92 2.0 35.9 64.1 2.3
14. North West 14 ** 0.0 5.9 * 22 1.6 * * 2.0
1 The time frame for surgeon visits was 6 months before to 6 months after the first surgery.2 The time frame for hospital admissions was 12 months before to 12 months after the first surgery.3 Standardized to the Overall Salivary Gland Cancer Cohort; sex-specific rates have been adjusted for age; age-specific rates have been adjusted for sex.* In accordance with ICES policy, the exact number is suppressed when the cell size is <6, or when the cell size allows for a number of <6 to be calculated.* * A percentage could not be derived as it is difficult to determine the denominator of patients that presented to each treatment LHIN using administrative data.XRT = external beam radiotherapy; IQR = interquartile range.

Institute for Clinical Evaluative Sciences 99Institute for Clinical Evaluative Sciences 99
HEAD AND NECK CANCER SURGERY IN ONTARIO, 2003–2010SURGERY FOR SALIVARY GLAND CANCER
EXHIBIT 4.2B Health care services used by adults in the Salivary Gland Cancer Resection Cohort, by Local Health Integration Network of residence and of treatment, in Ontario, 2003 to 2010
Key Findings
• Patients treated by salivary gland resection had 1.2 emergency department visits, on average, in the 12 months before and 12 months after their definitive resection procedure.
• Patients treated by salivary gland resection received, on average, 11.4 days of Community Care Access Centre (CCAC) services in the 12 months before and 12 months after their definitive resection procedure. Across the Local Health Integration Networks (LHINs) of patient residence, the highest number of days of CCAC services rendered (20 days) was for patients from the Eric St. Clair LHIN at the time of diagnosis; the lowest number (5 days) was among those residing in the Mississauga Halton LHIN.
• Patients treated by salivary gland resection had very few days (0.3 days, on average) in the intensive care unit during their salivary gland resection admission. This varied by the LHIN of the treating institution, potentially reflecting differing sizes of tumours and variations in the complexity of procedures performed by different institutions.
• Nearly 8% of patients undergoing a salivary gland resection procedure in Ontario from 2003 to 2010 were readmitted within 30 days of discharge. Even among LHINs with the highest treatment volumes, there were variations in the readmission rate.

Institute for Clinical Evaluative Sciences100 Institute for Clinical Evaluative Sciences100
HEAD AND NECK CANCER SURGERY IN ONTARIO, 2003–2010 SURGERY FOR SALIVARY GLAND CANCER
EXHIBIT 4.2B continued
Characteristic Cohort, N
ED Visits CCAC Visits ICU Days Hospital Readmissions
nAvg1 per
patient, n nAvg1 per
patient, n nAvg1 per patient,n n
Patients readmitted
n %
Ontario 1,010 1,197 1.2 11,508 11.4 316 0.3 87 76 7.5
LHIN of residence1. Erie St. Clair 60 100 1.7 1,169 19.5 21 0.4 * * *
2. South West 109 154 1.4 1,613 14.8 63 0.6 13 10 9.2
3. Waterloo Wellington 61 64 1.0 562 9.2 39 0.6 * * *
4. Hamilton Niagara Haldimand Brant 113 138 1.2 1,536 13.6 13 0.1 13 11 9.7
5. Central West * 33 0.7 496 10.8 9 0.2 * * *
6. Mississauga Halton 79 63 0.8 363 4.6 8 0.1 * * *
7. Toronto Central 67 101 1.5 827 12.3 29 0.4 * * *
8. Central 101 80 0.8 798 7.9 35 0.3 * * *
9. Central East 136 135 1.0 1,157 8.5 32 0.2 17 17 12.5
10. South East 43 67 1.6 307 7.1 20 0.5 * * *
11. Champlain 78 101 1.3 1,167 15.0 9 0.1 * * *
12. North Simcoe Muskoka 40 58 1.5 517 12.9 7 0.2 * * *
13. North East 55 78 1.4 807 14.7 23 0.4 * * *
14. North West * 25 1.1 189 8.6 8 0.4 * * *
LHIN of treatment1. Erie St. Clair 22 21 1.0 98 4.5 12 0.5 * * *
2. South West 160 268 1.7 2,868 17.9 103 0.6 15 12 7.5
3. Waterloo Wellington 33 23 0.7 204 6.2 9 0.3 * * *
4. Hamilton Niagara Haldimand Brant 125 145 1.2 1,526 12.2 10 0.1 15 13 10.4
5. Central West 28 21 0.8 112 4.0 0 0.0 * * *
6. Mississauga Halton 55 33 0.6 243 4.4 6 0.1 * * *
7. Toronto Central 281 326 1.2 3,555 12.7 124 0.4 21 19 6.8
A. University Health Network 165 182 1.1 2,104 12.8 46 0.3 10 8 4.8
B. Sunnybrook Health Sciences Centre 37 44 1.2 633 17.1 51 1.4 * * *
C. Mount Sinai Hospital 40 66 1.7 691 17.3 22 0.6 * * *
D. Other 39 34 0.9 127 3.3 * * * * *
8. Central 33 12 0.4 64 1.9 * * 0 0 0.0
9. Central East 82 82 1.0 572 7.0 14 0.2 16 15 18.3
10. South East 27 29 1.1 205 7.6 6 0.2 * * *
11. Champlain 87 127 1.5 1,195 13.7 9 0.1 * * *
12. North Simcoe Muskoka 18 26 1.4 61 3.4 * * * * *
13. North East 45 72 1.6 779 17.3 20 0.4 * * *
14. North West 14 12 0.9 26 1.9 0 0.0 0 0 0.0
1 The denominator includes all patients in the Salivary Gland Cancer Resection Cohort.* In accordance with ICES policy, the exact number is suppressed when the cell size is <6, or when the cell size allows for a number of <6 to be calculated.ED = emergency department; CCAC = Community Care Access Centre; ICU = intensive care unit.

Institute for Clinical Evaluative Sciences 101Institute for Clinical Evaluative Sciences 101
HEAD AND NECK CANCER SURGERY IN ONTARIO, 2003–2010SURGERY FOR SALIVARY GLAND CANCER
EXHIBIT 4.3 Hospital admissions for salivary gland surgery among adults in the Salivary Gland Cancer Resection Cohort in the 12 months before and 12 months after their diagnosis, by Local Health Integration Network of residence and of treatment, in Ontario, 2003 to 2010
Key Findings
• Nearly two-thirds of salivary gland resections were performed in the Local Health Integration Networks (LHINs) where patients resided at the time they were diagnosed (exact number not shown due to suppression of small cells).
• Approximately 21% of salivary gland resection procedures done in hospitals in the Toronto Central LHIN were performed on patients who lived in the LHIN when their cancers were diagnosed. The majority of salivary gland resection procedures performed in Toronto Central LHIN hospitals involved patients who lived in other LHINs, such as the Central LHIN (24%) and the Central East LHIN (21%).
• Across the province, 56% of salivary gland resection procedures received by patients in this study cohort were done in hospitals in the South West, Hamilton Niagara Haldimand Brant, and Toronto Central LHINs (exact numbers not shown due to suppression of small cells).

Institute for Clinical Evaluative Sciences102 Institute for Clinical Evaluative Sciences102
HEAD AND NECK CANCER SURGERY IN ONTARIO, 2003–2010 SURGERY FOR SALIVARY GLAND CANCER
EXHIBIT 4.3 continued
LHIN of Residence
LHIN of Treatment
Ontario1. Erie St.
Clair2. South
West3. Waterloo Wellington
4. Hamilton Niagara
Haldimand Brant
5. Central West
6. Mississauga Halton
7. Toronto Central 8. Central
9. Central East
10. South East 11. Champlain
12. North Simcoe
Muskoka13. North
East14. North
West
Admissions, n (Column %, Row %)1
1. Erie St. Clair * 36(60.0, 22.5) * 60
(5.9, 100.0)
2. South West 104(95.4, 65.0) * * * * 109
(10.8, 100.0)
3. Waterloo Wellington
15(24.6, 9.4)
30(49.2, 90.9)
10(16.4, 8.0) * * 61
(6.0, 100.0)
4. Hamilton Niagara Haldimand Brant * 105
(92.9, 84.0) * * 113(11.2, 100.0)
5. Central West 21(45.7, 75.0)
8(17.4, 14.6)
12(26.1, 4.3) * * *
6. Mississauga Halton * * * 41
(51.9, 74.6)25
(31.7, 8.9) * * 79(7.8, 100.0)
7. Toronto Central * 59(88.1, 21.0) * * 67
(6.6, 100.0)
8. Central * * * 68(67.3, 24.2)
21(20.8, 63.6) * 101
(10.0, 100.0)
9. Central East * 58(42.7, 20.6) * 71
(52.2, 86.6) * * 136(13.5, 100.0)
10. South East * 9(20.9, 3.2) * * 19
(63.3, 100.0) * 43(4.3, 100.0)
11. Champlain * * 78(7.7, 100.0)
12. North Simcoe Muskoka * 21
(52.5, 7.5) * 40(4.0, 100.0)
13. North East 7(12.7, 2.5) * * 45
(81.8, 100.0)55
(5.5, 100.0)
14. North West * * *
Ontario * 160(100.0, 15.8)
33100.0, 3.3)
125(100.0, 12.4)
28(100.0, 2.8)
55(100.0, 5.5)
281(100.0, 27.8)
33(100.0, 3.3)
82(100.0, 8.1)
27(100.0, 2.7)
87(100.0, 8.6) * 45
(100.0, 4.5) * 1,010(100.0, 100.0)
1 Column % = the proportion of patients having salivary gland cancer surgery in a given LHIN who were residents of that LHIN when diagnosed, and the proportion who were residents of other LHINs. Row % = the proportion of patients having salivary gland cancer surgery in a given LHIN who had surgery in their LHIN of residence, and the proportion who had the surgery in other LHINs.
* In accordance with ICES policy, the exact number is suppressed when the cell size is <6, or when the cell size allows for a number of <6 to be calculated. Totals may not sum due to small-cell suppression.

Institute for Clinical Evaluative Sciences 103Institute for Clinical Evaluative Sciences 103
HEAD AND NECK CANCER SURGERY IN ONTARIO, 2003–2010SURGERY FOR SALIVARY GLAND CANCER
EXHIBIT 4.4 Type of definitive resection procedure among adults in the Salivary Gland Cancer Resection Cohort, by sex, age group, neighbourhood income quintile, community size, and Local Health Integration Network of residence and of treatment, in Ontario, 2003 to 2010
Key Findings
• With increasing age, patients were more likely to have a total or radical resection. For example, 62% of patients aged 75 or older received a total or radical resection, while 45% of those aged 18–54 received the same procedure. This could be a reflection of more advanced disease in the older population.
• Among patients in the Salivary Gland Resection Cohort, the type of procedure performed was not related to neighbourhood income or community size.
• Local Health Integration Networks with higher treatment volumes were more likely to perform a total or radical resection on the Salivary Gland Resection Cohort.
Characteristic Cohort, N
Definitive Resection Procedure
Partial or Subtotal Resection Total or Radical Resection
n % n %
Ontario 1,010 483 47.8 527 52.2
SexFemale 424 221 52.1 203 47.9
Male 586 262 44.7 324 55.3
Age group,3 years18–54 374 205 54.8 169 45.2
55–64 204 102 50.0 102 50.0
65–69 77 38 49.4 39 50.6
70–74 99 40 40.4 59 59.6
≥75 256 98 38.3 158 61.7
Neighbourhood income quintileQ1 (lowest) 179 83 46.4 96 53.6
Q2 169 84 49.7 85 50.3
Q3 215 104 48.4 111 51.6
Q4 215 103 47.9 112 52.1
Q5 (highest) 232 109 47.0 123 53.0
Community size (population)≥1,500,000 351 163 46.4 188 53.6
100,000–1,499,999 392 196 50.0 196 50.0
<100,000 267 124 46.4 143 53.6

Institute for Clinical Evaluative Sciences104 Institute for Clinical Evaluative Sciences104
HEAD AND NECK CANCER SURGERY IN ONTARIO, 2003–2010 SURGERY FOR SALIVARY GLAND CANCER
EXHIBIT 4.4 continued
Characteristic Cohort, N
Definitive Resection Procedure
Partial or Subtotal Resection Total or Radical Resection
n % n %
LHIN of residence 1. Erie St. Clair 60 26 43.3 34 56.7
2. South West 109 48 44.0 61 56.0
3. Waterloo Wellington 61 30 49.2 31 50.8
4. Hamilton Niagara Haldimand Brant 113 68 60.2 45 39.8
5. Central West * * 45.7 * 54.3
6. Mississauga Halton 79 36 45.6 43 54.4
7. Toronto Central 67 33 49.3 34 50.7
8. Central 101 42 41.6 59 58.4
9. Central East 136 74 54.4 62 45.6
10. South East 43 18 41.9 25 58.1
11. Champlain 78 30 38.5 48 61.5
12. North Simcoe Muskoka 40 22 55.0 18 45.0
13. North East 55 22 40.0 33 60.0
14. North West * * 59.1 * 40.9
LHIN of treatment1. Erie St. Clair * * * * *
2. South West 160 62 38.8 98 61.3
3. Waterloo Wellington 33 20 60.6 13 39.4
4. Hamilton Niagara Haldimand Brant 125 79 63.2 46 36.8
5. Central West 28 12 42.9 16 57.1
6. Mississauga Halton 55 30 54.5 25 45.5
7. Toronto Central 281 106 37.7 175 62.3
A. University Health Network 165 48 29.1 117 70.9
B. Sunnybrook Health Sciences Centre 37 14 37.8 23 62.2
C. Mount Sinai Hospital 40 23 57.5 17 42.5
D. Other 39 21 53.8 18 46.2
8. Central 33 14 42.4 19 57.6
9. Central East 82 54 65.9 28 34.1
10. South East 27 15 55.6 12 44.4
11. Champlain 87 35 40.2 52 59.8
12. North Simcoe Muskoka * * * * *
13. North East 45 18 40.0 27 60.0
14. North West * * * * *
* In accordance with ICES policy, the exact number is suppressed when the cell size is <6, or when the cell size allows for a number of <6 to be calculated.

Institute for Clinical Evaluative Sciences 105Institute for Clinical Evaluative Sciences 105
HEAD AND NECK CANCER SURGERY IN ONTARIO, 2003–2010SURGERY FOR SALIVARY GLAND CANCER
EXHIBIT 4.5 Proportion of adults in the Overall Salivary Gland Cancer Cohort who received a salivary gland resection as a definitive procedure, by Local Health Integration Network of residence, in Ontario, 2003 to 2010
Key Finding
• The proportion of patients in this cohort who received a salivary gland resection in the 12 months following their diagnosis varied according to their Local Health Integration Network (LHIN) of residence at the time of diagnosis. It ranged from a high of 89% of patients living in the Central West LHIN to a low of 72% of those living in the South East LHIN.
CharacteristicCohort,
N
Salivary Gland Resection
LHIN Rate vs. Ontario Rate1
Patients receiving, n
Patients receiving, %
Ontario 1,240 1,011 81.5 0.0
LHIN of residence1. Erie St. Clair 75 60 80.0 -1.8
2. South West 125 109 87.2 7.0
3. Waterloo Wellington 69 61 88.4 8.5
4. Hamilton Niagara Haldimand Brant 142 113 79.6 -2.3
5. Central West * * 88.5 8.6
6. Mississauga Halton 92 79 85.9 5.4
7. Toronto Central 92 67 72.8 -10.7
8. Central 126 101 80.2 -1.6
9. Central East 169 137 81.1 -0.5
10. South East 60 43 71.7 -12.0
11. Champlain 96 78 81.3 -0.2
12. North Simcoe Muskoka 50 40 80.0 -1.8
13. North East 65 55 84.6 3.8
14. North West * * 81.5 0.0
1 Ontario rate = 81.5%* In accordance with ICES policy, the exact number is suppressed when the cell size is <6, or when the cell size allows for a number of <6 to be calculated.

Institute for Clinical Evaluative Sciences106 Institute for Clinical Evaluative Sciences106
HEAD AND NECK CANCER SURGERY IN ONTARIO, 2003–2010 SURGERY FOR SALIVARY GLAND CANCER
EXHIBIT 4.6A Overall pattern of surgical care provided to adults in the Salivary Gland Cancer Resection Cohort, by physician specialty, in Ontario, 2003 to 2010
Key Findings
• General surgeons accounted for 16% of physicians providing salivary gland resection in Ontario during the study period. They performed a disproportionately low proportion (9%) of all salivary gland resection procedures on the cohort. Similar trends were observed for plastic surgeons who performed resections on less than 1% of the cohort.
• General surgeons were more likely to perform partial or subtotal resections; otolaryngology‒head and neck surgeons were more likely to perform total or radical resections.
• The majority (91%) of patients were treated by otolaryngology‒head and neck surgeons.
Physician Specialty
Physicians Performing Salivary Gland Cancer Surgery Surgeries Performed Patients Treated
Definitive Procedure
Partial or Subtotal Resection Total or Radical Resection
n % n % n % n % n %
Ontario 134 100.0 941 100.0 941 100.0 431 45.8 510 54.2
Otolaryngology 107 79.9 854 90.8 854 90.8 54 67.5 * *
General surgery 21 15.7 80 8.5 80 8.5 371 43.4 483 56.6
Plastic surgery 6 4.5 7 0.7 7 0.7 6 85.7 * *
* In accordance with ICES policy, the exact number is suppressed when the cell size is <6, or when the cell size allows for a number of <6 to be calculated.

Institute for Clinical Evaluative Sciences 107Institute for Clinical Evaluative Sciences 107
HEAD AND NECK CANCER SURGERY IN ONTARIO, 2003–2010SURGERY FOR SALIVARY GLAND CANCER
EXHIBIT 4.6B Overall pattern of surgical care provided to adults in the Salivary Gland Cancer Resection Cohort, by hospital type, in Ontario, 2003 to 2010
Key Findings
• Head and neck cancer centres accounted for 15% of the hospitals providing salivary gland resections in Ontario during the study period; however, these nine hospitals performed 57% of all salivary gland resections in this cohort.
• Patients undergoing resection for salivary gland cancer at a designated head and neck cancer centre were more likely to have a total/radical resection compared with those who received care at other hospitals.
Hospital Type
Hospitals Performing Oral Cavity Cancer Surgery Surgeries Performed Patients Treated
Definitive Procedure
Partial or Subtotal Resection Total or Radical Resection
n % n % n % n % n %
Ontario 62 100.0 1,010 100.0 1,010 100.0 483 47.8 527 52.2
Head and neck cancer centre 9 14.5 580 57.4 580 57.4 230 39.7 350 60.3
Other hospital 53 85.5 430 42.6 430 42.6 253 58.8 177 41.2

Institute for Clinical Evaluative Sciences108 Institute for Clinical Evaluative Sciences108
HEAD AND NECK CANCER SURGERY IN ONTARIO, 2003–2010 SURGERY FOR SALIVARY GLAND CANCER
EXHIBIT 4.7A Diagnostic and adjunctive procedures received by adults in the Salivary Gland Cancer Resection Cohort in the 12 months before and 12 months after their definitive surgery, by Local Health Integration Network of residence and of treatment, in Ontario, 2003 to 2010
Key Findings
• On average, patients in the Salivary Gland Resection Cohort received 0.1 panendoscopies and 0.1 other endoscopies (bronchoscopy or esophagoscopy) in the year before and after their definitive surgery.
• Only 25% of the patients who underwent a resection received a fine-needle aspiration biopsy of the head and neck prior to their surgery.
• Neck dissections were performed on 49% of patients. There was considerable variability across LHINs of patient residence and LHINs where care was received. Use was the lowest for patients living in the South East LHIN at the time of diagnosis (37%). Among the LHINs with head and neck cancer treatment centres, the South East LHIN also had the lowest rate of neck dissections (19%). This may indicate differences in case-mix between the sites. Often, early-stage tumours do not warrant a neck dissection if there is no evidence of disease in the neck after a thorough examination by the doctor and after appropriate radiological imaging of the neck. This could also be a reflection of variations in availability or use of fine-needle aspiration biopsy preoperatively and whether this was diagnostic or not.
• Nine percent of patients who underwent a resection received a free flap within the two-year period surrounding the definitive procedure. This rate varied by LHIN of residence and LHIN of treatment. Among LHINs of treatment that had head and neck cancer treatment centres, patients in the South East LHIN were least likely to receive a free flap (0%).
• In the year before and after their salivary gland resection, 15% of patients received a facial reanimation procedure. This procedure is used for patients in whom the tumour has injured the nerve controlling the muscles of the face or in cases where this nerve was injured or removed during the resection. Patients receiving treatment at the South West and Toronto Central LHINs were most likely to receive the procedure. This likely indicates the greater complexity of cases being treated at these high-volume LHINs/institutions.

Institute for Clinical Evaluative Sciences 109Institute for Clinical Evaluative Sciences 109
HEAD AND NECK CANCER SURGERY IN ONTARIO, 2003–2010SURGERY FOR SALIVARY GLAND CANCER
EXHIBIT 4.7A continued
CharacteristicCohort,
N
Panendoscopy Other Endoscopy Oral Cavity Biopsy Neck Open Biopsy Fine-Needle Aspiration Biopsy
nAvg1 per
patient, n nAvg1 per
patient, n nAvg1 per
patient, n nAvg1 per
patient, n nAvg1 per
patient, n
Ontario 1,010 52 0.1 95 0.1 43 0.0 148 0.1 326 0.3
LHIN of residence1. Erie St. Clair 60 * * * * * * 12 0.2 16 0.3
2. South West 109 * * * * * * 13 0.1 48 0.4
3. Waterloo Wellington 61 * * * * 0 0.0 12 0.2 21 0.3
4. Hamilton Niagara Haldimand Brant 113 * * 18 0.2 * * 9 0.1 62 0.5
5. Central West * 6 0.1 10 0.2 6 0.1 10 0.2 24 0.5
6. Mississauga Halton 79 * * * * 8 0.1 12 0.2 16 0.2
7. Toronto Central 67 * * * * * * 7 0.1 19 0.3
8. Central 101 8 0.1 15 0.1 * * 18 0.2 27 0.3
9. Central East 136 8 0.1 * * * * 22 0.2 30 0.2
10. South East 43 0 0.0 * * 0 0.0 6 0.1 * *
11. Champlain 78 * * * * * * 15 0.2 15 0.2
12. North Simcoe Muskoka 40 * * 6 0.2 * * * * 20 0.5
13. North East 55 * * 8 0.1 7 0.1 6 0.1 6 0.1
14. North West * * * 9 0.4 * * * * 18 0.8
LHIN of treatment1. Erie St. Clair * 0 0.0 * * * * * * * *
2. South West 160 * * 7 0.0 * * 24 0.2 65 0.4
3. Waterloo Wellington 33 0 0.0 * * 0 0.0 * * 7 0.2
4. Hamilton Niagara Haldimand Brant 125 * * 19 0.2 6 0.0 13 0.1 75 0.6
5. Central West 28 * * * * * * * * 19 0.7
6. Mississauga Halton 55 * * * * 6 0.1 6 0.1 * *
7. Toronto Central 281 27 0.1 35 0.1 13 0.0 51 0.2 99 0.4
A. University Health Network 165 19 0.1 23 0.1 12 0.1 22 0.1 85 0.5
B. Sunnybrook Health Sciences Centre 37 * * * * 0 0.0 14 0.4 * *
C. Mount Sinai Hospital 40 * * * * 0 0.0 10 0.3 * *
D. Other 39 * * * * * * * * 9 0.2
8. Central 33 0 0.0 7 0.2 0 0.0 13 0.4 * *
9. Central East 82 * * * * * * 7 0.1 16 0.2
10. South East 27 0 0.0 * * 0 0.0 * * 0 0.0
11. Champlain 87 * * * * * * 17 0.2 15 0.2
12. North Simcoe Muskoka * * * * * 0 0.0 0 0.0 * 0.7
13. North East 45 * * 6 0.1 6 0.1 * * * *
14. North West * * * * * 0 0.0 * * * 0.6
1 The denominator includes all patients in the Salivary Gland Cancer Resection Cohort.* In accordance with ICES policy, the exact number is suppressed when the cell size is <6, or when the cell size allows for a number of <6 to be calculated.

Institute for Clinical Evaluative Sciences110 Institute for Clinical Evaluative Sciences110
HEAD AND NECK CANCER SURGERY IN ONTARIO, 2003–2010 SURGERY FOR SALIVARY GLAND CANCER
EXHIBIT 4.7A continued
Characteristic
Neck Dissection Free Flap Reconstructive Procedure Tracheostomy Gastrostomy Tube
nAvg1 per
patient, nPatients
receiving, % nAvg1 per
patient, nPatients
receiving, % nAvg1 per
patient, n nAvg1 per
patient, n nAvg1 per
patient, n
Ontario 550 0.5 49.2 98 0.1 9.3 298 0.3 16 0.0 31 0.0
LHIN of residence1. Erie St. Clair 30 0.5 50.0 8 0.1 13.3 14 0.2 * * * *
2. South West 58 0.5 47.7 11 0.1 9.2 32 0.3 * * * *
3. Waterloo Wellington 30 0.5 47.5 6 0.1 8.2 20 0.3 0 0.0 * *
4. Hamilton Niagara Haldimand Brant 56 0.5 46.9 * * * 23 0.2 * * 6 0.1
5. Central West 21 0.5 43.5 * * * 13 0.3 * * * *
6. Mississauga Halton 50 0.6 53.2 7 0.1 8.9 28 0.4 0 0.0 * *
7. Toronto Central 42 0.6 56.7 7 0.1 9.0 19 0.3 * * * *
8. Central 65 0.6 58.4 15 0.1 14.9 45 0.4 * * * *
9. Central East 77 0.6 44.9 21 0.2 14.7 44 0.3 * * * *
10. South East 17 0.4 37.2 6 0.1 14.0 8 0.2 0 0.0 * *
11. Champlain 34 0.4 39.7 * * * 11 0.1 * * 0 0.0
12. North Simcoe Muskoka 26 0.7 62.5 * * * 11 0.3 * * * *
13. North East 33 0.6 56.4 * * * 26 0.5 0 0.0 0 0.0
14. North West 11 0.5 45.5 * * * * * 0 0.0 * *
LHIN of treatment1. Erie St. Clair * 0.3 27.3 0 0.0 0.0 * * 0 0.0 * *
2. South West 90 0.6 52.5 21 0.1 12.5 51 0.3 * * * *
3. Waterloo Wellington 8 0.2 21.2 * * * 6 0.2 0 0.0 0 0.0
4. Hamilton Niagara Haldimand Brant 66 0.5 50.4 * * * 26 0.2 * * 8 0.1
5. Central West 9 0.3 28.6 0 0.0 0.0 8 0.3 0 0.0 0 0.0
6. Mississauga Halton 31 0.6 43.6 0 0.0 0.0 10 0.2 0 0.0 * *
7. Toronto Central 225 0.8 73.3 59 0.2 20.3 133 0.5 6 0.0 13 0.0
A. University Health Network 149 0.9 83.6 41 0.2 23.6 82 0.5 * * 9 0.1
B. Sunnybrook Health Sciences Centre 37 1.0 86.5 13 0.4 35.1 31 0.8 0 0.0 0 0.0
C. Mount Sinai Hospital 26 0.7 60 * * * 7 0.2 * * * *
D. Other 13 0.3 30.8 0 0.0 0.0 13 0.3 0 0.0 * *
8. Central 6 0.2 18.2 * * * 11 0.3 0 0.0 0 0.0
9. Central East 31 0.4 28.0 6 0.1 7.3 14 0.2 * * 0 0.0
10. South East 6 0.2 18.5 0 0.0 0.0 0 0.0 0 0.0 0 0.0
11. Champlain 38 0.4 40.2 * * * 12 0.1 * * 0 0.0
12. North Simcoe Muskoka * 0.3 27.8 0 0.0 0.0 * * 0 0.0 0 0.0
13. North East 25 0.6 51.1 * * * 23 0.5 0 0.0 0 0.0
14. North West * * * * * * * * 0 0.0 * *
1 The denominator includes all patients in the Salivary Gland Cancer Resection Cohort.* In accordance with ICES policy, the exact number is suppressed when the cell size is <6, or when the cell size allows for a number of <6 to be calculated.

Institute for Clinical Evaluative Sciences 111Institute for Clinical Evaluative Sciences 111
HEAD AND NECK CANCER SURGERY IN ONTARIO, 2003–2010SURGERY FOR SALIVARY GLAND CANCER
EXHIBIT 4.7B Radiologic services received by adults in the Salivary Gland Cancer Resection Cohort in the 12 months before and 12 months after their definitive surgery, by Local Health Integration Network of residence and of treatment, in Ontario, 2003 to 2010
Key Findings
• The major modality used to image the head and neck in the Salivary Gland Resection Cohort was the computed tomography (CT) scan. On average, more than one (1.3) CT scan was performed per patient within the two-year period surrounding the patients’ definitive salivary gland resection procedure. Head and neck ultrasound imaging was also used on many patients (0.8 per patient).
• A significant number of chest X-rays (2.1 per patient on average) and CT scans of the chest (0.7 per patient) were done on patients in this cohort.
• Other less common imaging tests undergone by patients in this study cohort included abdominal CT scans and abdominal ultrasound (each averaging 0.3 per patient).
• Magnetic resonance imaging (MRI) was infrequently used to diagnose or stage salivary gland cancer in this cohort (an average of 0.6 per patient).
• Nearly 87% of patients in the resection cohort received some form of head and neck imaging prior to their definitive surgical resection. As the standard of care is some form of imaging, preferably CT or MRI, before surgical resection, this proportion was lower than expected.
• Bone scans were performed infrequently in this cohort (98 scans, an average of 0.1 per patient).

Institute for Clinical Evaluative Sciences112 Institute for Clinical Evaluative Sciences112
HEAD AND NECK CANCER SURGERY IN ONTARIO, 2003–2010 SURGERY FOR SALIVARY GLAND CANCER
EXHIBIT 4.7B continued
CharacteristicCohort,
N
Head and Neck Chest Abdomen
Ultrasound CT Scan MRI Scan X-Ray CT Scan Ultrasound CT Scan
nAvg1 per
patient, n nAvg1 per
patient, n nAvg1 per
patient, n nAvg1 per
patient, n nAvg1 per
patient, n nAvg1 per
patient, n nAvg1 per
patient, n
Ontario 1,010 759 0.8 1,318 1.3 624 0.6 2,089 2.1 660 0.7 296 0.3 300 0.3
LHIN of residence1. Erie St. Clair 60 52 0.9 89 1.5 22 0.4 169 2.8 27 0.5 23 0.4 16 0.3
2. South West 109 74 0.7 110 1.0 44 0.4 217 2.0 60 0.6 15 0.1 23 0.2
3. Waterloo Wellington 61 52 0.9 80 1.3 23 0.4 152 2.5 43 0.7 21 0.3 19 0.3
4. Hamilton Niagara Haldimand Brant 113 58 0.5 119 1.1 56 0.5 243 2.2 57 0.5 26 0.2 32 0.3
5. Central West * 46 1.0 55 1.2 31 0.7 74 1.6 32 0.7 18 0.4 14 0.3
6. Mississauga Halton 79 76 1.0 105 1.3 61 0.8 130 1.6 42 0.5 21 0.3 18 0.2
7. Toronto Central 67 49 0.7 101 1.5 57 0.9 175 2.6 50 0.7 25 0.4 15 0.2
8. Central 101 58 0.6 139 1.4 81 0.8 238 2.4 75 0.7 51 0.5 38 0.4
9. Central East 136 136 1.0 174 1.3 105 0.8 219 1.6 98 0.7 32 0.2 39 0.3
10. South East 43 35 0.8 57 1.3 36 0.8 101 2.3 22 0.5 10 0.2 15 0.3
11. Champlain 78 45 0.6 98 1.3 35 0.4 115 1.5 39 0.5 22 0.3 20 0.3
12. North Simcoe Muskoka 40 34 0.9 60 1.5 33 0.8 79 2.0 38 1.0 12 0.3 19 0.5
13. North East 55 33 0.6 93 1.7 25 0.5 126 2.3 54 1.0 11 0.2 20 0.4
14. North West * 11 0.5 38 1.7 15 0.7 51 2.3 23 1.0 9 0.4 12 0.5
LHIN of treatment1. Erie St. Clair * 25 1.1 29 1.3 * * 72 3.3 6 0.3 9 0.4 6 0.3
2. South West 160 114 0.7 204 1.3 62 0.4 390 2.4 95 0.6 40 0.3 46 0.3
3. Waterloo Wellington 33 24 0.7 25 0.8 14 0.4 53 1.6 13 0.4 9 0.3 * *
4. Hamilton Niagara Haldimand Brant 125 68 0.5 144 1.2 56 0.4 286 2.3 64 0.5 32 0.3 34 0.3
5. Central West 28 27 1.0 23 0.8 15 0.5 41 1.5 18 0.6 9 0.3 * *
6. Mississauga Halton 55 55 1.0 58 1.1 39 0.7 71 1.3 25 0.5 15 0.3 10 0.2
7. Toronto Central 281 225 0.8 442 1.6 275 1.0 685 2.4 268 1.0 105 0.4 114 0.4
A. University Health Network 165 121 0.7 267 1.6 170 1.0 367 2.2 163 1.0 49 0.3 68 0.4
B. Sunnybrook Health Sciences Centre 37 26 0.7 60 1.6 19 0.5 106 2.9 32 0.9 18 0.5 15 0.4
C. Mount Sinai Hospital 40 46 1.2 67 1.7 55 1.4 142 3.6 42 1.1 24 0.6 19 0.5
D. Other 39 32 0.8 48 1.2 31 0.8 70 1.8 31 0.8 14 0.4 12 0.3
8. Central 33 29 0.9 42 1.3 19 0.6 38 1.2 9 0.3 11 0.3 8 0.2
9. Central East 82 71 0.9 91 1.1 47 0.6 130 1.6 40 0.5 17 0.2 12 0.1
10. South East 27 25 0.9 32 1.2 19 0.7 32 1.2 15 0.6 * * 14 0.5
11. Champlain 87 50 0.6 110 1.3 41 0.5 128 1.5 44 0.5 26 0.3 22 0.3
12. North Simcoe Muskoka * * * 18 1.0 10 0.6 27 1.5 8 0.4 6 0.3 * *
13. North East 45 23 0.5 76 1.7 12 0.3 112 2.5 43 1.0 8 0.2 17 0.4
14. North West * * * 24 1.7 * * 24 1.7 12 0.9 * * * *
1 The denominator includes all patients in the Salivary Gland Cancer Resection Cohort.* In accordance with ICES policy, the exact number is suppressed when the cell size is <6, or when the cell size allows for a number of <6 to be calculated. CT = computed tomography; MRI = magnetic resonance imaging.

Institute for Clinical Evaluative Sciences 113Institute for Clinical Evaluative Sciences 113
HEAD AND NECK CANCER SURGERY IN ONTARIO, 2003–2010SURGERY FOR SALIVARY GLAND CANCER
EXHIBIT 4.7C Consultations and services received by adults in the Salivary Gland Cancer Resection Cohort in the 12 months before and 12 months after their definitive surgery, by Local Health Integration Network of residence and of treatment, in Ontario, 2003 to 2010
Key Findings
• Approximately 72% of all patients in the Salivary Gland Resection Cohort saw a radiation oncologist during the 12 months before and after their definitive salivary gland resection procedure. About 59% of this study cohort received radiation therapy as part of their treatment.
• Rates of referral to a radiation oncologist were lowest among patients who lived in the South West Local Health Integration Network (LHIN) at the time of their diagnosis (66%). Patients who lived in the North East LHIN at the time of their diagnosis had the highest referral rate to radiation oncology (82%).
• More than a third (37%) of patients in this cohort were seen by a medical oncologist during the 24 months surrounding their definitive salivary gland resection. This rate ranged from a low of 21% among people who resided in the South East LHIN at the time of diagnosis to a high of 55% among those living in the Erie St. Clair LHIN.
• Six percent of patients in this cohort received chemotherapy as part of their treatment for salivary gland cancer.
• On average, patients in the cohort visited surgeons 8.1 times in the 12 months before and 12 months after their definitive salivary gland resection.
• Seven percent of patients in the cohort received a palliative care consultation in the 12 months before and 12 months after their definitive salivary gland resection. The highest rate (13%) was observed among those living in the Waterloo Wellington LHIN at the time of diagnosis.

Institute for Clinical Evaluative Sciences114 Institute for Clinical Evaluative Sciences114
HEAD AND NECK CANCER SURGERY IN ONTARIO, 2003–2010 SURGERY FOR SALIVARY GLAND CANCER
EXHIBIT 4.7C continued
CharacteristicCohort,
N
Radiation OncologyConsultations Radiation Therapy
Medical Oncology Consultations Chemotherapy
SurgeryConsultation
Palliative CareConsultations
Patients receiving, %
Avg1 per patient, n
Patients receiving, %
Avg1 per patient, n
Patients receiving, %
Avg1 per patient, n
Patients receiving, %
Avg1 per patient, n
Patients receiving, %
Avg1 per patient, n
Patients receiving, %
Ontario 1,010 72.2 0.8 59.3 0.7 36.5 0.6 6.1 0.4 99.6 8.1 7.2
LHIN of residence1. Erie St. Clair 60 70.0 0.9 56.7 0.6 55.0 0.8 11.7 1.3 100.0 7.7 *
2. South West 109 66.1 0.8 55.0 0.8 53.2 1.0 10.1 0.6 100.0 7.7 *
3. Waterloo Wellington 61 72.1 0.9 55.7 0.7 44.3 0.7 9.8 0.7 100.0 7.3 13.1
4. Hamilton Niagara Haldimand Brant 113 74.3 0.8 57.5 0.7 38.1 0.7 6.2 0.4 100.0 7.5 8.0
5. Central West * 73.9 0.8 60.9 0.9 30.4 0.5 * 0.5 100.0 9.8 *
6. Mississauga Halton 79 69.6 0.7 46.8 0.5 29.1 0.4 * 0.4 100.0 8.5 *
7. Toronto Central 67 71.6 0.7 62.7 0.8 44.8 1.0 * 0.1 97.0 8.4 *
8. Central 101 79.2 1.0 62.4 0.7 29.7 0.6 5.9 0.4 100.0 9.6 5.9
9. Central East 136 72.1 0.8 61.0 0.7 29.4 0.5 * 0.4 99.3 7.9 6.6
10. South East 43 67.4 0.9 46.5 0.6 20.9 0.3 0.0 0.0 97.7 5.1 *
11. Champlain 78 66.7 0.8 65.4 0.8 25.6 0.4 * 0.1 100.0 8.7 9.0
12. North Simcoe Muskoka 40 75.0 0.9 67.5 0.8 45.0 0.8 * 0.2 100.0 10.4 *
13. North East 55 81.8 1.0 69.1 0.8 32.7 0.5 * 0.3 100.0 7.2 *
14. North West * 72.7 0.8 77.3 0.8 27.3 0.4 * 0.9 100.0 8.5 *
LHIN of treatment1. Erie St. Clair * 68.2 0.7 40.9 0.4 31.8 0.5 0.0 0.0 100.0 7.5 *
2. South West 160 67.5 0.9 58.8 0.8 60.0 1.1 13.1 1.1 100.0 7.5 8.8
3. Waterloo Wellington 33 63.6 0.7 42.4 0.5 21.2 0.3 * 0.2 100.0 7.5 0.0
4. Hamilton Niagara Haldimand Brant 125 73.6 0.9 55.2 0.7 39.2 0.6 8.0 0.5 100.0 7.6 8.8
5. Central West 28 60.7 0.7 50.0 0.8 35.7 0.4 * 0.5 100.0 9.1 *
6. Mississauga Halton 55 61.8 0.7 50.9 0.7 21.8 0.3 * 0.1 100.0 8.3 *
7. Toronto Central 281 82.9 1.0 69.4 0.9 36.7 0.7 6.0 0.3 99.6 9.3 8.2
A. University Health Network 165 83.0 0.9 69.7 0.9 33.3 0.6 6.7 0.3 100.0 8.8 8.5
B. Sunnybrook Health Sciences Centre 37 97.3 1.2 81.1 1.0 40.5 0.8 * 0.8 100.0 9.9 *
C. Mount Sinai Hospital 40 72.5 1.0 67.5 0.8 40.0 1.0 * 0.4 100.0 10.8 *
D. Other 39 79.5 0.9 59.0 0.8 43.6 0.8 * 0.0 97.4 9.1 *
8. Central 33 75.8 0.8 57.6 0.6 24.2 0.3 0.0 0.0 100.0 9.2 *
9. Central East 82 62.2 0.7 50.0 0.6 29.3 0.5 * 0.4 97.6 7.2 *
10. South East 27 59.3 0.8 40.7 0.5 * 0.3 * 0.6 96.3 4.0 *
11. Champlain 87 71.3 0.9 65.5 0.8 25.3 0.4 * 0.1 100.0 8.7 9.2
12. North Simcoe Muskoka * 50.0 0.6 44.4 0.6 61.1 1.1 0.0 0.0 100.0 7.5 0.0
13. North East 45 82.2 1.0 68.9 0.8 28.9 0.4 * 0.3 100.0 7.0 *
14. North West * 64.3 0.6 64.3 0.6 * 0.1 * 0.2 100.0 9.3 *
1 The denominator includes all patients in the Salivary Gland Cancer Resection Cohort.* In accordance with ICES policy, the exact number is suppressed when the cell size is <6, or when the cell size allows for a number of <6 to be calculated.

Institute for Clinical Evaluative Sciences 115Institute for Clinical Evaluative Sciences 115
HEAD AND NECK CANCER SURGERY IN ONTARIO, 2003–2010SURGERY FOR SALIVARY GLAND CANCER
EXHIBIT 4.8A Diagnostic and adjunctive procedures received by adults in the Salivary Gland Cancer/No Resection Cohort in the 12 months before and 12 months after their diagnosis, by Local Health Integration Network of residence, in Ontario, 2003 to 2010
Key Findings
• Similar to patients in the Salivary Gland Resection Cohort, patients in the No Resection Cohort received an average of 0.1 panendoscopies (18 in Ontario) and 0.1 other endoscopies (bronchoscopy or esophagoscopy) (23 in Ontario) in the year before and after their diagnosis (data not shown due to small sample sizes).
• Neck dissections (removal of the lymph nodes in the neck) were conducted in approximately 17% of patients. There was considerable variability across LHINs of patient residence. The proportion was lowest (0%) for patients living in the Waterloo Wellington, South East and North East LHINs at the time of diagnosis.
• Very few patients in the Salivary Gland/No Resection Cohort received a free flap, any reconstructive procedure, tracheostomy or gastrostomy tube within the 24-month window surrounding their diagnosis.
• Oral cavity biopsies were performed infrequently in this cohort (15 in Ontario, an average of 0.1 per patient)
Characteristic Cohort, N
Neck Open Biopsy
Head and Neck Fine-Needle
Aspiration Biopsy Neck Dissection Free FlapReconstructive
Procedure Tracheostomy Gastrostomy Tube
nAvg1 per
patient, n nAvg1 per
patient, n nAvg1 per
patient, n
Patients receiving,
% nAvg1 per
patient, n
Patients receiving,
% nAvg1 per
patient, n nAvg1 per
patient, n nAvg1 per
patient, n
Ontario 229 46 0.2 69 0.3 46 0.2 16.6 8 0.0 3.5 23 0.1 7 0.0 11 0.0
LHIN of residence1. Erie St. Clair 15 * * * * * * * * * * * * 0 0.0 * *
2. South West 16 * * * * * * * * * * 7 0.4 0 0.0 * *
3. Waterloo Wellington 8 * * * * 0 0.0 0.0 0 0.0 0.0 * * 0 0.0 0 0.0
4. Hamilton Niagara Haldimand Brant 29 * * 15 0.5 * * * * * * * * * * * *
5. Central West * * * * * * * * 0 0.0 0.0 0 0.0 0 0.0 0 0.0
6. Mississauga Halton 13 * * * * * * * * * * * * * * * *
7. Toronto Central 25 8 0.3 13 0.5 * * * 0 0.0 0.0 0 0.0 0 0.0 * *
8. Central 25 * * * * 9 0.4 32.0 * * * * * * * * *
9. Central East 32 10 0.3 9 0.3 7 0.2 18.8 * * * * * 0 0.0 0 0.0
10. South East 17 * * * * 0 0.0 0.0 0 0.0 0.0 0 0.0 0 0.0 * *
11. Champlain 18 6 0.3 * * * * * 0 0.0 0.0 0 0.0 * * 0 0.0
12. North Simcoe Muskoka 10 * * 9 0.9 * * * * * * * * 0 0.0 0 0.0
13. North East 10 * * 0 0.0 0 0.0 0.0 0 0.0 0.0 0 0.0 0 0.0 0 0.0
14. North West * 0 0.0 * * * * * 0 0.0 0.0 0 0.0 0 0.0 0 0.0
1 The denominator includes all patients in the Salivary Gland Cancer/No Resection Cohort.* In accordance with ICES policy, the exact number is suppressed when the cell size is <6, or when the cell size allows for a number of <6 to be calculated.

Institute for Clinical Evaluative Sciences116 Institute for Clinical Evaluative Sciences116
HEAD AND NECK CANCER SURGERY IN ONTARIO, 2003–2010 SURGERY FOR SALIVARY GLAND CANCER
EXHIBIT 4.8B Radiologic services received by adults in the Salivary Gland Cancer/No Resection Cohort in the 12 months before and 12 months after their definitive surgery, by Local Health Integration Network of residence, in Ontario, 2003 to 2010
Key Findings
• Patients in the Salivary Gland/No Resection Cohort received a number of radiologic services in the 12 months before and after their diagnosis. These included computed tomography (CT) scans of the head and neck (1.7 per patient, on average), chest X-rays (2.5 per patient), chest CT scans (0.9
per patient), abdominal ultrasounds (0.4 per patient), and abdominal CT scans (0.5 per patient).
• Patients who did not undergo resection received slightly fewer radiologic imaging services overall compared to those who did have a resection surgery (see Exhibit 4.7B). This was most prominent in the chest imaging category.
• There was little variation in the use of radiologic services provided to patients in this cohort across different Local Health Integration Networks of patient residence.
• Very few MRI scans of the abdomen were performed on patients in this cohort (less than 6 in total).
Characteristic Cohort, N
Head and Neck Chest Abdomen
Ultrasound CT Scan MRI Scan X-Ray CT Scan Ultrasound CT Scan
nAvg1 per
patient, n nAvg1 per
patient, n nAvg1 per
patient, n nAvg1 per
patient, n nAvg1 per
patient, n nAvg1 per
patient, n nAvg1 per
patient, n
Ontario 229 154 0.7 378 1.7 120 0.5 582 2.5 202 0.9 95 0.4 117 0.5
LHIN of residence1. Erie St. Clair 15 12 0.8 25 1.7 8 0.5 34 2.3 * * * * * *
2. South West 16 9 0.6 26 1.6 7 0.4 45 2.8 14 0.9 9 0.6 * *
3. Waterloo Wellington 8 * * 13 1.6 * * 15 1.9 * * * * * *
4. Hamilton Niagara Haldimand Brant 29 18 0.6 45 1.6 9 0.3 65 2.2 19 0.7 13 0.4 8 0.3
5. Central West * * * * * * * 9 1.5 * * 0 0.0 * *
6. Mississauga Halton 13 11 0.8 27 2.1 * * 29 2.2 17 1.3 * * 10 0.8
7. Toronto Central 25 17 0.7 47 1.9 13 0.5 55 2.2 23 0.9 13 0.5 11 0.4
8. Central 25 14 0.6 48 1.9 21 0.8 62 2.5 30 1.2 11 0.4 24 1.0
9. Central East 32 30 0.9 61 1.9 19 0.6 88 2.8 45 1.4 23 0.7 25 0.8
10. South East 17 13 0.8 18 1.1 12 0.7 17 1.0 12 0.7 * * 7 0.4
11. Champlain 18 13 0.7 26 1.4 10 0.6 92 5.1 12 0.7 6 0.3 11 0.6
12. North Simcoe Muskoka 10 7 0.7 16 1.6 8 0.8 37 3.7 7 0.7 * * * *
13. North East 10 * * 14 1.4 * * 24 2.4 9 0.9 * * 7 0.7
14. North West * * * * * 0 0.0 10 2.0 * * 0 0.0 0 0.0
1 The denominator includes all patients in the Salivary Gland Cancer/No Resection Cohort.* In accordance with ICES policy, the exact number is suppressed when the cell size is <6, or when the cell size allows for a number of <6 to be calculated. CT = computed tomography; MRI = magnetic resonance imaging.

Institute for Clinical Evaluative Sciences 117Institute for Clinical Evaluative Sciences 117
HEAD AND NECK CANCER SURGERY IN ONTARIO, 2003–2010SURGERY FOR SALIVARY GLAND CANCER
EXHIBIT 4.8C Consultations and services received by adults in the Salivary Gland Cancer/No Resection Cohort in the 12 months before and 12 months after their definitive surgery, by Local Health Integration Network of residence, in Ontario, 2003 to 2010
Key Findings
• Approximately 69% of patients in the Salivary Gland/No Resection Cohort saw a radiation oncologist in the 12 months before and after their diagnosis. About 57% of this cohort received radiation therapy as a part of treatment.
• Rates of referral to a radiation oncologist varied widely across the Local Health Integration Network (LHINs). The rate was highest among
patients living in the Hamilton Niagara Haldimand Brant LHIN at the time of their diagnosis (86%).
• A higher proportion of patients in this cohort (58%) were seen by a medical oncologist in the 24 months surrounding their diagnosis as compared to the cohort that received a resection (see Exhibit 4.7C).
• Despite not having received a salivary gland resection, patients in this cohort visited surgeons an average of 5.1 times in the 12 months before and 12 months after their diagnosis; this was less
often than those who received a definitive resection procedure (see Exhibit 4.7C). Nearly all patients in the No Resection Cohort (94%) saw a surgeon in that same period.
• Thirty-one percent of patients in the No Resection Cohort received a palliative care consultation in the 12 months before and 12 months after their diagnosis; only 7% of patients in the Resection Cohort had this consultation (see Exhibit 4.7C).
Characteristic Cohort, N
Radiation OncologyConsultation Radiation Therapy
Medical OncologyConsultation Chemotherapy Surgery Consultation
Palliative CareConsultation
Patients receiving, %
Avg1 per patient, n
Patients receiving, %
Avg1 per patient, n
Patients receiving, %
Avg1 per patient, n
Patients receiving, %
Avg1 per patient, n
Patients receiving, %
Avg1 per patient, n
Patients receiving, %
Ontario 229 68.6 0.9 57.2 0.8 58.1 1.1 10.9 0.8 93.9 5.1 30.6
LHIN of residence1. Erie St. Clair 15 80.0 0.9 73.3 0.9 66.7 1.1 40.0 1.4 100.0 6.6 *
2. South West 16 * * * * 56.3 0.6 * * 68.8 3.4 *
3. Waterloo Wellington 8 * * * * * * * * 100.0 6.4 *
4. Hamilton Niagara Haldimand Brant 29 86.2 0.9 65.5 1.0 55.2 0.8 * * 96.6 5.2 27.6
5. Central West * * * * * * * 0.0 0.0 * * *
6. Mississauga Halton 13 69.2 0.8 61.5 1.2 61.5 1.1 * * 92.3 4.6 *
7. Toronto Central 25 72.0 0.8 64.0 0.8 56.0 1.3 0.0 0.0 92.0 4.0 40.0
8. Central 25 68.0 0.8 52.0 0.8 68.0 1.8 * * 100.0 6.2 32.0
9. Central East 32 68.8 1.2 53.1 1.0 65.6 1.5 * * 96.9 6.1 31.3
10. South East 17 64.7 0.9 64.7 1.1 41.2 0.6 * * 88.2 3.4 35.3
11. Champlain 18 83.3 1.2 77.8 0.9 61.1 1.3 * * 100.0 5.7 33.3
12. North Simcoe Muskoka 10 60.0 0.6 * * 70.0 1.4 0.0 0.0 100.0 7.1 *
13. North East 10 * * * * * * * * 100.0 4.2 *
14. North West * * * * * 0.0 0.0 * * * * *
1 The denominator includes all patients in the Salivary Gland Cancer/No Resection Cohort.* In accordance with ICES policy, the exact number is suppressed when the cell size is <6, or when the cell size allows for a number of <6 to be calculated.

Institute for Clinical Evaluative Sciences118 Institute for Clinical Evaluative Sciences118
HEAD AND NECK CANCER SURGERY IN ONTARIO, 2003–2010 SURGERY FOR SALIVARY GLAND CANCER
Discussion and Conclusions
Summary of findings and clinical implications
Our analysis of the incidence rates of salivary gland cancer in Ontario from 2003 to 2010 found that rates were much higher among men than women and higher in the elderly regardless of sex.
Although nearly 93% of Ontario adults newly diagnosed with salivary gland cancer underwent a surgical procedure for their disease within a year of diagnosis, only 82% had a definitive procedure (a parotid or submandibular gland resection).
Persons aged 75 or older who were newly diagnosed with salivary gland cancer were less likely to have any cancer-related surgery (or salivary gland resection) than younger people with this disease.
Among the 82% of patients in the cohort who underwent a parotid or submandibular gland resection for salivary gland cancer, 52% had a total or radical resection. A majority (57%) of salivary gland cancer resection procedures done in Ontario between 2003 and 2010 were performed at head and neck cancer treatment centres. A large majority of these procedures were performed by otolaryngologists (91%); the remainder were performed by general surgeons (9%) and plastic surgeons (1%).
More than a third (35%) of all surgical admissions for salivary gland cancer occurred outside the LHINs where patients were living at the time of their diagnosis, with the majority of admissions (56%) occurring in three LHINs (Toronto Central, South West, and Hamilton Niagara Haldimand Brant). Surgical care is far less regionalized for salivary gland cancer than for cancers of the oral cavity and larynx/hypopharyx. Salivary glance cancer is a relatively rare cancer that is often diagnosed after surgical resection and has rates of regionalization that are similar to gynecological malignancies.6
Care for patients with salivary gland cancer is resource intensive; it involves a significant number of diagnostic tests and procedures, as well as the services of a multidisciplinary team that includes different types of oncologists. In Ontario, the abdomen is not routinely imaged for staging in patients undergoing salivary gland resection. Within a year of resection, patients in this cohort had used a large number of CCAC services (11 days of care per patient on average); this is significantly less than the number of services used by those in the oral cavity and larynx/hypopharynx resection cohorts. This may be because the population with salivary gland cancer is more elderly than individuals with other head and neck cancers.
In this cohort, there was little use of head and neck MRI to diagnose or stage salivary gland cancer; patients were imaged largely with CT. Only 87% of patients undergoing a resection received any form of preoperative head and neck imaging to appropriately stage their tumour. Currently, there is no practice guideline on the use of CT or MRI; however, it is a
standard of care for patients to receive some form of axial imaging (CT or MRI) prior to surgical resection. This number (87%) should be taken into consideration when setting a benchmark in future quality improvement projects.
The use of surgery, chemotherapy and radiotherapy for salivary gland cancer varied according to the LHIN of patient residence. Significant variations existed among the province’s major head and neck cancer treatment centres as to rates of consultation with radiation oncologists and medical oncologists. Similar variations were observed in the use of radiotherapy and chemotherapy.
Among the LHINs, there was also significant variation in rates of palliative care consultation. This may be indicative of a group of cancer patients presenting with very late-stage disease, or it may be due to more limited access to palliative services in certain LHINs. This should be further studied, and improvements should be targeted through regional and provincial initiatives. Patients who did not undergo a resection still used considerable surgical and other health care resources.
Supplementary data from this study were used to describe variations in incidence rates, resection rates and types of surgical ablations performed on patients with salivary gland cancer in Ontario; these have been published separately.7

Institute for Clinical Evaluative Sciences 119Institute for Clinical Evaluative Sciences 119
HEAD AND NECK CANCER SURGERY IN ONTARIO, 2003–2010SURGERY FOR SALIVARY GLAND CANCER
Implications for policy and planning
The incidence of salivary gland cancer increases with age. As the Ontario population ages, there may be increasing demand for health services related to the diagnosis and treatment of salivary gland cancer, which may require planning for future healthcare resources.
We noted variations in the use of surgical procedures and referral to specialists among salivary gland cancer patients residing in one LHIN and being treated in another. More research is necessary to understand this observation and whether quality improvement initiatives are needed.
Of the head and neck cancers presented in this atlas, salivary gland cancer is the least regionalized. Benign parotid gland masses are far more common than malignant ones. A surgical resection is often used for both diagnostic and therapeutic purposes if a fine-needle aspiration biopsy does not provide a diagnosis. This is reflected in the number of surgeons and centres performing salivary gland cancer surgery. Although this is understandable, a significant proportion (75%) of patients who had a resection did not undergo a fine-needle aspiration biopsy attempt before their surgery; this is the standard of care because although a fine-needle aspiration biopsy may not provide an exact diagnosis, it can certainly differentiate between benign and malignant lesions. This in turn will change the staging workup, as well as the extent of resection. Regional quality improvement initiatives could help address the low biopsy rate and potentially improve compliance with best practice guidelines that have yet to be developed in Ontario for this cancer subsite.
Despite some regionalization to designated head and neck cancer treatment centres, there are significant variations in the diagnostic workup, treatment, use of adjunctive procedures, and consultations for patients residing in one LHIN and being treated in another, even among the three LHINs with the highest treatment volumes. Province-wide quality improvement programs and communities of practice should be designed with input from the province’s nine major head and neck cancer treatment centres in an effort to standardize care, monitor and improve compliance with guidelines, and study outcomes in this cancer cohort. As there are so few cases of salivary gland cancer in the province, an accelerated and streamlined referral system to designated head and neck cancer treatment centres could be developed to further regionalize care of these cancers. This may improve the accuracy of fine-needle aspiration biopsy, cytopathology and final diagnosis. It will also improve access to reconstructive procedures, which are much more likely to be delivered at high-volume centres.
Future research
Cancer-stage data and comorbidity information are needed to more thoroughly analyze case-mix differences among the major head and neck cancer treatment centres. Work is required to validate the histology codes captured by the Ontario Cancer Registry for salivary gland cancer. Future studies should focus on delineating processes of care (i.e., preoperative imaging and metastatic workup,
multidisciplinary consultation and cancer care conferences, and appropriate follow-up care) and examining the association between adherence to guidelines and patient outcomes.
References
1. Advisory Committee on Cancer Statistics. Canadian Cancer Statistics 2014. Toronto, ON: Canadian Cancer Society; 2014. Accessed July 7, 2015 at http://www.cancer.ca/~/media/cancer.ca/CW/cancer%20information/cancer%20101/Canadian%20cancer%20statistics/Canadian-Cancer-Statistics-2014-EN.pdf.
2. Speight PM, Barrett AW. Salivary gland tumours. Oral Dis. 2002; 8(5):229–40.
3. Theriault C, Fitzpatrick PJ. Malignant parotid tumors. Prognostic factors and optimum treatment. Am J Clin Oncol. 1986; 9(6):510–6.
4. Schmidt RL, Hall BJ, Wilson AR, Layfield LJ. A systematic review and meta-analysis of the diagnostic accuracy of fine-needle aspiration cytology for parotid gland lesions. Am J Clin Pathol. 2011; 136(1):45–59.

Institute for Clinical Evaluative Sciences120 Institute for Clinical Evaluative Sciences120
HEAD AND NECK CANCER SURGERY IN ONTARIO, 2003–2010 SURGERY FOR SALIVARY GLAND CANCER
5. Kim BY, Hyeon J, Ryu G, Choi N, Baek CH, Ko YH, et al. Diagnostic accuracy of fine needle aspiration cytology for high-grade salivary gland tumors. Ann Surg Oncol. 2013; 20(7):2380–7.
6. Elit L, Schultz S, Prysbysz R, Barbera L, Saskin R, Gunraj N, et al. Patterns of care for the initial management of cervical cancer in Ontario. Eur J Gynaecol Oncol. 2008; 30(5):493–6.
7. Eskander A, Irish J, Freeman J, Gullane P, Gilbert R, Groome PA, et al. Overview of major salivary gland cancer surgery in Ontario (2003–2010). J Otolaryngol Head Neck Surg. 2014; 43:50.

Institute for Clinical Evaluative Sciences 121
HEAD AND NECK CANCER SURGERY IN ONTARIO, 2003–2010
5 Reflections and Recommendations
Inside
• Introduction • Role of Surgery in the Management of Head
and Neck Cancer • Reflections on Research Findings • Limitations of This Study • Recommendations

Institute for Clinical Evaluative Sciences122
HEAD AND NECK CANCER SURGERY IN ONTARIO, 2003–2010 REFLECTIONS AND RECOMMENDATIONS
Introduction
Head and neck cancer is a leading cause of death worldwide. It is responsible for a significant portion of health care expenditure because of its impact on the ability to breathe, speak and swallow.
It is expected that there will be an increase in the prevalence of disease and disease burden over time for the following reasons:
• Head and neck cancer predominantly affects individuals over the age of 60, and this segment of the population is growing.
• New treatments and technologies related to chemotherapy, radiotherapy and robotic surgery are constantly evolving and often cost more; therefore, we are also expecting a potential increase in the cost of managing the head and neck cancer patient.
• Patients are living longer due to changes in disease etiology, disease responsiveness to treatment and improved treatments. The growing number of survivors will lead to increased costs over time in the areas of imaging, follow up and further treatment, as well as the management of complications and side effects from treatment.
Role of Surgery in the Management of Head and Neck Cancer
This atlas is focussed on those patients diagnosed with and surgically treated for head and neck cancer in Ontario. It examines surgery-related health services because surgeons play a key role in the diagnosis, staging and treatment of nearly all head and neck cancers and are the main portal of entry to the health care system for the head and neck cancer patient. The collection of tissue by a surgeon after a surgical consultation is often the first step in the cancer journey for patients, and surgeons are often the first to disclose the diagnosis to patients.
There is evidence that surgeons and hospitals in Ontario that treat a higher volume of head and neck cancer patients are associated with better results (survival) in this population.1,2 Therefore, the centralization of surgical services for these patients should be encouraged. Prior to this evidence, Cancer Care Ontario’s Head and Neck Cancer Standards had recommended a minimum of 80 cases per year for hospitals performing head and neck cancer surgery.3 This atlas indicates that high-volume surgeons and hospitals are performing the majority of oral cavity and larynx/hypopharynx cancer surgery in Ontario, although there is room for improvement with further regionalization of care.
Quality improvement of head and neck cancer care in Ontario is an ongoing process. This atlas provides data on key areas of variation and points to potential areas for improvement; its format was designed to inform regional, population-based planning of head and neck cancer surgery services while supporting policy-makers as they reach key decisions regarding the funding and allocation of limited resources. Last but certainly not least, our hope is that this atlas will be the basis for a health services research program in the field of head and neck oncology in Ontario. This atlas is largely descriptive and provides hypothesis-generating data that can be used to study and improve quality of care and outcomes in the province.
The ultimate goal of a highly functioning health system is to improve the patient experience by providing excellent quality of care and achieving better outcomes. Without an understanding of the current landscape, it is difficult to move forward. This atlas is the first step in that journey.
Reflections on Research Findings
In this section, using a theme-based discussion, we summarize the key points derived from this atlas while reflecting on their meaning and listing actionable items.

Institute for Clinical Evaluative Sciences 123
HEAD AND NECK CANCER SURGERY IN ONTARIO, 2003–2010REFLECTIONS AND RECOMMENDATIONS
The changing incidence of head and neck cancer
There has been a marked decrease in the incidence of larynx/hypopharynx cancer, a moderate rise in the incidence of salivary gland cancers and a significant rise in the incidence of oropharynx cancers. The rise in incidence of salivary gland cancers is independent of pathologies such as melanoma or squamous cell carcinoma that may have been mislabelled as salivary gland cancers.
There has been a rise in the incidence of head and neck cancers with advanced age, particularly among those aged 65 years or older. Similarly, with the exception of salivary gland cancers, there has been a rise in the incidence of head and neck cancers in lower-income neighbourhoods.
Important variations exist in the incidence of head and neck cancer by Local Health Integration Network (LHIN) of residence; these warrant further investigation.
Variation in the use of surgery by patient age and LHIN of residence
Older patients are less likely to receive surgery related to their head and neck cancer or a definitive surgical resection. This difference may be the result of appropriate decision making, but further investigation is warranted to ensure there is no age-based inequity in the provision of treatment.
The LHIN of patient residence at the time of diagnosis led to significant variations in the use of
surgery. This could be explained by potential differences in referral patterns, in treatment approaches among high-volume treatment centres, in training received by head and neck oncologists, and in access to resources. This variation also warrants further investigation, including the assessment of guideline-directed care.
Variations in treatments provided by LHIN of treatment (flaps and neck dissections)
Even among those LHINs with the highest-volume treatment centres, there were important variations in the use of neck dissection for the three cancer subsites. These variations may be explained by differences in the stage of presentation of patients to each of the centres; however, this explanation is unlikely to account for all of the variation, and further study is required to assess the adequacy of neck dissection use.
Similarly, free flap use varied among the LHINs of treatment, even among the LHINs of treatment with a head and neck cancer centre. These variations were consistent between cancer subsites indicating that some centres are far more likely to use free flaps than other centres. This has implications for equitability of use of such treatments across the province. Access may be limited at some centres where the surgeons performing ablations do not have access to free flap surgeons. Alternatively, some centres may be overusing free flaps. This should be studied further to determine the adequacy of free
flap use and to assess where resources can be better distributed among the head and neck cancer treatment centres.
Regionalization of cancer care
In Ontario, head and neck cancer care is largely regionalized to nine hospitals in six cities that were designated in 2014 as head and neck cancer treatment centres.4 During the years covered by our study (2003 to 2010), a formal program to regionalize head and neck cancer surgery in Ontario did not fully exist. In 2009, Cancer Care Ontario published provincial standards that recommended a minimum volume of 80 surgical cases per year per centre; informal operationalization of this standard began at that time.3
Nonetheless, during our study period a small proportion of oral cavity and larynx/hypopharynx cases were being treated outside of the network of designated sites. A study conducted by Cancer Care Ontario in 2013‒2014 found that not all of the designated head and neck cancer treatment centres met the minimum volume standard and only 83% of patients were being treated at one of these designated centres.4 There is strong evidence to suggest that higher-volume surgeons and hospitals in Ontario are associated with better outcomes (i.e., survival) for patients in the management of their head and neck cancers, and that hospital volumes appear to be more important than surgeon volumes.1,2 Based on the finding that there is a strong volume-outcome relationship in the management of

Institute for Clinical Evaluative Sciences124
HEAD AND NECK CANCER SURGERY IN ONTARIO, 2003–2010 REFLECTIONS AND RECOMMENDATIONS
head and neck cancer combined with the findings from this atlas and more recent data from Cancer Care Ontario, a formal program to regionalize care of these tumours to designated head and neck cancer treatment centres was initiated in 2014.4 This will likely lead to a further decrease in the number of cases being performed at nondesignated sites and may lead to improved outcomes.
Salivary gland cancers are understandably and appropriately less regionalized (57% of cases are treated at designated centres). Ultrasound-guided fine-needle aspiration and advanced cytological diagnosticians are not readily available in many regions in Ontario, and this may affect surgeons’ ability to preoperatively plan the extent of resection. However, the data on neck dissection and radiotherapy by region (i.e., LHIN) of treatment demonstrate much higher rates of both of these interventions in regions with a head and neck cancer centre. This finding suggests that, based on clinical and radiological grounds, advanced and/or aggressive tumours are being appropriately referred to high-volume centres for resection and subsequent management. Although the preliminary data appear to support this suggestion, further study is required to confirm whether it is indeed the case. Given the rarity of these tumours, their varied histologies and the current lack of regionalization when compared to the management of other head and neck cancer subsites, a policy to further regionalize their treatment may be warranted.
Providers of cancer care
Otolaryngology‒head and neck surgeons are the main providers of care for patients with head and neck cancer. A very small group of general surgeons also provide this care within the context of a high-volume centre. We were unable to determine using administrative data which providers had a fellowship as surgical oncologists, but anecdotally, recent surgical recruitment at all head and neck cancer treatment centres have a recognized fellowship in head and neck surgical oncology. Such training from an approved and accredited fellowship program or equivalent should be maintained to ensure the highest quality of delivered care to patients with head and neck cancer, a relatively uncommon cancer site.
Despite the majority of care being provided by one specialty and at designated head and neck cancer treatment centres, variations in the use of procedures, consultations and adjuvant therapies indicate a lack of agreement on how best to manage these tumours. The development of communities of practice may be a first step toward increasing communication, collaboration and knowledge dissemination between treatment centres. To decrease variations and improve outcomes, province-wide quality improvement initiatives must engage all surgeons treating these cancers at high-volume centres.
Key processes of care (imaging and multidisciplinary care)
Among the resection cohort of patients, there were large variations in the use of head and neck and chest imaging; this finding is surprising given the clear recommendation from the provincial guidelines that patients should receive this process of care prior to surgical intervention.3 Similarly, the extent of multidisciplinary care (a patient being seen by more than one oncologist) prior to surgical resection also varied significantly, and this too had been strongly recommended in the 2009 guidelines. To decrease these variations, province-wide quality improvement initiatives, particularly in the guideline-recommended processes of care, must engage all surgeons treating head and neck cancers at high-volume centres to enhance the quality of care and potentially improve outcomes.
Central role of surgeons in the head and neck cancer patient’s journey
Surgeons provide diagnostic procedures (including biopsies, scopes and panendoscopy) to patients with head and neck cancer, and as the gatekeepers of Ontario’s head and neck cancer care program, they are often required to coordinate diagnosis, staging, multidisciplinary consultation, treatment and follow-up. These surgeons would have also seen patients with benign head and neck tumours or suspected head and neck tumours, two cohorts not examined in this atlas. All head and neck cancers

Institute for Clinical Evaluative Sciences 125
HEAD AND NECK CANCER SURGERY IN ONTARIO, 2003–2010REFLECTIONS AND RECOMMENDATIONS
require a surgical specimen for diagnosis. Furthermore, many head and neck cancers are treated surgically, particularly oral cavity and salivary gland cancers and to a lesser extent laryngeal/hypopharyngeal and oropharyngeal cancers. It is, therefore, not surprising that almost all patients in our study saw a surgeon in the 24-month period surrounding their diagnosis, even those patients that did not have a cancer-related surgical procedure. Surgeons should be considered key players in the quality improvement discussion and initiatives being actively employed by the provincial government and Cancer Care Ontario.
Limitations of This Study
Exclusion of oropharynx cancers
Due to the difficulty in identifying primary treatment modality using administrative data, this atlas does not include information on surgically resected cancers of the oropharynx. This is an important cancer subsite for future study as it is rising in incidence and affecting a younger population of patients. It is also associated with a changing etiology in the form of a virus — human papillomavirus (HPV).
Treatments for cancers of the oropharynx are evolving such that patients with HPV-associated tumours are candidates for trials in which de-escalation is an option. De-escalation involves
treating patients with single-modality therapies (e.g., radiation treatment without concurrent chemotherapy) or with the same modalities but at lower doses (e.g., lower-dose radiation). While in the past, oropharyngeal tumours were treated mainly with radiotherapy or chemoradiotherapy, advances in technology (e.g., robotic surgery) have made it possible for select patients with early-stage disease to receive a surgical resection; thus, surgeons are playing an increasing role in the primary management of these tumours.
Lack of survivorship data
Because this atlas focuses on new and incident cancers of the head and neck and does not capture their prevalence, it underestimates the health resources required to manage patients with these cancers. With improved treatments and survival in Ontario, an increasing number of patients live with these cancers, often cured but dealing with the side effects of their treatment and requiring a variety of health care resources in the longer term. Also, because the Ontario Cancer Registry captures only the first diagnosis of cancer, the burden of this disease is further underestimated because patients are at a significant risk of second primaries (a second tumour in the upper aerodigestive tract) or synchronous tumours (two tumours in different locations that present at the same time).
Limitations related to missing cancer staging
Staging data for head and neck cancer are not available in the Ontario Cancer Registry. Steps should be taken to add this information to administrative databases, as this would significantly improve their power to answer important health services and clinical research questions. Furthermore, for oropharyngeal cancers, HPV status, which has important prognostic implications, should also be collected.
Some of the variations observed could potentially be explained by differences in the stage at presentation for the different cancer sites; however, it is unlikely that stage differences alone would explain some of the large variations we observed.
Lengthy study period
This atlas includes data from 2003 to 2010, which is a relatively long study period. These years were selected as they were recent, included surrogate information on the use of radiation therapy, and included enough patients such that we would not need to block too many cells for privacy reasons. Some changes in the management of head and neck cancers may have occurred in the province, although we are not aware of any that occurred during the study period. Also, some of our findings may be related to a particular event during the time period in the study. For instance, Ontario experienced a SARS outbreak in 2003, and services in the province were limited to treat only the sickest patients while

Institute for Clinical Evaluative Sciences126
HEAD AND NECK CANCER SURGERY IN ONTARIO, 2003–2010 REFLECTIONS AND RECOMMENDATIONS
preventing the spread of infection. Referral patterns for head and neck cancer patients may have been affected during that time period.
Effects of geography and funding
Important geographic and funding considerations need to be taken into account when interpreting our findings. Patients residing in the North West LHIN are sometimes treated in the province of Manitoba, and this may not have been captured in the Ontario health data available to us. Thus, our data may have artificially demonstrated that patients in the North West LHIN receive fewer health care services than their peers elsewhere in Ontario. It is also possible that a small number of patients travelled to other provinces or the United States for treatment. Additionally, in some regions of the province, mainly the South East LHIN, some physicians are compensated through alternative payment plans for which there are no OHIP billing codes. This practice may have limited our capture of health services provided to patients treated in this LHIN.
Recommendations
Many of our conclusions match those included in the 2008 cancer surgery atlas produced by ICES,5 but a few of our findings are unique to head and neck cancer surgery.
Quality improvement in Ontario’s cancer system
Head and neck cancer surgery is already highly regionalized to head and neck cancer treatment centres in Ontario, although there is room for further regionalization, particularly for salivary gland malignancies. More importantly, there is room to improve the quality of delivered care, and surgeons should play a critical role in the design and implementation of such programs. Communities of practice should be created for the head and neck cancer treatment centres in Ontario to assess the variations discussed in this atlas and to reduce variations in delivered care.
Cancer-related health services research program
Many of the questions regarding our province’s health care system and its delivery of services to cancer patients can be addressed by consulting the Ontario Cancer Registry. Specifically, surgeons, through Cancer Care Ontario’s Health Services Research Program, should be involved in answering these questions:
• Given the degree of regionalization, what can be done to improve the quality of delivered care?
• Why are there large variations in delivered care to head and neck cancer patients?
• What key differences in access to resources exist among the LHINs that may explain such variations?
• Are patients receiving guideline-recommended processes of care before undergoing surgical resection and are these processes of care associated with outcomes?
The answers to these and other health services research questions at the system level will serve as a platform from which to launch quality improvement initiatives for head and neck cancer care in Ontario.
Improved capture of cancer staging data
Some of the variations in care depicted in this atlas may be related to the stage of cancer at presentation. For Ontario Cancer Registry data to be useful in answering a broader range of questions, controlling for stage at presentation is essential. It is also feasible, given that a large proportion of patients are treated at cancer treatment centres that make every attempt to record stage at presentation. The centralization of head and neck cancer care has made it easier to collect such data.
Further study of cancer-related structures, processes and outcomes
The Donabedian model of quality improvement assesses structures of care, processes of care and outcomes of care.6 This atlas addresses, to a large

Institute for Clinical Evaluative Sciences 127
HEAD AND NECK CANCER SURGERY IN ONTARIO, 2003–2010REFLECTIONS AND RECOMMENDATIONS
extent, structures and processes of care; it does not assess outcomes. Next steps might include linking some of the structures and processes of care with outcomes. This effort will naturally lead to quality improvement initiatives.
References
1. Eskander A, Merdad M, Irish JC, Hall SF, Groome PA, Freeman JL, et al. Volume-outcome associations in head and neck cancer treatment: a systematic review and meta-analysis. Head Neck. 2014; 36(12):1820‒34.
2. Eskander A, Irish J, Groome PA, Freeman J, Gullane P, Gilbert R, et al. Volume-outcome relationships for head and neck cancer surgery in a universal health care system. Laryngoscope. 2014; 124(9):2081‒8.
3. Gilbert R, Devries-Aboud M, Winquist E, Waldron J, McQuestion M; Head and Neck Disease Site Group. The Management of Head and Neck Cancer in Ontario. Evidence-Based Series 5-3. Toronto, ON: Cancer Care Ontario; 2009. Accessed July 16, 2015 at https://www.cancercare.on.ca/common/pages/UserFile.aspx?fileId=58592.
4. Cancer Quality Council of Ontario. Head and neck centres. Accessed May 23, 2015 at http://www.csqi.on.ca/cms/One.aspx?portalId=327483&pageId=335333.
5. Urbach DR, Simunovic M, Schultz SE. Cancer Surgery in Ontario: ICES Atlas. 2nd ed. Toronto, ON: Institute for Clinical Evaluative Sciences; 2008.
6. Donabedian A. Evaluating the quality of medical care. Milbank Mem Fund Q. 1966; 44(3 Pt 2): 166‒206.

Institute for Clinical Evaluative Sciences128
HEAD AND NECK CANCER SURGERY IN ONTARIO, 2003–2010
Technical Appendix
Inside
• Data Sources • Methods
Sections of this appendix parallel sections in the technical appendix included in Cancer Surgery in Ontario, an atlas published by ICES in 2008.1 Our aim is to replicate that atlas’s methodology to allow for comparisons across anatomical sites using health administrative data.

Institute for Clinical Evaluative Sciences 129
HEAD AND NECK CANCER SURGERY IN ONTARIO, 2003–2010TECHNICAL APPENDIX
Data Sources
Ontario Cancer Registry (OCR)
Maintained by Cancer Care Ontario, the OCR is a computerized database of information on all Ontario residents who have been newly diagnosed with cancer or who have died of cancer. All cancers are included with the exception of nonmelanoma skin cancer and carcinoma in situ, a type of pre-invasive cancer.
Discharge Abstract Database (DAD)
The DAD is a database of administrative, clinical and demographic information abstracted from hospital records. Managed by the Canadian Institute for Health Information, the DAD includes patient-level data for acute and chronic care hospitals, rehabilitation hospitals and day-surgery clinics in Ontario.
Ontario Health Insurance Plan (OHIP) Database of Physician Billings
The OHIP database contains all claims made by Ontario physicians for insured services rendered to Ontario residents. Each record represents a separate service (identified by fee code) rendered to a specific person on a specific date. It includes the following information: type of service, diagnosis, service provider, service recipient, service date, physician’s practice group, and referring physician (where applicable).
Registered Persons Database (RPDB)
The RPDB is a population-based registry maintained by the Ministry of Health and Long-Term Care to manage publicly funded health care services covered under OHIP. The RPDB is essentially a historical listing of the unique health numbers issued to persons eligible for Ontario health services. The listing includes corresponding demographic information such as date of birth, sex, address, date of death (where applicable) and changes in eligibility status. When new RPDB data arrive at ICES, personal information, such as name and street address, is removed, and each unique health number is converted into an anonymous identifier, ensuring the protection of each individual’s privacy.
ICES Physician Database (IPDB)
The IPDB contains information about physicians practising in Ontario. It is created and maintained by ICES, using data from several sources, including the Ontario Physician Human Resource Data Centre (OPHRDC), the OHIP Corporate Provider Database and the OHIP Database of Physician Billings. For each physician, the IPDB includes age, sex, practice location, physician specialty, type of services provided, and medical school name and year of graduation.
2006 Census Area Profiles
These Statistics Canada files contain population-based information from the 2006 census for different geographic areas (including census division and census metropolitan area). The files include information on age, sex, ethnicity, educational level attained, employment, income and socioeconomic status.

Institute for Clinical Evaluative Sciences130
HEAD AND NECK CANCER SURGERY IN ONTARIO, 2003–2010 TECHNICAL APPENDIX
Methods
Study populations and timelines
The study populations for each cancer site discussed in this atlas included all Ontario residents 18 years of age or older who were newly diagnosed with cancer between January 1, 2003, and December 31, 2010. The following look-back/look-forward windows were used:
Purpose Time Window
To determine if individuals had surgery for their cancer
From 12 months before to 12 months after their cancer diagnosis
To estimate the number of visits persons undergoing cancer-related surgery had with their treating surgeon
From 6 months before to 6 months after their first surgery
To measure the use of nonsurgical health services by individuals who had cancer
From 12 months before to 12 months after their definitive surgery
To measure the use of nonsurgical health services by individuals who did not have surgery for their cancer
From 12 months before to 12 months after their cancer diagnosis
Age groupings of study populations
Age categories were defined as follows: 18–54, 55–64, 65–69, 70–74 and 75+ years. This choice of age groupings best represents the age distributions of the cancer cohorts studied.
Standardization method
All incidence rates were standardized to the population of Canada as of July 1, 1991, using the direct method of standardization. Subgroup proportions, such as the proportion of each particular cancer cohort who underwent surgery, were standardized to either the Overall Cancer Cohort or the Cancer Surgery Cohort.
Cancer definitions
Cancers were defined using the diagnosis code variables in the Ontario Cancer Registry. These are based on the International Classification of Disease, 9th Revision (ICD-9) developed by the World Health Organization. The cancer sites studied in this atlas were defined as follows:
Cancer Site ICD-9 Code Description Exclusions
Oral Cavity 140.3, 140.4 Mucosal lining of lips
146.4 Anterior aspect of epiglottis
141 Tongue
143 Gum
144 Floor of mouth
145 Other/unspecified mouth
146 Oropharynx
Larynx/Hypopharynx
146.4 Anterior aspect of epiglottis
148 Hypopharynx
161 Larynx
Salivary Glands
142.0 Parotid gland
142.1 Submandibular gland

Institute for Clinical Evaluative Sciences 131
HEAD AND NECK CANCER SURGERY IN ONTARIO, 2003–2010TECHNICAL APPENDIX
Definition of patient residence
For all analyses presented in this atlas, the definition of Local Health Integration Network of residence is based on where each person was living when diagnosed with cancer.
Identification and categorization of cancer surgeries
Most analyses of cancer surgery begin with a set of predefined procedures; the next step is to examine who received each procedure. Similar to the 2008 ICES cancer atlas, the current study differed from this approach in that we started with a number of cohorts (our study populations) whose members had been diagnosed with specific cancers during a given period. We then looked backward and forward in time to determine the types of procedures these patients received. The multistage process included the following steps:
Step 1. All individuals newly diagnosed with cancer during the study period were identified from the Ontario Cancer Registry.
Step 2. Data on these individuals were linked to the Discharge Abstract Database to determine the procedures they underwent in the period from 12 months before to 12 months after their diagnosis.
Step 3. The list of procedures developed for each cancer site was reviewed by a group of experts to determine which were cancer-related. The five-digit codes contained in the Canadian Classification of Health Interventions (CCI)* were used to identify procedures associated with surgical cancer treatment (excluding biopsy).
Step 4. More specific CCI codes (those containing up to 10 digits) were used to define analytic surgical subgroups (i.e., definitive procedures). For brevity, only the five-digit CCI codes are included in this appendix. However, the full CCI codes were helpful in determining the most definitive procedure when more than one CCI code was found.
(Note: In the tables on the following pages, NEC = not elsewhere classified.)
* The CCI is the current national standard for classifying health care procedures. It replaces the Canadian Classification of Diagnostic, Therapeutic and Surgical Procedures (CCP) and the intervention portion of the International Classification of Diseases, Ninth Revision, Clinical Modification (ICD-9-CM) in Canada. The CCI classifies a broad range of diagnostic, therapeutic and support interventions.

Institute for Clinical Evaluative Sciences132
HEAD AND NECK CANCER SURGERY IN ONTARIO, 2003–2010 TECHNICAL APPENDIX
Oral cavity cancer–related surgery Surgery defining the Oral Cancer Surgery Cohort was based on the following CCI codes plus any resection codes in the next table:
CCI Code Description
1GJ54 Management of internal device, trachea1GJ77 Bypass with exteriorization, trachea1MC87 Excision partial, lymph node(s), neck region NEC (cervical)1MC89 Excision total, lymph node(s), neck region NEC (cervical)1MC91 Excision radical, lymph node(s), neck region NEC (cervical)1NF53 Implantation of internal device, stomach1NF54 Management of internal device, stomach1NF55 Removal of device, stomach
1NK53 Implantation of internal device, small intestine1NK54 Management of internal device, small intestine1NK55 Removal of device, small intestine1SG58 Procurement, muscles of the back1SN58 Procurement, scapula1SQ58 Procurement, pelvis1SY58 Procurement, muscles of the chest and abdomen1SY80 Repair, muscles of the chest and abdomen1TQ58 Procurement, muscles of the forearm (around elbow)1TQ80 Repair, muscles of the forearm (around elbow)1VD58 Procurement, muscles of hip and thigh1VQ58 Procurement, tibia and fibula1YT58 Procurement, skin of arm1YT80 Repair, skin of arm1YV58 Procurement, skin of leg1YV80 Repair, skin of leg
Oral cavity cancer resection To qualify for inclusion in the Oral Cavity Cancer Resection Cohort, patients would have been classified with one of the following CCI codes:
CCI Code* Description
1ED87 Excision partial, maxilla1ED91 Excision radical, maxilla1EE87 Excision partial, mandible 1EE91 Excision radical, mandible 1EN87 Excision partial, mandibular alveolar ridge 1EN91 Excision radical, mandibular alveolar ridge 1FG87 Excision partial, oral and buccal mucosa 1FH87 Excision partial, floor of mouth
1FJ87 Excision partial, tongue 1FJ91 Excision radical, tongue 1YE87 Excision partial, lip
* In Chapter 2 (oral cavity cancer), CCI codes were used to define the type of definitive resection provided
To further characterize the Oral Cavity Cancer Resection Cohort, the following OHIP codes were used to assess physician-level data, mainly physician specialty:
OHIP Code Description
M055 Maxillary, Caldwell-Luc (includes intranasal antrostomy)M056 Maxillectomy (partial or complete) R181 Excision of nasopharyngeal or oropharyngeal lesion (with palatal split)R182 Excision of nasopharyngeal or oropharyngeal lesion (with mandibulotomy, glossotomy
and/or palatal split)S003 Excision of oral lesion (2–4 cms, inclusive)S005 Composite resection of lesion of oral cavity and/or oropharynx with partial resection of mandibleS006 Excision of oral lesion (more than 4 cms)S007 Extended composite resection of lesion of oral cavity and oropharynx with partial
resection of mandible and resection of maxillaS010 Wedge resection of lip (with plastic repair)S011 Wedge resection of lip (vermilion)S012 Lip shave vermilionectomyS018 Partial glossectomyS067 Partial pharyngectomy – transthyroid or lateralZ502 Excision of oral lesion (less than 2 cms)Z504 Excision of lip lesion

Institute for Clinical Evaluative Sciences 133
HEAD AND NECK CANCER SURGERY IN ONTARIO, 2003–2010TECHNICAL APPENDIX
Larynx/hypopharynx cancer–related surgery Surgery defining the Larynx/Hypopharynx Cancer Surgery Cohort was based on the following CCI codes plus any resection codes in the next table:
CCI Code Description
1EQ87 Excision partial, soft tissue of head and neck1FU87 Excision partial, thyroid gland 1FU89 Excision total, thyroid gland 1FV83 Transfer, parathyroid gland 1FX87 Excision partial, oropharynx 1GA59 Destruction, glottis 1GE59 Destruction, larynx NEC1GA87 Excision partial, glottis
1GA89 Excision total, glottis 1GJ53LAPM Implantation of internal device, trachea of tracheoesophageal button using open approach1GJ54 Management of internal device, trachea1GJ77 Bypass with exteriorization, trachea1MC87 Excision partial, lymph node(s), neck region NEC (cervical)1MC89 Excision total, lymph node(s), neck region NEC (cervical)1MC91 Excision radical, lymph node(s), neck region NEC (cervical)1NF53 Implantation of internal device, stomach1NF54 Management of internal device, stomach1NF55 Removal of device, stomach1NK53 Implantation of internal device, small intestine1NK54 Management of internal device, small intestine1NK55 Removal of device, small intestine1SY58 Procurement, muscles of the chest and abdomen1SY80 Repair, muscles of the chest and abdomen1TQ58 Procurement, muscles of the forearm (around elbow)1TQ80 Repair, muscles of the forearm (around elbow)
1VD58 Procurement, muscles of hip and thigh1YT58 Procurement, skin of arm1YT80 Repair, skin of arm1YV58 Procurement, skin of leg1YV80 Repair, skin of leg1SG58 Procurement, muscles of the back1SN58 Procurement, scapula1SQ58 Procurement, pelvis1VQ58 Procurement, tibia and fibula
Larynx/hypopharynx cancer resection To qualify for inclusion in the Larynx/Hypopharyx Cancer Resection Cohort, patients would have been classified with one of the following CCI codes:
CCI Code Description
1GB87 Excision partial, supraglottis1GB89 Excision total, supraglottis1GD87 Excision partial, laryngeal cartilage 1GD89 Excision total, laryngeal cartilage 1GE87LL Excision partial, larynx NEC (vertical technique) 1GE87NZ Excision partial, larynx NEC (horizontal technique) 1GE89 Excision total, larynx NEC1GE91 Excision radical, larynx NEC
To further characterize the Larynx/Hypopharynx Cancer Resection Cohort, the following OHIP codes were used to assess physician-level data, mainly physician specialty:
OHIP Code* Description
M081 Total laryngectomy M082 Laryngofissure M084 Segmental laryngectomy (including reconstruction)M085 Arytenoidectomy or arytenoidopexy or lateralization procedure S068 Pharyngo-laryngectomy
* In Chapter 3 (larynx/hypopharynx cancer), OHIP fee codes were used to define the type of definitive resection provided.

Institute for Clinical Evaluative Sciences134
HEAD AND NECK CANCER SURGERY IN ONTARIO, 2003–2010 TECHNICAL APPENDIX
Salivary gland cancer–related surgery Surgery defining the Salivary Gland Cancer Surgery Cohort was based on the following CCI codes plus any resection codes in the next table:
CCI Code Description
1BB80 Repair, other nerves of head and neck1BB87 Excision partial, other nerves of head and neck1BD58 Procurement, nerve(s) of the ear1BT58 Procurement, nerve(s) of lower leg1CV53LALF Implantation of internal device, upper eyelid using open approach and implant (e.g., gold weight)1CX74 Fixation, eyelid NEC using incisional approach1EP80 Repair, muscles of head and neck 1EQ87 Excision partial, soft tissue of head and neck
1GJ54 Management of internal device, trachea1GJ77 Bypass with exteriorization, trachea1MC87 Excision partial, lymph node(s), neck region NEC (cervical)1MC89 Excision total, lymph node(s), neck region NEC (cervical)1MC91 Excision radical, lymph node(s), neck region NEC (cervical)1NF53 Implantation of internal device, stomach1NF54 Management of internal device, stomach1NF55 Removal of device, stomach1NK53 Implantation of internal device, small intestine1NK54 Management of internal device, small intestine1NK55 Removal of device, small intestine1SG58 Procurement, muscles of the back1SN58 Procurement, scapula1SQ58 Procurement, pelvis1SY58 Procurement, muscles of the chest and abdomen1SY80 Repair, muscles of the chest and abdomen1TQ58 Procurement, muscles of the forearm (around elbow)
1TQ80 Repair, muscles of the forearm (around elbow)1VD58 Procurement, muscles of hip and thigh1VQ58 Procurement, tibia and fibula
1WT58LAXXA Procurement, tendons of ankle and foot of autograft using open approach1YA87 Excision partial, scalp1YB87 Excision partial, skin of forehead1YC87 Excision partial, skin of ear 1YD87 Excision partial, skin of nose 1YF87 Excision partial, skin of face
1YG87 Excision partial, skin of neck 1YT58 Procurement, skin of arm1YT80 Repair, skin of arm1YV58 Procurement, skin of leg1YV80 Repair, skin of leg2FP71HA Biopsy salivary glands and ducts using percutaneous (needle) approach
Salivary gland cancer resection To qualify for inclusion in the Salivary Gland Cancer Resection Cohort, patients would have been classified with one of the following CCI codes:
CCI Code* Description
1FM87 Excision partial, parotid gland1FM89 Excision total, parotid gland 1FM91 Excision radical, parotid gland 1MC87** Excision partial, lymph node(s), neck region NEC (cervical)2FP71LA Biopsy salivary glands and ducts using open approach
* In Chapter 4 (salivary gland cancer), CCI codes were used to define the type or extent of the definitive resection provided.* * Considered a definitive resection in only those patients that had an OCR diagnosis of submandibular gland cancer and did not undergo any of
the other definitive procedures. We chose to do this because it is plausible that patients with submandibular gland cancers would undergo a limited neck dissection as their definite procedure as opposed to a submandibular gland excision alone.
To further characterize the Salivary Gland Cancer Resection Cohort, the following OHIP codes were used to assess physician-level data, mainly physician specialty:
OHIP Code Description
S042 Excision of submandibular gland or sublingual gland S043 Excision parotid gland (total with preservation of facial nerve)S044 Excision parotid gland (total without preservation of facial nerve)S045 Excision parotid gland (subtotal with preservation of facial nerve)

Institute for Clinical Evaluative Sciences 135
HEAD AND NECK CANCER SURGERY IN ONTARIO, 2003–2010TECHNICAL APPENDIX
Histology codes
More than 90% of mucosal head and neck cancers are squamous cell carcinomas. For this reason, in the chapters devoted to oral cavity and larynx/hypopharynx cancers, we excluded patients with ICD-O-3 histology codes that were not in keeping with squamous cell carcinoma. The following histology codes were included:
ICD-O-3 Code* Description
8020 Undifferentiated carcinoma 8051 Verrucous carcinoma8052 Papillary squamous cell carcinoma8070 Squamous cell carcinoma8071 Squamous cell carcinoma, keratinizing8072 Squamous cell carcinoma, non-keratinizing8073 Squamous cell carcinoma, small cell,
non-keratinizing 8074 Squamous cell carcinoma, spindle cell8075 Squamous cell carcinoma, pseudoglandular8076 Squamous cell carcinoma, microinvasive 8077 Squamous intraepithelial neoplasia, grade III8078 Squamous cell carcinoma, horn formation 8082 Lymphoepithelial carcinoma8083 Basaloid squamous cell carcinoma8084 Squamous cell carcinoma, clear cell
8094 Basosquamous carcinoma 8123 Basaloid carcinoma 8560 Adenosquamous carcinoma
* ICD-O-3 = International Classification of Diseases for Oncology, 3rd Edition
For Chapter 4 (devoted to salivary gland cancers), we excluded melanoma and lymphoma histological types but included the remaining histological codes and these are presented in the chapter. We chose to include squamous cell carcinoma in this chapter as well as there are a very small minority of salivary gland cancers that are squamous cell carcinoma histologically. More importantly, some skin squamous cell carcinomas are metastatic to the salivary glands and require a surgical resection similar to that for a primary salivary gland cancer. We wanted to capture procedures performed on the salivary glands for cancer regardless of the histological type, and thus we were more liberal with histological codes in this chapter.

Institute for Clinical Evaluative Sciences136
HEAD AND NECK CANCER SURGERY IN ONTARIO, 2003–2010 TECHNICAL APPENDIX
Identification of diagnostic, radiologic and other nonsurgical health services
OHIP fee codes were used to identify the following services:
• Biopsy• Bone scan• Chemotherapy• CT scan• Emergency department visits• Endoscopy and panendoscopy • External beam radiation• Facial reanimation• Fine-needle aspiration• Gastrostomy tube • Intensive care• MRI scan• Neck dissection• Palliative care (including home care visits)• PET scan• Radiation therapy planning• Reconstructive procedures • Specialist consultations (including surgeon visits)• Swallow study • Tracheotomy• Ultrasound• X-ray
(Note: Utilization of these procedures is examined in Exhibits X.7 and X.8).
Biopsy
BiopsyS063 Pharynx – Tonsillectomy
S065 Pharynx – Adenoidectomy
Z323 Larynx – Laryngoscopy – Direct, with removal of lesion(s)
Z324 Larynx – Laryngoscopy – Indirect, with biopsy or removal of foreign body
Z501 Mouth – Incision – Biopsy
Z502 Mouth – Excision – Lesion – Less than 2 cm
Z503 Lips – Incision – Biopsy
Z504 Lips – Excision of lesion
Z537 Oral cavity – Incision – Biopsy – Requiring general anaesthetic
Excision or Biopsy of Small Parotid MassJ149 Diagnostic ultrasonic guidance of biopsy, aspiration, amniocentesis or drainage procedures
Z522 Salivary gland – Excision small tumour
Neck BiopsyZ405 Lymph nodes – Biopsy – Cervical, axillary, inguinal
Z406 Lymph nodes – Biopsy – Scalene
Bone Scan
J650 Nuclear med. – Bone scintigraphy – General survey
J651 Nuclear med. – Bone single site
J850 Nuclear med. – Bone scintigraphy – General survey
J851 Nuclear med. – Bone single site
Y650 Nuclear med. – Bone scintigraphy – General survey
Y651 Nuclear med. – Bone single site
Y850 Nuclear med. – Bone scintigraphy – General survey
Y851 Nuclear med. – Bone single site
Chemotherapy
G339 Inj/inf. chemotherapy & patient assess. – Single agent IV
G345 Inj/inf. chemotherapy & patient assess. – Multiple agent IV
G359 Inj/inf. chemotherapy & patient assess. – Special single agent, etc.
G381 Inj/inf. chemotherapy (marrow suppression) – Single injection

Institute for Clinical Evaluative Sciences 137
HEAD AND NECK CANCER SURGERY IN ONTARIO, 2003–2010TECHNICAL APPENDIX
CT Scan
CT Scan – Abdomen and/or PelvisX126 Abdomen – with/out IV contrast
X231 Pelvis – without IV contrast
X232 Pelvis – with IV contrast
X233 Pelvis – with/out IV contrast
X409 Abdomen – without IV contrast
X410 Abdomen – with IV contrast
Excision or Biopsy of Small Parotid MassX125 Thorax – with/out IV contrast
X406 Thorax – without IV contrast
X407 Thorax – with IV contrast
CT Scan – Head and/or NeckX124 Neck - with/out IV contrast
X188 Head - with/out IV contrast
X400 Head - without IV contrast
X401 Head - with IV contrast
X402 Complex head - without IV contrast
X403 Neck - without IV contrast
X404 Neck - with IV contrast
X405 Complex head - with IV contrast
X408 Complex head - with/out IV contrast
Emergency Department Visits
H055 ED Physician on Duty
H065 Emerg. Phys. Consult. (Non-Specialist in Emerg. Med.)
H101 Minor Assess. – GP – ED Phys. on Duty – M-F Days
H102 Comprehensive Assess. & Care – Daytime
H103 Multiple Systems Assess. – GP – ED Phys. on Duty
H104 GP Re-assess. – ED Phys. on Duty – M-F Days
H105 Interim Inpatient Admission Orders
H112 ED Phys. on Duty – Extra to Proc. – Nights
H113 ED Phys. on Duty – Extra to Proc. – Sat/Sun/Holidays
H121 Minor Assess. – Phys. on Duty – Nights
H122 Comprehensive Assess. & Care – Nights
H123 Mult. Syst. Assess. – Phys. on Duty – Nights
H124 Re-Assess. – ED Phys. on Duty – Nights
H131 Minor Assess. – ED Phys. on Duty – Evenings
H132 Comprehensive Assess. & Care – ED Phys. on Duty – Evenings
H133 Mult. Syst. Assess. – ED Phys. on Duty – Evenings
H134 Re-assess. – ED Phys. on Duty – M-F Evenings
H151 Minor Assess. – ED Phys. on Duty – Sat/Sun/Holiday
H152 Comprehensive Assess. & Care – Sat/Sun & Holidays
H153 Mult. Syst. Assess. – ED Phys. on Duty – Sat/Sun/Holiday
H154 Re-assess. – ED Phys. on Duty – Sat/Sun/Holiday

Institute for Clinical Evaluative Sciences138
HEAD AND NECK CANCER SURGERY IN ONTARIO, 2003–2010 TECHNICAL APPENDIX
Endoscopy and Panendoscopy
Other Endoscopy (with or without biopsy)E600 Larynx – Laryngoscopy using operating microscope
Z298 Nose – EUGA of nasopharynx, if only procedure performed
Z299 Nose – Fiberoptic endoscopy of upper airway with rigid endoscope
Z321 Larynx – Laryngoscopy – Direct, with/out biopsy
Z327 Trachea & Bronchi – Bronchoscopy, with/out biopsy
Z515 Digestive Syst. Oesophagoscopy, with/out biopsy(s)
Panendoscopy (with or without biopsy)Z355 Trachea & Bronchi – Quadroscopy or panendoscopy , with/out biopsy
Facial Reanimation Procedures
TarsorrhaphyE190 Eyelid – Suture – Tarsorrhaphy
Nerve Suture or GraftN287 Peripheral Nerves – Suture – Major peripheral nerve
N288 Peripheral Nerves – Graft – Major nerve /Secondary repair
Static or Dynamic SlingsR531 Muscles – Repair/Reconstruction – Static slings
R532 Muscles – Repair/Reconstruction – Dynamic slings
Composite Repair of Facial ParalysisR533 Muscles – Repair/Reconstruction – Composite repair or resection
Fine-Needle Aspiration of the Head or Neck
Z413 Lymph Nodes – Incl. scalene node fine-needle aspiration
Gastrostomy Tube
J055 Diag. Radiol. – Clin. procedure with percutaneous gastrostomy
S118 Stomach – Incl. gastrostomy
S119 Stomach – Percutaneous endoscopic gastrostomy
Z532 Stomach – Percutaneous endoscopic gastrostomy – revised
Intensive Care (any of the following, limit of one per day)
G400 Critical Care Per Diem (first day)
G401 Critical Care Per Diem (2nd to 10th day)
G402 Critical Care Per Diem (11th day onward)
G405 Ventilatory Support – ICU (first day)
G406 Ventilatory Support – ICU (2nd to 10th day)
G407 Ventilatory Support – ICU (11th day onward)
G557 Comprehensive Care – ICU (first day)
G558 Comprehensive Care – ICU (2nd to 10th day)
G559 Comprehensive Care – ICU (11th day onward)
MRI Scan
Head and/or NeckX421 Head – Multislice sequence
E875 Head – Multislice sequence with spectroscopy
X425 Head – Multislice sequence repeat
E876 Head – Multislice sequence repeat with spectroscopy
X431 Neck – Multislice sequence
X135 Neck – Multislice sequence repeat
Abdomen and/or PelvisX451 Abdomen – Multislice sequence (1 or 2 echos)
X461 Pelvis – Multislice sequence (1 or 2 echos)
Neck Dissection
Partial Neck DissectionR910 Neck Lymph Nodes – Excision – Limited
Total or Radical Neck DissectionR911 Neck Lymph Nodes – Excision – Radical
R915 Neck Lymph Nodes – Excision – Modified Radical – Preservation of Spinal Accessory Nerve

Institute for Clinical Evaluative Sciences 139
HEAD AND NECK CANCER SURGERY IN ONTARIO, 2003–2010TECHNICAL APPENDIX
PET Scan
J700 Solitary pulmonary nodule
J701 Thyroid cancer
J702 Germ cell tumour
J703 Colorectal cancer
J704 Lymphoma – Evaluation of residual mass
J705 Lymphoma – Assessment of response to treatment
J706 Non-small cell lung cancer
J709 Limited disease small cell lung cancer
Palliative Care
A945 GP/FP Special Palliative Care Consultation
C945 Special Palliative Care Consultation, Hospital Inpatient
C882 GP/FP Terminal Care in Hospital
C982 Palliative Care
W872 Terminal Care in Nursing Home
W882 GP Terminal Care in Chronic Care Hospital
W972 Palliative Care in Nursing Home
W982 Palliative Care in Chronic Care Hospital
K023 Palliative Care Support, Individual Care, 0.5 Hr or Major Part
B998 Special Visit, Palliative Care Home, Days, Evenings
B966 Travel Premium, Palliative Care Home Visit
G511 Telephone Management of Palliative Care at Home
G512 Weekly Palliative Care Case Management
Radiation Therapy Planning (used as proxy measure for radiation therapy)
X310 Radiation Treatment Planning Level 1 – Simple
X311 Radiation Treatment Planning Level 2 – Intermediate
X312 Radiation Treatment Planning Level 3 – Complex
X313 Radiation Treatment Planning Level 4 – Full 3D
Reconstructive Procedures
Pedicled FlapsS013 Lips – Repair – Cleft Lip – Unilateral
S014 Lips – Reconstruction with Lip Switch Flap
S015 Lips – Repair – Complex Reconstruction
R070 Skin – Pedicle Flap – Direct, Intermediate
R080 Skin – Pedicle Flaps – Direct, Large
R101 Skin – Pedicle Flaps – Delay, Intermediate
R100 Skin – Pedicle Flaps – Delay, Major
Myocutaneous, Myogenous or Fasciocutaneous FlapsR005 Skin – Myocutan. Flap – Incl. Closure of Sterno-mastoid/Tensor Fascia Lata
R006 Skin – Myocutan. Flap – Incl. Closure of Pectoralis Major, etc.
R009 Skin – Myocutan. Flap – Incl. Closure of Osseous Flaps, etc.
Skin Grafts (Split Thickness or Full Thickness)R084 Skin – Split Thick. Graft – Very Minor, Small Area
R085 Skin – Split Thick. Graft – Minor, Medium Area
R086 Skin – Split Thick. Graft – Intermediate, Large Area
R087 Skin – Split Thick. Graft – Major, Complex Area
R088 Skin – Split Thick. Graft – Extensive Major, Large Area
R092 Skin – Full Thick. Graft – Minor, Less than 1 cm
R093 Skin – Full Thick. Graft – Intermediate, 1-5 cm
R083 Skin – Full Thick. Graft – Major, Over 5 cm Diameter
R091 Skin – Full Thick. Graft – Complex, Eyelid, Nose, Lip, Face
Free Flap ElevationR013 Skin & Subcut. Tissue – Free Island Flaps – Jejunum Artery & Vein for Transplantation
R064 Skin & Subcut. Tissue – Elevation of F.I. Skin & Subcut. Flap & Closure of Defect
R067 Skin & Subcut. Tissue – Elevation of Innervated F.I. Skin and Subcut. Flap
R125 Skin – Elevation of F.I. Skin & Muscle Flap & Closure of Defect
R128 Skin – Elevation of F.I. Muscle Flap with Tendon & Nerve & Closure of Defect
R131 Skin – Elevation of F.I. Bone Flap & Closure of Defect
R134 Skin – Elevation of F.I. Skin & Bone Flap & Closure of Defect
Free Flap Transplantation
R015 Skin & Subcutaneous Tissue – Free Island Flaps – Transpl. of Jejunum Artery & Vein with Microvascular Anastomosis
R066 Skin & Subcut. Tissue – Transpl. of F.I. Skin & Subcut. Flap with Microvasc. Anast.
R069 Skin & Subcut. Tissue – Transpl. of Innervated F.I. Skin & Subcut. Flap with Microvasc. Anast. & Nerve Repair
R127 Skin – Transpl. of F.I. Skin & Muscle Flap with Microvasc. Anast.
R130 Skin – Transpl. of F.I. Muscle Flap with Tendon, Nerve and Microvasc. Anast.
R133 Skin – Transpl. of F.I Bone Flap with Microvasc. Anast. & Bone Fixation
R136 Skin – Transpl. of F.I Skin & Bone Flap with Microvasc. Anast. & Bone Fixation

Institute for Clinical Evaluative Sciences140
HEAD AND NECK CANCER SURGERY IN ONTARIO, 2003–2010 TECHNICAL APPENDIX
Specialist Consultations
Radiation Oncology A345 Consultation
A346 Repeat Consultation
A745 Limited Consultation
C345 Consultation – Hospital
C346 Repeat Consultation – Hospital
C745 Limited Consultation – Hospital
Medical Oncology A135 Consultation – Internal & Occupational Medicine
A136 Repeat Consultation – Int. & Occ. Med.
A435 Limited Consultation – Int. Med.
C135 Consultation – Int. Med. – Hospital
C136 Repeat Consultation – Int. Med. – Hospital
C435 Limited Consultation – Int. Med. – Hospital
Otolaryngology–Head and Neck Surgery*
A243 Special Assessment
A244 Partial Assessment
A245 Consultation
A246 Repeat Consultation
A935 Special Surgical Consultation on I.C. Basis
C243 Specific Assessment – Hospital
C244 Specific Re-assessment – Hospital
C245 Consultation – Hospital
C246 Repeat Consultation – Hospital
C935 Special Surgical Consultation – Hospital
K013 Counselling – Individual care, first three units
K033 Counselling – One person, additional units/patient/year/unit
K040 Group Counselling – Two or more persons
K041 Group Counselling – Two or more persons, additional*Includes a specialty code for Otolaryngology–Head and Neck Surgery.
General Surgery or Thoracic/Cardiothoracic Surgery **
A033 Specific Assess. – Gen. Surg.
A034 Partial Assess. – Gen. Surg.
A035 Consult. – Gen. Surg.
A036 Repeat Consult. – Gen. Surg.
A093 Specific Assess. – Cardio. & Thoracic Surg.
A094 Partial Assess. – Cardio. & Thoracic Surg.
A095 Consult. – Cardio. & Thoracic Surg.
A096 Repeat Consult. – Cardio. & Thoracic Surg.
General Surgery or Thoracic/Cardiothoracic Surgery ** (continued)
A643 Specific Assess. – Thoracic Surg.
A644 Partial Assess. – Thoracic Surg.
A645 Consult. – Thoracic Surg.
A646 Repeat Consult. – Thoracic Surg.
A935 Special Surgical Consult. on I.C. Basis
C033 Specific Assess. – Gen. Surg. – Hospital
C034 Specific Re-assess. – Gen. Surg. – Hospital
C035 Consult. – Gen. Surg. – Hospital
C036 Repeat Consult. – Gen. Surg. – Hospital
C093 Specific Assess. – Cardio. & Thoracic Surg. – Hospital
C094 Specific Re-assess. – Cardio. & Thoracic Surg. – Hospital
C095 Consult. – Cardio. & Thoracic Surg. – Hospital
C096 Repeat Consult. – Cardio. & Thoracic Surg. – Hospital
C643 Specific Assess. – Thoracic Surg. – Hospital
C644 Specific Re-assess. – Thoracic Surg. – Hospital
C645 Consult. – Thoracic Surg. – Hospital
C646 Repeat Consult. – Thoracic Surg. – Hospital
C935 Special Surgical Consult. – Cardio. & Thoracic Surg. – Hospital
K013 Counselling – Individual Care, first three units
K033 Counselling – One person, additional units/pat/year/unit
K040 Group Counselling – Two or more persons
K041 Group Counselling – Two or more persons, additional* *Includes a specialty code for Cardio & Thoracic Surgery, General Surgery, Vascular Surgery and Thoracic Surgery.
Plastic Surgery (fee code and main specialty plastic surgery)***
A083 Specific Assess. – Plastic Surg.
A084 Partial Assess. – Plastic Surg.
A085 Consult. – Plastic Surg.
A086 Repeat Consult. – Plastic Surg.
A935 Special Surgical Consult. on I.C. Basis
C083 Specific Assess. – Plastic Surg. – Hospital
C084 Specific Re-assess. – Plastic Surg. – Hospital
C085 Consult. – Plastic Surg. – Hospital
C086 Repeat Consult. – Plastic Surg. – Hospital
C935 Special Surgical Consult. – Plastic Surg. – Hospital
K013 Counselling – Individual care, first three units
K033 Counselling – One person, additional units/patient/year/unit
K040 Group Counselling – Two or more persons
K041 Group Counselling – Two or more persons, additional* * *Includes a specialty code for Plastic Surgery.

Institute for Clinical Evaluative Sciences 141
HEAD AND NECK CANCER SURGERY IN ONTARIO, 2003–2010TECHNICAL APPENDIX
Swallow Study
X105 Diag. Radiology – Palatopharyngeal Analysis – Cine/Videotape
X106 Diag. Radiology – Pharynx & Oesophagus – Cine/Videotape
X107 Diag. Radiology – Oesophagus only
Tracheotomy
E639 With Anterior Cricoid Split – Add to Tracheotomy
M089 Creation of Tracheo-oesophageal Fistula
T310 Tracheotomy
Z325 Emergency tracheotomy
Z741 Trachea & Bronchi, including Tracheotomy
Ultrasound
Ultrasound – Thorax, Abdomen, and RetroperitoneumJ128 Abdomen/Retroperitoneum – Abdom. scan, limited study
J135 Abdomen/Retroperitoneum – Abdom. scan, complete
J428 Abdomen/Retroperitoneum – Abdom. scan, limited study
J435 Abdomen/Retroperitoneum – Abdom. scan, complete
Ultrasound – Head and NeckJ105 Face and/or Neck, excluding vascular study
J149 Guidance of biopsy, aspiration or drainage procedure
J405 Face and/or Neck, excluding vascular study
X-Ray
X090 Diag. Rad. – Chest – single film
X091 Diag. Rad. – Chest – two views
X092 Diag. Rad. – Chest – three or more views

Institute for Clinical Evaluative Sciences142
HEAD AND NECK CANCER SURGERY IN ONTARIO, 2003–2010 TECHNICAL APPENDIX
Identification of head and neck cancer centres
We considered classifying Ontario hospitals as either academic (teaching) or community hospitals, but this approach would not have captured important information. Head and neck cancers are rarer than other cancers treated in the province. Nine hospitals in the province employ fellowship-trained head and neck surgical oncologists and radiation oncologists to manage these rare tumours; these hospitals are identified as head and neck cancer centres (represented geographically in Exhibit 1.3). We thus categorized our hospitals using this more important distinction as it demonstrates the percentage of procedures being provided at nondesignated centres and is a measure of the degree of regionalization of head and neck cancer care in Ontario.
The following institutions are designated as head and neck cancer centres in Ontario:
Institution No. Institution
3910 University Health Network (includes Toronto General Hospital, Princess Margaret Hospital, Toronto Western Hospital and Toronto Rehabilitation Institute)
1423 Mount Sinai Hospital, Toronto 3936 Sunnybrook Health Sciences Centre, Toronto3850 London Health Sciences Centre 2003 St. Joseph's Hospital, Hamilton4059 Health Sciences North, Sudbury 1100 Kingston General Hospital 4048 Ottawa Hospital – Civic Campus4046 Ottawa Hospital – General Campus
This information is pertinent to Exhibits 2.6B, 3.6B and 4.6B.

Institute for Clinical Evaluative Sciences 143
HEAD AND NECK CANCER SURGERY IN ONTARIO, 2003–2010TECHNICAL APPENDIX
Identification of physician specialties and subspecialties
Identifying physician specialties and subspecialties presented several challenges.
• Because physician identifiers used in the CIHI-DAD are not standard for all Ontario hospitals, it was necessary to use OHIP data for the physician specialty analysis. The OHIP billings then had to be matched back to the procedures identified in the CIHI-DAD, a challenging process because the procedures were not defined the same way in the two data sources.
• There was variation in the fee codes that physicians used to bill OHIP for surgical procedures (i.e., they did not always bill as expected).
• Some physician subspecialties are not listed in the OHIP data, so it was necessary to link to other sources. Each additional data source used increased the potential sources of misclassification error.
• Because the OHIP fee schedule does not follow the same structure as the CIHI-DAD, it was necessary to use an iterative process to identify and match billings with surgeries.
The following process was used to identify physician specialties and subspecialties:
1. A list of OHIP billing codes used for cancer surgery was developed by the clinician-authors involved in the development of the atlas.
2. For each cancer subsite, OHIP records were extracted that matched the following criteria: the service date was between January 1, 2003 and December 31, 2010, the patient was a member of the cancer cohort, and the fee code was one of those on the list provided by the clinician-authors (see pages 132-141 of this appendix).
3. OHIP billings were matched with the CIHI-DAD procedures on patient and date. This was done twice: first, we sought an exact match between the procedure date on the DAD record and the service date on the OHIP billing; then we utilized a date window of ±2 days.
4. In situations where there was still a high proportion of unmatched surgeries, the process was started over, using a slightly different methodology. Rather than extracting OHIP billings using a defined list of fee codes, we extracted all OHIP billings for services other than office, emergency department or long-term care visits for the patient cohort within the defined time frame.
5. After going through the matching exercise outlined in no. 3 (above), the matched OHIP billings were examined to see what other fee codes might have been missed in the original list of probable billing codes.
6. After consultation with the clinician-authors, the original list of fee codes was amended and the initial process was re-run, resulting in the final match.
Once the OHIP billings for the surgeries were identified, the specialty of the physician who submitted the billing was obtained from the ICES Physician Database.
This information is pertinent to Exhibits 2.6A, 3.6A and 4.6A.
Reference
1. Urbach DR, Simunovic M, Schultz SE. Cancer Surgery in Ontario: ICES Atlas. Toronto, ON: Institute for Clinical Evaluative Sciences; 2008.


Data Discovery Better Health
Institute for Clinical Evaluative Sciences G1 06, 2075 Bayview Avenue Toronto, Ontario M4N 3M5www.ices.on.ca


